IEEE TRANSACTIONS ON IMAGE PROCESSING, VOL. XX, NO. Y, MONTH 2002 1 Contour Detection Based on Non-Classical Receptive Field Inhibition Cosmin Grigorescu, Nicolai Petkov, and Michel A. Westenberg* Abstract — We propose a biologically motivated computa- tional step, called non-classical receptive field (non-CRF) in- hibition, more generally surround inhibition or suppression, to improve contour detection in machine vision. Non-CRF inhibition is exhibited by 80% of the orientation-selective neurons in the primary visual cortex of monkeys and has been demonstrated to influence the visual perception of man as well. The essence of this mechanism is that the response of an edge detector in a certain point is suppressed by the responses of the operator in the region outside the area of operator support. We combine classical edge detection with two types of inhibitory mechanism, isotropic and anisotropic inhibition, both of which have counterparts in biology. For edge detection, we also use a biologically motivated method (the Gabor energy operator). The resulting operator re- sponds strongly to isolated lines, edges, and contours, but exhibits a weaker or no response to edges that make part of texture. We use natural images with associated ground truth con- tour maps to assess the performance of the proposed oper- ator regarding the detection of contours while suppressing texture edges. The results show that our method enhances contour detection in cluttered visual scenes more effectively than classical edge detectors used in machine vision (Canny edge detector). Therefore, the proposed operator is more useful for contour-based object recognition tasks, such as shape comparison, than traditional edge detectors, which do not distinguish between contour and texture edges. Tra- ditional edge detection algorithms can, however, also be ex- tended with surround suppression. Next to the advance- ment of contour detection in machine vision, this study con- tributes to the understanding of inhibitory mechanisms in biology. Keywords — Canny operator, contour detection, edge de- tection, Gabor energy, non-classical receptive field inhibi- tion, surround suppression, texture I. Introduction E DGE detection is considered a fundamental operation in image processing and computer vision. Conse- quently, much research has been done in this area and a considerable body of literature has been accumulated [1–12]. While a large number of edge detection algorithms have been proposed, research on edge detection continues to be a fertile field of activity. One of the problems with contemporary edge detectors is that they do not make a distinction between contours of objects — these are the ac- tual primitives needed in most machine vision applications — and edges originating from textured regions. There is evidence that the human visual system makes such a dif- ference in its early stages of visual information processing, and that isolated edges, on the one hand, and edges in a group, on the other hand, are perceived in different ways. The authors are with the Institute of Mathematics and Computing Science, University of Groningen, P.O. Box 800, 9700 AV Gronin- gen, The Netherlands. E-mail: {cosmin, petkov, michel}@cs.rug.nl. Phone: +31 50 3637131. Fax: +31 50 363 3800. An important finding in the neurophysiology of the vi- sual system of monkeys and cats, made in the beginning of the 1960s — i.e. before the development of edge detection algorithms for digital image processing — was that the ma- jority of neurons in the primary visual cortex respond to a line or an edge of a certain orientation in a given position of the visual field. Initially, two types of orientation-selective neuron were found, one that was sensitive to the contrast polarity of lines and edges, called simple cell, and another that was not, called complex cell [13,14]. The study of the properties of these neurons has been an active area of re- search [15–20] and, in 1981, a Nobel prize for medicine and physiology was awarded to D. Hubel and T. Wiesel who pioneered this work [21]. Later, computational models were developed aiming at simulating the function of these neurons. Simple cells can be modelled by linear filters followed by half-wave rectifica- tion [22–26]. Complex cells need more intricate modelling, which includes three stages: linear filtering, half-wave rec- tification, and subsequent local spatial summation [27–31]. Local energy models, in which the activities of a pair of simple cells are used to derive the activity of a complex cell, were also proposed [29, 32]. These computational models gave the basis for biologi- cally motivated edge detection algorithms in image process- ing. In particular, a family of two-dimensional Gabor func- tions was proposed as a model of the linear filtering proper- ties of simple cells [33,34]. Subsequently, Gabor functions were widely used in various computer vision tasks, such as image coding and compression [35], motion analysis [36], image enhancement [37], face recognition [38], person iden- tification based on iris pattern analysis [39], texture anal- ysis [40–45], retrieval from image databases [46–48], and edge detection [49–53]. Detailed neurophysiological research revealed a consid- erable functional diversity in the rather broad class of orientation-selective cells. Besides the classes of simple and complex cells [13, 14, 21, 54], further classes were identified, such as end-stopped cells, originally also called hypercom- plex cells [54–59], contour cells [60–62], and grating cells [63,64]. Furthermore, the concept of a receptive field had to be reconsidered. By definition, the receptive field is the re- gion in which an optimal stimulus elicits vigorous response from a neuron. For simple and complex cells, for instance, this is the area in which a bar or an edge of certain optimal size and orientation triggers the cell to respond. This re- gion is presently referred to as the classical receptive field (CRF). Detailed studies have shown that once a cell is ac- tivated by a stimulus in its CRF, another, simultaneously presented stimulus outside that field can have an effect on

Welcome message from author
This document is posted to help you gain knowledge. Please leave a comment to let me know what you think about it! Share it to your friends and learn new things together.
Transcript
IEEE TRANSACTIONS ON IMAGE PROCESSING, VOL. XX, NO. Y, MONTH 2002 1
Contour Detection Based on Non-ClassicalReceptive Field Inhibition
Cosmin Grigorescu, Nicolai Petkov, and Michel A. Westenberg*
Abstract— We propose a biologically motivated computa-tional step, called non-classical receptive field (non-CRF) in-hibition, more generally surround inhibition or suppression,to improve contour detection in machine vision. Non-CRFinhibition is exhibited by 80% of the orientation-selectiveneurons in the primary visual cortex of monkeys and hasbeen demonstrated to influence the visual perception of manas well. The essence of this mechanism is that the responseof an edge detector in a certain point is suppressed by theresponses of the operator in the region outside the area ofoperator support. We combine classical edge detection withtwo types of inhibitory mechanism, isotropic and anisotropicinhibition, both of which have counterparts in biology. Foredge detection, we also use a biologically motivated method(the Gabor energy operator). The resulting operator re-sponds strongly to isolated lines, edges, and contours, butexhibits a weaker or no response to edges that make part oftexture.
We use natural images with associated ground truth con-tour maps to assess the performance of the proposed oper-ator regarding the detection of contours while suppressingtexture edges. The results show that our method enhancescontour detection in cluttered visual scenes more effectivelythan classical edge detectors used in machine vision (Cannyedge detector). Therefore, the proposed operator is moreuseful for contour-based object recognition tasks, such asshape comparison, than traditional edge detectors, whichdo not distinguish between contour and texture edges. Tra-ditional edge detection algorithms can, however, also be ex-tended with surround suppression. Next to the advance-ment of contour detection in machine vision, this study con-tributes to the understanding of inhibitory mechanisms inbiology.
Keywords— Canny operator, contour detection, edge de-tection, Gabor energy, non-classical receptive field inhibi-tion, surround suppression, texture
I. Introduction
EDGE detection is considered a fundamental operationin image processing and computer vision. Conse-
quently, much research has been done in this area anda considerable body of literature has been accumulated[1–12]. While a large number of edge detection algorithmshave been proposed, research on edge detection continuesto be a fertile field of activity. One of the problems withcontemporary edge detectors is that they do not make adistinction between contours of objects — these are the ac-tual primitives needed in most machine vision applications— and edges originating from textured regions. There isevidence that the human visual system makes such a dif-ference in its early stages of visual information processing,and that isolated edges, on the one hand, and edges in agroup, on the other hand, are perceived in different ways.
The authors are with the Institute of Mathematics and ComputingScience, University of Groningen, P.O. Box 800, 9700 AV Gronin-gen, The Netherlands. E-mail: cosmin, petkov, [email protected]: +31 50 3637131. Fax: +31 50 363 3800.
An important finding in the neurophysiology of the vi-sual system of monkeys and cats, made in the beginning ofthe 1960s — i.e. before the development of edge detectionalgorithms for digital image processing — was that the ma-jority of neurons in the primary visual cortex respond to aline or an edge of a certain orientation in a given position ofthe visual field. Initially, two types of orientation-selectiveneuron were found, one that was sensitive to the contrastpolarity of lines and edges, called simple cell, and anotherthat was not, called complex cell [13,14]. The study of theproperties of these neurons has been an active area of re-search [15–20] and, in 1981, a Nobel prize for medicine andphysiology was awarded to D. Hubel and T. Wiesel whopioneered this work [21].
Later, computational models were developed aiming atsimulating the function of these neurons. Simple cells canbe modelled by linear filters followed by half-wave rectifica-tion [22–26]. Complex cells need more intricate modelling,which includes three stages: linear filtering, half-wave rec-tification, and subsequent local spatial summation [27–31].Local energy models, in which the activities of a pair ofsimple cells are used to derive the activity of a complexcell, were also proposed [29,32].
These computational models gave the basis for biologi-cally motivated edge detection algorithms in image process-ing. In particular, a family of two-dimensional Gabor func-tions was proposed as a model of the linear filtering proper-ties of simple cells [33, 34]. Subsequently, Gabor functionswere widely used in various computer vision tasks, such asimage coding and compression [35], motion analysis [36],image enhancement [37], face recognition [38], person iden-tification based on iris pattern analysis [39], texture anal-ysis [40–45], retrieval from image databases [46–48], andedge detection [49–53].
Detailed neurophysiological research revealed a consid-erable functional diversity in the rather broad class oforientation-selective cells. Besides the classes of simple andcomplex cells [13,14,21,54], further classes were identified,such as end-stopped cells, originally also called hypercom-plex cells [54–59], contour cells [60–62], and grating cells[63,64]. Furthermore, the concept of a receptive field had tobe reconsidered. By definition, the receptive field is the re-gion in which an optimal stimulus elicits vigorous responsefrom a neuron. For simple and complex cells, for instance,this is the area in which a bar or an edge of certain optimalsize and orientation triggers the cell to respond. This re-gion is presently referred to as the classical receptive field(CRF). Detailed studies have shown that once a cell is ac-tivated by a stimulus in its CRF, another, simultaneouslypresented stimulus outside that field can have an effect on
2 IEEE TRANSACTIONS ON IMAGE PROCESSING, VOL. XX, NO. Y, MONTH 2002
Fig. 1. The effect of orientation contrast in non-CRF inhibition [69]:the plot shows the response of a neuron to a stimulus composed ofa single bar of optimal orientation in the CRF (central circle) and agrating of varying orientation outside the CRF. The inhibition by thesurrounding grating is strongest when its orientation coincides withthe orientation of the optimal stimulus. (Courtesy of C. Blakemoreand Exp. Brain Res.).
the cell response [65, 66]. This, mostly inhibitive effect isreferred to as non-classical receptive field (non-CRF) inhi-bition; it turned out to be the rule rather than the excep-tion, being exhibited to a different extent by 80% of theorientation-selective cells [67, 68]. Many studies focussedon the effect of orientation contrast [66, 67, 69–73]. Blake-more and Tobin [69], for instance, measured the responseof a cell to a white bar of optimal orientation, position,and size in the presence of a grating covering the area out-side the CRF. They observed an inhibitory effect causedby the grating. This effect was strongest when the grat-ing had the same orientation as the optimal bar stimulus;in this case the response of the cell was reduced to thelevel of spontaneous activity. The inhibitory effect of thegrating decreased with the deviation of its orientation fromthe optimal orientation, see Fig. 1. The dependence of thenon-CRF inhibition on the relative orientation, contrast,spatial frequency, and position of the distractor stimuluswas studied in [74]. In general, an orientation-selective cellwith non-CRF inhibition will respond most strongly to asingle bar, line, or edge in its receptive field and will showreduced response when more bars are added to the sur-roundings. In an extreme case, such a cell responds to anisolated bar or line, but does not respond to a system ofsuch stimuli [64]. Such cells have actually been found byneurophysiologists: Schiller et al. [75], for instance, foundmany cells in area V1 which responded strongly to singlebars and edges but did not respond to sine-wave gratings.Similar cells were encountered by Peterhans and von derHeydt [64] in experiments with bars, edges, and square-wave gratings as test stimuli. This type of cell was calledthe bar cell, referring to the preference of the operator forbars vs. gratings, and a computational model was proposedfor it [76].
The neurophysiological data mentioned above correlateswell with the results of various psychophysical experiments,which have shown that the perception of an oriented stim-ulus, such as a line, can be influenced by the presence of
Fig. 2. (a) The pop-out effect of an oriented line segment on abackground of other segments, the distractors, correlates well with theresponse of the neuron shown in Fig. 1 as a function of the orientationcontrast: the segment pops out only if its orientation is sufficientlydifferent from that of the background. (b) The three legs of thetriangle are not perceived in the same way: the leg that is parallel tothe bars of the grating is less salient than the other two legs [80].
other such stimuli (distractors) in its neighbourhood. Thisinfluence can, for instance, manifest itself in an overestima-tion of an acute angle between two lines [77], or in the so-called orientation contrast pop-out effect [67], see Fig. 2(a).Figure 2(b) illustrates the suppression of contour percep-tion by a grating. The contour ‘disappears’ in a gratingmost easily when the grating consists of elements similarto the contour. The latter effect was shown to exhibit aspecific dependence on the spatial frequency of the distrac-tor signal [78,79].
As non-CRF inhibition seems to be a common propertyof biological edge detectors that determines human percep-tion of edges and lines, we considered a more close exami-nation of the role of this mechanism in the process of edgedetection and evaluating its potential usefulness in imageprocessing and computer vision algorithms to be worth-while. Our main hypothesis is that this mechanism sup-presses edges which make part of texture, while it doesnot suppress edges that belong to the contours of objects.An edge detection algorithm which employs this inhibitionmechanism will thus primarily detect contours of objects,and it will not respond (sufficiently) to edges which belongto texture regions. The edge maps generated by such anedge detector will thus be more useful for contour-basedobject recognition tasks, such as shape comparison [81,82],than traditional edge detectors which do not make a differ-ence between contour and texture edges.
The paper is organized as follows. Section II describescomputational models. Simple cell and complex cell modelsand the related Gabor and Gabor energy filters are brieflydiscussed, and two contour operators that employ non-CRFinhibition are introduced. In Section III, we evaluate theperformance of the contour operators. A performance mea-sure is defined, and experimental results obtained with thecontour operators and the Canny edge detector are com-pared. Finally, we summarize the results and draw conclu-sions in Section IV.
GRIGORESCU, PETKOV, & WESTENBERG: CONTOUR DETECTION BASED ON NON-CLASSICAL RECEPTIVE FIELD INHIBITION 3
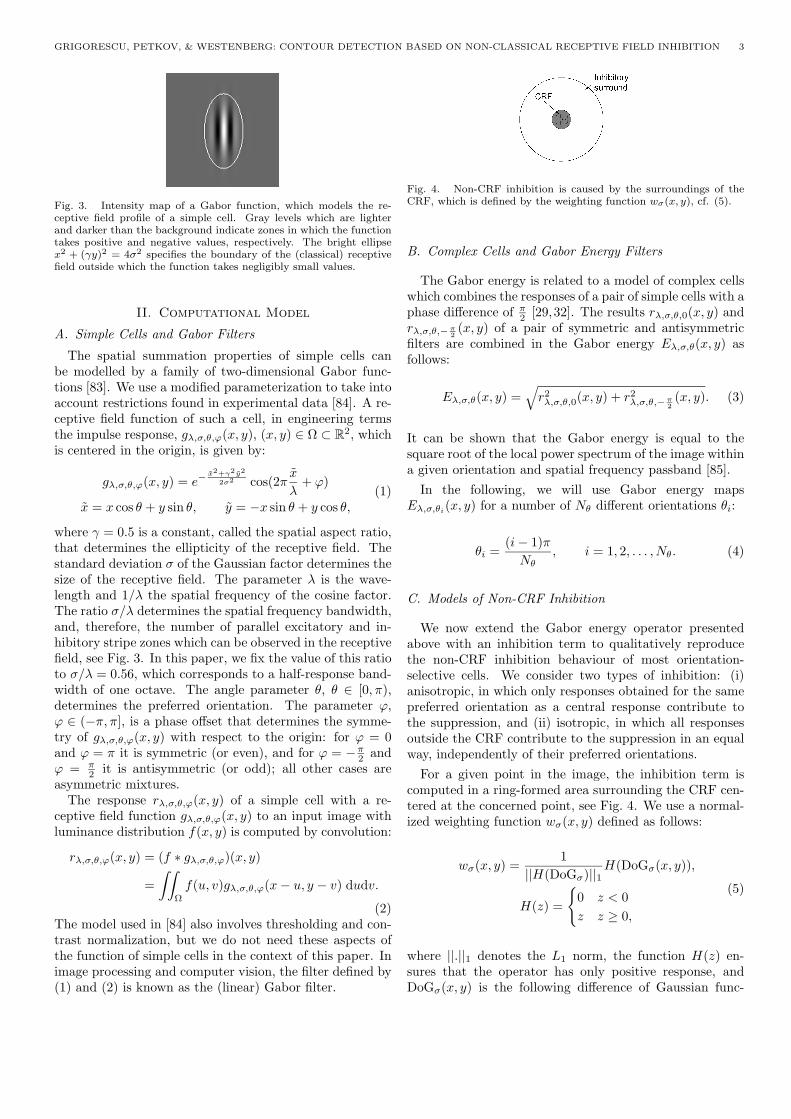
Fig. 3. Intensity map of a Gabor function, which models the re-ceptive field profile of a simple cell. Gray levels which are lighterand darker than the background indicate zones in which the functiontakes positive and negative values, respectively. The bright ellipsex2 + (γy)2 = 4σ2 specifies the boundary of the (classical) receptivefield outside which the function takes negligibly small values.
II. Computational Model
A. Simple Cells and Gabor Filters
The spatial summation properties of simple cells canbe modelled by a family of two-dimensional Gabor func-tions [83]. We use a modified parameterization to take intoaccount restrictions found in experimental data [84]. A re-ceptive field function of such a cell, in engineering termsthe impulse response, gλ,σ,θ,ϕ(x, y), (x, y) ∈ Ω ⊂ R2, whichis centered in the origin, is given by:
gλ,σ,θ,ϕ(x, y) = e−x2+γ2y2
2σ2 cos(2πx
λ+ ϕ)
x = x cos θ + y sin θ, y = −x sin θ + y cos θ,(1)
where γ = 0.5 is a constant, called the spatial aspect ratio,that determines the ellipticity of the receptive field. Thestandard deviation σ of the Gaussian factor determines thesize of the receptive field. The parameter λ is the wave-length and 1/λ the spatial frequency of the cosine factor.The ratio σ/λ determines the spatial frequency bandwidth,and, therefore, the number of parallel excitatory and in-hibitory stripe zones which can be observed in the receptivefield, see Fig. 3. In this paper, we fix the value of this ratioto σ/λ = 0.56, which corresponds to a half-response band-width of one octave. The angle parameter θ, θ ∈ [0, π),determines the preferred orientation. The parameter ϕ,ϕ ∈ (−π, π], is a phase offset that determines the symme-try of gλ,σ,θ,ϕ(x, y) with respect to the origin: for ϕ = 0and ϕ = π it is symmetric (or even), and for ϕ = −π2 andϕ = π
2 it is antisymmetric (or odd); all other cases areasymmetric mixtures.
The response rλ,σ,θ,ϕ(x, y) of a simple cell with a re-ceptive field function gλ,σ,θ,ϕ(x, y) to an input image withluminance distribution f(x, y) is computed by convolution:
rλ,σ,θ,ϕ(x, y) = (f ∗ gλ,σ,θ,ϕ)(x, y)
=∫∫
Ω
f(u, v)gλ,σ,θ,ϕ(x− u, y − v) dudv.
(2)The model used in [84] also involves thresholding and con-trast normalization, but we do not need these aspects ofthe function of simple cells in the context of this paper. Inimage processing and computer vision, the filter defined by(1) and (2) is known as the (linear) Gabor filter.
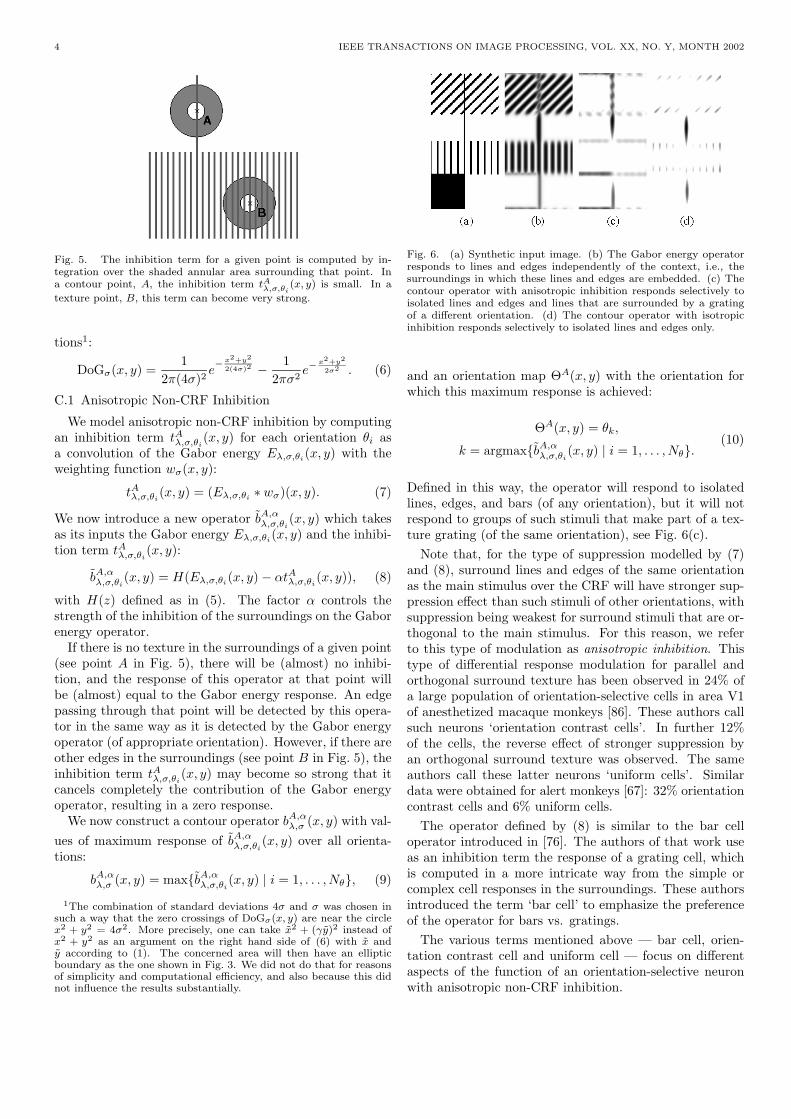
Fig. 4. Non-CRF inhibition is caused by the surroundings of theCRF, which is defined by the weighting function wσ(x, y), cf. (5).
B. Complex Cells and Gabor Energy Filters
The Gabor energy is related to a model of complex cellswhich combines the responses of a pair of simple cells with aphase difference of π
2 [29,32]. The results rλ,σ,θ,0(x, y) andrλ,σ,θ,−π2 (x, y) of a pair of symmetric and antisymmetricfilters are combined in the Gabor energy Eλ,σ,θ(x, y) asfollows:
Eλ,σ,θ(x, y) =√r2λ,σ,θ,0(x, y) + r2
λ,σ,θ,−π2(x, y). (3)
It can be shown that the Gabor energy is equal to thesquare root of the local power spectrum of the image withina given orientation and spatial frequency passband [85].
In the following, we will use Gabor energy mapsEλ,σ,θi(x, y) for a number of Nθ different orientations θi:
θi =(i− 1)πNθ
, i = 1, 2, . . . , Nθ. (4)
C. Models of Non-CRF Inhibition
We now extend the Gabor energy operator presentedabove with an inhibition term to qualitatively reproducethe non-CRF inhibition behaviour of most orientation-selective cells. We consider two types of inhibition: (i)anisotropic, in which only responses obtained for the samepreferred orientation as a central response contribute tothe suppression, and (ii) isotropic, in which all responsesoutside the CRF contribute to the suppression in an equalway, independently of their preferred orientations.
For a given point in the image, the inhibition term iscomputed in a ring-formed area surrounding the CRF cen-tered at the concerned point, see Fig. 4. We use a normal-ized weighting function wσ(x, y) defined as follows:
wσ(x, y) =1
||H(DoGσ)||1H(DoGσ(x, y)),
H(z) =
0 z < 0z z ≥ 0,
(5)
where ||.||1 denotes the L1 norm, the function H(z) en-sures that the operator has only positive response, andDoGσ(x, y) is the following difference of Gaussian func-
4 IEEE TRANSACTIONS ON IMAGE PROCESSING, VOL. XX, NO. Y, MONTH 2002
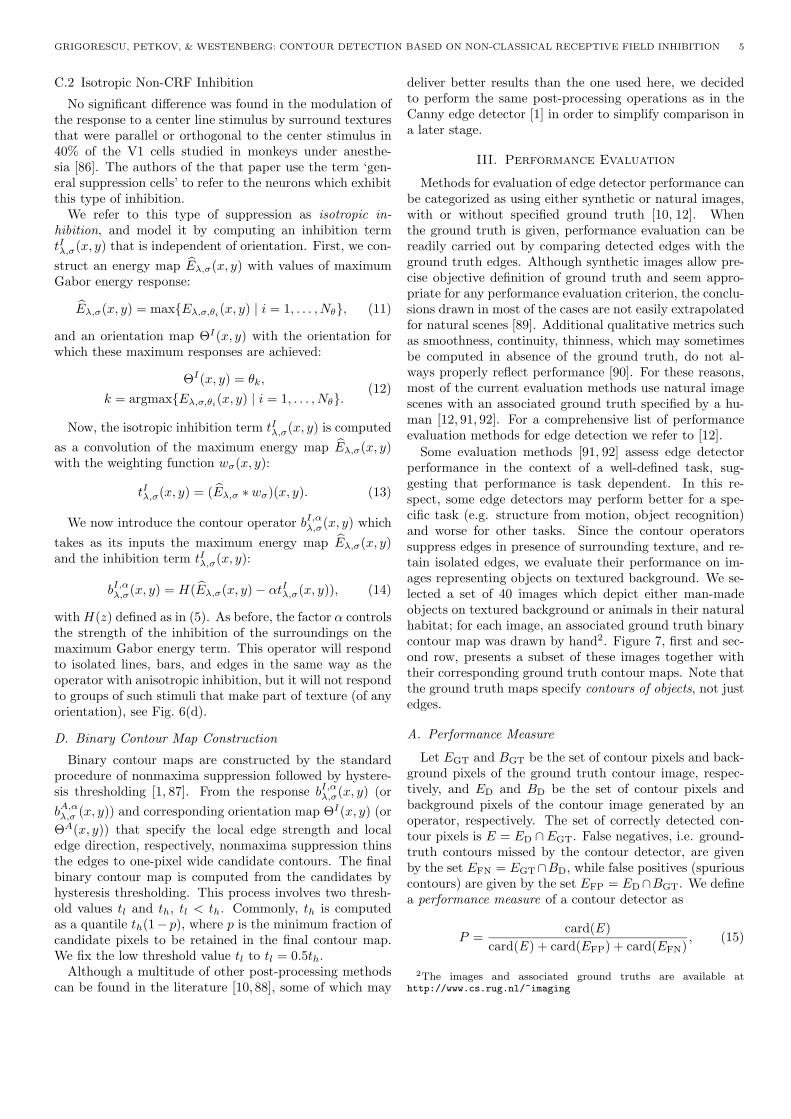
Fig. 5. The inhibition term for a given point is computed by in-tegration over the shaded annular area surrounding that point. Ina contour point, A, the inhibition term tAλ,σ,θi
(x, y) is small. In a
texture point, B, this term can become very strong.
tions1:
DoGσ(x, y) =1
2π(4σ)2e− x
2+y2
2(4σ)2 − 12πσ2
e−x2+y2
2σ2 . (6)
C.1 Anisotropic Non-CRF Inhibition
We model anisotropic non-CRF inhibition by computingan inhibition term tAλ,σ,θi(x, y) for each orientation θi asa convolution of the Gabor energy Eλ,σ,θi(x, y) with theweighting function wσ(x, y):
tAλ,σ,θi(x, y) = (Eλ,σ,θi ∗ wσ)(x, y). (7)
We now introduce a new operator bA,αλ,σ,θi(x, y) which takes
as its inputs the Gabor energy Eλ,σ,θi(x, y) and the inhibi-tion term tAλ,σ,θi(x, y):
bA,αλ,σ,θi(x, y) = H(Eλ,σ,θi(x, y)− αtAλ,σ,θi(x, y)), (8)
with H(z) defined as in (5). The factor α controls thestrength of the inhibition of the surroundings on the Gaborenergy operator.
If there is no texture in the surroundings of a given point(see point A in Fig. 5), there will be (almost) no inhibi-tion, and the response of this operator at that point willbe (almost) equal to the Gabor energy response. An edgepassing through that point will be detected by this opera-tor in the same way as it is detected by the Gabor energyoperator (of appropriate orientation). However, if there areother edges in the surroundings (see point B in Fig. 5), theinhibition term tAλ,σ,θi(x, y) may become so strong that itcancels completely the contribution of the Gabor energyoperator, resulting in a zero response.
We now construct a contour operator bA,αλ,σ (x, y) with val-ues of maximum response of bA,αλ,σ,θi
(x, y) over all orienta-tions:
bA,αλ,σ (x, y) = maxbA,αλ,σ,θi(x, y) | i = 1, . . . , Nθ, (9)
1The combination of standard deviations 4σ and σ was chosen insuch a way that the zero crossings of DoGσ(x, y) are near the circlex2 + y2 = 4σ2. More precisely, one can take x2 + (γy)2 instead ofx2 + y2 as an argument on the right hand side of (6) with x andy according to (1). The concerned area will then have an ellipticboundary as the one shown in Fig. 3. We did not do that for reasonsof simplicity and computational efficiency, and also because this didnot influence the results substantially.
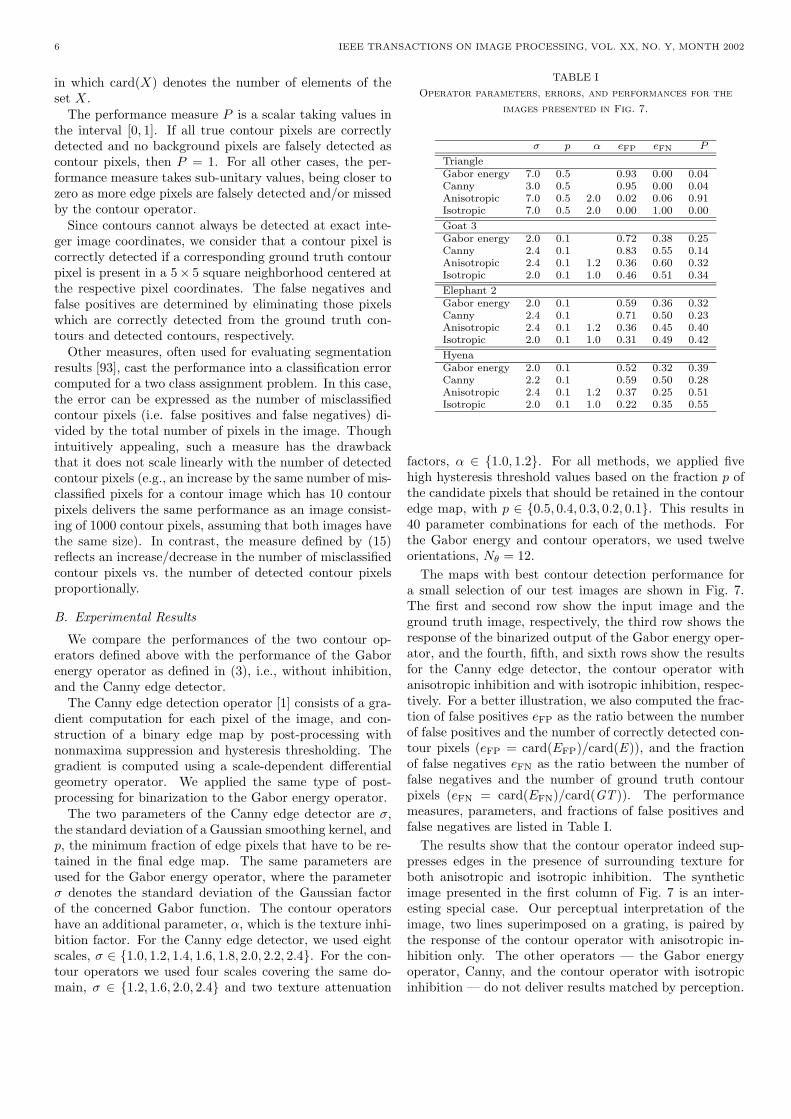
Fig. 6. (a) Synthetic input image. (b) The Gabor energy operatorresponds to lines and edges independently of the context, i.e., thesurroundings in which these lines and edges are embedded. (c) Thecontour operator with anisotropic inhibition responds selectively toisolated lines and edges and lines that are surrounded by a gratingof a different orientation. (d) The contour operator with isotropicinhibition responds selectively to isolated lines and edges only.
and an orientation map ΘA(x, y) with the orientation forwhich this maximum response is achieved:
ΘA(x, y) = θk,
k = argmaxbA,αλ,σ,θi(x, y) | i = 1, . . . , Nθ.
(10)
Defined in this way, the operator will respond to isolatedlines, edges, and bars (of any orientation), but it will notrespond to groups of such stimuli that make part of a tex-ture grating (of the same orientation), see Fig. 6(c).
Note that, for the type of suppression modelled by (7)and (8), surround lines and edges of the same orientationas the main stimulus over the CRF will have stronger sup-pression effect than such stimuli of other orientations, withsuppression being weakest for surround stimuli that are or-thogonal to the main stimulus. For this reason, we referto this type of modulation as anisotropic inhibition. Thistype of differential response modulation for parallel andorthogonal surround texture has been observed in 24% ofa large population of orientation-selective cells in area V1of anesthetized macaque monkeys [86]. These authors callsuch neurons ‘orientation contrast cells’. In further 12%of the cells, the reverse effect of stronger suppression byan orthogonal surround texture was observed. The sameauthors call these latter neurons ‘uniform cells’. Similardata were obtained for alert monkeys [67]: 32% orientationcontrast cells and 6% uniform cells.
The operator defined by (8) is similar to the bar celloperator introduced in [76]. The authors of that work useas an inhibition term the response of a grating cell, whichis computed in a more intricate way from the simple orcomplex cell responses in the surroundings. These authorsintroduced the term ‘bar cell’ to emphasize the preferenceof the operator for bars vs. gratings.
The various terms mentioned above — bar cell, orien-tation contrast cell and uniform cell — focus on differentaspects of the function of an orientation-selective neuronwith anisotropic non-CRF inhibition.
GRIGORESCU, PETKOV, & WESTENBERG: CONTOUR DETECTION BASED ON NON-CLASSICAL RECEPTIVE FIELD INHIBITION 5
C.2 Isotropic Non-CRF Inhibition
No significant difference was found in the modulation ofthe response to a center line stimulus by surround texturesthat were parallel or orthogonal to the center stimulus in40% of the V1 cells studied in monkeys under anesthe-sia [86]. The authors of the that paper use the term ‘gen-eral suppression cells’ to refer to the neurons which exhibitthis type of inhibition.
We refer to this type of suppression as isotropic in-hibition, and model it by computing an inhibition termtIλ,σ(x, y) that is independent of orientation. First, we con-struct an energy map Eλ,σ(x, y) with values of maximumGabor energy response:
Eλ,σ(x, y) = maxEλ,σ,θi(x, y) | i = 1, . . . , Nθ, (11)
and an orientation map ΘI(x, y) with the orientation forwhich these maximum responses are achieved:
ΘI(x, y) = θk,
k = argmaxEλ,σ,θi(x, y) | i = 1, . . . , Nθ.(12)
Now, the isotropic inhibition term tIλ,σ(x, y) is computedas a convolution of the maximum energy map Eλ,σ(x, y)with the weighting function wσ(x, y):
tIλ,σ(x, y) = (Eλ,σ ∗ wσ)(x, y). (13)
We now introduce the contour operator bI,αλ,σ(x, y) whichtakes as its inputs the maximum energy map Eλ,σ(x, y)and the inhibition term tIλ,σ(x, y):
bI,αλ,σ(x, y) = H(Eλ,σ(x, y)− αtIλ,σ(x, y)), (14)
with H(z) defined as in (5). As before, the factor α controlsthe strength of the inhibition of the surroundings on themaximum Gabor energy term. This operator will respondto isolated lines, bars, and edges in the same way as theoperator with anisotropic inhibition, but it will not respondto groups of such stimuli that make part of texture (of anyorientation), see Fig. 6(d).
D. Binary Contour Map Construction
Binary contour maps are constructed by the standardprocedure of nonmaxima suppression followed by hystere-sis thresholding [1, 87]. From the response bI,αλ,σ(x, y) (orbA,αλ,σ (x, y)) and corresponding orientation map ΘI(x, y) (orΘA(x, y)) that specify the local edge strength and localedge direction, respectively, nonmaxima suppression thinsthe edges to one-pixel wide candidate contours. The finalbinary contour map is computed from the candidates byhysteresis thresholding. This process involves two thresh-old values tl and th, tl < th. Commonly, th is computedas a quantile th(1− p), where p is the minimum fraction ofcandidate pixels to be retained in the final contour map.We fix the low threshold value tl to tl = 0.5th.
Although a multitude of other post-processing methodscan be found in the literature [10, 88], some of which may
deliver better results than the one used here, we decidedto perform the same post-processing operations as in theCanny edge detector [1] in order to simplify comparison ina later stage.
III. Performance Evaluation
Methods for evaluation of edge detector performance canbe categorized as using either synthetic or natural images,with or without specified ground truth [10, 12]. Whenthe ground truth is given, performance evaluation can bereadily carried out by comparing detected edges with theground truth edges. Although synthetic images allow pre-cise objective definition of ground truth and seem appro-priate for any performance evaluation criterion, the conclu-sions drawn in most of the cases are not easily extrapolatedfor natural scenes [89]. Additional qualitative metrics suchas smoothness, continuity, thinness, which may sometimesbe computed in absence of the ground truth, do not al-ways properly reflect performance [90]. For these reasons,most of the current evaluation methods use natural imagescenes with an associated ground truth specified by a hu-man [12, 91, 92]. For a comprehensive list of performanceevaluation methods for edge detection we refer to [12].
Some evaluation methods [91, 92] assess edge detectorperformance in the context of a well-defined task, sug-gesting that performance is task dependent. In this re-spect, some edge detectors may perform better for a spe-cific task (e.g. structure from motion, object recognition)and worse for other tasks. Since the contour operatorssuppress edges in presence of surrounding texture, and re-tain isolated edges, we evaluate their performance on im-ages representing objects on textured background. We se-lected a set of 40 images which depict either man-madeobjects on textured background or animals in their naturalhabitat; for each image, an associated ground truth binarycontour map was drawn by hand2. Figure 7, first and sec-ond row, presents a subset of these images together withtheir corresponding ground truth contour maps. Note thatthe ground truth maps specify contours of objects, not justedges.
A. Performance Measure
Let EGT and BGT be the set of contour pixels and back-ground pixels of the ground truth contour image, respec-tively, and ED and BD be the set of contour pixels andbackground pixels of the contour image generated by anoperator, respectively. The set of correctly detected con-tour pixels is E = ED ∩EGT. False negatives, i.e. ground-truth contours missed by the contour detector, are givenby the set EFN = EGT∩BD, while false positives (spuriouscontours) are given by the set EFP = ED∩BGT. We definea performance measure of a contour detector as
P =card(E )
card(E ) + card(EFP) + card(EFN), (15)
2The images and associated ground truths are available athttp://www.cs.rug.nl/~imaging
6 IEEE TRANSACTIONS ON IMAGE PROCESSING, VOL. XX, NO. Y, MONTH 2002
in which card(X) denotes the number of elements of theset X.
The performance measure P is a scalar taking values inthe interval [0, 1]. If all true contour pixels are correctlydetected and no background pixels are falsely detected ascontour pixels, then P = 1. For all other cases, the per-formance measure takes sub-unitary values, being closer tozero as more edge pixels are falsely detected and/or missedby the contour operator.
Since contours cannot always be detected at exact inte-ger image coordinates, we consider that a contour pixel iscorrectly detected if a corresponding ground truth contourpixel is present in a 5× 5 square neighborhood centered atthe respective pixel coordinates. The false negatives andfalse positives are determined by eliminating those pixelswhich are correctly detected from the ground truth con-tours and detected contours, respectively.
Other measures, often used for evaluating segmentationresults [93], cast the performance into a classification errorcomputed for a two class assignment problem. In this case,the error can be expressed as the number of misclassifiedcontour pixels (i.e. false positives and false negatives) di-vided by the total number of pixels in the image. Thoughintuitively appealing, such a measure has the drawbackthat it does not scale linearly with the number of detectedcontour pixels (e.g., an increase by the same number of mis-classified pixels for a contour image which has 10 contourpixels delivers the same performance as an image consist-ing of 1000 contour pixels, assuming that both images havethe same size). In contrast, the measure defined by (15)reflects an increase/decrease in the number of misclassifiedcontour pixels vs. the number of detected contour pixelsproportionally.
B. Experimental Results
We compare the performances of the two contour op-erators defined above with the performance of the Gaborenergy operator as defined in (3), i.e., without inhibition,and the Canny edge detector.
The Canny edge detection operator [1] consists of a gra-dient computation for each pixel of the image, and con-struction of a binary edge map by post-processing withnonmaxima suppression and hysteresis thresholding. Thegradient is computed using a scale-dependent differentialgeometry operator. We applied the same type of post-processing for binarization to the Gabor energy operator.
The two parameters of the Canny edge detector are σ,the standard deviation of a Gaussian smoothing kernel, andp, the minimum fraction of edge pixels that have to be re-tained in the final edge map. The same parameters areused for the Gabor energy operator, where the parameterσ denotes the standard deviation of the Gaussian factorof the concerned Gabor function. The contour operatorshave an additional parameter, α, which is the texture inhi-bition factor. For the Canny edge detector, we used eightscales, σ ∈ 1.0, 1.2, 1.4, 1.6, 1.8, 2.0, 2.2, 2.4. For the con-tour operators we used four scales covering the same do-main, σ ∈ 1.2, 1.6, 2.0, 2.4 and two texture attenuation
TABLE I
Operator parameters, errors, and performances for the
images presented in Fig. 7.
σ p α eFP eFN P
TriangleGabor energy 7.0 0.5 0.93 0.00 0.04Canny 3.0 0.5 0.95 0.00 0.04Anisotropic 7.0 0.5 2.0 0.02 0.06 0.91Isotropic 7.0 0.5 2.0 0.00 1.00 0.00
Goat 3Gabor energy 2.0 0.1 0.72 0.38 0.25Canny 2.4 0.1 0.83 0.55 0.14Anisotropic 2.4 0.1 1.2 0.36 0.60 0.32Isotropic 2.0 0.1 1.0 0.46 0.51 0.34
Elephant 2Gabor energy 2.0 0.1 0.59 0.36 0.32Canny 2.4 0.1 0.71 0.50 0.23Anisotropic 2.4 0.1 1.2 0.36 0.45 0.40Isotropic 2.0 0.1 1.0 0.31 0.49 0.42
HyenaGabor energy 2.0 0.1 0.52 0.32 0.39Canny 2.2 0.1 0.59 0.50 0.28Anisotropic 2.4 0.1 1.2 0.37 0.25 0.51Isotropic 2.0 0.1 1.0 0.22 0.35 0.55
factors, α ∈ 1.0, 1.2. For all methods, we applied fivehigh hysteresis threshold values based on the fraction p ofthe candidate pixels that should be retained in the contouredge map, with p ∈ 0.5, 0.4, 0.3, 0.2, 0.1. This results in40 parameter combinations for each of the methods. Forthe Gabor energy and contour operators, we used twelveorientations, Nθ = 12.
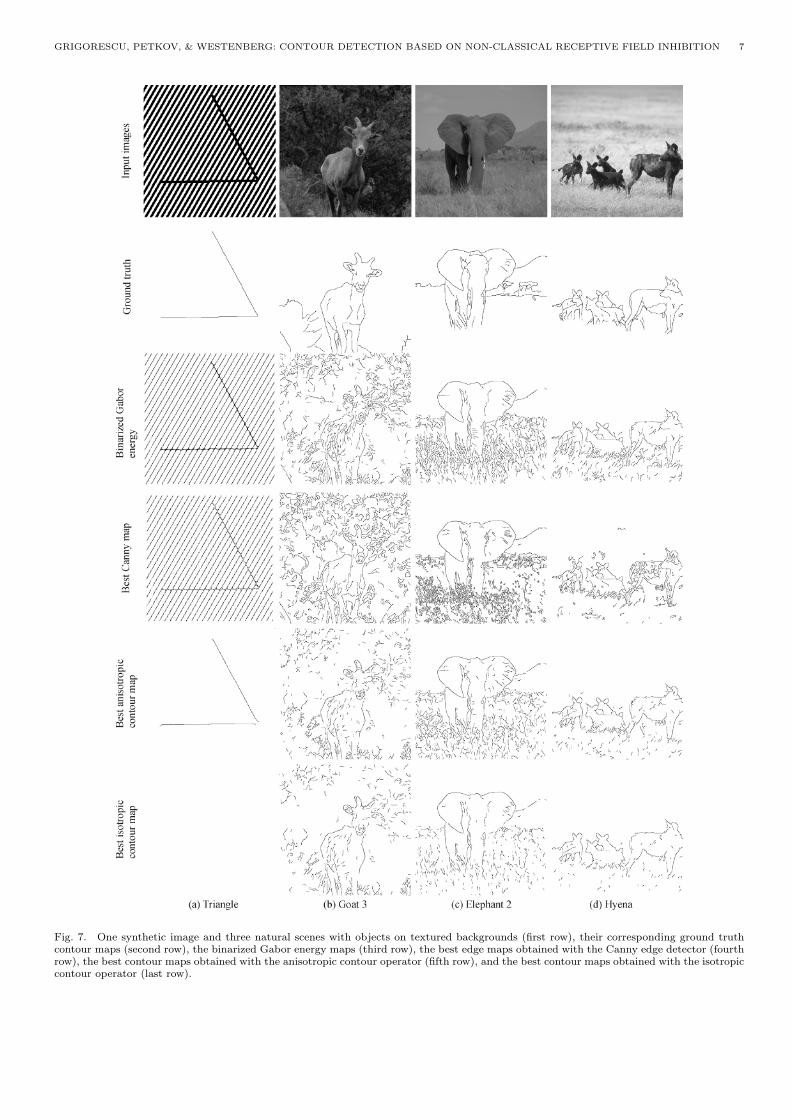
The maps with best contour detection performance fora small selection of our test images are shown in Fig. 7.The first and second row show the input image and theground truth image, respectively, the third row shows theresponse of the binarized output of the Gabor energy oper-ator, and the fourth, fifth, and sixth rows show the resultsfor the Canny edge detector, the contour operator withanisotropic inhibition and with isotropic inhibition, respec-tively. For a better illustration, we also computed the frac-tion of false positives eFP as the ratio between the numberof false positives and the number of correctly detected con-tour pixels (eFP = card(EFP)/card(E )), and the fractionof false negatives eFN as the ratio between the number offalse negatives and the number of ground truth contourpixels (eFN = card(EFN)/card(GT )). The performancemeasures, parameters, and fractions of false positives andfalse negatives are listed in Table I.
The results show that the contour operator indeed sup-presses edges in the presence of surrounding texture forboth anisotropic and isotropic inhibition. The syntheticimage presented in the first column of Fig. 7 is an inter-esting special case. Our perceptual interpretation of theimage, two lines superimposed on a grating, is paired bythe response of the contour operator with anisotropic in-hibition only. The other operators — the Gabor energyoperator, Canny, and the contour operator with isotropicinhibition — do not deliver results matched by perception.
GRIGORESCU, PETKOV, & WESTENBERG: CONTOUR DETECTION BASED ON NON-CLASSICAL RECEPTIVE FIELD INHIBITION 7
Fig. 7. One synthetic image and three natural scenes with objects on textured backgrounds (first row), their corresponding ground truthcontour maps (second row), the binarized Gabor energy maps (third row), the best edge maps obtained with the Canny edge detector (fourthrow), the best contour maps obtained with the anisotropic contour operator (fifth row), and the best contour maps obtained with the isotropiccontour operator (last row).
8 IEEE TRANSACTIONS ON IMAGE PROCESSING, VOL. XX, NO. Y, MONTH 2002
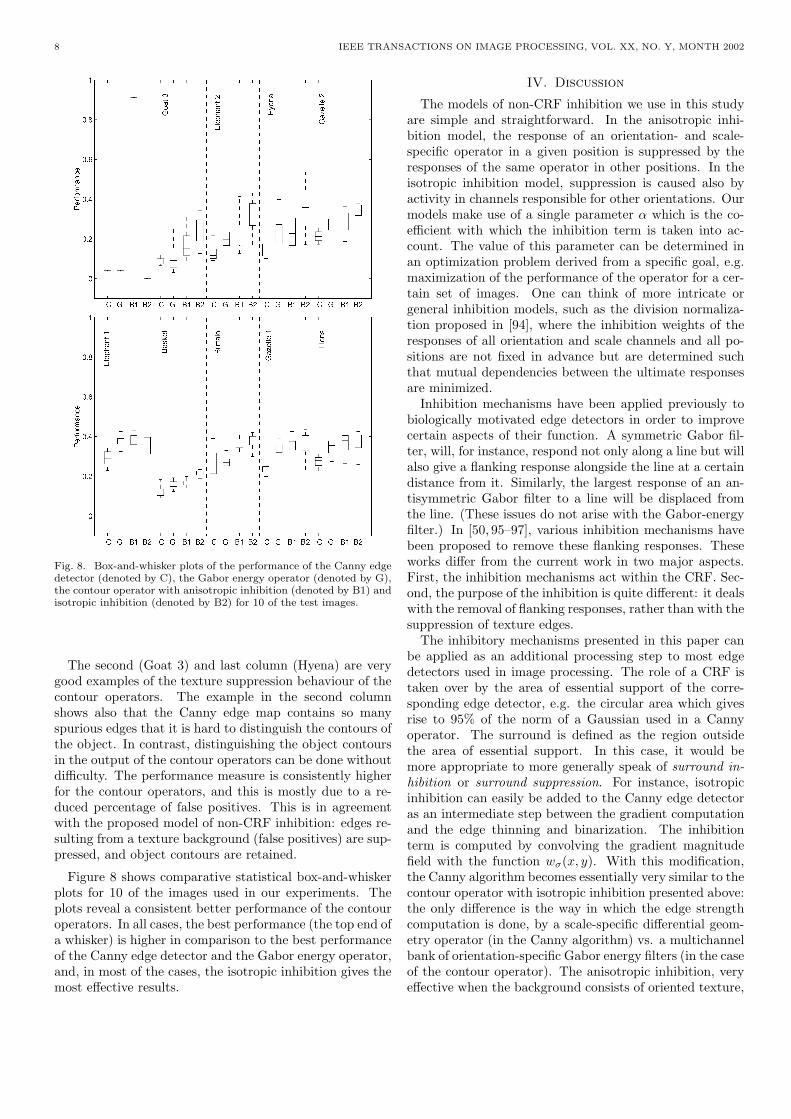
Fig. 8. Box-and-whisker plots of the performance of the Canny edgedetector (denoted by C), the Gabor energy operator (denoted by G),the contour operator with anisotropic inhibition (denoted by B1) andisotropic inhibition (denoted by B2) for 10 of the test images.
The second (Goat 3) and last column (Hyena) are verygood examples of the texture suppression behaviour of thecontour operators. The example in the second columnshows also that the Canny edge map contains so manyspurious edges that it is hard to distinguish the contours ofthe object. In contrast, distinguishing the object contoursin the output of the contour operators can be done withoutdifficulty. The performance measure is consistently higherfor the contour operators, and this is mostly due to a re-duced percentage of false positives. This is in agreementwith the proposed model of non-CRF inhibition: edges re-sulting from a texture background (false positives) are sup-pressed, and object contours are retained.
Figure 8 shows comparative statistical box-and-whiskerplots for 10 of the images used in our experiments. Theplots reveal a consistent better performance of the contouroperators. In all cases, the best performance (the top end ofa whisker) is higher in comparison to the best performanceof the Canny edge detector and the Gabor energy operator,and, in most of the cases, the isotropic inhibition gives themost effective results.
IV. Discussion
The models of non-CRF inhibition we use in this studyare simple and straightforward. In the anisotropic inhi-bition model, the response of an orientation- and scale-specific operator in a given position is suppressed by theresponses of the same operator in other positions. In theisotropic inhibition model, suppression is caused also byactivity in channels responsible for other orientations. Ourmodels make use of a single parameter α which is the co-efficient with which the inhibition term is taken into ac-count. The value of this parameter can be determined inan optimization problem derived from a specific goal, e.g.maximization of the performance of the operator for a cer-tain set of images. One can think of more intricate orgeneral inhibition models, such as the division normaliza-tion proposed in [94], where the inhibition weights of theresponses of all orientation and scale channels and all po-sitions are not fixed in advance but are determined suchthat mutual dependencies between the ultimate responsesare minimized.
Inhibition mechanisms have been applied previously tobiologically motivated edge detectors in order to improvecertain aspects of their function. A symmetric Gabor fil-ter, will, for instance, respond not only along a line but willalso give a flanking response alongside the line at a certaindistance from it. Similarly, the largest response of an an-tisymmetric Gabor filter to a line will be displaced fromthe line. (These issues do not arise with the Gabor-energyfilter.) In [50, 95–97], various inhibition mechanisms havebeen proposed to remove these flanking responses. Theseworks differ from the current work in two major aspects.First, the inhibition mechanisms act within the CRF. Sec-ond, the purpose of the inhibition is quite different: it dealswith the removal of flanking responses, rather than with thesuppression of texture edges.
The inhibitory mechanisms presented in this paper canbe applied as an additional processing step to most edgedetectors used in image processing. The role of a CRF istaken over by the area of essential support of the corre-sponding edge detector, e.g. the circular area which givesrise to 95% of the norm of a Gaussian used in a Cannyoperator. The surround is defined as the region outsidethe area of essential support. In this case, it would bemore appropriate to more generally speak of surround in-hibition or surround suppression. For instance, isotropicinhibition can easily be added to the Canny edge detectoras an intermediate step between the gradient computationand the edge thinning and binarization. The inhibitionterm is computed by convolving the gradient magnitudefield with the function wσ(x, y). With this modification,the Canny algorithm becomes essentially very similar to thecontour operator with isotropic inhibition presented above:the only difference is the way in which the edge strengthcomputation is done, by a scale-specific differential geom-etry operator (in the Canny algorithm) vs. a multichannelbank of orientation-specific Gabor energy filters (in the caseof the contour operator). The anisotropic inhibition, veryeffective when the background consists of oriented texture,
GRIGORESCU, PETKOV, & WESTENBERG: CONTOUR DETECTION BASED ON NON-CLASSICAL RECEPTIVE FIELD INHIBITION 9
can also be incorporated, while less directly, as a compu-tational step into the Canny algorithm and other similaralgorithms which operate on a gradient magnitude and ori-entation map. The inhibition step may be expected to im-prove contour detection performance when images containobjects of interest on a textured or cluttered background.
The non-CRF inhibition algorithms presented in this pa-per treat different classes of edges and lines in differentways: single contour lines and edges, on one hand, beingconsidered as non-texture features, are not affected by theinhibition, while groups of lines and edges, on the otherhand, viewed as texture features, are suppressed. As al-ready noted in the introduction, this different treatmentcorrelates well with our own visual perception. For in-stance, while the contours of a single leaf of a tree on aplain background are to be seen as non-texture features,the same contours can occur as texture features when theyappear in a foliage image together with the contours ofmany other leaves. The emergence of a separate linguisticentity, the word ‘texture’, for a group of edges indicatesa semantic difference associated with the context in whichan edge appears: stand-alone as a contour of an object vs.in a group of similar edges forming texture. In a similarway, separate entities have evolved in language to indicatea semantic, contextual difference between a single tree anda collection of trees, a forest.
It was suggested by Nothdurft et al. [86] that non-CRFinhibition may play a certain role in texture segmenta-tion by generating sensitivity to (texture) feature contrast.Our computational models supports this assumption. Theanisotropic surround inhibition operator (8), for instance,will respond more strongly at the boundary between twotextures of different preferred orientations than inside uni-form texture regions. Both the isotropic (14) and theanisotropic (8) operator will respond more strongly at theboundary between two textures of different frequency spec-tra than inside these textures. Next to this role of non-CRFinhibition, we think that the main biological utility of non-CRF inhibition is the separation of contour from textureinformation and the mediation of object contours to highercortical areas as proposed previously in [76, 98]. Indeed,while non-CRF inhibition scarcely influences the responsesto isolated contours, i.e., contours that are not embedded intexture, it strongly reduces the responses to texture. Thebiologically (in our view) most important effect of this neu-ral mechanism might thus be that of contour (vs. texture)detection.
In summary, in this work we have shown that non-CRFinhibition, more generally surround inhibition, is a usefulcomputational mechanism that substantially improves con-tour detection.
References
[1] J. F. Canny, “A computational approach to edge detection,”IEEE Trans. Pattern Anal. and Machine Intell., vol. 8, no. 6,pp. 679–698, 1986.
[2] F. Bergholm, “Edge focusing,” IEEE Trans. Pattern Anal. andMachine Intell., vol. 9, pp. 726–741, 1987.
[3] S. Sarkar and K. Bowyer, “Optimal infinite impulse response
zero-crossing based edge detection,” Comp. Vis., Graph. ImageProc., vol. 2, no. 54, pp. 224–243, 1991.
[4] C. A. Rothwell, J. L. Mundy, W. Hoffman, and V. D. Nguyen,“Driving vision by topology,” in Int. Symposium on ComputerVision, 1995, pp. 395–400, Coral Gables, Fla.
[5] L. Iverson and S. W. Zucker, “Logical/linear operators for imagecurves,” IEEE Trans. Pattern Anal. and Machine Intell., vol.17, no. 10, pp. 982–996, 1995.
[6] S. M. Smith and J. M. Brady, “SUSAN - a new approach to lowlevel image processing,” Int. J. Comp. Vis., vol. 23, no. 1, pp.45–78, 1997.
[7] M. Tabb and N. Ahuja, “Multiscale image segmentation byintegrated edge and region detection,” IEEE Trans. Image Pro-cessing, vol. 6, no. 5, pp. 642–655, 1997.
[8] J. C. Bezdek, Chandrasekhar R, and Y. Attikiouzel, “A geomet-ric approach to edge detection,” IEEE Trans. Fuzzy Syst., vol.6, no. 1, pp. 52–75, 1998.
[9] M. J. Black, G. Sapiro, and D. Marimont D. Heeger, “Robustanisotropic diffusion,” IEEE Trans. Image Processing, vol. 7,no. 3, pp. 421–432, 1998.
[10] S. Ando, “Image field categorization and edge/corner detectionfrom gradient covariance,” IEEE Trans. Pattern Anal. and Ma-chine Intell., vol. 22, no. 2, pp. 179–190, 2000.
[11] P. Meer and B. Georgescu, “Edge detection with embeddedconfidence,” IEEE Trans. Pattern Anal. and Machine Intell.,vol. 23, no. 12, pp. 1351–1365, 2001.
[12] K. Bowyer, C. Kranenburg, and A. Dougherty, “Edge detectorevaluation using empirical ROC curves,” Comp. Vis. ImageUnderstanding, vol. 84, pp. 77–103, 2001.
[13] D. H. Hubel and T. N. Wiesel, “Receptive fields, binocular in-teraction, and functional architecture in the cat’s visual cortex,”J. Physiol. (London), vol. 160, pp. 106–154, 1962.
[14] D. H. Hubel and T. N. Wiesel, “Sequence regularity and geom-etry of orientation columns in the monkey striate cortex,” J.Comput. Neurol., vol. 158, pp. 267–293, 1974.
[15] D. G. Albrecht, R. L. De Valois, and L. G. Thorell, “Visualcortical neurons: Are bars or gratings the optimal stimuli?,”Science, vol. 207, pp. 88–90, 1980.
[16] R. L. De Valois, D. G. Albrecht, and L. G. Thorell, “Corticalcells: bar and edge detectors, or spatial frequency filters,” inFrontiers of Visual Science, S. J. Cool and E. L. Smith III, Eds.Springer Verlag, New York, 1978.
[17] K. K. De Valois, R. L. De Valois, and E. W. Yund, “Responsesof striate cortical cells to grating and checkerboard patterns,” J.Physiol. (London), vol. 291, pp. 483–505, 1979.
[18] I. D. G. Macleod and A. Rosenfeld, “The visibility of gratings:spatial frequency channels or bar-detecting units?,” Vis. Res.,vol. 14, pp. 909–915, 1974.
[19] C. W. Tyler, “Selectivity for spatial frequency and bar width incat visual cortex,” Vis. Res., vol. 18, pp. 121–122, 1978.
[20] R. von der Heydt, “Approaches to visual cortical function,” Rev.Physiol., Biochem., and Pharmacol., vol. 108, pp. 69–150, 1987.
[21] D. H. Hubel, “Explorations of the primary visual cortex, 1955-1978,” Nature, vol. 299, pp. 515–524, 1982, (1981 Nobel Prizelecture).
[22] B. W. Andrews and D. A. Pollen, “Relationship between spatialfrequency selectivity and receptive field profile of simple cells,”J. Physiol. (London), vol. 287, pp. 163–176, 1979.
[23] V. D. Glezer, T. A. Tscherbach, V. E. Gauselman, and V. M.Bondarko, “Linear and non-linear properties of simple and com-plex receptive fields in area 17 of the cat visual cortex,” Biol.Cybern., vol. 37, pp. 195–208, 1980.
[24] J. J. Kulikowski and P. O. Bishop, “Fourier analysis and spatialrepresentation in the visual cortex,” Experientia, vol. 37, pp.160–163, 1981.
[25] L. Maffei, C. Morrone, M. Pirchio, and G. Sandini, “Responsesof visual cortical cells to periodic and non-periodic stimuli,” J.Physiol. (London), vol. 296, pp. 27–47, 1979.
[26] J. A. Movshon, I. D. Thompson, and D. J. Tolhurst, “Spatialsummation in the receptive fields of simple cells in the cat’sstriate cortex,” J. Physiol. (London), vol. 283, pp. 53–77, 1978.
[27] J. A. Movshon, I. D. Thompson, and D. J. Tolhurst, “Receptivefield organisation of complex cells in the cat’s striate cortex,” J.Physiol. (London), vol. 283, pp. 79–99, 1978.
[28] H. Spitzer and S. Hochstein, “A complex cell receptive fieldmodel,” J. Neurophysiol., vol. 53, pp. 1266–1286, 1985.
[29] M. C. Morrone and D. C. Burr, “Feature detection in human
10 IEEE TRANSACTIONS ON IMAGE PROCESSING, VOL. XX, NO. Y, MONTH 2002
vision: A phase-dependent energy model,” Proc. R. Soc. Lond.B, vol. 235, pp. 221–245, 1988.
[30] R. Shapley, T. Caelli, M. Morgan, and I. Rentschler, “Computa-tional theories of visual perception,” in Visual Perception: TheNeurophysiological Foundations, L. Spillmann and J. S. Werner,Eds., pp. 417–448. Academic Press, New York, 1990.
[31] R. G. Szulborski and L. A. Palmer, “The two-dimensional spatialstructure of non-linear subunits in the receptive fields of complexcells,” Vis. Res., vol. 30, pp. 249–254, 1990.
[32] E. H. Adelson and J. R. Bergen, “Spatio-temporal energy modelsfor the perception of motion,” J. Opt. Soc. Am. A, vol. 2, pp.284–299, 1985.
[33] J. G. Daugman, “Uncertainty relations for resolution in space,spatial frequency, and orientation optimized by two-dimensionalvisual cortical filters,” J. Opt. Soc. Am. A, vol. 2, pp. 1160–1169,1985.
[34] J. P. Jones and L. A. Palmer, “An evaluation of the two-dimensional Gabor filter model of simple receptive fields in catstriate cortex,” J. Neurophysiol., vol. 58, pp. 1233–1258, 1987.
[35] J. G. Daugman, “Complete discrete 2-D Gabor transforms byneural networks for image analysis and compression,” IEEETrans. Acoust., Speech, and Signal Processing, vol. 36, no. 7,pp. 1169–1179, 1988.
[36] D. J. Heeger, “Model for extraction of image flow,” J. Opt. Soc.Am. A, vol. 4, pp. 1455–1471, 1987.
[37] G. Cristobal and R. Navarro, “Space and frequency variantimage enhancement based on Gabor representation,” PatternRecognit. Lett., vol. 15, pp. 273–277, 1994.
[38] B. S. Manjunath, C. Shekhar, and R. Chellappa, “A new ap-proach to image feature detection with applications,” PatternRecognit., vol. 29, no. 4, pp. 627–640, 1996.
[39] J. G. Daugman, “High confidence visual recognition of personsby a test of statistical independence,” IEEE Trans. PatternAnal. and Machine Intell., vol. 15, no. 11, pp. 1148–1161, 1993.
[40] M. R. Turner, “Texture discrimination by Gabor functions,”Biol. Cybern., vol. 55, pp. 71–82, 1986.
[41] I. Fogel and D. Sagi, “Gabor filters as texture discriminator,”Biol. Cybern., vol. 61, pp. 103–113, 1989.
[42] J. R. Bergen and M. S. Landy, “Computational modelling ofvisual texture segregation,” in Computational models of visualprocessing, M. S. Landy and J. A. Movshon, Eds., pp. 253–271.MIT Press, Cambridge, Mass., 1991.
[43] A. C. Bovik, “Analysis of multichannel narrowband filters forimage texture segmentation,” IEEE Trans. Signal Processing,vol. 39, no. 9, pp. 2025–2043, 1991.
[44] A. K. Jain and F. Farrokhnia, “Unsupervised texture segmenta-tion using Gabor filters,” Pattern Recognit., vol. 24, no. 12, pp.1167–1186, 1991.
[45] T. N. Tan, “Texture edge detection by modelling visual corticalchannels,” Pattern Recognit., vol. 28, no. 9, pp. 1283–1298, 1995.
[46] W. Y. Ma, NETRA: A Toolbox for Navigating Large ImageDatabases, Ph.D. thesis, University of California, Santa Barbara,1997.
[47] B. S. Manjunath and W. Y. Ma, “Texture features for browsingand retrieval of image data,” IEEE Trans. Pattern Anal. andMachine Intell., vol. 18, no. 8, pp. 837–842, 1996.
[48] B. S. Manjunath, P. Wu, S. Newsam, and H. D. Shin, “A texturedescriptor for browsing and similarity retrieval,” Sign. Proc.:Image Communication, vol. 16, no. 1–2, pp. 33–43, 2000.
[49] M. C. Morrone and R. A. Owens, “Feature detection from localenergy,” Pattern Recognit. Lett., vol. 6, pp. 303–313, 1987.
[50] F. Heitger, “Feature detection using suppression and enhance-ment,” Tech. Rep. TR-163, Communication Technology Labo-ratory, Swiss Federal Institute of Technology, 1995.
[51] L. Rosenthaler, F. Heitger, O. Kubler, and R. von der Heydt,“Detection of general edges and keypoints,” in Proc. Eur. Conf.Computer Vision (ECCV’92), G. Sandini, Ed. 1992, pp. 78–86,Springer Verlag.
[52] R. Mehrotra, K. R. Namuduri, and N. Ranganathan, “Gaborfilter-based edge detection,” Pattern Recognit., vol. 25, no. 12,pp. 1479–1494, 1992.
[53] P. Kovesi, “Image features from phase congruency,” Videre: J.Comp. Vis. Res., vol. 1, no. 3, pp. 2–27, 1999.
[54] D. H. Hubel and T. N. Wiesel, “Receptive fields and functionalarchitecture of monkey striate cortex,” J. Physiol. (London),vol. 195, pp. 215–243, 1968.
[55] E. Peterhans and R. von der Heydt, “The role of end-stopped re-ceptive fields in contour perception,” in New Frontiers in Brain
Research, Proc. 15th Goettingen Neurobiology Conf., N. Elsnerand O. Creutzfeld, Eds., 1987, p. 29.
[56] A. Dobbins, S. W. Zucker, and M. S. Cynader, “Endstoppedneurons in the visual cortex as a substrate for calculating cur-vature,” Nature, vol. 329, pp. 438–441, 1987.
[57] D. H. Hubel and T. N. Wiesel, “Receptive fields and functionalarchitecture in two non-striate visual areas (18 and 19) of thecat,” J. Physiol. (London), vol. 28, pp. 229–289, 1965.
[58] M. Versavel, G. A. Orban, and L. Lagae, “Responses of visualcortical neurons to curved stimuli and chevrons,” Vis. Res., vol.30, pp. 235–248, 1990.
[59] E. Peterhans and R. von der Heydt, “Elements of form per-ception in monkey prestriate cortex,” in Representations ofVision. Trends and Tacit Assumptions, A. Gorea, Y. Fregnac,Z. Kapoulis, and J. Findlay, Eds., pp. 111–124. Cambridge Univ.Press, Cambridge, 1991.
[60] R. Baumann, R. van der Zwan, and E. Peterhans, “Figure-ground segregation at contours,” Eur. J. Neurosci., vol. 9, pp.1290–1303, 1997.
[61] B. Heider, V. Meskenaite, and E. Peterhans, “Anatomy andphysiology of a neural mechanism defining depth order and con-trast polarity at illusory contours,” Eur. J. Neurosci., vol. 12,pp. 4117–4130, 2000.
[62] E. Peterhans and F. Heitger, “Simulation of neural responsesdefining depth order and contrast polarity at illusory contoursin monkey area V2,” J. Comput. Neurosci., vol. 10, no. 2, pp.195–211, 2001.
[63] R. von der Heydt, E. Peterhans, and M. R. Dursteler, “Gratingcells in monkey visual cortex: Coding texture,” in Channelsin the Visual Nervous System: Neurophysiology, Psychophysicsand Models, B. Blum, Ed., pp. 53–73. Freund Publ. House Ltd.,London, 1991.
[64] R. von der Heydt, E. Peterhans, and M. R. Dursteler, “Periodic-pattern-selective cells in monkey visual cortex,” J. Neurosci.,vol. 12, pp. 1416–1434, 1992.
[65] G. Rizzolatti and R. Camarda, “Inhibition of visual responsesof single units in the cat visual area of the lateral suprasylviangyrus (Clare-Bishop area) by the introduction of a second visualstimulus,” Brain Res., vol. 88, no. 2, pp. 357–361, 1975.
[66] J. I. Nelson and B. J. Frost, “Orientation-selective inhibitionfrom beyond the classic visual receptive field,” Brain Res., vol.139, pp. 359–365, 1978.
[67] J. J. Knierim and D. C. van Essen, “Neuronal responses to statictexture patterns in area V1 of the alert macaque monkey,” J.Neurophysiol., vol. 67, pp. 961–980, 1992.
[68] H. E. Jones, K. L. Grieve, W. Wang, and A. M. Sillito, “Sur-round suppression in primate V1,” J. Neurophysiol., vol. 86, no.10, pp. 2011–2028, 2001.
[69] C. Blakemore and E. A. Tobin, “Lateral inhibition betweenorientation detectors in the cat’s visual cortex,” Exp. BrainRes., vol. 15, pp. 439–440, 1972.
[70] E. De Yoe, J. Knierim, D. Sagi, B. Juilesz, and D. van Essen,“Single unit responses to static and dynamic texture patterns inmacaque V2 and V1 cortex (abstract),” Invest. Ophtalmol. Vis.Sci., vol. 27, no. Suppl., pp. 18, 1986.
[71] W. Fries, K. Albus, and O. D. Creutzfeld, “Effects of interactingvisual patterns on single cell responses in cat’s striate cortex,”Vis. Res., vol. 17, pp. 1001–1008, 1977.
[72] A. Grinvald, D. Ts’o, R. D. Frostig, E. Lieke, A. Arieli, andR. Hildesheim, “Optical imaging of neuronal activity in the vi-sual cortex,” in Neural Mechanisms of Visual Perception, D. M.-K. Lam and C. Gilbert, Eds., pp. 117–136. Portfolio, Woodlands,Texas, USA, 1989.
[73] L. Maffei and A. Fiorentini, “The unresponsive regions of visualcortical receptive fields,” Vis. Res., vol. 16, pp. 1131–1139, 1976.
[74] J. R. Cavanaugh, W. Bair, and J. A. Movshon, “Orientation-selective setting of contrast gain by the surrounds of macaquestriate cortex neurons,” Neurosci. Abstracts, vol. 23, pp. 227.2,1997.
[75] P. H. Schiller, B. L. Finlay, and S. F. Volman, “Quantitativestudies of single-cell properties in monkey striate cortex. III.Spatial frequencies,” J. Neurophysiol., vol. 39, pp. 1334–1351,1976.
[76] N. Petkov and P. Kruizinga, “Computational models of visualneurons specialised in the detection of periodic and aperiodicoriented visual stimuli: bar and grating cells,” Biol. Cybern.,vol. 76, no. 2, pp. 83–96, 1997.
GRIGORESCU, PETKOV, & WESTENBERG: CONTOUR DETECTION BASED ON NON-CLASSICAL RECEPTIVE FIELD INHIBITION 11
[77] C. Blakemore, R. H. S. Carpenter, and M. A. Georgeson, “Lat-eral inhibition between orientation detectors in the human visualsystem,” Nature, vol. 228, pp. 37–39, 1970.
[78] J. A. Solomon and D. G. Pelli, “The visual filter mediating letteridentification,” Nature, vol. 369, pp. 395–397, 1994.
[79] N. Petkov and M. A. Westenberg, “Suppression of contour per-ception by band-limited noise and its relation to non-classicalreceptive field inhibition,” Biol. Cybern., in press.
[80] A. Galli and A. Zama, “Untersuchungen uber die Wahrnehmungebener geometrischer Figuren, die ganz oder teilweise von an-deren geometrischen Figuren verdeckt sind,” Zeitschrift fur Psy-chologie, vol. 123, pp. 308–348, 1931.
[81] S. Belongie, J. Malik, and J. Puzicha, “Shape matching andobject recognition using shape contexts,” IEEE Trans. PatternAnal. and Machine Intell., vol. 24, no. 4, pp. 509–522, 2002.
[82] C. Grigorescu and N. Petkov, “Distance sets for shape filtersand shape recognition,” Tech. Rep. IWI-2002-9-02, Institute ofMathematics and Computing Science, University of Groningen,2002.
[83] J. G. Daugman, “Uncertainty relation for resolution in space,spatial frequency, and orientation optimized by two-dimensionalvisual cortical filters,” J. Opt. Soc. Am. A, vol. 2, no. 7, pp.1160–1169, July 1985.
[84] N. Petkov and P. Kruizinga, “Computational models of visualneurons specialised in the detection of periodic and aperiodicoriented visual stimuli: bar and grating cells,” Biol. Cybern.,vol. 76, pp. 83–96, 1997.
[85] S. E. Grigorescu, N. Petkov, and P. Kruizinga, “Comparison oftexture features based on Gabor filters,” IEEE Trans. ImageProcessing, vol. 11, no. 10, pp. 1160–1167, 2002.
[86] H. C. Nothdurft, J. L. Gallant, and D. C. van Essen, “Responsemodulation by texture surround in primate area V1: Correlatesof ”popout” under anesthesia,” Vis. Neurosci., vol. 16, pp. 15–34, 1999.
[87] M. Sonka, V. Hlavac, and R. Boyle, Image Processing, Analysis,and Machine Vision, Brooks/Cole Publishing Company, PacificGrove, CA, USA, 1999.
[88] M. Heath, S. Sarkar, T. Sanocki, and K. Bowyer, “A robustvisual method for assessing the relative performance of edge-detection algorithms,” IEEE Trans. Pattern Anal. and MachineIntell., vol. 19, no. 12, pp. 1338–1359, 1997.
[89] Y. T. Zhou, V. Venkateshwar, and R. Chellappa, “Edge de-tection and linear feature extraction using a 2D random fieldmodel,” IEEE Trans. Pattern Anal. and Machine Intell., vol.11, pp. 84–95, 1989.
[90] L. Kitchen and A. Rosenfeld, “Edge evaluation using local edgecoherence,” IEEE Trans. Syst., Man, and Cybern., vol. 11, no.9, pp. 597–605, 1981.
[91] M. Shin, D. Goldgof, and K. W. Bowyer, “An objective compari-son methodology of edge detection algorithms for structure frommotion task,” in Empirical Evaluation Techniques in ComputerVision, pp. 235–254. IEEE CS Press, 1998.
[92] M. C. Shin, K. W. Bowyer, and D. B. Goldgof, “Comparisonof edge detectors using an object recognition task,” Comp. Vis.Pattern Recognit., pp. 360–365, 1999.
[93] Y. J. Zhang, “A survey on evaluation methods for image seg-mentation,” Pattern Recognit., vol. 29, no. 8, pp. 1335–1346,1996.
[94] E. P. Simoncelli and O. Schwartz, “Modeling surround sup-pression in V1 neurons with a statistically-derived normalizationmodel,” in Advances in Neural Information Processing Systems11, M. S. Kearns, S. A. Solla, and D. A. Cohn, Eds., Cambridge,MA, 1999, pp. 153–159, MIT Press.
[95] N. Petkov, P. Kruizinga, and T. Lourens, “Lateral inhibition incortical filters,” in Proc. Int. Conf. on Digital Signal Processing,Nicosia, Cyprus, July 14–16 1993, pp. 122–129.
[96] N. Petkov, P. Kruizinga, and T. Lourens, “Orientation compe-tition in cortical filters – an application to face recognition,” inComputing Science in The Netherlands 1993, Amsterdam, 1993,pp. 285–296, Stichting Mathematisch Centrum.
[97] N. Petkov and T. Lourens, “Interacting cortical filters for objectrecognition,” in Proc. of the Asian Conference on ComputerVision, Osaka, Japan, Nov. 23–25 1993, pp. 583–586.
[98] N. Petkov and P. Kruizinga, “Perception of form and texturethrough complementary bar and grating cell channels,” Percep-tion, vol. 29, no. suppl., pp. 60c, 2000.
Cosmin Grigorescu received the Dipl.Eng.degree in 1995 and M.S. degree in 1996 incomputer science from Politehnica Universityof Bucharest, Romania. From 1996 to 1998,he did teaching and research at the Controland Computer Faculty of the same university.Since 1998, he has been pursuing a Ph.D. de-gree in the Department of Computing Science,University of Groningen, The Netherlands. Hisareas of research are image processing, com-puter vision and pattern recognition, with em-
phasis on models inspired from human vision.
Nicolai Petkov is Scientific Director of theInstitute of Mathematics and Computing Sci-ence, University of Groningen, The Nether-lands, where he holds the chair of ParallelComputing and Intelligent Systems. He is au-thor of two books and 60 scientific publications.His current research interests are in the areaof computer simulations of the visual system,making links between computer vision, neuro-physiology, psychophysics, and arts.
Michel A. Westenberg received the M.Sc.degree in computing science from the Univer-sity of Groningen, the Netherlands, in 1996. In2001, he received the Ph.D. degree in mathe-matics and natural sciences from the same uni-versity. His current research interests are in thearea of computer vision and scientific visualiza-tion.
Related Documents