1 IECM Comparisons of PC, IECM Comparisons of PC, NGCC and IGCC Plants: NGCC and IGCC Plants: Current Technology and the Potential for Current Technology and the Potential for Cost Reductions Through Cost Reductions Through “ Learning Learning” Edward S. Rubin, Anand B. Rao and Chao Chen Department of Engineering and Public Policy Carnegie Mellon University Pittsburgh, Pennsylvania 6 th International CO2 Capture Network Trondheim, Norway March 8, 2004 Carnegie Mellon Factors Affecting Reported Costs Factors Affecting Reported Costs of CO of CO 2 Capture & Storage (CCS) Capture & Storage (CCS) • Choice of CCS Technology • Process Design and Operating Variables • Economic and Financial Parameters • Choice of System Boundaries; e.g., Power plant only vs. partial or complete life cycle One facility vs. multi-plant system (regional, national or global) GHG gases considered (CO 2 only vs. all GHGs) • Time Frame of Interest Current technology vs. future (improved) systems Consideration of technological “learning”

Welcome message from author
This document is posted to help you gain knowledge. Please leave a comment to let me know what you think about it! Share it to your friends and learn new things together.
Transcript

1
IECM Comparisons of PC, IECM Comparisons of PC, NGCC and IGCC Plants:NGCC and IGCC Plants:
Current Technology and the Potential for Current Technology and the Potential for Cost Reductions Through Cost Reductions Through ““LearningLearning””
Edward S. Rubin, Anand B. Rao and Chao ChenDepartment of Engineering and Public Policy
Carnegie Mellon UniversityPittsburgh, Pennsylvania
6th International CO2 Capture Network Trondheim, Norway
March 8, 2004
Carnegie Mellon
Factors Affecting Reported Costs Factors Affecting Reported Costs of COof CO22 Capture & Storage (CCS)Capture & Storage (CCS)
• Choice of CCS Technology• Process Design and Operating Variables• Economic and Financial Parameters• Choice of System Boundaries; e.g.,
Power plant only vs. partial or complete life cycleOne facility vs. multi-plant system (regional, national or global)GHG gases considered (CO2 only vs. all GHGs)
• Time Frame of InterestCurrent technology vs. future (improved) systemsConsideration of technological “learning”

2
Carnegie Mellon
Different Measures of CostDifferent Measures of CostEmbodying Key AssumptionsEmbodying Key Assumptions
(COE)ccs – (COE)ref
(CO2/kWh)emitted, ref – (CO2/kWh)emitted, ccs
• Cost of CO2 Avoided ($/ton CO2)
=
• Cost of Electricity ($/MWh)(TCR)(FCF) + FOM
(CF)(8760)(MW) + VOM + (HR)(FC)=
(COE)ccs – (COE)ref
(CO2/kWh)captured, ccs
• Cost of CO2 Captured ($/ton CO2)
=
Carnegie Mellon
Project ObjectivesProject Objectives
• Develop a modeling framework to systematically evaluate the performance and cost of alternative CCS options at the level of an individual plant
• Provide flexibility and transparency of assumptions• Incorporate both current and advanced technologies
for power generation and CO2 capture• Integrate carbon management technologies with
other environmental control systems • Characterize key uncertainties in performance and
cost (of components and the overall system)

3
Carnegie Mellon
Modeling ApproachModeling Approach
• Systems Analysis Approach• Process Technology Models• Engineering Economic Models• Advanced Software Capabilities
Probabilistic analysis capabilityUser-friendly graphical interfaceEasy to add or update models
Carnegie Mellon
Schematic of COSchematic of CO22 Capture Capture and Storage System and Storage System
Energy Conversion
Process
Air orOxygen
Coal orNatural Gas
UsefulProducts
(Electricity, Fuels,Chemicals, Hydrogen)
CO2
- EOR- ECBM- Aquifers- Ocean
CO2Capture
CO2Transport
CO2 Storage (Sequestration)
- Pipeline

4
Carnegie Mellon
MultiMulti--Pollutant Interactions Pollutant Interactions Also are Explicitly ModeledAlso are Explicitly Modeled
CriteriaAir
Pollutants
PMSO2
NOx
HazardousAir
Pollutants
HgHClH2SO4
CO2
CH4
GreenhouseGas
Emissions
Carnegie Mellon
IECMIECM--CS Software PackageCS Software Package
PowerPowerPlantPlant
ModelsModels
GraphicalGraphicalUserUser
InterfaceInterface
Plant andPlant andFuelFuel
DatabasesDatabases
Fuel PropertiesFuel PropertiesHeating ValueHeating ValueCompositionCompositionDelivered CostDelivered Cost
Plant DesignPlant DesignConversion ProcessConversion ProcessEmission ControlsEmission ControlsSolid Waste MgmtSolid Waste MgmtChemical InputsChemical Inputs
Cost DataCost DataO&M CostsO&M CostsCapital CostsCapital CostsFinancial FactorsFinancial Factors
Plant & ProcessPlant & ProcessPerformancePerformance
-- EfficiencyEfficiency-- Resource useResource use
EnvironmentalEnvironmentalEmissionsEmissions
-- Air, water, landAir, water, land
Plant & ProcessPlant & ProcessCosts Costs -- CapitalCapital
-- O&MO&M-- COECOE

5
Carnegie Mellon
Recent DevelopmentsRecent Developments• Expand model to include current combustion-based
and gasification-based power systems:Pulverized coal combustion (PC)Natural gas combined cycle combustion (NGCC)Integrated gasification combined cycles (IGCC)
• Incorporate CCS options based on current commercial technologies:
Amine (MEA) scrubbing for combustion systemsWater-gas shift + Selexol for gasification systemsPipeline transport + geologic storage options
• Assess options, payoffs and R&D priorities for new or improved CO2 capture technologies:
Case study of advanced amine-based systems
A Quick Tour A Quick Tour of the Modelof the Model
(IECM(IECM--CS 4.0.1)CS 4.0.1)
Carnegie Mellon

6
Select Plant Type
Carnegie Mellon
PC Plant with COPC Plant with CO22 CaptureCapture
Carnegie Mellon

7
NGCC Plant with CONGCC Plant with CO22 CaptureCapture
Carnegie Mellon
IGCC Plant with COIGCC Plant with CO22 CaptureCapture
Carnegie Mellon

8
Set Overall Plant Parameters
Carnegie Mellon
Set Financial Parameters
Carnegie Mellon

9
Specify Fuel Properties
Carnegie Mellon
Specify Gasifier Parameters
Carnegie Mellon

10
Set Raw Syngas Composition
Carnegie Mellon
Set Power Block Performance Parameters
Carnegie Mellon
11
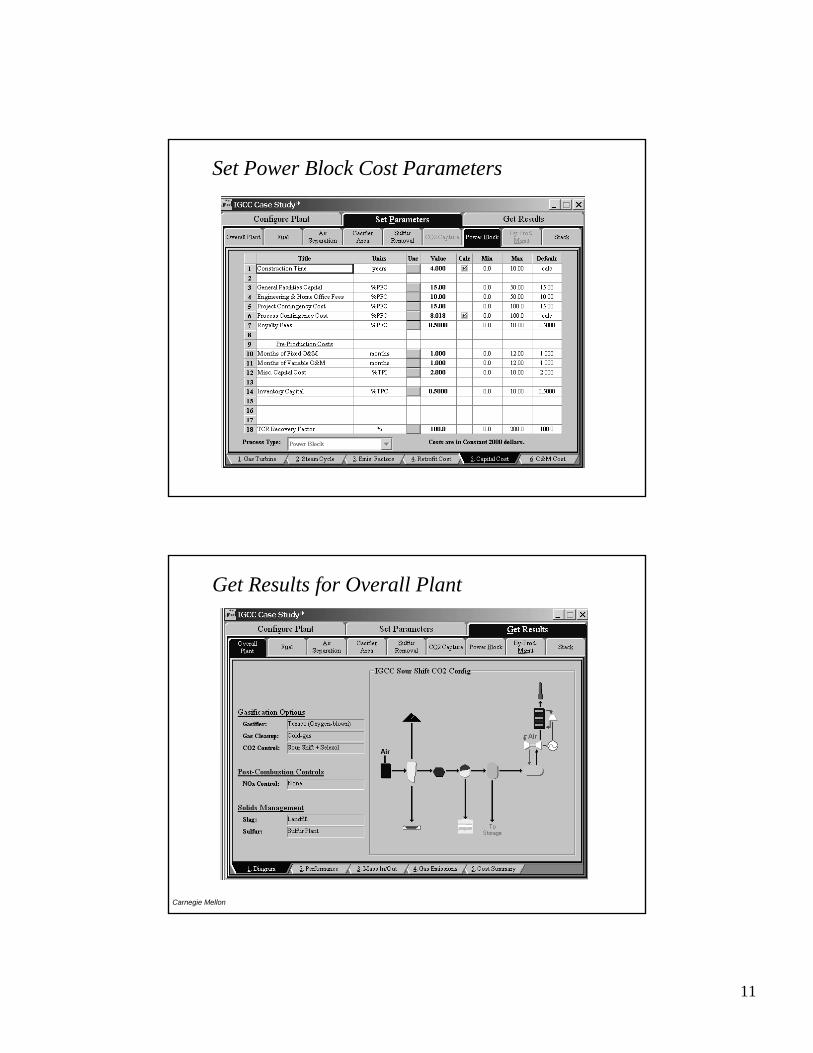
Set Power Block Cost Parameters
Get Results for Overall Plant
Carnegie Mellon

12
Get Results for Plant Mass Balance
Carnegie Mellon
Get Results for Specific Components
Carnegie Mellon

13
Illustrative Case StudiesIllustrative Case Studies
Carnegie Mellon
Carnegie Mellon
Case Study AssumptionsCase Study Assumptions
13.813.813.8Pipeline Pressure (MPa)
Texaco quench2 x 7FASupercriticalReference PlantReference Plant2%S BitNat. Gas2%S BitFuel Type
AquiferAquiferAquiferGeologic Storage Option
909090CO2 Removal (%)WGS+SelexolMEAMEACO2 Capture System
CCS PlantCCS Plant1.203.911.20Fuel Cost, HHV ($/GJ)757575Capacity Factor (%)
37.051.339.4Net HHV Efficiency (%)
IGCCNGCCPCParameter

14
Carnegie Mellon
Net Plant Output (MW)Net Plant Output (MW)
0
100
200
300
400
500
600
PC NGCC IGCC
Ref. Plant with CCS
(biggerplant)
(25%derate)
Carnegie Mellon
COCO22 Emission Rate (kg/Emission Rate (kg/MWhMWh))
809
364
827
10743
95
0
100
200
300
400
500
600
700
800
900
PC NGCC IGCC
Ref. Plant with CCS

15
Carnegie Mellon
Cost of Electricity ($/MWh)Cost of Electricity ($/MWh)
47
0
10
20
30
40
50
60
70
80
90
PC NGCC IGCC
4249
84
61
74
Ref. Plant +capture + transport & storage
Carnegie Mellon
Cost of COCost of CO22 Avoided ($/Avoided ($/tonnetonne COCO22))
0
10
20
30
40
50
60
70
PC NGCC IGCC
52
34
59
capture transport + storage

16
Carnegie Mellon
ReminderReminder:: Different Assumptions Different Assumptions May Give Different ResultsMay Give Different Results
Cum
ulat
ive
Prob
abili
ty
CO2 Mitigation Cost ($/tonne CO2 avoided)
1.00.90.80.70.60.50.40.30.20.10.0
0 10 20 30 40 50 60 70 80 90 100
DETERMINISTIC
Uncertainty or Variability in:- CO2 capture efficiency- steam-electric penalty- compressor efficiency- lean sorbent loading- process facilities cost- CO2 storage cost- variable operating costs- gross plant heat rate- plant capacity factor- fixed charge factor
Cost Variationsfor Amine-Based
Coal Plant
Potential Cost ReductionsPotential Cost Reductionsfrom Technology Innovationfrom Technology Innovation
Carnegie Mellon

17
Carnegie Mellon
Two Approaches to Estimating Two Approaches to Estimating Future Technology CostsFuture Technology Costs
• “Top-Down” ApproachUse of learning curves (experience curves) to estimate cost reductions as a function of cumulative production or output
• “Bottom-Up” ApproachUse of engineering-economic models of a technology to examine implications of specific process improvements
Carnegie Mellon
Learning Curves for FGD SystemsLearning Curves for FGD Systems(Normalized costs based on 90% SO(Normalized costs based on 90% SO22 removal, 500 MW plant, 3.5%S coal)removal, 500 MW plant, 3.5%S coal)
10%
100%
1 10 100 1000Cumulative World Capacity of Wet FGD Systems (GWe)
FGD
Cap
ital C
ost
(% o
f bas
e va
lue) y = 1.45x -0.168
R 2 = 0.79
19761980
19821990
1995
Cost reduction = 11%per doubling of
installed capacity
10%
100%
1 10 100 1000Cumulative World Capacity of Wet FGD Systems (GWe)
FGD
Cap
ital C
ost
(% o
f bas
e va
lue) y = 1.45x -0.168
R 2 = 0.79
19761980
19821990
1995
Cost reduction = 11%per doubling of
installed capacity
10%
100%
1 10 100 1000Worldwide Capacity of Wet FGD Systems (GWe)
Nor
mal
ized
FG
D O
&M
Cos
ts
Y = 3.88x-0.36
R2 = 0.99Projected cost reduction = 22%per doubling of
installed capacity
10%
100%
1 10 100 1000Worldwide Capacity of Wet FGD Systems (GWe)
Nor
mal
ized
FG
D O
&M
Cos
ts
Y = 3.88x-0.36
R2 = 0.99Projected cost reduction = 22%per doubling of
installed capacity
O&MO&MCostsCosts
CapitalCapitalCostCost

18
Carnegie Mellon
Learning Curves for SCR SystemsLearning Curves for SCR Systems(Normalized costs based on 80% NOx removal, 500 MW plant, medium(Normalized costs based on 80% NOx removal, 500 MW plant, medium S coal, 65% CF)S coal, 65% CF)
O&MO&MCostsCosts
CapitalCapitalCostCost
10%
100%
1 10 100Cumulative World Capacity of SCR at Coal-Fired Plants (GWe)
SCR
Cap
ital c
ost (
% o
f bas
e va
lue)
y = 1.28x-0.18
R2 = 0.75
1983 1989
1996
19951993
Cost reduction = 12%per doubling of
installed capacity
10%
100%
1 10 100Cumulative World Capacity of SCR at Coal-Fired Plants (GWe)
SCR
Cap
ital c
ost (
% o
f bas
e va
lue)
y = 1.28x-0.18
R2 = 0.75
1983 1989
1996
19951993
Cost reduction = 12%per doubling of
installed capacity
1%
10%
100%
1 10 100Worldwide SCR Capacity at Coal-Fired Plants (GWe)
Nor
mal
ized
SC
R O
&M
Cos
t
Y = 1.87x -0.48
R2 = 0.67 Projected cost reduction = 28%per doubling of
installed capacity
1%
10%
100%
1 10 100Worldwide SCR Capacity at Coal-Fired Plants (GWe)
Nor
mal
ized
SC
R O
&M
Cos
t
Y = 1.87x -0.48
R2 = 0.67 Projected cost reduction = 28%per doubling of
installed capacity
Carnegie Mellon
BottomBottom--Up Approach:Up Approach:
Performance Model for MEA SystemPerformance Model for MEA System
Flue Gas In: G, Tfg, yin
MEA makeup
Absorber
Captured CO2(99.8% pure)
Regenerated Solvent
CO2 CO2
Regenerator
L, Tsolv, C, φlean
η
φmax
Qreg
φlean
ηCO2 = f(L/G, C, yin, φlean, Tfg, Tsolv, H, D)
Flue Gas Out

19
Carnegie Mellon
0
1000
2000
3000
4000
5000
6000
7000
A B C D E F G H I JExpert
Sorb
ent R
egen
erat
ion
Hea
t (k
J/kg
CO
2)
Current (Best Guess)
Future (Best Guess)
““Best GuessBest Guess”” Expert Judgments Expert Judgments for Regeneration Heatfor Regeneration Heat ReqmReqm’’tt
Average improvement = 23%
Carnegie Mellon
Expected Process ImprovementsExpected Process ImprovementsRelative to Current BaselineRelative to Current Baseline
3%(48%)Sorbent Cost ($/ tonne sorbent)
76%49%Sorbent Loss (kg/ tonne CO2)
43%23%Regeneration Heat Reqm’t(kJ/ kgCO2)
81%28%Sorbent Concentration(wt%)
OptimisticValues
“Best Guess”Values
ParameterAverage Improvement Based on

20
Carnegie Mellon
81
CheaperBoiler
Potential COE Reductions ($/Potential COE Reductions ($/MWhMWh))for the PC Plant w/Amine Capturefor the PC Plant w/Amine Capture
0102030405060708090
10087 84
PlantDerate
SameOutput
71 69 68
FutureAmines
HeatIntegr.
AmineCapex
Reference Plant
Carnegie Mellon
Potential Cost Reductions: Potential Cost Reductions: Avoidance Cost ($/Avoidance Cost ($/tonnetonne COCO22))
0
10
20
30
40
50
60
70
57
31
52
29
34
49
PlantDerate
SameOutput
CheaperBoiler
FutureAmines
HeatIntegr.
AmineCapex

21
Carnegie Mellon
Estimated Cost Reductions for Estimated Cost Reductions for Improved Amine SystemsImproved Amine Systems
0
0.1
0.2
0.3
0.4
0.5
0.6
0.7
0.8
0.9
1
25 30 35 40 45 50 55 60$/tonne CO 2 avoided
Cum
. Pro
babi
lity
Based on experts' future projections
Based on experts' current estimates
M easure of R&D benefit
Distributions Based on4 Process Parameters
Carnegie Mellon
Work in ProgressWork in Progress• Incorporate performance and cost models of advanced
power systems and CO2 capture options:Oxyfuel combustionAdvanced IGCC designsITM oxygen production
• Expand cost and performance models of CO2transport and storage options
• Comparative analyses of CO2 capture options for new and existing plants
Advanced PC, NGCC and IGCC systemsRepowering or rebuild of existing units
• Assessments of R&D Benefits

22
Carnegie Mellon
The Model is Available At . . .The Model is Available At . . .
• CO2 Version (Beta Test):Contacts: [email protected]
• Web Access :www. iecm-online.com
• Technical Support:[email protected]
Related Documents


![*) E]* tes - IECM](https://static.cupdf.com/doc/110x72/62e76d42498a9f76ce0847bb/-e-tes-iecm.jpg)


