Ruts, Rolling and Tillage (ie Soil and Water Credit!) Jodi DeJong-Hughes Extension Educator Soils and Crops 507-337-2816 [email protected]

Welcome message from author
This document is posted to help you gain knowledge. Please leave a comment to let me know what you think about it! Share it to your friends and learn new things together.
Transcript

Ruts, Rolling and Tillage (ie Soil and Water Credit!)
Jodi DeJong-Hughes
Extension Educator Soils and Crops
507-337-2816

Choosing a Tillage System
• Cropping System
– Rotation, residue removal
• Erosion Potential
– Slope, soil type
• Long Term Productivity
• Others
– Risk and comfort
– Current equipment
– Learning curve
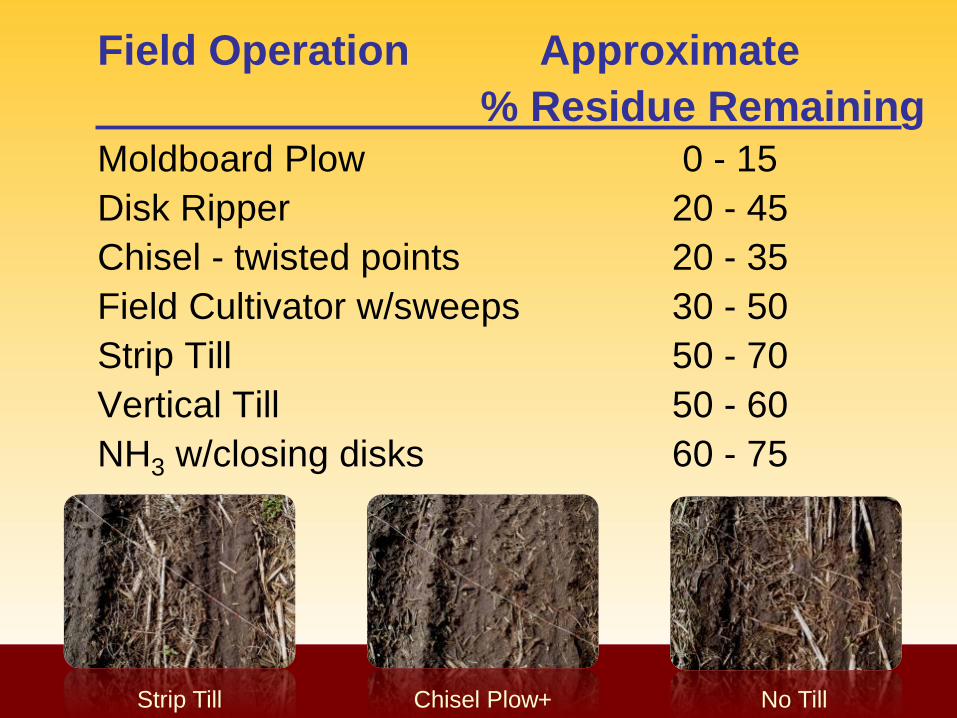
Field Operation Approximate
% Residue Remaining
Moldboard Plow 0 - 15
Disk Ripper 20 - 45
Chisel - twisted points 20 - 35
Field Cultivator w/sweeps 30 - 50
Strip Till 50 - 70
Vertical Till 50 - 60
NH3 w/closing disks 60 - 75
Strip Till No Till Chisel Plow+

Strip Tillage
• Loosens the soil in the row 7-10” wide while maintaining residue between the rows
• Builds organic matter and soil structure
• Less energy required and less erosion than conventional systems

Strip Till Management
• Tile drainage is beneficial
• Have a ST rep or experienced strip tiller on speed dial
• Planting directly on the berm is essential
• Soil will ‘mellow’ in 3-4 yrs, but increased water infiltration will be immediate
Committed Sales Rep

Holloway Soil Temps - May 08
40
50
60
70
80
90
23 24 25 26 27 28 29 30 31
Te
mp
eratu
re
(F
)
Date
ST- In Row Disk Rip
ST- Btwn Row MBP
DeJong-Hughes, Lamb, Stahl, Miller
Date Planted
30” row spacing
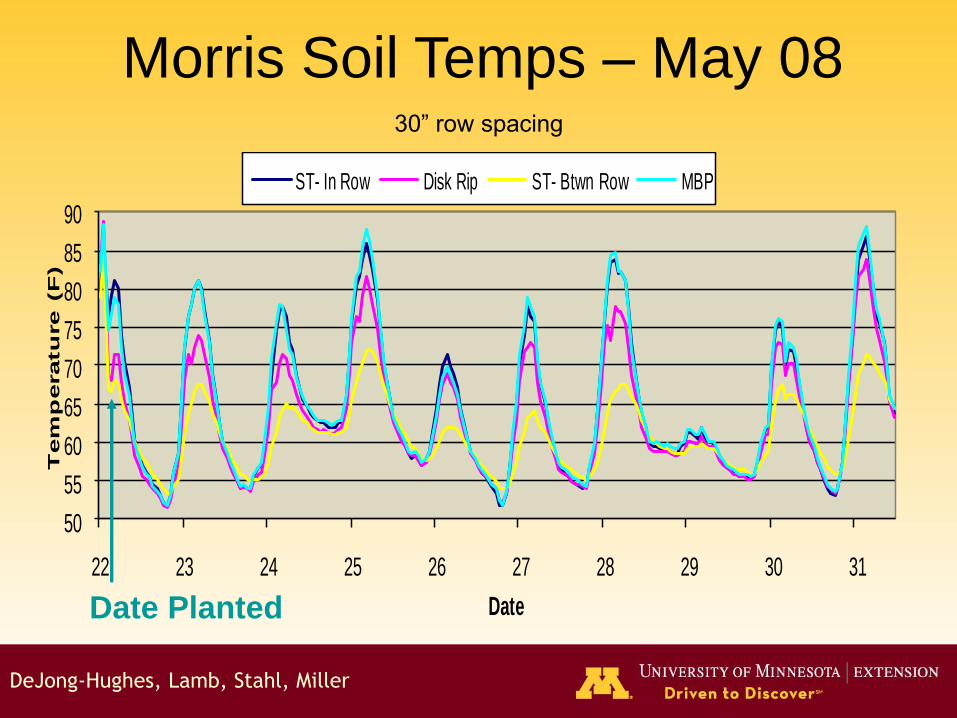
Morris Soil Temps – May 08
50
55
60
65
70
75
80
85
90
22 23 24 25 26 27 28 29 30 31
Tem
peratu
re (F
)
Date
ST- In Row Disk Rip ST- Btwn Row MBP
DeJong-Hughes, Lamb, Stahl, Miller
Date Planted
30” row spacing

2006-08 Soybean Data (Jeffers, MN)
2006 2007 2008 Residue %
Treatment ------------- bu/ac ------------ (average)
Chisel Plow 50.3 47.2 43.9 56%
No Till 47.8 46.8 41.6 73%
Strip Till 50.7 48.4 44.6 62%
LSD (0.05) NS 1.7 NS 4.4
All plots were rotated with ST corn.

2007 and 2009 Corn Data (Jeffers, MN)
Previous
Treatment
Yield (bu/ac) Residue
2007 2009 Average
ST - Corn
CP-SB 175.4 182.0 54%
ST- Corn
NT– SB 169.4 176.7 62%
ST- Corn
ST- SB 167.0 176.2 60%
LSD (0.05) NS NS
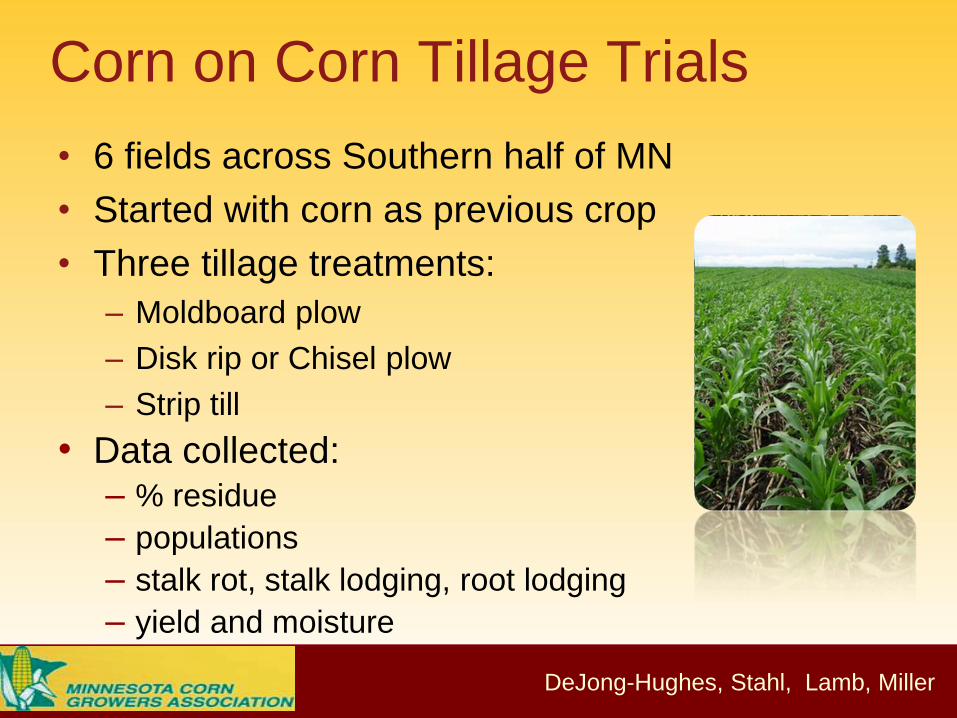
Corn on Corn Tillage Trials
• 6 fields across Southern half of MN
• Started with corn as previous crop
• Three tillage treatments:
– Moldboard plow
– Disk rip or Chisel plow
– Strip till
• Data collected: – % residue
– populations
– stalk rot, stalk lodging, root lodging
– yield and moisture
DeJong-Hughes, Stahl, Lamb, Miller

1st Year Corn Yields (bu/ac) 2008
100
120
140
160
180
200
220
ST
DR/CP
MBP
*Holloway had a 2nd light tillage pass in the spring
All are NS

2nd Year Corn Yields (bu/ac) 2009
100
120
140
160
180
200
220
ST
DR/CP
MBP
NS
NS

3rd Year Corn Yields (bu/ac) 2010
100
120
140
160
180
200
220
CPDR
MP
ST
NS
NS
*Morris and Heron Lake had secondary coulter pass

3rd Year Corn Yields (bu/ac) 2010
Tillage Cannon
City
Heron
Lake Morris Lamberton
CP/DR + FC 191.6 167.6 145.0 184.4
MP + FC 183.4 172.1 170.0 190.7
ST 197.2 147.3 150.7* 156.5*
LSD (.05) NS 3.5 NS 14.1
* Secondary spring coulter pass

What Happened in Morris?
Change in soils across the research plot

RTK and Yield with ST
Treatment
Corn Yield (bu/ac)
% from RTK
ST with RTK 221 ab ---
ST - visual 213 c - 4
ST - 7” off center 216 bc - 2.3
No Till 218 ab - 1.4
Chisel Plow 221 a ---
Tony Vyn, Indiana 2006

Strip Till C-C Soil Temps
In-row vs. Between-the-row
505560657075808590
22 23 24 25 26 27 28 29 30 31
ST- In Row ST- Btwn Row
DeJong-Hughes, Lamb, Stahl, Miller
30” row spacing
15 degrees

Strip Till Management
• Tile drainage - important
• RTK - important (esp. if equipment doesn’t line-up)
• Experienced help - important
• Look at all mgmt aspects – critical
– Fertility
– Weed management and shifts
– Equipment interactions
– Patience, flexibility, and a Plan B

Horizontal vs. Vertical Tillage
• Horizontal tillage
– Chisel
– Cultivator
– Strip tiller
– Ripper
• Vertical tillage
– Super coulter
– Disk

Vertical Tillage
• Shallow tillage 1-3”
• Drive 7-10 mph
• Incorporates a little
residue and sizes residue
• Usually 2 passes in wet
spring will get you in the
field
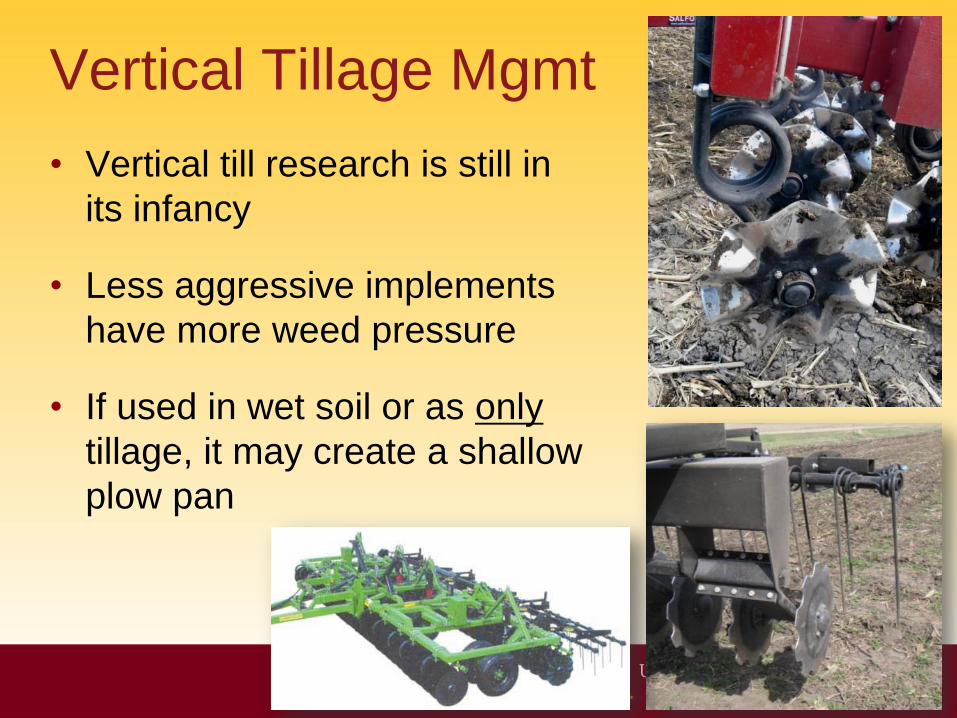
Vertical Tillage Mgmt
• Vertical till research is still in
its infancy
• Less aggressive implements
have more weed pressure
• If used in wet soil or as only
tillage, it may create a shallow
plow pan

Tillage Trials
• Clarkfield (2) and Carlisle (1)
• Corn/Soybean rotation
• Various tillage rotations at each location
• Started Fall 2009 (1 year of data)
Equipment used at Clarkfield

2010 Soybean Data - Clarkfield
Tillage Treatment
Residue
(%)
Population
(plants/ac)
Yield
(bu/ac)
Fall ST + Spring
coulter pass 61 148,800 58.0
Salford RTS, 2x 58 153,700 59.9
Fall Wishek disk
+ field cultivator 41 143,300 56.7
Fall DMI
+ field cultivator 54 153,200 57.1
LSD (0.05) 8.9 NS NS
DeJong-Hughes, J. Coulter

2010 Corn Data - Clarkfield
Tillage Treatment
Residue
(%)
Population
(plants/ac)
Height
(inches)
Yield
(bu/ac)
Fall ST +
coulter pass 36 32,200 10.6 156.6 ab
Salford RTS x 2 30 32,800 11.1 162.9 a
Fall CP +
field cultivator 30 31,900 10.7 152.2 b
Fall CP +
field cultivator 33 32,000 10.9 155.8 ab
LSD (0.05) NS NS NS 7.1
DeJong-Hughes, J. Coulter

Equipment Used at Carlisle
Gates Magnum Coulter at
0 and 7.5 degree pitch
Hiniker ST in Fall and
prototype coulter ST in spring
Why 2 passes? No breakdown that winter.

2010 Corn Data - Carlisle
Tillage Treatment
Population
(plants/ac)
Height
(inches)
Moisture
(%)
Corn Yield
(bu/ac)
S- field cultivator 33,800 11.2 a 14.6 179.2 a
F- ST
S- Coulter pass 33,200 10.7 ab 14.1 178.2 a
S- Gates Magnum
Coulter – 0o 31,800 8.4 c 16.1 167.0 b
S- Gates Magnum
Coulter – 7.5o 31,500 9.7 b 15.0 170.7 b
LSD (0.05) NS 1.2 1.1 7.1
DeJong-Hughes, J. Coulter
High weed pressure in the Gates 0

Kansas State 2009 Research
• Treatments:
– Case True Tandem 330 Turbo (vert. till)
– Long term no-till
• Applied 6.4” of water/hour
• Infiltration rate:
– VT 21.4 mm/hr
– NT 44.0 mm/hr
• Bd was decreased in top 2”
• Did not incorporate P and K
Pressley et al.

Vertical Tillage Pilot Study
Physical Properties VT mean NT mean p-value,
t-test**
Bulk density (g cm-3) 0-2” 1.13 1.21 0.08
2-4” 1.29 1.30 0.92
Infiltration (mm hr-1)* 21.4 44.0 0.04
Yield (bu/ac) 67.1 65.9 NS
This field had beautiful soil properties to begin with - NT since
the 1980’s. No density increase below the depth of tillage (2”)
Pressley, KSU, 2009
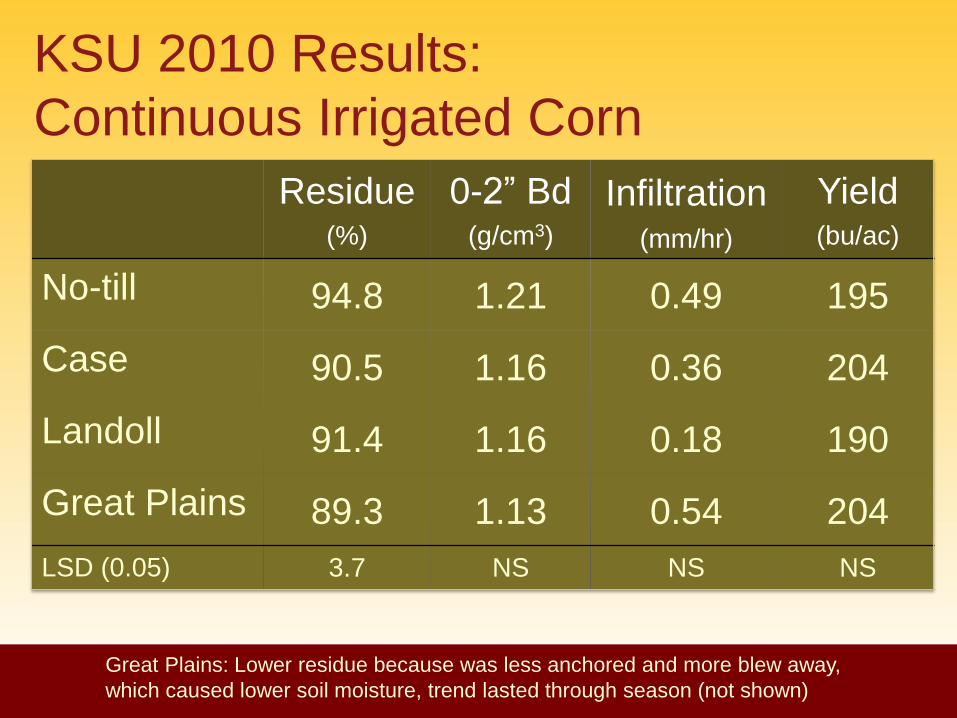
KSU 2010 Results:
Continuous Irrigated Corn
Residue (%)
0-2” Bd (g/cm3)
Infiltration (mm/hr)
Yield (bu/ac)
No-till 94.8 1.21 0.49 195
Case 90.5 1.16 0.36 204
Landoll 91.4 1.16 0.18 190
Great Plains 89.3 1.13 0.54 204
LSD (0.05) 3.7 NS NS NS
Great Plains: Lower residue because was less anchored and more blew away,
which caused lower soil moisture, trend lasted through season (not shown)

KSU 2010 Results:
Continuous Corn
Residue (%)
0-2” BD (g/cm3)
Infiltration (mm/hr)
Yield (bu/ac)
No-till 60.2 0.96 a 0.8 b 154
Case 40.8 0.78 b 2.1 a 176
Disk 35.6 0.80 b 1.3 ab 154
LSD (0.05) 7.7 0.12 0.95 NS
At this site, tillage was done in fall, resulted in more treatment differences

Where to Try Vertical Tillage • Good at sizing residue and introducing air to a
shallow depth
– Wet springs
– When fall tillage was not completed
– Sands that need to have some tillage
– Decrease residue build-up
• Leaves 50-60% corn residue = good on slopes
and all soil types
• Versatile
• Shallow tillage = works well with rotational tillage

Caution When Using Vertical Till
• In long term NT fields
– Decreased surface soil structure = decreases
water infiltration
• When broadcasting N
– Most machines will not cover N = volitalization
• Using for many years in wet conditions
– May create hard pan

Field Operations and Management
Practices for Different Tillage Systems
Operation NT ST CP DR MBP
Stalk chopping 1 1 1
Primary tillage 1 1 1 1
Secondary tillage 1-2 1-2 1-2
Surface nutrient application 1 1 1 1
Planting 1 1 1 1 1
Spraying 2 2 2 2 2
Harvest 1 1 1 1 1
Total number of trips 5 5 8-9 8-9 8-9

Tillage Economics ($/acre)
$13.05
$29.80
$45.63
$55.11 $56.64
$-
$10.00
$20.00
$30.00
$40.00
$50.00
$60.00
NT ST CP DR MBP
UMN 2008 Custom Rate Survey


Choosing a Tillage System
• Cropping System – Rotation, residue removal
– Timeliness of field operations
• Erosion Potential – Slope, soil type
• Others – Risk
– Current equipment
– Comfort
– Learning curve

Team:
• Jodi DeJong-Hughes, Doug Holen, Phil Glogoza,
Russ Severson, Jim Stordahl - UMN Extension
• MN producers, consultants, and roller manufactures
• USDA-ARS, MDA, NRCS and SWCD
Funding Provided by:
MN Soybean Research & Promotion Council
Ground Rolling Research Summary

Perceived Benefits of Rolling Fields
• Able to keep combine head low to the
ground without picking up rocks, corn
root balls, and soil
– Harvest lowest pods
– Decrease dockage for ‘dirty’ seed beans
– Less wear and tear on equipment
– Increase combine speed
– Ease of harvest
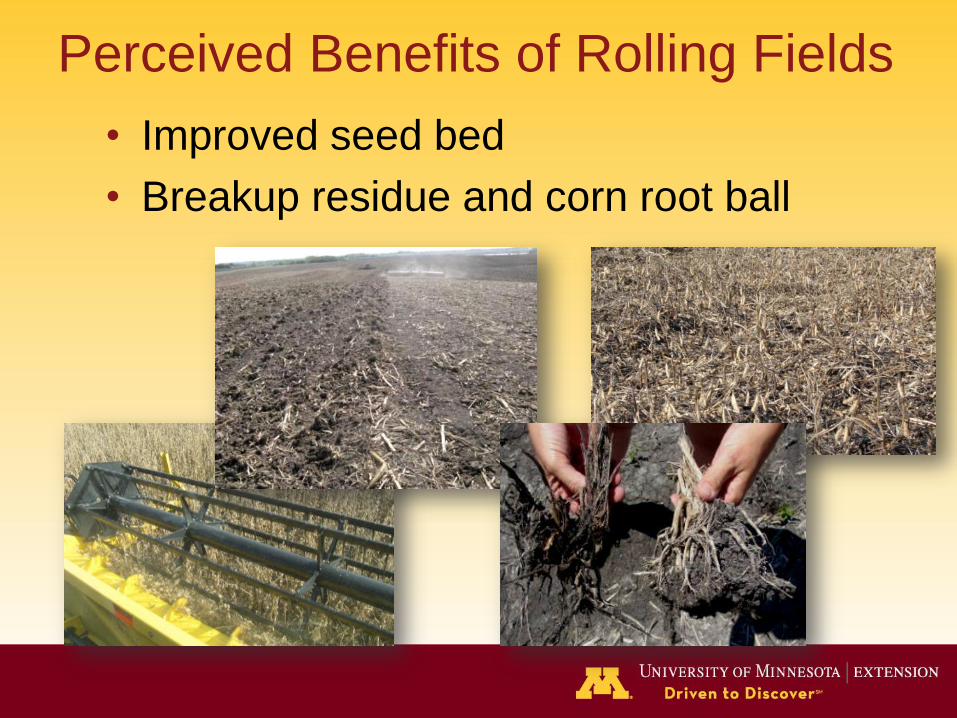
Perceived Benefits of Rolling Fields
• Improved seed bed
• Breakup residue and corn root ball

2008
2009
2010
Materials and Methods
• Three year study (2008-10)
– 2008 was a pilot year
• Rolling treatments applied at:
– Pre-plant
– Post-plant
– 50% emergence
– V1 – 1st trifoliate
– V3 – 3rd trifoliate
– No rolling

Materials and Methods, con’t.
• Variables observed:
– stand, plant injury, yield, seed quality characteristics
– residue decomposition, water infiltration and runoff
(data not shown)
• Randomized complete block design with 3 reps
Rep 1 Rep 2 Rep 3

• Field sized equipment
• Plot width varied with
roller width
• Minimum plot length 500’
• Harvest with combines
and weigh wagons
All Research Sites:
Riteway Smooth roller
Brillion notched roller
Flexi-coil packer
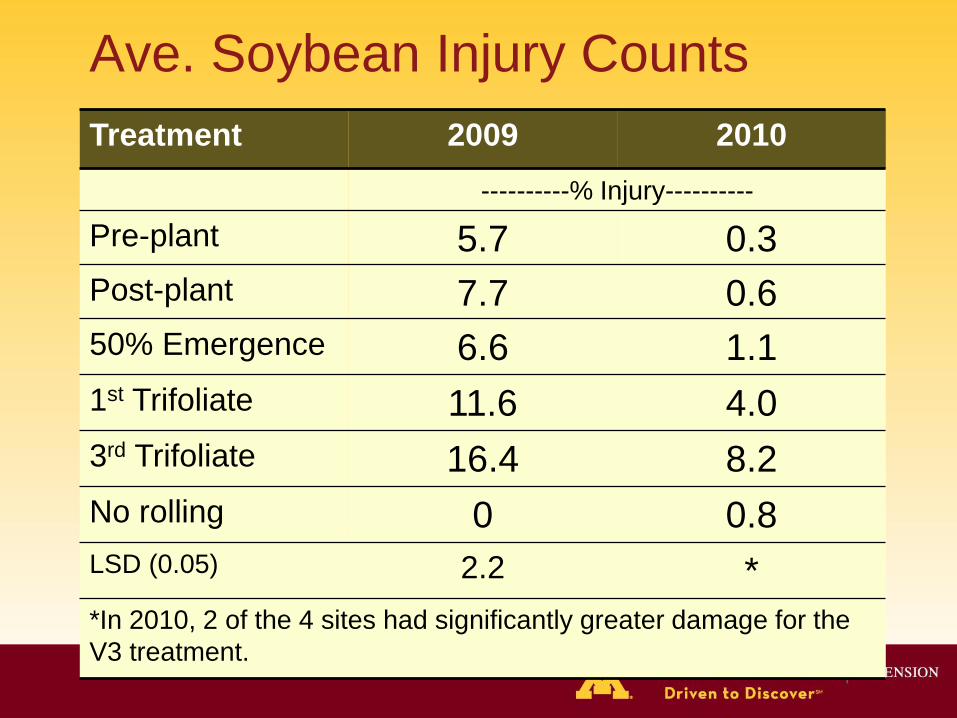
Ave. Soybean Injury Counts
Treatment 2009 2010
----------% Injury----------
Pre-plant 5.7 0.3
Post-plant 7.7 0.6
50% Emergence 6.6 1.1
1st Trifoliate 11.6 4.0
3rd Trifoliate 16.4 8.2
No rolling 0 0.8
LSD (0.05) 2.2 *
*In 2010, 2 of the 4 sites had significantly greater damage for the
V3 treatment.

Ave. Soybean Populations
Treatment 2009* 2010*
------- 1,000 Plants/acre -------
Pre-plant 158 160
Post-plant 158 160
50% Emergence 152 142
1st Trifoliate 153 151
3rd Trifoliate 150 135
No Rolling 155 154 * No statistical differences between plant populations by treatment at any locations by year.

Rolling Damage 50% Emerged V1 V3

Ave. Soybean Yield by Year
Treatment 2009* 2010*
-----Yield in bushels/ac -----
Pre-plant 46.6 52.1
Post-plant 46.6 51.2
50% Emergence 46.1 51.8
1st Trifoliate 45.2 51.6
3rd Trifoliate 45.3 50.0
No Rolling 44.7 51.8 LSD (0.05) NS NS
*Protein, oil, test weight and moisture are NS for all years

Iowa Rolling Research
Treatment
NW Iowa NC Iowa
2009 2010 2010
------Yield bu/acre------
Post-plant 64.2 58.8 57.4
1st trifoliate 65.5 58.2 58.3
3rd trifoliate --- --- 55.7
6 leaves --- --- 49.4*
No rolling 64.7 59.8 58.1 LSD (0.05) NS NS 5.9
Al-Kaisi et al, ISU

Potential Problems:
• Greater risk for sealing the soil
• Increased wind and
water erosion
• Cracked stem may
increase disease and
lodging issues

Summary
• Plant injury increased with later rolling.
• Population was not significantly affected
by treatment.
• Yield was not significantly affected by
treatment.
• Seed quality characteristics was not
significantly affected by treatment.

Conclusion
• No yield advantage or disadvantage to rolling past emergence up to V3.
• However, risk increases with:
– Cool, cloudy conditions
– No-till
– Wet soil conditions at rolling
– Rolling direction

Fall Rut Affects on Yield
• Growers observe ~3 year affect from ruts
• 7 fields were GPS’d in Fall 2009
– Frenchie with Crop One and 4 local growers
– All but 1 field was CP + SFC
• Ruts vs not rutted areas were flagged-off
• Data and hand harvest w/in the flags
J. DeJong-Hughes,
J. Coulter
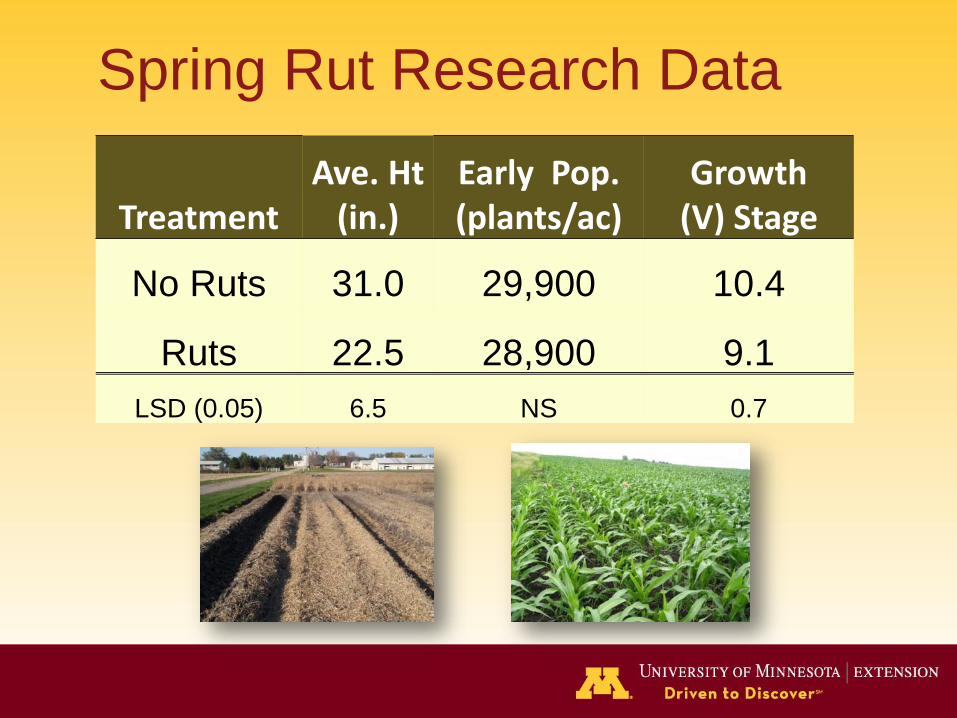
Spring Rut Research Data
Treatment Ave. Ht
(in.) Early Pop. (plants/ac)
Growth (V) Stage
No Ruts 31.0 29,900 10.4
Ruts 22.5 28,900 9.1
LSD (0.05) 6.5 NS 0.7

Harvest Rut Research Data
Treatment Final pop. (plants/ac)
Moist (%)
Yield (bu/ac)
No Ruts 29,100 14.9 158.6
Ruts 29,100 15.1 131.3
LSD (0.05) NS NS 11.1
Average yield drop was 17% and was very consistent.
One field had a 37% yield decrease. Ruts were on
headlands = compaction + ruts (121 vs 77 bu/ac).
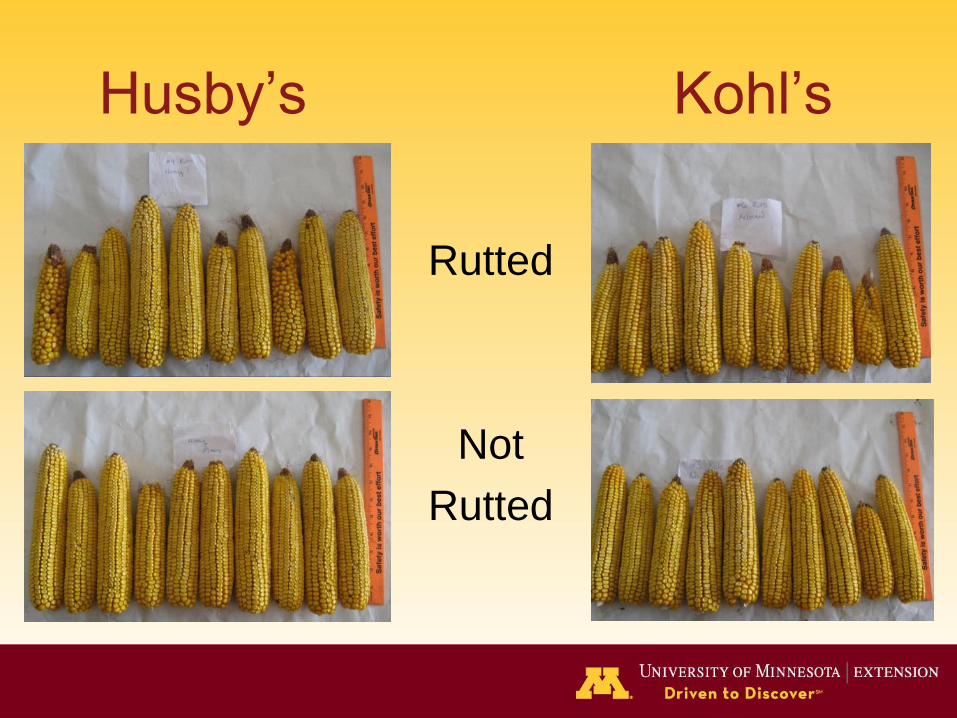
Husby’s Kohl’s
Rutted
Not
Rutted

Questions?
Related Documents