International Symposium on Standards, Applications and Quality Assurance in Medical Radiation Dosimetry (IDOS) Vienna, Austria 9 - 12 November 2010 BOOK OF EXTENDED SYNOPSES IAEA-CN-182

Welcome message from author
This document is posted to help you gain knowledge. Please leave a comment to let me know what you think about it! Share it to your friends and learn new things together.
Transcript

International Symposium on
Standards, Applications and Quality Assurance in Medical Radiation Dosimetry
(IDOS)
Vienna, Austria
9 - 12 November 2010
BOOK OF EXTENDED SYNOPSES
IAEA-CN-182


CONTENTS
Plenary Session 1
RADIATION MEASUREMENT STANDARDS FOR IMAGING AND THERAPY I
CN-182-INV002 What can primary standards do for you? 3
H.M Kramer
CN-182-148 Primary water calorimetry for clinical electron beams, scanned proton beams and 192Ir
brachytherapy 5 A. Sarfehnia, K. Stewart, C. Ross, M. McEwen, B. Clasie, E. Chung, H. M. Lit, J. Flam, E. Cascio, M. Engelsman, H. Paganetti, J. Seimtjens
CN-182-253 Results of the direct comparison of primary standards for absorbed dose to water in 60Co and
high-energy photon beams (EURAMET TC-IR Project 1021) 9 A. Stenrer, A. Baumgartner, R.-P. Kapsch, G. Stuck, F.-JMalinger
CN-182-008 The LNE-LNHB water calorimeter: Measurements in a Co beam 11
B. Rapp, A. Ostrowsky, J. Daures CN-182-057 Dose conversion for the BIPM graphite calorimeter standard for absorbed dose to water 15
D.T. Burns
Plenary Session 2
RADIATION MEASUREMENT STANDARDS FOR IMAGING AND THERAPY II
CN-182-INV003 What colour is 'your gray'? 19
P.J .Allisy-Roberts
CN-182-209 Design and principles of a graphite calorimeter for brachytherapy 21
T. Sander, H. Palmans, S. Duane, M. Bailey, P. Owen
CN-182-100 Development of a primary standard in terms of reference air kerma rate for 1 T
brachytherapy seeds 23 I. Aubineau-Laniece, J.M. Bordy, B. Chauvenet, D. Cutarella, J. Gouriou, J. Plagnard
CN-182-207 Analysis of the tandem calibration method for kerma-area product meters via Monte Carlo
simulations 25 A. Malusek, G. Aim Carlsson
CN-182-117 Determination of absorbed dose to water in megavoltage electron beams using a calorimeter-
Fricke hybrid system 27 C. D. Cojocaru, G. Stucki, M. R, McEwen, C. K. Ross
m

Parallel Session 3a
REFERENCE DOSIMETRY AND COMPARISONS IN EXTERNAL BEAM RADIOTHERAPY I
CN-182-INV004 Ten years after: Impact of recent research in photon and electron beam dosimetry on
TRS-398 31 H Benmakhlouf, P Andreo
CN-182-063 Beam quality correction factors for plane parallel chambers in photon beams 35
R.P. Kapsch, I. Gomola CN-182-149 Updating the AAPM's TG-51 protocol for clinical reference dosimetry of high energy
photon beams 37 M. McEwen, L. DeWerd, G. Ibbott, D. Rogers, S. Seltzer, J. Seuntjens
CN-182-285 Application of a new dosimetry formalism to IMRT head and neck radiotherapy 39
K. Rosser, E. Fernandez
CN-182-310 IPEM report 103: Small field MV photon dosimetiy 41
M. M. Aspradakis, J. P. Byrne, H. Palmans, J. Conway, A. P. Warrington, K. Rosser, S. Duane
Parallel Session 3b
INTERNAL DOSIMETRY: COMPUTATIONAL PHANTOMS & RADIOBIOLOGICAL MODELLING
CN-182-INV005 Computational phantoms and skeletal dose models for adult and paediatric internal
dosimetry 45 W. Batch, M. Wayson, D. Pafundi
CN-182-134 Photon and electron specific absorbed fractions for the University of Florida paediatric
hybrid computational phantoms 47 M. Wayson, W. Botch
CN-182-167 Inverse treatment planning for targeted radionuclide therapy 49
J. Gonzalez, C. Calderon, R. Alfonso, O. Diaz Rizo, J. Olivet, R.P. Baum
CN-182-349 Validating activity prescription schemes in radionuclide therapy based on TCP and NTCP
indexes calculation 51 C.F. Calderon, J.J. Gonzalez, W. Quesada, R. Alfonso, O. Rizo
CN-182-227 Isoeffective dose specification of normal liver during radioembolization using %Y
microspheres 53 B.W. Wessels, A.G. Di Dia, Y. Zheng, M. Cremonesi
iv

Parallel Session 4a
SMALL AND NON-STANDARD FIELDS
CN-182-INV006 Small and composite field dosimetry: The problems and recent progress 59
H. Pa/mans CM 82-012 On the implementation of a recently proposed dosimetric formalism to a robotic radiosurgery
system 61 E. Pantelis, W. Kilby, A. Moutsatsos, K. Zourari, P. Karaiskos, P. Papagiannis, C. Antypas, C. Hourdakis
CN-182-200 Small field dosimetric measurements with TLD-100, alanine, and ionization chambers 63
S. Junell, L. DeWerd, M.S. Huq, J. Novotny Jr, M. Quader, M.F. Desrosiers, G. Bednarz
CN-182-217 Application of a new formalism for dose determination in Tomotherapy HiArt 65
M.C. Pressello, C. De Angel is, R. Rauco, D. Aragno, M. Betti, D. Viscomi, E. Santini
CN-182-146 Advanced dosimetry techniques for accurate verification of non-standard beams 69
E. Chung, E. Soisson, H. Bouchard, J. Seuntjens
Parallel Session 4b
INTERNAL DOSIMETRY: PATIENT SPECIFIC METHODS
CN-182-INV007 Imaging based, patient specific dosimetry 73
M. Ljungberg, K. Sjogreen-Gleisner
CN-182-034 Good practice of clinical dosimetry reporting 75
M. Lassmann, C. Chiesa, M. Bardies
CN-182-300 Pitfalls in patient specific dosimetry 77
A.M. Fade% R.C. Cabrejas, G. Chebel, M.L. Cabrejas CN-182-192 Towards patient specific dosimetry in nuclear medicine: Associating Monte Carlo and 3-D
voxel-based approaches 79 A. Desbree, L. Hadid, N. Grandgirard, N. Pierrot, H. Schlattl, E. Blanchardon, M. Zankl
CN-182-360 Clinical implementation of patient specific dosimetry: Comparison with absorbed
fraction-based methods 81 G. Sgouros, R.F. Hobbs, R.L. fflaht, P. W. Ladenson
v

Plenary Session 5
EXTERNAL QUALITY AUDITS IN RADIOTHERAPY
CN-182-INV008 The IAEA quality audits for radiotherapy 85
J. Izewska, P. Bern, G. Azangwe, S. Vatnitsky, E. Rosenblatt, E. Zubizarreta
CN-182-INV009 Credentialing institutions for advanced technology clinical trials 87
G. Ibbott CN-182-141 A dosimetric audit of IMRT in the UK 89
J. Berresford, E. Bradshaw, M. Trainer, G. BudgeU, P. Williams, P. Sharpe
CN-182-326 Preliminary results from a dosimetric audit performed at Swedish radiotherapy centres 91
T. Knoos, J. Medin, L. Persson
CN-182-135 BELdART: Organization of a quality assurance audit for photon and electron beams based
on alanine/EMR dosimetry 95 B. Schaeken, S. Lelie, R. Cuypers, W. Schroeyers, F. Sergent, S. Vynckier, A. Runders, D. Verellen, H. Jannssens
CN-182-315 Dosimetry audits in radiotherapy using radiophotoluminescent glass dosimeter in JAPAN 97
H. Mizuno, A. Fukumura, Y. Kusano, S. Sakata
Parallel Session 6a
REFERENCE DOSIMETRY AND COMPARISONS IN EXTERNAL BEAM RADIOTHERAPY II
CN-182-INV010 Recent advances in dosimetry in reference conditions for proton and light-ion beams 101
S. Vatnitsky, P. Andreo, D. T.L. Jones CN-182-325 Experimental determination of the kQ factor for a Farmer chamber in a high energy scanned
pulsed proton beam 103 J. Medi n
CN-182-061 Calorimetric determination of k0 factors for an NE2561 ionization chamber in 3 cm x 3 cm
beams of 6 MV and 10 MV photons 105 A. Krauss
CN-182-277 Conversion of dose-to-graphite to dose-to-water in clinical proton beams 107
H. Palmans, L. Al-Sulaiti, R. A. S. Thomas, D. R. Shipley, J. Martinkovic, A. Kacperek
CN-182-268 Flattening filter free beams: Dosimetric characterisation, beam quality and peripheral doses. 109
G. Kragl, S. af Wetterstedt, B. Knausl, F. Baler, D. Albrich, S. Lutz, MDalatyd, P. McCavana, T. Wiezorek, T. Knoos, B. McClean, D. Georg
vi

Parallel Session 8b
CLINICAL DOSIMETRY IN X RAY IMAGING III
CN-182-INV011 New advances in CT dosimetry 113
J. M. Boone
CN-182-003 Regional diagnostic reference levels and collective effective doses from CT scanners in India
115 R. S Livingstone, P. M Dinakaran
CN-182-028 Variations of dose to the lung during computed tomography (CT) thorax examinations:
A Monte Carlo study 117 R Schmidt, J. Wulff, L. Castra, K. Zink
CN-182-206 Patient specific kerma-area product as an exposure estimator in computed tomography: The
concept and typical values 119 A. Mahisek, E. Helmrot, G. Aim Carlsson
CN-182-226 Application of dosimetric methods for obtaining diagnostic reference levels in panoramic
dental radiography 121 L. V. Canevaro, MM. Nunes, C. D. Almeida
Parallel Session 7a
CLINICAL DOSIMETRY IN RADIOTHERAPY
CN-182-INV012 Verification of the radiation treatment planning process: Did we get it right? 125
J. Van Dyk
CN-182-INV013 Assessing heterogeneity correction algorithms using the Radiological Physics Center's
anthropomorphic thorax phantom 127 D. Followill, S. Davidson, P. Alvarez, G. Ibbott
CN-182-122 LiFo-film dosimeters in skin dose measurements 129
S. Lelie, T. Lennertz, B. Schaeken, B. Bogdanov, E. Bressers, S. Schreurs, W. Schroevers, D. Verellen
CN-182-24,9 A dosimetric protocol for the use of radiochromic film in radiotherapy quality assurance in
Norway 131 A. Mauring
CN-182-160 Peripheral doses in modern radiotherapy techniques: A comparison between IMRT,
Thomotherapy and Cyberknife 133 E. DAgostino, G. Defi'aene, L. de Freitas Nascimento, R. Bogaerts, F. Van den Heuvel, F. Vanhavere
vii

Parallel Session 8b
CLINICAL DOSIMETRY IN X RAY IMAGING III
CN-182-INV014 A proposed European protocol for dosimetry in breast tomosynthesis 139
D.R. Dance, K.C. Young, R.E. van Engen CN-182-272 Assessment of trigger levels to prevent tissue reaction in interventional radiology procedures
141 A. Trianni, D. Gasparini, R. Padovani
CN-182-151 Digital breast tomosynthesis: Comparison of two methods to calculate patient doses 143
L. Cockmartin, A. Jacobs, D. Dance, H. Bosnians
CN-182-180 Compliance of full field digital mammography systems with the European Protocol for
image quality and dose 147 P.J. Barnes, D.H. Temperton
CN-182-289 On the influence of the patient's posture on organ and tissue absorbed doses caused by
radiodiagnostic examinations 149 R. Kramer, V. F. Cassola
Parallel Session 8a
REFERENCE DOSIMETRY AND COMPARISONS IN BRACHYTHERAPY
CN-182-INV015 New brachytherapy standards paradigm shift 153
M. P. Toni
CN-182-016 From reference air kerma-rate to nominal absorbed dose-rate to water paradigm shift in
photon brachytherapy: ISO new work item proposal 157 U. Quast, T. W. KauJich, A. Ahnesjo, J. T. Alvarez-Romero, D. Donnarieix, F. Hensley, L. Maigne, D. C. Medich, F. Mourtada, A. S. Pradhan, C. Soares, G. A. Zakaria
CN-182-081 Calibrations of high dose and low dose rate brachytherapy sources 159
H-J. Selbach, M. Meier CN-182-157 On the quality control of low energy photon brachytherapy sources: Current practice in
Belgium and the Netherlands 161 A. Aalbers, M. de Bra band ere, C. Koedooder, M. Moerland, B.Thissen, A. van't Riet, A. Rijnders, B. Schaeken, S. Vynckier
CN-182-018 Cuban laboratory proficiency test for calibration of well-type chambers using two types of
HDR 192Ir sources 163 G. Walwyri Salas, M. Bambynek, S. Gutierrez Lores, H-J. Selbach, J. Morales
viii

Parallel Session 8b
CLINICAL DOSIMETRY IN X RAY IMAGING III
CN-182-INV016 Calibration of kerma-area product meters with a patient dose calibrator 167
P. Toroi, A. Kosunen CN-182-080 Performance test of multi parameter measuring devices used for quality assurance in
diagnostic radiology 169 L. Biiermann, R. Bottcher
CN-182-086 C alibration of pencil type ionization chambers at various irradiation lengths and beam
qualities 171 C. J. Hourdakis, A. Boziari, E. KoumbouU
CN-182-137 Radiation dose measurements for paediatrics and co-patients during micturating
cystourethrography 173 A. Sutieman, F. Abd-Alrahman, B. Hussain, M. Hamadelneel
C'N-182-143 Diagnostic reference levels in neonatal units 175
M. T. Bahreyni Toossi, M. Malekzadeh
Plenary Session 9
RADIATION PROTECTION DOSIMETRY
CN-182-INV017 Occupational exposure of medical staff: An overview 179
F. Vanhavere
CN-182-296 Occupational doses in interventional cardiology: Experiences in obtaining worldwide data as
part of the ISEMIR project 183 J. Le Heron, R. Padovani A. Duran, D.L. Miller, H.K. Sim, E. Vano, C. Lefaure, M. Rehani
CN-182-198 Estimation of hand doses from positrons during FDG manipulation 187
M. Fiilop, I. Makaiova, P. Povinec, D. Bacek, P. Vlk, P. Ragan, I. Gomola, V. Husak
CN-182.-159 The ORAMED project: Optimization of radiation protection for medical staff in
interventional radiology, cardiology and nuclear medicine 191 N. Ruiz Lopez, M. Sans Merce, I. Earth, E. Carinou, A. Carnicer, I. Clairand, J. Domienik, L. Donadille, P. Ferrari, M. Fulop, M. Ginjaume, G. Gualdrini, C. Koukorava, S. Krim, F. Mariotti, D. Nikodemova, A. Rimpler, K. Smarts, L. Struelens, F. Vanhavere
ix

POSTERS
RADIATION MEASUREMENT STANDARDS FOR IMAGING AND THERAPY
CN-182-032 Quality management system of secondary standard dosimetry laboratory in Sri Lanka 195
C. Kasige, S.A Raindra Abeysinghe, L.P Jayasinghe CN-182-050 Evaluation of RQR beam quality at SSDL Jakarta Indonesia 197
H. Prasetio, R. Andika, S. Wijanarko, A. Rahmi
CN-182-054 The BIPM graphite calorimeter standard for absorbed dose to water 199
S. Pi card, D. T. Burns, P. Roger
CN-182-056 Establishment of reference radiation qualities for mammography at the BIPM 201
C. Kessler, D.TBurns, P. Roger, P.JAUisy-Roberts
CN-182-095 Stopping of 5-20 MeV protons in liquid water: Basic data for radiotherapy dosimetry 203
T. Siiskonen, H. Kettunen, K. Perajatyi, A. Javanainen, M. Rossi, W. Trzaska, J. Turunen, A. Virtanen
CN-182-097 Brachytherapy calibration service at secondary standard dosimetry laboratory in Argentina.. 205
R. Pichio
CN-182-101 Determination of the absorbed dose to water for 12 "'I interstitial brachytherapy sources 207
T. Schneider, H-J. Selbach
CN-182-103 AFRIMETS working together with AFRA and the IAEA promoting quality dosimetry and
sustainability in the region 209 Z.L.M. Msimang
CN-182-129 Development of a primary standard in terms of absorbed dose to water for 125I brachytherapy
seeds 211 L Aubineaii-Laniece, P. Aviles-Lucas, J-M. Bordy, B. Chauvenet, D. CutareUa, J. Gouriou, J. Plagnard
CN-182-1 Sa Improved calibration and measurement capabilities in terms of absorbed dose to water for
Co gamma rays at Cuban SSDL 213 S. Gutierrez Lores, G. Walwyn Salas, M. Lopez Rodriguez
CN-182-150 Establishment of calorimetry based absorbed dose standard for newly installed Elekta
Synergy accelerator at ARPANSA 215 G. Ramanathan, P Marty, J. Lye, C. Oliver, D. Butler, D. Webb
CN-182-158 Absorbed dose to water secondary standard for brachytherapy sources in Austria 217
F. Gabris, A. Steurer, R. Brettner-Messler
x

CN-182-161 The Belgian laboratory for standard dosimetry calibrations used in radiotherapy 219
L.C. Mihailescu, A.L. Lebacq, H.Thierens, F. Vanhavere CN-182-162 Recent regional key comparison results for air kerma and absorbed dose to water in X rays
and 60Co radiation 221 I Csete, C. K. Ross, L. Biiermann, J.H. Lee
CN-182-169 Determination of the G value for HDR 92Ir sources using ionometric measurements 223
L.Franco, S. Gavazzi, C.EdeAlmeida CN-182-194 Analysis of long-term stability of radiotherapy dosimeters calibrated in the Polish SSDL 225
P. Ulkowski, W. Balski, B. Gwiazdowska CN-182-196 Quality system of the Argentine SSDL 227
M.Saravi, A. Zaretzky, A. Stefanic, G. Montano, M. Vallejos
CN-182-199 Implementation of a metrological framework for dosimetry of X ray beams used in
diagnostic radiology in Minas Gerais, Brazil 229 T. A. da Silva, P. M. C. de Oliveira, J. V. Pereira, F. C. Bastos, L. J. Sauza, P. L. Squair, A. T. Baptista Neto, C. M. A. Soares, M. S. Nogueira Tavares, T. C. AJonso
CN-182-221 Development of an absorbed dose calorimeter for use in IMRT and small field external beam
radiotherapy 231 S. Duane, M. Bailey S. Galer F. Graber
CN-182-224 Re-establishing the photon absorbed dose primaiy standard on the new NPL clinical linac.... 233
D. Shipley, J. Pearce, S. Duane, R. Nutbrown
CN-182-236 Implementation of RQR-M qualities in standard X ray beam used for calibration of
mammography ionization chambers 235 E. L. Correa, P. C. Franciscatto, L. V.E. Caldas, V. Vivolo, M. P. A. Potiens
CN-182-238 Operational tests of the standard reference system used for gamma radiation calibration,
therapy level, at calibration laboratory of IPEN-CNEN/SP 237 W. B. Damatto, G. P. Santos, M. P. A. Potiens, L. V. E. Caldas, V. Vivolo
CN-182-253 Results of the direct comparison of primary standards for absorbed dose to water in °Co and
high-energy photon beams (EURAMET TC-IR Project 1021) 239 A. Steurer, A. Baumgartner, R.-P. Kapsch, G. Stuck, F.-J'Malinger
CN-182-265 Re-establishing of the dosimetry laboratory in NRPI Prague 241
L. Judas, I. Horakova, J. Dobesova, L. Novak
CN-182-267 Development of a water calorimeter as a primary standard for absorbed dose to water
measurements for HDR brachytherapy sources 243 J.A. de Pooter, L.A. de Prez
xi

CN-182-274 Assuring the quality of the mammography calibrations in Cuban laboratory by comparison
with Greek dosimetry standard 245 G. Walwyri, C. Hourdakis, A. Martinez, N. Gonzalez, A. Vergara
CN-182-313 Present status of SSDL and dosimetry protocol for external radiotherapy in Japan 247
A. Fukumura, H. Mizuno, Y. Kusano, H. Saitoh
REFERENCE DOSIMETRY AND COMPARISONS IN EXTERNAL BEAM RADIOTHERAPY
CN-182-009 Calibration of helical tomotherapy using ESR/alanine dosimetry 251
T. Garcia, P. Francois, N. Perichon, V. Lourenco, J.MBordy
CN-182-015 Measurement corrections for output factor measurements of small robotic radiosurgeiy
beams formed by a variable aperture collimator 253 P. Francescon, W. Kilby, N. Satariano, S. Cora
CN-182-025 Ferrous ammonium sulfate dosimeter chemical yield determination for dose measurement
standardization in high energy photons 255 O. Moussous, T .Medjaje, M. Benguerba
CN-182-027 Testing the accuracy of electron transport in the Monte Carlo code FLUKA for calculation of
ion chamber wall perturbation factors 257 M. Klingebiel, K. Zink, J. Wulff
CN-182-030 Conceptual improvements and limitations in non-standard beam reference dosimetry 259
H. Bouchard, I. Kawrakow, J.F Carrier, J. Seuntjens
CN-182-040 Experimental evaluation of reference dosimetry for non-standard fields in an aperture based
IMRT system 265 R. Alfonso-Laguardia, E. Larrinaga-Cortina, L. De la Fuente, I. Silvestre-Patallo
CN-182-058 Response of alanine dosimeters in small photon fields 267
M. Anton, A. Krauss, R-P. Kapsch, T. Hackel
CN-182-059 Chamber quality factors for the NACP-02 chamber in 60 Co beams: Comparison of EGSNRC
and PENELOPE Monte Carlo simulations 269 J. Wulff, K. Zink
CN-182-073 Comparison of calibration methods of plane parallel ionization chambers for electi on beam
dosimetry 271 /. Jokelainen, A. Kosunen
CN-182-074 Influence of pulse length and high pulse dose on saturation correction of ionization chamber
273 L. Karsch, C. Richter, J. Pawelke
x n

CN-182-084 The dosimetry of electron beams using the PRESAGE dosimeter 275
T. Gorjiara, R .Hill, Z. Kuncic, C .Baldock
CN-182-091 A Monte Carlo investigation of 31010 ionization chamber perturbation factor for small field
dosimetry 277 P. V. Kazantsev, V.A. KUmanov
CN-182-093 Comparison of calibration factors of plane parallel chambers used for high energy electron
beams in the Czech Republic 279 I. Horakova, I. Koniarova, V. Dufek
CN-182-112 Assessment of different detectors for relative output factor measurements in small
radiosurgery fields of the Leksell Gamma Knife 281 J. Novotny Jr., J.P. Bhatnagar, M.S. Huq
CN-182-113 Current worldwide practice in calibration of small Leksell Gamma Knife radiosurgery fields:
Initial results from the International Calibration Survey 283 J. Novotny Jr., M.F. Desrosiers, J.P. Bhatnagar, J. Novotny, M.S. Huq, J.M. Puhl S.M. Seltzer
CN-182-119 Validation of experimental results in small field dosimetry 285
T. Sabino, L. N. Rodrigues
CN-182-120 Experimental determination of beam quality correction factors in therapeutic carbon ion
beams 287 M. Sakama, T. Kanai, A. Fukumura, Y. Kase
CN-182-147 Accurate dose distributions: The implications of new effective point of measurement values
for thimble ionization chambers 289 F. Tessier
CN-182-1® Small field dosimetry in high energy photon beams based on water calorimetry 291
L.A. de Prez CN-182-176 Monte Carlo modelling of dosimetric parameters for small field MV X ray beams 293
D.I. Thwaites, G. Cranmer-Sargison, C. J. Evans, N. P. Sidhu
CN-182-195 Results of calibration coefficients of plane parallel Markus type ionization chambers
calibrated in 60 Co and electron beams 295 IV. Bulski, P. Ulkowski, B. Gwiazdowska
CN-182-214 Study of the formalism used to determine the absorbed dose for X ray beams 297
U. Chica, A. Lallena, M. Anguiano
CN-182-219 A critical examination of Spencer-Attix cavity theory 299
A.E. Nahum, V. Panettieri
x m

CN-182-220
Optical-fiber guided A1203:C radioluminescence dosimetry for external beam radiotherapy.. 301 C.E. Andersen, S.M.S. Damkjcer, M.C. Aznar
CN-182-222 Application of dose area product and DAP ratio to dosimetry in 1MRT and small field
external beam radiotherapy 303 S. Duane, F. Graber, R.A.S. Thomas
CN-182-223 Measurement and modelling of electron beam profiles and calculation of graphite
calorimeter gap corrections and ion chamber wall perturbation factors for the NPL Elekta synergy linear accelerator 305 M. Bailey, D. R Shipley
CN-182-229 Measurement and modelling of beam profiles in small fields produced by a 2.5 mm
microMLC 307 S. Duane, F. Graber, M. Luzzara, H. PaJmans
CN-182-230 Secondary electron perturbations in Farmer type ion chambers for clinical proton beams 309
H. Palmans
CN-182-243 Ionization chamber of variable volume and the uncertainties in the chamber positioning 311
J. L. Silva, R.S Cardoso, J.G.P Peixoto
CN-182-252 Contributions of the different ion chamber walls to the fiuence perturbation in clinical
electron beams: A Monte Carlo study of the NACP-02 parallel-plate chamber 313 K. Zink, J. Wulff
CN-182-264 Dosimetry for small size beams such as IMRT and stereotactic radiotherapy: Is the concept
of the dose at a point still relevant? Proposal for a new methodology 315 A. Ostrowsky, J.MBordy, J'Dawes, L. de Carlan, F. Delaunay
CN-182-312 Concerns in France about the dose delivered to the patients in stereotactic radiation therapy .317
S. Derreumaux, G. Boisserie, G. Brunei, I. Buchheit, T. Sarrazin
CN-182-321 Analytical determination of a plan class specific reference (PCSR) field for reference
dosimetry of IMRT fields 319 T. Ohrman, U. Isacson, A. Montelius, P. Andreo
REFERENCE DOSIMETRY AND COMPARISONS IN BRACHYTHERAPY
CN-182-007 Calibration of 1" Ir sources used for high dose rate remote afterloading brachytherapy 323
M. Asghar, S. Fatmi, H. Mota, S.A. Buzdar, M. Afzal
CN-182-020 Fast Fourier transform algorithm for dose computations in heterogeneous brachytherapy
geometries 325 E. Nani, P. Francescon, S. Cora, J.H. Amuasi, E.H.K Akaho, E. Afenya
xiv
CN-182-038 Internal clinical acceptance test of the dose rate of10 Ru/106Rh ophthalmic applicators 329
T. W. Kaulich, M. Bamberg
CN-182-046 Detectors for brachytherapy dosimetry: Response as a function of photon energy 331
I. Jokelainen, P. Sipila, H. Jatyinen
CN-182-067 Measurement of low level ionization current in a new standard free air chamber derived from
an l25I brachytherapy source 333 Y. Unno, T. Kurosawa, A. Yunoki, T. Yamada, Y. Sato, Y. Hino
CN-182-210 Source geometry correction factors for HDR 192Ir brachytherapy secondary standard well
chamber calibrations 335 T. Sander, D. Shipley, R. Nutbrown, H. Palmans, S. Duane
CN-182-239 3-D distribution measurement of the absorbed dose to water around 19 "If brachytherapy
source by thermoluminescent dosimeters 337 V. Lourengo, D. Vermesse, D. Cutarella, M. P. A viles Lucas. I. Aubineau-Laniece
CN-182-24.0 Characterization of a parallel plate ionization chamber for the quality control of clinical
applicators 339 P. L. Antonio, L. V. E. Caldas
CN-182-297 The first experience of implementation of HDR afterloader with' °Co source into clinical
practice at National Cancer Institute 341 T. Pidlubna, O. Galias, 1. Magdych
CN-182.-323 Gel dosimetiy for HDR brachytherapy 3-D distribution through MRI 343
G. Batista Hernandez, G. Velez, C. Schiirrer
CLINICAL DOSIMETRY IN X RAY IMAGING
CN-182-010 Detecting small lesions with low dose in head CT: A phantom study 347
M. Perez, A.E. Carvalho, H.J. Khowy, M.C. Casus, M.E. Andrade, J.E. Paz
CN-182-035 Dose assessment in interventional radiological procedures in children with gafchromic films:
Results of IAEA project RAS/9/055.TSA3 349 A. Zaman, M. Ali, A. Ahmed, M.Zaman
CN-182-044 Mammography reference field in Japan 351
T. Tanaka, T. Kurosawa, R. Nouda, T. Matsumoto, N. Saito, S. Matsumoto, K. Fukuda
CN-182-053 Estimation of entrance surface doses (ESDs) for common medical X ray diagnostic
examinations in radiological departments in Mashhad, Islamic Republic of Iran 353 S. EsmaMi, M.T. Bahreyni Toossi
xv

CN-182-066 Patient dosimetry in conventional X ray examinations of children 355
M.A.S Lacerda, T.A da Silva, H.J Khoury
CN-182-069 Variation of radiation doses from CT paediatric procedures in large medical centers in
Riyadh, Saudi Arabia 357 A. N. Al-Haj
CN-182-078 Risk/benefit ratio of the breast screening programme in Tuscany (Italy) for the years 2004-
2008 359 V. Ravaglia, M. Quattrocchi, S. Mazzocchi, B. Lazzari, G. Zatelli, A. Vaiano, S. Busoni, C. Gasperi, A. Lazzari
CN-182-079 Survey of dose after the introduction of digital mammographic systems in Tuscany (Italy).... 361
M. Quattrocchi, V. Ravaglia, S. Mazzocchi, B. Lazzari, G. Zatelli, A. Vaiano, S. Busoni, C. Gasperi, A. Lazzari
CN-182-087 Can a non-invasive X-ray tube voltage measuring device (kV meter) that reads the peak
voltage, be used for the measurement of the Practical Peak Voltage (PPV)? 363 C.J. Houdakis
CN-182-092 Entrance surface air kerma to patients during chest computed radiography in the United
Republic of Tanzania 365 W.E. Muhogora, J.B. Ngatunga, U.S. Lema, L. Meza, E. Byorushengo, J. Mwimanzi, M. Nyaki, S. Mikidadi, F.P. Banzi
CN-182-114 Dose assessment in CT examinations 367
W. Nyakodzwe, G. Mukwada
CN-182-121 Patient dose audit of radiology departments across Ghana 369
J. Fazakerley, E. Ofori, D. Scutt, M Ward, B.M. Mo ores CN-182-12B Characterization of diagnostic radiation qualities according to the IEC 61267 at
LMRI-ITN 373 P. Limede, C. Oliveira, J. Cardoso, L. Santos
CN-182-130 Applications of the IAEA code of practice TRS-457 for establishing radiation qualities at the
Syrian National Radiation Metrology Laboratory 375 M.A. Bero and M. Zahili
CN-182-1 $2 A comparison of full field digital mammography systems: Physical characteristics and image
quality/dose performance in optimized clinical environment 377 N. Oberhofer, A. Fracchetti, E. Moroder
CN-182-13 8 Optimization of radiation dose in abdominal computerized tomography 379
A.M El now, A. Sutieman A. Gabir
xvi

CN-182-151 Image quality and patient dose in digital panoramic radiography 381
V. Brasileiro, H. J. Khouty, R. Kramer, M. E. Andrade, J. B. Nascimento Netob, C. Boiras
CN-182-156 Influence of TRS-457 on dosimetric measurements in computed tomography 385
IV. Skrzynski, W. Slusarczvk-Kacprzyk, W. Bui ski
CN-182-164 Quality assurance protocol for digital intra-oral X ray systems 387
A. Jacobs, J. Nens, R. Jacobs, B. Vandenberghe, H. Bosnians
CN-182-179 Commissioning two constant potential X ray sets for the calibration of diagnostic dose and
dose rate instruments by achieving IEC 61267-2005 beam qualities using end point photon spectrometry 389 /.). H Temperton, J. E Palethorpe, P. R Austin, D. E Delahunty
CN-182-189 Calibration of OSL dosimeters according to the IAEA code of practice for diagnostic
radiology dosimetry TRS-457 391 M.B. Freitas, R.H.C. Alves, E.M. Yoshimura
CN-189-193 Quality assurance of automatic exposure control devices for digital radiography: Belgian
approach 393 J. Nens, working group BHPA, A. Jacobs, N. Marshall, H. Bosmans
CN1 82-205 Skin doses to patients during CT perfusion of the liver 397
A. Beganovic, I. Sefic-Pasic, M. Gazdic-Santic, A. Drljevic, A. Skoplj ak-Beganovic
CN-182-228 Dose survey in Moroccan paediatric university hospitals: Impact of a preliminary work in
diagnostic radiology 399 F. Bentayb, K. Nfaoui, O. El Bassraoui, A.C Pedrosa Azeedo
CN-182-233 Patient dosimetry in radiography examinations and establishment of national diagnostic
reference levels in Ukraine 401 M. Pylypenko, L. Stadnyk, O. Shalyopa, O. Gur
CN-182-241 A tandem system for quality control in mammography beams 403
J. O. Silva, L. V. E. Caldas
CN-182-242 Evaluation of radiation dose and image quality in computed tomography in Rio de Janeiro,
Brazil 405 F. A. Mecca, S. Kodlulovich, L. Conceiqao
CN-182-259 Test and calibration of a home-made ionization chamber for dose measurement in computed
tomography 407 VS. Barros, M.P.A. Potiens, M. Xavier, H.J. Khouty, L. V.E. Caldas
xvii

CN-182-263 Patient doses in simple radiographic examinations in Madagascar: Results from IAEA
Project 409 M.J. Ramanandraibe, T. Randriamora, R. Andriambololona, E. Rakotoson
CN-182-266 Humidity dependence in kerma area product meter used in diagnostic X ray examinations.... 411
P.O. Hetland
CN-182-269 Patient dose in a breast screening program: Digital versus film mammography 413
A. Ramirez-Munoz, A. Dominguez-Folgueras, M.L. Chapel-Gomez CN-182-275 Influence of detector type and position on KAP-meter calibration on fluoroscopy and
angiography units 415 R. Boris ova, J. Vassileva
CN-182-287 Dependence of mean glandular dose on compression plate position 417
S. Avramova-Cholakova, J. Vassileva
CN-182-288 Evaluation of diagnostic X ray devices and patient doses in Indonesia: preliminary result 419
E. Hiswara, H. Prasetio
CN-182-293 Image quality and radiation dose assessment in 3-D imaging: Cone beam CT versus CT 421
P. Colombo, A. Moscato, A. Pierelli, S. Pasetto, F. Cardinale, A. Torresm
CN-182-337 Design and construction of a Brazilian phantom for CT image quality evaluation 423
S. K. Dias, A. Damasio, F. A. Mecca, L. Conceigao, H. J.Khoury
CN-182-340 A new dosimetric phantom for evaluation of glandular dose in conventional and digital
mammography systems 425 C. M. C. Coutinho, C. D. Almeida, J. E. Peixoto, R. T. Lopes
CN-182-342 Characterization of a mammography dosimetric phantom 427
C. D. de Almeida, C. M. C. Coutinho, J. E. Peixoto, B. M. Dantas
CN-182-345 A new IAEA handbook for teachers and students: Diagnostic radiology physics 429
A. Maidment., S. Christofides, D. Dance, K-H Ng, A. Kesner, D. McLean
CLINICAL DOSIMETRY IN RADIOTHERAPY
CN-182-001 Newer approaches and developments of quality assurance procedures for intrabeam intra-
operative radiotherapy unit 433 K. R. Muralidhar, B. K. Rrout, A. Mallik, Poornima
CN-182-011 Verification of newly upgraded radiation therapy treatment planning system XIO CMS at the
Institute of Oncology Vojvodina 435 B. Petrovic, L. Rutonjski, M. Baucal, M. Teodorovic, E. Gershkevitsh
xviii

CN-182-021 Practical use of diode array to help determine small field data in order to commission an
IMRT TPS with MLC 437 C. Castellanos, G. Castillo
CN-182-022 The choice of detector for linear accelerator and TPS commissioning 441
E. Gershkevitsh, A. Peraticou, D. Dimitriadis, A. V. Aritkan T. Efthymiou, E. Stylianou Markidou, A. Giannos, C. Constantinou
CN-182-039 Quality assurance of IMRT plan evaluation and dosimetric comparison using AAPM Task
Group 119 443 M. Ravikumar, S. Sathiyan, C. Varatharaj
CN-182-043 Comparison of four different commercial devices for Rapid Arc and sliding window IMRT
QA 445 C. Varatharaj, S. Stathakis, M. Ravikumar, C. Esquivel, N. Papanikolaou
CN-182-048 Isocentric electron treatments with shortened applicators 447
J. Niemela, M. Tenhunen, J. Keyrilainen
CN-182-060 A virtual Monte Carlo based model of an IORT electron accelerator 449
A. Toussaint, J. Wulff, H.-O. Neidel, F. Ubrich, K. Zink
CN-182-062 Experimental investigation of a computed radiography system as detector for dosimetry 451
M. Rouijaa, R-P. Kapsch
CN-182-064 Analysis of portal dose prediction verification results: Small clinic practical view 453
H E. Hietala
CN-182-075 Experience of quality assurance procedures for dose calculation verification in external
radiotherapy treatment planning 455 M. Prusova
CN-182-090 Dosimetric comparison of intensity modulated radiotherapy treatments with step and shoot
and sliding window techniques 457 S.M. Palaniappan , S.S Supe, M. Ravikumar
CN-182-098 Multipurpose, semi-anatomical water phantom for TPS verification 459
P.Sipild, H. Jatyinen, A. Kosunen, J. Ojala, J. Niemela
CN-105-105 On-board imaging commissioning and quality assurance program: ROV experience 461
M. Hegazy, W. Patterson, W. Ding
CN-182-10B Imaging dose to various organs at risk during image guided radiotherapy in the pelvic region
~ 463 A. Palm, M. Stock, E. Steiner, D. Georg
CN-182-110 Problems of clinical dosimetry in Russian radiotherapy centers 465
I. Kostylev, M. Kisliakova
xix

CN-182-115 Sensitivity study of an EPID for real time patient specific IMRT QA 467
E. Larrinaga-Cortina, R. Alfonso-Laguardia, S. Karnas CN-182-11$ FLUKA Monte Carlo simulation for the Leksell Gamma Knife PERFEXION: Preliminary
results 469 A. Totresin, N. Bertolino, F. Cappucci, M.G. Brambilla, H.S. Mainardi, G. Battistoni
CN-182-125 In vivo dosimetry for head and neck carcinoma: Determination of target absorbed dose from
entrance and exit absorbed dose measurements 473 L. Farhat, M. Besbes, A. Brisker, J. Daoud
CN-182-126 Use of 2-D Array seven29 in QC of photon beams 475
T. Antropova
CN-182-127 Dose distributions in critical organs for radiotherapy treatment with' JCo beams of some
common cancers 477 MS. Rahman, M. Shamsuzzaman, Z. Alain. S. Sharmin
CN-182-139 Measurement of the out-of-field neutron and gamma dose equivalents from a 230 MeV
proton pencil beam 479 B. Mukherjee, J. Lambert, R. Hentschel, J. Farr
CN-182-145 Comparison of different radiotherapy treatment techniques, radiation qualities and therapy
machines with respect to neutron dose 481 R, A. Hcilg, J. Besserer, S. Mayer, U. Schneider
CN-182-153 Energy dependence of radiochromic dosimetry films for use in radiotherapy verification 483
K. Chelminski, W. Bulski, D. Georg, Z. Maniakowski, D. Oborska
CN-182-175 Performance evaluation and dosimetry of CT IGRT systems 487
R. Lindsay, J. Sykes, R. Dickinson, D.I Thwaites
CN182-177 VMAT planning and verification of delivery and dosimetry using the 3-D Delta' dosimetry
system 489 S.J Derbyshire, J. [Alley, V.P Cosgrove, D.I Thwaites
CN-182-178 OSL detector for in vivo dosimetry in pelvis and head and neck cancer treatment 491
C. Viegas, A. Viamonte, A.M. Campos
CN-182-197 Evaluation of the dosimetric perturbation introduced by an esophageal nitinol stent 493
F. Garcia Yip, F. Padilla Cabal, I. Silvestre Patallo, M. Perez Liva, J.L Morales Lopez, L, De la Fuente Rosales
CN-182-201 Dosimetry of proton spot beam profiles of the scanning beam nozzle at the Proton Therapy
Center in Houston 495 N. Sahoo, X. R. Zhu, A. Anand, G. O. Sawakuchi, G. Ciangaru, F. Poenisch, K. Suzuki, U. Titt, R. Mohan, M. Gillin
xx

CN-182-218 Treatment delivery reproducibility of a helical tomotherapy system evaluated by using 2-D
ionization chamber and imaging detector arrays 497 E. Cagni, M. Paiusco, A. Bott, M. Ion
CN-182-245 Quality assurance in radiotherapy with anthropomorphic phantoms 499
P. Alvarez, A. Molineu, D. Followill, G. Ibbott
CN-182-248 Nemo X: Freeware independent monitor units calculation for external beam radiotherapy 501
S. Agostinelli, S. Garelli, F. Foppiano, G. Taccini CN-182-250 Beam matching of Primus linacs for step and shoot IMRT 503
D. Venenata, E. Garrigo, C. Descamps, E. Gomez, R. Mainardi, Y. Pipman
CN-182-251 A method to enhance spatial resolution of a 2-D ion chamber array as a filmless tool for
quality control of MLC 505 R. Diaz Moreno, D. Venencia, E. Gatrigo, Y. Pipman
CN-182-254 Physical aspects of radiotherapy quality assurance: Quality control protocol - update of
IAEA TECDOC-1151 507 R. Alfonso, P. Andreo, M. Brunetto, E. Castellanos, E. Jimenez, I. Silvestre, D. Venencia
CN-182-258 A proposal for process QA in modern radiation therapy 509
L. J. Schreiner, T. Olding, J. Darkoa
CN-182-261 Comparative study of spectrophotometric response of the 270 Bloom Fricke gel dosimeter to
clinical photon and electron beams 511 C. C. Cavinato, R. K. Sakuraba, J. C. Cruz, L. L. Campos
CN-182-262 Simulated clinical effect of in vivo diode perturbation in megavoltage photon beam
radiotherapy 513 D.R .McGowan, R. Francis, R. W. Roberts, P. Dvorak
CN-182-270 Performance of a CVD diamond detector for dosimetiy in radiotherapy photon beams 515
M. Pimpinella, V. De Coste, G. Conte, A.S. Guerra, F.P. Mangiacotti, A. Petrucci
CN-182-271 Comparison of dose distributions for various applicators for treatment of rectal cancer 519
O. V. Kozlov, N.E. Mukhina
CN-182-273 Patient specific quality assurance of whole pelvic intensity-modulated radiotherapy (WP-
IMRT) with hypofractionated simultaneous integrated boost (SIB) to prostate for high risk prostate cancer 521 E. Moretti, M.R Malisan, M. Crespi, C. Foti, R. Padovani
CN-182-278 The application of GAFCHROMIC® EBT films for abutted half-beam monoisocentric fields
matching quality control 523 M. Lavrova, O.Kazina, I. Vakhrnshin, E. Lomteva, T. Tatarinova, V. Gubin
xxi

CN-182-279 Comparison of doses on organs at risk for patients with cervix cancer for 2-D and 3-D
methods of treatment p lanning 525 N. Muhina, O. Kozlov, O. Kravetz
CN-182-280 Dosimetric evaluation of a 2-D ion chamber array for verification of big gradient areas in
small segments of IMRT plans 527 A. Cordero-Ramirez
CN-182-282 Evaluation of a commercial 4-D diode array for helical tomotherapy plan verification 531
M. Zeverino, G. Giovannini, G. Taccini
CN-182-290 The comparison of different control charts to analyze patient specific IMRT QA 533
T. Sanghangthuma, T. Pawlicki, S. Suriyapee, S. Srisatit
CN-182-2* Clinical implementation of entrance in vivo dosimetry with a diode system in MV photon
beam radiotherapy 535 L. G. Aldrovandi, M. L. Mairal, S. G. Paidon, E. C. Raslawski
CN-182-299 Response characterization of a diode system for in vivo dosimetry during megavoltage
photon beam radiotherapy 537 L. G. Aldrovandi, M. L. Mairal, S. G. Paidon, E. C. Raslawski
CN-182-306 Experience on total plan dose verification in step & shoot and sliding window IMRT 539
D. Venencia, Gairigo, Descamps, Vieira, Mainardi, Pipman CN-182-318 Assessment of the dosimetry effect of the embolization material in stereotactic Radiosurgery 541
O.O. Galvan de la Cruz, J.M. Larraga-Gutietrez, S. Moreno-Jimenez, O.A. Garcia-Garduno, M.A. Cells
CN-182-322 A Monte Carlo based model for the photoneutron field evaluation in an Elekta Precise linear
accelerator 543 M. Perez-Liva, F. PadiUa-Cabal, E. Lara, R. Alfonso-Laguardia, J.A Garcia, N. Lopez-Pino
CN-182-324 Dosimetric evaluation of the BlueFrame-FiMe treatment planning system: Results of IAEA
TECDOC-1540 547 A. Bruna, L. Ojeda, G. Velez
CN-182-353 In vivo dosimetry study in total body irradiation performed for 54 patients 549
M. Besbes, H. Mahjoub, L. Kochbati, A. Ben Abdennabi, L. Farhat, S. Abdessaied, L. Salem, H. Frikha, C. Nasr Ben Ammar, D. Hentati, W. Gargouri, T. Messai, F. Benna, M. Maalej
XXll

INTERNAL DOSIMETRY FOR DIAGNOSTIC AND THERAPEUTIC NUCLEAR MEDICINE
CN-182-019 Dosimetric evaluation in patient with metastatic differentiated thyroid cancer by the use of
124I and 1311 553 G. Rossi, M. Camarda, P. D'Avenia, E. Di Nicola, L .Montani, S. Fattori
CN-182-037 Estimation of internal dose to patients undergoing myocardial perfusion scintigraphy 555
P. Tandon, B.S. Gill, M. Venkatesh
CN-187-077 Applicability of semiconductor detectors and related ANGLE software for QA in medical
radiation dosimetry 557 S. Jovanovic, A. Dlabac
CN-182-082 PET with 124I-beta-CIT: Imaging based dosimetry for a new radiopharmaceutical 561
P. Saletti, V. Berti, P. Panic he!li. G. Valentini, A. Pupi, C. Gori
CN-182-116 Equivalent therapy model for non-Hodgkin's lymphoma: Uncertainty analysis for
radiobiologic parameters 563 P.L Roberson, S.J Wilderman, A.MAvram, M.S Kaminski, M.J Schipper, Y.K Dewaraja
CN-182-186 Equivalent therapeutic response model for non-Hodgkin's lymphoma: Tumor specific cell
proliferation and analysis of follow-up studies 565 S.J Wilderman, P.L Roberson, A.M Avram, M.S Kaminski, M.J Schipper, Y.K Dewaraja
EXTERNAL QUALITY AUDITS
CN-182-005 A TLD based postal audit method for source strength verification of high dose rate 192Ir
brachytherapy sources 569 S. D. Sharma, V. Shrivastava, Philomina A., G. Chourasia, Y. S. Mayya
CN-182-024 The SSDL-ININ experience in TLD postal pilot programme for radiotherapy external beam
audit at Mexican hospitals 571 J. T. Alvarez R. V.M. Tovar Munoz
CN-182-041 External quality audit of IMRT planning and delivery: Preliminary results 573
R. Alfonso-Laguardia, Y. Sola-Rodriguez, J. L. Alonso-Samper, E. Larrinaga-Cortina, L. De la Fuente
CN-182-042 Development of nati onal radiotherapy audit in the UK 575
S. Bolton CN-182-085 The role of dosimetry audits in radiotherapy quality assurance: The 8 year experience in
Greek radiotherapy and brachytherapy centers 577 C. J. Hourdakis, A. Boziari
x x m
CN-182-088 Good practice for QA of nuclear medicine equipment: National guidance in Finland 579
R. Bly, H, Jarvinen, H. Korpela
CN-182-096 Dose quality audits activity via mailed TLDs in the last five years (2005 - 2009) 581
K. Sergieva, Z. Bouchakliev
CN-182-099 The IAEA/WHO TLD postal dose audit programme for radiotherapy in the Russian
Federation 585 T. Ktylova
CN-182-102 General audit strategy using large scale diagnostic radiology examination data 587
P. Charnock, R. Wilde, J. Fazakerley, R. Jones, B.M Moores
CN-182-152 Mailed megavoltage photon TLD audit program for radiotherapy providers in Australia 589
C. P. Oliver, D. J. Butler, D. V. Webb
CN-182-171 Dosimetry audits based onNCS report 18: Assessment of absorbed dose to water in external
beam therapy 591 T. Perik, A. Aalbers, L. de Prez, M. Dwarswaard, K. Feyen, J. Hermans, E. Loeff, J. Martens, A. Monseux, E. Peeters-Cleven, N. Planteydt, S. van het Schip, F. Sergent, F. Wittkamper
CN-182-188 Independent dosimetry audits for radiotherapy practices in Syrian Arab Republic using
standard instrumentation kit 593 M. Alnassar, M. Hammudi, M. A. Bero
CN-182-190 Testing, commissioning and validating an optically stimulated luminescense (OSL)
dosimetry system for mailed dosimetry at the Radiological Physics Center 595 J. F. Aguirre, P. Alvarez, G. Ibbott, D. Followill
CN-182-191 A system for mailed dose revision in radiotherapy using lithium formate EPR dosimetry 597
S. Olsson, Z. Malke, P. Larsson, A. Carlsson Tedgren
CN-182-204 Development of guidelines for the use of IMRT and IGRT in clinical trials 599
T. Kron, A. Haworth, D. Comes, M. Grand CN-182-211 TLD postal quality audits for radiotherapy dosimetry in Cuba: Past, present and future
developments 601 S. Gutierrez Lores, G. Walwyn Salas
CN-182-231 Development of methodology for TLD quality audits of MLC shaped photon beams in
radiotherapy 603 S. Luo, Z. He, J. Yuan, B. Yang, K. Li
CN-182-232 Development of national TLD-audit network in Ukraine for postal quality control of
radiotherapy dosimetry 605 M. Pylypenko, L. Stadnyk, O. Shalyopa
xxiv
CN-182-247 Development of TLD audits for radiotherapy dosimetry in Argentina 607
A. M.Stefanic, G. Montafw, L. Molina, M. Saravi CN-182-304 Use of an anthropomorphic phantom to improve the external beam audits in radiotherapy 609
J.L Alonso Samper, R. Alfonso Laguardia., F. Garcia Yip, E. Larrinaga Cortina, S. Patallo
CN-182-309 The status of dosimetry practices in radiotherapy hospitals in developing countries in 2000-
2009: An evaluation using the IAEA/WHO TLD postal dose audits 611 G. Azangwe, P. Bera, J. Izewska
CN-182-344 IAEA support to national TLD audit networks for radiotherapy dosimetry 613
J. Izewska, G. Azangwe, P. Bera
CN-182-348 TLD audits for symmetric and asymmetric photon beams and electron beams in radiotherapy
centers in Poland 615 J. Rostkowska, M. Kania, W. Bulski, B. Gwiazdowska
RADIATION PROTECTION DOSIMETRY
CN-182-031 Personnel monitoring services in Kenya 619
S. Kiti, B. Kaboro, R. Kinyua
CN-182-033 Characterization of secondary radiation field in radiotherapy facilities with reference to a
staff 621 K. Polaczek-Grelik, B. Karaczyn, A. Orlef, A. Konefal, M. Janiszewska, J. Regula
CN-182-045 Determination of the optimum frame of an entrance door to a treatment room with a linear
accelerator generating high energy X rays 623 A. Konefal, W. Zipper
CN-182-070 A 10 year statistical review of occupational doses of cardiology and angiography staff:
Strengthening the radiation protection programme 625 A.N. Al-Haj, I. Al-Gain
CN-182-089 Staff dosimetry in interventional cardiology using electronic personal dosimeters 627
I.I. Suttman, M.K. A. Bashier, S. G. Elnour, I. Salih CN-182-136 Evaluation of radiation protection status in some health centers in the Sudan 629
A. Sulieman, S. Khalifa, M. Elfadil
CN-182-203 Uncertainty assessment in the biokinetic and dosimetric models of "Po: New ingestion dose
coefficients 633 Saidou, S. Baechler, J. Guilherme
xxv
CN-182-216 Optimization of position of skin dose monitor on hands of nuclear medicine staff 635
M. Fiilop, P. Povinec, I. Makaiova, J. Vesely, L. Hornanska, A. Vondrak, Z. Cesnakova, S. Skraskova, K. Aksamitovd, D. Bacek, P. Vlk, J. Kantova, A. Fiiriova
CN-182-235 Comparing calibration factors for gamma and beta radiation of portable detectors 637
F.B.C. Nonato, V. Vivolo, L.V.E. Caldas
CN-182-331 Comparative study of Brazilian and North American unshielded primary air kerma of
radiological equipment 639 P. R. Costa, L. T. Taniguti, T. A. C. Furquim
CN-182-333 Determination of transmission properties of baryte concretes 641
P R. Costa, E.M. Yoshimura
CN-182-355 Medical workers dosimetry comparisons in Kenya 2005 - 2009 643
B. Kaboro, J. Keter
xxvi

Plenary Session 1 Radiation Measurement Standards for Imaging and
Therapy I


IDOS, Vienna, 9-12 November 2010 E2-CN-182, Paper No INV002
What can primary standards do for you? H.M Kramer
Physikalisch-Technische Bundesanstalt, Braunschweig Germany
E-mail address of main author: Hans-Mkhael. [email protected]
In virtually all fields of high-level technology enormous advances have been achieved by continuously perfecting the methodologies. As a result we are offered completely new products or products with a performance which not too long ago had been judged as utterly unrealisable. One impressive example is the enormous increase in circuit density of electronic devices realised over the last two decades or so. This progress was achieved by uniting forces of many disciplines successfully. In this context metrology, the science of measurement plays an indisputably vital role. Without the development of a rugged dimensional metrology chain down to the sub-micron regime the development experienced in electronic circuitry could not have taken place.
Also in other fields of metrology, many national laboratories have actively endeavoured to develop primary standards tailored to the needs of the end user. This process applies to the full extent and may be even especially to the field of dosimetry of ionising radiation. Traditionally, metrology institutes provide calibrations for reference conditions that were largely selected by themselves. For performing external radiotherapy the user is provided with a 60Co-calibration in spite of the fact that he uses in the overwhelming majority of cases fields produced by linear accelerators. By what could be termed a change of paradigm, metrology institutes attempt increasingly to provide standards well matched to clinical needs. The driving forces behind this development are at least two-fold: The ever increasing sophistication of diagnostic and therapeutic methods, like e.g. IMRT to name just one, requires both new measurement techniques and reduced measurement uncertainties in order to realise fully the advantages of new radiological procedures. Secondly, new technical developments appear on the market, demanding for completely new kinds of dose measurements. An example of this kind are miniature x-ray tubes for brachytherapy. With the main emphasis on radiotherapy an overview will be given on the efforts undertaken by metrology institutes in order supply the medical physicist in the clinic with dosimetric tools suitable and adequate for the complete range of current radiological procedures.
3


IDOS, Vienna, 9-12 November 2010 E2-CN-182, Paper No INV002
Primary water calorimetry for clinical electron beams, scanned proton beams and 1 Ir brachytherapy
A. Sarfehnia3, K. Stewart", C. Rossb, M. McEwenb, B. Clasiec, E. Chung3, H. M. Luc, J. Flanzc, E. Cascioc, M. Engelsmanc, H. Paganettf, J. Seuntjens3
a Medical Physics Unit, McGill University, Montreal, Quebec, Canada
b National Research Council of Canada, Ottawa, Ontario, Canada c Massachusetts General Hospital and Harvard Medical School, Boston, MA, USA
E-mail address of main author: [email protected]
The aim of this paper is to develop and evaluate a primary water calorimeter-based standard in clinical high energy electron beams, proton beams, and It' brachytherapy. Currently, for all these beams, a widely used primary standard is non-existent. A water calorimetric standard will allow for the direct measurement of absolute absorbed dose to water Dw.
A transportable Domen-type water calorimeter has been developed in-house at McGill University (FIG 1, FIG 2). The calorimeter consists of a 30x30x20 cm3 Lucite water tank that is surrounded by a sophisticated system of temperature cooling and temperature control. A Pyrex parallel plate calorimeter vessel was used to house two glass-coated bead thermistors (nominal resistance of 10 kO at 4 °C) which were positioned with a nominal 2.4 mm separation centered on the central axis of the beam (FIG 2A). The thermistors act as extremely accurate point temperature detectors. The calorimeter was validated in high energy photon beams against Canada's national standard at the National Resarch Council of Canada (NRC).
In water calorimetry, Dw at a point is determined through a 'point' measurement of local temperature rise AT through: D = c • AT | | k., where c is the specific heat capacity and k\ represent several
correction factors. Heat transfer correction factor ku is defined as the ratio of the ideal temperature rise (a temperature rise solely due to locally deposited absorbed dose in the absence of heat transfer) to the actual temperature rise (with the effects of heat transfer taken into account) at a given point. It is the largest correction factor in water calorimetry and was calculated with the help of COMSOL MULTIPHASICS™ numerical heat transport simulations. It was determined in electron and proton water calorimetry that the temperature gradients formed in water as a result of radiation are too small to cause large convective currents to form. As such, conduction is the dominant mode of heat transfer, and was the only effect that was numerically modeled. In scanned proton dosimetry, the exact details of the scanning procedure was also input into the model. In 19ilr brachytherapy calorimetry, the temperature gradients formed in water primarily due to source selfheating are too large to be ignored. As such, in COMSOL, the 'conduction/convection' module was coupled with the "Navier-Stokes incompressible fluid" module to accurately model the conduction as well as convection modes of heat transfer at nominal temperature of 4 °C both inside and outside the calorimeter vessel.
In clinical ELECTRON beams, the measurement were performed for 5 energies spanning 6-20 MeV, while the point of measurement was taken to be at dKf. In PROTON beams, dose was measured for both double scattering and scanning delivery. In the scattered mode, the dose was measured at the isocenter in a relatively flat portion of the Spread Out Bragg Peak (SOBP) produced by 250 MeV protons, while in scanned beam, the dose was measured at the center of a relatively flat dose distribution painted with 15 layers of proton energies ranging from 128-150 MeV. In mlR BRACHYTHERAPY< an additional holder (see FIG 2B) was mounted onto the vessel to facilitate accurate positioning of the source with respect to the thermistors. A nominal 55 mm source-to-detector
5
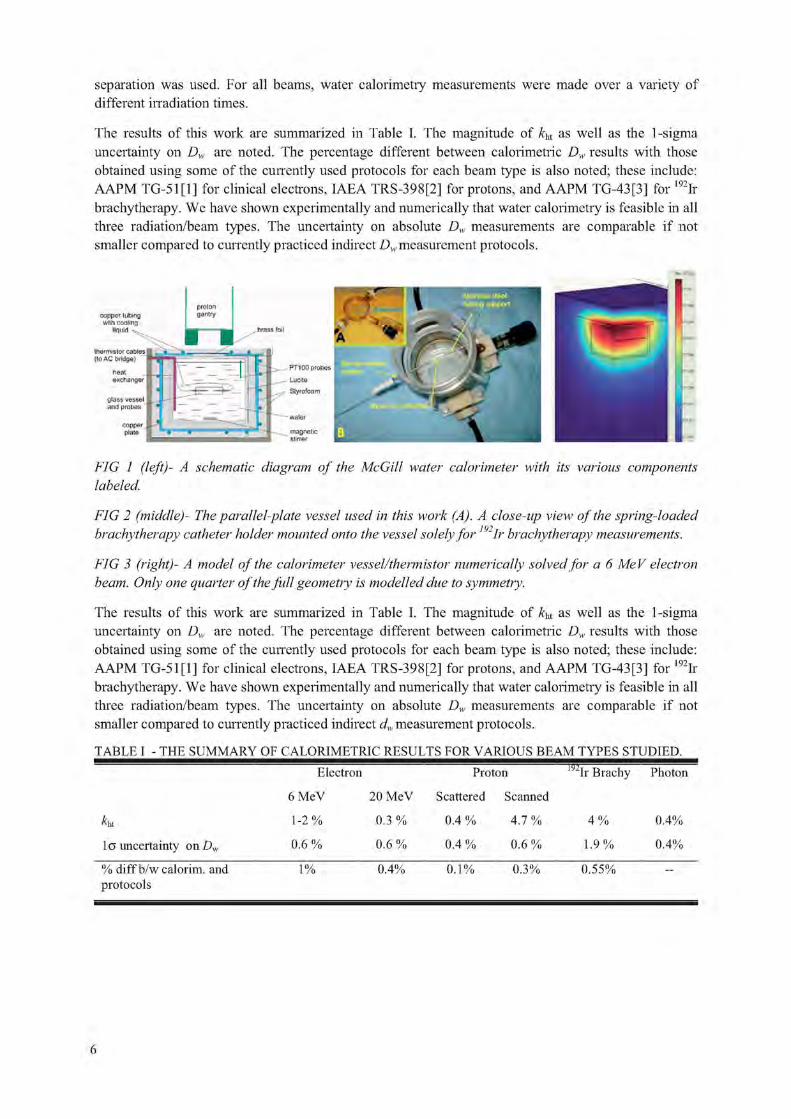
separation was used. For all beams, water calorimetry measurements were made over a variety of different irradiation times.
The results of this work are summarized in Table I. The magnitude of kbt as well as the 1-sigma uncertainty on Dw are noted. The percentage different between calorimetric Dw results with those obtained using some of the currently used protocols for each beam type is also noted; these include: AAPM TCi-5111 ] for clinical electrons, IAEA TRS-398[2] for protons, and AAPM TG-43[3] for 192Ir brachytherapy. We have shown experimentally and numerically that water calorimetry is feasible in all three radiation/beam types. The uncertainty on absolute Dw measurements are comparable if not smaller compared to currently practiced indirect Dw measurement protocols.
thermistor cables (lo AC fridge)
FIG 1 (left)- A schematic diagram of the McGill water calorimeter with its various components labeled.
FIG 2 (middle)- The parallel-plate vessel used in this work (A). A close-up view of the spring-loaded brachytherapy catheter holder mounted onto the vessel solely for ~Ir brachytherapy measurements.
FIG 3 (right)- A model of the calorimeter vessel/thermistor numerically solved for a 6 MeV electron beam. Only one quarter of the full geometry is modelled due to symmetry.
The results of this work are summarized in Table I. The magnitude of /f|U as well as the 1-sigma uncertainty on Dw are noted. The percentage different between calorimetric Dw results with those obtained using some of the currently used protocols for each beam type is also noted; these include: AAPM TG-51[1] for clinical electrons, IAEA TRS-398[2] for protons, and AAPM TG-43[3] for 192Ir brachytherapy. We have shown experimentally and numerically that water calorimetry is feasible in all three radiation/beam types. The uncertainty on absolute L), measurements are comparable if not smaller compared to currently practiced indirect d.y measurement protocols.
TABLE I - THE SUMMARY OF CALORIMETRIC RESULTS FOR VARIOUS BEAM TYPES STUDIED.
Electron Proton 192Ir Brachy Photon
6 MeV 20 MeV Scattered Scanned
K 1 - 2 % 0.3 % 0.4 % 4.7 % 4 % 0.4%
l o uncertainty on Du 0.6 % 0.6 % 0.4 % 0.6 % 1.9% 0.4%
% diff b/w calorim. and protocols
1% 0.4% 0.1% 0.3% 0.55%
6
REFERENCES
[1] P. ALMOND ET AL. "AAPM's TG51 protocol for clinical reference dosimetry of high energy photon and electron beams," Med Phys 26, 1847-1870 (1999)
[2] IAEA TRS-398 "Absorbed dose determination in external beam radiotherapy," 23 Apr 2004
[3] R. NATH ET AL. "Dosimetry of interstitial brachytherapy sources: Recommnedations of the AAPM TG43," Med Phys 22, 209-234 (1995)
7

IDOS, Vienna, 9-12 November 2010 E2-CN-182, Paper No INV002
Results of the direct comparison of primary standards for absorbed dose to water in Co and high-energy photon beams
(El! RAM E I TC-IR Project 1021)*
A. Steurer3, A. Baumgartnera'b, R.-P. Kapschc, G. Stuckid, F.-J. Maringera'b
aBEV - Bundesamt fuer Eich- und Vermessungswesen, Vienna, Austria "Vienna University of Technology, Atomistitut, Vienna, Austria CPTB - Physikalisch Technische Bundesanstalt, Braunschweig, Germany dMETAS - Bundesamt fur Metrologie, Bern, Switzerland
E-mail address of main author: Andreas. [email protected]. at
The BEV graphite calorimeter is in operation since 1983 as an absorbed dose to water primary standard for "Co radiation fields [1], [2], After an extended refurbishment process the energy range was enhanced for application in accelerator fields. For this puipose a set of conversion and correction factors was required. They were obtained utilising Monte Carlo simulations and measurements.
To verify the results of the refurbishment and the enhancement process a project was proposed for the direct comparison of primary standards for absorbed dose to water of BEV, METAS and PTB, in "°Co gamma ray beams and high-energy photon beams. The primary standards used for this comparison were the BEV graphite calorimeter and two water calorimeters (METAS, PTB).
The measurements were earned out in the 60Co gamma ray beams and in high-energy photon beams (4 MV, 6 MV, 10 MV and 15 MV) of METAS and PTB. The BEV transported the graphite calorimeter primary standard to PTB (in September 2008) and METAS (in November 2008).
This was the first time that an absorbed dose primary standard calorimeter of one National Metrology Institute (NMI) was transported to a different NMI for the purpose of a direct comparison in accelerator high-energy photon beams.
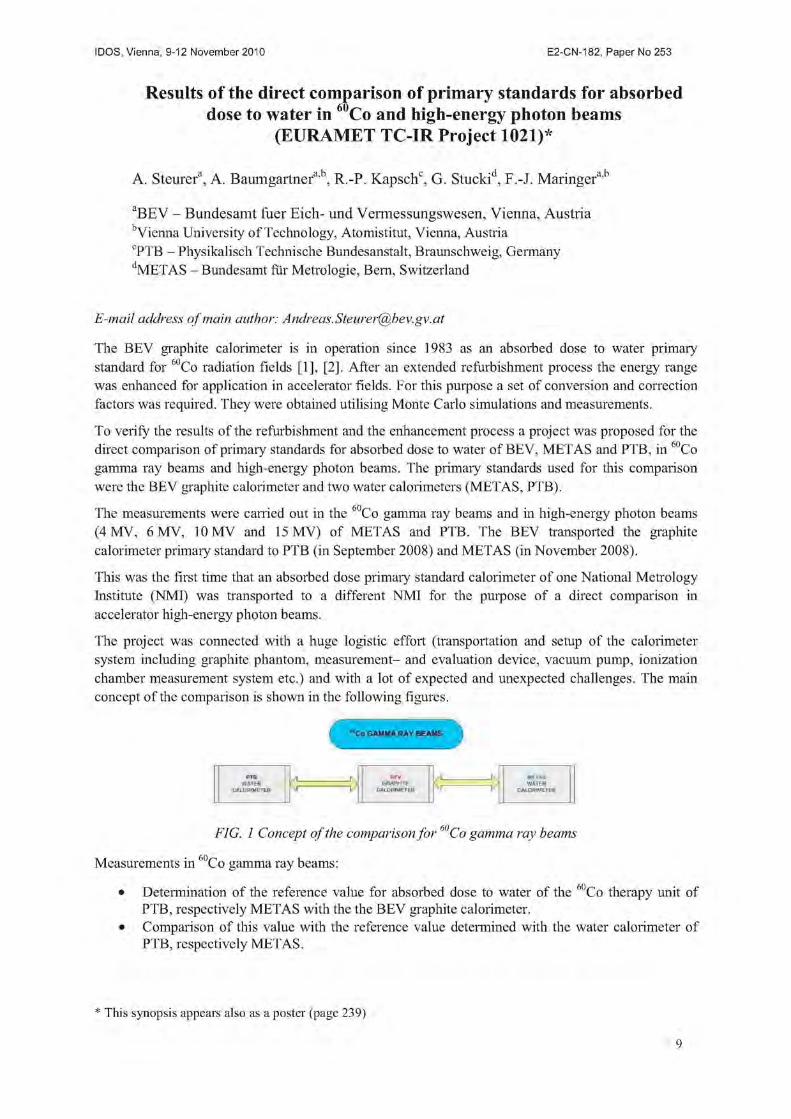
The project was connected with a huge logistic effort (transportation and setup of the calorimeter system including graphite phantom, measurement- and evaluation device, vacuum pump, ionization chamber measurement system etc.) and with a lot of expected and unexpected challenges. The main concept of the comparison is shown in the following figures.
"'Co GAMMA RAY BEAMS
PTB WAITER CALORIMETER A f BUV GHWIfTE CftLORIWETEH N, •BETAS WATER CALCWMETER
PTB WAITER CALORIMETER N k BUV GHWIfTE CftLORIWETEH \i 1/
•BETAS WATER CALCWMETER
FIG. 1 Concept of the comparison for60Co gamma ray beams
Measurements in 60Co gamma ray beams:
• Determination of the reference value for absorbed dose to water of the 60Co therapy unit of PTB, respectively METAS with the the BEV graphite calorimeter.
• Comparison of this value with the reference value determined with the water calorimeter of PTB, respectively METAS.
* This synopsis appears also as a poster (page 239)
9

HIGH ENERGY PHOTON BEAMS
Measurements in high-energy photon beams:
• Determination of absorbed dose to water at the accelerator at PTB, respectively METAS and calibration of an ionization chamber.
• Calibration of the same ionization chamber using an ionization chamber of PTB respectively METAS, calibrated with the water calorimeter of PTB, respectively METAS.
The graphite calorimeter was used in quasi-adiabatic mode to obtain the absorbed dose to graphite. The conversion to absorbed dose to water were done by two methods based on the photon fluence scaling theorem [3]: conversion by calculation (applied for 60Co measurements) and conversion with an ionization chamber (applied for accelerator beam measurements). The use of the first method at the accelerator is affected by two problems:
• The effective (virtual) point of source of an accelerator beam is not well known • There are backscatter influences to the monitor chamber from the graphite phantom as a result
of the small distance according to the photon fluence scaling theorem
For 60Co a deviation of -0,3 % (PTB) and 0,2 % (METAS) was obtained. At the METAS accelerator-deviations between 0,3 % and 0,7 % for the four energies were obtained. Only the results for the PTB accelerators are problematical. Deviations between 1,5 % and 2,2 % were obtained. The reason for the discrepancy seems to be clear. The measurements with the ionization chamber in the graphite phantom were made immediately after the graphite calorimeter measurements with a working temperature of 27 °C. Therefore a temperature effect - which influences the ionization current measurement - is assumed. Considering these circumstances one obtains a shift in the right direction. Unfortunately a retrospective correction is not possible.
Nevertheless, and especially under consideration of the very short measuring time at PTB, respectively at METAS the project was very successful. Only five days were scheduled and necessary for five energies including setups of the graphite calorimeter and calibration of the ionization chambers and of course solving of some of the unexpected problems. The mobile application of the BEV graphite calorimeter was shown impressively. Within a very short time very satisfactory results can be obtained. The results obtained by the different NMI's are widely in agreement. Comparing the ionization chamber calibration coefficients of PTB and METAS for the four considered high-energy photon beam qualities deviations between 0,2 % and 0,9 % were obtained.
REFERENCES
[1] LEITNER A., WITZANI J.: The Realization of the Unit of Absorbed Dose at the Austrian Dosimetry Laboratory Seibersdorf, OEFZS-4740, Februar 1995
[2] WITZANI J., DUFTSCHMID K.E., STRACHOTINSKY CH. & LEITNER A.: A Graphite Absorbed-Dose Calorimeter in the Quasi-Isothermal Mode of Operation, Metrologia 20, 73-79 (1983), Springer-Verlag.
[3] PRUITT J.S., LOEVINGER R.: The photon-fluence scaling theorem for Compton-scattered radiation. Med Phys 9, 1982.
10

IDOS, Vienna, 9-12 November 2010 E2-CN-182, Paper No INV002
The LNE-LNHB water calorimeter:
Measurements in a Co beam
B. Rapp, A. Ostrowsky, J. Daures
CI;A. LIST, Laboratoire National Henri Becquerel (LNE LNHB), F-91191 Gif-sur-Yvette, France
E-mail address of main author: [email protected]
Calorimetry is the best technique available to perform absolute measurement of absorbed dose [1], The energy imparted by ionizing radiations to the mater by mass unit is directly measured, matching the definition of the absorbed dose quantity. Graphite or water calorimeters are mainly used as reference for absorbed dose in water in most of the national metrology laboratories involved in ionizing radiations. LNE-LNHB has a long experience with graphite and tissue-equivalent calorimeters |2|[3|. Graphite calorimeter is still the reference for photon and electron beams dosimetry. Associated with a transfer procedure from graphite to water, it leads to the reference of absorbed dose to water which is the reference quantity for radiotherapy.
The new water calorimeter built mainly consists of a water filled acrylic glass container enclosed in a thick layer of polystyrene. The double wall container is regulated in temperature at 4°C to avoid convection in the water volume. The temperature rise is measured with a thermistor probe positioned inside a quartz vessel containing high purity water.
Heat transfers inside the calorimeter were simulated with a finite elements software in order to improve the design of the different elements ensuring thermal control of the water acrylic phantom. Thermal simulation and absorbed dose distribution simulation by Monte-Carlo method have been used to evaluate the correction factor due to thermal conduction. The perturbation factor of the radiation field caused by the calorimeter materials has been determined both by ionization chamber measurement and Monte-Carlo calculations.
In water, all the energy deposited by radiation is not converted in thermal heat, depending of the content in gases and impurities (heat defect of water). In order to obtain a zero heat defect, high purity water saturated with N> gas is used to fill the measurement quartz vessel. Simulations of the water radiolysis, based on real measurements, have been used to estimate the uncertainty on the heat defect which is the major term of the uncertainty budget.
The new LNE-LNHB water calorimeter has been used in ' Co beam [4]. Measurements under irradiation will be exposed in details and the related uncertainties will be analyzed. The results are compared with the reference of absorbed dose to water established with other primary methods. Absorbed dose to water measured by water calorimeter (FIG 1) presents a dispersion between 1 and 2% but the automation of measurements allows to reduce the uncertainty on the mean value to 0.07% by carrying a large number of irradiations (N=420). The results are in good agreement with the present reference based on graphite calorimetry [5]. The final combined relative standard uncertainty on absorbed dose to water is 0.49% (TABLE 1).
11

f62 O Q
60
58
56
54
52
FIG 1: Absorbed dose to water measured by water calorimeter (black dots), the present reference value in the Co reference beam of the laboratory, based on graphite calorimetry is drawn on same figure (red line).
TABLE 1: UNCERTAINTY BUDGET.
Source of uncertainty Relative uncertainty Value 100 si 100 uj
Temperature probe calibration - 0.1 Temperature probe positioning - 0.3
Specific heat of water (J.kg^.K"1) 4204.8 0.1 Thermal conduction correction factor kc
* 0.1
Radiation field perturbation correction factor kp 1.0032 0.15 Heat defect of water h 0 0.3 Density of water correction factor kp 1.00032 0.01 AT measurement reproducibility (N-420) - 0.07 Quadratic summation 0.19 0.45
Combined relative standard uncertainty on Dw 0.49
* Thermal conduction correction factor (tirr~ 240 s) :
kc = 1.0043, 1.0012, 1.0004, 0.9997
Dw=56.75 +0.28 Gy/h S(DW)/&W=0.49%
„,= 56.77 Gy/h
The new water calorimeter allows a measurement of the absorbed dose to water with a relative standard uncertainty lower than 0.5% complementary to the existing graphite calorimeters. This instrument permits to check the consistency of the laboratory dosimetric references by two independent methods. It is very valuable to operate both graphite and water calorimetry at LNE-LNHB to have a different approach in photon and electron beams for radiotherapy purposes. It will now be used to participate to the new references on accelerator high energy X-ray and electron beams, medium X-ray and proton beams.
12

REFERENCES
[1] J. SEUNTJENS AND S. DUANE, Photon absorbed dose standards, Metrologia 46 (2009) S39-S58.
[2] J. DAURES, A. OSTROWSKY, Test of the new GR9 graphite calorimeter Comparison with GR8, Absorbed dose and air kerma primary standard workshop - 9-11 May 2007, PARIS.
[3] J. DAURES AND A. OSTROWSKY, New constant-temperature operating mode for graphite calorimeter at LNE-LNHB, (2005) Phys. Med. Biol. 50 4035.
[4] B. RAPP, A. OSTROWSKY, J. DAURES, Development of water calorimetry at LNE-LNHB, 14° International Congress of Metrology, 22-25 June 2009, Paris, France.
[5] Report of the 19th meeting of the Consultative Committee for Ionizing Radiation (CCRI), CCRI(I): 19th meeting (May 2009), BIPM, France.
13


IDOS, Vienna, 9-12 November 2010 E2-CN-182, Paper No INV002
Dose conversion for the BIPM graphite calorimeter standard for absorbed dose to water
D. T. Burns
Bureau International des Poids et Mesures
E-mail address of main author: [email protected]
Introduction
The existing standard for absorbed dose to water in ""Co gamma radiation at the BIPM is a parallel-plate cavity ionization chamber [1], The present paper describes a new standard for use in ,0Co and in accelerator photon beams based on a graphite calorimeter.
The realization of the standard can be divided into three major stages: a measurement of the specific heat capacity of the graphite used for the calorimeter construction, as described in [2]; the design and construction of the graphite calorimeter itself, as described in [3]; the conversion from the mean graphite absorbed dose to the calorimeter core, Dc, to the absorbed dose to water at the reference point in a water phantom, Dw. The dose conversion makes use of the Monte Carlo code PENELOPE [4] and experimental measurements using a transfer ionization chamber tailored to the specific needs of the dose conversion.
Principle of the technique
The governing equation for the determination of Dw is
Dw = Qw Nd,c km [4,w,mc / Ak,c,Mc], C1)
where Qw is the ionization charge measured using the transfer chamber positioned with its centre at the reference point in water, NDs is the measured graphite absorbed-dose calibration coefficient for the transfer chamber and km is a measured correction for the radial non-uniformity of the beam. The term in parenthesis is a ratio of calculated 'calibration coefficients'. Expanding the measured and calculated calibration coefficients,
Dw = Dc (Qw / Qc) km [{D ) / ( A , M C / ) , „ , ) I - ( 2 )
where Qc is the ionization charge measured using the transfer chamber in the calorimeter phantom. The parameters DwMC, DcMC, AaVjW and Dcav,c are the calculated equivalents of Dw, Dc, Qw and Qc, respectively. Adopting the notation Cw c for the total calculated conversion:
Dw = Dq (Qw / Qc) km Cw>c. (3)
An important component of the dose conversion is the similarity of the dimensions and materials of the calorimeter and the transfer chamber. Additionally, the chamber has a relatively simple and precisely-known construction, allowing accurate modelling.
Monte Carlo simulations
The calculations are divided into four distinct simulations labelled I, II, III and IV, evaluating DoMc, -Dcav.c, £>cav,w and DwMC, respectively. The geometric models for these are represented schematically in Figure 1.
15

1 i
FIG 1. A schematic representation of the four models used for the Monte Carlo calculations. The radiation field is incident from the left and is indicated by the dashed lines. Model I represents the calorimeter core in its small graphite phantom positioned in an evacuated PMMA phantom. A graphite build-up block centres the core at the reference depth, a mirror at the back reflects radiative heat loss back to the calorimeter. In model II, the calorimeter core and vacuum gap are replaced by the transfer chamber and the PMMA phantom is open to the atmosphere. In model HI, an open-topped PMMA phantom with the same PMMA window thickness is filled with water and the transfer chamber is positioned in a thin waterproof envelope. In model IV, the chamber is removed and the mean absorbed dose to water is calculatedfor a disc of the same dimensions as the air cavity.
Results and uncertainties
Results for Cw>c will be presented for the reference 60Co beam at the BIPM. In the context of a programme of key comparisons of Dw standards for high-energy photon beams, the new standard was transported to the accelerators of the NRC in June 2009 and the PTB in March 2010, and is scheduled to be used at the NIST in September 2010. Results will be presented for these beams, evaluated using phase-space information supplied by each laboratory.
A detailed analysis has addressed uncertainties associated with simulated geometries, radiation transport mechanics, interaction coefficients and phase-space spectra. The results suggest a standard uncertainty for CWiC below 0.25 %. Additionally, in connection with the comparison at the NRC, calculations of Cw>c for the BIPM standard were made by the NRC [5] using the EGSnrc code [6], Agreement between the BIPM and NRC calculations at the 0.2 % level strongly supports the uncertainty analysis and the view that the symmetry of the method results in a low sensitivity to the details of the Monte Carlo calculations.
REFERENCES
[1 ] BOUTILLON M AND PERROCHE A-M 1993 Ionometric determination of absorbed dose to water for cobalt 60 gamma rays Phys. Med. Biol. 38 439-54
[2] PICARD S, BURNS D T AND ROGER P 2007 Determination of the specific heat capacity of a graphite sample using absolute and differential methods Metrologia 44 294302
[3] PICARD S, BURNS D T AND ROGER P 2009 Construction of an absorbed-dose graphite calorimeter Rapport BIPM-2009/01 (Sevres: Bureau International des Poids et Mesures)
[4] SALVAT F, FERNANDEZ-VAREA J M, ACOSTA E AND SEMPAU J 2003 PENELOPE - a code system for Monte Carlo simulation of electron and photon transport Workshop Proc. (Issy-les-Moulineaux, France 7-10 July) (Paris: OECD)
[5] PICARD S, BURNS D T, ROGER P, MCEWEN M, COJOCARU C AND ROSS C 2009 Comparison of the calorimetric standards for absorbed dose to water of the NRC and the BIPM for clinical accelerator beams Metrologia Technical Supplement (to be published)
[6] KAWRAKOW I AND ROGERS D W O 2000 The EGSnrc code system: Monte Carlo simulation of electron and photon transport Technical Report PIRS-701 (Ottawa, Canada: National Research Council of Canada) http://www.irs.inms.nrc.ca/EGSnrc/pirs701 .pdf
16

Plenary Session 2
Radiation Measurement Standards for Imaging and Therapy II

IDOS, Vienna, 9-12 November 2010 E2-CN-182, Paper No INV002
What colour is 'your gray'?
P.J. Allisy-Roberts
Bureau International des Poids et Mesures, F-92312
E-mail address of main author: [email protected]
The quantities air kernia and absorbed dose to water are both measured in terms of J/kg which for dosimetry has been allocated the special name of gray. However, unless these measurements are traceable to the SI, there is no way in which a gray measured in one laboratory or hospital for a given quantity can be shown to be equivalent to another measurement of the same quantity. The International Committee for Weights and Measures (CIPM) recognizing this fact for all SI units, established in 1999 a Mutual Recognition Arrangement (MRA) [1] whereby all signatory national metrology institutes (NMIs) could demonstrate such equivalence through the participation in international key comparisons and thereby be able to claim equivalence for their calibration and measurement capabilities. To date, 77 institutes from 48 Member States, 26 Associate States of the General Conference and 3 international organizations, including the IAEA, have signed the CIPM MRA.
The Bureau International des Poids et Mesures (BIPM) being the laboratory set up under the Metre Convention in 1875 for the traceability of the SI, established an ionizing radiation laboratory in 1960 with the strong support of the NMIs and in particular the International Committee on Radiation Units and Measurements (ICRU). Radiation dosimetry comparisons were started in the early 1960s and a continuing series of BIPM on-going comparisons [2] enables every Member State to claim traceability to the SI either directly through the BIPM, through another NMI that holds equivalent primary standards or via the IAEA Dosimetry Laboratory programme for the SSDL Network [3].
The presentation will demonstrate the degrees of equivalence of the gray held by the Member States and Associate States through BIPM and other international comparisons run by the Regional Metrology Organizations (RMOs) into which the IAEA dosimetry capabilities are linked. An example as at April 2010 is given in Figure 1. The CIPM MRA key comparison database (KCDB) contains up to date details of all degrees of equivalence [4].
Other ionizing radiation dosimetry quantities also require traceability, such as ambient or personal dose equivalent and these are often compared by supplementary comparisons as the uncertainties are generally larger than for key comparisons [5],
Activity measurements also need to be traceable to the SI and so key comparisons are held for the determination of the becquerel, for a large number of different radionuclides. The BIPM operates the Systeme International de Reference (SIR) for gamma-emitting radionuclides [6]. The SIR enables any NMI to submit an ampoule of a radioactive solution or gas to the SIR and obtain a normalized value of equivalent activity that can be instantly compared against all other such measurements for the same radionuclide. Figure 2 shows a snapshot as at April 2010 for activity measurements of 60Co. Comparisons of radionuclide activity within the RMOs can be linked via the SIR comparisons, as will be shown.
19

BIPM.RI(I)-K1, SIM.RI(I) K1 (2002), COOMET.RI(l)-K1 (2006} and EUROME".RI(l)-K1 (2005 to 2008) Degrees of equivalence with the KCRV for air kerma in a ,Co
h f . T . f % -{- - - - - -I- -L -1 - - -i- H- --H W -II - I " - 1 1. -5 -
-15 — -
N.B. Black squares indicate results that are more than 10 years old.
FIG 1. A snapshot of degrees of equivalence for 60Co air kerma measured by BIPM Member States and some Associate States that have taken part in BIPM or RMO comparisons. The NMI acronyms are given in the key comparison database of the CIPMMRA.
BIPM.RI(II)-K1 .Co-60 Degrees of equivalence for equivalent activity of 'Co
? & !i a
150 100 50 O
-50 -100 -150
J T T { T I I T T , " , , I I 1
- 1 1 5 1 1
" 1
j I1
> I 1 •
21 14 7 1 O &
1 *
-/ £
-14 -21
i fl tf I
N.B. Black square dates pre 1990. Right-hand axis s h o w s approximate values only.
FIG 2. A snapshot of degrees of equivalence for 60Co. activity measurements made by BIPM Member States that have taken part in the BIPM SIR comparisons. The NMI acronyms are given in the key comparison database of the CIPM MRA.
REFERENCES
[1] CIPM MRA: Mutual recognition of national measurement standards and of calibration and measurement certificates issued by national metrology institutes. International Committee for Weights and Measures, 1999, 45 pp. http://www.bipm.org/pdf/mra.pdf.
[2] BIPM, 2009, Technical protocol for ongoing BIPM dosimetry comparisons.
[3] IAEA, 1999, SSDL Network Charter IAEA, Vienna, 1999 IAEA/WHO/SSDL/99
[4] BIPM, the Key Comparison database of the CIPM MRA, http://kcdb.bipm.org
[5] ANKERHOLD U. ET AL, 2002, EUROMET.RI(I)-Sl: personal dose equivalent comparison between the BEV and the PTB, 2002 Metrologia 39 06010
[6] RATEL G., The Systeme International de Reference and its application in key comparisons, Metrologia, 2007, 44(4), S7-S16.
20

IDOS, Vienna, 9-12 November 2010 E2-CN-182, Paper No INV002
Design and principles of a graphite calorimeter for brachytherapy
T. Sander, H. Palmans, S. Duane, M. Bailey, P. Owen
National Physical Laboratory, Hampton Road, Teddington, TW11 OLW, United Kingdom
E-mail address of main author: [email protected]
The use of high dose rate (HDR) brachytherapy has increased worldwide over recent years with 192Ir now being the most commonly used radioisotope for HDR brachytherapy [1], Brachytherapy dosimetry for gamma ray sources is currently based on source calibrations in terms of reference air kerma rate (RAKR) or air kerma strength (AKS) [2]. However, the quantity of interest is the absorbed dose rate to water at a distance of 1 cm from the source centre, Dw, which is currently calculated from RAKR or AKS by applying the formalism described in the AAPM Task Group 43 protocol [3] and update TG-43U1 [4], Like for external beam radiotherapy dosimetry, there is now growing need for accurate brachytherapy source dosimetry traceable to national absorbed dose primary standards.
A novel absorbed dose graphite calorimeter for the measurement of HDR 1' Ir brachytherapy sources was designed and built at the National Physical Laboratory (NPL). Calorimetry is based on the assumption that all or a known fraction of the absorbed radiation energy appears as heat, so that the measurement of absorbed dose reduces to a measurement of a temperature change. Compared to existing external beam calorimeters, the design of the brachytherapy calorimeter was optimised in order to deal with large dose gradients close to the source and the self-heating of the radioactive source. Monte Carlo (MC) simulations (EGSnrc, version V4-r2-2-5) [5] and heat transfer simulations (COMSOL Multiphysics version 3.3a) [6] were used to derive the basic design of the calorimeter. The initial heat transfer simulations showed that the calorimeter should be operated under vacuum.
The graphite calorimeter comprises an annular core (minimum radius = 24 mm, maximum radius = 26 mm, height = 5 mm) and four graphite cylinders providing build-up and full scatter conditions at the point of measurement. The annular core is surrounded by a 1 mm vacuum gap in order to reduce the heat transfer from the point of measurement to the outer graphite phantom, and together with two further 0.25 mm wide vacuum gaps in the graphite cylinder, this shields the core from the self-heating of the source. Each of the five graphite pieces contains four sensing thermistors and four heating thermistors, allowing the operation in adiabatic or thermostatic mode. Various types of HDR brachytherapy sources can be located at the geometric centre of the cylindrical graphite phantom (radius =10 cm, height =14 cm) and the sources can be inserted through an aluminium tube which is connected to a vacuum housing which fully encloses the graphite calorimeter.
The new brachytherapy calorimeter realises absorbed dose to graphite at a reference distance of 2.5 cm. In this work, correction and conversion factors were determined by MC simulations based on the final design. These factors include the graphite-to-water conversion factor, and perturbation correction factors which are the volume averaging correction factor (1.0024 ± 0.0008), the impurity correction factor (0.9997 ± 0.0003), the vacuum gap correction factor (0.9992 ± 0.0004), the inhomogeneity correction factor (1.0008 ± 0.0004) and the full scatter correction factor (1.0060 ± 0.0005).
An MC-calculated dose map of the final design of the calorimeter and a Nucletron microSelectron v-1 'classic' HDR 192Ir source was used in a refined heat transfer model where both the heat flow due to the source self-heating and the distributed radiation heating were investigated. The heat transfer model was validated by measuring the response of the calorimeter using a dummy heat source.
21

Progress on the commissioning of the calorimeter and the likely impact on future brachytherapy dosimetry will be reported. NPL's new brachytherapy calorimeter offers the possibility of a direct measurement of Dw and a potential reduction in the overall uncertainty associated with brachytherapy dosimetry.
REFERENCES
[1] THOMADSEN, B. R., RIVARD, M. J. AND BUTLER, W. M. (eds.), Brachytherapy Physics, AAPM Medical Physics Monograph No. 31 (2005), 59-74.
[2] SANDER, T. AND NUTBROWN, R. F., The NPL air kerma primary standard TH100C for high dose rate 192Ir brachytherapy sources, NPL Report DQL-RD 004 (2006).
[3] NATH, R., ANDERSON, G., LUXTON, K. A., WEAVER, K. A., WILLIAMSON, J. F. AND MEIGOONI, A. S,, Dosimetry of interstitial brachytherapy sources: Recommendations of the AAPM Radiation Therapy Committee Task Group No. 43. Med. Phys. 22 (1995), 209-234.
[4] RIVARD, M. J., COURSEY, B. M., DEWERD, L. A., HANSON, W. F., SAIFUL HUQ, M„ IBBOTT, G. S„ MITCH, M. G., NATH, R. AND WILLIAMSON, J. F., Update of AAPM Task Group No. 43 Report: A revised AAPM protocol for brachytherapy dose calculations, Med. Phys. 31 (2004), 633-674.
[5] KAWRAKOW, I. AND ROGERS, D. W. 0. , The EGSnrc code system: Monte Carlo simulation of Electron and Photon Transport, NRCC Report PIRS-701 (2006).
[6] Cortisol MultiphysicsTM Reference Manual Version 3.3a, Stockholm: Cortisol AB (2007).
22

IDOS, Vienna, 9-12 November 2010 E2-CN-182, Paper No INV002
Development of a primary standard in terms of reference air kerma rate for 125I brachytherapy seeds
I. Aubineau-Laniece, J.M. Bordy, B, Chauvenet, D. Cutarella, J. Gouriou, J. Plagnard
CEA, LIST, Laboratoire National Henri Becquerel, 91191 Gif-sur-Yvette Cedex, France;
E-mail address of main author: [email protected]
The LNE-LNHB is currently developing the French primary standard in low dose rate brachytherapy. The method is based on a free-in-air ionization chamber for 125I seeds. Such sealed radioactive sources are used for treatment of ophthalmic and prostatic cancers. Low dose rate brachytherapy seeds are of small size, about 0.8 mm in diameter and 4.5 mm in length, cylindrically shaped and of complex internal design. This causes an anisotropy of emission in both planes, longitudinal and transverse. The reference air kerma rate is theoretically defined in this latter plane at a point positioned in a small volume of air at a one meter distance from the source center, the source and the air volume being surrounded by vacuum. To overcome the difficulties linked to a transversal anisotropic emission and to an expected low signal-to-noise ratio, a circular ring-shaped free-in-air ionization chamber has been designed. The 125I source seed is placed at the center of this ring detector in a tube of a low attenuated material, as shown on figure 1.
FIG 1. Primary standard device developed to assess the reference air kerma rate
This paper presents an extended characterization of the circular ring-shaped free-in-air ionisation chamber. This one deals with the signal-to-noise ratio optimization, the detection volume assessment (taking into account the electric field distribution within it) and the sensitivity of the measurement linked to the source positioning. Furthermore, the correction factors to apply to the measurement results are described and their estimation using Monte Carlo codes of particle transport are presented for the Bebig iodine seed sources, referenced 1125 SI6.
23


IDOS, Vienna, 9-12 November 2010 E2-CN-182, Paper No INV002
Analysis of the tandem calibration method for kerma-area product meters via Monte Carlo simulations
A. Malusek, G. Aim Carlsson
Division of Radiation Physics, Linkoping University, SE-581 85, Linkoping, Sweden
E-mail address of main author: [email protected]
The kerma-area product PKA is defined as
PKA= J AKC,AIRDA (1)
where KC llir is the air collision kerma, and A is the integration area at a reference plane perpendicular to the beam axis. The kerma-area product is measured by KAP-meters. The calibration coefficient of a KAP-meter is affected by the choice of the reference plane and integration area [1], A procedure standardizing the measurement of the calibration coefficient was proposed in [2]. In this beam area method, the reference KAP-meter is placed at the distance of 100 cm from the focal spot. The field KAP-meter is placed between the reference KAP-meter and the focal spot; its precise location is not critical. The main advantage of this method is that the field KAP-meter measures /JK A at a plane close to the patient. The disadvantage is that photons scattered in the field KAP-meter and collimator housing may pass beside the relatively small reference KAP-meter. To mitigate the problem, the tandem calibration method was proposed, see [3]. In this method, the reference KAP-meter is placed at an optimal distance from the field KAP-meter so that (i) it registers most of the radiation passing through the field KAP-meter, and (ii) the amount of radiation backscattered from the reference KAP-meter does not significantly affect the signal of the field KAP-meter. A suitable distance was found to be 30-40 cm for the Diamentor M4 (PTW) KAP-meters, and the distance of 30 cm was recommended in general. Measurements showed that the difference between the beam area and tandem calibration methods is relatively small. The aim of our work was to obtained more detailed information about this difference via computer simulations.
The MCNP Monte Carlo code was used to calculate /ka values for an ideal reference KAP-meter placed at (i) the distance of 30 cm from the field KAP-meter and (ii) the patient plane 100 cm from the focal spot; these positions correspond to calibrations via the tandem and beam area methods, respectively, see Fig. la. The VacuTec's type 70157 field KAP-meter was modelled using a set of cylinders with radii of 8 cm, see Fig. lb. X-ray spectra were taken from the catalogue of x-ray spectra and filtered with 5 mm of Al. Beam radius was 5.24 cm at 100 cm from the focal spot.
Fig. 2a shows that the tandem calibration method underestimated j°ka values at the patient plane by approximately 2.5% for the tube voltage of 40 kV. A larger integration area (r > 8 cm) resulted in a smaller relative difference, about 1.5% for the radius of 20 cm. Variations between results for different x-ray tube voltages were mostly caused by attenuation of the beam in air; this follows from a comparison of Fig. 2a with Fig. 2b. The latter contains results calculated in a geometry where air surrounding the field KAP-meter was replaced with vacuum. Also note that although the relative difference in figure 2b is less than 1% for the radius of 32 cm, the function PIC.IP(R)/ IjKA, is known to diverge to infinity for large r in vacuum [1],
25

30.0 cm
30.0 cm
100 cm
field KAP-meter
ideal reference KAP-meter
patient plane
outer wall air cavity inner wall conductive coating
FIG. 1: (a) Schematic view of the simulation geometry. The ideal reference KAP-meter was positioned 30 cm from the field KAP-meter. The kerma-area product, PKAp, ctt the patient plane was expressed as a function of the integration area radius r. (b) The cylindrical field KAP-meter consisted of air cavities, and inner and outer walls covered with conductive coating. (The figures are not to scale).
1.000 0.995
0.990
0.985
0.980
0.975
0.970
1.010
1.005
1.000
0.995
x-ray tube (b) R = 8 cm
radius / cm radius / cm FIG.2: The ratio PKAPO')/ PKAI, where Picip(t') is the kerma-area product at the patient plane as a function of the radius r, and PKAr is the kerma-area product measured by the ideal reference KAP-meter at the position used for tandem calibration, (a, left) The field KAP-meter was placed in air. (b, right) The field KAP-meter was placed in vacuum.
REFERENCES
[1] MALUSEK, A.; LARSSON, J. P.; CARLSSON, G. A., Monte Carlo study of the dependence of the KAP-meter calibration coefficient on beam aperture, x-ray tube voltage and reference plane, Phys. Med. Biol., 52(4) 2007, 1157-70
[2] INTERNATIONAL ATOMIC ENERGY AGENCY, Dosimetry in diagnostic radiology: an international code of practice, Technical Report Series no. 457, Vienna, Austria (2007)
[2] TOROI, P., KOMPPA, T. and KODUNEN A., A tandem calibration method for kerma-area product meters, Phys. Med. Biol., 53(2008) 4941-4958
26

IDOS, Vienna, 9-12 November 2010 E2-CN-182, Paper No INV002
Determination of absorbed dose to water in megavoltage electron beams using a calorimeter-Fricke hybrid system
C. D. Cojocaru, G. Stucki, M. R. McEwen, C. K. Ross
Institute for National Measurement Standards, National Research Council, Ottawa, ON, Canada
E-mail address of main author: [email protected]
The Fricke dosimeter solution is a dilute aqueous system formed by adding sulfuric acid and ferrous ammonium sulfate to aerated, high-purity, water. The concentration of Fe3+ ions is proportional to the absorbed dose deposited in the solution and is usually measured using UV absorption spectroscopy. Contaminants can significantly affect performance and therefore great care must be taken during preparation and readout. Traditionally, Fricke solution has been irradiated in solid vials, usually made of quartz or glass, but this can lead to significant corrections for the holder. The innovative approach taken here is to irradiate the Fricke in sealed polyethylene bags. This eliminates any wall correction and allows one to custom design the dosimeter shape to the application. For the measurements in electron beams the bag size was approximately 40 mm x 40 mm x 3 mm, with a Fricke volume of 4
Irradiations were carried out using the Elekta Precise linac at the NRC, which produces electron beams with nominal energies of 4, 8, 12, 18 and 22 MeV. The dosimeters were placed at zref
(according to TG-51) in a water phantom and doses in the range 7 Gy to 50 Gy were delivered to investigate signal-to-noise and any dose dependence. The irradiations were carried out over a period of five months to evaluate the long-term repeatability of the system.
It was found that the contaminating effect of the polyethylene bag on the absorbance signal was small and could be accurately corrected for using unirradiated controls and carefully controlling the time from filling each bag to readout. The average repeatability on a single dosimeter was 1.1%. Figure 1 shows the variation in absorbance with dose delivered for the 18 MeV beam. In this case the reference is the primary standard water calorimeter [1], As can be seen the relation is linear and the standard uncertainty in the gradient is estimated to be 0.2%.
The hybrid nature of the system is that a Fricke calibration factor is obtained using the NRC primary standard water calorimeter in a high energy electron beam (>18 MeV) and then we use the results of Stucki et til, [2] on the energy-independence of the absorbed dose dependence of the Fricke dosimeter to determine the dose in low energy electron beams. This gives us a system that can determine the absolute absorbed dose over the complete range of energies available from a clinical linear accelerator. As a first test we determined experimental k0 factors for a number of ionization chambers. Figure 2 shows the results of this investigation for the PTW Roos parallel-plate chamber, comparing measurement to the TG-51 protocol. The data are normalized at the 18 MeV beam point (R50 == 7 cm). The standard uncertainty in the experimental determination of the energy dependence (k'Rs„) is estimated to be 0.5%. The experimental energy dependence deviates from that predicted by TG-51 at low energies and is in good agreement with recent Monte-Carlo investigations of chamber perturbation corrections.
27

c 3
- p (0 <1) o c (0 - p
o w> X! <
200.0
180.0 160.0 140.0 120.0 100.0 80.0 60.0 40.0 20.0
0.0
/
/
0 20 40
Dose (Gy)
3%
2% CT 2 00
E o
1%
0%
5 -1% T3 CD >
jo - 2 % <1) cc -3%
20 *. 40 • 6
Dose (Gy)
FIG 1. Calibration curve for Fricke dosimeter. The inset plot shows the deviation from a straight line.
R 5 0 ( c m )
FIG 2. Energy dependence in electron beams for PTWRoos chamber.
REFERENCES
[1] McEWEN M R and DUSAUTOY A R "Primary standards of absorbed dose for electron beams" Metrologia 46 S59-S79 (2009)
[2] STUCKI G, MUENCH W and QUINTEL H "The METAS absorbed dose to water calibration service for high energy photon and electron beam radiotherapy" Proc. Int. Symp. on Standards and Codes of Practice in Medical Radiation Dosimetry (Vienna, Austria 2002) (Vienna: IAEA) (2003)
28

Parallel Session 3a
Reference Dosimetry and Comparisons in External Beam Radiotherapy I


IDOS, Vienna, 9-12 November 2010 E2-CN-182, Paper No INV002
Ten Years After: impact of recent research in photon and electron beam dosimetry on TRS-398
H Benmakhlouf, P Andreo
Medical Radiation Physics, Stockholm University and Karolinska Institute, Sweden
E-mail address: [email protected]
Ten years after the publication of the IAEA TRS-398 Code of Practice for reference radiotherapy dosimetry in 2000 [1] is a reasonable period to analyze the impact of the research made in this field. The use of experimentally determined NDiW,o calibration coefficients and ko.oo beam quality factors for the user chamber, the preferred option in TRS-398, is a practice becoming more common each day, following the increased availability of absorbed dose to water national primary standards [2]. It is also the most suitable procedure to verify the calculated kg.g0 values in TRS-398 using perturbation correction factors derived between 15 and 30 years ago and those which would result from the adoption of recent Monte Carlo calculations. It is emphasized that the new MC results available are restricted to a few cylindrical and plane-parallel chambers. Furthermore, most results are still based on the classical approach of assuming independent perturbation correction factors due to different chamber components, rather than simulating in detail real ionization chambers and deriving an overall correction.
In the case of megavoltage photon beams, new MC data agree quite well with the values in TRS-398 with the exception of the NE-2571 Farmer-type chamber. Experimentally determined beam quality correction factors kg for a this chamber as a function of beam quality are shown in Fig. 1, where data compiled in ref. [3] have been updated and complemented according to new publications; a sigmoid weighted fit is included in the figure. Data for the pdis, pwaU and pcel of a NE-2571 chamber have been calculated by several authors using the EGSnrc MC system. For each factor, we have fitted the set of data available using robust techniques (MatLab) which minimize the influence of outliers, and derived corresponding kg values. A comparison with the kg data in TRS-398 (Fig. 2) shows that the difference between the two kg datasets is very pronounced at the highest energies, and that experimental results fall between TRS-398 and the new MC data. Overall uncertainties in calculated kg would not decrease by more than 0.1%-0.2%, as both sWMir and Wair dominate the overall uncertainty with their estimates of 0.5% [1]. Considering the small differences involved between the new data for some chambers and TRS-398, the lack of experimental and calculatcd data for most commercial chambers, and the additional uncertainty caused by the need of adopting new I-values and stopping powers, it can be concluded that time has not arrived yet for recommending changes in TRS-398. Fully detailed simulations of ionization chambers, verified experimentally, would be preferred to the use of independent perturbation correction factors, as well as data for a larger set of commercial chambers, preferably using other MC systems too, to avoid potential bias.
For electron beams substantial differences with TRS-398 have been found for pp-chambers, particularly NACP at low energies. TRS-398 assumed pcm, to be unity for "well-guarded" plane parallel (pp) chambers; despite evidence that wall effects introduce a non-negligible pwaU, the lack of reliable data led to recommend this factor to be unity too. Using MC calculations, mostly simulating NACP pp-chambers with EGSnrc, several publications have concluded that both perturbation correction factors differ from unity. The evidence for pwaU, including its energy dependence, appears to be consolidated, varying approximately between 1-2% for R50 between 8 cm and 1 cm respectively. There is, however, a considerable spread in the data for pcm, (discrepancies larger than 1% at some energies are shown in Fig. 3) despite having used the same MC code and chamber geometry, which
31
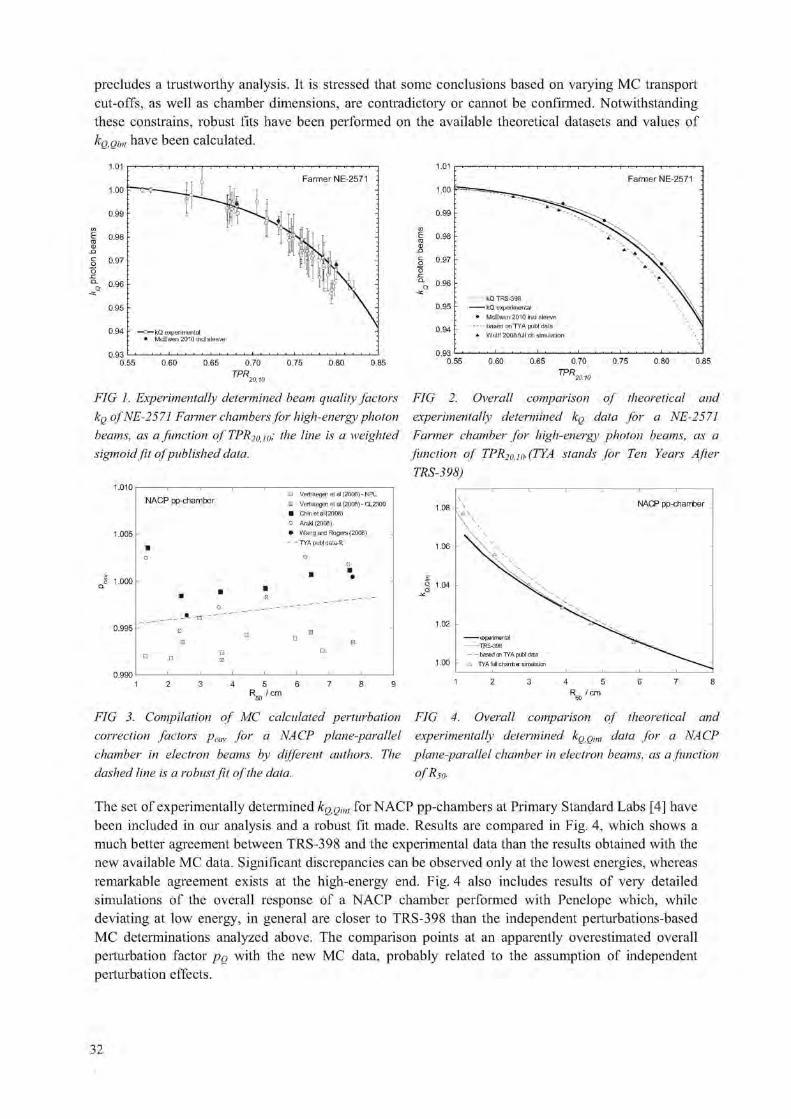
precludes a trustworthy analysis. It is stressed that some conclusions based on varying MC transport cut-offs, as well as chamber dimensions, are contradictory or cannot be confirmed. Notwithstanding these constrains, robust fits have been performed on the available theoretical datasets and values of %omf have been calculated.
FIG 1. Experimentally determined beam quality factors kg of NE-2571 Farmer chambers for high-energy photon beams, as a function of TPR2OJO! the line is a weighted sigmoid fit of published data.
1 . 0 1
1 . 0 0
0 . 9 9
0 . 9 8
0 . 9 7
0 . 9 6
0 . 9 5
0 9 4
0 . 9 3 0 . 5 5
Farmer NE-2571 :
kQ TRS-398 kQ experimental
• McEwen 2010 incl sleeve - based on TYA publ data
* Wulff 2008 full ch simulation
0 . 6 0 0 . 6 5 0 . 7 0 0 . 7 5 0 . 8 0 0 . 8 5
FIG 2. Overall comparison of theoretical and experimentally determined ICQ data for a NE-2571 Farmer chamber for high-energy photon beams, as a function of TPR>,. ,»(TYA stands for Ten Years After TRS-398)
NACP pp-chamber
1 . 0 0 5 h
H Vertiaegen etal (2006)-NPL : Vertiaegen et al (2006) - CL2300 • Chin etal (2008) o Araki (2008) • Wang and Rogers (2008)
- - TYA publ data-fit
0 . 9 9 5 h
1.08 . \ \
A
\
\ \
NACP pp-chamber
1.06
1.04
1.02
1.00
experimental TRS-398 based cn TYA publ data
A TYA full charrber simulation
4 5 6 R „ /cm 4 5
R /cm
FIG 3. Compilation of MC calculated perturbation correction factors pcm, for a NACP plane-parallel chamber in electron beams by different authors. The dashed line is a robust fit of the data.
FIG 4. Overall comparison of theoretical and experimentally determined ICQQU,, data for a NACP plane-parallel chamber in electron beams, as a function ofRS0.
The set of experimentally determined /c, ,.,>,•„. for NACP pp-chambers at Primary Standard Labs [4] have been included in our analysis and a robust fit made. Results are compared in Fig. 4, which shows a much better agreement between TRS-398 and the experimental data than the results obtained with the new available MC data. Significant discrepancies can be observed only at the lowest energies, whereas remarkable agreement exists at the high-energy end. Fig. 4 also includes results of very detailed simulations of the overall response of a NACP chamber performed with Penelope which, while deviating at low energy, in general are closer to TRS-398 than the independent perturbations-based MC determinations analyzed above. The comparison points at an apparently overestimated overall perturbation factor po with the new MC data, probably related to the assumption of independent perturbation effects.
32

Data for 60Co y-ray beams play a fundamental role in electron beam dosimetry, both using cylindrical and pp-chambers, as the data enter into kg calculations and whenever pp-chambers are cross-calibrated against cylindrical chambers. An important achievement for the pwau of NACP pp-chambers is that the value recommended in TRS-398 has practically been confirmed with independent MC calculations using both EGSnrc and Penelope at an uncertainty better than 0.1%. It is then remarkable that the uncertainty in ko becomes considerably reduced, eliminating the major constrain for the use of 60Co-calibrated NACP chambers, and thus its k() factors, for electron beam dosimetry as well as for other charged particle beams (protons and carbon ions).
The use of a cylindrical chamber in electron beams, either for a direct Dw determination or for pp-chamber cross-calibration, acquires particular relevance if the new MC calculated values of perturbation correction factors for Farmer chambers in 60Co would be taken into account. It is emphasized that the suggested overall increase of 1.5% ofpg, compared with TRS-398, would appear in the denominator and therefore decrease kg (of electrons) by the same amount. As a result, the Dw
used for a cross-calibration and all relevant kg factors for pp-chambers would also decrease by approximately the same amount, as the new electron perturbation factors discussed above do not compensate for such large increase. Only for very low electron energies where pg approximates 1% there would be a partial balance, but the large difference would persist at medium and high energy. In addition, excellent experimental agreement (at the level of 0.2%) exists between electron dosimetry based on NACP chambers which have been either cross-calibrated or calibrated directly in p"Co at a standards laboratory. The decrease in absorbed dose of about 1.5% discussed here would yield a considerable discrepancy with such current evidence, which is not likely to be in error by such large amount. The need for finding a solution which provides consistent dose determination in the entire electron (and photon) energy range, irrespective of the procedure used, remains as a major priority.
REFERENCES
[1] ANDREO, P., BURNS, D. T„ HOHLFELD, K„ HUQ, M. S„ KANAI, T„ LAITANO, F„ SMYTH, V. and VYNCKIER, S., Absorbed dose determination in external beam radiotherapy: An international code of practice for dosimetry based on standards of absorbed dose to water, International Atomic Energy Agency, Vienna, IAEA Technical Report Series No. 398 (2000).
[2] ALLISY, P. J., BURNS, D. T. and ANDREO, P., International framework of traceability for radiation dosimetry quantities. Metrologia 46 (2009) S1-S8.
[3] ANDREO, P., A comparison between calculated and experimental kg photon beam quality correction factors. Phys. Med. Biol. 45 (2000) L25-L38.
[3] McEWEN, M. R. and DUSAUTOY, A. R„ Primary standards of absorbed dose for electron beams, Metrologia 46 (2009) S59-S79.
33


IDOS, Vienna, 9-12 November 2010 E2-CN-182, Paper No INV002
Beam quality correction factors for plane parallel chambers in photon beams
R.P. Kapsch3,1. Gomolab
aPhysikalisch-Technische Bundesanstalt (PTB), Braunschweig, Germany
bIBA Dosimetry, Schwarzenbruck, Germany
E-mail address of main author: [email protected]
According to modern dosimetry protocols for external beam radiotherapy (e.g. 0) the absorbed dose to water Av,o in a photon beam of beam quality Q can be obtained by
(1)
Here MQ is the reading of an ionization dosimeter in the photon beam of quality Q (which has already been corrected for all other influence quantities except the beam quality), NDtW is the calibration factor in terms of absorbed dose to water obtained in a 60Co beam, and 1<q is the beam quality correction factor which corrects for the different response of the ionization chamber in the 01 Co beam and the photon beam of quality Q. For cylindrical ionization chambers values of KQ are tabulated in dependence on the type of the ionization chamber [1].
For plane parallel ionization chambers, however, no chamber-type specific kg values are given in dosimetry protocols and consequently those chambers cannot be used for absorbed dose measurements in high-energy photon beams according to Eq. (1). The rationale for this is an unacceptably large variati on of the kg values for different plane parallel chambers of the same type of up to 4 % which has been reported in early studies [2]. Due to this variation, no reliable chamber-type specific values for the correction factor kg could be tabulated.
However, from some more recent studies (see e.g. [3] and the references therein) there is evidence that for modern plane-parallel chambers the kg factors might vary much less than the 4 % reported earlier, which is probably due to an improvement in the manufacturing process of modern plane-parallel chambers yielding more uniform chambers with smaller tolerances.
To clarify this we investigated the variation of the beam quality correction factors kg for two types of modern plane parallel chambers, namely IBA PPC05 and IBA PPC40. Ten chambers of each type (taken from different manufacturing batches) were cross calibrated in three high-energy photon beams by comparing their reading with the reading of a cylindrical chamber of type NE2561. Assuming that the absorbed dose rates measured with the plane parallel and cylindrical chambers are the same, the beam quality correction factor of the plane parallel chamber kf can be obtained by
Hp = k f . (2) Q NVV • MVV Q lyD,w lvlO
The superscripts "pp" and "ref' denote the plane parallel chamber under test and the chamber used as a reference (NE2561), respectively. The variation of the kjf values is determined only by the
quantities ND>W and Mg which can be measured; the factor /c')1 , which has been taken from [1], is a
constant and does not influence the chamber-to-chamber variation of k f f . The calibration factors ND>W
of all chambers were determined in the 60Co reference beam of the Physikalisch-Technische Bundesanstalt (PTB), the chamber readings MQ were obtained in the 4 MY, 8 MY, and 25 MY photon
35

beams available at one of the Elekta Precise linear accelerators of the PTB. The individual k^ factors
obtained for all plane parallel chambers are shown in FIG. L
PPC05
I I I ^ k A
• 4 MV • 8 MV
- • - 25 MV
83 111 156 157 158 159 160 161 474 475
Serial number of chamber
342 344 507 509 510 512 808
Serial number of chamber
FIG. 1. Experimentally obtained kQ factors for the chambers of types PPC05 (left) and PPC40 (right). Some of the measurements with PPC40 chambers were repeated after a few days in order to check the
kref
reproducibility of the results. The error bars shown on the data do not include the uncertainty of -from Eq. (2), they denote only the uncertainty attributed to the ND,w and MQ measurements.
The variation of the kg values observed here is less than 0.7 % for both chamber types at all beam qualities; the relative standard deviation of the individual kjf values is about 0.2 % for each chamber
type and beam quality. These values correspond well with the variations observed in similar experiments for other types of modern plane parallel chambers [3].
From the results presented here it can be concluded that chamber-type specific values for the beam quality correction factor kg for modern types of plane parallel chambers could be tabulated in dosimetry protocols with an uncertainty which is not much larger than the uncertainty stated for the kQ factors of cylindrical chambers. This would allow for the use of plane parallel chambers for absorbed dose measurements in photon beams using the same formalism as for cylindrical chambers (see Eq. (1)).
REFERENCES
[ 1 ] INTERNATIONAL ATOMIC ENERGY AGENCY, Absorbed Dose Determination in External Beam Radiotherapy, Technical Reports Series No. 398, Vienna, 2000
[2] ICOSUNEN, A., jARVINEN, H., SIPILA, P., Optimum calibration of NACP type plane parallel ionization chambers for absorbed dose determination in low energy electron beams, Measurement Assurance in Dosimetry (Proc. int. Symp. Vienna, 1993), IAEA, Vienna, 1994, 505-513
[3] KAPSCH, R.-P., BRUGGMOSER, G.; CHRIST, G.; DOHM, O. S.; HARTMANN, G. H„ SCHULE, E., Experimental determination ofpCo perturbation factors for plane-parallel chambers, Phys. Med. Biol. 52 (2007), 7167-7181
36

IDOS, Vienna, 9-12 November 2010 E2-CN-182, Paper No INV009
Updating the AAPM's TG-51 protocol for clinical reference dosimetry of high-energy photon beams
M McEwen3, L DeWerdb, G Ibbottc, D Rogersd, S Seltzer6, J Seuntjensf
a National Research Council, Ottawa, ON, Canada
' University of Wisconsin, Madison, WI, United States
c M D Anderson Cancer Centre, Houston, TX, United States
dCarleton University, Ottawa, ON, Canada
eNational Institute of Standards and Technology, Gaithersburg, MD, United States
f McGill University, Montreal, QC, Canada
E-mail address of main author: [email protected]
It is now more than ten years since the TG-51 protocol was published. The AAPM has set up a Working Group to review TG-51 (authors listed above) and provide some much-needed information on the present situation of reference dosimetry for megavoltage photon and electron beams. The two modalities are being discussed separately, and this presentation deals only with photon beams. An addendum to TG-51 has been drafted and the highlights are described here.
Photon beam addendum highlights
i) Calculated kQ factors for new chambers developed after the publication of TG-51
k( ) factors for all chambers currently available were calculated using the approach of TG-51. Example data are shown in Figure 1.
1 . 0 1 0
1 . 0 0 0
0.990
0.980
0.970
0.960
0.950
0.940
50 60 70 80 90 100
dd(10)x
% % © » 1 .
• CC01
" I CC04
i CC13
• FC65G O •
* » FC65P -J.
% V \
0 » O w Ol,
8
FIG 1. Calculated kg factors for a) a range of IBA chambers and b) chambers of a similar design from different manufacturers.
37
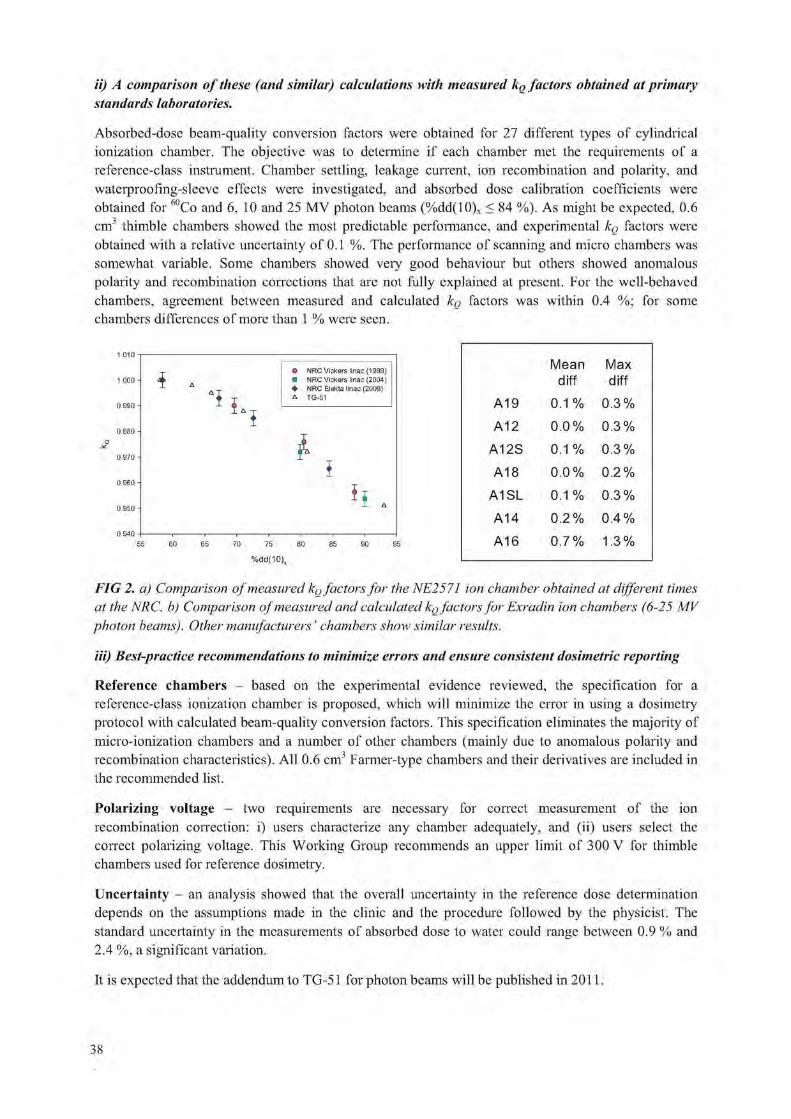
ii) A comparison of these (and similar) calculations with measured kQ factors obtained at primary standards laboratories.
Absorbed-dose beam-quality conversion factors were obtained for 27 different types of cylindrical ionization chamber. The objective was to determine if each chamber met the requirements of a reference-class instrument. Chamber settling, leakage current, ion recombination and polarity, and wateiproofing-sleeve effects were investigated, and absorbed dose calibration coefficients were obtained for 60Co and 6, 10 and 25 MV photon beams (%dd(10)x < 84 %). As might be expected, 0.6 cm3 thimble chambers showed the most predictable performance, and experimental kg factors were obtained with a relative uncertainty of 0.1 %. The performance of scanning and micro chambers was somewhat variable. Some chambers showed very good behaviour but others showed anomalous polarity and recombination corrections that are not fully explained at present. For the well-behaved chambers, agreement between measured and calculated kg factors was within 0.4 %; for some chambers differences of more than 1 % were seen.
i NRC Vickers linac {1999} NRC Vickers linac (2004) NRC Elekta linac (2009) TG-51
70 75
% d d ( 1 0 )
Mean Max diff diff
A19 0.1 % 0.3%
A12 0.0% 0.3%
A12S 0.1 % 0.3%
A18 0.0% 0.2%
A1SL 0.1 % 0.3%
A14 0.2% 0.4%
A16 0.7% 1.3%
FIG 2. a) Comparison of measured kg factors for the NE2571 ion chamber obtained at different times at the NRC. b) Comparison of measured and calculated kg factors for Exradin ion chambers (6-25 MV photon beams). Other manufacturers' chambers show similar results.
Hi) Best-practice recommendations to minimize errors and ensure consistent dosimetric reporting
Reference chambers - based on the experimental evidence reviewed, the specification for a reference-class ionization chamber is proposed, which will minimize the error in using a dosimetry protocol with calculated beam-quality conversion factors. This specification eliminates the majority of micro-ionization chambers and a number of other chambers (mainly due to anomalous polarity and recombination characteristics). All 0.6 cm3 Farmer-type chambers and their derivatives are included in the recommended list.
Polarizing voltage - two requirements are necessary for correct measurement of the ion recombination correction: i) users characterize any chamber adequately, and (ii) users select the correct polarizing voltage. This Working Group recommends an upper limit of 300 V for thimble chambers used for reference dosimetry.
Uncertainty - an analysis showed that the overall uncertainty in the reference dose determination depends on the assumptions made in the clinic and the procedure followed by the physicist. The standard uncertainty in the measurements of absorbed dose to water could range between 0.9 % and 2.4 %, a significant variation.
It is expected that the addendum to TG-51 for photon beams will be published in 2011.
38

IDOS, Vienna, 9-12 November 2010 E2-CN-182, Paper No 285
Application of a new dosimetry formalism to IMRT head and neck radiotherapy
K. Rossera and E. Fernandez1
aThe London Clinic, 22 Devonshire Place, London WIG 6BW, U.K..
J oint Department of Physics, The Institute of Cancer Research and The Royal Marsden NHS Foundation Trust, Downs Road, Sutton Surrey SM2 5PT, UK
E-mail address of main author: [email protected]
The purpose of our study is to investigate the application of a dosimetry formalism proposed by Alfonso et al [1] to head and neck (H&N) IMRT in the clinic. The aim is to design a representative fpcsr
L fpcsr fref for H&N treatments using IMRT, and evaluate the corresponding correction factors KQPCSR,Q and ifclim fpcsr Qdw'Qpcsr f° r a Farmer and IBA ccl3 chamber and Electronic Portal Imaging Device (EPID) dosimetry
used in the clinic. IMRT treatments at the Royal Marsden Hospital, Sutton are delivered on Elekta Precise® linear accelerators equipped with Synergy cone beam CT systems, EPID and either 1cm or 4mm leaf width (at isocentre) multi-leaf collimators. IMRT treatment planning is performed using a DMPO algorithm on a Philips Pinnacle treatment planning system (TPS).
To establish a representative pcsr field, ten clinical head and neck plans were chosen. A Rando phantom (head and shoulders) was scanned with a ccl3 chamber inserted. Based on the clinical protocol a pcsr field was then devised for the Rando phantom, using 7 beams and collimator angle close to zero. The high dose PTV was chosen around the chamber so that the dose was uniform within 1% across the chamber. The plan was inverse planned according to normal clinical protocol, (see FIG 1)
FIG 1-pcsr field based on clinical plan

It was thought that this approach was not practical for a code of practice so a second simpler pcsr field was designed for the Rando phantom. This pcsr field was forward planned with 7 fields each at 5o collimator angle. For each field the same 3 rectangular segments were used, making a wedge effect and giving a uniform dose over the chamber. Figure 2 shows the segments for one gantry angle.
FIG 2 Simplified pcsr field
1 J pcsr ~>Jref For the full manuscript we will determine KQPCS,.,Q using the clinical and simplified pcsr fields for a
1—fclinifpcsr Farmer and a IBA cc 13 chamber and EPID. Then we will obtain KQCKN,QPCSR for each of our ten clinical plans. In doing this we will gain valuable experience on how to adopt the new formalism in the clinical situation.
REFERENCE
[1] ALFONSO R ET AL, A new formalism for reference dosimetry of small and nonstandard fields. Med. Phys., 35, 5179-86, 2008.
40
IDOS, Vienna, 9-12 November 2010 E2-CN-182, Paper No INV009
IPEM report 103: Small field MV photon dosimetry
M. M. Aspradakis\ J. P. Byrneb, H, Palmansc, J. Conwayd, A. P. Warrington6, K. Rosserf, S. Duanec
a Department of Radiation Oncology, Cantonal Hospital of Lucerne, Switzerland 0 Regional Medical Physics Department, Freeman Hospital, Newcastle upon Tyne, UK c National Physical Laboratory, Teddington, UK d Cancer Research Centre, University of Sheffield, Weston Park Hospital, Sheffield, UK ePhysics Department, Royal Marsden Hospital, Sutton, UK f The London Clinic, London, UK
E-mail address of main author: [email protected]
The use of small photon fields has been an established practice in stereotactic radiotherapy/radiosurgery (SRT/SRS) for many years and a lot of work has been published on their use. Nevertheless, when small fields have been included in the delivery of significant patient doses, there have been serious dosimetric errors reported in patient treatment. Recent technological advances in conventional linear accelerators have improved their mechanical accuracy, stability, dosimetric control and there has been an increasing availability in the clinic of standard-, mini- and micro- multi-leaf collimators (MLCs). Small fields are nowadays being used on treatment equipment (machines and treatment planning systems (TPS)) not originally designed for their delivery and modelling. Furthermore specialised systems specifically designed for intensity modulated radiotherapy (IMRT) are in use for patient treatment (e.g. TomoTherapy and Cyberknife). The main aim of this report is to assist the medical physicist in understanding the potential for error, identifying areas to focus on to minimise these, enable the clinic to identify the field size limit where treatment planning and delivery systems can be commissioned with confidence.
An MV photon field is defined as 'small' when either of the following conditions is met:
1. The field size is not large enough to provide CPE at the position of measurement. That is, when the field dimensions are comparable or less than the lateral range of secondary electrons for the beam energy under investigation;
2. The collimating device obstructs part of the direct beam source, as viewed from the point of measurement.
The first challenge in narrow field dosimetry is the definition of field size because the conventional approach of classifying fields based on the full width half maximum (FWHM) breaks down at small collimator settings. The second challenge is that most commonly used detectors are simply too big for the determination of dosimetric parameters in a small field. In addition to this, detector size and perturbation effects can be substantial for small fields as opposed to larger fields where they are in general small and manageable. The third challenge is ensuring accurate dose modelling by the TPS. Lastly, changes in the beam spectrum as the field size decreases and the deviation from the conventional reference field size mean that there is no established protocol for absolute or reference dosimetry in small fields and this has implications in the measurement of reference dose based on existing dosimetry protocols.
The large amount of published information on the subject of small field dosimetry is presented in twelve chapters. Attention is drawn to relevant aspects of quality assurance for the treatment machine
41
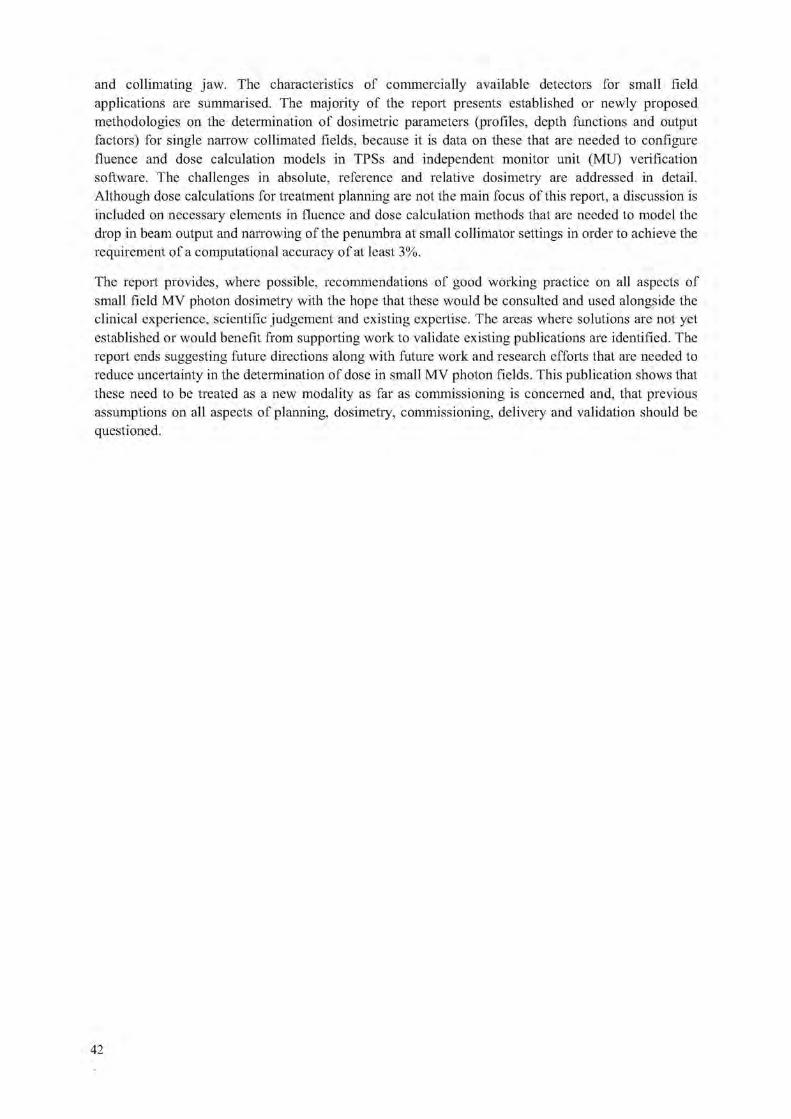
and collimating jaw. The characteristics of commercially available detectors for small field applications are summarised. The majority of the report presents established or newly proposed methodologies on the determination of dosimetric parameters (profiles, depth functions and output factors) for single narrow collimated fields, because it is data on these that are needed to configure fluence and dose calculation models in TPSs and independent monitor unit (MU) verification software. The challenges in absolute, reference and relative dosimetry are addressed in detail. Although dose calculations for treatment planning are not the main focus of this report, a discussion is included on necessary elements in fluence and dose calculation methods that are needed to model the drop in beam output and narrowing of the penumbra at small collimator settings in order to achieve the requirement of a computational accuracy of at least 3%.
The report provides, where possible, recommendations of good working practice on all aspects of small field MV photon dosimetry with the hope that these would be consulted and used alongside the clinical experience, scientific judgement and existing expertise. The areas where solutions are not yet established or would benefit from supporting work to validate existing publications are identified. The report ends suggesting future directions along with future work and research efforts that are needed to reduce uncertainty in the determination of dose in small MV photon fields. This publication shows that these need to be treated as a new modality as far as commissioning is concerned and, that previous assumptions on all aspects of planning, dosimetry, commissioning, delivery and validation should be questioned.
42

Parallel Session 3b
Internal Dosimetry: Computational Phantoms and Radiobiological Modelling


IDOS, Vienna, 9-12 November 2010 E2-CN-182, Paper No INV009
Computational phantoms and skeletal dose models for adult and paediatric internal dosimetry
W. Bolch,3 M. Wayson,3, D. Pafundi3
a The University of Florida, Gainesville, FL, USA
E-mail address of main author: [email protected] Dose estimates of internal organs and tissue structures in nuclear medicine have been performed since the early 1960s using 3D representative models of human anatomy constructed from geometric surface equations. This early generation of computational anatomic model is referred to as a stylied (or mathematical) phantom and was first introduced to the research community through the work of Walter Synder at the Oak Ridge National Laboratory and through the Medical Internal Radiation Dose (MIRD) committee of the Society of Nuclear Medicine [1], In the early 1980s, a series of refined stylzied models were introduced by Mark Cristy and Keith Eckerman at ORNL, and these have hence been referred to as the ORNL series of phantoms [2], With the increasing use of 3D medical imaging - CT and MR - through the mid-to-late 1980s, a second generation of phantom was introduced based upon detailed image segmentation - the so-called voxel (or tomographic) phantom. Efforts to create voxel phantoms covering a wide range of adult and even pediatric sizes continued through the 1990s and into the present day. Recently, however, a third generation of phantom technology has been introduced providing the flexibility / scalability of stylzied phantoms, yet retaining the anatomic realism of voxel phantoms [3]. These so-called hybrid phantoms use polygon mesh and non-uniform rational B-spline (NURBS) surfaces to describe both internal organ surfaces and outer body contours of the virtual patient being represented (see Fig 1). Hybrid phantoms uniquely allow one to both standardize internal anatomy, yet develop libraries of phantoms that cover ranges of body heights and weights as might be seen in a given patient population. In this presentation, we will review these various formats and categories of anatomic models available for use in nuclear medicine dosimetry.
Of the many tissues of dosimetric interest in virtual patient phantoms, one of the more challenging to model are the tissues of the skeleton - active bone marrow and skeletal endosteum. Present day models of bone marrow dosimetry utilize extensively a unique but limited set of linear pathlength distributions acquired in the late 1960s to early 1970s at the University of Leeds using contact radiographs of bone histological sections and an optical scanning device. Recent work at the University of Florida has pioneered the use of microimaging techniques of both whole cadaveric bone and cored samples of spongiosa to yield a truly 3D presentation of the bone marrow cavities and bone trabeculae in different skeletal regions and for different subject ages. In this presentation, we will review the progress in providing more realistic models of electron, photon, and alpha particle dosimetry for skeletal tissue dose assessment using Paired-Image Radiation Transport (or PIRT) modeling techniques that couple both a macroscopic model of cortical bone and trabecular spongisoa, with a microscopic model of individual marrow cavities and bone trabeculae. These techniques allow for significant improvements over existing skeletal dose models as they (1) allow for particle escape from spongisoa regions and from small skeletal sites, (2) allow for cortical to spongisoa cross-fire, (3) allow for a ICRP revised 50-micron definition of the skeletal endosteum, and (4) allow for bone-specific reporting of marrow dose (see Figure 2 regarding variations in marrow self-dose within the adult male).
45
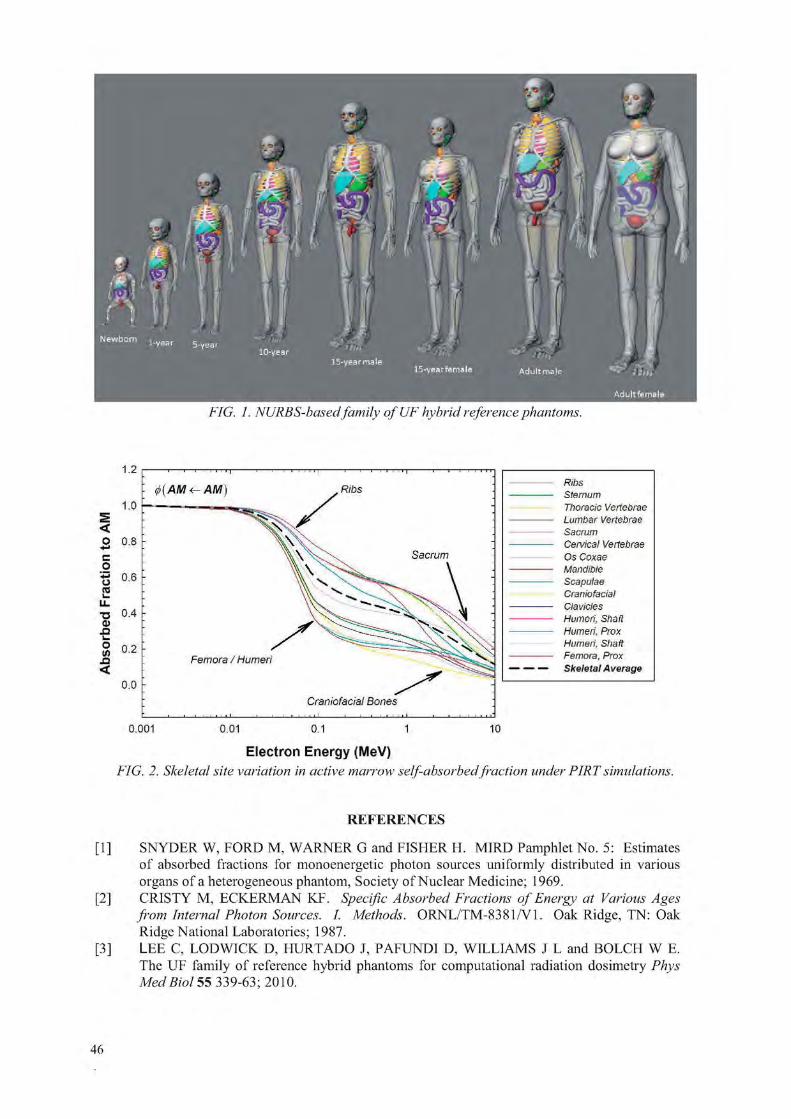
FIG. 1. NURBS-based family ofUF hybrid reference phantoms.
Ribs Sternum Thoracic Vertebrae Lumbar Vertebrae Sacrum Cervical Vertebrae Os Coxae Mandible Scapulae Craniofacial Clavicles Humeri, Shaft Humeri, Prox Humeri, Shaft Femora, Prox Skeletal A verage
0 .001
: ^(AM<-AM)
Sacrum
Craniofacial Bones
Femora / Humeri
Electron Energy (MeV) FIG. 2. Skeletal site variation in active marrow self-absorbedfraction under PIRTsimulations.
REFERENCES
[1] SNYDER W, FORD M, WARNER G and FISHER H. MIRD Pamphlet No. 5: Estimates of absorbed fractions for monoenergetic photon sources uniformly distributed in various organs of a heterogeneous phantom, Society of Nuclear Medicine; 1969.
[2] CRIST'Y M, ECKERMAN KF. Specific Absorbed Fractions of Energy at Various Ages from Internal Photon Sources. I. Methods. ORNL/TM-8381/V1. Oak Ridge, TN: Oak Ridge National Laboratories; 1987.
[3] LEE C, LODWICK D, HURT ADO J, PAFUNDI D, WILLIAMS J L and BOLCH W E. The UF family of reference hybrid phantoms for computational radiation dosimetry Phys Med Biol 55 339-63; 2010.
46
IDOS, Vienna, 9-12 November 2010 E2-CN-182, Paper No INV009
Photon and electron specific absorbed fractions for the University of Florida paediatric hybrid computational phantoms
M. Wayson3 and W. Bolcha
a The University of Florida, Gainesville, FL, USA
E-mail address of main author: [email protected]
The University of Florida has developed a set of computational phantoms which originated from real human anatomy in the form of computed tomography (CT) image sets. The organ shapes, orientation, and placement of the internal anatomy were directly determined from these image sets, imported into a 3D graphics program Rhiimceros™, and scaled to ICRP reference values [1]. Rhinoceros™ employs a method of volume description called non-uniform rational B-spline (NURBS) surfaces. Any given volume is described by the boundary created by these surfaces. The surfaces themselves are easy to manipulate, so non-reference body morphometries are readily modeled. The majority of the gross human anatomy was created using NURBS surfaces, but the skeleton was treated separately due to its complexity. A skeletal model with delineated cortical bone and spongiosa/medullary cavity regions was created and imported into Rhinceros™ and left in polygon mesh format [2], Surfaces are initially in polygon mesh format when imported. They are subsequently converted to NURBS surfaces. The result was a model which combines the anatomic realism of actual human anatomy with the simple deformability of stylized models. This class of phantom was termed the "hybrid" phantom. Male and female models were created for the ICRP reference ages of newborn, 1 year, 5 years, 10 years, and 15 years.
The process for performing internal dosimetry for non-skeletal anatomy is relatively straight forward. Using MCNPX 2.6, radiation transport is performed, and the energy deposited in any given target organ is tallied and divided by the total energy emitted from any given source organ and the target organ's mass. This calculation yields the specific absorbed fraction or SAF, which contains the critical geometric information needed to perform accurate dose calculations for any nuclear medicine procedure. Coupled with the total number of transformations in the source organ and the radionuclide's radiation energies and yields, a whole body effective dose can also be assessed.
The process for performing internal dosimetry for skeletal anatomy is not as straight forward. Since the skeletal microstructure is so small and intricate, explicit trabecular bone and marrow cavities are unable to be modeled with NURBS surfaces. Therefore, an alternate method was developed to determine the radiation dose from an external source of photons to red bone marrow and endosteum, the radiosensitive targets of the skeleton. This method is referred to as the photon "dose response function" (DRF). Pre-computed electron absorbed tractions (AF) were used in conjunction with photon mass interaction coefficients to calculate the absorbed dose to the radiosensitive cells of the skeleton per unit fluence of photons incident on the subsegmented spongiosa and medullary cavities [3]. To calculate the SAF, the fluence of photons emitted from any given source organ reaching the spongiosa and medullary cavities was tallied. Then, the total energy emitted from the source organ was used to compute an SAF for red bone marrow and endosteum. The results could then be combined with results from the general organ dosimetry to produce a whole body effective dose for any nuclear medicine procedure.
The objective for this project is to produce a comprehensive set of photon and electron SAFs for all 10 University of Florida pediatric hybrid computational phantoms. The SAFs are calculated for 21 photon and electron energies, more than the current standard dataset. They are calculated for a
47

complete index of source and target organ combinations of interest. The results from these calculations are imbedded in a software program capable of producing dose estimates from user input. The user is able to specify the radionuclide of interest and the total number of transformations in each source organ. The software gives dose estimates to all target organs of interest in addition to the whole body effective dose per unit injected activity. A representative sample of the results from a preliminary simulation of a uniform photon source in the liver of the UF female hybrid newborn phantom (UFOOF) is shown in Fig. 1. Back-extrapolation and inverse Monte Carlo were used to improve data original subjected to poor Monte Carlo sampling statistics.
1.00E+03
P h o t o n E n e r g y ( M e V )
Residual Soft Tissue
— Adrenal (L)
Adrenal (R)
— Brain
Breast
— Bronchi
Right Colon W
— — Right Colon C
Esophagus
— • External nose
— Eye balls
Gall Bladder W
Gall Bladder C
Heart W
HeartC
Kidney-cortex (L)
—>— Kidney-cortex (R)
Kidney-medulla (L)
Kidney-medulla (R)
Kidney-pelvis <L]
Kidney-pelvis (R)
FIG. 1. Photon specific absorbedfractions from a uniform photon source in the liver for the UFOOF phantom.
REFERENCES
[1] LEE C, LODWICK D, HASENAUER D, WILLIAMS JL, LEE C, BOLCH WE. Hybrid computational phantoms of the male and female newborn patient: NURBS-based whole-body models. Phys Med Biol 2007;52:3309-3333.
[2] PAFUNDI D, LEE C, WATCHMAN C, et al. An image-based skeletal tissue model for the ICRP reference newborn. Phys Med Biol 2009;54:4497-4531.
[3] CRISTY M, ECKERMAN KF. Specific Absorbed Fractions of Energy at Various Ages from Internal Photon Sources. I. Methods. ORNL/TM-8381/V1. Oak Ridge, TN: Oak Ridge National Laboratories; 1987.
48
IDOS, Vienna, 9-12 November 2010 E2-CN-182, Paper No INV009
Inverse treatment planning for targeted radionuclide therapy J. Gonzalez3, C. Calderona, R. Alfonsob, O, Diaz Rizoc, J. Oliva3, R.P. Baumd
"Department of Nuclear Medicine. Institute of Oncology and Radiobiology, Havana, Cuba bDepartment of Radiotherapy. Institute of Oncology and Radiobiology, Havana, Cuba
Institute of Applied Sciences and Technologies. Havana, Cuba dDepartment of Nuclear Medicine. Centre for PET. Zentralklinik Bad Berka. Bad Berka. Germany
E-mail address of main author. [email protected]
A method for inverse treatment planning was developed for targeted radionuclide therapy. Taking into account the fact that the efficacy of targeting radionuclide therapy is affected by nonuniformity dose and dose rate distributions in tumors, we introduce the equivalent uniform biologically effective dose (EUBED) concept on treatment planning for targeting radionuclide therapy [1], The EUBED model converts the spatial biologically effective dose (BED) distribution into an equivalent uniform biologically effective dose value that would produce a biological response similar to that expected from de original BED distribution. According to this, the treatment planning must quantify the relationship between administered activity and the absorbed dose distribution that expressed in terms of biological effect maximizing the EUBED in tumor while the mean dose in dose-limiting normal organs is maintained within accepted values. The method is based on calculation of the absorbed dose distribution using patient-specific imaging data, incorporating radiobiologic modeling to account for effects of dose rate distribution for better prediction of tumor response. For BED calculation, we use a BED model based on cell repair and proliferation during the internal irradiation at low dose rate with beta emitters [2].
The inverse planning process consists in the estimation of activity to be administered from treatment prescription in terms of tumor control probability (TCP), assuming that each amount of administered activity produces the same biological effect, for treatment schemes that uses multiple activity administrations equally time-spaced [1]. From SPECT images of absorbed dose distribution at voxel level in Gy/GBq, the differential dose volume histogram is obtained and used together with the mean absorbed dose of the dose-limiting organ as input parameters. From prescribed TCP, the corresponding EUBED is calculated and divided by the number of activity administrations to determine the partial EUBED for one administration. The amount of activity, that produces an EUBED equals to the previously calculated partial EUBED, is determined by an iterative method, from the differential dose volume histogram (DVH). In this algorithm, the constraint condition is that the estimated amount of activity must be lesser than maximum tolerate activity (MTA) by the dose-limiting organ. The optimization process consist in to maximize the EUBED, while the mean dose to limiting-dose organ is maintained within the accept values varying the number of activity administrations. This process is based on the fact that in presence of nonuniform dose distribution, the treatment is less effective as the activity increase [3] and the dose fractionation is better tolerated by patients and may help to alleviate the effects of nonuniform dose distribution on treatment efficacy [1].
The method was validated using a clinical case data for different treatment schemes with different numbers of equal amount of administered activity. The total activity was the same for each selected treatment scheme from which the TCP was estimated by direct treatment planning from SPECT images. Because of, the DVH comprise in one single graph the spatial absorbed dose distribution, the results of inverse treatment planning using the TCP obtained from direct planning were compared with the results of direct planning. The comparison showed no significant differences for both methods. These results validate the method of inverse planning dosimetry proposed in this work.
49

The obtained results also were compared with the treatment planning based on mean BED to explore the impact of nonuniform BED distribution on treatment efficacy. This analysis demonstrates an important reduction on achieved EUBED for each selected treatment scheme which contribute to reduce the therapeutic effect.
A more detailed description of the method will be published elsewhere [4],
The inverse treatment planning is useful for estimation of the amount of activity to produce an expected effect in terms of prescribed TCP for treatment schemes based on multiple activity administrations and could be applied in clinical routine if radiobiologic parameters of tumor are available. The analysis of results of treatment planning based on mean BED shows an important reduction of likelihood to achieve the tumor control when dose distribution is nonuniform.
REFERENCES
[1] O'DONOGHUE, J. A. Implications of nonuniform tumor doses for radioinmunotherapy, J. Nucl. Med, 1999. 40: p. 1337-1341.
[2] GONZALEZ, J. AND C. CALDERON. Dose-response model for targeted radionuclide therapy. World J. Nucl. Med, 2004. 3: p. 225-228.
[3] ICRTJ Report No. 67. Absorbed dose specification in nuclear medicine. 2002: Ashford. England.
[4] GONZALEZ, J., ET AL. Inverse treatment planning for targeted radionuclide therapy, in Press.
50
IDOS, Vienna, 9-12 November 2010 E2-CN-182, Paper No INV009
Validating activity prescription schemes in radionuclide therapy based on TCP and NTCP indexes calculation
C.F. Calderon3, J.J. Gonzalez3, W. Quesada3, R. Alfonso3, O. Rizob
3 Institute of Oncology and Radiobiology, Havana, Cuba
bHigh Institute of Applied Technologies and Sciences, Havana, Cuba
E-mail address of main author: [email protected]
In this work a formulation for evaluation and acceptance of activity prescription schemes (single or multiple administrations) in radionuclide therapy based on the calculation of Tumor Control Probability (TCP) and Normal Tissue Complication Probability (NTCP) is presented. The Poisson model was used for TCP calculation and NTCP by using the Lyman-Kutcher-Burman's (LKB) model [1]. All calculations for biological evaluation of the activity prescription schemes are made from the absorbed dose in mGy/MBq of injected activity calculated from the gammagraphic images. The input data for calculations are activity (MBq) per administration, the number of administration proposed and time interval between administrations (equally spaced).
The TCP (Poisson model) calculation was made by determination of Biological Equivalent Dose (BED) using a formulation of linear-quadratic (LQ) model in which cell repair and proliferation during the irradiation at low dose rate (LDR) were considered [2], Similarly, NTCP (LKB's model) calculation was also done from BED determination, but those calculated for LDR were converted to 2Gy-equivalent dose at high dose rate in order to use the tolerance values tabulated [8] and because it is more understandable for physicians. Kidneys, bone marrow and whole body were considered as critical organs. Proliferation was considered only for bone marrow during the BED calculations. The BED model for LDR reported in [2] was extended for multi-exponential dose rate function with any number of terms. A formulation for multiple administrations, equally time-spaced where cumulative dose effects are included, is also tested [3].
The dose distribution was considered homogeneous in tumor volume, keeping in mind that some dose distribution parameters, like equivalent uniform dose (EUD), could be used for description of irradiation effects for non-homogeneous dose distribution [4], as we could find in applications of radionuclide therapy in real clinical situation. Similarly dose distribution in normal tissue is considered as uniform. The tolerance values used where those for whole-volume irradiation of the organ [5]. As acceptance criteria was considered NTCP<0.05; the treatment is not accepted if the critical value is overcame for any critical organs for the proposal.
The evaluation/verification of prescription could be done by two ways: (a) direct evaluation in the expression obtained for TCP and NTCP or (b) determination of optimal activity value by iterative methods for given values of time inter-administration and number of administration. The results obtained for two examples (based on clinical data) are discussed where alternative treatment schemes should be evaluated because of toxicity in critical tissues. Nevertheless, the tolerance (maximum tolerable activity) in radionuclide therapy is established considering the absorbed dose in whole body (below 2Gy), other critical organs (kidneys, bone marrow or any other) should be carefully controlled.
51

The whole body absorbed dose may be below the tolerance limit, but the critical limit in critical tissues may be exceeded if lesion uptake is reduced. Although the formulation presented here consider a uniform dose distribution in tumour and normal tissues, it could be easily used with dose distribution parameters that describes more realistically the effects of non-uniform dose distributions more realistically.
REFERENCES
[1] Bl R MAX C, KUTCHER G, EMAMI B, ET AL. Fitting of normal tissue tolerance data to an analytic function. Int J Radiat Oncol Biol Phys 1991. 21(1): p.123-135.
[2] GONZALEZ J, CALDERON C. Dose response model for targeted radionuclide therapy. World J Nuc Med 2004, 3: p.225-228.
[3] CALDERON CF, GONZALEZ J., ET AL. Modeling biological effects of repeated systemic administrations of small dose fraction in radionuclide therapy, work in press.
[4] NIEMIERKO A. Reporting and analyzing dose distributions: a concept of equivalent uniform dose. Med Phys 1997. 24: p. 103-110
[5] EMAMI B, LYMAN J, BROWN A, ET AL, Tolerance of normal tissue to therapeutic irradiation. Int J Radiat Oncol Biol Phys 1991. 21(1): p.109-122.
52

IDOS, Vienna, 9-12 November 2010 E2-CN-182, Paper No INV009
Isoeffective dose specification of normal liver during radioembolization
using 4 Y microspheres
B.W. Wessels3, A.G. Di Diab, Y. Zheng3, M. Cremonesib
"University Hospitals Case Medical Center, Cleveland, Ohio, USA
' Unit of Medical Physics, European Institute of Oncology, Milan, Italy
E-mail address of main author: [email protected]
Background and Purpose Although normal tissue tolerance doses for liver undergoing conventional 2 Gy daily fractionated radiotherapy has been well-described (7), the organ tolerance to normal liver (NL) during radioembolization (RE) remains under investigation (2). Injection of Y-90 microspheres into the hepatic artery for targeting of metastatic lesions results in the concurrent delivery of highly heterogeneous pattern of expontially decaying absorbed dose to the NL, Current methods of specifying dose limiting toxicity to NL by the manufacturer include activity nomograms based on the assumed delivery of 70 -130 Gy uniformly to the whole liver at an arbitrary dose rate (3, 4). Dale (5) and O'Donoghue (6) describe how to relate BED (Biological Effective Dose) and EUD (Equivalent Uniform Dose) for radionuclide therapy. Cremonesi (2) has applied the BED model for the NL irradiation using 64 Gy BED as a clinical dose toxicity limit with a cohort of 20 patients. Degree of heterogeneity was not specified and multiple administrations were permitted. No radiation-related toxicities were observed which was consistent with reported dose escalation schemes (3) and the Sirsphere package insert (4). Clearly, absorbed dose non-uniformity must be taken into account when analyzing therapy delivered by RE in order to set a meaningful limits to NL toxicity (7) relative to external beam experience.
Methods
We propose to use the Isoffective Dose Model (8) which relates the biological effect of a test (unknown) radiation given at various dose-rates, non-uniformity of deposition and/or particle type (RBE) to a standard uniform photon irradiation given in daily 2 Gy fractions. The biological effect of the absorbed dose given by the test irradiation compared to the reference irradiation would be scaled by weighting factors (e.g. W BED, W BUD, W RBE )• As an illustrative example for application to
radionuclide therapy, absorbed dose to a patient heterogeneously delivered to the normal liver by RE is shown in the DVH data (Fig.l). The DVH data was generated from Tc- 99m - MAA SPECT images to check the post-therapeutic distribution. These distribution data are typical for the results of Y-90 Sirsphere irradiation reported by Cremonesi (2) and consistent bremstrahung imaging. Average voxel size was approximately 0.08 ml for a 1500 g liver or 19,000 dose calculation volumes. To compute the BED and EUD for Figure 1 data, an a/|3 ratio of 2.5 Gy and T y, repair of 2.5 h was used
with the BED (5) and basic EUD model (9). As a first approximation, weighting factors were assumed to be linearly related, resulting in BED and EUD weighting factors to be calculated separately. The weighting factor for BED is expressed as:
Differential DVH for Normal liver
Dose [Gy)
FIG. 1 Differential DVH for NL
53

_ Equivalent dose to NL in 2 Gy daily fractions BED — \ t.* )
Mean Absorbed dose to the NL The weighting factor W E U D is computed as:
EUD for DVH data of absorbed dose WEUD = (Eq- 2)
Mean Absorbed dose to the NL The weighting factor W RBE is taken as simply the RBE, since it is already scaled to a reference radiation. Finally, the Isoeffective dose (8) would be expressed as:
DhoE = WBED X WEUD X WRBE x Mean Absorbed dose to the NL (Eq. 3) Results
For the sample data provided in Table 1, a mean absorbed dose to the NL was computed to be 27.4 Gy. BED value was 41.0 Gy and corresponding EUD for the NL was 16.9 Gy. To determine the Equivalent Dose (Eq 1), the BED is divided by (1 + 2.0/(a/p)) or the relative effectiveness for 2 Gy fractions. Using these values to substitute into equations 2 and 3, resulting W BED, W EUD, W RBE were 0.83, 0.62, 1.0, respectively. Final DIsoE was computed to be 13.9 Gy. Analysis of other DVH data associated with this clinical trial shows similar results. NL surviving fraction has also been shown to be sensitive to T ; / 2 r e p a i r ( 7 ) .
Alpha particle irradiation by RE may be advantageous by increasing the dose/dose rate to the target tissues if minimally irradiated normal tissues are spatially segregated from high dose targeted areas. The Isoefective Dose Model can be used to relate biological effects of the alpha emitter using voxelized RBE's if dose rate dependence is specified.
Discussion and Conclusion
The novel application of the Isoffective Dose Model was shown to provide a direct association between RE dosimetry and external beam normal organ dose toxicity data through the use of BED, EUD and RBE weighting factors. Non-linear relations between weighting factors over a practical range of clinically relevant parameters (e.g. T Vz rep, T dose rate and tissue radiosensitivity) warrants further study (6).
Based on these models assumptions for this sample patient, the D IsoE of 13.9 Gy is 2.5 times lower than the M CP reported for NL (TD5/5 = 35 Gy) for external beam irradiation (2). The MIRD committee (Society of Nuclear Medicine) has recommended that D IsoE be reported in barendson Bd (a biologically weighted adsorbed dose unit) (10). Using administered activity nomograms, Y-90 therapy is expected to be safely administered but not optimized for maximum organ tolerance dose nor effectiveness. A practical scanned-based, dosimetric approach may lead to a superior method which results in increased clinical effectiveness. Since these models have limited predictability for small volumes at high dose for a parallel organ architecture (7), a minimum volume of 700 ml of NL receiving a dose < 20 Gy may be an important determinate for the onset of toxicity. For such macro-regions of inactivity, volume estimate are easily generated and quantified by routine scanning procedures.
54

REFERENCES
[1] PAN CC, KAVANAGH BD, DAWSON LA, et al. Int J Radiat Oncol Biol Phys. Mar 1;76(3 Suppl):S94-100.
[2] CREMONESI M, FERRARI M, BARTOLOMEI M, et al. Eur J Nucl Med Mo! Imaging. Nov 2008;35(11):2088-2096.
[3] SALEM R, THURSTON K. J. Vase. Interv Radiol 2006;17: 1251-78. [4] SIR-Spheres Yttrium-90 [package insert]. Lane Cove, Australia: Sirtex Medical. 2004 [5] DALE RG. Phys Med Biol. Oct 1996;41 (10): 1871-1884. [6] O'DONQGHUE JA. J Nucl Med. Aug 1999;40(8):1337-1341. [7] YORKE ED, JACKSON A, FOX RA, WESSELS BW, GRAY BN. Clin Cancer Res. Oct
1999;5(10 Suppl):3024s-3030s. [8] WAMBERSIE A, HENDRY JH, ANDREO P, et al. Radiat Prot Dosimetry. 2006;122(1-
4):463-470. [9] NIEMIERKO A. Med Phys. Jan 1997;24(1): 103-110. [10] SGOUROS G, HOWELL RW, BOLCH WE, FISHER DR. J Nucl Med. Mar 2009;50(3):485-
487.
55


Parallel Session 4a
Small and Non-Standard Fields


IDOS, Vienna, 9-12 November 2010 E2-CN-182, Paper No INV009
Small and composite field dosimetry: The problems and recent progress
H. Palmans1
National Physical Laboratory, Teddington, United Kingdom
E-mail address of main author: [email protected]
While reference dosimetry for broad external beams has been well established [1, 2] the increased use of small fields in intensity modulated radiotherapy (IMRT) and stereotactic radiosurgery (SRS) has revealed that there are many remaining questions about the accuracy of small field dosimetry and what constitutes best practice. Various incidents reported recently demonstrate the need for clear guidelines and recommendations for small field dosimetry.
Some treatment units, such as GammaKnifc, CybcrKnifc and TomoThcrapy, cannot establish the broad beam reference conditions prescribed in conventional dosimetry [1, 2]. Ionisation chambers, most commonly used and recommended in reference dosimetry, are too voluminous for use in small fields causing perturbation corrections to become unmanageably large. For many other detectors, the energy dependence and its influence in going from large to small field dosimetry is not well known. While there are some indications that beam quality is not greatly affected by field size (based on the small variation of the water to air stopping power ratios), it is not a priori obvious how to measure beam quality for small fields especially if a broad beam cannot be established at the same unit. Even the definition of field size itself becomes ambiguous due to the apparent beam widening compared to the collimator setting as a result of overlapping penumbrae or lateral charged particle disequilibrium in small fields.
Concerning composite IMRT plans, it is common practice to verify a clinical plan by calculating the dose distributions it will deliver to a homogeneous phantom and verify it by 2D- or 3D-dosimetry methods. However, with the use of more and more complex IMRT plans in order to achieve homogeneous target dose coverage whilst optimally sparing critical organs, dose distributions in homogeneous phantom conditions become increasingly inhomogeneous and accurate dosimetry becomes very difficult if not impossible. This is exemplary of the huge leap between the static fields used for reference and relative dosimetry on the one hand and the way a clinical IMRT treatment is actually delivered on the other hand. There is also an increased tendency of treatment planning systems to be based on fluence calibrations rather than on dosimetric data for a range of field sizes. For those situations reference dosimetry in a composite reference plan would be more relevant.
Several national and international working groups have been established in recent years to provide literature review, guidelines and recommendations for small and composite field dosimetry (IPEM, DIN, NCS, IAEA/AAPM...). An international working group on small and composite field dosimetry formed by the IAEA in collaboration with the AAPM, published a proposed formalism extending the recommendations from IAEA TRS-398 to fields that cannot establish conventional reference conditions as well as to composite fields [3]. This formalism introduces the concepts of machine specific or intermediate reference fields for static small fields and plan-class specific reference fields for composite fields, which both deviate from conventional reference fields and bridge the gap with smaller fields and clinical composite fields, respectively. The dosimetry for both types of fields
1 On behalf of an international (IAEA and AAPM endorsed) working group on small and composite field dosimetry consisting of: Rodolfo Alfonso, Pedro Andreo, Roberto Capote, M Saifi.il Huq, Joanna, Izewska, Jonas Johansson, Warren Kilby, Rock Mackie, Ahmed Meghzifene, Hugo Palmans, Karen Rosser, Jan Seuntjens and Wolfgang Ullrich.
59

requires dosimeter perturbation correction factors that can be evaluated using Monte Carlo simulations or experiments.
This presentation will review the problems associated with small and composite field dosimetry and recent solutions that have been proposed for various of the above mentioned problems. Concerning beam quality measurement for example, several authors have proposed an equivalent field size method combined with generic tabulated data of depth dose characteristics. Others have demonstrated that dose-area-product measurements combined with lateral distributions can offer an alternative. Dosimeter volume averaging can within certain limits be corrected for by high-resolution 2D- or 3D-dosimetry methods such as film and gel dosimetry. Others have proposed abandoning the concept of measuring dose at a point but rather measure dose over a volume coinciding with the detector's sensitive volume, an approach particularly useful for plan-class specific reference fields. The energy dependence of dosimeters like diodes can be dealt with by cross-calibrating them against ion chambers at an intermediate field, small enough to contain negligible head scatter contribution but large enough to exhibit lateral charged particle equilibrium and minimal volume averaging for the ion chamber.
The second part of the presentation will deal with the proposed formalism [3] and review the status of data collection from the literature and recent experimental and Monte Carlo work to derive the necessary correction factors for its application. Based on a discussion of uncertainty requirements of small and composite fields the significance of perturbations emerging from those data is evaluated. The general observation is that for most machine specific or intermediate reference fields and plan-class specific reference fields the correction factors are within 1-2% from unity while for relative field output factors in small fields down to 5 mm field size perturbations are still within a manageable limit of 5% for detectors that exhibit sufficiently low volume averaging and are not too much affected by e.g. high-Z metallic electrodes and cable currents. In general these observations indicate that it is well feasible to apply the formalism but that more data are needed for pinning down correction factors within uncertainty levels of a few tenths of a percent.
REFERENCES
[1] ANDREO, P., BURNS, D. T„ HOHLFELD, is... HUQ, M. S„ KANAI, T„ LAITANO, F„ SMYTH, V. G. AND VYNCKIER, S., Absorbed dose determination in external beam radiotherapy: an international code of practice for dosimetry based on standards of absorbed dose to water, IAEA Technical Report Series 398, IAEA, Vienna, Austria (2000).
[2] ALMOND, P. R„ BIGGS, P. J., COURSEY, B. M„ HANSON, W. F„ SAIFUL HUQ, M„ NATH, R. AND ROGERS, D. W. 0., AAPM's TG-51 protocol for clinical reference dosimetry of high-energy photon and electron beams, Med. Phys. 26:1847-70 (1999).
[3] ALFONSO, R„ ANDREO, P., CAPOTE, R. SAIFUL HUQ, ML, KILBY, W„ KJALL, P., MACKIE, T. R„ PALMANS, H„ ROSSER., K„ SEUNTJENS, J., ULLRICH, W. AND VATNITSKY, S., A new formalism for reference dosimetry of small and non-standard fields, Med. Phys. 35:5179-5186 (2008).
60
IDOS, Vienna, 9-12 November 2010 E2-CN-182, Paper No INV009
On the implementation of a recently proposed dosimetric formalism to a robotic radiosurgery system
E. Pantelis3, W. Kilbyb, A. Moutsatsos3, K. Zourari3, P. Karaiskos3, P. Papagiannis3, C. Antypasc, C. Hourdakis''
3 Medical Physics Laboratory, Medical School, University of Athens, 75 Mikras Asias, 115 27 Athens, Greece
b Accuray Inc., Sunnyvale, California 94089
cCyberKnife center, Iatropolis - Magnitiki Tomografia, 54 - 56 Ehtnikis Antistaseos, 152 31, Athens, Greece
d Ionizing Radiation Calibration Laboratory, Greek Atomic Energy Commission (GAEC), Agia Paraskevi, 153 10 Athens, Greece
E-mail address of main author: [email protected]
This work seeks to implement a recently proposed dosimetric formalism for the reference dosimetry of small and non-standard fields [1] in a CyberKnife1 Robotic Radiosurgery System.
Calibration dosimetry measurements were performed in the non-standard, 60 mm diameter, machine specific reference (msr) field using a Farmer ion chamber (PTW-31013), five cylindrical chambers with cavity lengths ranging from 16.25 mm down to 2.7 mm and alanine dosimeters. Comparison of the Farmer dose response with corresponding results using the alanine pellets was performed to establish the chamber's msr correction factor according to the proposed dosimetric formalism. The Farmer chamber dose response was also compared against corresponding results of the smaller cavity length cylindrical chambers to assess the volume averaging effect.
Output factor (OF) measurements were performed for the 5 mm, 7.5 mm, 10 mm and 15 mm diameter small fields using two microchambers, three diode detectors, alanine dosimeters, TLD microcubes and EBT Gafchromic films. Appropriate correction factors were calculated for the ion chamber and diode detector OF measurements using, a published Monte Carlo- based method [2], Corresponding volume average correction factors were calculated for the alanine output factor measurements using the 3D dose distributions measured with polymer gel dosimeters. These correction factors were applied to diode, microchamber and alanine OF measured results to account for the changes in detectors response according to the new dosimetric formalism. The accuracy of the calculated correction factors was validated by comparing the diode, microchamber and alanine dosimeters corrected OF values and the corresponding results measured using TLD and EBT film water equivalent dosimeters.
Farmer chamber and alanine reference dosimetry results were found in close agreement, yielding a J^ f nsr ' f' -ef
correction factor of ,2 - 0.999 ± 0.016 for the chamber readings. These results were also found to be in agreement within experimental uncertainties with corresponding results obtained using the shorter cavity length ionization chambers. The mean measured dose values of the latter however, were found to be consistently greater than that of the Farmer chamber. This finding, combined with an observed inverse relationship between the mean measured dose and chamber cavity length that follows the trend predicted by theoretical volume averaging calculations in the msr field [3], implies that the
f nsr ' f' -ef Farmer 2,„s, ,2 correction is greater than unity. Regarding the output factor results, deviations as large as 33% were observed between the different dosimeters used. These deviations were
61

substantially decreased when appropriate correction factors were applied to the measured microchamber, diode, and alanine values. After correction, all diode and microchamber measured output factors agreed within 1.6% and 3.1% with the corresponding alanine and TLD measurements, respectively. The weighted mean output factors were 0.681 ± 0.001, 0.824 ± 0.001, 0.875 ± 0.001 and 0.954 ± 0.001 for the 5 mm, 7.5 mm, 10 mm and 15 mm beams, respectively.
In conclusion, this work showed that the Farmer chamber can be used for reference dosimetry in the msr field of this treatment delivery system. The reference dosimetry results of this work obtained using chambers with different cavity lengths, combined with previous literature findings [4], suggest
f nsr ' f' -ef that a — Farmer chamber dose response correction factor of 1.01 may improve calibration
J^ f >nsr ' f i'i measurement accuracy. The & correction is less than 0.5% for ion chambers with cavity lengths less than 10 mm. Substantial improvements in small field output factor measurement accuracy can be obtained when using microchambers and diodes by applying appropriately calculated correction factors to the detector measurements according to the proposed dosimetric formalism, and their routine use is therefore recommended.
REFERENCES
[1] ALFONSO, R„ ANDREO, P., CAPOTE, R, HUQ, M. S„ KILBY, W„ KJALL, P., MACKIE, T. R„ PALMANS, H„ ROSSER, K„ SEUNTJENS, J., ULLRICH, W„ AND VATNITSKY, S„ A new formalism for reference dosimetry of small and nonstandard fields, Medical Physics 35 (2008) 5179-5186.
[2] FRANCESCON, P., CORA, S„ AND CAVEDON, C„ Total scatter factors of small beams: a multidetector and Monte Carlo study, Medical Physics 35 (2008) 504 - 513.
[3] KAWACHI, T„ SAITOH, H„ INOUE, M., KATAYOSE, T„ MYOJOYAMA, A., AND HATANO, K., Reference dosimetry condition and beam quality correction factor for CyberKnife beam, Medical Physics 35 (2008) 4591-4598.
[4] ARAKI, F., Monte Carlo study of a Cyberknife stereotactic radiosurgery system, Medical Physics 33 (2006) 2955-2963.
62
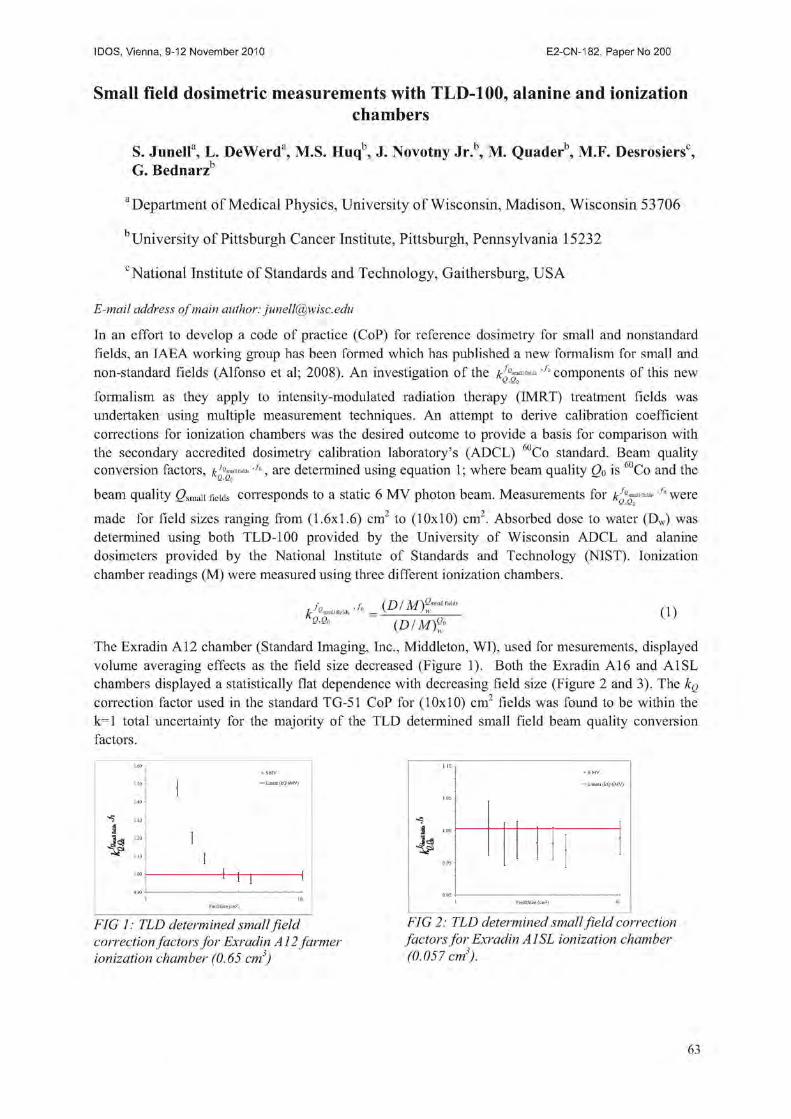
IDOS, Vienna, 9-12 November 2010 E2-CN-182, Paper No INV009
Small field dosimetric measurements with TLD-100, alanine and ionization chambers
S. Junell3, L. DeWerd3, M.S. Huqb, J. Novotny Jr.b, M. Quaderb, M.F. Desrosiersc, G. Bednarz
a Department of Medical Physics, University of Wisconsin, Madison, Wisconsin 53706
b University of Pittsburgh Cancer Institute, Pittsburgh, Pennsylvania 15232
c National Institute of Standards and Technology, Gaithersburg, USA
E-mail address of main author: [email protected]
In an effort to develop a code of practice (CoP) for reference dosimetry for small and nonstandard fields, an IAEA working group has been formed which has published a new formalism for small and non-standard fields (Alfonso et al; 2008). An investigation of the 11MiI "f° components of this new
Q>Q o
formalism as they apply to intensity-modulated radiation therapy (IMRT) treatment fields was undertaken using multiple measurement techniques. An attempt to derive calibration coefficient corrections for ionization chambers was the desired outcome to provide a basis for comparison with the secondary accredited dosimetry calibration laboratory's (ADCL) 6GCo standard. Beam quality conversion factors, J", are determined using equation 1; where beam quality Q0 is " Co and the beam quality t?smaii fiejas corresponds to a static 6 MV photon beam. Measurements for j^V™' /o were L 1VXV- L I O U I V111V11 lO AV/A r ^smnW fifties 1
made for field sizes ranging from (1.6x1.6) cm2 to (10x10) cm2. Absorbed dose to water (Dw) was determined using both TLD-100 provided by the University of Wisconsin ADCL and alanine dosimeters provided by the National Institute of Standards and Technology (NIST). Ionization chamber readings (M) were measured using three different ionization chambers.
= (1) % a
(/) Mf
The Exradin A12 chamber (Standard Imaging, Inc., Middleton, WI), used for mesurements, displayed volume averaging effects as the field size decreased (Figure 1). Both the Exradin A16 and A1SL chambers displayed a statistically flat dependence with decreasing field size (Figure 2 and 3). The k0
correction factor used in the standard TG-51 CoP for (10x10) cm2 fields was found to be within the k=l total uncertainty for the majority of the TLD determined small field beam quality conversion factors.
1.60
1.50 • 6MV
—linear (kQ6MV)
field
s
J <3 ! u . !
! i 1 i 1 10
Field Size (cm2}
FIG 1: TLD determined small field correction factors for Exradin A12 farmer ionization chamber (0.65 cm3)
FIG 2: TLD determined small field correction factors for Exradin A1SL ionization chamber (0.057 cm3).
63

. J«s
—Linear (kQ 6 MV)
Field Size (cm2)
FIG 3: TLD determined small field correction factors for Exradin A16 ionization chamber (0.007 cm3).
Alanine Field Dose measured Diff. from pellet size by NIST 40 Gy No. |mni| [Gy] [%1 10 16x16 38.03 -4.9 11 16x16 38.51 -3.7 12 16x16 38.35 -4.1 13 32x32 39.23 -1.9 14 32x32 39.35 -1.6 18 48x48 39.37 -1.6 TABLE 1: ALANINE PELLET IRRADIATION RESULTS.
The TLD-100 chips were found to have an average standard deviation (reproducibility) of -1.5%. Error bars in Figures 1 to 3 represent the dose to water uncertainty at k=l. The combined standard uncertainty is ~3-4%. Alanine pellets provided by NIST were irradiated with the same method as the TLDs. They were each given a dose of 40 Gy and returned to NIST to be read. The results are shown in Table 1 and show a discrepancy of up to 4.9% between the measured and delivered doses, with the largest discrepancies for the (16 x 16) mm2 field. (Table 1). We can conclude that TLDs and alanine do not have the precision required to measure the ionization chamber beam quality conversion factors with the desired precision of less than 1%.
Future work will include measurements for composite small field treatments or Plan Class Specific Reference Fields (PCSR) as outlined in the proposed IAEA small field dosimetry protocol. The precision of TLDs and alanine in composite fields as opposed to single static field is not expected to differ much. Measurements will be made to verify this hypothesis and results from these measurements will also be used in future research as benchmarks for Monte Carlo simulations. A small phantom was developed for these measurements (Figure 4). A head and neck IMRT plan will be used as the example treatment field. The plan will be designed such that the central region of the composite field where the detectors are located will receive a uniform dose. Measurements will be taken at every step in the calibration transfer process (Figure 5). This chain starts at standard chamber calibration procedures of 5 cm depth in water for a (10x10) cm2 field in 60Co and ends with the chamber in phantom in a PCSR field.
FIG 4: Acrylic phantom with a diameter of 10 cm and a length of 10 cm. Inserts are availiable to accommodate a variety of detectors including TLDs, alanine, film, and ionization chambers (Standard Imaging, Inc., Middleton, WI).
FIG 5: Flow chart of ionization chamber calibration transfer from 60 Co to PCSR fields.
64

IDOS, Vienna, 9-12 November 2010 E2-CN-182, Paper No INV009
Application of a new formalism for dose determination in Tomotherapy HiArt
M.C. Pressello' C. De Angelis<2), R. Rauco' D. Aragno* M. Betti D. Viseonii' E. Santini(1)
' 0 Department of Medical Physics, Azienda Ospedaliera San Camillo Forlanini, Rome-Italy, (2) Department of Technology and Health, Istituto Superiore di Sanita, Rome-Italy
E-mail address of main author: [email protected]
Tomotherapy HiArt (TTHA) is a machine designed for image guided intensity modulated radiation therapy for cancer patients. TTHA radiation delivery modality is very complex, being a combination of rotation of the source, translation of the couch and fast binary movement of 64 pairs of leaves producing a very high number of beamlets (~107).
The application of international Codes of Practice for absolute dose determination for TTHA is a challenge because of the machine architecture that makes not feasible the recommended reference conditions. It cannot provide a 10 cm x 10 cm field and absolute dose determination in water is difficult because of the small diameter of the bore, forcing the user to perform absolute calibration in non standard geometric conditions. Moreover, the lack of flattening filter leads changes in lateral profile of the photon fluence compared to a conventional linear accelerator (Linac), adversely affecting the homogeneity of the dose profile along the length of detector sensitive volume and making critical the choice of the ionization chamber with the appropriate sensitive volume. In addition, energy spectrum modification in Linacs without flattening filter has been demonstrated [1] to have an effect on the strength of relationship between beam quality indexes TPR20,10 and %dd(10) and the beam quality correction factors K Q Q 0 and K 0 for IAEA398 [2] and AAPMTG51 [3], respectively.
Some authors carried out Monte Carlo simulation to determine correction factors for limited number of ionization chambers in order to apply the conventional Cops to TTHA for absorbed dose measurements [4, 5]. Some authors used those data for absolute dose determination [6], whereas other authors measured chambers correction factors by direct calibration against alanine dosimeters [7].
Recently, a new formalism for absolute dose determination in non standard field was proposed by IAEA group [8]. It provides a comprehensive and effective extension of IAEA398 [2] for the dose determination in complex radiotherapy machines.
The aim of this paper is to investigate the dosimetric effects on several ionization chambers due to specific modality of TTHA radiation delivery. The application of the new IAEA formalism to absolute dose determination at static and helical IMRT fields of TTHA is reported and compared the other methods proposed in literature [4, 5].
At our knowledge, a complete and systematic application of the new formalism at TTHA has not been yet addressed, although some authors [9] are carrying out MC simulation to compute correction factors suggested by Alfonso.
Yj™*J™f fcfpcsrJmsr In this work a n c j .<•',„., factors, as defined in the new formalism, were determined with an experimental approach, performing measurement in water phantom using, as reference dosimetry, alanine/EPR system operating at the Istituto Superiore di Sanita, Italian National Institute of Health, and traceable to the Italian Primary Standard Dosimetry Laboratory (INMRI-ENEA) [10]. Pinpoint, Farmer and A1SL Exradin ionization chambers were investigated.
65

According to the new formalism, a machine specific reference field was defined and the correction
factor, , for ionization chambers was determined to account for the beam variations due to the non-conventional reference conditions at TTHA with respect to a Siemens Linac IAEA reference conditions (see Table 1). In addition, a set of composite plan class specific reference fields, pcsr, close to typical clinical treatment was defined (varying field dimension and pitches values) and the
j^. fpcsr if msr corresponding were found out. Finally, for an actual treatment, dose was determined in water with alanine and compared to that evaluated with ionization chamber applying the new formalism. Preliminary results for Farmer chamber are reported in Tables 2 and 3 for static and dynamic fields, respectively.
Table 1. Reference conditions for dose determination at Linac and at TTHA. Siemens LINAC TTHA
Field dimension 10x10 cm2 5x10 car
SSD; SCD 90 cm; 100 cm 75 cm; 85 cm
Nominal energy 6 MV (TPR20,10=0.674) 6VIV cmuo.io' =0.613)
Nominal Dose rate 200 cGy/min 800 cGy/min
Table 2. Dose determination at TTHA reference field with different methods compared with alanine route.
Dose (Gy)
(Jeray2005)
Dose (Gy)
(Thomas 2005)
Dose (Gy)
(alanine)
Farmer chamber 9.90 9.94 10.15
Yj™*J™F FCFPCSR JREF Table 3. Correction factors & and Qpc""Q for static and composite beam reference dosimetry.
TT fmsr.fref ^Q„„r,Q
J^ fpcsr,fref
Qpcsr-B ( p c s r l
)
J^ fpcsr ,fref Qpcsr-e (P c s r2
)
J^. fpcsr ,fref Qpcsr-e , | > C s r 3
)
J^. fpcsr,fref a per-a (Pcs r4
)
Farmer chamber 1.018 0.982 0.993 1.013 1.021
66

REFERENCES
[1] G. XIONG and D. W. O. ROGERS, Relationship between %dd„10...x and stopping-power ratios for flattening filter free accelerators: A Monte Carlo study Med. Phys. 35, 2008
[2] P. ANDREO, D.T. BURNS, K. HOHLFELD, M.S. HUQ, T. KANAI, F. LAITANO, V.G. SMYTHE, and S.VYNCKIER, Absorbed dose determination in external beam radiotherapy, IAEA Technical Report No. 398; 2000
[3] P. R. ALMOND, P. J. BIGGS, B.M. COURSEY, W. F. HANSON, M.S. HUQ, R. NATH, D. W. ROGERS, AAPM's TG51 protocol for clinical reference dosimetry of high-energy photon and electron beams, Med. Phys. No.26, 1999
[4] R. JERAJ, T.R. MACKIE, J. BALOG, G. OLIVERA, Dose calibration of non-conventionaltreatment systems applied to helical Tomotherapy, Med. Phys. , 2005,
[5] S. D. THOMAS, M. MACKENZIE, D. W. O. ROGERS, B. G. FALLONE, A Monte Carlo derived TG-51 equivalent calibration for helical Tomotherapy, Med. Phys.32, 2005
[6] C, J. BAILAT, T. BUCHILLIER, M. PACHOUD, R. MOECKLI, F. O. BOCHUD_ An absolute dose determination of helical tomotherapy accelerator, TomoTherapy High-Art II Med. Phys. 36 , 2009
[7] S. DUANE, D. NICHOLAS, H. PALMANS, B. SCHAEKEN, J. SEPHTON, P. SHARPE, R. THOMAS, M.TOMSEJ, D. VERELLEN, S. VYNCKIER, Dosimetry audit for Tomotherapy using alanine/EPR, Med.Phys. 33, 2006
[8] R. ALFONSO, P. ANDREO, R. CAPOTE, M. SAIFUL HUQ, W. KILBY, P. KjALL, T.R. MACKIE, H.PALMANSA, K. ROSSER, J. SEUNTJENS, W. ULLRICH, S. VATNITSKY, A new formalism for referencedosimetry of small and nonstandard fields, Med. Phys. 35, 2008
[9] E. S. STERPIN, T. R. MACKIE, W. LU, G. H. OLIVERA, S. VYNCKIER.Calculation of K Correction Factors with Monte Carlo Simulations in Tomotherapy Clinical Helical . Int J. R One Biol Phys 75, 3 Supplement 2009
[10] S. ONORI, E. BORTOLIN, A. CALICCHIA, A. CAROSI, C, DE ANGELIS, S. GRANDE, Use of the commercial alanine and TL dosemeters for dosimetry intercomparisons among the Italian radiotherapy centres, Rad. Prot. Dosim. 120, 2006
67

IDOS, Vienna, 9-12 November 2010 E2-CN-182, Paper No INV009
Advanced dosimetry techniques for accurate verification of non-standard beams
E. Chunga, E. Soissona b, H. Bouchardt d, J. Seuntjensa
aMcGill University, Montreal, QC, Canada
bMcGill University Health Centre, Montreal, QC, Canada cUniversite de Montreal, Montreal, QC, Canada dCentre Hospitalier de l'Universite de Montreal, Montreal, QC, Canada
E-mail address of main author: [email protected]
The purpose of this work is to apply established reference dosimetry techniques [1] for the verification of various nonstandard field deliveries.
A cylindrical polymethyl methacrylate (PMMA) phantom filled with water was constructed in the center of which absorbed dose to water was measured. Two candidate plan-class specific reference (pcsr) fields [2] for (i) linear accelerator (a Varian' Clinac1M 6 EX linear accelerator)-based and (ii) TomoTherapy®-based typical head and neck IMRT deliveries were planned. The absorbed dose to water in each pcsr field normalized to that in a reference 10x10 cm2 field was measured using: (i) Gafchromic EBT films, a diamond detector, and a guarded liquid-filled ionization chamber [3] for the linac-based IMRT delivery and (ii) a PTW microLion chamber for the TomoTherapy®-based IMRT
f f delivery. Based on the new dosimetry formalism [2], pcsr correction factors k j : ' j were measured
for five air-filled ionization chambers (Exradin A12, NE2571, Exradin A1SL, Exradin A14 and PinPoint 31006) in fully rotated and collapsed deliveries for the linac-based IMRT delivery and only in a fully rotated delivery for the TomoTherapy -based IMRT delivery. For each ionization chamber,
f f
the expected correction factor kj ' lfg in idealized (gradient-free) conditions was also determined. Details of calculating the expected theoretical correction factor have been published elsewhere [1,4].
f f For the linac-based IMRT delivery, the correction factor kj""'q in the fully rotated delivery was the
same (0.9955-0.9986) within the measurement uncertainty of 0.3 % [1], as plotted in Fig. 1(a). However, the measured correction factor is systematically lower than that in ideal conditions. This suggests that the dose distribution of the pcsr field is not perfectly uniform over the measurement region. In the collapsed delivery, the correction factor is more chamber-type depedent (0.9960-1.0048). This is attributed to the effect of systematic residual gradient effects on the smaller chambers, i.e., Exradin A1SL, Exradin A14 and PinPoint® 31006.
As shown in Fig. 1(b), the correction factor kjj"*'^ for the TomoTherapy®-based IMRT delivery is very similar for the Exradin A12 and NE2571 Farmer-type chambers (1.0043 and 1.0037, respectively) and the smaller chambers (1.0071-1.0076) with a measurement uncertainty of 0.3 %. However, the correction factor differs by 0.33 % between the Farmer-type and smaller chambers. The measured correction factors for the Farmer-type chambers agree well with the predicted ones, whereas those for the smaller chambers are 0.5-0.6 % greater than the expected correction factors. We speculate that the lower gradient integration effect to the smaller chambers may lead to more significant and variable correction factor.
Further study is required to investigate the difference of the pcsr correction factors between the measurement and expectation in idealized conditions, especially for the smaller chambers.
69
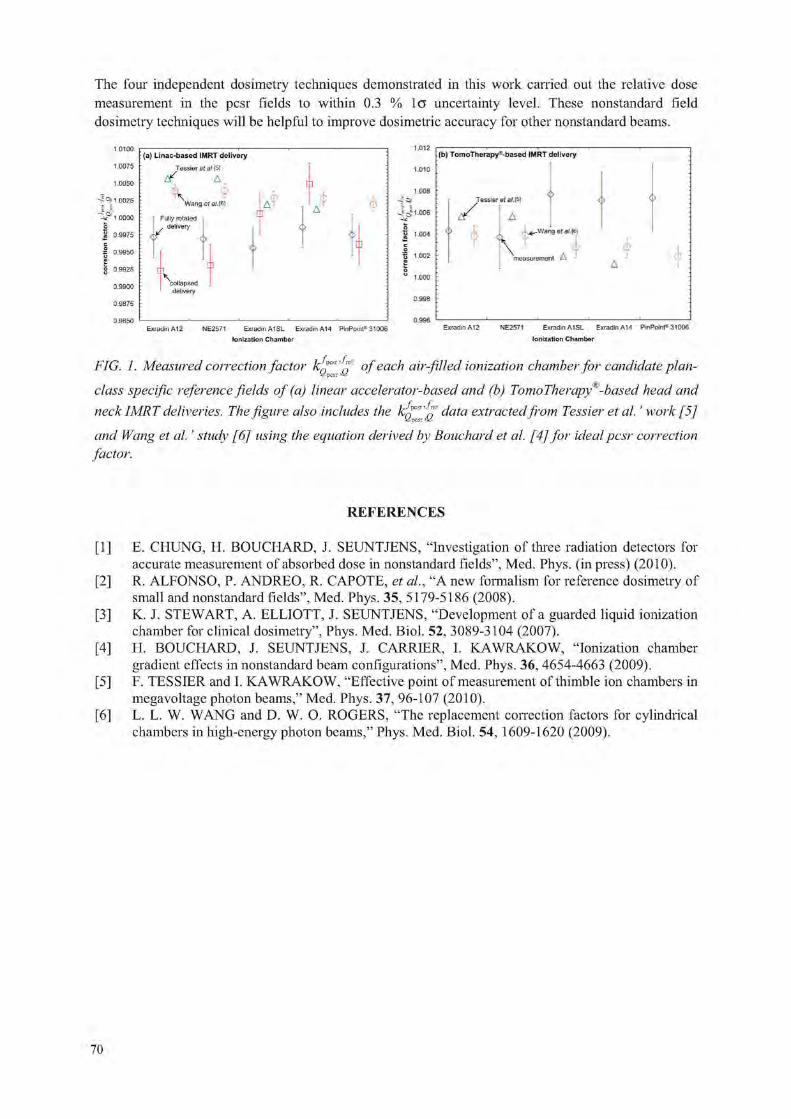
The four independent dosimetry techniques demonstrated in this work carried out the relative dose measurement in the pcsr fields to within 0.3 % lo uncertainty level. These nonstandard field dosimetry techniques will be helpful to improve dosimetric accuracy for other nonstandard beams.
1.0100
1.0075
1.0050
- 1 0025 imoo
o | 0.9975 c
| 0.9950
6 0.9925
0.9900
0.9875
0.9H50
{a} Linac-based IMRT delivery Tessier etal.[5\
ttf A \
Wang efa/.[6} A o T Fully rotated
delivery
¥
cralapsed
Exiadin A12 NE2571 Exradin A1SL Exfadin A14 PinPoirti 31006
1.012
1.010
1.008
-J -J1.006
0 "3 1.004
1 1.002
o
" 1.000
0.998
0.996
:(b) TomoTh erapy '-based IMRT delivery
i z /
Jessier et al. [5]
A
0 \ .-.^V/ang et at. [6]
measurement A
Ionization Chamber
Exradin A12 NE2571 ExradinAISL ExradinA14 PinPoint® 31006
Ionization Chamber
f f FIG. 1. Measured correction factor k ^ p °feac^ air-fiHed ionization chamber for candidate plan-class specific reference fields of (a) linear accelerator-based and (b) TomoTherapy*'-based head and
f f neck IMRT deliveries. The figure also includes the k j d a t a extracted from Tessier et al.' work [5] and Wang et al.' study [6] using the equation derived by Bouchard et al. [4] for ideal pcsr correction factor.
REFERENCES
[1] E. CHUNG, H. BOUCHARD, J. SEUNTJENS, "Investigation of three radiation detectors for accurate measurement of absorbed dose in nonstandard fields", Med. Phys. (in press) (2010).
[2] R. ALFONSO, P. ANDREO, R. CAPOTE, et al., "A new formalism for reference dosimetry of small and nonstandard fields", Med. Phys. 35, 5179-5186 (2008).
[3] K. J. STEWART, A. ELLIOTT, J. SEUNTJENS, "Development of a guarded liquid ionization chamber for clinical dosimetry", Phys. Med. Biol. 52, 3089-3104 (2007).
[4] H. BOUCHARD, J. SEUNTJENS, J. CARRIER, I. KAWRAKOW, "Ionization chamber gradient effects in nonstandard beam configurations", Med. Phys. 36, 4654-4663 (2009).
[5] F. TESSIER and L K AWRAKOW, "Effective point of measurement of thimble ion chambers in megavoltage photon beams," Med. Phys. 37, 96-107 (2010).
[6] L. L. W. WANG and D. W. O. ROGERS, "The replacement correction factors for cylindrical chambers in high-energy photon beams," Phys. Med. Biol. 54, 1609-1620 (2009).
70

Parallel Session 4b
Internal Dosimetry: Patient Specific Methods

IDOS, Vienna, 9-12 November 2010 E2-CN-182, Paper No INV009
Imaging based, patient specific dosimetry
M. Ljungberg, K. Sjogreen-Gleisner
Dept of Medical Radiation Physics Clinical Sciences, Lund Lund University SE-221 85 Lund, Sweden
E-mail address of main author: [email protected]
The prognosis of achieving longtime remission for disseminated cancer disease is in many cases poor. A systemic treatment is required and therefore external beam radiation therapy is less suited. Treatment with radiolabeled pharmaceuticals, so called radionuclide therapy is such a systemic treatment. In radionuclide therapy, the absorbed dose is delivered by administration of radionuclides that emit electrons or alpha particles. It is here assumed that the released kinetic energy is transferred by interactions to sensitive parts of the cells activating cell death, and thus an accurate dosimetry is important. However, absorbed dose planning for radionuclide therapy is a real challenge in that the source cannot be turned on or off (as in external beam therapy) but decays exponentially with characteristics depending on the biokinetics and the radionuclide half-life. On a small-scale, the radiopharmaceutical is also heterogeneously distributed which means that the energy deposition is generally nonuniform. The biokinetics may also change over time which means that activity measurements need to be made at several time points to estimate the total amount of released energy in an organ or tumour. Practical issues regarding the number of measurements and patient mobility may therefore limit the accuracy in this calculation. The dose-rate for radionuclide therapy is also much lower than in external beam therapy. Since the treatment is systemic, circulating activity may result in absorbed doses to normal organs and tissues. Often this poses a problem and puts a limit on the amount of activity to can be administered. This is one of the major reasons for the requirement of an accurate patient-specific dosimetry.
One of the major problems is that the biokinetics varies between patients and the activity uptake and clearance should therefore be measured for each individual patient in order to estimate the total number of decays in a particular organ/tissue. The way that this can be performed is either by sequential planar scintillation camera measurements or by SPECT methods. Scintillation cameras generally have a low spatial resolution and sensitivity (cps/MBq) due to the collimator. The resolution is in order of 1-2 cm depending on the source location and radionuclide characteristics. Image noise is also a major problem since only a small activity is given for pre-planning which can degrade the image quality.
Dosimetry using 2D planar imaging and the conjugate-view activity quantitation method have been used for many years. The quantification of the activity includes several approximations. In a planar acquisition the source depth in the patient is not resolved which makes the correction for photon attenuation and unwanted contribution from scattered photons to the image less accurate and consistent. Furthermore, contributions from activity uptakes that overlap the volume of interest in the image is a major problem. For calculation of the absorbed dose, the organ mass also needs to be determined, which can be made using patient CT images, or, using less accurate estimations from standardized phantom geometries. The energy deposition and transport is done based on pre-calculated dose factors from standardized phantom geometries. Despite these problems, the conjugate-view method has been the major choice for many dosimetrical studies.
73

SPECT provide a possibility for 3D activity measurements. In this method, correction for non-homogeneous photon attenuation, scatter and loss of spatial resolution due to the collimator are today quite accurate when incorporated in iterative reconstruction methods. SPECT also allows for an accurate 3D absorbed dose calculation in that the patient's geometry can be taken into conseration if a co-registered CT study of the patient is available. Modern hybrid SPECT/CT cameras make such calculations relatively straight-forward. A major advantage using SPECT imaging is also that the absorbed dose calculation is on a voxel-level which may reduce the need for an accurate organ delineation and problems due to partial-volume effects. Dose-volume histograms are possible to obtain. However, a limitation with the SPECT based method is the small axial field-of-view (about 40 cm) of a SPECT camera.
Image-based absorbed dose calculations can be made either by convolution methods using pre-calculated dose kernels for photons and electrons or by implementing foil Monte Carlo calculations where each individual particle is simulated until termination and the energy released in each interaction site is scored in individual voxels. Here, a quantitative accurate SPECT study of the activity distribution an and registered CT study describing the patient's specific geometry are used as input. The main advantage of Monte Carlo simulations as compared to convolution methods is that non-homogeneities and boundary is included in the calculation. However, such simulations take considerable longer time to perform.
This presentation with focus on describing the different methods that today is used for 2D and 3D image-based patient specific dosimetry calculations and link the description of these methods to examples of clinical studies that are ongoing at the Lund University Hospital.
74

IDOS, Vienna, 9-12 November 2010 E2-CN-182, Paper No INV009
Good practice of clinical dosimetry reporting
M Lassmann3, C. Chiesab, M. Bardies"
a Department of Nuclear Medicine, Uni versity of Wtirzburg, Germany
bNuclear Medicine Unit, Foundation IRCCS Istituto Nazionale Tumori, Milan, Italy
CINSERM, UMR 892, Nantes, France
E-mail address of main author: [email protected]
A lot of recent publications in Nuclear Medicine contain data on dosimetric findings for existing or new, diagnostic or therapeutic agents. In many of those articles, however, the description of the methodology applied for dosimetry is lacking or omitting important details.
Our intention is to guide the user through a series of suggestions for reporting dosimetric approaches. The authors are aware of the large amount of data required to report the way a given clinical dosimetry procedure was implemented. Another aim of this guidance document is to provide comprehensive information for preparing and submitting publications and reports containing data on internal dosimetry.
The items addressed in this guidance document on good practice of clinical dosimetry reporting could also be used as a checklist by reviewers of manuscripts submitted to scientific journals or grant applications. In addition, this document could be used to decide which data are useful for a documentation of dosimetry results in individual patient records. This may be of importance whenever the approval of a new radiopharmaceutical by official bodies such as EMEA or FDA is envisaged.
In detail the following items are addressed:
a) Equipment
This includes but is not limited to summarize the kind of equipment used for the study and the appropriate quality control measures taken.
b) Image Quantification
This includes acquisition settings and the corrections performed (e.g. attenuation, scatter, dead time, processing parameters for SPECT or PET, background) in addition to the calibration of the devices used.
c) Biokinetics
The number of data points per patient needs to be documented as well as the integration and fitting procedure of the time-activity curves. The way the data are extrapolated after the last measured data point also needs to be documented.
d) Dosimetry calculations
All the steps leading to a final calculation of the absorbed dose should be given for individual patients. If results are expressed in Gy/MBq, then the injected activity should also be reported. Care should be taken that the significant numbers of digits in the resulting values for absorbed doses do not exceed the errors of the underlying process. If possible, errors margins including the results of a propagation of error calculation should be included.
75
e) Miscellaneous items
In some cases confounding factors such as the use of recombinant human TSH in the case of differentiated thyroid cancer or renal protection agents (e.g. sometimes used during treatments with radiolabeled peptides) might alter the biokinetics of a given radiopharmaceutical. This information should be provided.
Acknowledgment
This work was developed under the supervision of the dosimetry committee of the EANM (K. Bacher, M Bardies, C Chiesa, G Flux, M. Konijnenberg, M Lassmann, S. Palm [Observer of the IAEA], S-E Strand, L. Strigari).
76
IDOS, Vienna, 9-12 November 2010 E2-CN-182, Paper No INV009
Pitfalls in patient specific dosimetry
A. M. Fadel1, R. C. Cabrejas2, G. Chebel1, M. L. Cabrejas3
1 Hospital Durand. Hospital Universitario Austral,3 CNEA/Fund. Cientifica del Sur
Buenos Aires, Argentina
Introduction: 1-131 is used to treat patients with Differentiated Thyroid Cancer after thyroidectomy to eliminate the malignant tissue. The dose was calculated by the MIRD dosimetry.
The aim of this paper was to analyze the pitfalls that occurred while calculating the lesion tumoricidal dose with the objective to minimize the damage to normal organs (lung and bone marrow).
Radionuclide therapeutic activity was calculated after image quantitative analysis and treatment planning taking into account the radiobiology of the patient.
Material and methods: 30 patients with Differentiated Thyroid Cancer were studied determining whole body 1-131 retention after 3 mCi administration of this radiotracer with a planar gamma camera during 5 days or until the retained activity was less than 1 %. Images of the target and risk tissues were acquired to procure 1-131 uptake and biological half life. Blood concentration of the same isotope (% Dose/liter) was also measured at different times after the isotope ingestion.
Additional organ and metastatic tissue kinetic analysis was carried out. Accurate determination of the retained activity in the lesions is not easy to obtain on account of different factors that introduce important errors which have to be corrected: a) tissue Attenuation, b) Scattering, c) Collimator Septal penetration and d) Partial Volume Effect.
The quantification of the activity in the lesions was performed by determining the uptake in a region of interest (ROI) corresponding to the tissue to be evaluated and comparing its activity with a known standard.
From the isotope "Residence Time" in the whole body, the blood kinetic data and the application of the MIRD software, the maximum treatment dose that could be administered to the patient without producing injury to normal tissues, was established.
Influence of other factors were also evaluated: a) Instrument dead time contribution on whole body uptake determination, b) Amount of 1-131 administered activity to avoid stunning effects, c) Correct organ activity determination after instrument sensitivity stability, attenuation, scattering, collimator penetrating effect of the radiation and partial volume effect correction, d) correct blood sample anticoagulation to keep the blood homogeneity, e) Time choice for correct kinetic curve parameter determination, f) Image processing filters affecting organ volume size and ROI border limits determination, g) Choice of the standard sample for comparison with 100% of the administered activity.
Experimental measurement errors were assessed to estimate the maximum possible error that could be accepted.
Results: Corrected and uncorrected whole body uptake images, blood sample curves and experimental error estimation are shown. The results indicate which errors have to be considered at the most.
77

Those are also the main teaching factors to be taken into account when the technique is set up in a Nuclear Medicine laboratory. Regretfully some of them are not easy to correct because they need special elements: 3 window spectrometer to correct for scattered radiation and septa penetration; phantom to determine the k factors corresponding to the scatter and septal penetration contribution in the photopeak, phantom with inserts to determine the Contrast Recovery curve to correct for Partial Volume Effect. In addition it is necessary to process the images data with the Mathlab software.
Blood
CQGD
2 3 4 Time (days)
•••*•• Patient 1 — Patient 2
FIG 1 shows the Whole Body
I
1 1 1 r -
0 1 2 3 4 5
A B
FIG 2: A: Patient measured in Photopeak window, B: Same patient with Scatter contribution and Septal penetration subtracted
Quantification Error Estimation: It was carried out with a "Data Spectum Torso Phantom" including small known volume lesions (3 ml). Images were acquired with the same technology as for patients (3 window method attenuation correction, Partial Volume Effect correction). Determined errors were 3%.
Conclusion: As a consequence of this study a training programme was written in an attempt to make useful and appropriate dosimetric studies. In the future, hybrid instruments (SPECT/CT and PET/CT) will be widely available increasing image spatial resolution, attenuation / scatter correction and processing techniques that will turn this methodology simpler.
REFERENCES
[1 ] MIRD (Medical Internal Radiation Dose) Pamphlet Na 11.
[2] MACEY ET AL. Med.Phys. 22: 1637,1995
[3] Data Spectrum Corporation
[4] The MathWorks, Inc., Web site
78

IDOS, Vienna, 9-12 November 2010 E2-CN-182, Paper No INV009
Towards patient-specific dosimetry in nuclear medicine: Associating Monte-Carlo and 3D voxel-based approaches
A. Desbreea, L. Hadida, N. Grandgirarda, N. Pierratb, H. Schlattlc, E. Blanc hardona, M. Zanklc
a Internal Dosimetry Department, Institute for Radiological Protection and Nuclear Safety, Fontenay-aux-Roses, France
h Imaging Department, Institut Curie, Paris, France c Institute of Radiation Protection, Helmholtz Zentrum Munchen-German Center for Environmental Health, Neuherberg, Germany
E-mail address of main author: [email protected]
In nuclear medicine, radiopharmaceuticals are incorporated into the body and distributed through biokinetic processes. Thus, each organ can become a source of radiation delivering a fraction of emitted energy in tissues. Therefore, internal absorbed dose must be calculated accurately and realistically to ensure the patient radiation protection. Until now, the absorbed doses were derived from standard mathematical models, in which different regions are defined by complex equations. To offer more realistic geometries of the human morphology, an alternative class of anatomical models called voxel phantoms was then developed and adopted by the International Commission on Radiological Protection (ICRP) and the International Commission on Radiation Units and Measurements (ICRU) to represent the reference adult [1],
In this context, the Internal Dose Assessment Laboratory (1RSN, France) has developed the software OEDIPE, French acronym for "tool for personalised internal dose assessment" [2,3]. This user-friendly graphical interface written using the Interactive Data Language (ITT Visual Information Solutions, USA) enables the dose evaluation in associating voxel phantoms and the MCNPX Monte-Carlo particle transport calculation code (LANL, USA) [4]. It can provide either the mean absorbed dose at the organs' level or at the voxel level, where the isodose curves are superimposed on the anatomical images.
When internal emitters are involved, the calculation of absorbed dose to radiosensitive tissues is based on the combination of biokinetics, nuclear decay data and the Specific Absorbed Fraction (SAF). This geometric parameter is defined as the fraction of energy emitted from a source organ that is absorbed by a target organ, divided by the mass of the target organ. Thus, SAFs were calculated for monoenergetic photon and electron sources for the new ICRP/ICRU adult reference phantoms using the OEDIPE software. First, the results were validated by comparison with those obtained by the German center for environmental health (HMGU, Germany) using the EGSnrc Monte-Carlo code. They showed overall agreement for photons and high-energy electrons with differences lower than 8%. Nevertheless, significant differences were found for distant organs for low-energy electrons due to large statistical uncertainties and the differences in electron transport algorithms used by EGSnrc and MCNPX. Then, for photon SAFs, the values calculated for the voxel phantoms were compared to the one derived from mathematical phantoms. It showed that for cross-fire, for many organ pairs, voxel phantom SAFs were higher than current values based on stylised models. Indeed, the inter-organ distances are larger in the mathematical phantoms than in reality, due to the simplified organ shapes that were required owing to the limited computational capacities available at the time when these models have been developed. For electron SAFs, it was assumed until now that the energy of the non-penetrating emissions was entirely deposit in the source organ. Calculations realised with Monte-Carlo codes showed that it is worthwhile to calculate electron SAFs, especially for higher electron energies and for small, not distant and walled organs.
79

In a second step, absorbed doses for different radiopharmaceuticals, currently used in nuclear medicine, were determined for the voxel reference phantoms using OEDIPE and the standard biokinetic described in ICRP publication 53, 80 or 106. They were then compared to absorbed doses for the stylised phantoms. Significant differences were found for some organs, depending on the radiopharmaceutical of interest, due to the differences in weight and distances between organs and the approximations previously used for electrons.
The contribution of reference absorbed dose values is necessary for diagnostic radiopharmaceuticals. However, the anatomical parameters can be far from the reference values, especially in the medical field. Thus, it is of interest to study the influence of the various patients' morphologies on the absorbed doses. This was achieved for different radiopharmaceuticals using the versatility of the OEDIPE software. To this aim, the biokinetic models of the ICRP were integrated and about 10 specific-patient voxel phantoms were constructed from whole-body PET/CT scans.
Finally, the use of a well-supported radiation transport code such as MCNPX with knowledge of patient anatomy and physiology will result in a significant improvement in the accuracy of personalised dose calculations, in particular in internal radiotherapy.
REFERENCES
[1] INTERNATIONAL COMMISSION ON RADIOLOGICAL PROTECTION (ICRP). Adult reference computational phantoms. 2009; Publication 110 (Oxford: Elsevier).
[2] CHIAVASSA S, AUB1NEAU-LANIECE I, BITAR A, LISBONA A, BARBET J, FRANCK D, JOURDAIN J R, BARDIES M. Validation of a personalized dosimetric evaluation tool (OEDIPE) for targeted radiotherapy based on the Monte Carlo MCNPX code. Phys.Med.Biol. 2006;51 : 601-616.
[3] CHIAVASSA S, BARDIES M, JOURDAIN J R, FRANCK D. OEDIPE: A Personalized Dosimetric Tool Associating Voxel-Based Models with MCNPX. Cancer biotherapy & radiopharmaceuticals 2005, 20(3):325-332.
[4] WATERS L S. MCNPX user's manual version 2.4.0. Los Alamos National Laboratory, Technical Report. 2002; LA-CP-02-408.
80
IDOS, Vienna, 9-12 November 2010 E2-CN-182, Paper No INV009
Clinical implementation of patient-specific dosimetry: Comparison with absorbed fraction-based methods
G. Sgouros, R.F. Hobbs, R.L. Wahl, P.W. Ladenson
Johns Hopkins University, School of Medicine, Division of Nuclear Medicine, Baltimore, USA
E-mail address of main author: [email protected]
The clinical feasibility and benefit of using 3-D, imaging-based, patient-specific dosimetry on treatment outcome should be assessed to evaluate the potential benefits of this dosimetry approach. As a first step to demonstrating clinical feasibility, we have used the previously described patient-specific dosimetry software package, 3D-RD, for the prospective calculation of the therapeutic activity administration to a pediatric thyroid cancer patient with diffuse lung metastases. The Monte Carlo-based calculation was performed in "real-time" so as to help the treating physician determine the appropriate therapeutic radioiodine activity. In this case, the constraint was on delivering no more than 27 Gy to the lungs of this patient as this has been reported as the maximum tolerated dose for normal lung. The impact of using 3D-RD in this calculation was assessed by comparing the result obtained with a MIRD whole-organ S-value-based dosimetry approach as implemented in the OLINDA dosimetry software. A substantial difference (39%) between the 3D-RD and the MIRD-based value was found when the OLINDA calculation was implemented by selecting a pediatric phantom that matched the patient's weight. In a retrospective examination of the OLINDA calculation and with the benefit of the 3D-RD analysis we identified the reason for the discrepancy and were able to reconcile the differences. Analysis of additional patient data, including the assessment of differential therapeutic outcome, is essential in evaluating the value of sophisticated but logistically demanding dosimetry approaches such as 3D-RD.
81


Plenary Session 5
External Quality Audits in Radiotherapy


IDOS, Vienna, 9-12 November 2010 E2-CN-182, Paper No INV009
The IAEA quality audits for radiotherapy
2
J. Izewska, P. Bera, G. Azangwe, S. Vatnirsky , E. Rosenblatt, E. Zubizarreta
International Atomic Energy Agency, Vienna, Austria
E-mail address of main author: [email protected] The IAEA, jointly with the World Health Organization (WHO), for over 40 years has operated a dosimetry audit service for radiotherapy using thermoluminescent dosimeters (TLD). The service is known as the IAEA/WHO TLD postal dose audits and it is one of the oldest dosimetry services in the world [1], To-date, the calibration of approximately 8000 radiotherapy beams (see Figure 1) in 1700 cancer centres in 120 countries have been audited through this service. An integral part of the auditing process is resolving discrepancies in the beam calibrations that are discovered. The discrepancies are followed-up by the IAEA [2] and local experts, and their causes are traced, understood and corrected.
0.6 !*Mg
0.4 -I 1 1 1 1 1 1 1 0 1000 2000 3000 4000 5000 6000 7000 8000
beam check nr
FIG. 1. Results of the IAEA/WHO TLD postal dose audits of radiotherapy centres for the delivery of absorbed dose to water under reference conditions during 1969-2009.
Significant improvements have been observed in dosimetry practices in radiotherapy centres worldwide. In its early years, the IAEA/WHO TLD postal dose audit service recorded approximately 50% audited centres had the adequate beam calibration used for cancer treatment. The provision of regular auditing programme over long time enables the IAEA to document that several radiotherapy centres have improved their abilities to accurately deliver the radiation dose. The percentage of acceptable results has reached 96% at present. However, 4% of the poor results remain uncorrected either due to a failure to respond to the IAEA/WHO efforts or due to local problems that could not be resolved without allocation of appropriate resources. Some centres work within practical limitations such as insufficient availability of qualified medical physicists or lack of adequate dosimetry equipment, which compromises quality. These inadequacies have to be addressed locally.
2 Former IAEA staff member
85

Another dosimetry audit programme for treatment planning in external beam radiotherapy, which has been developed by the IAEA, called TPS audit, is based on a semi-anthropomorphic phantom [3]. It assesses the radiotherapy workflow for conformal techniques, from patient data acquisition and computerized treatment planning to dose delivery. The IAEA is supporting national and sub-regional TPS audit activities to improve the quality and safety of radiotherapy in Member States. To-date, two pilot TPS audit exercises have been completed, in the Baltic States and among Hungarian radiotherapy centres. The experience gained in the pilot TPS audits [4] has highlighted the need for careful attention to basic aspects of dosimetry and treatment planning.
The third audit modality operated by the IAEA for radiotherapy is a comprehensive audit [5] that reviews radiation oncology practices in cancer centres with the aim to improve quality. The Quality Assurance Team for Radiation Oncology (QUATRO) audit makes use of high level experts in radiation oncology, medical physics and radiotherapy technology who comprise the auditing team. The QUATRO audits aim to help radiotherapy centres attain the best level of practice possible for their country. Audits assess the radiotherapy infrastructure; patient and equipment related procedures; radiation protection; staffing levels and professional training programmes for the local radiotherapy staff.
By 2010, QUATRO has conducted approximately 50 audits on request, in radiotherapy centres from Central and Eastern Europe, Asia, Africa, and Latin America. Auditors identify gaps in technology, human resources and procedures, allowing the audited centres to document areas for improvement. Some centres have been acknowledged for operating at a high level of competence, while others have received a comprehensive set of recommendations. Overall, the audits have contributed to significant improvements at centres, and to identifying common issues of concern that are being addressed internationally.
To conclude, quality audits in radiotherapy have demonstrated to be a useful tool for the improvement of radiotherapy practices in cancer centres. In particular, it is of importance for centres to have access to dosimetry auditing programmes, especially when installing new equipment and implementing new procedures.
REFERENCES
[1] IZEWSKA, J., SVENSSON, H„ IBBOTT, G„ Worldwide Quality Assurance Networks for Radiotherapy Dosimetry, Proc. Int. Symp. Standards and Codes of Practise in Med. Rad. Dosim. IAEA-CN-96/76, IAEA, Vienna (2002) 139-156.
[2] INTERNATIONAL ATOMIC ENERGY AGENCY, On-Site Visits to Radiotherapy Centres: Medical Physics Procedures, Quality Assurance Team for Radiation Oncology (QUATRO), TECDOC 1543, IAEA, Vienna (2007).
[3] INTERNATIONAL ATOMIC ENERGY AGENCY, Commissioning of Radiotherapy Treatment Planning Systems: Testing for Typical External Beam Treatment Techniques, IAEA TECDOC Series No. 1583, IAEA, Vienna (2008).
[4] GERSHKEVITCH, E„ SCHMIDT, R„ VELEZ, G., et al, Dosimetric Verification of Radiotherapy Treatment Planning Systems: Results of IAEA Pilot Study, Radioth. Oncol., 89 (2008) 338-346.
[5] INTERNATIONAL ATOMIC ENERGY AGENCY, Comprehensive Audits of Radiotherapy Practices: A Tool for Quality Improvement, Quality Assurance Team for Radiation Oncology (QUATRO), IAEA, Vienna (2007).
86

IDOS, Vienna, 9-12 November 2010 E2-CN-182, Paper No INV009
Credentialing institutions for advanced technology clinical trials
G. Ibbott
UT MD Anderson Cancer Center - Radiological Physics Center, Houston, USA
E-mail address of main author: [email protected]
The Radiological Physics Center (RPC) is responsible for credentialing institutions to use advanced technologies in radiation therapy clinical trials sponsored by the US National Cancer Institute (NCI). The RPC was founded in 1968 and has functioned continuously for 42 years to support NCI-sponsored clinical trials. The focus of this presentation is on the RPC's evaluation of advanced technology radiation therapy. The use of the RPC's benchmarks and anthropomorphic phantoms has revealed a number of interesting observations about the delivery of IMRT and SBRT, some of which have caught the attention of the public and the news media. Medical physicists should be aware of, and understand these results.
At institutions that participate in NCI-sponsored clinical trials, the RPC monitors the basic machine output and brachytherapy source strengths, the dosimetry data utilized by the institutions, the calculation algorithms used for treatment planning, and the institutions' quality control procedures. The methods of monitoring include on-site dosimetry review by an RPC physicist, and a variety of remote audit tools. During the on-site evaluation, the institution's physicists and radiation oncologists are interviewed, physical measurements are made on the therapy machines, dosimetry and quality assurance data are reviewed, and patient dose calculations are evaluated. The remote audit tools include 1) mailed dosimeters evaluated on a periodic basis to verify output calibration and simple questionnaires to document changes in personnel, equipment, and dosimetry practices, 2) comparison of dosimetry data with RPC "standard" data to verify the compatibility of dosimetry data, 3) evaluation of reference and actual patient calculations to verify the validity of treatment planning algorithms, and 4) review of the institution's written quality assurance procedures and records. Mailable anthropomorphic phantoms are also used to verify tumor dose delivery for special treatment techniques. Any discrepancies identified by the RPC are pursued to help the institution find the origin of the discrepancies and identify and implement methods to resolve them. The RPC has recently extended all of the monitoring and credentialing programs to include proton beam facilities.
Institutions are required to irradiate an anthropomorphic phantom to participate in certain clinical trials that involve advanced technologies such as IMRT and SBRT. The institution must handle the phantom as if it were a patient; they perform a CT simulation, develop a treatment plan, and then deliver the treatment according to their plan. The phantom is returned to the RPC where the dosimeters are removed and analyzed. The treatment plan must be submitted electronically to the Image-Guided Therapy QA Center (ITC), a QA center that participates with the RPC to handle digital data. The RPC then compares the institution's treatment plan with the results of the dosimeter analysis. Criteria for agreement vary with phantom model, but for several phantoms are 7% dose and 4 mm distance to agreement.
The RPC has reported on several occasions that the failure rate with the anthropomorphic phantoms ranges between 20% and 30%. This large failure rate has been commented upon by the American Association of Physicists in Medicine (AAPM) and other organizations, and a topic of concern for several of the clinical trials study groups.
87

The RPC has investigated the causes of failures and has determined that many causes fall into categories described in Table 1.
, Minimum # of Explanation occurrences incorrect output factors in TPS 1
incorrect PDD in TPS 1 IMRT Technique 3
Software error 1 inadequacies in beam modeling at leaf ends (Cadman, et al; . .
PMB2002) QA procedures 3
errors in couch indexing with Peacock system 3 equipment performance 2
setup errors 7
While conducting these reviews, the RPC has amassed a large amount of data describing the dosimetry at participating institutions. Representative data from the monitoring programs will be discussed and examples will be presented of specific instances in which the RPC contributed to the discovery and resolution of dosimetry errors. The results of credentialing programs for IMRT, SBRT, brachytherapy, and proton beams will be described.
This work was supported by PHS CAO10953 and CA081647 awarded by NCI, DHHS

IDOS, Vienna, 9-12 November 2010 E2-CN-182, Paper No INV009
A dosimetric audit of IMRT in the UK
J. Berresford3, E. Bradshaw3, M. Trainer3, G. Budgell3, P. Williams3, P. Sharpeb
3North Western Medical Physics, The Christie NHS Foundation Trust, Manchester, UK
b National Physical Laboratory, Teddington , UK
E-mail address of main author: [email protected]
The clinical implementation of IMRT in the UK following recommendations of the National Radiotherapy Advisory Group [1] has provided an opportunity for a national audit to determine the general levels of accuracy for this complex technique. While involvement in centralized QA processes is often a prerequisite for participation in clinical trials the protocols are specific and often too time consuming to be applied to all centres using IMRT for their routine clinical practice.
The audit reported here was carried out under the auspices of the NPL/IPEM National Audit Group and was designed to give assurance that this powerful but complex technique has been implemented safely into clinical practice across the UK. 58 centres participated and a total of 78 plans were audited.
Method
The audit was designed to be applicable to most methods of IMRT delivery but excluded rotational techniques. It required measurements of 2D dose distribution and absolute dose at a point within the distribution. This method has been shown to be effective in detecting problems with IMRT modelling / beam delivery. It is more sensitive method of error detection than combined dose distribution measurements which hide errors by averaging them over multiple beams. The method chosen reflected current clinical practice in the way IMRT is actually being delivered at each centre and is applicable to any treatment site. Participating centres were invited to submit 1-3 recently completed typical IMRT treatments.
Each centre recalculated the modulated beams, by projection of each beam onto a flat water-equivalent phantom using a 0° gantry angle. The relative 2D dose distributions were calculated in the isocentric plane at 5 cm depth along with the absolute doses at single points. These points were selected to be in a high dose, low dose-gradient region.
Films, irradiated to measure the distributions, were mailed, unprocessed, to the central analysis centre where they were compared with calculated 2D dose distributions which had been submitted electronically.
Point doses were measured using the NPL's mailed alanine reference dosimetry service. Alanine pellets were irradiated by the participating centres by multiple delivery of the same IMRT beam to give a dose of around 10 Gy and were analysed centrally.
Results
The results of are summarized in the histograms shown below (FIG 1&2).
89

FIG. 1. Histogram of number of beams passing gamma test for dose distributions tested at the 3%/3mm level. 2 further beams are off-scale, in the 80-90% pass range.
FIG. 2. Histogram of number of beams passing gamma test for dose distributions tested at the 4%/4mm level 1 further beam is off-scale, in the 80-90% pass range.
97.7% (389/398) of the beams submitted achieved >95% of the dose distribution within the appropriate gamma test criterion; typically 3%/3mm for pelvic and breast plans, 4% 4mm for head and neck plans.
.10 -7.5 -2.5 0 2 .5
% different from expected dose
7.5 10
FIG. 3. Histogram of the alanine measurements relative to expected doses in all the IMRT beams. A further 3 measurements were off-scale: at-77.1%, -29.1% and-14% respectively.
The target dose for the alanine measurements was 10 Gy; the results being analysed in terms of the percentage difference between the measured dose and the dose quoted by the participant at the position of the alanine pellet. The majority of results fall on a distribution with mean difference of 0.05% and a standard deviation 1.5%. This is consistent with the uncertainties expected in dose delivery and measurement under these conditions.
Plans which fell outside the tolerance have been investigated and most of the discrepancies resolved satisfactorily
The audit had shown excellent dosimetric compliance for IMRT in the UK. As such it is a foundation for further work including the clinical aspects of the technique including target delineation during planning and verification of delivery using image guided radiotherapy
REFERENCE [1] NRAG (NATIONAL RADIOTHERAPY ADVISORY GROUP) Radiotherapy: developing a
world class service for England. Report to Ministers. February 2007.
90

IDOS, Vienna, 9-12 November 2010 E2-CN-182, Paper No INV009
Preliminary results from a dosimetric audit performed at Swedish radiotherapy centres
T. Knows1, J. Medin , L. Persson2
Skane University Hospital Lund, Radiation Physics, S-221 85 Lund, Sweden,2'Swedish Radiation Safety Authority, S-171 16 Stockholm, Sweden
A project was initiated by the Lund group and the Swedish Radiation Safety Authority during 2008-9 to perform audit of the radiotherapy centres in Sweden. The previous inter-institutional audit was performed 28 years ago (Johansson et a! 1982). The project started late 2009 and 18 radiotherapy centres in Sweden will be visited by two physicists from Lund to perform this audit which will include several major steps in the radiotherapy process:
1.A plastic phantom with tubes of different electron densities reproducing different tissue properties is scanned in the local CT-scanner and transferred to the local treatment planning system (TPS) in order to analyze the conversion of Hounsfield units to densities (or electron densities)
2. Absorbed dose measurements in reference dosimetry according to IAEA TRS-398. 3. An electronic on-line diode array is used to measure:
a. A set of standard fields calculated in the local TPS b. A simple 3D-CRT plan mirroring a conventional prostate treatment
Step 1 is performed by scanning a CIRS Electron Density Phantom 062 which includes insert covering the most common tissues, see Table 1.
TABLE 1. TISSUE REPLACEMENTS IN THE C I PHANTOM FOR EVALUATION OF HOUNSFIELD UNIT TO DENSITY CONVERSION.
Tissue/Material Physical Density (g/cm3) Electron density (electrons/cm3 x 1023)
Rel electron density to water
H2O Syringe 1.00 3.340 1.000 Lung (Inhale) 0.20 0.634 0.190 Lung (Exhale) 0.50 1.632 0.489 Breast (50/50) 0.99 3.261 0.976
Dense Bone 800mg/ cm3 1.53 4.862 1.456 Trabecular Bone 200mg/cm3 1.16 3.730 1.117
Liver 1.07 3.516 1.052 Muscle 1.06 3.483 1.043 Adipose 0.96 3.170 0.949
This phantom was scanned using a common planning protocol on the local CT-scanner, the images were transferred to the TPS and the imported HU and/or densities were recorded.
For step 2, a water phantom in PMMA was designed and built at the audit group's workshop with dimensions 25x25x35 cm3with two tubes for ionisation chambers of Farmer 0.6 cm3 type. One chamber is for the measured charge and the second for monitoring the stability of the beam during the series of measurements. The distance between the chambers is such that the monitor does not influence the measured signal. An arrangement of holder and distance rods are used to assure the correct amount of water for measurements at 10 or 20 cm depth. All measurements by the audit group are performed in the reference geometry of the visited hospital. Both the local and the audit group determine the absorbed dose in the reference geometry at the visit. An additional measurement with the local and the audit group's ionisation chambers is performed where the chambers are alternated placed in the two positions in the audits water phantom in order to assure the status of the chamber/electrometer combinations. In this way only differences in the calibration coefficient ND)W
from the national SSDL will influence the results.
91
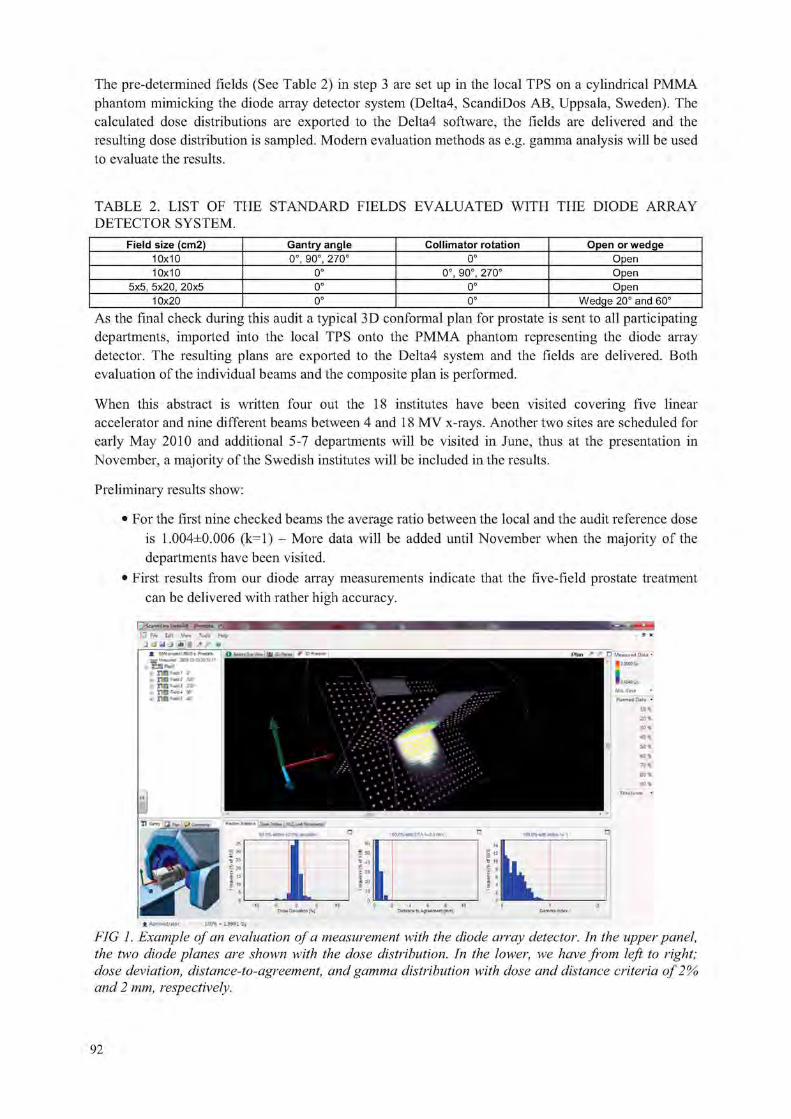
The pre-determined fields (See Table 2) in step 3 are set up in the local TPS on a cylindrical PMMA phantom mimicking the diode array detector system (Delta4, ScandiDos AB, Uppsala, Sweden). The calculated dose distributions are exported to the Delta4 software, the fields are delivered and the resulting dose distribution is sampled. Modern evaluation methods as e.g. gamma analysis will be used to evaluate the results.
TABLE 2. LIST OF THE STANDARD FIELDS EVALUATED WITH THE DIODE ARRAY DETECTOR SYSTEM.
Field size (cm2) Gantry angle Collimator rotation Open or wedge 10x10 0°, 90°, 270° 0° Open 10x10 0° 0°, 90°, 270° Open
5x5, 5x20, 20x5 0° 0° Open 10x20 0° 0° Wedge 20° and 60°
As the final check during this audit a typical 3D conformal plan for prostate is sent to all participating departments, imported into the local TPS onto the PMMA phantom representing the diode array detector. The resulting plans are exported to the Delta4 system and the fields are delivered. Both evaluation of the individual beams and the composite plan is performed.
When this abstract is written four out the 18 institutes have been visited covering five linear accelerator and nine different beams between 4 and 18 MV x-rays. Another two sites are scheduled for early May 2010 and additional 5-7 departments will be visited in June, thus at the presentation in November, a majority of the Swedish institutes will be included in the results.
Preliminary results show:
• For the first nine checked beams the average ratio between the local and the audit reference dose is 1.004±0.006 (k=l) - More data will be added until November when the majority of the departments have been visited.
• First results from our diode array measurements indicate that the five-field prostate treatment can be delivered with rather high accuracy.
4 Adtil»liMriIor ICO* = 1.9991 Gy
FIG 1. Example of an evaluation of a measurement with the diode atray detector. In the upper panel, the two diode planes are shown with the dose distribution. In the lower, we have from left to right; dose deviation, distance-to-agreement, and gamma distribution with close and distance criteria of 2% and 2 mm, respectively.
92

REFERENCE
JOHANSSON KA, MATTSSON LO, SVENSSON H, Dosimetric intercomparison at the Scandinavian radiation therapy centres. I. Absorbed dose intercomparison, Acta Radiol Oncol. 1982;21(1):1-10.
93


IDOS, Vienna, 9-12 November 2010 E2-CN-182, Paper No INV009
BELdART: Organization of a quality assurance audit for photon and electron beams based on alanine/EMR dosimetry
B. Schaeken3, S. Lelie3, R. Cuypers3, W. Schroeyers3, F. Sergentb, S. Vynckierc, A, Rinders d, D. V e r e l l e n H . Janssens3
3NuTeC-EMR dosimetry laboratory, Xios Hogeschool Limburg, Technologiecentrum, Wetenschapspark 27, 3590 Diepenbeek, Belgium
bClinique et Maternite Ste-Elisabeth, dept. Radiotherapie, Place Louise Godin 15, 5000 Namur, Belgium
cUCL, St-Luc University Hospital, dept. of Radiation Oncology, Avenue Hippocrate 10, 1200 Brussel, Belgium
Europe Hospitals, dept. of radiotherapy, Groeselenberg 57, 1180 Brussel, Belgium eVrije Universiteit Brussel, Pleinlaan 1, 1000 Brussel, Belgium
E-mail address of main author: [email protected]
Introduction
The Belgian dosimetry audit in radiotherapy (BELc/ART) project was set up by the Federal Agency of Nuclear Control1 (FANC) to verify, on a national base, the compliance of the dose stated by the center with the measured dose. The visitation encompasses a basic mechanical test and a dosimetric verification of the dose measured in reference and non-reference conditions, including irregular fields with MLC. Absorbed dose to water is measured with alanine/ EMR dosimetry. The number of monitor units (MU) to deliver 4 Gy at the detector is calculated by the participating centre according to the clinical procedure. Dose measurements are traceable to the water calorimeter standard at PTB2 and in addition alanine/EMR dosimetry is compared at regular intervals against ionometry as part of the auditing performed by the Belgian Hospital Physicist Association (BHPA). The audit started in feb. 2009 and all photon beams and two electron beams per linac in clinical use will be audited within a period of three years.
Materials & methods The alanine dosimeters used are cylindrical pellets (Harwell with a diameter of 4.8 mm; height of 2.7 mm, average mass is 59.8 mg). In each experiment, the measured dose to water is expressed as the average reading of four detectors. The alanine detectors are read out in a Bruker EMX""e'° spectrometer (9" magnet, X-band) equipped with a high sensitivity resonator ER4119HS-W1. EMR spectra are acquired as the first derivative of the absorption spectrum using the following spectrometer settings: center magnetic field = 348 niT; sweep width = 30 mT; Microwave power = 0.25 mW; field modulation 0.5 mT; modulation frequency = 100 kHz; 2048 channels each sweep, conversion time 40.96 ms and a sweep time of 83.89 ms. Five separate spectra were acquired for each detector after subsequent rotation by 72°. To allow accurate measurements, the spectrometer is operating in a air-conditioned room in which temperature and relative humidity (RH) are permanently monitored (T= 21°C, RH < 40%). Temporal variations in the spectrometer sensitivity are taken into account by recording the irradiated alanine spectra simultaneously with a reference substance. Dose to water is determined using the "dose normalized amplitude" (AD) methodology developed by Anton3'4. The pure
95

alanine base function is obtained from detectors irradiated at 0 Gy and 20 Gy in the Co-60 reference beam at PTB. The readings are corrected for: temperature: (1) kT = (1.9 ± 0.2) 10"3 K"1; (2) energy: kQ
(MV) = 1.003 ± 0.0032, kQ (MeV) = 1.0214 ± 0.012 and (3) fading: £fadmg = e"ctAt, c, = 7.10"5 ±4.10"5 d" '. The combined standard uncertainty on the amplitude measurement is estimated at u(AD) = 30 mGy and the relative combined standard uncertainty on a dose measurement under the experimental conditions of BELc/ART is estimated ur(DK) -1.1 %.
For high energy X-rays, various dosimetry parameters are checked in reference and non-reference conditions on the beam axis. The audit includes checks of the reference beam output, the beam quality (QI) of open and wedged beams, the wedge and tray factor, beam output variation with symmetric collimator openings including the collimator exchange effect and beam outputs for multi leaf shaped fields. For electron beams, the output is measured under reference conditions for one high and one low energy beam.
The relative deviation between measured and stated dose 8 = (Dmeasured - D,,,,„„,) / Dcentre is classified into four levels and reported to the participating center: (1) "within optimal level": 8 < 3%, (2) "within tolerance level": 3% < | 8 | < 5%, (3) "out of tolerance level": 5% < | 8 | < 10% and (4) "alarm level": | 8 \ > 10%.
Results Up to now, 31 linacs (Varian, Siemens, Elekta, Novalis, BrainLabAB/MHI "Vero") have been subjected to a mechanical control: all results are found within the optimal level, except for 1 linac. Dosimetry was checked in 53 photon beams (4MV - 18MV). For a total of 506 experiments in photon beams, the average ratio of measured dose to stated dose D,v/Dceillcr was found 0.998 with a spread of 0.020 (la). The average ratio of (alanine) measured dose to the dose measured with a Farmer Baldwin ionization chamber under reference conditions was .Daianme/ FannerBaidwin ~~ 0.999 with a spread of 0.006 (la).
For electron beams the output in water was measured in 44 electron beams (4 MeV - 25 MeV). The ratio of measured to stated dose DJDccrilcr was 1.006 with a spread of 0.02 (1 a).
Updated and more specific results will be communicated in detail at the meeting.
The BFLc/ART-projcct is sponsored 100% by the FANC
REFERENCES
[1] A. KRAUSS, "The PTB water calorimeter for the absolute determination of absorbed dose to water in Co-60 radiation", Metrologia 2006; 43: 259-272.
[2] M. ANTON, "Development of a secondary standard for the absorbed dose to water based on the alanine EPR dosimetry system", Appl. Rad. Isot.2005; 62, 779-795.
[3] M. ANTON, "Uncertainties in alanine/ESR dosimetry at the Physikalisch-Technische Bundesanstalt", Phys. Med. Biol. 2006; 51, 5419-5440.
96

IDOS, Vienna, 9-12 November 2010 E2-CN-182, Paper No INV009
Dosimetry audits in radiotherapy using radiophotoluminescent glass dosimeters in Japan
H. Mizuno a, A. Fukumura a, Y. Kusano \ S. Sakata b
a National Institute of Radiological Sciences (NIRS), Chiba, Japan
1 Association for Nuclear Technology in Medicine (ANTM), Chiba, Japan
E-mail address of main author: [email protected]
Introduction
Although over 800 linear accelerators have been clinically used about 700 radiation therapy facilities in Japan [1] , for many years, no external audit system existed. Postal dosimetry audit system was established by the National Institute of Radiological Sciences (NIRS; SSDL) [2], We chose the radiophotoluminescent glass dosimeter (RGD) as a postal detector rather than a TLD. The new RGD system, the Dose Ace (ASAHI GLASS CO.), commercially available in Japan, had stable output, its reproducibility was much improved, and the RGD had almost no fading effects. New audit system using the RGD in Japan was begun on November, 2007. The audit results of the first few years will be presented.
Dosimetry audit system
RGDs and a water equivalent solid phantom (Tough Water Phantom, KYOTO KAGAKU CO.) were sent to radiotherapy hospitals, where the RGDs were irradiated with 1 Gy at the reference condition of the X-ray beam (Field size 10 cm x 10 cm, Depth 10cm) using the delivered phantom. Irradiated RGDs were then sent back to NIRS and the outputs were read by a RGD reader. The RGD system is shown in FIG. 1. The tolerance level was set to ±5% considering the uncertainty of ±1.6% (1 standard deviation). The NIRS group conducted the postal audit trial with 106 hospitals from 2006 to 2007 and achieved a 1.3% standard deviation for 191 beams [2], Based on this successful trial, the postal dose audit service was initiated in November 2007 and is operated by the Association for Nuclear Technology in Medicine (ANTM). The audit is not mandatory and the hospitals that participate in the audit have to pay a fee of about $966 for reference conditions of 2 beam energies of X-rays. We are recommending participation in the audit every three years.
FIG. 1. Three RGDs are contained in the tough water phantom.
97

100
The audit results of past 2 years
From its inception in November 2007 to March 2010, 113 hospitals have participated in the audit. This included a total of 127 linear accelerators and a total of 224 checked beams (60 beams (4 MV), 67 beams (6MV), 94 beams (10 MV) and 3 beams (15 MV).
N=224 beams
0.96 0.98 1 , 0 2 1.04
^Earl^stai
FIG. 2. Distribution of the results of the postal dose audits of radiotherapy hospitals for the delivery of absorbed dose to water under reference condition during 2007-2009.
The distribution of the results is shown in FIG. 2. The results correspond to ratios of the NIRS RGD read dose to that stated by the user, DRGD /DSMR. The mean ratio was 1.005, its standard deviation 0.9%, and the outliers ranged between a minimum of 0.974 and a maximum of 1.036.
Application to non-reference conditions
To make the audit more practical, an audit for non-reference conditions has been studied. This includes checks of dose variations with field size and wedge transmission. Regarding field size variation, slight correction factor was necessary. We started the audit of non-reference conditions from the April, 2010.
REFERENCES
[1] TESHIMA, T., NUMASAKI II.. SHIBUYA, II., et al., Japanese Structure survey of radiation oncology in 2007 (First report). J Jpn Soc Ther Radiol Oncol 21 (2009) 113-125. Japanese article
[2] MIZIJNO, H„ KANAI, T„ KUSANO, Y„ et al., Feasibility study of glass dosimeter postal dosimetry audit of high-energy radiotherapy photon beams. Radiother Oncol 86 (2008) 258-263.
98

Parallel Session 6a
Reference Dosimetry and Comparisons in External Beam Radiotherapy II


IDOS, Vienna, 9-12 November 2010 E2-CN-182, Paper No INV015
Recent advances in dosimetry in reference conditions for proton and light-ion beams
S. Vatnitskiy3, P. Andreob, D. T. L. Jonesc
a MedAustron, Wiener Neustadt, Austria
h Medical Radiation Physics, Stockholm University - Karolinska Institutet, Stockholm, Sweden
c International Commission on Radiation Units the and Measurements, Bethesda, MD, USA
Radiotherapy with proton and light-ion beams is a rapidly expanding modality with more than 50 facilities expected to be operational by 2015. Uniformity of dose specification is a prerequisite for comparing clinical data from different institutions and for undertaking collaborative clinical trials. In recent years considerable effort has been devoted to the development and improvement of the accuracy and reproducibility of reference dosimetry and the calibration of proton and light-ion beams taking account of the different beam-delivery techniques used for treatment. This paper reviews the developments in dosimetry under reference conditions of proton and light-ion beams that have taken place since IAEA International Symposium on Standards and Codes of Practice in Medical Radiation Dosimetry in 2002,
Introduction There is continuously growing interest in the medical community throughout the world in establishing dedicated hospital-based facilities employing proton and light-ion (heavier than protons) beams for radiotherapy. There are more than 30 such treatment facilities currently operational worldwide [1] and there are plans to open at least another 20 within the next five years. Treatment planning of the high-precision conformal therapy with ion beams requires accurate dosimetry and beam calibration in order to ensure delivery of the correct prescribed dose. Exchange of clinical experience and implementation of institutional and collaborative treatment protocols needs to be based on consistent and harmonized dosimetry procedures. This paper reviews the efforts to standardize the dosimetry of therapeutic proton and light-ion beams and summarizes the developments in dosimetry procedures in reference conditions that have taken place since the IAEA International Symposium on Standards and Codes of Practice in Medical Radiation Dosimetry in 2002. Since no national or international dosimetry standards for proton and light-ion beams have been established, the major effort has therefore been devoted to studies of the theoretical framework and practical guidelines for the use of ionization chamber dosimetry.
Recent developments in the dosimetry of proton and heavier ion beams Currently air-filled thimble ionization chambers with 60Co calibration factors are recognized as the most practical and reliable reference instruments for proton and light-ion beam dosimetry. The following sections provide an overview of recent developments in absorbed dose determination in proton and light-ion beams with the emphasis on ionization chamber dosimetry.
ICRU Report 78 (2007) ICRU 78 [2] recommended that TRS-398 [3] be adopted as the standard proton dosimetry protocol as it is very simple to use and harmonizes with other modality's codes of practice. The energy required to produce an ion pair (vv-value) in air is a significant factor and potentially the main source of uncertainty in ionometric proton dose determinations. The values used in the various protocols formulated in the past have differed significantly. Based on a comprehensive evaluation of published w-values [5] the adoption of a value of 34.2 J C"1 ± 0.4 % was recommended in ICRU 78. This value is consistent with the value recommended in TRS-398.
101

Basic data - w-values Since calorimetry is the most direct way to determine absorbed dose to water (the reference material for dose specification), a comparison the results of dose measurements using ionization chambers and water calorimeters has always been considered as a standard approach to determine w-values or beam quality correction factors ko• The results reported for protons and light- ions recently are discussed in the paper.
Basic data - stopping powers Stopping-power ratios are another major source of uncertainty in the dosimetry of protons and light-ions. Whereas in the case of protons TRS-398 [2] included accurate track-length fluence-weighted water to air stopping power ratios (.vWiair), for heavier ions this quantity was approximated by simple ratios of collision stopping powers, the basic data originating from rather inhomogeneous datasets. The emphasis in recent years on improving these dosimetry data, notably for carbon ions, is therefore well justified. Whereas an ongoing ICRU working group on key data for dosimetry will provide a final recommendation for /water and other quantities of interest, an errata to ICRU 73 [4] has been released [6] recommending the use of a tentative value of 78.0 eV, adopted from an internal GSI report. The entire set of available data needs to be analyzed and will probably result in a revision and a re-evaluation of all available stopping-power ratios for electrons, protons and heavier ions.
Basic data - ion chamber perturbation factors Due to the lack of reliable data, it has been assumed up to now that perturbation correction factors for ionization chambers are negligible (i.e., assumed to be equal to one) both in proton and light-ion beam dosimetry. Notwithstanding the fact that the corrections are small, the current high accuracy sought in light-ion beam dosimetry suggests that further investigations in the field are required to determine appropriate numerical values.
Recombination corrections Ionization chamber measurements in proton and heavier ion beams should be corrected for the recombination of ions and electrons within the air cavity as this reduces the amount of charge collected [2], The treatment of recombination corrections for ionization chambers in delivery systems that use uniform beam scanning with energy stacking or small-diameter, high-dose-rate scanned beams are more complex than for systems that use passive beam delivery systems. The charge-collection efficiency of ionization chambers for scanning systems should be determined by calibration against a dose-rate-independent device, such as a calorimeter or a Faraday cup (FC). If a dose-rate-independent device is not available, then the two-voltage method can be used to determine the recombination correction factor. A review of recent studies is presented in this paper.
REFERENCES
[ 1 ] PARTICLE THERAPY COOPERATIVE GROUP: http://ptcog.web.psi.ch/ptcentres.html [2] INTERNATIONAL ATOMIC ENERGY AGENCY, Absorbed Dose Determination in
External Beam Radiotherapy: An International Code of Practice for Dosimetry Based on Standards of Absorbed Dose to Water, Technical Reports Series No. 398, IAEA, Vienna (2000)
[3] INTERNATIONAL COMMISSION ON RADIATION UNITS AND MEASUREMENTS, Prescribing, Recording, and Reporting Proton-Beam Therapy, ICRU Report 78, JICRU 7,2 (2007) (Oxford University Press, Oxford, UK)
[4] INTERNATIONAL COMMISSION ON RADIATION UNITS AND MEASUREMENTS, Stopping of Ions Heavier than Helium, ICRU Report 73, JICRU 5,1 (2005) (Oxford University Press, Oxford, UK)
[5] JONES, D. T. L., The vv-value in air for proton therapy beams. Radiat. Phys Chem. 75 (2006) 541-550.
[6] SIGMUND, P., SCI I INNER, A., AND PAUL, H„ Errata and Addenda for ICRU Report 73, Stopping of Ions Heavier than Helium, Journal of the ICRU vol. 5 no. 1 (2005), Insert in ICRU Report 83, JICRU 10,1 (2010) (Oxford University Press, Oxford, UK)
102

IDOS, Vienna, 9-12 November 2010 E2-CN-182, Paper No INV015
Experimental determination of the kQ-factor for a Farmer chamber in a high energy scanned pulsed proton beam
J. Medin
Radiation Physics, Skane university hospital, Lund, Sweden
E-mail address of main author: [email protected]
Water calorimetry has become an important technique for establishing the absorbed dose under reference conditions also in proton beams. However, the main part of investigations done so far has been performed in passively scattered beams where irradiation conditions are comparable to conventional beams regarding a simultaneous irradiation of the defined field-size. This was, for example, the case in an earlier study performed with the water calorimeter used in the present work, determining experimental beam quality correction factors, kg,go, for two types of Farmer ionisation chambers in a 175 MeV clinical proton beam (Medin et al 2006). In scanned pulsed proton beams, one may expect potential issues related to the correct calorimetric determination of the temperature rise caused by high dose gradients in the vicinity of the thermistor probes when the narrow pencil beam is scanned over the defiend field size. Also when an ionisation chamber is used in a scanned proton beam, as in the present investigation, one may foresee issues related to ion recombination in the collecting gas due to the high instantaneous dose rate when the narrow beam strikes the chamber volume.
In the present work, water calorimetry was implemented in a 180 MeV scanned pulsed proton beam at the The Svedberg Laboratory in Uppsala, and the absorbed dose determined with a sealed water calorimeter was compared with the results obtained using two NE 2571 ionisation chambers at a depth in water corresponding to RKS = 16.5 cm. The ionisation chambers had been calibrated at 60Co in terms of absorbed-dose-to-water at the Swedish SSDL (secondary standards dosimetry laboratory) traceable to BIPM (Bureau International des Poids et Mesures). The design of the water calorimeter closely follows the NRC (National Research Council) sealed water calorimeter (cf . Seuntjens and Palmans 1999). The temperature increase due to irradiation is measured at the centre of a cylindrical glass vessel filled with highly purified water (outer diameter - 67.6 mm, average wall thickness = 1 mm) using two thermistor probes connected to a Wheatstone bridge circuit. Measurements were performed at 4°C in order to avoid problems associated with convective heat transfer. The high purity water was saturated with N2 gas in order to remove all other gases, notably oxygen, which would otherwise affect the measured temperature rise.
Measurements with the water calorimeter in the scanned proton beam were performed over a period of 11 months, resulting in five sets of absorbed dose determinations. A new fill of the glass vessel and saturation with N2 gas was done for each set. A total of 169 determinations of the absorbed dose were made. The experimental standard deviation of the mean value for the 169 measurements was found to be 0.11%, including the uncertainty in determination of temperature change and positioning. The two Farmer ionisation chambers included in the study were irradiated on two and three separate occasions, respectively, with the first occasion coinciding in time with the last set of calorimetric measurements. The results (both calorimetry and ionometry) were normalized to the reading of a reference transmission ionisation chamber, positioned immediately upstream from the two bending magnets in the beam line (cf . Lorin et al 2000). The alignment and stability of the beam during each irradiation was simultaneously controlled with a four-segmented transmission ionisation chamber and an independent monitor chamber.
103

Based on the water calorimetric determination of the absorbed dose, the the beam quality correction factor, k0, for the NE2571 Farmer type ionisation chamber in the scanned proton beam was found to be 1.032 ± 0,013. This result can be compared with the previous result obtained in the passively scattered proton beam (1.021 ± 0.007), resulting in a 1.1% deviation. Due to large uncertainty in the correction for ion recombination in the scanned beam (approximately 1%), any possible difference in one or more factors affecting kg between the two proton beams is obscured. Further theoretical and/or experimental work should therefore be conducted in order to refine the determination of the correction factor for ion recombination in pulsed proton beams in order to reduce its uncertainty.
REFERENCES
[1 ] LORIN S, GRUSELL E, TILLY N, MEDIN J, BLOM M, REISTAD D, ZIEMANN V AND GLIMELIUS B 2000 Development of a compact proton scanning system in Uppsala with a second moveable magnet Phys. Med. Biol. 45 1151-63
[2] MEDIN J, ROSS C K, KLASSEN N V, PALMANS H, GRUSELL E AND GRINDBORG J-E 2006 Experimental determination of beam quality factors, kQ, for two types of Farmer chamber in a 10 MV photon and a 175 MeV proton beam, Phys. Med. Biol 51 1503-21
[3] SEUNTJENS J AND PALMANS H 1999 Correction factors and performance of a 4°C sealed water calorimeter Phys. Med. Biol. 44 627-646
104

IDOS, Vienna, 9-12 November 2010 E2-CN-182, Paper No INV015
Calorimetric determination of kg factors for an NE2561 ionization chamber in 3 cm x 3 cm beams of 6 MV and 10 MV photons
A. Krauss
Physikalisch-Technische Bundesanstalt (PTB), Braunschweig, Germany
E-mail address of main author: [email protected]
The reference conditions described in dosimetric measurement protocols like TRS-398 [1] of IAEA are given for large photon radiation fields of 10 cm x 10 cm. However, modern radiotherapy treatment machines generally use small field sizes and - for some of them - the required reference conditions cannot be realized anymore. Thus, new concepts for dosimetry are required. Within the framework of the iMERA-PLUS action of the European Metrology Research programme, investigations were performed at PTB with a water calorimeter to determine kg factors of ionization chambers in small photon radiation fields of 6 MV and 10 MV photons.
The water calorimeter is operated at a water temperature of 4 °C and offers essentially the same features as have been described previously [2,3]. Measurements were performed at one of PTB's new Elekta Precise medical accelerators with 6 MV and 10 MV photons. The field size at a 10 cm depth inside the water phantom of the calorimeter was limited to 3 cm X 3 cm using a fixed external collimator made of lead. This collimator was mounted in front of the radiation head of the accelerator. During the experiments, the output of the accelerator was normalized to a transmission monitor chamber which was mounted in front of the water calorimeter's radiation entrance window.
For the calorimetric part of the investigation, the influence of the heat transport occurring during and after the measurements in the 3 cm x 3 cm radiation field is of major concern. To study the effects due to the heat transport experimentally, many sequences of four consecutive irradiations with drift periods of 130 s in between were performed for 60 s and 120 s irradiation times, and several calorimetric detectors with temperature sensors having different lateral positions relative to the central axis of the radiation beam were applied. Corresponding heat transport calculations and the determination of heat conduction correction factors k( - for the different measurement conditions were performed on the basis of the finite-element method using a 3-dimensional geometry model, taking into account the calorimetric detector including the real position of the temperature sensors as well as the measured lateral and depth-dose distributions of the 3 cm x 3 cm radiation fields. The calculated correction factors kc vary between 0.991 and 0.962. Figure 1 presents a comparison of the uncorrected results of calorimetric measurements and the results of the heat conduction calculations. The data shown are the ratios of the first and the second irradiation as a function of the position relative to the central axis of the field. These ratios are mainly affected by the superposition of the heat conduction effects of the consecutive irradiations.The calculated data are in good agreement with the experimental ones, which proves that the calculated correction factors kc can be adequately used for the calorimetric determination of absorbed dose to water and, hence, for the determination of the ko factors for ionization chambers.
For the determination of the ko factors, the NE2561 chamber was mounted inside the water phantom of the calorimeter at the same depth in water as the calorimetric detector was positioned before.
105

FIG 1: For the case of 10 MV photons and for 120 s irradiation time, the solid line shows the ratio of the calculated correction factors kc of the second and the first irradiation, kc(#2)/kc(#l), os a function of the position relative to the centra l axis of the field. The ratios of the mean values of calorimetric results of the first and the second irradiation obtained from different experiments, together with their standard uncertainties are also shown. The results obtained with different detectors are represented by different symbols.
The readings of the chamber were corrected for polarity and recombination effects during the irradiations. For both radiation qualities, the preliminary results of the present investigation offers a ratio of 1.003 +/- 0.004 of the ko factors in the 3 cm x 3 cm and in the reference field (10 cm x 10 cm). The standard uncertainty only considers the contributions from the experimental determination of the ko factors in the 3 cm x 3 cm radiation field. No dependence of the ko factors on the size of the radiation field occurred in the current investigation.
ACKNOWLEDGMENT
The research within this EURAMET joint research project leading to these results has received funding from the European Community's Seventh Framework Programme, ERA-NET Plus, under Grant Agreement No. 217257.
REFERENCES
[1] INTERNATIONAL ATOMIC ENERGY AGENCY, Absorbed dose determination in external beam radiotherapy, TRS 398, Vienna: IAEA 2000
[2] KRAUSS A., The PTB water calorimeter for the absolute determination of absorbed dose to water in 60Co radiation, Metrologia 43 (2006) 259-272
[3] KRAUSS A., KAPSCH R.-P,, Calorimetric determination of kg factors for NE2561 and NE2571 ionization chambers in 5 cm x 5 cm and 10 cm x 10 cm radiotherapy beams of 8 MV and 16 MV photons, Phys. Med. Biol. 52 (2007) 6243-6259 and Corrigendum, Phys. Med. Biol. 53 (2008) 1151
106

IDOS, Vienna, 9-12 November 2010 E2-CN-182, Paper No INV015
Conversion of dose-to-graphite to dose-to-water in clinical proton beams
H. Palmans3, L. Al-Sulaitib, R. A. S. Thomas2, D. R. Shipley3, J. Martinkovicc, A. Kacperek'
aNational Physical Laboratory, Teddington UK
University of Surrey, Guildford UK
c Slovak Institute of Metrology, Bratislava Slovakia
dClatterbridge Centre of Oncology, Wirral UK
E-mail address of main author: [email protected]
Introduction
The National Physical Laboratory has developed a primary standard level graphite calorimeter for proton dosimetry based on an earlier prototype which was used to measure the value of the mean energy required to produce an ion pair in dry air by protons [1], One of the largest uncertainties in deriving the desired quantity, absorbed dose to water, from a measurement with a graphite calorimeter is the conversion procedure from dose-to-graphite to dose-to-water [2], One of the corrections in the conversion procedure is the fluence correction accounting for any difference in proton and target fragment fluence in both phantom materials as a result of non-elastic nuclear interactions. In the present work, the conversion of dose-to-graphite to dose-to-water has been investigated for a low-energy proton beam using experiments in the Clatterbridge Centre of Oncology beam lines and by Monte Carlo simulations using three different Monte Carlo codes: GEANT4, MCNPX and FLUKA.
Experimental method
The experimental set-up is shown in Fig. 1. A collimated pencil beam of 4 mm diameter was monitored by a Roos chamber at collimator exit. An NACP-02 chamber measured ionization behind a series of graphite plates in a fixed source-to-detector configuration with the front window of the NACP-02 at isocentric distance. For the measurements in water phantom the water surface was kept constant at the isocentric distance. It was assumed that both the Roos and the NACP-02 chambers measured a laterally integrated signal covering the entire particle fluence. A small correction, not exceeding 1%, on this assumption was measured by performing the water phantom measurements at various distances. Measurements were performed for a non-modulated 60 MeV proton beam. The 80% dose level at the distal edge was used as a measure of range to correct the depths in graphite to water equivalent depths. A possible ion chamber perturbation was neglected (or considered the same in both phantoms). The ionization measured in the chamber was considered as a measure of the proton fluence and the ratio of readings in water and graphite thus a fluence correction factor.
Monte Carlo simulations
All Monte Carlo simulations were done for a 60 MeV mono-energetic proton beam and in all cases laterally integrated proton fluence was scored. In Geant4 (version 4.9.0) ICRU Report 49 stopping powers are used and the precompound model was used for non-elastic nuclear interactions. The phantom was a 50 mm diameter cylinder and slab thicknesses were 0.05 mm for graphite and 0.07 mm for water. In MCNPX (version 2.5.0) simulations were performed on a cylindrical slab phantom with a diameter of 40 mm and slabs of 0.1 mm thickness. Nuclear cross section data from the LA150H
107
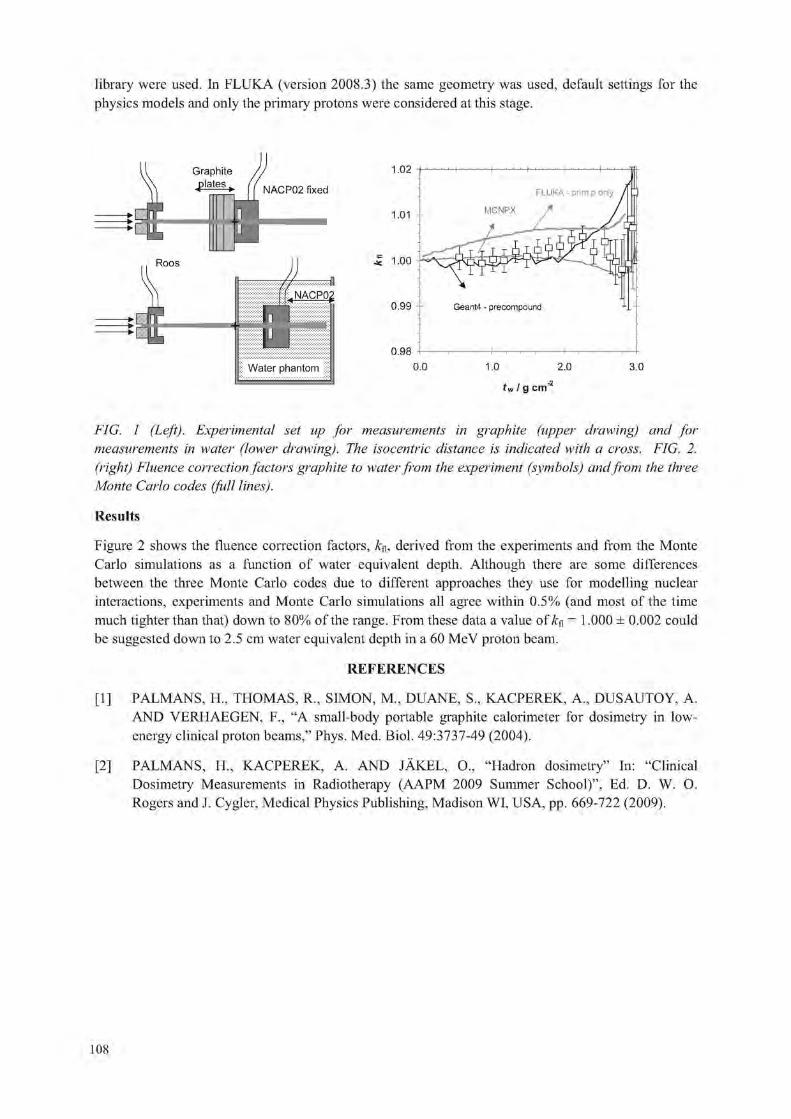
library were used. In FLUKA (version 2008.3) the same geometry was used, default settings for the physics models and only the primary protons were considered at this stage.
Graphite
j p l a t e s • NACP02 fixed
Roos
1.02
1.01
5 1.00
0.99
0.98
tw I g cm
FIG. 1 (Left). Experimental set up for measurements in graphite (upper drawing) and for measurements in water (lower drawing). The isocentric distance is indicated with a cross. FIG. 2. (right) Fluence correction factors gi'aphite to water from the experiment (symbols) and from the three Monte Carlo codes (full lines).
Results
Figure 2 shows the fluence correction factors, derived from the experiments and from the Monte Carlo simulations as a function of water equivalent depth. Although there are some differences between the three Monte Carlo codes due to different approaches they use for modelling nuclear interactions, experiments and Monte Carlo simulations all agree within 0.5% (and most of the time much tighter than that) down to 80% of the range. From these data a value of U& = 1.000 ± 0.002 could be suggested down to 2.5 cm water equivalent depth in a 60 MeV proton beam.
REFERENCES
[1] PALMANS, H„ THOMAS, R„ SIMON, M„ DUANE, S„ KACPEREK, A., DUSAUTOY, A. AND VERHAEGEN, F., "A small-body portable graphite calorimeter for dosimetry in low-energy clinical proton beams," Phys. Med. Biol. 49:3737-49 (2004).
[2] PALMANS, H„ KACPEREK, A. AND jAKEL, O., "Hadron dosimetry" In: "Clinical Dosimetry Measurements in Radiotherapy (AAPM 2009 Summer School)", Ed. D. W. O. Rogers and J. Cygler, Medical Physics Publishing, Madison WI, USA, pp. 669-722 (2009).
108

IDOS, Vienna, 9-12 November 2010 E2-CN-182, Paper No INV015
Flattening filter free beams: Dosimetric characterisation, beam quality and peripheral doses
KragI Ga, af Wetterstedt Sb, Knausl Ba, Baier Fa, Albrich Da, Lutz Sd, Dalaryd Mc, McCavana Pb, Wiezorek Td, Knoos Tc, McClean Bb, Georg Da
a Radiotherapy Department, Medical Radiation Physics, Medical University of Vienna / AKH Vienna, Austria
b
Radiotherapy Department, St Luke's Hospital, Dublin, Ireland c
( Radiation Physics, Lund University and University Hospital, Lund, Sweden
Department of Radiotherapy, University Hospital Jena, Germany
E-mail address of main author: [email protected]
Introduction: Recently, there is growing interest in operating medical linear accelerators without a flattening filter. Due to the superposition of multiple intensity patterns, uniform beam profiles are no longer required for IMRT. The same holds for SBRT since the peaked shape of lateral profiles of flattening filter free (FFF) beams becomes dominant only at larger field sizes. The main rational for the use of FFF beams is the substantially increased dose rate. Other advantages are reduced scatter and leaf transmission. Consequently, leakage radiation, which mainly contributes to peripheral dose (PD) at larger distances of the field edge, is reduced.
The aim of the present study was a comprehensive dosimetric characterisation of unflattened beams including the determination of beam quality variations across the field as well as the measurement of PD for advanced radiotherapy techniques.
Material and methods: Two Elekta Precise linear accelerators were modified to provide photon beams with and without a flattening filter. In each mode, three nominal beam energies were available: 6 and 10MV at the Medical University Vienna (MUW); and 6MV at the Saint Luke's Hospital Dublin (SLH). In the FFF mode a 6mm thick copper filter was rotated into the beam line to reduce electron contamination and to stabilize the beam. It acts as a beam stopper in case the target breaks. Dosimetric data including percentage depth dose, lateral profiles, scatter factors, surface dose and leaf transmission was acquired according to the requirements of TPSs Oncentra Masterplan (Nuclctron) and Monaco (Elekta CMS). Subsequently, the data was implemented into the respective planning system.
Beam quality variations were assessed by the determination of half-value layers (HVL) as a function of the off-axis ray angle in narrow beam geometry. At the MUW the measurements were performed with a device that enabled the fixation of the collimators, the absorbers and the ionization chamber at the gantry, while at the SLH the gantry was tilted to 270° and the dosimetric equipment was positioned on the table.
Finally, treatment head leakage radiation was measured according to IEC recommendations. SBRT and IMRT treatment plans were generated for both flattened and unflattened beams. All treatment plans were delivered to the relevant anatomic region of a Rando phantom which was extended by a solid water slab phantom. Dosimetric measurements were performed with TLD-700 rods, radiochromic films and an ionisation chamber, which were positioned within the slab phantom along the isocentric longitudinal axis.
109

Results: Depths of dose maxima for flattened and unflattened beams did not deviate by more than 2mm and penumbral widths agreed within 1mm. In FFF mode the collimator exchange effect was on average found to be 0.3% for rectangular fields. Between maximum and minimum field size head scatter factors of unflattened beams showed 40 and 56% less variation for 6 and 10MV beams than conventional beams. Phantom scatter factors for FFF beams differed up to 4% from published reference data. For field sizes smaller than 15cm, surface doses relative to the dose at dmax increased for unflattened beams with maximum differences of 7% at 6MV and 25% at 10MV for 5x5cm2 fields. For a 30x30cm2 field, relative surface dose decreased by about 10% for FFF beams. Leaf transmission on the central axis was 0.3 and 0.4% lower for unflattened 6 and 10MV beams, respectively.
For flattened 6 and 10MV photon beams the relative HVL(0) varied by about 11 % for an off-axis ray angle 0=10°. These results agreed within ±2% with a previously proposed generic off-axis energy correction. For unflattened beams the variation was less than 5% in the whole range of off-axis ray angles up to 10°. The difference in relative HVL data was less than 1% for unflattened beams at 6 and 10MV.
With unflattened beams treatment head leakage was reduced by 52% for 6 and 65% for 10MV. Thus, peripheral doses were in general smaller for treatment plans calculated with unflattened beams. At 20cm distance from the field edge PD was on average reduced by 24 and 31 % for 6 and 10MV SBRT plans. For IMRT plans the average reduction was 16% for a prostate and 18% for a head&neck case.
Conclusions: Due to the removal of the conically shaped flattening filter energy spectra of unflattened beams are softer and vary less across the field. Thus, a simplification of dose calculation and increased dosimetric accuracy is expected. Removing the flattening filter leads to reduced PD for advanced treatment techniques. Using higher beam energies contributed to a further reduction of PD. As IMRT substantially increases out-of-field doses compared to conformal radiotherapy, a reduction of the patients exposure to dose outside the treatment field is definitely beneficial. Further treatment planning studies are ongoing in order to assess the clinical benefits of FFF beams.
distance from field edge (cm)
FIG. 1. Results of peripheral dose measurements (in the isocentric plane) as a function of the distance from the field edge for IMRT prostate plans with 10 MV flattened and unflattened beams.
The relative dose reduction in (%) achieved by using FFF beams is indicated in gray in the top part of the figure.
110

Parallel Session 6b
Clinical Dosimetry in X ray Imaging 1


IDOS, Vienna, 9-12 November 2010 E2-CN-182, Paper No INV015
New advances in CT dosimetry
J.M. Boone University of California Davis Medical Center, Sacramento, California
E-mail address of main author: [email protected]
The radiation dose in computed tomography (CT) has come under recent scrutiny, due in part to several unfortunate CT overdose accidents but primarily due to the dramatically increased utilization of CT in diagnostic medicine. While CT scanner technology has advanced greatly in the past decade, the most widely used radiation dosimetry methods were developed 30 years ago. The International Commission on Radiological Units and Measurements (ICRU) report committee on CT image quality and radiation dose will propose new CT dosimetry methods, and these will be discussed in this presentation. These methods are largely consistent with measurement protocols defined in the American Association of Physicists in Medicine document TG-111. The proposed methods also allow the characterization of CT scanners which allow very wide z-axis collimation.
CTDIlOO-based methods for CT dosimetry were originally designed as dose metrics, however widey used extensions of CTDI100 (including CTDIw and CTDIvol) represent simple efforts to estimate patient dose. Unfortunately the 160 mm and 320 mm polymethyl methacrylate (PMMA) phantoms used for CTDI100 measurement are not representative of most patients and their use (without correction factors) reduces the accuracy of dose estimation.
The principal advances of the proposed ICRU CT dosimetry methods are that they include patient diameter, as well as beam energy and the scan length used. It is recognized that Monte Carlo derived dose coefficients are likely to be the most accurate dosimetry method, while physical measurements are performed principally to calibrate and validate Monte Carlo derived CT dosimetric values. Further, the ICRU CT committee is developing dose values for a range of patient sizes, from pediatric to obese adults, that will likely serve the needs of most patient dose estimates. Correction for scan length is straightforward.
In addition to patient dosimetry, recommendations will be made in regard to acceptance testing procedure and periodic quality assurance measurements on CT scanners. Specifically, a poyethylene phantom has been developed which is both a dosimetry phantom as well as an image quality phantom. The phantom would be scanned and the center dose determined, and then the user can adjust the CT technique factors to achieve a standard dose level to the phantom. This second adjusted scan can be used to determine the image noise using the Noise Power Spectrum. This will allow comparisons of the dose efficiency between CT scanners which differ by vendor and model number.
In addition to phantom based measurements, a number of x-ray beam profile measurements will be discussed. As whole body CT scanners increase the width of the collimated x-ray field in the z-dimension, and with the proliferation of fully cone beam CT imaging systems, there is a need to determine the incident beam profile in the absence of a phantom. To facilitate this, the use of a real time radiation probe is being proposed which will allow relative radiation profiles to be measured. A measurement technique which uses the real time probe and allows the assessment of a CT scanners beam shaping (bow tie) filter(s) will be presented, and methods for characterizing the beam in the z-axis will also be mentioned.
113


IDOS, Vienna, 9-12 November 2010 E2-CN-182, Paper No INV015
Regional diagnostic reference levels and collective effective doses from CT scanners in India
R. S. Livingstone, P. M. Dinakaran
Department of Radiology, Christian Medical College, Vellore, India
E-mail address of main author: [email protected]
Diagnostic examinations performed using CT is on the increase and use of this modality needs to be monitored periodically. The aim of this study was to establish regional diagnostic reference levels (DRL) and assess collective effective doses from CT scanners in India.
In-site CT dose measurements were performed for 127 CT scanners in 20 regions in Tamil Nadu, South India. DRLs were formulted for 3 CT examinations namely thorax, abdomen and pelvis. The survey was performed over a period of 2 years. A questionnaire was used for collection of data from all CT centres visited as a part of the regional survey. The questionnaire included the type, model of the scanner; location of the installation; exposure parameters such as tube potentials, tube time-current product, rotation time, pitch (spiral and MDCT); number of scans performed per day; quality assurance performed routinely in each centre; Clinical protocols for respective anatomical regions; availability of dose reduction techniques and dose derivatives in the console.
Radiation dose measurements were performed using routine exposure parameters for thorax, abdomen and pelvis as practiced in each installation. CT dose index (CTDI) was measured using a 32 cm polymethyl methacrylate (PMMA) body phantom. The effective doses were estimated from weighted CT dose index (CTDIW) and dose length product (DLP) values using conversion factors. The CTDIW
values were calculated using the formula
CTDIW = 1/3 CTDIioo,c + 2/3 CTDIl00,p
The dose length product (DLP) was calculated using weighted volume CT dose index (CTDIvoi) and scan length. The effective dose (E) was estimated using the conversion factor from the European criteria for measurement of CT doses [1], The collective effective doses were calculated from the mean effective dose from a particular CT examination and the corresponding number of examinations of that examination performed each year.
An average of 2080 CT examinations is performed each day in the region, of which 2.8 % are paediatrics. Of the 2080 examinations, 1065 were head scans, 409 thorax, 429 abdomen and 177 extremities [2]. Of the 127 CT scanners evaluated, 13 were conventional, 11 refurbished conventional, 53 Single slice helical scanner (SSHS), 6 refurbished SSHS and 44 multidetector CT (MDCT). 54% of CT installations were in the hospitals, 13% in residential areas and 33% in commercial areas. The mean number of exposed population from CT examinations per day in the region was 105 ± 172.82 (7 - 769). Table 1 shows the regional DRLs for CT examinations of specific anatomical regions. The scan lengths are for the Indian population in Tamil Nadu. The mean collective effective dose was 13.42 man Sv ± 43.9 (0.06 -198) and the average effective dose per inhabitant per year was 1.34 mSv ±3.77 (0.01 - 17).
115

TABLE 1: REGIONAL DRLS FOR CT EXAMINATION OF THORAX, ABDOMEN AND PELVIS
CT examination (Mean scan length)
Effective doses in mSv
CT examination (Mean scan length)
Mean ± SD Range 50Ul
Percentile Third
quartile
Thorax (36.1 cm) 8.04 ±3 .3 1.9-24.9 7.7 9.4
Abdomen (33.8 cm) 6.66 ±2 .7 1.6-20.6 6.4 7.8
Pelvis (19.1 cm) 4.57 ± 1.4 1 .14-8 4.4 5.45
There were lot of variations in doses which could be attributed to the differences in dose efficiency between scanner models, use of obsolete scanners and variation in protocols. This study is the first step in the country to establish DRLs for CT scanners. 22 to 35% of scanners had radiation doses above the third quatile values required for the establishment of DRLs. The study reveals that the DRLs are within the international reference level for CT scanners as reported in literature [3]. As the number of CT examinations performed in the country are on the increase, it is therefore imperative to audit CT examinations in order to ensure that doses do not deviate from the established regional DRLs. In light of this study, it is necessary that every CT user should be trained to interpret the dose descriptives such as CTDIvoi, DLP or effective dose values available on the CT console in order to keep doses as low as reasonably practicable. In India, there is a need for standardising clinical protocols for optimising exposure parameters and scan lengths for desired anatomical regions.
REFERENCES
[1] EUROPEAN COMMISSION. European guidelines on quality criteria for computed tomography. Report EUR 16262. European Community, Brussels, Belgium, 1998
[2] LIVINGSTONE RS AND DINAKARAN P. Regional survey of CT dose indices in India. RPD 136(3):222-227; 2009
[3] METTLER FA, HUDA W, YOSHIZUMI TT AND MAHESH M. Effective Doses in Radiology and Diagnostic Nuclear Medicine: A Catalog. Radiology 248 (1) 254-263; 2008
116

IDOS, Vienna, 9-12 November 2010 E2-CN-182, Paper No INV015
Variations of dose to the lung during computed tomography (CT) thorax examinations: A Monte Carlo study
R. Schmidt, J. Wulff, L. Castra, K. Zink
Institut fur medizinische Physik und Strahlenschutz (IMPS), University of Applied Sciences GieBen, Germany
E-mail address of main author :ralph. Schmidt. [email protected]
This study determined the influence of patient individuality on lung organ doses for chest CT examinations. The aim was a statistical statement on the variability as well as the uncertainty caused by the patient individuality. Furthermore, the reproducibility of the mean organ dose value of the lung using the new ICRP 110 voxelized adult female phantom was determined [1 ].
Calculation of lung doses for 61 female chest CT studies with identical scan parameters (120 kV, 135 mAs, 100 mm collimation, 1.5 pitch) were done. For all patients, the lung was contoured and the geometry was simulated using the Monte Carlo method without patient table and with its original voxel size. The lungs were completely included in the scan area. A so-called user code CTDOSPP was developed which extends the Monte Carlo package EGSnrc [2] and enables rotational simulation of CT X-ray sources [3], A developed graphical user interface GMctdospp allows easy handling of simulation parameters and CT studies, which are loaded in the DicomRT struct format [4]. The transformation of CT values to material and density values is carried out with a standard relationship. The ICRP adult female material composition of all organs were directly taken from the publication [1]. The patient table and bed and pillow were assumed to be air in order to be similar to patient pool. All simulations were calibrated for better handling and visualisation to a CTDIair value of 22.9 mGy.
Simulation values were grouped into 1 mSv classes (see figure 1). The organ dose classes fit well to a Gaussian distribution (correlation coefficient R2 = 0.97). The fit's mean value is lOmSv with a standard deviation of 2 mSv. The variability is about ± 30 % with minimum at 8 mSv and maximum at 13 mSv. The calculated organ dose to the lungs of the ICRP adult female phantom is about 11 mSv and thus within the calculated standard deviation of the patient pool. For all simulations the statistical uncertainty was between 2 and 3.5 %.
This present study shows good statistical verification of the 30 % assumption [5] in uncertainty caused by patient individuality and is a good maybe more reliable alternative to measurements in phantoms [6]. The ICRP phantom value agrees well to the distribution, but could not exactly reproduce the calculated mean value, which could be caused by the explicit material simulation, by its own individuality etc.. For an estimation of organ and effective dose and thus for the individual risk it will be more than sufficient, at any rate it overestimates the mean. But it should keep in mind that a large difference in organ doses caused by the individuality is possible.
117

20
15
CD
5
0
FIG. 1. Variations in dose to the lung of 61 patients (black bars), the Gaussian fit through the simulated classes (red dotted line) and the lung dose of the ICRP adult female phantom (blue dotted
line)
1 1 1 j 1 1 1 1 1 1 1 1 1 1 1 1 1 1 1 1 1
gaussian fit 1 1 | | ! 1 1 1 j 1 1 1 1 | 1 1 1
i i c r p 110 : R = \ k i adult female
sim. patient / \ -
classes^ 7 /
/ / r
\ i \ i \ • \
-
-
/ /
4— /
/ /
/ /
i i
i
!
I
\ \ \ T \ \
S
-
/ /
/ y - s* T , , i , , , 1 , , I , , I ,
I I
, , i ! , , , I ,
\ \
TTTTlr 7 8 9 10 11 12 13
organ dose / mSv
REFERENCES
[1] ICRP 110, Adult Reference Computational Phantoms, ICRP Publication 110, Published by Elsevier Ltd. (2009).
[2] KAWRAKOW, I., ROGERS, D„ The EGSnrc Code System: Monte Carlo Simulation of Electron and Photon Transport. NRCC Report No. PIRS-701, National Research Council of Canada (2006).
[3] WULFF, J., KEIL, B„ AUVANIS, D„ HEVERHAGEN, J., KLOSE, K„ ZINK, K, Dosimetrische Evaluation von Augenlinsen-Protektoren in der Computertomographie -Messungenund Monte-Carlo-Simulationen. Z Med Phys 18 (2007) 9-26
[4] Dicom at http://medical.nema.org/ [5] NAGEL, H., Ed., Radiation Exposure in Computed Tomograph, European Coordination
Committee of the Radiological and Electromedical Industries, Frankfurt (2000) [6] ICRU 74, Patient Dosimetry for X Rays used in Medical Imaging, Journal of the ICRU, Vol 5,
No 2, Report 74 (2005)
118

IDOS, Vienna, 9-12 November 2010 E2-CN-182, Paper No INV015
Patient-specific kerma-area product as an exposure estimator in computed tomography: The concept and typical values
A. Malusek3, E. Helmrot3 b, G. Aim Carlsson3
a Division of Radiation Physics, Linkoping University, SE-581 85 Linkoping, Sweden
Department of Radiation Physics, Linkoping University Hospital, SE-581 85 Linkoping, Sweden
E-mail address of the main author: [email protected]
The concept of the patient-specific kerma-area product (PSKAP) as an exposure estimator in computed tomography (CT) was suggested in [1], but no detailed information on how to evaluate this quantity in practice was given. We extend the idea by proposing (i) a rigorous definition of PSKAP, and (ii) a method for its evaluation by a CT scanner. To demonstrate the performance of the method, we used the Siemens Somatom Open CT scanner to obtain PSKAP values (here denoted as PPSKA) for the standard CT dosimetry head phantom.
Let PSKAP of a CT examination be defined as a sum of projection-specific kerma-area products PKA,\
PPSKA~ X PKA,i • (1)
Each PK.U neglects photons passing beside the patient. It can be calculated by a CT scanner from values measured by a KAP-meter mounted downstream the bowtie filter, see Fig. la, as follows: For each projection, detector elements shaded by the patient are identified. For simplicity, we assume here that the corresponding region at a plane perpendicular to the beam axis is an interval (xa, xj), see Figs, la and lb. Then , is evaluated as
p ^ ^ m t ^ i ^ M d x , (2) "KA "KL
where 7 - 1 / 1 is the kerma-area product rate measured by the KAP-meter as a function of tube current I, /'/< is the acquisition time for projection I, and PA(x) and PKL(0) are the kerma-length products taken at positions x. and 0, respectively. The ratios PKI(0)/PKA and PKL(X)/PKL(0) are determined during a calibration of the CT scanner. The integral in equation (2) is evaluated separately for each projection.
Since this concept has not been implemented in clinical CT scanners yet, we determined the PPSKA value for a cylindrical phantom using a simplified method. The measurement with the KAP-meter was omitted, and equation (2) simplified to
= PKL = 0)At, , (3)
where is the kerma-length product rate measured at the iso-center. Measurements of the kerma-length product were performed with a WD CT 10 pencil ionization chamber. Measured values were corrected for beam hardening of the x-ray spectrum in the bowtie filter via correction factors pre-calculated using the PENELOPE Monte Carlo code (Fig. 2b). Corrected values of the PKL(X)/PKL(0) ratio for 80, 100, 120, and 140 kV are in Fig 2a. The resulting patient-specific kerma-area-product was
119

/ J P S K A = 0.25 Gy cm2 for the x-ray tube voltage of 120 kV, tube current of 100 niA, scanning time of 1 s, and beam width at the iso-center of 1.2 cm. For a sequential 10 cm scan of the head cylinder with pitch 1, the value was 10/1.2 = 8.3 times larger, i.e. /Jrsi<\ =2.1 Gy cnr.
To implement this method: (i) the CT scanner must be equipped with a KAP-meter, (ii) the calculation procedure must be implemented in the scanner's software, and (iii) a calibration to determine the ratio PKL(0)/PKA and the function PKL(X)/PKL(0) must be performed.
FIG. 1: (a, left) Schematic view of the integration interval (xa, xb) which can be defined as a region where the signal intensity drops below a certain threshold level. To avoid attenuation in the couch, the signal can be calculated from reconstructed images, (b, right) The interval (xa, Xb) is used to evaluate the integral in equation (2); the integral equals the area below the curve PKL(x)/PKL(0).
x-ray tube bowtie filter KAP-meter
phantom
couch detector array signal intensity
iso-center
o 80 kV o 100 kV o 120 kV o 140 kV
i 1— 50 100
x / mm
0 10 20 30 40 thickness of Al / mm
FIG. 2: (a, left) The normalized kerma-length product, PKL(X)/PKL(0), as a function of position, x,for x-ray tube voltages of 80, 100, 120, and 140 kV and the head bowtie filter, (b, right) Calculated calibration coefficient, NKL, of the WD CT 10 chamber as a function of aluminium filter thickness.
REFERENCE
[1] HUDA W., Time for unification of CT dosimetry with radiography and fluoroscopy, Radiation Protection Dosimetry (2008), Vol. 128, No. 2, 129 - 132
120

IDOS, Vienna, 9-12 November 2010 E2-CN-182, Paper No 226
Application of dosimetric methods for obtaining diagnostic reference levels in panoramic dental radiography
L. V. Canevaro a, M. M. Nunes b, C. D. Almeida a
a Instituto de Radioprote9ao e Dosimetria / Comissao Nacional de Energia Nuclear (IRD/CNEN), Rio de Janeiro, Brasil. b Programa de Engenharia Nuclear / Universidade Federal do Rio de Janeiro (COPPE/UFRJ), Rio de Janeiro, Brasil.
E-mail address of main [email protected]
Radiological techniques in dentistry have been developing rapidly and the panoramic dental radiology equipment (PDR) has been used increasingly [1], In PDR, radiosensitive organs can be irradiated by the primary beam or can receive scattered radiation [2]. In Brazil, it has not been adopted reference levels for panoramic radiography, mainly because there are few dosimetric researches in PDR.
The TRS 457 [3] suggests the use of quantity kerma-length product (PKL) to quantify the dose in PDR. Another quantity that can be used is the kerma-area product (PKA). In PDR, the X-ray equipment is in rotation during the emission of X-rays, the irradiation fields are small, making difficult both dose measurement and field size definition. The point is to determine the most appropriate method considering the practicality and uncertainty of the chosen method. In this work, two methods for obtaining PKA have been tested in panoramic devices. We used a Diamentor M4-KDK PKA meter, a Radcal 9015 dosimetric system with electrometer model 9015 with a CT ionization chamber (10X5-3CT) and a thimble chamber (10X5-6).
The goals of the present study are to verify the viability of a PKA meter and a CT ionization chamber to assess PKA and PKL IN a panoramic X-ray unit as a feasible method of obtaining dosimetric values to quantify patient exposure.
PKA meters are calibrated by the manufacturer, traceable to a primary measure of air kerma in a geometry different from that to be used in practice. Thus, the meter must be calibrated in situ. In PDR, the distances are fixed, the X-ray tube rotates during the exposure, the radiation beam is extremely narrow and the collimator is fixed. To overcome these difficulties, in this work the meter was calibrated in cephalometric mode. The average calibration factor obtained for one X-ray equipment (Rotographic Plus) was 0.80 ± 0.02. The uncertainty for the measurement of air kerma was 1%. The uncertainty for the measurement of PKA was ±0.01 cGy.cnr . Similar values were obtained for other equipment.
For each value of voltage and current of the tube, dosimetric measurements were performed with the PKA ionization chamber positioned ahead of the first collimator and CT chamber before the second collimator. The procedure was repeated using other collimators on the equipment (eg collimators for children). The values obtained with the PKA meter were compared with values calculated from CT camera data using equation 1:

PKA calculated = PKL X h (Eq. 1)
PKL = kerma-length product measured with a CT chamber
h = Height of the radiation beam at the entrance of the second collimator.
Table 1 shows the PKA and PKL values obtained during simulation tests in a panoramic equipment evaluated. The values of PKA and PKL IN our work were similar to those found in the literature. [4, 5]. Both methods evaluated have found similar values when comparing one to another. Considering the results, we conclude that both methods of measure can be employed as a simple and direct way to measure patients doses for this type of examination. Relying on dosimetric values in this type of oral examinations promote greater control of patients exposure.
TABLE It RESULTS OF PKA AND Pkl MEASUREMENTS IN ROTOGRAPHIC PLUS X-RAY EQUIPMENT. [MA - 10, AREA - (83,7 ± 1,3)CM2].
kVp Time PKA(measured) CL (Pencil chamber measure)
P K L P K A
(calculated) A
(s) (cGy.cm2) (uGy) (uGy.cm) (cGy.cm2) (%)
60 14 2,64 ±0,01 224,0 ± 2,2 2240 ± 22 2,64 ± 0,03 0
65 14 3,36 ±0,01 290,0 ±2,9 2900 ±29 3,42 ± 0,04 -2
70 17 5,14 ±0,01 429,6 ± 4,3 4296 ± 43 5,07 ± 0,07 1
75 17 7,09 ±0,01 580,2 ±5,8 5802 ±58 6,85 ±0,09 3
80 17 8,27 ±0,01 677,0 ±6,8 6770 ±68 7,99 ±0,10 3
85 17 10,71 ±0,01 838,4 ±8,4 8384 ±84 9,89 ±0,13 8
The calculations required are simple, quick and easy to come by, so do not introduce many sources of uncertainty in the measurement process. This fact make possible to include this tests in the quality control routine.
This methodology is being applied in other panoramic equipment in order to have enough dosimetric information making it possible to propose mechanisms for optimization of this practice and, in long term, establish reference levels for PDR in Rio de Janeiro and Brazil.
R E F E R E N C E S
[1] UNITED NATIONS SCIENTIFIC COMMITTEE ON THE EFFECTS OF ATOMIC RADIATION. "Sources and Effects of Ionizing Radiation". UNSCEAR 2000 Report Vol. I, 2000.
[2] INTERNATIONAL COMMISSION ON RADIOLOGICAL PROTECTION. "Recommendations of the International Commission on Radiological Protection". ICRP Publication 103, Pergamon Press, 2007.
[3] INTERNATIONAL ENERGY ATOMIC AGENCY. Technical Reports Series No. 457. "Dosimetry in Diagnostic Radiology". An International Code of Practice. IAEA, 2007.
[4] WILLIAMS, J. R., MONTGOMERY, A. "Measurement of dose in panoramic dental radiology". The British Journal of Radiology, 73, pp.1002-1006, The British Institute of Radiology, 2000.
[5] HELMROT, E., CARLSSON, G. A. "Measurement of Radiation Dose in Dental Radiology". Radiat. Prot. Dosim., Vol. 114, N° 1 - 3, pp. 168- 171, 2005.
122

Parallel Session 7a
Clinical Dosimetry in Radiotherapy


IDOS, Vienna, 9-12 November 2010 E2-CN-182, Paper No INV015
Verification of the radiation treatment planning process:
Did we get it right?
Jacob Van Dyka b
"International Atomic Energy Agency, Vienna, Austria; bLondon Regional Cancer Program and University of Western Ontario, London, Ontario, Canada
E-mail address of main author: [email protected] ([email protected])
The field of radiation therapy has seen a rapid evolution from 2-D radiation therapy (2-D RT) to 3-D conformal radiation therapy (3-D CRT) to intensity modulated radiation therapy (IMRT), along with image-guided radiation therapy (IGRT). Each stage of transition was associated with a higher level of technological sophistication. Treatment planning (TP) is at the hub of the multi-stage radiation treatment (RT) process - any inaccuracies at this stage will result in an inaccurate treatment for the patient. Fig. 1 shows the steps of the RT process for three common treatment scenarios. Various reports have been developed that deal with the acceptance, commissioning and quality assurance (QA) of RT planning systems (TPS) [1-3]. Dealing with the TPS is only part of the total process of ensuring that "we got it right". "Getting it right" incorporates four key activities [1]: "education", "documentation", "verification" and "communication".
"Education" includes specialized training specifically for new technologies. Many reports on radiation therapy errors [4] have shown that a significant underlying cause is the lack of adequate training.
2 - D R T 3-D CRT I M R T
Patient positioning & immobilization
X Patient data for
RT planning (Conlours/2-D x-ray Ellms)
Prescription & simple constraints
Forward planning *
Manual data transfer
Patient positioning & Patient positioning & immobilization immobilization
I \ Imaging for RT planning Imaging for RT planning
(Mostly CT) (CT... + possibly other)
1 Target & normal tissue Target & normal tissue
delineation delineation 1 1
Definition of D-V Definition of D-V constraints constraints
i 1
Forward planninq Mmzrmwm m^^mmm
I Manual &ior electronic Electronic data transfer data transfer Electronic data transfer
Set-up confirmation (Port films)
X
"Documentation" involves record keeping for all activities associated with the implementation and QA of a TPS. The documentation should be clear enough so that if a physicist leaves the department, it should be easy for a new physicist to see what has been done during the TPS workup and QA procedures.
"Verification" involves a variety of activities - including measurements associated with commissioning, on-going QA and "end-to-end" tests. During the acceptance procedures a series of tests are performed (e.g., "site tests" as described in [2]) which verify that the system responds according to the specifications set out in the purchase process. "Verification" also includes commissioning measurements and tests to ensure that the dose calculations can be performed with the accuracy as defined in the specifications. If the measurements are inaccurate, then the resulting dose calculations performed by the TPS will attempt to reproduce these incorrect measurements. Very significant treatment errors (e.g., 50% errors in dose delivery [5]) have been known to occur as a result
Patient-specific dosimetry confirmation
Dose delivery (Beams, shields, wedges seiby
RTS)
Set-up confirmation (EPIQ/lrnaging)
X Dose delivery
(Beams set by RTs, possibly shields/wedges)
| Basic
• Unique to IMRT
| | 3-D CRT & IMRT
Set-up confirmation (Imaging/I GRT)
I _
Difference? between 3-D CRT & IMRT
FIG. 1. Block diagram of different treatment scenarios.
125

of the use of an incorrect ionization chamber for small field stereotactic techniques. Appropriate detectors [6] are required in different regions of dose delivery, e.g., measurements in the build-up region should be made with a parallel plate ionization chamber. Central ray measurement beyond the maximum dose should be made with a low-noise cylindrical volume ionization chamber when measuring photon beams but should be made with parallel plate chambers when measuring electron beams. Cross beam dose profiles should be made with a small diameter cylindrical ionization chamber. Anthropomorphic phantom measurements need to be made with thermoluminescent dosimeters (TLDs) or, the recently introduced, optically stimulated luminescence (OSL) dosimeters [7]. For IMRT, patient-specific measurements may have to be made to verify that the MLC delivery process is accurate. For this, a variety of procedures and technologies have been developed that are commercially available and range from TLD measurements and/or ionization chamber measurements in specialized phantoms, to the use of film dosimetry or the use of 2-D or 3-D arrays of detectors [8],
"Communication" takes various forms. First, it includes clear communication, in terms of the use and the outputs of the TPS, e.g., physicians need to be very clear about their definition of target volumes, expected margins and the corresponding dose-volume constraints. Treatment planners need to be very clear about details regarding the set-up of treatment techniques. Treatment protocols should be developed jointly by the professional groups involved in the RT process and these should be available as written, or "on-line", documents. The dose prescription and the dose normalization should be clearly understood by all professionals involved.
To assess whether "we got it right" with respect to the actual dose delivered to the patient, a technique can be fully evaluated by CT scanning an anthropomorphic phantom, having a physician define the target volume on the resulting images and providing dose-volume constraints and the prescription, developing a treatment plan, and finally delivering a dose to the phantom which has been loaded with dosimeters. Alternatively, TLD, MOSFET or OSL dosimeters can be used with in vivo dosimetry on patients to determine the agreement between calculated and delivered dose. Ultimately, all of these procedures should convince the professional staff that "we got it right"!
REFERENCES
[1] INTERNATIONAL ATOMIC ENERGY AGENCY, Commissioning and Quality Assurance of Computerized Planning Systems for Radiation Treatment of Cancer. TRS-430, IAEA, Vienna (2004).
[2] INTERNATIONAL ATOMIC ENERGY AGENCY, Specification and Acceptance Testing of Radiotherapy Treatment Planning Systems. TECDOC-1540, IAEA, Vienna (2007).
[3] INTERNATIONAL ATOMIC ENERGY AGENCY, Commissioning of Radiotherapy Treatment Planning Systems: Testing for Typical External Beam Techniques. IAEA, Vienna (2008).
[4] BOADU, M., REHANI, M.M. Unintended exposure in radiotherapy: identification of prominent causes. Radiother Oncol. 93:609-617 (2009).
[5] htlp://www.nylimcs.com/2010/02/25/us/25radiation.htrnr?_r~1 &scp~l &sq~coxhcallh&st~csc. [6] Accessed 2010-07-28 KRON, T. Dose Measuring Tools. In: The Modern Technology of
Radiation Oncology. Van Dyk, J. (ed.). Medical Physics Publishing, Madison, (1999). [7] JURSINIC, P.A., Characterization of Optically Stimulated Luminescent Dosimeters, OSLDs,
for Clinical Dosimetric Measurements. Med. Phys. 34: 4594-4604 (2007) [8] LI, J.G., YAN, G., LIU, C. Comparison of two commercial detector arrays for IMRT quality
Assurance. J. Appl. Clin. Med. Phys. 10: 2942 (2009).
126

IDOS, Vienna, 9-12 November 2010 E2-CN-182, Paper No INV015
Assessing heterogeneity correction algorithms using the Radiological Physics Center's anthropomorphic thorax phantom
D.S. Followill, S. Davidson, P. Alverez, G.S. Ibbot
UT M.D. Anderson Cancer Center, Houston, USA
The Radiological Physics Center (RPC) was established as a resource in radiation dosimetry and physics for cooperative clinical trial groups and radiotherapy facilities that deliver radiation treatments to patients entered onto cooperative group protocols. The RPC's primary responsibility is to assure NCI and the cooperative groups that the participating institutions deliver radiation treatments that are clinically comparable to those delivered by other institutions in the cooperative groups. One of the remote audit techniques used by the RPC to assure NCI is to credential institutions using its anthropomorphic phantoms, i.e. an end to end test from imaging to planning to final dose delivery as if the phantom were an actual patient. With the recent the implementation of several lung protocols requiring heterogeneity corrected target doses, the RPC, through its credentialing activities have evaluated numerous heterogeneity correction algorithms as used in various treatment planning systems. These systems include Elekta Pinnacle supeiposition convolution (SC) (adaptive convolve and collapsed cone) algorithms, Varian Eclipse pencil beam (PB) and AAA algorithms, TomoTherapy planning station SC, Accuray Multiplan PB and Monte Carlo (MC) algorithms, Nomos Corvus PB, CMS XiO SC, BrainLab PB and Elekta PrecisePlan Clarkson algorithm.
The thorax phantom was sent to nearly 200 institutions since late 2004. This phantom (figure 1) is a water-filled plastic shell that simulates a patient not only in dimensions but also in densities for imaging and treatment purposes. This design includes two lungs with density of 0.33 g/cm3 and a target centrally located in the left lung with density near 1 g/cm3. TLD and radiochromic films were used as dosimeters within and near the target region. Institutions that received the phantom were requested to image, plan and treat the phantom as if a patient. The institutions were asked to submit both the homogeneous and heterogeneity corrected treatment plans using the same number of monitor units.
FIG 1, Thorax phantom
As seen in Table 1, the initial evaluation of the target doses comparing the ratio of the homogeneous dose to heterogeneity corrected dose revealed a difference between several of the planning system algorithms (TPS). There is a 5-10% difference between the Clarkson/ PB algorithms calculated corrected heterogeneity doses as compared to the
TABLE 1. COMPARISON BETWEEN TPS CORRECTION ALGORITHMS
TPS Hetero. Correction # Irrad. Ctr. of Ctr. of Algorithm Target Ave. TargetAve.
^hetert/^homo Diu/Dhetero
Pinnacle Adapt C/CC conv 15 1.14 0.98 Hi-Art Superposition 9 1.15 0.99
XiO Superposition 8 1.13 0.97 Accuray Mulitplan Monte Carlo 6 1.1 0.98
Eclipse AAA 12 1.12 0.96 Eclipse Pencil Beam 12 1.18 0.95
Brain Lab Pencil Beam 5 1.2 0.96 PrecisePlan Clarkson 2 1.19 0.99
Accuray Mulitplan Pencil Beam 2 - 0.87
127

SC/AAA/Monte Carlo corrected heterogeneity doses. This difference was not obvious when considering the ratio of the TLD dose to the calculated heterogeneity corrected doses in the center of the target where the average TLD/target dose ratio was 0.97 ± 0.025 (std dev) with the exception of the Accuray MultiPlan algorithm where the ratio was 0.87 ± 0.018. However when one looked at the dose profiles and gamma index (±5%/3mm) of the dose distributions going through and around the target there were clear differences between classes of heterogeneity correction algorithms as seen in Figure 2 where the Pinnacle SC data is compared to the Eclipse PB data. The reason for this observed difference was due to the lack of lateral electron scatter in the PB and Clarkson type algorithms. The SC/AAA/Monte Carlo algorithms all accounted for this lateral scatter and as such
FIG 2. Comparison of dose profile, isodose distribution and gamma analysis between (A) Pinnacle SC and (B) Eclipse PB.
the agreement between measurement and calculation was good. Figure 3 shows a histogram of the percent of pixels passing the gamma index criteria for various planning system heterogeneity correction algorithms and once again you can see which algorithms do a poor job and which ones have a higher rate of passing the criteria.
Conclusion: Various heterogeneity correction algorithms are more accurate at calculating doses to targets in the lung and these algorithms are being required for clinical trials treating lung tumors.
Work was supported by PHS grant CA10953 and CA081647 awarded by NCI, DHHS.
FIG 3. Histogram of the percent of pixels passing the 5%/3mm
128

IDOS, Vienna, 9-12 November 2010 E2-CN-182, Paper No INV015
LiFo-film dosimeters in skin dose measurements
S. Leliea e, T. Lennertz3, B. Schaekenab'c, B, Bogdanov6, E. Bressers', S. Schreurs3, W. Schroeyers3, D. Verellenc d
aNuTeC, XIOS Hogeschool Limburg, dept. TIW, Agoralaan Gebouw H, Diepenbeek, Belgium
' ZNA-Middelheim, dept. Radiotherapy, Lindendreef 1, 2020 Antwerpen, Belgium
c Vrije Universiteit Brussel, Laarbeeklaan 103, 1090 Brussels, Belgium
dUZ-Brussel, dept. radiotherapy, Laarbeeklaan 101, 1090 Brussels, Belgium
eOrfit Industries nv, Polymer research and development, Vosveld 9a, 2110 Wijnegem.
f
LOC, Virgajesseziekenhuis, Stadsomvaart 11, 3500 Hasselt.
E-mail address of main author: [email protected] Skin dose is an important issue in radiation therapy to control malicious skin effects due to high doses to the skin[Ge05)fCo95]. Radiation therapy planning systems however can not deliver accurate dose calculations in the first few mm of tissue (build-up effect, difficult measurement of skin dose, transition between tissue and air in planning CT, ...). This study will present the use of lithium formate monohydrate film dosimeters as a possible dosimeter in skin dose measurement. Lithium formate monohydrate (LiFo) is mixed with s-polycaprolactone (PCL) in a ratio of 35wt% LiFo and 65wt% PCL. Afterwards the mixture is pressed into 1 mm thick film sheets. LiFo forms stable free radicals when irradiated [mos]- The concentration of radicals is a measure for the absorbed dose and can be measured using an electron magnetic resonance (EMR) spectrometer in combination with a high sensitive resonant cavity. The peak-to-peak value of the first derivative of the absorption spectrum measured with the EMR spectrometer is a measure for the free radical concentration and consequently the absorbed dose. Together with the dosimeter a reference nuclide signal is measured to correct for spectrometer sensitivity fluctuations at short and long-term. LiFo was preferred to L-a-alanine due to a higher sensitivity of the dosimetric material and the little amount of radiosensitive material that can be processed in the current production process. In our measurements LiFo film dosimeters of 20 mm by 4 mm and a thickness of 1 mm were irradiated using different irradiation facilities in various radiotherapy centres in Belgium with photon energies of 6 and 18 MV.
A dose calibration curve was established using a series of dosimeters irradiated to a known absorbed dose (5 to 50 Gy). Each dose point corresponds with 4 irradiated dosimeters. A linear EMR-signal to dose response was obtained (figure 1).
Rotational depency of the read-out of the dosimeter was studied. This resulted in a rotational dependecy of up to 8.5%. The rotational dependency can be corrected for by measuring multiple orientations of the dosimeter in one measurement (i.e. 5 different spectra of one dosimeter). A total uncertainty (orientation, tilting of dosimeter ...) of 5% was obtained for 20 Gy.
Fading measurements were performed over a period of 14 weeks. In the first 8 weeks no significant fading was found. A significant fading was seen afterwards with up to 40% in week 22. New periodic measurements are being performed to validate these results.
129

In addition to the development and characterisation of these dosimeters, the integral skin dose was measured in some clinical case studies for breast sparing cancer treatments. The techniques of tangential fields, IMRT and helical tomotherapy were investigated and the measured skin dose was compared with the dose as estimated by the treatment planning system. Differences up to 50% were observed, illustrating the inaccuracy in skin dose calculations.
fc- T £ 3 "D w JS tfl u 2
u 1 c u a qj rt
T3 o 3 £ — y e
0.008 0.007 0.006 0.005 0.004 0.003 0.002 0 . 0 0 1
0
Dose respons
y= 1.14E-04x + 9.20E-04 R 2 = y . y y E - u i
10 20 30
ow[c>y)
40 50 60
FIG 1: Dose response for LiFo film dosimeters
REFERENCES
[1] JD COX et al.: Toxicity criteria of the Radiation Therapy Oncology Group (RTOG) and the European Organization for Research and Treatment of Cancer (EORTC) [editorial], Int J Radiat Oncol Biol Phys 31, 1995, pl341-1346
[2] P. GEORG et al.: The use of the source-skin distance measuring bridge indeed reduces skin teleangiectasia after interstitial boost in breast conserving therapy, Radiotherapy and Oncology 74, 2005, p323-330
[3] E. LUND et al.: Formates and dithionates: sensitive EPR-dosimeter materials for radiation therapy, Applied Radiation and Isotopes 62, 2005, p317-324
ACKNOWLEDGEMENTS
Institute for the promotion of Innovation through Science and Technology in Flanders (IWT-Vlaanderen)
130
IDOS, Vienna, 9-12 November 2010 E2-CN-182, Paper No INV015
A dosimetric protocol for the use of radiochromic film in radiotherapy quality assurance in Norway
A. Mauring
Norwegian Radiation Protection Authority (NRPA), 0steras, Norway
E-mail address of main author: [email protected]
Recent advancements in external beam radiotherapy has urged a revision of the existing quality control routines at Norwegian hospitals. There has been a concern that the established method, primarily focused on point dose measurements using an ionization chamber in a water phantom, does not give enough information about the planar dose distribution. With this background, a master's thesis [1] project was initiated at the NRPA in 2008. The goal of the thesis was to develop a method that would relate established methods [2] to 2-D dosimetry using GafChromic® EBT [3] film, and perform measurements at a number of Norwegian hospitals. After completion of the thesis, the project was developed further to include an improved experimental method and measurement results from a total of 19 linear accelerators from all ten radiotherapy hospitals in Norway [4]. In addition, the film was thoroughly assessed with regards to measurement accuracy [5]. The project was finished in May of 2009, and published reports are available from the NRPA website (http://www.nrpa.no).
Experimental setups were designed to shed light on areas where existing dosimetry quality assurance might be inadequate; abutted fields, rotated fields and small fields that utilize overtravel on the secondary collimators. Abutted field techniques are commonly encountered in head-and-neck treatments, while small overtravel fields are often used as booster fields, e.g. in breast cancer treatment. In order to get a direct relation between absolute dosimetry and relative film dosimetry, measurements of absolute dose were performed at each hospital according to TRS 398 [6] using a thimble type ionization chamber in a water phantom. These measurements were done using 6 and 15 MV photon fields, with the number of monitor units custom selected in each case so that the ionization chamber would receive 2 Gy.
For film dosimetry, five different setups were studied for each linear accelerator - a standard reference field, abutted fields without collimator rotation, abutted fields with collimator rotation in the x- and y-direction, and overtravel fields. All films were placed under a water phantom containing the equivalent of 10 g/cm2 water with a SSD of 90 cm, analogous to the ionization chamber setup. 15 MV photon fields were used for all film measurements.
After exposure all films were stored in light-proof envelopes for 24-48 hours before being scanned five times on a flatbed scanner at 72 dpi. The mean pixel value of the red channel of the last three scans was used for analysis. The protocol used for film processing was based on a modification of the procedure first suggested by Devic et al (2005) [7]. Self-written software in Matlab was used for all image processing and most analysis tasks. As film response may vary noticeably for different measurement series, the measured absolute dose from the ionization chamber measurements of the reference field was used to adjust the calibration curve to each individual linear accelerator. A thorough assessment of the uncertainties in the film show that the 2a dose uncertainty for the film is less than 4 % at the 2 Gy level.
Results from the absolute ionization chamber measurements in the isocenter of a reference field show that the measured dose values all lie within 2 % of the expected value of 2,0 Gy. Measurements done
131

with film on an equivalent field show that penumbra, field size, flatness and symmetry gives results that are also in agreement with expected values.
For abutted field setups the results are more incongruous, as overlaps and gaps between the abutted fields result in deviations in dose larger than 30 % in small areas within the fields. For the cases where the fields were also rotated measured errors were generally larger, partly because certain gaps or overlaps were doubled in the rotation process. Linear accelerators that utilize MLC as a secondary collimator seemed more prone to anomalies in the planar dose distribution. This may be accounted to small errors in the fine adjustments on the large number of individual leaves.
Overtravel field measurements show that almost all of the linear accelerators were able to geometrically reproduce the small field sizes. However, comparisons with dose planning software using gamma evaluation methods [8; 9] show that in many cases the predicted doses in the overtravel fields differ significantly from the measured doses using film.
Measurements with both the ionization chamber setup and film show that hospitals have good control of their standard reference field, but still have some potential for improvement when it comes to specialized field setups. The GafChromic® EBT type radiochromic film proved useful in performing simple and cost-effective 2-D dosimetry. With continuous development in the field it is likely that this type of film could become increasingly prominent in clinical QA routines.
REFERENCES
[1] MAURING, A., A novel dosimetric protocol for high energy radiotherapy beams in Norway using radiochromic film. Thesis submitted for the degree of Master of Science, Department of Physics, University of Oslo. Stralevernrapport 2010:2. Osteras: Statens stralevern, 2008.
[2] BJERKE, H., Dosimetry in Norwegian radiotherapy: Implementation of the absorbed dose to water standard and code of practice in radiotherapy in Norway. Stralevernrapport 11:2003, Osteras: Statens stralevern, 2003.
[3] GafChromic® EBT: Self-developing film for radiotherapy dosimetry. Wayne, NJ: Advanced Materials Group, International Specialty Products, 2007.
[4] MAURING, A., Radiokromisk film for karakterisering av stralefelt: Protokoll for praktisk bruk av GafChromic® EBT til dosimetriformal innen straleterapi. StralevernRapport 2009:9. Osteras: Statens stralevern, 2009.
[5] MAURING, A., Radiokromisk film for kontroll av stralefelt: Protokoll for praktisk bruk og behandling av GafChromic® EBT til dosimetriformal innen straleterapi. StralevemRapport 2009:9. Osteras: Statens Stralevern, 2009.
[6] IAEA Technical Report Series 398. Absorbed Dose Determination in External Beam Radiotherapy. Wien: International Atomic Energy Agency, 2001.
[7] DEVIC S. ET AL., Precise radiochromic film dosimetry using a flat-bed document scanner. Medical Physics 2005; 32(7): 2245-2253.
[8] LOW, DA AND DEMPSEY, JF., Evaluation of the gamma dose distribution comparison method. Medical Physics 2003; 30(9): 2455-2464.
[9] DEPUYDT, T. ET AL., A quantitative evaluation of IMRT dose distributions: refinement and clinical assessment of the gamma evaluation. Radiotherapy and Oncology 2002; 62(3): 309-319.
132

IDOS, Vienna, 9-12 November 2010 E2-CN-182, Paper No INV015
Peripheral doses in modern radiotherapy techniques: A comparison between IMRT, Thomotherapy and Cyber knife
1 2 1 2 E. D'Agostino , G. Defraene , L. de Freitas Nasdmento , R. Bogaerts , F. Van den Heuvel and F. Van haven
1 Radioprotection Dosimetry and Calibration, Belgian Nuclear Science Institute, Mol
2 Radiotherapy department, University Hospital Gasthuisberg, Leuven
E-mail address of main author: [email protected]
The goal of this intercomparison is to determine the impact of peripheral doses, during treatment of prostate cancer. Three different machines will be compared: IMRT (lOMeV, nowaday the common energy used in clinical practice, and 18MeV; Varian Clinac 2100 C/D (Varian Medical Systems, Inc., Palo Alto, CA, USA), Tomotherapy (6 MeV) and Cyberknife (6 MeV). The treatment devices are located in the university hospitals of Leuven, Brussels and Liege respectively. Two possible working strategies will be followed. In the first case a common treatment protocol will be agreed among the three clinical centers and this same protocol will be used by each partner. In this case we will be able to evaluate the performances (in terms of peripheral doses) of the different machines when faced to the same constraints, in terms of dose distribution. In the second case each center will treat the tumour following its internal treatment protocol. The goal of this second measurements round is to compare the machines when each of them is working with its own optimized protocol.
The measurements are done with a Rando Alderson (RA) antropomorphic phantom filled in with TLD's (MTS-N pellets) and neutron bubble detectors (in the case of lOMeV and 18 MeV IMRT). The phantom is imaged using a CT scanner and the same conversion curve 'Hounsfield Units - electronic density' is shared across the three clinical centers, along with the CT data. Different organs are considered in the study: thyroid, stomach, colon, kidney, liver and lungs for neutrons and photons measurements. In the case of photons, we also monitor the dose in the esophagus, spleen, red bone marrow, brain, small intestine and pancreas. Photon doses are measured by placing TLD into the RA phantom, in correspondence of the different organs. The TLD's were distributed within the different organs in order to guarantee a, as uniform as possible, 3D coverage of the volume. The final equivalent doses values were obtained by averaging on the different organs TLD's. Neutron doses are measured by placing bubble detectors, both for thermal (BDT) and fast neutrons (BD-PND) in holes drilled in the studied organs. We deliver a single treatment fraction of 2Gy (in the entire treatment 74Gy are delivered to the tumor site).
We present here some preliminary results. At present we have perfomed two measurements on the IMRT device, for lOMeV and 18MeV. The delivered number of monitor units in the optimal 5-field IMRT plan was approximately 10% higher in the 18 MeV plan compared to the 10 MeV plan. Figure 1 shows the photons equivalent dose for the different organs. Photons doses are reported in mSv/(delivered Gy).
133
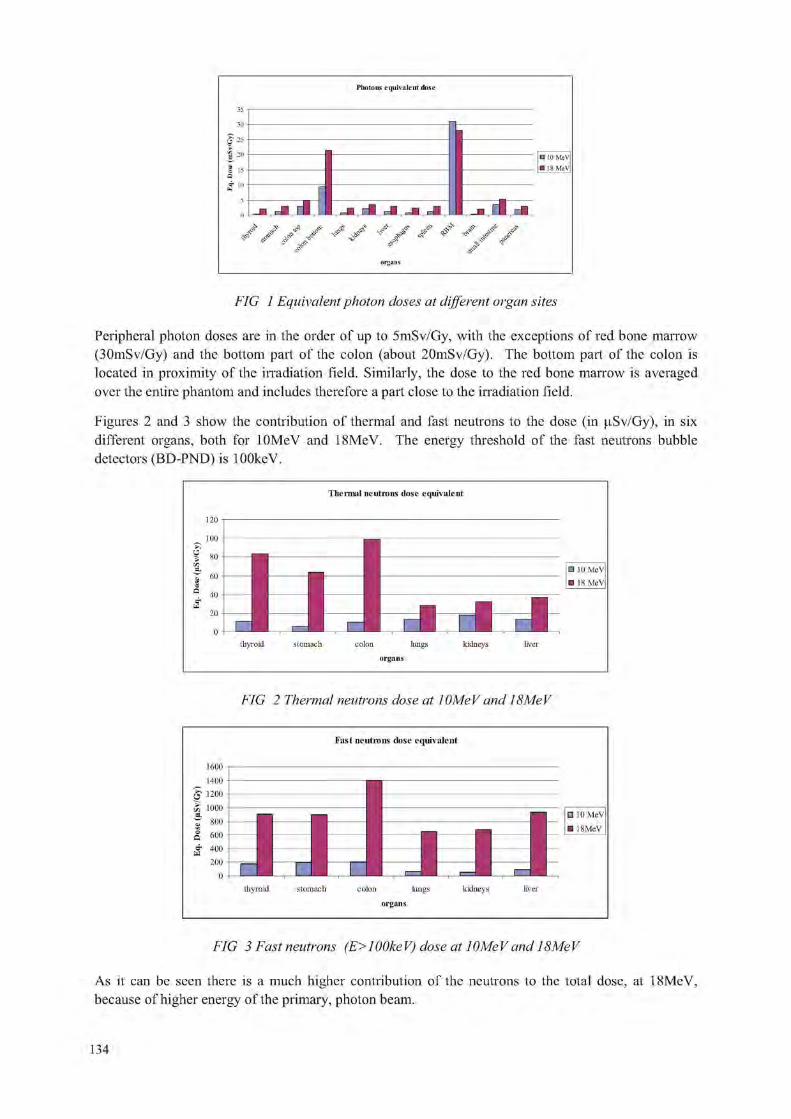
FIG 1 Equivalent photon doses at different organ sites
Peripheral photon doses are in the order of up to 5mSv/Gy, with the exceptions of red bone marrow (30mSv/Gy) and the bottom part of the colon (about 20mSv/Gy). The bottom part of the colon is located in proximity of the irradiation field. Similarly, the dose to the red bone marrow is averaged over the entire phantom and includes therefore a part close to the irradiation field.
Figures 2 and 3 show the contribution of thermal and fast neutrons to the dose (in (.iSv/Gy), in six different organs, both for lOMeV and 18MeV. The energy threshold of the fast neutrons bubble detectors (BD-PND) is lOOkeV.
Thermal neutrons dose equivalent
FIG 2 Thermal neutrons dose at lOMeV and 18MeV
Fast neutrons dose equivalent
1600 n
thyroid stomach colon lungs kidneys liver organs
FIG 3 Fast neutrons (E> 1 OOke V) dose at 1 OMe V and 18Me V
As it can be seen there is a much higher contribution of the neutrons to the total dose, at 18MeV, because of higher energy of the primary, photon beam.

For organs distant from the irradiation field, such as the thyroid, we can see that the major contribution to the peripheral dose comes from the neutrons, fast neutrons in particular. This is due to the important attenuation of the photons, at such distances, in particular for lower (lOMeV) energies.
To conclude, we present here preliminary results of IMRT prostate treatment at lOMeV and 18MeV. The contribution of photons and neutrons is measured in an antropomorphic phantom. At distant organs/sites, the neutrons component of the dose will be higher than the photon component. This study will soon include two more radiotherapy techniques, namely, Thomotherapy and Cyberknife, both at 6MeV In the coming month we plan to complete the first round of measurements.
REFERENCES
[1] F. VANHAVERE ET AL. Radiation Protection and Dosimetry (2004), 110(1-4), pp 607-612 [2] S. KRY ET AL. Int. J. Radiation Oncology Biol. Phys. (2005), 62(4), pp 1204-1216
135


Parallel Session 7b
Clinical Dosimetry in X ray Imaging II


IDOS, Vienna, 9-12 November 2010 E2-CN-182, Paper No INV014
A proposed European protocol for dosimetry in breast tomosynthesis
D. R. Danceab, K. C. Youngab, R. E van Engenc
" N C C P M , Royal Surrey County Hospital, Guildford GU2 7XX, UK
Dept. of Physics, University of Surrey, Guildford GU2 7XH, UK cNational Training and Expert Centre for Breast Cancer Screening (LRCB), Radboud University Nijmegen Medical Centre P.O. Box 6873, 6532 SZ Nijmegen, The Netherlands
E-mail address of main author: [email protected]
A Monte Carlo computer model of X-ray systems for digital breast tomosynthesis has been used to calculate the mean glandular breast dose for a range of imaging geometries, breast sizes and compositions and X-ray spectra. The objective was to provide absorbed dose conversion coefficients which may be used to estimate the mean glandular dose to the breast from measurements of air kerma. A formalism is proposed which extends that used in the Europe for conventional 2D projection mammography by the introduction of a further multiplicative factor T, so that the mean glandular breast dose (D) is obtained as:
D = K g c s T (1)
where K is a measurement of air kerma (specified below), g is the absorbed dose conversion coefficient for a breast of glandularity 50%, tabulated in [1] as a function of half value layer and breast thickness, the factor c corrects for the actual glandularity of the breast and the factor s allows for spectra which have the same HVL but originate from X-ray tubes with different target/filter combinations, as given in [2] and [3].
The Monte Carlo model used follows the approach in [1], [2] and [3], suitably extended to simulate geometries used for breast tomosynthesis. Two different geometries were treated: firstly a full field imaging system with a rotation point situated 4 cm above a fixed image receptor, which was at 66 cm from the focal spot of the X-ray tube; and secondly a scanning system with a 5 cm wide beam with matched image receptor which scans across the breast as the tube rotates. In the latter case the rotation point was below the breast platform and image receptor at 104 cm from the focal spot. For the first system rotation angles up to ±30 degrees were considered which more than encompasses the angular range of several commercial systems in use or under development. For the second system the annular range was ±17 degrees in accordance with the design of the particular scanning system simulated, a prototype manufactured by Sectra AB (Sweden). Tthe calculations were made for breasts in the thickness range 2-11 cm, glandularities in the range 0.1-100% and for X-ray spectra from Mo/Mo, Mo/Rh, Rh/Rh, W/Rh, W/Ag and W/Al target filter combinations.
In the 2D protocol, the air kerma is measured with a dosimeter in contact with the breast compression paddle. In the 3D protocol the air kerma is measured with the paddle resting on the breast support platform and corrected back to the incident surface of the breast using the inverse square law. This provides a well defined measurement position, but may require a correction for backscatter, depending on the dosimeter used. The air kerma is measured without the breast present, but at the same tube loading as a rotational exposure with the breast present. The measurement may in principle be made with the X-ray tube in the straight through (zero degree) position) or with the tube rotating, and factors have been calculated for both situations.
139

For the first geometry measurements in the straight through position are preferred as the requirement of a uniform angular response for the dosimeter is then easier to meet. The results for this first geometry are presented both as a function of angle (so that MGD can be estimated for geometries with varying exposures at different angles) and integrated over a complete angular range with uniform weighting. The results show that the formalism proposed in (1) can be used with sufficient accuracy with a single factor for each tomographic projection angle or range of projection angles.
For the second geometry (5 cm wide scanning beam), the rotational measurement is preferred as the conversions factors using a zero degree normalisation are very sensitive to beam width.
Depending on the particular situation and geometry, the conversion factor T is in the range 0.85 to 1.0, so that the value of the MGD for breast tomosynthesis is quite similar to that for 2D projection mammography with the same tube loading
REFERENCES
[1] DANCE, D. R., Monte Carlo calculation of conversion factors for the estimation of mean glandular breast dose, Phys. Med. Biol. 35 (1990) 1211-1219.
[2] DANCE D. R„ SKINNER, C, L„ YOUNG, K. C„ BECKETT, J.R., KOTRE, C.J.,. Additional factors for the estimation of mean glandular breast dose using the UK mammography dosimetry protocol, Phys. Med. Biol. 45 (2000) 3225-3240.
[3] DANCE D. R., YOUNG, K. C„ VAN ENGEN, R.E., Further factors for the estimation of mean glandular dose using the United Kingdom, European and IAEA dosimetry protocols, Phys Med Biol _54 (2009)4361-72.
140

IDOS, Vienna, 9-12 November 2010 E2-CN-182, Paper No INV015
Assessment of trigger levels to prevent tissue reaction in interventional radiology procedures
A. Triannia, D. Gasparinib, R. Padovani3
1 Medical Physics Department, University Hospital, Udine, Italy
~ Radiology Department, University Hospital, Udine, Italy
Email address of main author: [email protected]>g.it
As stated by the European regulation 97/43/Euratom patient dose should be periodically evaluated to guarantee optimisati on and justification of the practice. Moreover the ICRP (International Commission on Radiological Protection) recommends to provide an adequate follow-up and eventual treatment of these injuries, for patients whose skin dose has been 3 Gy or greater [1],
Maximum skin dose (MSD) could be directly measured using film or thermoluminescent dosimeters (TLDs) [2,3,4,5], But, it is important to have a methodology to perform an "on-line" evaluation (e.g.: during the procedure) of patient's skin dose to indentify high skin procedures. For interventional radiology procedures kerma-air product (KAP) and cumulative air kerma (CK) at the interventional reference point (IRP) could be used for this purpose.
This work aims to investigate the correlation between these parameters and the maximum skin dose directly measured in a sample of procedure.
The dosimetric indicator that better correlate with the MSD could then be used to define trigger levels that indicate the overcoming of threshold for deterministic effects and necessity of medical follow-up for possible radiation injuries, respectively. In a sample of 61 interventional radiology procedures performed with two angiographic system equipped with a digital flat panel detector by four experienced radiologists, the MSD has been measured with radiochromic films (Gafchromic XR-typeR, IPS, USA) placed between patient and couch. Radiochromic films have been calibrated under an angiographic beam for comparison with an ionisation chamber (Radcal, Model 2026C 6cc ion chamber). Images of films, obtained with a reflective flatbed scanner (Epson 1680pro), were evaluated in terms of dose with a Matlab routine.
Cerebral angiography, aneurysm embolisation and chemoembolisation of liver cancer are procedure where high skin doses could be delivered (table 1).
TABLE 1. PEAK SKIN DOSE (PSD) (MEAN VALUES, SD AND RANGE) FOR A SAMPLE OF SELECTED INTERVENTIONAL PROCEDURES.
Procedure No PSD (mGy)
Range (mGy)
Cerebral Angiography 25 352.4+ 145.4 98.8 -r 561.9 Aneurysm Embolization 18 1072.5 ± 1085.2 332.2 ±4941.9 Liver chemo-embolization 38 1343.8 ±915.7 343.4 ±4135.5
141

The correlation between PSD and CK was investigated, chemo-embolisation are represented in figures 1 and 2.
Results for aneurysm embolisation and liver
CK(mGy)
CK(mGy)
FIG I. Correlation between CK and PSD for FIG 2. Correlation between CK and PSD for aneurysm embolisation chemoembolisation of the liver.
For Aneurysm embolisation the correlation CK and measured PSD allows to identify a CK trigger level of 5.2 Gy that indicate the possible overcoming of 3 Gy for PSD. For liver chemoembolisation the CK trigger level assessed if 2.5 Gy.
The study is proposing a methodology to assess trigger levels in interventional radiology. Trigger level is an useful instrument providing to the interventionalist the cumulative air kerma value corresponding to the possible overcoming of a selected threshold of peak skin dose, useful in high dose procedures to prevent tissue reactions.
REFERENCES
[1] ICRP (2000). Recommendations of the International Commission on Radiological Protection. Publication 85: Avoidance of radiation injuries from medical interventional procedures. Ann. ICRP. Oxford, UK: Pergamon Press
[2] KOENIG TR, WOLFF D, METTLER FA, WAGNER LK (2001). Skin injuries from fluoroscopically guided procedures: part I, characteristics of radiation injury. Am J Roentgenol 177:3-11.
[3] KOENIG TR, METTLER FA, WAGNER LK. (2001). Skin injuries from fluoroscopically guided procedures: part 2, review of 73 cases and recommendations for minimizing dose delivered to patient. Am J Roentgenol 177:13-20.
[4] VANO E, GONZALEZ L, TEN Jl, FERNANDEZ JM, GUIBELALDE E, MACAYA C, (2001). Skin dose and dose-area product values for interventional cardiology procedures. Br J Radiol. 74:48-55.
[5] A. TRIANNI, G. CHIZZOLA, H. TOH, E. QUAI, E. CRAGNOLIN1, G. BERNARD I, A. PROCLEMER, AND R. PADOVANI (2005). Patient skin dosimetry in haemodynamic and electrophysiology interventional cardiology. RadiatProt Dosimetry 117: 241 - 246.
142

IDOS, Vienna, 9-12 November 2010 E2-CN-182, Paper No INV015
Digital breast tomosynthesis: Comparison of two methods to calculate patient doses
L. Cockmartin, A. Jacobs, D. Dance, H. Bosnians
E-mail address of main author: [email protected]
Introduction Digital breast tomosynthesis (DBT) has been a promising new development in the field of breast imaging. This three-dimensional technique provides images with reduced structure noise from overlaying tissues. While clinical studies are ongoing to evaluate the clinical performance of DBT, the associated radiation dose should be determined. If it is aimed to use DBT in a screening program, it is important to survey the dose delivered to the patient.
Material and methods Data collection was performed on a Siemens MAMMOMAT Inspiration TOMO breast tomosynthesis system in our hospital. In total, data of 100 clinical cases were collected but only the data from CC views were used for the calculation of the mean glandular dose (MGD) within the patient's breast. MGD calculations were performed in two ways. The first method is described by D. Dance et al.1"3 and uses the following formula:
MGD = K *s *c*s*Y.tCO-where K is the air kerma, the g factor is the incident air kerma to mean glandular dose conversion factor for 50% glandularity breasts, the c factor allows a correction for different glandularities, the s-factor corrects for the use of different spectra and t(0) is the tomo-factor which is dependent on the projection angle. The dose was calculated once based on the age of the patient and a second time based on the glandularity of the breast. The information about breast glandularities was provided by the radiologists.
The second method is described by I. Sechopoulos et al." and a totally different formula is used for the dose calculations:
^MAX % = ZrR * DgN„ * £ RGD(ct)
c : = E j f m
where Dg is the total glandular dose, XCR is the exposure measured in a reference point on the breast support plate (in roentgen), DgNo is the normalized glandular dose for the zero degree projection and RGD(a) is the relative glandular dose coefficient which is calculated for every tomosynthesis projection angle (a). These RGD calculations are based on fitting coefficients, which are tabulated, the tomosynthesis angle measured at the detector surface and the compressed breast chest wall to nipple distance (CND).
The results of the two methods are also compared with the dose indicated on the system.
Results and discussion The doses calculated with the first method (based on the age of the patient) vary between 0.64mGy and 3.39mGy for a breast thickness from 33mm to 95mm. The dose distribution in function of breast
143

thickness is shown in figure 1. Acceptable and achievable dose levels for 2D mammography are also shown.
/
•
; * • *. * *» •* *• *
*
V * - V '
- ; « • •
•
• Calculated MGD
- — Acceptable level
— • Achievable level
30 40 50 60 70 B0 90 100 Breast thickness (mm)
FIG 1: Calculated MGD in function of breast thickness.
The doses from the two methods can be compared with the doses indicated on the x-ray system. The relative difference between the indicated and the calculated dose is shown for both methods in figure 2. When the formula from Dance et al. is used, there is a good agreement between the indicated and the calculated value. For the second method, the differences are larger and doses are underestimated compared with the system MGD. This difference is probably due to the use of a different breast model and a different way of measuring the exposure or tube output.
35.00%
J0.00% a ID ?5.00% E w 16.0096 E o
£5.0096 ra ($0.00%
5.00%
Dance (age): deviation from system MGD
• • • • Sechopoulos: deviation from
system MGD
• • _
•
• • • • • m •
•
• • " • • • A
• m • " •
H • • • • •
A A A
* 4 4 * a a a A a \
A A 1
A A ^
( l A 5 10 15 20 25 30 35 40 45 50
FIG 2: Relative difference between the dose indicated on the system and the dose calculated with the two methods.
144
Conclusion It is possible to calculate the 3D MGD in a similar way as for 2D mammography. The two methods are relatively easy and can be applicable on a larger dataset. However, when glandularity information is included, dose calculations will be more complex and input from radiologists will be necessary, since glandularity information is not available in the DICOM header of the images. There is a small but significant difference between the two methods which can be explained by differences in the simulated breast model and measurements of the tube output.
REFERENCES
[1] D. DANCE, Additional factors for the estimation of mean glandular breast dose using the UK mammography dosimetry protocol, Phys. Med. Biol. 45 (2000) 3225-3240.
[2] D. DANCE,. Further factors for the estimation of mean glandular dose using the United Kingdom, European and IAEA breast dosimetry protocols, Phys. Med. Biol. 54 (2009) 4361 -4372.
[3] D. DANCE, Monte Carlo calculations of Mean Glandular Dose in 2D mammography and breast tomosynthesis, BHPA Continual Education 2010.
[4] I. SECHOPOULOS, Computation of the glandular radiation dose in digital tomosynthesis of the breast, Med. Phys. 34 (1), January 2007.
[5] I. SECHOPOULOS, Glandular radiation dose in tomosynthesis of the breast using tungsten targets, Journal of Applied Clinical Medical Physics, Volume 9, Number 4, Fall 2008.
145

IDOS, Vienna, 9-12 November 2010 E2-CN-182, Paper No INV015
Compliance of full field digital mammography systems with the European Protocol for image quality and dose
P J Barnes, D H Temperton
RRPPS, University Hospitals Birmingham NHS Foundation Trust, Birmingham, UK
E-mail address of main author: [email protected]
Introduction
The European Protocol1 recommends a method and standards to assess image quality and dose for full field digital mammography systems. The performance of six integrated digital systems and three computed radiography (CR) systems were compared against this protocol.
Method
Equivalent breasts thicknesses were simulated with a range of polymethyl methacrylate (PMMA) slabs and suitable spacers placed on the patient platform. Exposures were made under automatic exposure control (AEC) allowing the kV, target and filter combination to alter accordingly. Mean glandular dose (MGD) and contrast-to-noise ratio (CNR) was determined for the simulated breasts as described in the protocol.
Contrast detail measurements were taken from 16 images using the CDCOM (version 1.5.2) (available at http://www.euref.org)'and automated determination of threshold contrast software (version 2.4)'. Image analysis was performed on the pre-processed images. For each equivalent breast thickness, the measured CNR was assessed relative to the CNRlimitingvalue as defined the protocol.
The older GE Senographe DS (software version ADS 43.10.1) did not initially meet the image quality standards on the low and standard dose mode. These systems required detector calibrations to increase the dose so that the image quality complied.
Similarly the CNR measured for all CR systems initially fell below the limiting value. Adjustments to the AEC were required to ensure that the CNR m e a s u r e d was greater than the CNR l i m i t i n g v a l u e whilst ensuring that the MGD was below the acceptable limiting value given in the protocol.
Results (shown overpage)
Fig. 1 shows the ratio of the measured CNR divided by the CNR ii,n,>me Vaiue for different equivalent breast thicknesses for all the mammography systems. Fig. 2 shows the MGD used to achieve the CNR in Fig. 1.
Conclusion
Most integrated digital systems required no adjustment to comply with the dose and image quality standard in the European protocol but older models of the GE Senographe DS needed several detector calibrations to comply. All three CR systems required adjustments to the AEC in order to meet the standards. Most integrated digital systems performed better in terms of image quality and all delivered significantly lower MGD. For the 53mm equivalent breast thicknes, the largest MGD for a CR system was 2.0 times the lowest dose for an integrated digital system.
147

3.0 n
20 30 40 50 60 70 80 90
Equivalent breast thickness (mm)
FIG. I. CNR Measured/ CNR Limiting Values far different equivalent breast thicknesses
7.0 n i *— Hologic » Siemens • Essential
DS new K - DS old
Sectra e— Fuji
Kodak M3 •— Konica
—•— Hologic • Siemens
-*— Essential DS new
- x - DS old -*— Sectra —o— Fuji - 3 - Kodak M3 —»— Konica
0.0 -I 1 1 1 1 1 1 1
20 30 40 50 60 70 80 90
Equivalent breast thickness (mm)
FIG.2. Mean glandular dose to achieve the CNR results given in Fig. I.
REFERENCES
[1 ] VAN ENGEN R, YOUNG K C, BOSMANS H & THIJSSEN M: The European protocol for the quality control of the physical and technical aspects of mammography screening, Part B: Digital mammography. In: European Guidelines for Breast Cancer Screening, 4th Edition. Luxembourg: European Commission, 2006.
[2] YOUNG KC & DENNE J, Automated determination of threshold contrast: Software and instruction manual v2.6.(National Coordinating Centre for the Physics of Mammography, Guilford, UK)
148

IDOS, Vienna, 9-12 November 2010 E2-CN-182, Paper No INV015
On the influence of the patient's posture on organ and tissue absorbed doses caused by radiodiagnostic examinations
R. Kramer , V. F. Cassola
Department of Nuclear Energy, Federal University of Pernambuco, Recife, Brazil
E-mail address of main author: [email protected]
Standing and supine (=lying on one's back) postures are most frequently used positions for patients submitted to examinations in radiodiagnosis. When it comes to the assessment of organ and tissue absorbed doses, human phantoms connected to Monte Carlo (MC) codes are applied which usually represent individuals either in standing or in supine posture, i.e. that depending on the protocol of the examination to be simulated, some of the MC calculations are made using a phantom with the false posture. To find out if the posture has a significant impact on organ and tissue absorbed doses, one has to model phantoms to represent humans in different postures and to use them under exactly the same exposure conditions. FASH2_sta, MASH2_sta and FASH2_sup, MASH2_sup are pairs of female and male adult phantoms in standing and supine posture, respectively [1], The phantoms will be used for the simulation of X-ray examinations of the thorax and the abdomen and resulting organ and tissue absorbed doses will be compared for the two postures. This synopsis will show results for a thorax radiograph of the FASH2_sta and the FASH2_sup phantoms.
1 - Esophagus 2 - Kidneys 3 - Liver
ft-7 - Spleen S - Stomueh 0 - T h v r u i i l
FIG. 1. Thorax AP exposure scenario for the FASH2_sta phantom. FW = field width, FH = field height. Field size at image receptor in blue, at entrance in black.
1 - Lsuphugu* 2 - Kidneys J - L iver
- Lunj>s Z 5 - Fiincrcns
(t - Salivary Cihinds 7 - Spleen 8 - Stomach 9 -Thyroid
FIG. 2. Thorax AP exposure scenario for the FASH2_sup phantom. FW = field width, FH = field height. Field size at image receptor in blue, at entrance in black.
149

Up to 50% of all examinations of the thorax are being made with lying patients in intensive care or simply because hospitalized patients cannot stand up and/or turn around. The tube voltage is 90 kV, the filtration 2.5 mm Al, the FDD = 105 cm and the field size in the image receptor plane 35 cm x 40 cm. Normally, the patient is in supine posture and the projection is AP (ventro-dorsal). The field is centred on the middle of the sternum. Fig. 1 and 2 show the exposure scenarios for the FASH2_sta and FASH2_sup phantoms and Tab. 1 present the results as conversion coefficients between organ or tissue absorbed dose D and incident air kerma 1NAK. The last column shows organ dose differences between standing and supine posture of 67%, 54% and 46% for the pancreas, kidneys and stomach wall, respectively, which can occur if the radiograph is simulated with a phantom in false posture.
TABLE. L CONVERSION COEFFICIENTS BETWEEN SELECTED ORGAN AND TISSUE ABSORBED DOSES D AND INCIDENT AIR KERMA INAK FOR THORARCIC RADIOGRAPHS AP SIMULATED WITH THE FASH2 STA AND THE FASH 2 S IP PHANTOMS.
FASH2 Thorax AP, 35cm x 40cm 90 kV, 2.5mm Al. FDD = 105 cm Ogan/Tissue
Standing D/INAK Gy/Gy
Standing Error
%
Supine D/INAK Gy/Gy
Supine Error
%
Sup/Sta Field
35x40 BREASTS, glandular 0.847 0.3 0.871 0.3 1.028 KIDNEYS 0.063 1.1 0.097 0.9 1.540 LIVER 0.312 0.2 0.375 0.2 1.202 LUNGS 0.417 0.2 0.448 0.2 1.074 OESOPHAGUS 0.347 1.2 0.359 1.2 1.035 PANCREAS 0.049 1.8 0.082 1.4 1.673 SPLEEN 0.305 0.7 0.304 1.1 0.997 STOMACH WALL 0.192 0.8 0.281 0.7 1.464 THYMUS 0.664 1.1 0.677 1.1 1.020 THYROID 1.015 1.0 1.009 1.0 0.994 RED BONE MARROW 0.775 1.0 0.762 1.0 0.983 BONE SURFACE CELLS 1.037 1.6 1.075 1.6 1.037
REFERENCE
[1] CASSOLA V F, KRAMER R, BRAYNER C AND KHOURY H J Poster-specific phantoms representing female and male adults in Monte Carlo-based simulations for radiological protection Phvs Med Biol (2010) (submitted)
150

Parallel Session 8a
Reference Dosimetry and Comparisons in Brachytherapy


IDOS, Vienna, 9-12 November 2010 E2-CN-182, Paper No INV015
New brachytherapy standards paradigm shift M. P. Toni
Istituto Nazionale di Metrologia delle Radiazioni Ionizzanti, ENEA, CR Casaccia, Via Anguillarese 301, 00123 Roma, Italia
E-mail address of main author: [email protected]
The absorbed dose rate to water at short distances (1 cm typically) in water, is the quantity of interest for dosimetry in radiotherapy treatments. Moreover, the dose imparted to cancer patients must be known within a narrow band of uncertainty to avoid either damage to the healthy tissue resulting from exceeding international accepted tolerance levels or lack of tumor control due to a low dose delivered to the target volume. The goal for the uncertainty of the dose delivered to the target volume would be around 5% (at the level of one standard deviation), to assure the effectiveness of the radiotherapy treatment [1], This figure also takes into account the uncertainties in dose calculation algorithms.
In current brachytherapy (BT) treatments, the procedures to determine the absorbed dose imparted to the patient are not based on absorbed dose standards, but are based on measurements traceable to air kerma standards. In fact, the recommended quantity for the calibration of BT gamma ray sources is the reference air kerma rate, ^H, defined as the kerma rate to air, in air, at the reference distance of 1 m from the radioactive source, corrected for air attenuation and scattering [2]. The absorbed dose around a BT source is currently calculated by applying the formalism of the international AAPM Task Group 43 protocol [3] and its update [4]. This protocol is based on the air kerma strength, SK, a quantity that is numerically equivalent to R, at a distance of 1 m from the source. Based on [3, 4], the dose rate constant A converts the air-kerma strength -'ft" to the absorbed dose rate to water, ^(^n- in water at the reference position:
D(r o,00) = SK- A ( 1 )
Recently, a lower limit of 2,50 % was obtained [5] for the estimated overall uncertainty (at the level of one standard deviation) on measurements of D(rD,80) due to a HDR 192I BT source based on equation (1). However, in most cases the determination of 5K is typically affected by an uncertainty within 0,8 % (at the level of one standard deviations) [6, 7, 8]. Moreover, the determination of A relies on Monte Carlo simulations or relative measurements performed with passive dosimeters and therefore it is typically affected by an uncertainty greater than 5% (at the level of one standard deviation) [7]. Taking into account the uncertainties in algorithms for treatment planning dose, the procedures to determine the absorbed dose imparted to the patient in BT treatments, are currently affected by an uncertainty higher than the limit recommended of 5% (at the level of one standard deviation) [1]. A significant part of this uncertainty is due to a lack of metrology: no absorbed dose primary standards are currently used to calibrate BT sources [9] and the conversion procedure needed for BT dosimetry is a source of additional uncertainty on the final value of the absorbed dose imparted to the patient.
153

Many national medical associations and scientific international organizations- like ESTRO (European Society for Therapeutic Radiology and Oncology), IAEA (International Atomic Energy Agency), ICRU (International Commission on Radiation Units and Measurement) and BIPM (Bureau International des Poids et Mesures)- started research programs in the field of BT and encouraged the metrological community to develop direct absorbed dose standards for BT. The initiatives launched in recent years in response to this request are now well advanced.
A standard for direct measurements of absorbed dose to water in HDR 1,21 BT based on 4 °C- stagnant calorimetry) is described in [10]. The estimated overall uncertainty on this standard amounts to 1,90 % (at the level of one standard deviation).
In July 2008, a BT joint research project started within the European Association of National Metrology Institutes (EURAMET e.V.) aiming to develop seven standards for more direct measurements of absorbed dose to water -at clinically relevant distances [11]. The standards developed for measurement with high dose rate (HDR) BT sources (as 192Ir) are based on graphite and water calorimeters. The standards for measurement with low dose rate (LDR) BT sources (as 125I) are based on Ionometric measurements of kerma in water equivalent or graphite phantoms. A preliminary comparison among these standards is planned later this year. By these new absorbed dose standards a reference value of the absorbed dose to water at the reference distance of 1 cm from the source should be determined with a target value for the uncertainty within 2% (at the level of one standard deviations) and with a reduced uncertainty in the dose delivered to the patient in BT treatments. The project is supported by the European Commission in the Seventh Framework Programme.
In autumn 2011 a dosimetry workshop -addressed to the national and international medical physicists' associations- will be held to present the new standards and to promote an extension of the international protocol for dosimetry in BT based on absorbed dose standards. The developments of HDR and LDR absorbed dose standards and their validation represent a concrete progress towards a shift for a more direct and accurate traceability chain of BT sources according to the demand for low uncertainty to minimize the final uncertainty in patient dose delivery.
154
REFERENCES [1 ] INTERNATIONAL ATOMIC ENERGY AGENCY, Absorbed Dose Determination in External
Beam Radiotherapy: An International Code of Practice for Dosimetry based on Standards of Absorbed Dose to Water, Technical Reports Series No. 398, Vienna (2000)
[2] THE INTERNATIONAL COMMISSION ON RADIATION UNITS AND MEASUREMENTS, Dose and volume specification for reporting interstitial therapy, ICRU Report No 38 (1997)
[3] NATH, R. et al., Dosimetry of interstitial brachytherapy sources: Recommendations of the AAPM Radiation therapy Committee Task Group No.43. American association of Physicists in Medicine. Med. Phys. 22 (1995) 209-234
[4] RIVARD, M. J. et al., Update of AAPM Task Group No.43 Report: A revised AAPM protocol for brachytherapy dose calculations, Med. Phys. 31 (2004) 633-674
[5] SARFEHNIA A, et al., Direct measurement of absorbed dose to water in HDR 192Ir brachytherapy: water calorimetry, ionization chamber, Gafchromic film, and TG-43, Med. Phys. 37(2010) 1924-1932
[6] BIDMEAD, A. M., et al., The IPEM code of practice for determination of the reference air kerma rate for HDR 1 Tr brachytherapy sources based on the NPL air kerma standard.
[7] SOARES, C. G. et al., Primary standards and dosimetry protocols for brachytherapy sources, Metrologia 46 (2009) S80-S98
[8] SARFEHNIA A, et al., Direct measurement of absorbed dose to water in HDR 192Ir brachytherapy: water calorimetry, ionization chamber, gafchromic film, and TG-43, Med. Phys. 37(2010) 1924-1932
[9] IAEA TECDOC 1274, Calibration of photons and beta rays sources used in brachytherapy [10] SARFEHNIA A, SEUNTJENS, I , Developments of a water calorimetry-based standard for
absorbed dose to water in HDR 192Ir brachytherapy, Med. Phys. 37 (2010) 1914-1923 [11] TONI, M.P., et al., A Joint Research Project to improve the accuracy in dosimetry of
brachytherapy treatments, in the framework of the European Metrology Research Programme. 11th World Congress on Medical Physics and Biomedical Engineering, September 7-12, 2009 in Munich, Germany
155


IDOS, Vienna, 9-12 November 2010 E2-CN-182, Paper No INV015
From reference air-kerma-rate to nominal absorbed dose-rate to water Paradigm shift in photon brachytherapy: ISO new work item proposal
U. Quasta, T. W. Kaulich", A. Ahnesj oc, J. T. Alvarez-Romero1, D. Donnarieixe, F. Hensleyf, L. Maigneg, D. C. Medich11, F. Mourtada', A. S. Pradhanj, C. Soares\ G, A. Zakaria1
a Ex- Essen University Hospital, Essen, Germany 1 Dept. of Radiation One., Medical Physics, Tubingen University Hospital, Germany
cNucletron Scandinavia AB, Uppsala, Sweden dININ, SSDL Ionizing Radiation Metrology Department, Mexico City, Mexico e Centre Jean Perrin, Unite de Physique Medicale, Clermont-Ferrant, France fDept. Radiation One., Radiation Physics, University Hospital, Heidelberg, Germany gLaboratoir de Physique Corpusculaire, Clermont Universite, Clermont-Ferrant, France h Radiation Laboratory, University of Massachusetts Lowell, Lowell, MA, USA 1 Depts. of Radiation Physics, M. D. Anderson Cancer Center, Houston, TX, USA J Ex- Health and Safety Group, Bhabha Atomic Research Centre, Mumbai, India k National Institute of Standards and Technology, NIST, Gaithersburg, MD, USA 1 Med. Rad. Physics, Kreiskrankenhaus/Univ. of Cologne, Gummersbach, Germany
E-mail address of main author: Ulrich Quast, Obere Rauhe Egge 46, D 58456 Witten, Germany e-mail: Ulrich. Ouast'a uni essen. de
Over decades, photon radiation brachytherapy (BT) has proven worldwide as an essential modality of high precision radiation oncology for certain primary tumor sites. The dosimetric uncertainty of photon brachytherapy, however, is currently much larger than in external beam radiotherapy due to several factors including: calibration to the reference air-kerma-rate KR KR (or air-kerma strength), dose calculation model, dosimetric functions and dose measurement complexity, besides the geome-trical dose uncertainties in high dose-gradient BT-fields. In addition, many photon sources are applied with quite different dosimetric properties requiring much skill from the medical physicist [1], This work proposes increased accuracy of brachytherapy through improvents in source calibration and clinical dosimetry methodology. Currently, BT-photon sources are calibrated free in air, at 100 cm distance, and in terms of KR. By calibrating BT-photon sources directly to the TG-43U1 reference point at 1 cm in water [1], to be named the nominal absorbed dose-rate to water [2], Dw1, the number of calibration steps in the traceability chain is reduced from 6 to 4, thus reducing the expanded uncertainty in dose delivery for patient treatment [3]. With a target combined uncertainty of ucue<2%, the EURAMET project T2.J06 [3] is developing Dw1 primary standards, which will soon become available for high energy and low energy, high and low dose-rate BT-photon sources.
This is a paradigm shift that requires: international consensus, metrologic work and guidance. Thus, there is a need for an ISO standard [2] based on and extending the AAPM TG-43U1 formalism [1]. Taking into account the results and conclusions of the AAPM 2010 discussions, a draft for an ISO new work item proposal on Clinical dosimetry - Photon radiation sources for brachytherapy will be
) Dedicated to Prof. Dr.rer.nat. Jiirgen Bohm, ex-PTB. Braunschweig. Germany
157

presented. This standardization project could be launched within ISO TC 85/SC 2/WG 22, in continuation of ISO 21439 (2009) for beta radiation sources [4,5]. Clear terms and definitions are basic requirements for this standard.
It is proposed [2] that BT-photon radiation qualities need to be reclassified as: high-energy >100 keV, medium energy 40 keV to 100 keV, and low energy photons <40 keV (instead of 50 keV as border between two quality groups: high and low energy photons as defined by the AAPM TG-43). Also, Monte Carlo-calculated primary and scatter dose separation [6] is ideal to characterize radionuclide BT-sources [7], electronic X-ray BT-sources, BT-detectors and BT-phantoms. Calculated and measured consensus reference data-sets and calibration data are also required for all BT-sources, BT-detectors and BT-phantoms, through which the end-user medical-physicist could evaluate the data supplied by the manufacturer by using established methods, prior to clinical application. For experimental verification, plastic scintillators [8] appear to be a choice of detector as a future high precision transfer-standard (besides well established, but Dw.j -recalibrated special transfer standards
like well-type ionization-chambers) and as fast, direct reading dosemeter with high spatial and temporal resolution as required for detailed acceptance tests of BT-sources, -software, -planning, and -verification [2,3]. This ISO-standard will provide guidance for clinical BT-dosimetry in terms of absorbed dose to water and for estimating the uncertainty of this new quantity. Most standardized procedures can be given by referring to AAPM-reports and ESTRO-documents. General quality assu-rance issues, radiation protection and safety issues are outside the scope. Recommendations will be prepared to replace the KR A'^-by Dw 1 as basic dosimetric quantity, to become consistant with external beam radiotherapy and to reduce the dosimetric uncertainty in brachytherapy.
REFERENCES
[1] RIVARD, M. J., COURSEY B. M. et al., Update of AAPM Task Group No. 43 Report: A revised AAPM protocol for brachytherapy dose calculations, Med. Phys. 31 (2004) 633-674
[2] QUAST, U., KAULICH, T. W., et al., Clinical dosimetry of photon sources used in brachy-therapy: Need for international standardization, based on and extending the AAPM TG-43U1 formalism by calibration in terms of the nominal absorbed dose to water, to be discussed at the AAPM 2010 Philadelphia meeting; to be published as vision 20/20 article, Med. Phys. 37 (2010)
[3] BOVI, M., TONI, M. P., et al., Traceability to absorbed-dose-to-water primary standards in dosimetry of brachytherapy sources used for radiotherapy, Proceedings XIXth IMEKO World Congress, Lisbon, PT (2009) 1674-1679 and: http://brachytherapy.casaccia.enea.it
[4] QUAST, U., BO MM, J., KAULICH, T. W., The need for international standardization in clinical beta dosimetry for brachytherapy, LAEA-CN-96-73, IAEA, Vienna, AT (2003)
[5] SOARES, C. (convener), ISO 21439, Clinical dosimetry - Beta radiation sources for brachy-therapy, ISO, Geneva, CH (2009)
[6] RUSSEL, K. R., AHNESJO, A., Dose calculation in brachytherapy for a 1 Tr source using a primary and scatter dose separation technique, Phys. Med. Biol. 41 (1996) 1007-1024
[7] TAYLOR, R. E. P., ROGERS, D. W. 0., An EGSnrc Monte Carlo-calculated database of TG-43 parameters, Med. Phys. 35 (2008) 4228-4241, and: The CLRP TG-43 parameter database; at http://www.physics.carleton.ca/clrp/seed database/ (2008)
[8] FLUHS, D., HEINTZ, M., et al., Direct reading measurement of absorbed dose with plastic scintillators - The general concept and applications to ophthalmic plaque dosimetry, Med. Phys. 23 (1996) 427-434
158

IDOS, Vienna, 9-12 November 2010 E2-CN-182, Paper No INV015
Calibrations of high dose rate and low dose rate brachytherapy sources
H.J. Selbach, M. Meier
E-mail address of main author :[email protected]
Following the recommendations of the Task Group 43 of the American Association of Physics in Medicine (AAPM), the reference air-kerma rate (or the so-called air-kerma strength) of brachytherapy photon sources has to be determined as the basic quantity used in treatment planning systems, until primary standards for absorbed dose to water are available for the calibration of these sources. The German National Metrology Institute (PTB) has offered the calibration of high-dose rate (HDR) sources like 192Ir or Co sources in terms of the reference air kerma rate for about two decades.
Since 125I and 1 ' Pd seed implantation has become an increasingly popular treatment of localized prostate cancer in the last decade, PTB has developed a new primary standard for these low-dose rate (LDR) sources, and offers the calibration of LDR sources in terms of the reference air kerma rate.
Although HDR and LDR sources are characterized by the same quantity reference air kerma rate, the methods of realizing this quantity are quite different.
ForHDR192Ir and 60Co sources a secondary standard (a 1-liter ionization chamber) is used, which is calibrated traceably to the common primary air-kerma standards of PTB in two ways: A) By direct calibration against a "Bragg Gray" chamber, a graphite-walled pancake chamber of about 6 cm2
volume, and B) via the primary free air chambers for the X-radiation and additional measurements in the 137Cs and 'JCo reference fields using a special interpolation method.
For LDR sources, a large air-filled parallel-plate extrapolation chamber (GROVEX) with thin graphite front and back electrodes was developed at PTB as a primary standard for the determination of the reference air-kerma rate. The chamber is suitable for photon energies up to 40 keV. The underlying principle is that the air-kerma rate at the point of measurement is proportional to the increment of ionization per increment of chamber volume at chamber depths greater than the range of the most energetic secondary electrons originating in the entrance electrode.
Both methods of the realization of the reference air-kerma rate will be described, and in the case of LDR source calibrations, intercomparisons between the GROVEX and the Wide Angle Free Air Chamber (WAFAC) of the National Institute of Standards and Technology (NIST) and the Variable Angle Free Air Chamber (VAFAC) of the University of Wisconsin will be presented and discussed. A complete uncertainty budget for calibrations of LDR and HDR sources is given.
As the reference air kerma rate is defined in a point at a distance of 1 m from the source perpendicular to the source central axis, the anisotropy of the dose rate distribution is also of special interest. For this reason, the calibration procedure is extended by additional measurements of the azimuthal and polar anisotropy of the source distribution. Examples of some 2-dimensional air-kerma rate distributions are given.
Finally a short overview on the actual activities in the framework of a European research project with the task of establishing absorbed dose to water based primary standards for both HDR and LDR brachytherapy sources will be given.
159


IDOS, Vienna, 9-12 November 2010 E2-CN-182, Paper No INV015
On the quality control of low energy photon brachytherapy sources: Current practice in Belgium and the Netherlands
A. Aalbers3, M. de Brabandere", C. Koedooder0, M. Moerland1d, B.Thissene, A. van 't Rietf, A. Rijndersg, B. Schaeken11, S. Vvnckier
aVan Swinden Laboratorium, Delft, The Netherlands b Katholieke Universiteit Leuven (KUL), Leuven, Belgium c Academisch Medisch Centrum (AMC), Amsterdam, The Netherlands dUniversitair Medisch Centrum Utrecht (UMCU), Utrecht, The Netherlands e Centre hospitalier universitaire, Liege, Belgium f
Deventer Ziekenhuis, Deventer, The Netherlands gEuropa Ziekenhuizen, Brussels, Belgium
XuTeC, XIOS Hogeschool Limburg, Diepenbeek, Belgium 1 Cliniques universitaire St.Luc, Brussels, Belgium
E-mail address of main author: [email protected]
The number of patients presenting with and treated for prostate cancer has increased strongly in the last decades. To a large extent the increase is due to the introduction of the prostate specific antigen (PSA) screening blood test, enabling the detection of prostate cancer in an early stage. Among external beam therapy, surgery and other treatment modalities, Permanent Implant Prostate Brachytherapy (PPBT) is nowadays a commonly accepted treatment option, especially for early stage disease. As a result of these developments Low-Energy Photon (LEP) 125I sources are widely applied for PPBT in Belgium and The Netherlands.
An NCS (Nederlandse Commissie voor Stralingsdosimetrie) sub-committee, consisting of Belgian and Dutch medical physicists is studying the Quality Assurance (QA) aspects of LEP sources in brachytherapy applications and is presently drafting a report with guidelines and recommendations on Quality Control (QC) regarding dose calculation and source calibration. Based on the results of a questionnaire related to currently used brachytherapy QA procedures in Belgium and The Netherlands, a specific user test procedure for treatment planning systems (TPS) was developed. Furthermore an on-site audit programme was set up to measure the source strength of 12 I seeds in all participating hospitals.
From the questionnaire, the results of TPS tests and on-site visits it was found that there is a large variety of QC equipment and methods in use to verify the source strength of seeds. From the 34 radiotherapy centres responding to the questionnaire 10 had no measurement equipment available for verification purposes, 5 other institutes did not perform clinical source strength measurements on a routine basis. Four different TPS systems were in use in Belgian and Dutch radiotherapy centres. In all four systems the AAPM TG43 [1, 2] dose formalism and related physical data were implemented. However, the formalism was applied differently by various users. The TPS tests revealed variations in dose calculation results, due to incorrect application of expressions for the anisotropy model and to the use of invalid source data.
161

Source strength measurements in terms of air kerma were conducted on-site by visiting teams. Two commercially available measurement systems were used for the measurements by the NCS teams. The systems consisted of a PTW SourceCheck TM34051 device with a PTW Unidos T1001 electrometer and Standard Imaging IVB1000 well-type chamber connected to a PTW Unidos E electrometer. The equipment was calibrated at the Van Swinden Laboratory (Delft, The Netherlands) with NIST traceable 125I sources. For all source types used in Belgium and The Netherlands at the time of the on-site audit campaign, calibration coefficients were available directly traceable to the NIST WAFAC standard [3]. The results of the source strength measurements were compared with data stated by the supplier of the sources and if available with in-house measurements performed by the local medical physicist.
As an example, Figure 1A and IB show results of air-kerma measurements performed on-site by the NCS team. The histograms present the ratio of the value of the source strength stated by the manufacturer/supplier over the air kerma value measured by the NCS team. The histograms are given for Oncura Oncoseed 6711 sources measured with the Standard Imaging IVB1000 (Fig.lA) and the PTW SourceCheck (Fig. IB) equipment respectively.
FIG. la FIG. lb
i> e .2 10 co >
s 05 o X! o
® XI E
w c 0 <3 1 a 10 O
<u ,Q E IS
0.92 0.94 0.9 1.00 1.02 1.04 1.06
Ratio Manufacturer/ Si IVB1000 Oncura Oncoseed 6711
0.92 0.94 0.96 0,98 1.00 1.02 1.04 1.06
Ratio Manufacturer/ PTW Source Check Oncura Oncoseed 6711
In this paper we will present the results of the questionnaire, the TPS checks and the source strength measurements performed during the on-site visits as well as the QA recommendations presented in the NCS report.
REFERENCES [1] R. NATH, L.L. ANDERSON, G. LUXTON, K.A. WEAVER, J.F. WILLIAMSON AND A.S.
MEIGOONI.Dosimetry of interstitial brachytherapy sources: Recommendations of the AAPM Radiation Therapy Committee Task Group No. 43, Med. Phys. 22, (1995) 209-234
[2] M.J. RIVARD, B.M. COURSEY, L.A. DEWERD, W.F. HANSON, M.S. HUQ, G.S. IBBOTT, M.S. MITCH, R. NATH AND J.F. WILLIAMSON. Update of AAPM Task Group No. 43 report: A revised AAPM protocol for brachytherapy dose calculations, Med. Phys. 31,(2004) 633-674.
[3] S. M. SELTZER, P.J. LAMPERTI, R. LOEVINGER, M.G. MITCH, J.T. WEAVER AND B.M. COURSEY, New national air-kerma-strength standards for 1251 and 102Pd brachytherapy seeds, J. Res. Natl. Inst. Stand. Technol. 108(5), (2003) 337-357.
162
IDOS, Vienna, 9-12 November 2010 E2-CN-182, Paper No INV015
Cuban laboratory proficiency test for calibration of well-type chambers using two types of HDR 92Ir sources
G. Walwyn Salas a, M. Bambynek \ S.Gutierrez Loresa, H.J.Selbach b, J.Morales c
aCentro de Proteccion e Higiene de las Radiaciones, Havana, Cuba
cInstituto Nacional de Oncologia y Radiobiologia, Havana, Cuba
E-mail address of main author: [email protected]
The proficiency test by inter-laboratory comparisons is the commonly accepted procedure both for validation of the testing methods and assuring the quality of the calibration undertaken by the competence laboratories. The Secondary Standard Dosimetry Laboratory (SSDL) of Cuba is located at the Centro de Proteccion e Higiene de las Radiaciones (CPHR). The SSDL has recently implemented the calibration methodology of well-type chambers using the High Dose Rate 192Ir sources under activities of the technical co-operation project with the International Atomic Energy Agency. The reference standard of CPHR is traceable to the primary standard of the German National Metrology Institute (Physikalisch-Technische Bundesanstalt - PTB). The method used by the secondary laboratory follows the Technical Document 1274 [1], On this method the source available is measured in a well-type chamber calibrated against the primary standard. Because there is no HDR afterloader at the SSDL, the calibration of the client source can be done only in the hospital set-up. The user's chamber is calibrated by means of a calibrated source. This method has the advantage that the measurement set-up is simplified but problems can arise from the use of different source designs during calibration of the secondary standard at the primary laboratory and calibration of the user's chambers at the hospital set-up. The variation of the calibration coefficient of the PTW 33004 chamber due to the use of different sources and adapters has already been measured experimentally [2], The larger differences can be found near 4%. All those facts reinforced the idea to conduct a proficiency test to demonstrate that the calibration procedure used by SSDL can be applied in practice and will not lead to the incorrect calibration coefficient within the stated uncertainty.
The comparison was conducted during the years 2008-2009. The HDR 1000 plus and Nucleotron 077092 well-type chambers were used as transfer instruments. The source used for CPHR at the hospital was MICRO SELECTRON V2, which is different from the design of the GAMMAMED HDR 12i type source used at the primary laboratory. Both laboratories had previously agreed to evaluate the significance of the observed deviations by means of the number En recommended by ISO/IEC 43-1 [3]. The number En considers that the results are satisfactory when En< 1 and unsatisfactory when En> 1. This number En combines the influence of the difference between the values of the calibration coefficient Nk reported by laboratories and its uncertainties. This number is calculated as follows:
bPhysikalisch-Technische Bundesanstalt, Braunschweig, Germany
N, K,CPHR -N, K,PTB E (1) n
163

where:
N K , P T B = calibration coefficientreported by PTB
NK f j>||K = calibration coefficientreported by CPHR
uK pTii = combined standard uncertainty reported by PTB at 95% of confidence level.
u K < P i i R = combined standard uncertainty reported by CPHR at 95% of confidence level.
The results were satisfactory as number En remains below 1 (see table 1). Those results of testing confirm that the method implemented has led to comparable results and the calibration procedure is ready for dissemination of the quantity to the users. The results of this report apply only to GAMMAMED HDR 12i and MICROSELECTRON V2 192Ir sources. It seems to have an extended application for other types of sources if the same adapter is used with the chamber. The differences of the calibration coefficients determined by both laboratories are less than 1 % in the range of 0.7 to 36 mGy/h. In this sense, it can be concluded that the acceptable performance was achieved by the Cuban laboratory and it met the suitable requirements for dosimetry in Brachytherapy.
TABLE 1. RESULTS OF PROFICIENCY TEST FOR AIR KERMA RATE CALIBRATION COEFFICIENTS OBTAINED AT CPHR AND PTB USING THE HDR 192IR SOURCE. Calibration Radiation Calibrated Calibration coefficients Air kerma rate (mGy/h) En
quantity quality chamber obtained [Gy/Ah] x 10s
PTB CPHR PTB CPHR Reference Ir-192 HDR 1000 Plus 4.67 4.65 1.75 31.44 0.16 Air Kerma s/n A973052
Rate Ir-192 Nucleotron s/n 077092
8.99 9.07 0.7 35.85 0.33
REFERENCES
[1] INTERNATIONAL ATOMIC ENERGY AGENCY-TECDQC-1274. Calibration of photon and beta ray sources used in brachytherapy. Guidelines on standardized procedures at Secondary Standards Dosimetry Laboratories (SSDLs) and hospitals. IAEA, March 2002
[2] Priifungsschein Nr.0900512. PTW-Freiburg, 2009 [3] ISO/IEC 43-1. Proficiency testing by interlaboratory comparisons. Part-1, Development and
operation of proficiency testing schemes. Switzerland, 1997.
164
Parallel Session 8b
Clinical Dosimetry in X ray Imaging III


IDOS, Vienna, 9-12 November 2010 E2-CN-182, Paper No INV015
Calibration of kerma-area product meters with a patient dose calibrator
P Toroi, A Kosunen
Radiation and Nuclear Safety Authority
E-mail address of main author: [email protected]
Kerma-area product (KAP) meters are used for monitoring patient exposure during x-ray imaging. These field meters are used attached to clinical x-ray system and their calibration should be performed in the same position [1], Internationally uncertainty < 7% (confidence level 95%) is recommended for KAP measurements [1, 2]. The use of a proper calibration method is important to achieve appropriate measurement accuracy and comparable results. IAEA introduces three options for calibrations of field KAP meters [2]:
(1) calibration of the field KAP meter in laboratory (2) field calibration with a air kerma meter as a reference meter (3) field calibration with a KAP meter as a reference meter
In this study the use of novel large patient dose calibrator (PDC) meter as a reference KAP meter is studied. Comparison to the other calibration methods and to use of a conventional type of KAP meter as a reference instrument is made. The use of reference KAP meter was introduced by Toroi et al. as a tandem calibration method [3]. The main drawback to the method is the uncertainty produced by pronounced energy dependence of the response of conventional type of KAP meters [4]. PDC meter type has studied to have lower energy dependence and decreased uncertainty in tandem method is expected when using this type of KAP meter as a reference instrument [5].
Calibrations of reference meters are made at the secondary standard laboratory of STUK with IEC standard radiation qualities [6]. They are recommended and widely used for calibrations of dosimeters in x-ray imaging [1, 2]. As these radiation qualities do not cover the whole range of clinically used radiation qualities, interpolations, and in some cases also extrapolations, of calibration coefficient is needed [7], In this study the effect of interpolation from standard to clinical radiation qualities on measurement uncertainty is under specific interest. The calibration of PDC meter in SSDL laboratory is also performed with different field sizes and positions. Uniformity of the response is studied and the effects on field calibrations and uncertainties are valuated.
Calibrated reference meters are used for calibrations of field KAP meters in clinical x-ray equipments. Special attention will be made on the achieved accuracy. One of the advantage of the tandem calibration method is that the reference KAP value is measured in the same way as the field KAP meter is measuring it (as a surface integral of air kerma). If the reference value is based on air kerma measured in the centre of the x-ray field, the method itself may have some field size dependence. The field size dependence of the methods was studied by Toroi et al. but the comparison was limited by the small size of reference KAP meter [3]. In this study the field size dependence study was extended to larger field sizes. As a conclusion specific uncertainty budget is given for the field KAP meter calibration made with a PDC meter as a reference meter.
167

REFERENCES
[1] INTERNATIONAL COMMISSION ON RADIATION UNITS AND MEASUREMENTS (ICRU) Patient dosimetry for x-rays used in medical imaging, ICRU Report 74 J. ICRU 5(2) (2005)1-113.
[2] INTERNATIONAL ATOMIC ENERGY AGENCY (IAEA), Dosimetry in diagnostic radiology: An international code of practice, Technical report series no. 457, (2007) IAEA, Vienna.
[3] TOROI, P., KOMPPA, T., KOSUNEN A., A tandem calibration method for kerma-area product meters, Phys. Med. Biol. 53 (2008) 4941-4958.
[4] TOROI, P., KOMPPA, T„ KOSUNEN A., TAPIOVAARA, M„ Effects of radiation quality on the calibration of kerma-area product meters in x-ray beams, Phys. Med. Biol. 53 (2008) 5207-5221.
[5] TOROI, P., KOSUNEN, A., The energy dependence of the response of a patient dose calibrator, Phys. Med. Biol. 54 (2009) N151-N156.
[6] INTERNATIONAL ELECTROTECHNICAL COMMISSION (IEC) Medical diagnostic X-ray equipment - Radiation Conditions for use in the determination of characteristics, IEC 61267 (2005) IEC, Geneva.
[7] TOROI, P., Patient exposure monitoring and radiation qualities in two-dimensional digital x-ray imaging, Academic dissertation, STUK-A239 (2009) STUK, Helsinki.
168

IDOS, Vienna, 9-12 November 2010 E2-CN-182, Paper No INV015
Performance test of multi-parameter measuring devices used for quality assurance in diagnostic radiology
L. Biiermann, R. Bottcher
Physikalisch-Technische Bundesanstalt, Braunschweig, Germany
E-mail address of main author: [email protected]
Introduction: Semiconductor-based multi-parameter measuring devices (MMD) are frequently used for measurements necessary in the Quality Assurance (QA) of medical X-ray imaging devices, e.g. for acceptance and constancy tests. Such instruments are capable of measuring the X-ray tube voltage (kVp), exposure time, dose, dose rate, half-value layer (HVL) and total filtration (TF) from a single shot exposure when placed in the beam of a radiographic or mammographic X-ray device. The requirements on the performance of such instruments with respect to the parameter dose and dose rate are given in the international standard IEC 61674 [1] and those for the non-invasive measurements of X-ray tube voltage in IEC 61676 [2], Unfortunately, there are no standards which define requirements on the performance of measurements of the total filtration or half-value measurements. The purpose of this work was to examine the performance of MMDs with respect to their indication of the air kerma, X-ray tube voltage, half-value layer and total filtration as a function of reference radiation qualities as defined in IEC 61267 [3] and used for studies in general radiography and mammography. The question was how do such systems comply with the manufacturer's technical specifications and with requirements of international standards.
Materials and methods: Frequently used MMDs from four different manufacturers, in the paper referred to as devices A, B, C and D, were bought and examined at the X-ray facilities of the Physikalisch-Technische Bundesanstalt (PTB). Radiation qualities according to IEC 61267 [3] and additional mammographic qualities based on W-, Mo- and Rh- anode X-ray tubes operated with constant-potential high-voltage generators were used. The X-ray tube high-voltage is measured by means of voltage dividers produced and calibrated at PTB. The photon fluence spectra of all PTB radiation qualities are measured with a high-purity germanium detector. The measured spectra were used to calculate parameters characterizing the beam quality, like the mean photon energy and the first and second aluminum half-value layers with respect to air kerma rate. Air kerma rates are measured with the PTB primary standard free-air chambers for low- and medium-energy X-rays.
Measurements and results: The single shot response of the four MMDs in terms of air kerma, X-ray tube voltage, half-value layer and total filtration was measured as a function of the radiation qualities RQR (40 kV - 150 kV) and RQA (50 kV - 150 kV), which are used for studies in unattenuated and attenuated beams in general radiography, and RQR-M and RQA-M (25 kV - 35 kV), which are used for studies in unattenuated and attenuated mammographic beams. Further, additional mammographic qualities based on a W-anode tube filtered with 50 (.im of Rh and a Rh-anode tube filtered with 25 [.im of Rh were used in the examinations.
The results were analyzed by the deviation of the indication from the conventional true values. The determined deviations were compared with accuracy specifications given in the corresponding manuals of the manufacturers of the four systems and, if applicable, with the requirements of
169

international standards. The limits of inaccuracy stated in the manuals were 5 % for the dose, 1.5 % to 2 % for the tube voltage, and 10 % for half-value layer and filtration. About 20 % of all dose testing points were beyond the 5 % limit, about 30 % of the tube voltage points were beyond the 2 % limit and about 50 % of all tested points for half-value layers and filtration were beyond the 10 % limit. The range of radiation qualities at which the devices are capable of measuring the HVL and filtration by a single shot is significantly restricted.
In general it can be concluded that a remarkably high number of all testing points of the devices go beyond the limits of accuracy stated in the corresponding manuals. Only the results for dose and tube voltage measurements are acceptable although there are still some improvements required. The other quantities seem to serve as sales promotion but cannot really be recommended to be used in measurements for quality assurance.
REFERENCES
[1] IEC. (1997) International Electrotechnical Commission. Medical Electrical Equipment— Dosemeters with Ionization Chambers and/or Semiconductor Detectors as Used in X-ray Diagnostic Imaging. IEC Publication 61674 (Geneva: International Electrotechnical Commission).
[2] IEC. (1996) International Electrotechnical Commission. Medical Electrical Equipment— Dosimetric Instruments for Non-Invasive Measurements of X-ray Tube Voltage in Diagnostic Radiology, IEC Publication 61676 (Geneva: International Electrotechnical Commission).
[3] IEC. (2005) International Electrotechnical Commission. Medical Diagnostic X-ray Equipment— Radiation Conditions for Use in the Determination of Characteristics. IEC Publication 61267 (Geneva: International Electrotechnical Commission).
170

IDOS, Vienna, 9-12 November 2010 E2-CN-182, Paper No INV015
Calibration of pencil type ionization chambers at various irradiation lengths and beam qualities
C. J. Hourdakis, A. Boziari and E. Koumbouli
Greek Atomic Energy Commission (GAEC), Athens, Greece.
E-mail address of main author: [email protected]
Pencil type ionization chambers are being used in several diagnostic radiology applications, for the measurement of the air kerma length product, PKL. For the last decades, these chambers have mainly been used in computed tomography (CT) dosimetry. Recently, in the light of new CT technologies, the standards of CT dosimetry and methods have been reviewed and new types of detectors have been proposed to be used, replacing the pencil type chambers [1], However, before these new standards will be fully reviewed, adopted and implemented, the pencil type chambers will remain in use. Furthermore, pencil type chambers are being or could be used for dose measurement in other applications, like dental, cone and fan beams, etc.
This work presents the calibration results of a number of commercial pencil type chambers and demonstrates the variation of performance between chambers of the same model and between different models. It also explores the chamber's performance in various irradiation conditions and highlights some specialties of their calibration.
Twenty three pencil type chambers have been assessed; 5 from PTW (TM 30009), 8 from RADCAL (20x5-3CT), 5 from RTI (OCT 10) and 5 from VICTOREEN (660-6). All chambers had an active volume of 100 mm length and were connected to their electrometer / measuring device. Although the associated measuring dosimetry quantity is the PKL, only 50% of them measured the PKi in mGycm. The rest measured in mGy or in Roentgens (R). Irrespective of the measuring quantity and units, all dosimeters were calibrated in terms of NPKL i.e.in mGycm/reading (i.e. mGycm/mGycm , mGy cm/mGy or mGy cm/R).
Calibrations were performed at RQT series beam qualities [2] following the procedure proposed in IAEA TRS 457 CoP [3]. An aperture of 30 mm in length was placed 50 mm in front of the chamber, so the chamber to be partially irradiated. The reference PKL value was determined by the product of air kerma, K, behind the aperture at the plane of measurement, times the measured irradiati on length at the same point. The reference instrument for the K, measurement (A3 Exradin) provided traceability to PTB. The average values of the chambers' NPKL at RQT9 quality were 0.982±0.117 for all chambers and 0.983±0.009, 0.934±0.089, 0.899±0.030 and 1.005±0.120 for the PTW, RADCAL, RTI and VICTOREEN models respectively (fig. la). The two discrete distributions of Mm: that appeared in fig. la correspond to the instruments that measured in old (R) and S.I. (mGy) units, respectively.
The energy dependence of response at RQT series was 2.10%, 6.75%, 9.79% and 1.48% for the PTW, RADCAL, RTI and VICTOREEN models respectively (figure lb).
171
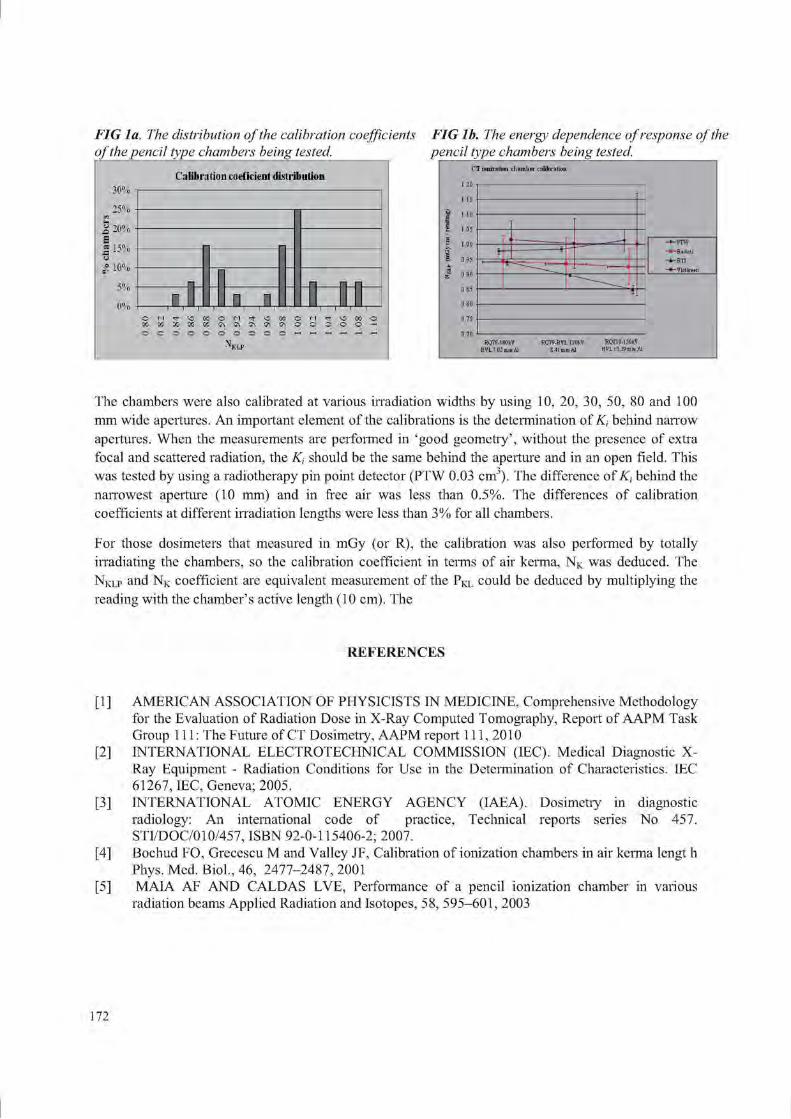
FIG la. The distribution of the calibration coefficients of the pencil type chambers being tested,
30%
25% <J 20% S a 1 5% (J o SF 10%
5%
0%
Calibration coeficient distribution
-
-
-
• _ -
n i
-
0.80
0.82
0.84
0.86
0.88
0.90
£ 0.
92
13
0.94
0.96
0.98
1.00
1.02
1.04
1.06
1.08
1.10
FIG lb. The energy dependence of response of the pencil type chambers being tested.
C'T ionization chamber rnlilii ntion 1.20
1.15
1.10
I.C5
1.00 0.95
- 4 i I 1 ——
i
—FTW ^Rsdcsl
RQT8-1 OOkV HYL7.0JmmAl RQT9-HVL 120fcV 8.41 mmAl RQT10-liOkV HVL 10.39 mm Al
The chambers were also calibrated at various irradiation widths by using 10, 20, 30, 50, 80 and 100 mm wide apertures. An important element of the calibrations is the determination of K, behind narrow apertures. When the measurements are performed in 'good geometry', without the presence of extra focal and scattered radiation, the K, should be the same behind the aperture and in an open field. This was tested by using a radiotherapy pin point detector (PTW 0.03 cm3). The difference of K, behind the narrowest aperture (10 mm) and in free air was less than 0.5%. The differences of calibration coefficients at different irradiation lengths were less than 3% for all chambers.
For those dosimeters that measured in mGy (or R), the calibration was also performed by totally irradiating the chambers, so the calibration coefficient in terms of air kerma, NK was deduced. The N K L P and N K coefficient are equivalent measurement of the P K L could be deduced by multiplying the reading with the chamber's active length (10 cm). The
REFERENCES
[1 ] AMERICAN ASSOCIATION OF PHYSICISTS IN MEDICINE, Comprehensive Methodology for the Evaluation of Radiation Dose in X-Ray Computed T omography, Report of AAPM Task Group 111: The Future of CT Dosimetiy, AAPM report 111, 2010
[2] INTERNATIONAL ELECTROTECHNICAL COMMISSION (IEC). Medical Diagnostic X-Ray Equipment - Radiation Conditions for Use in the Determination of Characteristics. IEC 61267, IEC, Geneva; 2005.
[3] INTERNATIONAL ATOMIC ENERGY AGENCY (IAEA). Dosimetry in diagnostic radiology: An international code of practice, Technical reports series No 457. STI/DOC/010/457, ISBN 92-0-115406-2; 2007.
[4] Bochud FO, Grecescu M and Valley JF, Calibration of ionization chambers in air kerma lengt h Phys. Med. Biol., 46, 2477-2487, 2001
[5] MAIA AF AND CALDAS LVE, Performance of a pencil ionization chamber in various radiation beams Applied Radiation and Isotopes, 58, 595-601, 2003
172

IDOS, Vienna, 9-12 November 2010 E2-CN-182, Paper No INV015
Radiation dose measurements for pediatrics and co-patients during micturating cystourethrography
A. Sulieman*, F. Abd-Alrahman, B, Hussain and M. Hamadelneel
College of Medical Radiologic Science, Sudan University of Science and Technology P.O.Box 1908, Khartoum, Sudan
•Corresponding Author: Tel: +249910874885,Fax: +249 183 785215,
E-mail address of main author: [email protected]
The objectives of this study are to (i) determine the Entrance surface dose (ESD), gonadal dose, effective dose (E) and relevant radiogenic risks associated with pediatric patients undergoing Micturating Cystourethrography (MCI G). (ii) evaluate the technique applied in order to reduce patient and co-patient dose, i.e. individuals helping in the support, care and comfort of the children during the examination and (iii) estimate the radiation risk to the patients and co-patients. The study was carried out in Soba University hospital, Khartoum.
A total of 60 thermoluminescence dosimeters (TLD-GR200A) circular chips of lithium fluoride (LiF:Mg,Cu,P) were used in this study. Prior to measurements, all TLD's were calibrated under reproducible reference condition using Toshiba Rotande model (T6-6TL-6) against ionization chamber PTW-CONNY II connected to radiation monitor controller at 100 cm source skin distance (SSD) [1], The TLD signal was read using an automatic TLD reader (Fimel PCL3, France) in an atmosphere of inert nitrogen. The read-out was at a 155 °C preheat temperature and the signal was acquired from 155 to 260 °C with heating rate of 11°C /s. All machines had already passed the routine quality control tests performed by Sudan Atomic Energy Commission. Three TLDs were inserted in a plastic envelope made of transparent polyethylene plastic foil placed on organ site and were fixed in the required position
The ESD was determined by TLDs for 33 children. Moreover, the surface dose was evaluated for the co-patient, who helped in support and comfort of the children, during examination.
ESD was used to estimate the patient effective dose (E) using the software provided by the National Radiological Protection Board (NRPB-SR262) [2],
The mean ESD and E resulting from MCUG procedure was estimated to be 5.51 mGy and 0.22 mSv respectively for the total patient population as can be seen in Table 1. The mean ESD results for all patients were larger than previous studies, which indicate the need for radiation dose optimization.
Ovaries and testes doses, which raise particular concern due to the hereditary effect of radiation, were estimated to be 0.54 mGy, 0.27 mGy, respectively. The measured co-patient doses (mGy) for all co-patients are presented in Table 2.
The use of full wrap-around apron is more effective due to the full coverage of the back and waist area, than the frontal protection one. The mean and the range of doses at the chest (above the lead
173

apron) are higher than at waist (under the lead apron) this is due to the fact that the transmission of the lead apron is very low (0.50 mm lead equivalent)
TABLE 1: MINIMUM, MEDIAN, MEAN, THIRD QUARTILE AND MAXIMUM VALUES OF THE ESP AND THYROID SURFACE DOSES (MGY) FOR PATIENTS.
Patient Mean Minimum Median 3 rd quartile Maximum
ESD 5.51 0.39 4.75 8.89 16.12
Thyroid 0.30 0.13 0.24 0.27 1.53
TABLE 2: MINIMUM, MEAN, MEDIAN, THIRD QUARTILE AND MAXIMUM VALUES OF CO-PATIENTS' ENTRANCE SURFACE DOSES (MGY) AND EFFECTIVE DOSE (MSV).
co-patients Mean Minimum Median 3rd quartile Maximum
Chest 0.27 0.18 0.21 0.24 1.60
waist 0.21 0.14 0.20 0.24 0.30
Effective dose 0.21 0.15 0.20 0.23 0.38
This study indicates the need of radiation exposure reduction to patients and co-patients undergoing MCUG, and underlines the importance of the protection in busy urology departments. The unnecessary radiation exposure can be reduced significantly by the presence of experienced examiner and technologist. The effective radiation dose to the patients (0.22 mSv) is well within the established safety limits, in the light of the current practice. Furthermore, the co-patient should put on a lead wrap-around protective apron for optimum protection against the scattered radiation. We believe that the available formulae to evaluate effective dose to patients and co-patients underestimate the co-patient doses. The results of this study provide baseline data to establish reference dose levels for MCUG examination in very young patients.
REFERENCES
[1] MARTIN, C.J., SUTTON, D.G., WORKMAN, A., SHAW, A,J„ TEMPETON, D. Protocol for measurement of patient entrance surface dose rates for fluoroscopic X-ray equipment. Br J Radiol 71:1283-87 (1998).
[2] HART, D., JONES, D.G. and WALL, B.F. Normalized organ doses for medical X ray examinations calculated using Monte Carlo techniques. NRPB 262. Chilton (U.K), (1998).
[3] A SULIEMAN, K THEODOROU, M VLYCHOU, T TOPALTZIKIS, D KANAVOU, I FEZOULIDIS, C KAPPAS, Radiation dose measurement and risk estimation for paediatric patients undergoing micturating cystourethrography. Br J Radiol. 2007,731-737.
174

IDOS, Vienna, 9-12 November 2010 E2-CN-182, Paper No INV015
Diagnostic reference levels in neonatal units M.T. Bahreyni Toossia, M. Malekzadeh"
a Medical Physics Research Center, Faculty of Medicine, Mashhad University of Medical Sciences, Mashhad- Iran
b Nursing and Allied Health Faculty. Semnan University of Medical Sciences, Semnan-Iran.
E-mail address of main author: [email protected]
Most of diagnostic X-ray examinations are performed during hospitalization of newborn babies in neonatal intensive care unit (NICU). These examinations are mostly carried out to image respiratory and gastrointestinal systems, commonly called chest and abdomen examinations. In several reports, researchers have emphasized that the risk of cancer induction following to exposure of ionizing radiation is inversely related to the age at the time of exposure; in other word radio sensitivity of a new born is assumed to be greater than a mature child or an adult [1], Most infants require multiple X-rays during their neonatal course which depends on underlying disease, and these standardized images give vital information to health care providers to interpret accurately and formulate appropriate interventions.
The concept of reference doses or DRLs have been developed as a practical aid to the optimization of patient protection in diagnostic radiology that was introduced in the UK in 1990 in a joint document by the Royal College of Radiologists and the National Radiological Protection Board [2]. Entrance Skin Dose (ESD) which is measured by TLD are often used for this purpose. Risk of death due to the radiation cancer incidence of chest x-ray was estimated by employing PCXMC 4 software [3]. This study was carried out during a period of 6 months in eight NICUs, located in different type of hospitals: maternity, pediatric, general and teaching hospitals. The studied population included 195 neonates with different illnesses. Mean weight of neonates was approximately 2600g, Radiographic parameters such as applied potential (kVp), current-time product (rnAs), FFD and neonate data were recorded. In NICU, radiographes are taken with a mobile X-ray unit. ESD can be measured by placing thermoluminescent dosemeters (TLD-100) on the surface of skin of patients. TLD chips were read finally by Harshaw 3500 TLD Reader. Incident air kerma, was calculated from ESD values to estimate cancer risk utilizing PCXMC software [3].
Minimum ESD was acquired in center no. 4 (a maternity hospital), in this center higher kVp (61-62) and lower mAs (0.5) was practiced. In center no 5 (a general hospital) a higher ESD was obtained, in this center larger radiation field (1000-1200 cm2) was used, lack of proper collimation was the main cause for higher patient dose. Short FFD gave rise to fairly high ESD in center no. 8 (a general hospital) for both types of examinations. In center no. 2 (a teaching hospital) patients who undertook abdomen radiography received relatively higher ESD, this was associated with application of high mAs (4). Generally, in various centers a wide range of kVp (41-62) and mAs (0.5-4) were applied.
175

Dosimetric quantities and patients information were recorded to an input fde of PCXMC and risk of death due to radiation induced cancer was estimated; for abdomen examination, the estimated risk is equal to 1.88xl0"6 for male and 4.43xl0"t' for female patients; for chest X-ray, it is equal to 2.54x10'" for male and 1.17x10" for female patients, higher risk for the latter group is in accordance with higher overall radiation risk for females.
For reducing dose, several actions should be pursued: paying attention to the ALARA principle, preparing national guidelines for good neonate radiographic techniques which would be traceable to existing standards and recommendations; training radiographers to specialize in neonatal imaging and neonatal radiation protection and finally establishing national diagnostic reference levels.
REFERENCES
[1] HANAN DATZ, AVI BEN-SHLOMO, DAVID BADER, SIEGAL SADETZKI, ADA JUSTER-RETCHER, KYLA MARKS. The Additional Dose to Radiosensitive Organs Caused by Using Under-Collimated X-Ray Beams in Neonatal Intensive Care Radiography. Radiation Protection Dosimetry (2008), Vol. 130, No. 4, pp. 518-524.
[2] B. F. WALL. Radiation Protection Dosimetry for Diagnostic. Radiology Patients. Radiation Protection Dosimetry (2004), Vol. 109, No. 4,pp.409±419.
[3] http://www.stuk.fi/sateilyn_kaytto/ohjelmat/PCXMC/ PCXMC 2.0 User's Guide (STUK-TR 7, pdf-file).). Accessed 20 Sep 2008.
[4] COMMISSION OF THE EUROPEAN COMMUNITIES European guidelines on quality criteria for diagnostic radiographic images in paediatrics. EUR 16261 EN (Luxembourg: office for official publications of the European communities)(1996).
[5] HART D, WALL BF, SCHRIMPTON PC, BUNGAY DR, DANCE DR. Reference doses and patient size in paediatric radiology. NRPB R-318.Chilton: HMSO 2000.
176

Parallel Session 9
Radiation Protection Dosimetry


IDOS, Vienna, 9-12 November 2010 E2-CN-182, Paper No INV015
Occupational exposure of medical staff: An overview
F. Vanhavere
SCK CRN, Belgian Nuclear Research Centre, Belgium
E-mail address of main author: fvanhave@SCKCEN. BE
Occupational exposure is defined as the exposure of a worker that is received or committed during a period of work. For an overview of the different area's where workers can be occupationally exposed we can refer to the UNSCEAR reports'11. The physicians, technicians, nurses, and other medical staff constitute the largest group of workers occupationally exposed to man-made sources of radiation. In this UNSCEAR publication you can find the average occupational doses worldwide and trends during the last 20-30 years. Of course these statistics are difficult to obtain, and there are large differences between different countries. According to the UNSCEAR data, the average exposure of medical workers are now decreasing worldwide, but the number of workers exposed to medical sources of radiation is still increasing.
We will give an overview of the occupational exposures in different areas of the medical field, and we will discuss some of the hot-topics and radiation protection problems. We will give some examples of recent staff dose measurements in the different medical fields.
Diagnostic radiology
Radiography is by far the most widely used X-ray imaging technique. During radiography with fixed installations, the radiographer would normally be expected to stand in a control booth that is typically shielded against X-ray tube leakage and scattered radiation from the room and patient. The occupational doses are mostly low.
Fluoroscopic procedures are by far the largest source of occupational exposure in medicine. These procedures require the operator to be present in the examination room, usually close to the patient. In fact, the patient is the main source of exposure because of scattered radiation. Shielding for this scattered radiation is more difficult, but it is possible to reduce the staff doses by partial shielding and simple procedural steps. Fluoroscopy procedures can also be therapeutic. In such cases the procedures arc even longer and doses to staff arc generally higher. Often distinction is made between interventional cardiology and radiology. And there are also a number of procedures which are performed outside the radiology or cardiology department.
The staff present in the fluoroscopy room should in principle always wear a lead apron. This reduces very much the whole body doses, but several parts of the body are not protected: hands, feet, head, sometimes thyroid (if no collar is used). The use of lead aprons introduces a problem of dose monitoring of the staff. The regulations differ from country to country whether to wear one or two dosemeters, where they should be worn, and how the results should be interpreted.
Doses to extremeties like hands and feet can be high, even though in normal cases direct exposure to the beam can be avoided. The eye lens doses are generally below the limit, but recent concern has risen on cataract inductions and these limits will probably be lowered. In such cases the eye lens doses may need to be monitored.
179

Although doses to patients from computed tomography (CT) may be high, the exposure of staff is usually low, because the primary x-ray beam is highly collimated, and scattered radiation levels are low. In all such CT units, leakage of radiation has been reduced to near zero. For staff in the control room of a properly designed facility, computed tomography does not represent a significant dose.
One of the new developments which cause concern for staff exposure is CT fluoroscopy. This is an interventional procedure where the physician is next to the patient during CT scans. Although it is possible to avoid this, often the hands of the physician are in the direct beam.
Dental radiology
In almost every dental office or clinic, a diagnostic X-ray machine is available and frequently used. The number of X-ray devices used in dentistry is thus extremely large. Occupational exposure in dentistry is from scattered radiation from the patient and leakage from the tube head, although the latter should be insignificant with modem equipment. A majority of dental practitioners do not receive measurable doses, and indeed some regulatory authorities do not require routine. A recent trend is the introduction of dental CBCT. This is again mostly of concern for patient doses, but also staff doses can increase due to this.
Nuclear medicine
Whereas the broad aim in diagnostic radiology is the imaging of anatomy, that in nuclear medicine is more the investigation of physiological processes. The use of radionuclide generators, particularly
I'c generators, requires handling tens of gigabecquerels of radioactive material during the elution process. The magnitude of the exposures when performing clinical nuclear medicine procedures depends on the precautions taken, including the use of syringe shields when performing the injections. Personnel must be close to the patient when giving the injections and while positioning the patient and camera. Special care should go to the extremity doses in nuclear medicine. There are also an increasingly number of therapeutic procedures in nuclear medicine. Here the activities used are an order of magnitude higher than in diagnostic procedures, and staff doses are logically much higher, especially when this is done on a less routinely bases.
Internal exposures of personnel are usually much less than external exposures; they are controlled by monitoring work surfaces and airborne concentrations, although some medical centres conduct routine bioassays.
Radiotherapy
Radiotherapy is an important treatment modality for malignant disease. Personnel should not normally be present in the treatment room when external beam therapy is being used. The types of exposure from linear accelerators depend on the type of beam (photon or electron) and the beam energy. Below 10 MeV, exposure comes only from radiation that penetrates the protective barrier. Above 10 MeV, photonuclear reactions can produce neutrons and activation products. The neutrons can penetrate the protective barrier while the unit is operating. Residual activity can expose personnel who enter the treatment room immediately after the treatment has been delivered. The exposures, however, are normally low. Brachytherapy, where there is manual loading of the radioactive sources, is usually the most significant source of personnel exposure. But in western counties most loading is done automatically, making the doses to the staff low.
180

Conclusion
The highest staff doses are found for fluoroscopic techniques, while in nuclear medicine, especially therapy applications, the extremity doses can approach the dose limits. The evolution of the eye lens dose limit should be followed closely as well. In medical applications new techniques and evolutions appear very fast and constantly. Care should be taken constantly to use the adequate radiation protection measures that keep the doses acceptable. Continuous training and education is a very important aspect in this.
REFERENCE
[1] UNSCEAR 2000 Report Vol.1. Sources and Effects of Ionizing Radiation, United Nations Scientific Committee on the Effects of Atomic Radiation, 2000
181


IDOS, Vienna, 9-12 November 2010 E2-CN-182, Paper No INV015
Occupational doses in interventional cardiology: Experiences in obtaining worldwide data as part of the ISEMIR project
J. Le Heron1, R, Padovani2, A.Duran3, D.L. Miller4, H.K. Sim5, E.Vano6, C. Lefaure1, M. Rehani1
1 International Atomic Energy Agency, Vienna, Austria 2
" Medical Physics Dpt. University Hospital, Udine, Italy
University Hospital, Cardiology Dpt., Montevideo, Uruguay 4 Radiology Dpt., Uniformed Services University, Bethesda, MD, USA
Cardiology Dpt., Sarawak General Hospital, Malaysia 6 Medical Physics Dpt., S. Carlos University Hospital and Universidad Complutense, Madrid, Spain
The International Atomic Energy Agency (IAEA) initiated in early 2009 the Information System on Occupational Exposure in Medicine, Industry and Research, referred to as the ISEMIR project. The project is specifically aimed at improving occupational radiation protection in those areas of radiation use in medicine, industry and research where non-trivial occupational exposures occur. Interventional Cardiology (IC) was the first such area identified and a working group was formed in February 2009 -the Working Group on Interventional Cardiology (WGIC).
One of the first actions of the WGIC was to devise questionnaires to gain insight into occupational radiation protection in IC around the world. This included a questionnaire addressed to national or state radiation protection (RP) regulatory bodies (RBs), asking, inter alia: the numbers of workers with personal dosimetry involved in IC procedures in 2008; values of occupational doses (effective dose) in the national authority's database (or database accessible by the national authority); and whether the RP RB defines the number and position of dosimeters for staff monitoring in IC. Responses were received from 81 RBs (56 national RBs and 25 state RBs) out of 191 attempted contacts.
About half the RBs (41 out of 81) stated that they were not able to provide occupational dose data for IC, citing reasons that included: no central dose register in the country or state; no easy access to the central dose register by the RB; the RB only had records of doses if they exceed some particular threshold (e.g. investigation or action level); no specific classification for interventional cardiologists, or other persons in IC in the database.
The other RBs (40 out of 81) were able to provide some occupational dose data, ranging from detailed dose values to data that were inconsistent and/or ambiguous. Some of the dose data supplied were not suitable for further analysis for reasons that included: reported dose data were "contaminated" with doses from other occupational classes or functions, such as interventional radiology; corrected and uncorrected doses were mixed in the same database; reported doses were from a database that contained only doses above some action level.
183

Occupational dose data from 29 countries were analyzed giving results [1] that included:
• For those RBs reporting data for IC physicians as a group, in 2008 the mean country median effective dose was 0.73±0.62 mSv per year, and the mean country 3rd quartile effective dose was 1.09±0.69 mSv per year. The 2008 results are based on reported monitoring results from 23 countries, for a total of 1432 interventional cardiology physicians.
• For those RBs reporting data for other professionals in IC as a group, in 2008 the mean country median effective dose was 0.76±0.68 mSv per year, and the mean country 3rd quartile effective dose was 1.10±1.09 mSv per year. The 2008 results are based on reported monitoring results from 17 countries, for a total of 825 other professionals working in IC.
While on the one hand, all the reported annual effective doses were well below the 20 mSv occupational dose limit, recommended by the ICRP, on the other they were lower than expected when compared with validated data from facility-specific studies. It is likely that the largest potential shortcoming of the reported results is the uncertainty of whether dosimeters were actually worn by the interventional cardiologists whenever they were performing IC procedures. Reasons for non-compliance with monitoring range from simple negligence to deliberate avoidance because of the fear of exceeding some dose threshold that leads to regulatory or administrative investigation (often as a result of an above-the-apron dose value being used as a surrogate for effective dose with no correction factor used).
About 60% of RBs stated that they specify the number and position of dosimeters for the monitoring of staff in IC. Of these: 40% specify the use of one dosimeter, to be worn above the apron in most cases (-80%); 20% specify the use of two dosimeters, one above and one below the apron; 40% did not provide details.
The initial survey showed that obtaining reliable data on occupational exposures in IC from RP RBs was problematic, with the further complication that recorded doses may underestimate the true occupational exposure. Alternative strategies for the collection of IC occupational dose data need to be utilised if a worldwide database is to be established under the ISEMIR project.
At the end of 2009 a small pilot trial was initiated to test the feasibility of obtaining the requisite occupational dose data directly from IC facilities. The perceived advantages of such an approach included: better identification of the occupations and roles of IC personnel; better information on the dosimetry underpinning the reported doses; and some scope for assessing compliance with monitoring. A simple spreadsheet was designed to obtain annual doses and workload for IC personnel.
An interim review of reported dose results from 8 IC facilities in March 2010 by the WGIC showed that problems still remained. Despite the frequent presence of a medical physicist in the surveyed IC facilities and a reasonably high level of awareness of RP, the results received from the 8 IC facilities showed no correlation between reported doses and the stated workload. Clearly the level of compliance with monitoring was variable. The WGIC felt that the extent of the compliance problem needed to be more firmly quantified, so the trial collection of data directly from IC facilities was extended to the end of August 2010. The results of the extended pilot trial will be presented and discussed. In parallel, guidelines on occupational RP in IC are being developed. One of the aims is to improve compliance with monitoring in IC.
184

REFERENCE
PADOVANI R, LE HERON J, CRUZ-SUAREZ R, et al., International project on individual monitoring and radiation exposure levels in interventional cardiology. Submitted to Radiat Prot. Dosim. April 2010.
185


IDOS, Vienna, 9-12 November 2010 E2-CN-182, Paper No INV015
Estimation of hand doses from positrons during FDG manipulation
M. Fulopa, I. Makaiova\ P. Povinecc, D. Bacekc, P. Vlkc, P. Ragand, I. Gomolae, V. Husakf
aSlovak Medical University, Bratislava, Slovakia, bOUSA, Bratislava, Slovakia, °BIONT, Bratislava, Slovakia, dUVZ SR, Bratislava, Slovakia, eIBA Dosimetry, Schwarzenbruck, Germany, University Hospital Olomouc, Czech Republic
Email address of main author: [email protected]
A method of positron dose estimation is based on measurements performed with two different types of commercially available thermoluminescence dosimeters (TLD Poland), having different detection sensitivity to positrons and photons. The first type is the MCP-Ns (LiF: Mg, Cu, P) with the thickness of active layer 0.05 mm designed to measure Hp(0.07), the second TLD is the MCP-7 (LiF: Mg, Cu, P) type with the thickness of 0,9 mm. Both TLDs have a form of circular pellets with the diameter of 4.5 mm.
Differences in the detection sensitivities between two different types of TLDs exposed by 18FDG are caused by various thicknesses of their sensitive layers as described in [1], According to this study the thermoluminiscent signal TL from various depths of TLD irradiated by beta particles is given by following equation
TL = C-{l-exp{-b-d))
where C is a proportionality constant, 6=2,32 for 90Sr/90Y beta source and d is a depth in the sensitive
layer. Taking into account the differences in the thickness of active layers of used TLDs, MCP-Ns (0.05 mm) and MC-P-7(0.9 mm) we assume differences in their positron detection efficiency. By solving the system of two linear equations with two unknown variables one can estimate relative positron and photon contributions to the total skin dose. The TLDs were calibrated with Cs gamma source with a dose close to 5 mGy, the readout was performed with a reader Harshaw-Bicron 3500 in a nitrogen atmosphere. TLD pairs were encapsulated into a polyethylene foil with the thickness of 0.03 mm and attached on latex gloves. Twelve various places on the left and right hands, including the positions, which receive usually the highest skin dose - the underneath of the tips and the nails of index fingers and thumbs, were chosen for placing the TLD pairs to estimate the skin doses during a real preparation and administration of FDG to patients in a nuclear medicine department.
Uncertainties of the dose responses estimated using the pairs of TLDs MCP-7 are leading to the differences in dose ratios (MCP-7/MCP-7) up to approximately 25 % (fig. 1). These uncertainties are for example due to various positions of TLDs, energy and angular dependences, batch uniformity and calibration procedure. The contribution of positrons to the total dose could be considered only if the ratio MCP-Ns/MCP-7 is higher than 1,25. Taking this into account we observed about 30% of monitored cases with contribution of the positron dose to the total skin dose (15 monitored cases out of 46). Monitored case means the monitoring of a physician or radiopharmaceutist at PET department during two working days.
187
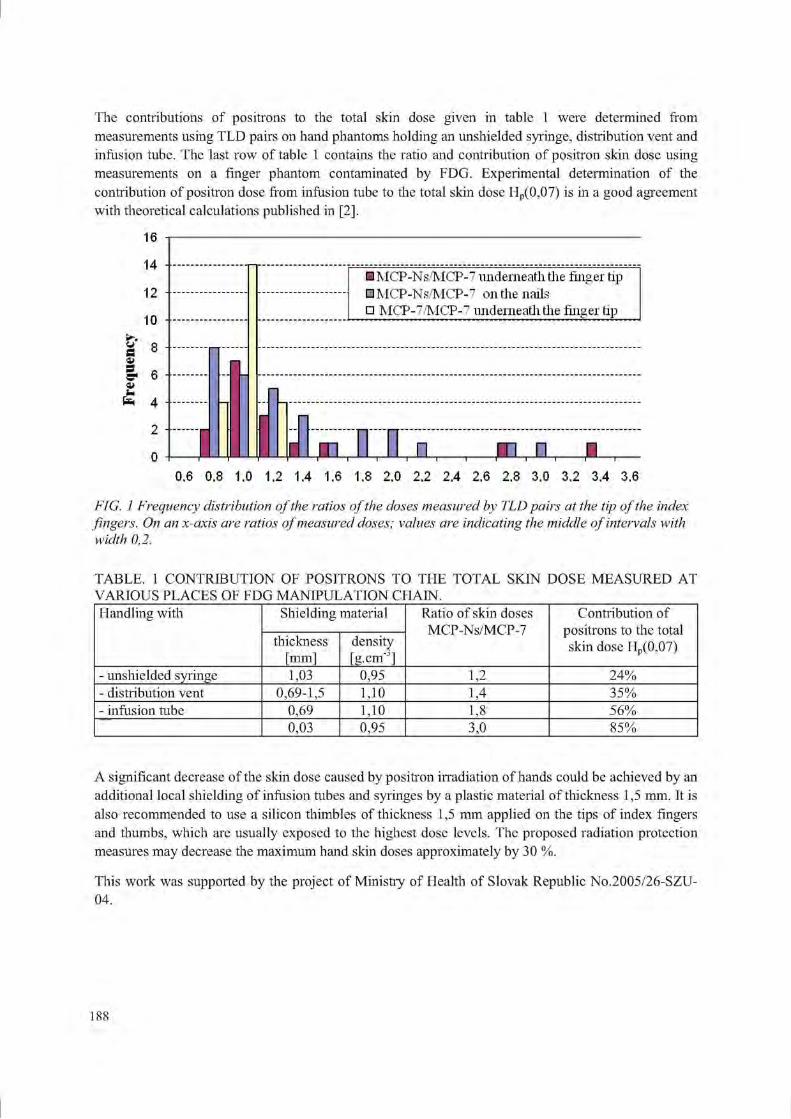
The contributions of positrons to the total skin dose given in table 1 were determined from measurements using TLD pairs on hand phantoms holding an unshielded syringe, distribution vent and infusion tube. The last row of table 1 contains the ratio and contribution of positron skin dose using measurements on a finger phantom contaminated by FDG. Experimental determination of the contribution of positron dose from infusion tube to the total skin dose Hp(0,07) is in a good agreement with theoretical calculations published in [2].
6/ S <u s c a im fc-
16
14
12
1 0 -
8 -
6 -
4 -
2 II
• MCP-Ns/MCP-7 underneath the finger tip • MCP-Ns/MCP-7 on the nails: • MCP-7/MCP-7 underneath the finger tip
ITL XL m, n XL 0.6 0.8 1.0 1.2 1.4 1.6 1.8 2.0 2.2 2.4 2.6 2.8 3.0 3.2 3.4 3.6
FIG. 1 Frequency distribution of the ratios of the doses measured by TLD pairs at the tip of the index fingers. On an x-axis are ratios of measured doses; values are indicating the middle of intervals with width 0,2.
TABLE. 1 CONTRIBUTION OF POSITRONS TO THE TOTAL SKIN DOSE MEASURED AT VARIOUS PLACES OF FDG MANIPULATION CHAIN. Handling with Shielding material Ratio of skin doses
MCP-Ns/MCP-7 Contribution of
positrons to the total skin dose Hp(0,07)
Handling with
thickness [mm]
density [g-cnr]
Ratio of skin doses MCP-Ns/MCP-7
Contribution of positrons to the total skin dose Hp(0,07)
- unshielded syringe 1,03 0,95 1,2 24% - distribution vent 0,69-1,5 1,10 1,4 35% - infusion tube 0,69 1,10 1,8 56%
0,03 0,95 3,0 85%
A significant decrease of the skin dose caused by positron irradiation of hands could be achieved by an additional local shielding of infusion tubes and syringes by a plastic material of thickness 1,5 mm. It is also recommended to use a silicon thimbles of thickness 1,5 mm applied on the tips of index fingers and thumbs, which are usually exposed to the highest dose levels. The proposed radiation protection measures may decrease the maximum hand skin doses approximately by 30 %.
This work was supported by the project of Ministry of Health of Slovak Republic No.2005/26-SZU-04.
188

REFERENCES
[1] GAZA, R., BULUR, E„ MC KEEVER, S. W. S„ SOARES, C, G„ Experimental Determination of the Dose Deposition Profile of a 90Sr Beta Source, Radiation Protection Dosimetry (2006) Vol. 120, No. 1-4, pp. 33-37
[2] COVENS, P., BERUS, D„ VANHAVERE, F„ CAVELIERS, V., The introduction of automated dispensing and injection during PET procedures: a step in the optimisation of extremity doses and whole-body doses of nuclear medicine staff, Radiation Protection Dosimetry (2010) 10.1093/rpd/ncql 10
189


IDOS, Vienna, 9-12 November 2010 E2-CN-182, Paper No INV015
The ORAMED project: Optimization of radiation protection for medical staff in interventional radiology, cardiology and nuclear medicine
1 1 2 * 3 4 * 5 N.Ruiz Lopez , M. Sans Merce , I. Barth", E. Carinou , A. Carnicer , I. Clairand , J. 6 5 .7 fi . 4 .7 Domienik , L. Donadille , P. Ferrari , M. Fulop , M. Ginjaume , G. Gualdrini , C.
3 9 . 8 * 2 9 Koukorava, S. Krim , F. Mariotti , D. Nikodemova , A. Rimpler~,K. Smans , L. Struelens9, F. Vanhavcrc
1 University Hospital Centre (CHUV),University of Lausanne, Switzerland 2 ~ BfS, Federal Office for Radiation Protection, Germany 3
" Greek Atomic Energy Commission (GAEC), Athens, Greece 4 Institute of Energy Technology - Universitat Politecnica de Catalunya (UPC) 5 Institute for Radiological Protection and Nuclear Safety (IRSN), Fontenay-aux-Roses,
France
NIOM, Nofer Institute of Occupational Medicine, Poland 7 ENEA Radiation Protection Institute, Bologna, Italy
Slovak Medical University Faculty, Bratislava, Slovakia 9 Belgian Nuclear Research Centre (SCK-CEN), Mol, Belgium E-mail address of main author: [email protected]
The ORAMED project was started in the beginning of 2008 to tackle the radiation protection of medical staff and is running for 3 years. A consortium of 12 partners, among which two commercial companies, are working together to improve the knowledge on the radiation exposures of medical staff. The project is structured in 5 different work packages (WP); each of these packages covers specific tasks leading to the common objective. WP1: Interventional Radiology, WP2: Eye lens dosimetry, WP3: Active Personal Dosemeters, WP4: Nuclear Medicine and WP5: Training and dissemination. This work only will present results of WP1 and WP4.
Routine monitoring of extremities is difficult, since "the most exposed area" according to ICRP recommendations cannot easily be identified. In most cases only finger or hand doses are reported. However, doses to the legs can be even higher than doses to the hands in interventional radiology. Cases of cataracts of staff involved in interventional procedures have been reported in recent years; however eye lens doses are rarely measured in routine monitoring. The objective of ORAMED's first work package is to obtain a set of standardized data on extremity and eye lens doses for staff in interventional radiology and cardiology and to design the recommended radiation protection measures and procedures to optimize staff protection.
In order to study extremity and eye lens doses of medical staff, a coordinated measurement program in different hospitals in Europe is presently ongoing. The procedures were chosen according to their frequency and/or high KAP (Kerma Area Product) values. The selected procedures are: cardiac angiographies (CA) and angioplasties (PTCA), radiofrequency ablations (RFA), pacemaker and cardiac defibrillator implantations (I'M. ICD), angiographies (DSA) and angioplasties (PTA) of the lower limbs (LL), the carotids (C) and the reins (R), embolisations and endoscopic retrograde cholangiopancreatographies (ERCP). A measurement protocol was established according to which
191

several parameters related to the system: the type and complexity of the procedure, the position of the physician and the protective equipment, the experience of the physician, the field parameters (kV values, filtration, projections, etc.) and finally the KAP values, are recorded. TL dosemeters are used for the measurements. The highest KAP values have been recorded during DSA PTA R and embolisations procedures while the lowest ones during PM/ICD and ERCP procedures. Moreover, the highest doses have been found for PM/ICD, DSA PTA R and embolisations. The parts of the body that receive the highest doses are the fingers of the left hand or the left wrist. The highest doses to the eye lens have been measured during embolisations.
In nuclear medicine, the dose distribution over the hand may vary during a single process as well as when several people perform the same procedure. Therefore, a lack of knowledge about "the most exposed area" is also identified. The fourth work package of the ORAMED project aims at optimizing radiation protection of medical staff in nuclear medicine. A measurement campaign was planned and is being performed to measure skin doses, Hp(0.07), at different positions on the hands for several nuclear medicine procedures. This was effectuated using a standard protocol, recording all the relevant information for radiation exposure, i.e. means of protection and tools. For diagnostics, the most used radionuclides have been considered: Tc-99m and F-18. For therapy, Zevalin® and DOTATOC, both labeled with Y-90, have been chosen. Preliminary results show that large variations of skin doses have been observed across the hands, from 0.1 to 32 mSv/GBq, depending on the radionuclide and the procedure, but also on the individual technician and the radiation protection measures. In some cases, the skin dose equivalent limit could be exceeded. The positioning of the dosimeter used in routine monitoring strongly affects the result obtained for Hp(0.07).
More information on the ORAMED project can be found on the website: www.oramed-fp7.eu. Finally, it should be mentioned that all the results of the ORAMED's project and the respective reccomendations will be presented in a dedicated workshope that will be held in Barcelona from January 20-22 2011 (www.upc.edu/inte/oramed).
ACKNOWLEDGMENT
The research leading to these results has received funding from the European Atomic Energy Community's Seventh Framework Programme (FP7/2007-2011) under grant agreement n° 211361.
192

Posters relating to Radiation Measurement Standards for Imaging and
Therapy


IDOS, Vienna, 9-12 November 2010 E2-CN-182, Paper No INV015
Quality management system of secondary standards dosimetry laboratory in Sri Lanka
C. Kasige, S.A. Ravindra Abeysinghe, L.P. Jayasinghe
Atomic Energy Authority of Sri Lanka
Email address of main author: [email protected]
Application of Quality Management System (QMS) of Secondary Standard Dosimetry Laboratory (SSDL) of the Atomic Energy Authority (ALA) of Sri Lanka provides path of workflow and information on laboratory operations, management and competence of staff that would assist the laboratory in continual improvement of its processes and meeting accreditation requirements in compliance with IS017025. Thus provision of customers' satisfied accredited dosimetry calibration services is needed for the country.
The SSDL currently possesses a reference electrometer (PTW Unidos) with protection level ion-chambers (NE2575, 600cc ion-chamber and PTW - lOLt ion-chamber) and therapy level ion-chambers (NE2571, 0.6cc thimble ion-chamber). Also the laboratory is also having measuring standards ( NE2570 electrometer with NE2575, 600cc ion-chamber and NE2571, 0.6cc thimble ion-chamber) .
A gamma irradiator which contains two gamma sources (Co-60 & Cs-137) and a X-ray system with six ISO 4037 beam qualities (narrow spectrum of energy range: 33keV - 118keV) are available for protection level X-ray calibrations.
Stability of the electrometers with Ion- chambers is performed with Sr-90 check sources, which are specially designed for each type of chambers in order to fix the set-up maintaining the same geometry for every measurement. An average of reading of ten consecutive measurements of which each measurement was made for 300s is taken for stability measurement. Each reading is corrected for ambient temperature and pressure. Acceptance of percentage deviation of stability results with respect to reference reading of respective chamber is ±1% for protection level and ± 0.5% for therapy level. All these equipments, when they are not in used are kept in a dry cabinet in order to control humidity.
The SSDL of AEA has become a part of an international network of dosimetry laboratories established by the International Atomic Energy Agency (IAEA) and the World Health Organization (WHO). This network provides assistance for members to maintain consistency of Radiation Standard measurements in their dosimetry laboratories.
Reference electrometer with ion-chambers has been calibrated from IAEA Radiation Standard Laboratory at Seibersdorf in Austria which is traceable to primary standards at BIPM. Measuring standards are calibrated using these reference standards. The SSDL also participates IAEA TLD dose audit program to ensure the accuracy of radiation standards and is firmly committed to achieve global harmonization wherever possible. Hence the QMS assures the quality and accuracy of the services provided to institutions such as hospitals, research institutes, industries for the safety of their radiation workers.
Reference electrometer with ion-chambers is used to standardize the gamma radiation fields. Measurements are made from 1 m onwards from the source with 25 cm step increment along the beam axis. Ten consecutive readings are taken for the measurement of air-kerma rate at a point. Ambient temperature, pressure and humidity at the beginning and end of measurements of each measurement are taken by using calibrated ancillary instruments, which are traceable to national and international
195

standards, for correction of density of air mass in the ion-chamber. This air-kerma rate is converted to ambient dose equivalent rate (ADER) for the calibration of area monitors and personal dose equivalent rate (PDER) for calibration of personal monitoring instruments/devices as recommended in IAEA Safety Report Series 16 [1].
Graphs, Distance Vs dose rate for ADER and PDER using power fitting formula are established. Decay correction is applied for each data point measured and a fresh graph, Distance Vs dose rate is prepared each day prior to calibration of instruments. Verification of dose given by the software program is done with manual calculation of three data points.
Energies of X-ray beams used for protection level calibration are verified with first and second half-value thicknesses of each X-ray beam. Measurements are made to obtain details of beam profile. With this information radiation field within 80% of beam intensity is considered as the appropriated radiation field where the instrument under calibration and reference ion-chambers are kept for calibration for X-rays.
Intermediate performance tests/checks of instruments that could affect the accuracy of measurements of radiation standards are carried out once per a every four months. After measuring and verifying the stability check results, air-kerma of radiation fields at lm from the sources are measured using the reference electrometer with the ion-chambers and verify the results obtained from the Graphs, Distance Vs Dose rates. This procedure assures the accuracy and reliability of radiation standards maintained at the SSDL.
Quality Manual addressing quality policy, management and technical requirements in compliance with ISO 17025, Document Control Manual describing the procedure adapted for maintaining all documents and records, Procedure Manual describing complete procedures for the provision of calibration service followed by Standard operating procedures for each and every method used in the SSDL for calibration and measurements are considered as the QMS. Implementation of this QMS with internationally accepted calibration procedures to provide reliable and accurate protection and therapy level calibration services traceable to international standards is exercised by qualified technical personnel. Calibration results are reported with associated uncertainties at 95% confidence level with a coverage factor of 2.
REFERENCES
[1] INTERNATIONAL ATOMIC ENERGY AGENCY, Calibration of Radiation Protection Monitoring Instruments, Safety Report Series No. 16, IAEA, Vienna (2000).
[2] INTERNATIONAL ORGANIZATION FOR STANDARDIZATION and INTERNATIONAL ELECTROTECHNICAL COMMISSION, General Requirements for the Competence of Testing and Calibration Laboratories, ISO/IEC 17025:2005(E) (2005).
196

IDOS, Vienna, 9-12 November 2010 E2-CN-182, Paper No INV015
Evaluation of RQR beam quality at SSDL Jakarta Indonesia
H. Prasetio, R. Andika, S. Wijanarko, A. Rahmi
"Dosimetry Division, Centre for Technology for Radiation Safety and Metrology, Jakarta Indonesia.
b Physics Department, University of Indonesia, West Java, Indonesia
E-mail address of main author: [email protected]
Calibration services for radiodiagnostic X ray beam quality based on IAEA TRS457 guidance [1] are being prepared by Secondary Standard Dosimetry Laboratory Jakarta, Indonesia. The RQR beam quality measurement has been completed, and most radiodiagnostic facility using general X ray equipment is our priority. Study of the characteristics of X ray spectra using XCOMP5R[2] and Monte Carlo [3,4] have also been undertaken for selected energy of the SSDL's X ray machine to evaluate the effective energy of Xray spectra. The measurements are done using Farmer type chamber NE2571 and Keithley Electrometer. The HVL measurements were undertaken based on IAEA TRS457 configuration; the additional filters are located 50cm from the source while detector is positioned at 100cm. All spectra of RQR beam quality were evaluated by using XCOMP5R. The RQR2, RQR5 and RQR10 spectra were evaluated using BEAMnrc monte carlo code. The X ray spectrum, effective energy and FWHM from XCOMP5R are compared with BEAMnrc. FWHM of each spectrum was calculated using correlation between standard deviation (8) and FWHM with Gaussian distribution as the basis of calculation. The following equation is used
FWHM= 2V2In(2) 5
Peaks of Spectrum of X ray characteristic appear for tube voltage above 70kV. In order to have Gaussian distribution the peak need to be removed since it will affect the relationship between standard deviation and FWHM.
The 1st HVL recommended by TRS457 had been obtained with maximum deviation of <2%. The spectra, effective energy, and homogeneity were obtained using XCOMP5R and BEAMnrc monte carlo code. During the measurement additional filter was put in front of collimator to obtain the required HVL. After adequate filter thickness found the value were keyed in as XCOMP5R and BEAMnrc input. From the calculations and measurements it was found that the discrepancy with IAEA TRS457 recommendation for 1st HVL was 1% and 2nd HVL was 12%. HVLs from XCOMP5R calculation were in good agreement with TRS457. Other study also shown that differences between XCOMP5R HVL calculation and measurements is 3%[5],
The X ray spectra generated by XCOMP5R and BEAMnrc were also compared, and they are in good consistency. The effective energies of BEAMnrc were evaluated using BEAMDP. The effective energy of RQR2, RQR5 and RQR7 obtained from XCOMP5R are 28.IkeV, 39.6keV, 63.5keV respectively and from BEAMnrc are 28.2keV, 39.9keV, and 63.8keV respectively. The FWHM and effective energy from calculations are shown in Table 1, and the spectrum generated by XCOMP5R and BEAMnrc are shown in Figure l.From all the data it shown that the 1st HVL obtained from measurements for SSDL Jakarta are in good agreement with IAEA TRS457 with discrepancy of <2%. Even though 1st HVL has been obtained, it is difficult to achieve the 2nd HVL. The 1st and 2nd HVL from XCOMP5R agree with IAEA TRS457, therefore XCOMP5R can be used to predict additional filter required to obtain beam quality recommended by IAEATRS457. FWHM from spectrum calculation are showing discrepancy, it is because not all the spectrum follow Gaussian distribution while our calculation based on Gaussian distribution.
197
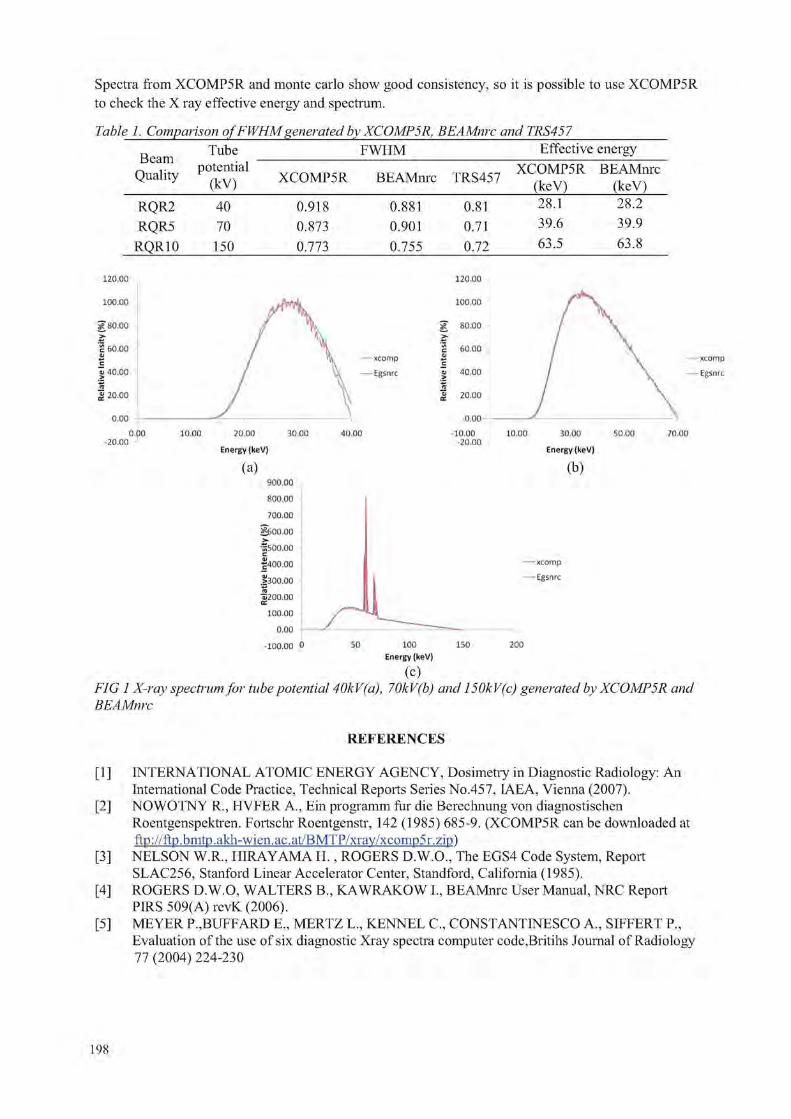
Spectra from XCOMP5R and monte carlo show good consistency, so it is possible to use XCOMP5R to check the X ray effective energy and spectrum.
Table 1. Comparison of FWHM generated by XCOMP 5R, BEAMnrc and TRS457
Beam Quality
Tube FWHM Effective energy Beam
Quality potential (kV) XCOMP5R BEAMnrc TRS457 XCOMP5R
(keV) BEAMnrc
(keV) RQR2 RQR5
RQRIO
40 70 150
0.918 0.873 0.773
0.881 0.901 0.755
0.81 0.71 0.72
28.1 39.6 63.5
28.2 39.9 63.8
0.00 -20.00
o.oo 10.00 20.00 30.00
Energy (keV)
(a) 900.00
800.00
700.00
§00.00 ••gsoo.oo c | 400 .00
1300.00 ra
Oj200.00 100.00
0.00 -100.00 0
-xcomp -Egsnrc
0.00 -10.00
-20.00 10.00 30.00 50.00
Energy(keV) (b)
-—xcomp — Egsnrc
50 150 200 100 Energy (keV)
(C) FIG 1 X-ray spectrum for tube potential 40kV(a), 70kV(b) and 150kV(c) generated by XCOMP5R and BEAMnrc
REFERENCES
[1 ] INTERNATIONAL ATOMIC ENERGY AGENCY, Dosimetry in Diagnostic Radiology: An International Code Practice, Technical Reports Series No.457, IAEA, Vienna (2007).
[2] NOWOTNY R., HVFER A., Ein programm fur die Berechnung von diagnostischen Roentgenspektren. Fortschr Roentgenstr, 142 (1985) 685-9. (XCOMP5R can be downloaded at ftp://ftp.bmtp. akh-wien.ac.at/BMTP/xray/xcomp5r.zip)
[3] NELSON W.R., HIRAYAMA H., ROGERS D.W.O.,"The EGS4 Code System, Report SLAC256, Stanford Linear Accelerator Center, Standford, California (1985).
[4] ROGERS D.W.O, WALTERS B„ KAWRAKOW I., BEAMnrc User Manual, NRC Report PIRS 509(A) revK (2006).
[5] MEYER P.,BUFFARD E„ MERTZ L„ KENNEL C„ CONSTANTINESCO A., SIFFERT P., Evaluation of the use of six diagnostic Xray spectra computer code,Britihs Journal of Radiology 77 (2004) 224-230
198
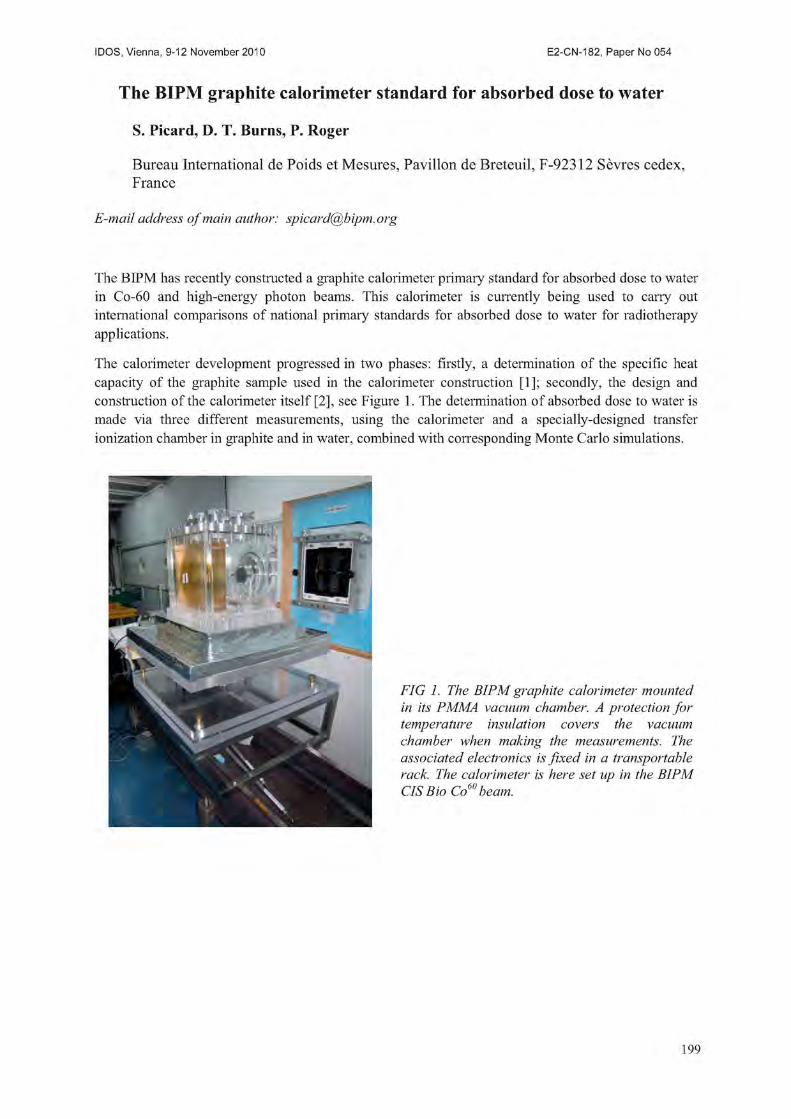
IDOS, Vienna, 9-12 November 2010 E2-CN-182, Paper No INV015
The BIPM graphite calorimeter standard for absorbed dose to water
S. Picard, D. T. Burns, P. Roger
Bureau International de Poids et Mesures, Pavilion de Breteuil, F-92312 Sevres cedex, France
E-mail address of main author: [email protected]
The BIPM has recently constructed a graphite calorimeter primary standard for absorbed dose to water in Co-60 and high-energy photon beams. This calorimeter is currently being used to carry out international comparisons of national primary standards for absorbed dose to water for radiotherapy applications.
The calorimeter development progressed in two phases: firstly, a determination of the specific heat capacity of the graphite sample used in the calorimeter construction [1]; secondly, the design and construction of the calorimeter itself [2], see Figure 1. The determination of absorbed dose to water is made via three different measurements, using the calorimeter and a specially-designed transfer ionization chamber in graphite and in water, combined with corresponding Monte Carlo simulations.
FIG 1. The BIPM graphite calorimeter mounted in its PMMA vacuum chamber. A protection for temperature insulation covers the vacuum chamber when making the measurements. The associated electronics is fixed in a transportable rack. The calorimeter is here set up in the BIPM CIS Bio Co6" beam.
199
The calorimeter is now in regular use in the BIPM Co-60 beam to determine the long-term reproducibility of the absorbed-dose determination. In 2008, the Accelerator Dosimetry Working Group of the CCRI(I) recommended a comparison of the dosimetry of accelerator beams at the national laboratories using the BIPM calorimeter [3]. The first comparison in this series took place at the NRC (Canada) in June 2009 [4], and comparisons have been carried out at the PTB (Germany) and NIST (USA) during 2010.
The paper gives a brief description of the method to determine the absorbed dose to water, concentrating on the novel conception of the calorimeter.
REFERENCES
[1] PICARD, S„ BURNS, D.T., ROGER, P., Determination of the Specific Heat Capacity of a Graphite Sample Using Absolute and Differential Methods, Metrologia 2007 44 294-302.
[2] PICARD, S„ BURNS, D.T., ROGER, P., Construction of an Absorbed-Dose Graphite Calorimeter, BIPM Sevres, 2009 Rapport BIPM-09/01.
[3] Key Comparison BIPM.RI(I)-K6: Calorimetric Comparison of Absorbed Dose to Water at High Energies, 2009, BIPM Sevres, Protocol 1.2 - CCRI(I).
[4] PICARD, S„ BURNS, D.T., ROGER, P., ALLISY-ROBERTS, P.J., McEWEN, M.R., COJOCARU, CD., ROSS, C.K., Key comparison BIPM.RI(I)-K6: Comparison of the standards for absorbed dose to water of the NRC and the BIPM for clinical accelerator beams (in preparation).
200

IDOS, Vienna, 9-12 November 2010 E2-CN-182, Paper No INV015
Establishment of reference radiation qualities for mammography at the BIPM
Kessler C., Burns D.T., Roger P. and Allisy-Roberts P.J.
Bureau International des Poids et Mesures
E-mail address of main author: [email protected]
Introduction
Low-energy x-ray key comparisons and calibrations have been carried out at the BIPM since 1966 in the range from 10 kV to 50 kV, using a tungsten-anode x-ray tube with Al beam filters. In 2001, the CCRI requested the BIPM to extend these activities to mammography, to meet the needs of the national metrology institutes (NMIs) for comparisons in this newly regulated domain and to provide SI traceable calibrations. The BIPM began this work by establishing a set of nine radiation qualities using the existing tungsten-anode x-ray tube with molybdenum and rhodium filters to simulate the radiation beams used in clinical mammography [1], The suitability of these simulated mammography x-ray qualities for the calibration of ionization chambers currently used in mammography was studied [2], In 2009, following the installation of a molybdenum-anode x-ray tube, four radiation qualities were established as reference beams for mammography comparisons and calibrations. A new primary standard for air kerma was constructed at the BIPM to be used for the dosimetry of these beams.
Irradiation facility and new radiation beams
The Mo-anode x-ray tube has been installed in the low-energy x-ray laboratory at the BIPM, sharing the facilities with the W-anode x-ray tube (high-voltage generator, voltage stabilization and anode current measuring system). The reference plane is 600 mm from the tube centre. Radiographic films were used for the study of the radiation field (size, shape and orientation). Horizontal and vertical radial profiles were measured using a thimble ionization chamber. Using the data from the radial profiles and the radiographic images, a system of two collimators was designed and machined in order to produce a uniform field 10 cm in diameter at the reference plane.
Following the advice of the NMIs, four radiation qualities were set up as reference beams for comparisons and calibrations. The characteristics of the beams are given in Table 1. The anode current for each quality was chosen to give an air-kerma rate of 2 mGy s 1 in the reference plane.
Table 1 Characteristics of the radiation qualities for mammography
Beam parameter Mo25
Radiatio
Mo28
n quality
Mo30 Mo35
Generating potential / kV 25 28 30 35
Additional filtration 30 jim Mo
Al half-value layer / mm 0.277 0.310 0.329 0.365
201

Measurement of energy spectra The photon energy spectra were measured using the Compton scattering method [1], The scattered photons were detected at 90° with a low-energy pure germanium detector coupled to a multichannel analyzer. The primary x-ray spectra were reconstructed from the resulting pulse-height distribution using commercial software [3].
Design and construction of a new standard
The new BIPM standard for mammography dosimetry is a parallel-plate free-air chamber designed to minimize the correction factors involved in the air-kerma determination between lOkV and 50 kV. The main characteristics are listed below: separation between the high-voltage plate and the collector: 70 mm; collector length, including half of the gap between collector and guard plate (0.5 mm): 15.537 mm; tungsten-alloy diaphragm diameter: 9.998 mm; collecting volume: 1219.8 mm ' ; attenuation length: 100 mm. Many of the correction factors for the standard required for the determination of KaiI were calculated using the Monte Carlo code PENELOPE [4] for mono-energetic photons from 2 kcV to 50 kcV in steps of 2 keV. A detailed simulation of the new BIPM standard was made using the PENELOPE geometry package PENGEOM. The results calculated for mono-energetic photons were convoluted with the spectra measured using the Compton spectrometer.
International comparisons
Comparisons with the NRC (Canada), NMIJ (Japan) and the NIST (USA) have been carried out using transfer chambers belonging to the NMIs; the standards of the NMIs and the BIPM compare favourably and the corresponding comparison resports are pending publication; the results will be available in the BIPM key comparison database of the CIPM MRA [5].
REFERENCES
[1] KESSLER C, 2006, Establishment of simulated mammography radiation qualities at the BIPM, Rapport BIPM-2006/08 8 pp.
[2] KESSLER, C„ BURNS, D.,T„ BUERMANN, L„ DE PREZ, L., Study of the response of ionization chambers to simulated mammography beams Rapport BIPM-2007/02 8 pp.
[3] MATSCHEKO G, Ribberfors R, 1989, A generalised algorithm for spectral reconstruction in Compton spectroscopy with corrections for coherent scattering, Phys. Med. Biol. 34 (1989) 835- 841.
[4] SAL VAT F, FERNANDEZ-VAREA J M, ACOSTA E, SEMPAU J, 2001, PENELOPE - A Code System for Monte Carlo Simulation of Electron and Photon Transport, NEA/NSC/DOC(2001)19 (ISBN 92- 64-18475-9).
[5] CIPM MRA: Mutual recognition of national measurement standards and of calibration and measurement certificates issued by national metrology institutes, International Committee for Weights and Measures, 1999, 45 pp. http://www.bipm.org/pdf/mra.pdf.
202

IDOS, Vienna, 9-12 November 2010 E2-CN-182, Paper No INV015
Stopping of 5-20 MeV protons in liquid water: Basic data for radiotherapy dosimetry
T. Siiskonen , H. Kettunei b, K. Perajarvf, A. .lavanainc: M. Rossib, W. Trzaska' , J. Turunen3, A. Virtanen
a STUK - Radiation and Nuclear Safety Authority, Helsinki, Finland
Department of Physics, University of Jyvaskyla, Finland
E-mail address of main author: [email protected]
Accurate proton stopping power data for water are required in many branches of radiation dosimetry. As an example, the dosimetry in proton radiotherapy is usually carried out relative to the 6cCo beam, in terms of absorbed dose to water. The calibration coefficient of an ionisation chamber for absorbed dose to water in a 60Co beam is converted to that in a proton beam via the beam quality correction factor /fyn.Q, as recommended by IAEA [1], As the dose is determined with the aid of an air-filled cavity ionisation chamber, the beam quality correction factor depends on the ratio of air and water stopping powers. According to IAEA, this ratio is the main source of uncertainty in the proton or heavy ion beam dosimetiy.
The experimental data on proton stopping powers in water are scarce or non-existent (above a few MeV in proton energy). The most recent data tabulation of International Commission on Radiation Units and Measurements (ICRU) [2] on proton stopping powers uses theoretical estimates above 0.5 MeV in proton energy. Recent investigations in the low-energy region (up to a few MeV) by other authors [3] have shed doubts on the accuracy of the widely-used stopping power data for water.
In this contribution we describe the measurement programme for determining the proton and, optionally, heavy ion stopping in liquid water at energies below 20 MeV per nucleon; this is the region where the stopping power models typically have the largest uncertainties. Our method is based on a time-of-flight transmission technique using microchannel plate (MCP) detectors. The major challenge with thin liquid targets in vacuum is to maintain the target as uniform as required by the desired experimental accuracy. Therefore, special emphasis was placed on the construction and the characterisation of the liquid target. The experiment was carried out at the accelerator laboratory of University of Jyvaskyla. To our knowledge this is the first measurement of proton stopping in liquid water at these energies. Final results from the actual stopping power experiment will be presented.
The target was made from two copper pieces. The target thickness was determined with calibration sheets made of steel. The gap between the copper pieces was filled with water. The nominal thickness of the water volume was 400 (am. The protons passed through the target via 3 mm diameter Havar windows (each with thickness of 2.15 (am). As the target was placed in vacuum, the water pressure caused a slight deformation of the Havar windows. Therefore, the thickness profile of the water volume at the position of the windows was measured with laser displacement sensors (Micro-Epsilon Ltd.) before and after the irradiation in vacuum. Using the described method the target thickness profile was obtained with less than 1% imprecision and less than 2% inaccuracy.
Two proton beam energies (13 MeV and 20 MeV) from the K130 cyclotron were used. Aluminium degraders with different thicknesses were used to reduce the proton energies so that the energy range from approximately 4.7 MeV to 20 MeV was covered in the experiment. Three MCP detectors were used to determine the proton flight times and, subsequently, energies before and after the target.
203
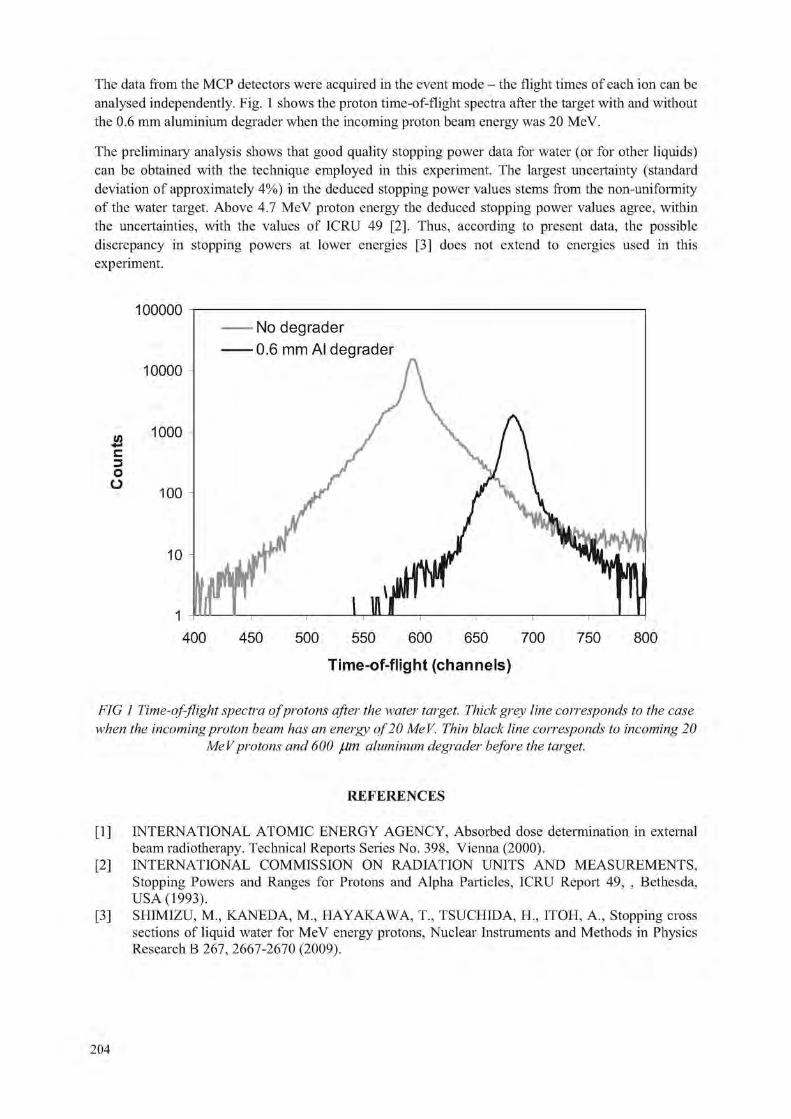
The data from the MCP detectors were acquired in the event mode - the flight times of each ion can be analysed independently. Fig. 1 shows the proton time-of-flight spectra after the target with and without the 0.6 mm aluminium degrader when the incoming proton beam energy was 20 MeV.
The preliminary analysis shows that good quality stopping power data for water (or for other liquids) can be obtained with the technique employed in this experiment. The largest uncertainty (standard deviation of approximately 4%) in the deduced stopping power values stems from the non-uniformity of the water target. Above 4.7 MeV proton energy the deduced stopping power values agree, within the uncertainties, with the values of ICRU 49 [2], Thus, according to present data, the possible discrepancy in stopping powers at lower energies [3] does not extend to energies used in this experiment.
Time-of-flight (channels)
FIG 1 Time-of-flight spectra of protons after the water target. Thick grey line corresponds to the case when the incoming proton beam has an energy of 20 MeV. Thin black line corresponds to incoming 20
MeV protons and 600 /Jm aluminum degrader before the target.
REFERENCES
[1] INTERNATIONAL ATOMIC ENERGY AGENCY, Absorbed dose determination in external beam radiotherapy. Technical Reports Series No. 398, Vienna (2000).
[2] INTERNATIONAL COMMISSION ON RADIATION UNITS AND MEASUREMENTS, Stopping Powers and Ranges for Protons and Alpha Particles, ICRU Report 49, , Bethesda, USA (1993).
[3] SHIMIZU, M.. KANEDA, M„ HAYAKAWA, T, TSUCHIDA, II, ITOH, A., Stopping cross sections of liquid water for MeV energy protons, Nuclear Instruments and Methods in Physics Research B 267, 2667-2670 (2009).
204

IDOS, Vienna, 9-12 November 2010 E2-CN-182, Paper No INV015
Brachytherapy calibration service at secondary standard dosimetry laboratory in Argentina
R. Pichio
National Atomic Energy Commission (CNEA), CAE, Buenos Aires, Argentina
Email address of main author: [email protected]
Regional Reference Center for Dosimetry (CRRD) belongs to Atomic Energy National Commission and it is located at Ezeiza Atomic Center. The CRRD has been carrying on calibration brachytherapy level since 2004. Brachytherapy level calibrations of sources and chamber-electrometers performed during last years at CRRD are presented in this work.
In Argentina, there are approximately 100 hospitals and clinics that are available to offer brachytherapy treatments, and the Nuclear Regulatory Authority is the institution that controls the state of brachytherapy sources.
The sources used for brachytherapy treatment are built in different shapes and they contain gamma radionuclide like 192 iridium, 125 iodine or 137 cesium and they are used for permanent or temporary implants in patients with cancer or vascular disease. The equipment used for the dosimetric controls of these sources is a well chamber (with holders) and electrometer. They have to be calibrated with secondary traceability to be sure that the calibration given by the manufacturer agrees with the air kerma strength determined at CRRD.
The reference equipment is formed by well chambers (with holders) and electrometers Standard Imaging Inc. HDR 1000 Plus model and MAX 4000 model, respectively. They were calibrated at Wisconsin Acreedited Dosimetry Calibration Laboratory for Amersham 125I seed 6711 model, 192Ir Varian HDR VS2000 model, Alfa-Omega and l37Cs tubes Amersham) Several intercomparations and follow up are done with a reference 3M 137Cs tube 6500/6D6C model. The coefficients air kerma strength given by ADCL 192Ir Varian HDR VS2000 model, Alfa-Omega NSK=4,642X105 Gy nt h'1 A'1
125I Amersham 6711 model NSK=2,2854X10¹¹ pGy m2 K1 A'1
137Cs Amersham tube N^=4,983X10" pGy m2 h'1 A'1
For calibrations chamber-electrometer (with holder) laboratory gives Nsk (calibration coefficient air kerma strength (20°C 101,325 kPa) and for sources gives Sk (air kerma strength) with percentage expanded uncertainties 3% for k=2. Calibrations are done according to protocols - instructions written at CRRD. No polarity or ion recombination corrections were done.
For "2Ir chamber-electrometer calibration the sensibility curve is obtained and polarity and ion recombination is checked. For 125I and 137Cs source calibration a leakage test is done and the charges are collected for two sources position (up and down) to take into a count the anisotropy in the geometiy, radioactive material deposition, and internal movements.
Calibrations were done in clinics and hospitals of Tucuman, Mendoza, Chaco, Santa Fe, Cordoba, Entre Rios, La Pampa and Buenos Aires province.
A total of 6 well chambers-electrometers, 120 137Cs tubes, 30 125I seeds (high and low activity for eyes tumor and for prostate, respectively) were calibrated.
205

Brachytherapy calibrations performed during last years was done for sources like seeds 1251 BACON Laboratory, Braquibac™ model, 137Cs tubes (Amersham CDC4, CDCSJ5, CDCSJ4, CDCSJ3, 6503, 6505 and 67-806 model, Therapeutics model 67-802) and during the last year started to calibrate well chamber and electrometer for 192Ir high dose rate (Nordion, Varian). Source used for this calibration was 192Ir ISODOSE CONTROL, Model: 0900001 and type: FLEXISOURCE IR I.
Instrumental calibrated during 2004-2010 were well chamber Cardinal Health Therapy Dosimeter, Sweet Spot Re-Entrant Ionization Chamber, Solydes, Nuclearlab, Standard Imaging HDR 1000 Plus. Some of them were sealed hermetically and the readings were not corrected by a factor associated to changes of pressure-temperature air.
Electrometers used for the calibration were Standard Imaging CDX-2000B, CDX and MAX 4000 model, PTW E UNIDOS, Cardinal, Keithley 35040 and Therapy Dosimeter 35617EBS Programmable Dosimeter.
Coefficient air kerm strength (NSk ) using 1 Tr HDR source were 4,683E+5 Gy m h"' A"1 and 4,635E+5 Gy nv h"1 A"' for equipments HDR 1000 Plus -CDX-2000B, 4,662E+5 Gy nrh"' A"' for HDR-Cardinal and 4,645E+5 Gy nrh"1 A"1 for HDR-PTW.
125 * 2 1 2 1
For " I seeds the values obtained for Skwere close to 6[.iGy nr h" and between (0,4 -2,4)(.iGy nr h" for high and low activity respectively. Nsk obtained were 3,637E+1 lf.iGy m2 h"1 A"1 for Nuclearlab -Keithely, 3,615E+ll[.iGy nrh"1 A"1 forNuclearlab-PTW, 1 J77E+13|iGy nrh"1 A"1 for Solydes-PTW, 2,329E+11 (.iGy m2 h"1 A"1 for HDR -Keithley prog, and 2,279E+11 uGy m2 h"1 A"1 for HDT- Cardinal. For 137Cs the values obtained for Skwere between 20-220(.iGy m2 h"1. Values ofNSkwere 4,916E+11 Gy m2 h"1 A'1 for HDR -CDX, 2,884E+11 Gy m2 h"1 A"1 for Nuclearlab - Keithley, 2,887E+11 Gy m2
h"1 A"1 for Nuclearlab -PTW, 5,018E+11 Gy m2 h"1 A"1 HDR-Keithley EBS, 4,986E+11 pGy m2 h"1 A"1
HDR- Cardinal.
Differences between air kerma strength found in certificates emitted by the manufacturer and the values given by the CRRD are in general below 3%. 4 cases were found with a difference of 20%. The coefficient air kerma strength was compared with the reference value (reference equipment) or Wisconsin certificate in the case that the equipment was calibrated there. Results agreed below 1%.
REFERENCES
[ 1 ] INTERNATIONAL ATOMIC ENERGY AGENCY, Calibration of Photon and Beta Ray Sources used in Brachytherapy: Guidelines on Standardized Procedures at Secondary Standards Dosimetry Laboratories (SSDLs) and Hospitals, IAEA-TECDOC-1274, Vienna (2002).
[2] MEGHZIFENE, A., et al., "Changes to the air kerma standard o the BIPM and Primary Standards Dosimetry Laboratories: Implications of IAEA calibrations to SSDL members", SSDL Newsletter 51, IAEA, Vienna (2005).
[3] ATTIX, F.H., Introduction to Radiological Physics and Radiation Dosimetry, John Wiley and Sons, USA, ISBN 0-471-01146-0, p 335 (1986).
206

IDOS, Vienna, 9-12 November 2010 E2-CN-182, Paper No INV015
Determination of the absorbed dose to water for I interstitial brachytherapy sources
T. Schneider, H.J. Selbach
Physikalisch-Technische Bundesanstalt (PTB), Braunschweig, Germany
E-mail address of main author: [email protected]
Dosimetry for low-energy interstitial brachytherapy sources is currently based on source calibrations in terms of the reference air-kerma rate (RAKR) or air-kerma strength (AKS). As patient dosimetry is based on the absorbed dose to water Z)w, a conversion formalism, as for example published by the American Association of Physicists in Medicine (AAPM), known as the TG-43 protocol [1] and its update (TG-43U1) [2], is required. The overall standard uncertainty in deriving Dw at a point near the source from RAKR or AKS using the protocol is estimated to be about 8 % (k=l). Deviations of 8 % between prescribed and applied doses have to be regarded as clinically significant. A direct calibration in terms of the absorbed dose to water would reduce this uncertainty.
A large, air-filled, parallel-plate extrapolation chamber in a phantom of water-equivalent material is under development for low energy photons as a primary standard for the realization of the absorbed dose to water [3]. The entrance and the back plate of the extrapolation chamber are made of a water-equivalent material (RWl) [4] with a measured density of 0.976 g/cm3. The thickness of the entrance plate (10.49 mm) defines the measurement depth within the water phantom (10.24 mm). Graphite was sprayed onto the inner side of the entrance plate. Biased at the potential U, this layer acts as the polarizing electrode and serves as the reference plane for the measurement. The back plate was chosen to be 60 mm in thickness. In front of the back plate, a polyethylene foil is located. A center collecting electrode and an outer guard ring - both at ground potential - are built, with this graphitized foil. The di ameter of the collecting electrode amounts to 100 mm.
The method of evaluation is described in [5]. It is based on a Monte Carlo-determined conversion factor C(Xi, xi+i) to be applied to the difference of the ionization charge for the two plate separations x, and Xj+i. In addition, the net energy fluence of the secondary electrons at the surface of the measuring volume must be taken into account. Both, this term and C(x;, xi+i) were calculated with the Monte Carlo simulation code EGSnrc [6], The spectra used in the calculation were obtained spectrometrically.
The first measurements of an 1-125 seed (BEBIG Symmetra 125.S06 [2]) with the chamber are presented in Fig. 1. The absorbed dose to water rate in the chamber determined at various plate separations is shown.
The results were compared to the results obtained by air-kerma rate measurements with the PTB primary standard chamber GROVEX I [7]. For the comparison, two different conversion formalisms will be applied to obtain additional information about their effect on the results: a) the formalism according to TG-43U1 and b) a direct conversion of the air-kerma rate determined with the GROVEX I to the absorbed dose to water rate in the new chamber by an MC-based conversion factor.
In the case of method a), a difference of 2.5 % was found and in the case of method b), a difference of 3.9 % was observed.
207

4 0 -
nGy/ s -
z 3 6 -
Q I z z 31
31
2 -
0- 1 1 1 1 1 1 1 1 1 1 1 i 1 1 i 1 i 0 20 40 60 80 100 120 140 m m 180
FIG.l. Absorbed dose to water rate determined in the new chamber at variours plate separations.
ACKNOWLEDGMENT
The research within this EURAMET joint research project leading to these results has received funding from the European Community's Seventh Framework Programme, ERA-NET Plus, under Grant Agreement No. 217257.
REFERENCES
[1] NATH R, ANDERSON L L, LUXTON G, WEAVER K A, WILLIAMSON J F AND MEIGOONI A S (1995) Dosimetry of interstitial brachytherapy sources: Recommendations of the AAPM Radiation Therapy Committee Task Group No 43 Med. Phys. 22 209-34
[2] RIVARD M J; COURSEY B M; DEWERD L A; HANSON W F; HUQ M S; IBBOTT G S; MITCH M G; NATH R; WILLIAMSON J F (2004) Update of AAPM Task Group No. 43 Report: A revised AAPM protocol for brachytherapy dose calculations. Med. Phys.;31 (3):633-74.
[3] SCHNEIDER T„ LANGE B„ MEIER M„ TAGTMEYER L„ SELBACH H. J. (2008) A new device for the measurement of the absorbed dose to wa-ter for low-energy x-rays and low dose-rate brachytherapy sources. Radiotherapy and Oncology: 22, Suppl. 2, S480
[4] HERMANN IC -P, GEWORSKI L, MUTH M and HARDER D (1985) Polyethylene-based water-equivalent phantom material for X-ray dosimetry at tube voltages from 10 to 100 kV. Phys. Med. Biol. 30: 1195-1200
[5] SCHNEIDER T, A method to determine the water kerma in a phantom for X-rays with energies up to 40 keV, (2009) Metrologia: 46 95-100.
[6] KAWRAKOW I, MAINEGRA-HING E, ROGERS D W O, TESSIER F AND WALTERS B.R.B.2010 The EGSnrc code system: Monte Carlo simulation of electron and photon transport Report PIRS-701 (Ottawa: National Research Council of Canada (NRCC)) (http://www.irs.inms.nrc.ca/ inms/irs/EGSnrc)
[7] SELBACH H-J, KRAMER, H-M, CULBERSON, W S 2008 Realization of reference air-kerma rate for low-energy photon sources Metrol. 45 422-428
208
IDOS, Vienna, 9-12 November 2010 E2-CN-182, Paper No INV015
AFRIMETS working together with AFRA and the IAEA promoting quality dosimetry and sustainability in the region
Z. L. M. Msimang
National Metrology Institutes of South Africa (NMISA), Pretoria, South Africa
E-mail address of main author: [email protected]
A Mutual Recognition Arrangement (MRA) was signed at a meeting held in Paris in 1999 by the directors of the national metrology institutes (NMI's) and representatives of two international organisations. This MRA was a response to a growing need for an open, transparent and comprehensive scheme to give users reliable quantitative information on the comparability of national metrology services and to provide the technical basis for wider agreements negotiated for international trade, commerce and regulatory affairs [1], It provides for the mutual recognition of national measurement standards and of calibration and measurement certificates issued by national metrology institutes, and is founded on the efforts of each individual national metrology institute to base its measurements and measurement uncertainties on SI units.
The arrangement is in two parts and the NMI's can choose to sign one or both. Through part one, signatories recognize the degree of equivalence of national measurement standards of participating NMI's; through part two, the signatories recognize the validity of calibration and measurement certificates issued by participating institutes.The NMI's that are signatory to the MRA agree to put in place structures that are appropriate within their regional metrology organisations (RMO's) [1], This is so that the RMO's may make proposals to the International Committee for Weights and Measures (CIPM) Consultative Committees on the choice of key comparisons, cany out the RMO key comparisons, participate in the Joint Committee of the Regional Metrology Organisations and the BIPM (JCRB), carry out supplementary comparisons and other actions designed to support mutual confidence in the validity of calibration and measurement certificates issued by participating institutes.
The idea of a greater African metrology system was conceptualised in 2004-2005 and AFRIMETS was established during 2006-2007. The Inaugural General Assembly (GA) meeting was held at the premises of the New Partnership for Africa's Development (NEPAD) in July 2007 where the Memorandum of Understanding was finalised and subsequently signed by representatives from bodies representing their official metrology institutes from 38 African countries. The second and third General assemblies were held in 2008 and 2009. The third GA was preceded by the working group meetings including the working group for ionising radiation. The main goal of AFRIMETS is to harmonise accurate measurements in Africa, establish new measurement facilities and gain international acceptance for all measurements. It is also envisaged that AFRIMETS will promote Africa's metrology interests and its effective participation in international standard-setting bodies. AFRIMETS replaced SADCMET as a Regional Metrology Organisations (RMO) representing Africa at the JCRB. One of the tasks of the JCRB is to coordinate the activities among the RMO's in establishing confidence for the recognition of calibration and measurement capabilities (CMC), according to the terms of the CIPM MRA [1],
National Metrology Institutes outside Africa, designated institutes in Africa, and other institutes in Africa responsible for accurate measurement can become associate members. Other organisations can have observer member status. Most ionising radiation laboratories in the region were set up with the help of the IAEA and are not within national metrology institutes. Some are members of the IAEA/WHO Secondary Standard Dosimetry Laboratory (SSDL) network and some countries are
209

members of the African Regional Cooperative Agreement (AFRA). AFRA is an intergovernmental agreement established in 1990 by the IAEA and African Member States to further strengthen and enlarge the contribution of nuclear science and technology to socioeconomic development on the African continent. The IAEA is not party to AFRA, but provides technical and scientific backstopping as well as financial and administrative support, in accordance with the rules and procedures governing the provision of technical assistance to its Member States.
A process to recognize Regional Designated Centres (RDCs) was initiated to cater to the needs of Members. In the context of AFRA, RDCs are defined as an established African institution able to provide multinational services. AFRA Member States apply a rigorous process to recognize RDCs. As of June 2009, 11 institutions have been recognized by the AFRA Member States as Regional Designated Centres in various fields of activity.
There are different organisations investing money into the Africa region to help governments set up institutes for different measurement needs for trade, health, regulatory etc. AFRA, Afrimets and IAEA working together will ensure harmonization of the work within the region with that of other organizations and help to ensure the relevance and impact of projects. This will also decrease the double funding for same kind of projects. The plans of the technical working group of ionising radiation including intercomparisons, proficiency testing schemes, intra and inter-regional CMC review process will be presented.
REFERENCES
[1] BUREAU INTERNATIONAL DES POIDS ET MESURES BIPM International Committee of Weights and Measures, Mutual recognition of national measurement standards and of calibration and measurement certificates issued by national metrology institutes, http://www.bipm. org/en/ cipm-mra/.
[2] INTER-AFRICA METROLOGY SYSTEM (AFRIMETS) Memorandum of understanding (MOU), rev 06, July 2007.
[3] INTERNATIONAL ATOMIC ENERGY AGENCY, M. Edwerd, Development of a Continent, IAEA Bulletin 51-1, September 2009.
210
IDOS, Vienna, 9-12 November 2010 E2-CN-182, Paper No INV015
Development of a primary standard in terms of absorbed dose to water for 25I brachytherapy seeds
I. Aubineau-Laniecea, P. Avilcs-I.ucas , J.M. Bordya, B, Chauvenet", D. Cutarella", J. Gourioua, J. Plagnarda
aCEA, LIST, Laboratoire National Henri Becquerel, 91191 Gif-sur-Yvette Cedex, France
bLMRI, CIEMAT. Avd. Complutense 22. Madrid 28040. Spain
E-mail address of main author: [email protected]
No primary standards for low dose rate (LDR) brachytherapy seeds are nowadays established for calibration in terms of absorbed dose to water. However, water is the reference medium for radiotherapy. Thus the absorbed dose to water is at the moment indirectly derived from the reference air kerma rate [1] using the conversion dose rate constants tabulated by the American Association of Physicists in Medicine [2]. The LNE-LNHB, under the European project "Increasing cancer treatment efficacy using 3D Brachytherapy", is developing and investigating a method to directly determine the absorbed dose to water of iodine-125 seeds used for treatment of ophthalmic and prostatic cancers. The fundamental outcome of this project is to reduce the current uncertainty on the absorbed dose delivered to the tumour to a level comparable to that associated to typical external beam radiotherapy procedures performed with accelerators (5 %, k=l).
The LNE-LNHB proposal for the LDR primary standard is based on measurements using a free-in-air ionization chamber. A two-step procedure is being established which will overcome practical difficulties encountered when measuring directly the absorbed dose to water for LDR brachytherapy sources. The LNE-LNHB methodology lies in the determination of the water kerma rate Ku V(1 cm,90°), at the surface, S, of a 1 cm radius water-equivalent spherical phantom placed in air and containing the LDR seed in its centre. This quantity is measured in the plane passing through the seed centre and perpendicular to its longitudinal axis. A correction factor is applied to account for the contribution of scattered photons arising when having water instead of air as surrounding medium [3],
A free-in-air circular ring-shaped ionization chamber and a photon spectrometer are used for the measurements. Monte Carlo simulations of the radiation transport are performed for the calculations required.
This paper describes the LNE-LNHB approach and presents the results obtained up to now.
211

REFERENCES
[1] INTERNATIONAL COMMISSION ON RADIATION UNITS AND MEASUREMENTS (ICRU) 1985, Dose and Volume specification for reporting intracavitary therapy in gynecology ICRU Report NO. 38 (Washington, DC: ICRU)
[2] RIVARD, M. J. et al, Update of AAPM Task Group No. 43 Report: A revised AAPM protocol for brachytheray dose calculations, Med. Phys. 31 (3) 2004.
[3] AUBINEAU-LANIECE, I. et al, "Absorbed dose reference for LDR brachytherapy -the LNE-LNHB approach", 14°"'° congres international de metrologie, Paris (France), juin 2009 (CD N°ISBN: 2-915416-08-7).
212
IDOS, Vienna, 9-12 November 2010 E2-CN-182, Paper No INV015
Improved calibration and measurement capabilities in terms of absorbed dose to water for 60Co gamma rays at Cuban SSDL
S. Gutierrez Lores, G. Walwyn Salas, M. Lopez Rodriguez
Center for Radiation Protection and Hygiene, Havana, Cuba
E-mail address of main author: [email protected]
A new set-up for the calibration of ionization chamber in terms of absorbed dose to water in a 60Co beam at Cuban SSDL was used as part of the normal service. Under IAEA Technical Co-operation Project CUB6017 "Quality Assurance in Measurements and Calibration for New Medical Technologies in Cuba" a stationary water phantom 41023 for horizontal beams and five different waterproof acrylic adapters were acquired. The major goal is to extend the calibration services provided by Cuban laboratory to other types of ionization chambers used in clinical dosimetry and to improve the reproducibility on the way to position phantom. For this purpose a metallic box with three holes on their base for to assure the phantom in a fixed and only position was constructed. The new set-up for the calibration of ionization chamber in terms of absorbed dose to water in a "°Co beam at Cuban SSDL is show figure 1.
The calibration at the Cuban SSDL was performed by using the Secondary Reference Standard chamber NE-2561 (serial number 323), which was calibrated at IAEA Dosimetry Laboratory. The calibration coefficient (NDw = 103.4 ±1.0 mGy/nC), established at the conditions T = 20.0 °C- and P = 101.325kPa (Calibration certificate CUB/2008/03) is thus traceable to BIPM. The Secondary Standard is only used for to calibrate two working standards instruments and to determine the absorbed dose rate of a Therathron Phoenix-20 f "Co unit. The ionization current was measured with a UNIDOSweblme
T10022 and serial number 0023 which had been calibrated at PTW- Freiburg in 2008. The two working standards calibrated against the Secondaiy Reference Standard were NE-2581 (serial number 797) used for routine calibrations of user instruments and NE-2571 (serial number 1881) used for to participate in bilateral comparisons or IAEA comparison programme. The calibrations were carried out with the geometrical axis of the chambers situated at a depth of 5 g/cnr using a waterproof acrylic adapter suitable. The source to the surface of the phantom distance (SSD) was 80 cm and the field size at the distance was 10 cm x 10 cm. The chambers were calibrated in terms of absorbed dose to water using the substitution method [1, 2], According to this method, the working chamber is placed at the reference point in the beam and a set of readings are taken, leading to the mean reading Mref. It is then, replaced by the chamber to be calibrated and a similar set of readings are taken, the calibration coefficient ND)W is given by:
Where Dw is the absorbed dose to water, determined by the working chamber and Mucoir is the
corrected reading of the chamber to be calibrated. According to the IAEA code of practice TRS-398 [3], the absorbed dose to water, Dw, is determined according to:
COIT (1)
Dw=M--NZA2)
213

Where N'ni is the absorbed dose to water calibration coefficient of the reference chamber obtained ' D,w from the Cuban laboratory reference chamber and M™" its reading corrected for temperature and
pressure according to the following equation:
(275.15 + T) 101.325 K7 = Mref
293.15 (3)
T and P are respectively the temperature in ° C and the pressure in kPa. The temperature and pressure are measured with a Thomen Meteo Station HM30 electronic thermometer inserted in water phantom and a PTB220A digital barometric pressure respectively. Both equipments by the same project CUB6017 were acquired. The absorbed dose to water calibration coefficient of the calibrated ionization chambers is thus given by:
N = Mcmr D,w ref
Nref
1 v D,w Mcorr
(4)
Six different models of commercially available ionization chambers were calibrated by using the new set up, which included 12 chambers from 4 national radiotherapy centres. The characteristics of these chambers are shown in table 1. The results of the coefficient calibration obtained by using the new set-up shown variations less to 1%, compared with set-up of calibration previously installed at Cuban SSDL. The absorbed dose rate obtained by using the new set-up is 0.2% lower than rather previous. With the new set-up the Cuban SSDL is able for to calibrate ionization chamber as such as: like
FIG 1 Set-up for the calibration of ionization chambers in terms of absorbed dose to water in a Co beam at Cuban SSDL.
Parameters Ionization chambers type Parameters PTW30001 PTW30004 PTW31002 PTW31010 PTW30013 PTW34001
Cavity
volume (cmJ) 0.6 0.6
0.125 0.125 0.6 0.35
Cavity length (mm) 23 23
6.5 6.5 23 depth 2 Cavity
radius (mm) 3.1 3.1
2.75 2.75 3.1 7.5
Wall Material
PMMA Graphite PMMA, Graphite
PMMA, Graphite
PMMA, Graphite
PMMA, Varnish Wall
Thickness (g cm"") 0.045 0.079
0.078 0.078 0.056 0.132
Central electrode material Al Al
Al Al Al —
Waterproof No No Yes Yes Yes Yes
Polarizing voltage (V)
+ 400 + 400 + 400 + 400 + 400 + 100
Number of calibrated chambers
4 2 2 1 2 1
Table 1: Characteristics of the cylindrical ionization chambers used in the present report
214

IDOS, Vienna, 9-12 November 2010 E2-CN-182, Paper No INV015
Establishment of calorimetry based absorbed dose standard for newly installed Elekta Synergy accelerator at ARPANSA
G. Ramanathan, P. Harty, J. Lye, C. Oliver, D. Butler and D. Webb
Australian Radiation Protection and Nuclear Safety Agency, Australia
E-mail address of main author: [email protected]
An Elekta Synergy Linear Accelerator providing 7 photon energies from 4 MeV to 25 MeV and 10 elecron energies from 4MeV to 22 MeV was installed at the beginning of 2009 to provide calibration services to radiotherapy centres in the country.This accelerator is similar to the one that has been installed at NPL around the same time. After the acceptance testing and commissioning, calorimetry measurements of the photon beams at nominal energies of 6 MeV, 10 MeV and 18 MeV to establish the Australian Primary standard of absorbed dose have been done. This paper brings out the details of the measurements and the results of a bilateral intercomparison done with NPL.
A graphite calorimeter procured from BEV, Austria has been established as primary standard in the '90s at the 60Co energy [1] and a similar calorimeter loaned by IAEA has been compared giving good agreement in measurements with a 60Co source at ARPANSA[2]. The IAEA calorimeter has been found to have better stability through a good medium control against the ambient temperature variations. This calorimeter has been used for measurements with the photon beams from the accelerator.
Before the actual measurements, a study of the stability of thermistors and the electronic heater control circuitries was done through a series of electrical calibrations. The elecrical calibration factor which gives the energy required to produce a fractional resistance change of the core thermistor has been found to have a constant value of -230 mJ/%R with a standard deviation of 0.4% similar to other results published for this type of calorimeter.
The photon beams from the accelerator have an initial ramping dose-rate for 1-2 seconds before stabilising to a near constant value. Figure 1 shows the dose-rate profiles obtained through the output of the monitor chamber located inside the head of the accelerator.The dose-rate variations are corrected in the data analysis program written in Matlab software.
Calorimetry measurements have been done in both quasi-adiabatic and quasi-isothermal modes. In the quasi-isothermal mode initially all the three bodies of the calorimeter (core, jacket and shield) are raised in temperatures with constant heating rates calculated based on the dose-rate obtained through the quasi-adiabatic mode. At the end of the heating period the radiation beam is brought on and the heaters switched off. Similarly at the end of the radiation run the heaters are switched on again to continue heating. The switching off/on of the heaters with radiation beam on/off is being done through a specially designed electronic circuit triggered by the output pulses from the monitor chamber.This has helped in reducing the uncertainties and improving the consistency of repeated measurements.
215

soo
7NN
600
V) •TZ 5 0 0 c 3 O 4 0 0 -4-1 'c
^ aoo
200
100
0
FIG. 1. Profiles of monitor output at 6,10 and 18 MV photon beams
Conversion of graphite absorbed dose to water absorbed dose is done through calorimetry, measurements of ionisation current in a graphite-walled chamber in a graphite phantom similar to the calorimeter and chamber measurements in a water tank all at the same distance. The conversion makes use of Monte-Carlo calculated doses in the graphite and water.
Gap correction for the calorimeter is calculated using EGSnrc and the correction factor for radial non-uniformity is evaluated through beam profile measurements moving a thimble chamber mounted in a graphite phantom similar in construction to the calorimeter.
As part of a bilateral intercomparison of accelerator measurements a graphite walled chamber was taken to NPL, U.K and was calibrated in their photon beams. The NPL-calibrated chamber was calibrated at ARPANSA against the IAEA calorimeter and the results of this intercomparison are presented here.
REFERENCES
[1 ] HUNTLEY R.B., WISE K.N and BOAS J.F., The Australian Standard of absorbed dose Proceedings of NPL Workshop on recent advances in calorimetric absorbed dose standards:workshop held December 8-10, 1999, NPL Report CIRM 42, 37 to 46.
[2] RAMANATHAN Ci„ WEBB D.V., BUTLER D.J., OLIVER CP.. The comparison of the ARPANSA and IAEA-K4 graphite calorimeters for the measurement of absorbed dose from 60Co, Paper presented at Workshop on "Absorbed Dose and Air Kerma Primary Standards" Paris, 9-11 May, 2007
Monitor Output
c - 6 M V
- 1 0 M V
1 8 MV
2 0 3 0 41) SO
T i m e in s e c o n d s
216

IDOS, Vienna, 9-12 November 2010 E2-CN-182, Paper No INV015
Absorbed dose to water secondary standard for brachytherapy sources in Austria
F. Gabris, A. Steurer, R. Brettner-Messler
BEV - Bundesamt fuer Eich- und Vermessungswesen, Vienna, Austria
E-mail address of main author: [email protected]
In a frame of a joint research project within the European Association of National Metrology Institutes (EURAMET e.V.) "T2.J06, Increasing cancer treatment efficacy using 3D brachytherapy" aiming to establish across the Europe a more accurate metrological basis for the dosimetry of radioactive sources used in the clinic for Brachytherapy (BT) treatment [1],
It leads to the necessity to create suitable metrology chain for traceability of absorbed dose measurements of BT radiation sources to absorbed dose to water primary and secondaiy standards. The absorbed dose to water, Dw, is the quantity of interest for dosimetry in radiotherapy - but no absorbed-dose-to-water primary standards are so far available for dosimetry of BT sources and following secondaiy' standards are also not used [2], Currently, the procedures to determine from the existing standards the absorbed dose imparted to the patient are affected by an uncertainty that could reduce the cure rate [3]. A significant fraction of this uncertainty is due to a lack of metrology.
During first three years of the project run it was created one of the first primary standards of absorbed dose to water, Dw quantity at the PTB Germany - the water calorimeter [4]. BEV Austria as the national metrology institute has developed its absorbed dose to water secondary standard on a base of well type ionizing chamber and the current measuring system with made measuring software to optimize measuring process and to minimize possible subject mistake. All needed metrology characteristics of the standard were stated by measurements, Monte-Carlo simulation calculation has been done as well. First Dw quantity calibration for BT source wTr was realized at the PTB primary laboratory this spring and the BEV secondaiy standard is now able to serve to hospitals with the calibration of their measuring instruments. Details of the BEV Dw quantity secondary standard will be described as well as the result of the calibration.
Second output of the project in Austria is the development and construction of the measuring system for scanning of in the practice used BT sources to measure their real distribution of the absorbed dose to water in short distances of about 1,5 cm from the source axis. The aim is check them for homogeneity and isotropy. Measuring system based on the set of five IBA Dosimetiy CC08 ionizing chambers placed inside the water phantom and moved around the source axis as well as some real measurements results will be presented and discussed.
Finally the third problem solution - how to effectively check outputs of the therapy planning systems by measurements - will be presented. As an effective tool was IBA 2D Detector Matrixx used and results of measurements will be discussed.
217
REFERENCES
[1] M.P. TOM, I. ALJBINEAU-LANIECE, M. BOVI, J. CARDOSO, D. CUTARELLA, F. GABRIS, J.E.GRINDBORG, A.S. GUERRA1, H. JARVINEN, C. OLIVEIRA, M. PIMPINELLA, J. PLAGNARD, T. SANDER, H.J. SELBACH, V. SOCHOR, J. SOLC, J. DE POOTER AND E. VAN DIJK, A Joint Research Project to improve the accuracy in dosimetry of brachytherapy treatments, in the framework of the European Metrology Research Programme http:A'www.euramet.org/'index.php?eID=tx_nawsecuredl&u=0&file=fdeadmin/docs/EM RP/JR P/iMERA-plus JRPs 2010-06-22/T2J06.pdf&t=1282638486&hash=0484e4efaa077530735390e97719212e
[2] M. J. RIVARD, B. M. COURSEY, L. A. DEWERD, W. F. HANSON, M. SAIFUL HUQ, G. S. IBBOTT, M. G. MITCH, R. NATH, J. F. WILLIAMSON, Update of AAPM Task Group No.43 Report: A revised AAPM protocol for brachytherapy dose calculations, Med. Phys. 31 (3) 2004
[3] MARIA PIA TONI, et.al., Absorbed Dose to Water Primary Standards for Brachytherapy, ESTRO Quarterly Newsletter, #76, Summer 2010, Page 26
[4] PHYSIKALISCH-TECHNISCHE BUNDESANSTALT (PTB), Scientific news from Division 6 „Ionising Radiation", Calorimetric determination of the absorbed dose to water in the near field of ir brachytherapy sources:, https://www.ptb.dc/en/oru/6/nachrichtcn6/2008/pdf7'61 Q08_cn.pdf
218

IDOS, Vienna, 9-12 November 2010 E2-CN-182, Paper No INV015
The Belgian laboratory for standard dosimetry calibrations used in radiotherapy
L.C. Mihailescua, A.L. Lebacqa, H.Thierensb, F. Vanhaverea
a Radiation Protection Dosimetry and Calibrations expert group (RDC), SCIOCEiN (Studiecentrum voor Kernenergie - Centre d'Etude de l'Encrgic Nucleaire), Boeretang 200, B-2400, Mol
Department of Medical Physics, Ghent University, Proeftuinstraat 86, B-9000, Ghent
E-mail address of main author: lmihaile@sckcen. be
Abstract. Starting from the end of the year 2008, the RDC (Radiation Protection dosimetry and Calibrations) expertise group of SCK'CHN took over the calibration and research activities at the Laboratory for Standard Dosimetry Ghent. The laboratory runs under a collaboration between SCK'CHN and the University of Ghent, with the support of Federal Agency for Nuclear Control (FANC).
The calibrations in Ghent were stopped at the beginning of 2008 and then restarted at the end of 2008. A new ' °Co source was installed at Ghent, a Theratron 780 unit. All the calibration setups installed in the past to the old °''Co source had to move to the new source and measurement history had to be acquired.The calibration of cylindrical and plane-parallel ionization chambers in terms of absorbed dose to water was defined as the first priority, since there was an urgent need from the Belgian hospitals. These calibrations are presently done in Ghent as secondary standard calibrations, traceable to the water calorimeter of VSL, Delft, The Netherlands and following the recomandations from TRS-398 protocol [1], The second priority was restarting the calibrations of cylindrical ionization chambers in terms of air kerma. A cylindrical graphite ionization chamber of type CC-01 is used for the absolute measurement of air kerma. Both setups are fully operational.
Special efforts were done to implement the SCK'CHN quality assurance (QA) system regarding ISO 17025 accreditation. The activity at the laboratory in Ghent was integrated as part of the Haboratory for Nuclear Calibrations (ENK -from the Dutch translation) of the SCK-CEN. Most of the activities of the LNK are already accredited by Belgian Accreditation Body (BEHAC) with respect to the ISO-17025 standards. The quality assurance procedures were prepared and are routineley followed for the two new setups mentioned above: calibrations in terms of absorbed dose to water and air kerma in 60Co beam.
During the preparation of the qaulity assurance procedures detailed tests were performed for both setups. Considering that the f Co source was recently installed at Ghent, meausrements were done to investigate the beam properties and the effect of the collimator. The theoretical dependence of the dose rate as a function of the source to chamber distance was verify and no significant effect of the scattering was observed. The beam profile was measured both with EBT films and with NE2571 chambers. A constant profile was observed. The dependence of the dose rate on the depth to water was also measured for the setup used for calibrations in terms of absorbed dose to water. Repeatability and stability of the setups in time were also investigated. All tests that were perfomed were used for a detailed estimation of the calibration uncertainties. The total expanded uncertainty for the calibrations factors was estimated at 1.3% for ND>W and at 0.8% for NK (for k=2 or 95% confidence level). The dominant component of uncertainty budget for NDjW is the uncertainty on the calibration factor of the secondary standards (NE2571 chambers) as provided by the primary laboratory.
219

The two calibration setups from above were already used for two intercomparisons organised by IAEA for secondary standard dosimetry laboratories: the IAEA/WHO TLD postal dose audit for radiotherapy level calibrations SSDL run 2009 and IAEA/SSDL Intercomparison of therapy level ionization chamber calibration factors run 2009.
Work is in progress for the refurbishment of the water calorimeter that had been used in Ghent as primary standard for absorbed dose to water [2]. The decision was taken to restart the calorimeter measurements at Ghent. Due to its old components the calorimeter has to be refurbished and its correction factors re-estimated.
REFERENCES
[1] INTERNATIONAL ATOMIC ENERGY AGENCY, "Absorbed Dose Determination in External Beam Radiotherapy: An International Code of Practice for Dosimetry based on Standards of Absorbed Dose to Water", Technical Report Series 398 (Vienna IAEA) 2000
[2] J. SEUNTJENS, H. PALMANS - Correction factors and performances of a 4°C sealed water calorimeter - Phys. Med. Biol. 44 (1999) 627-646
220
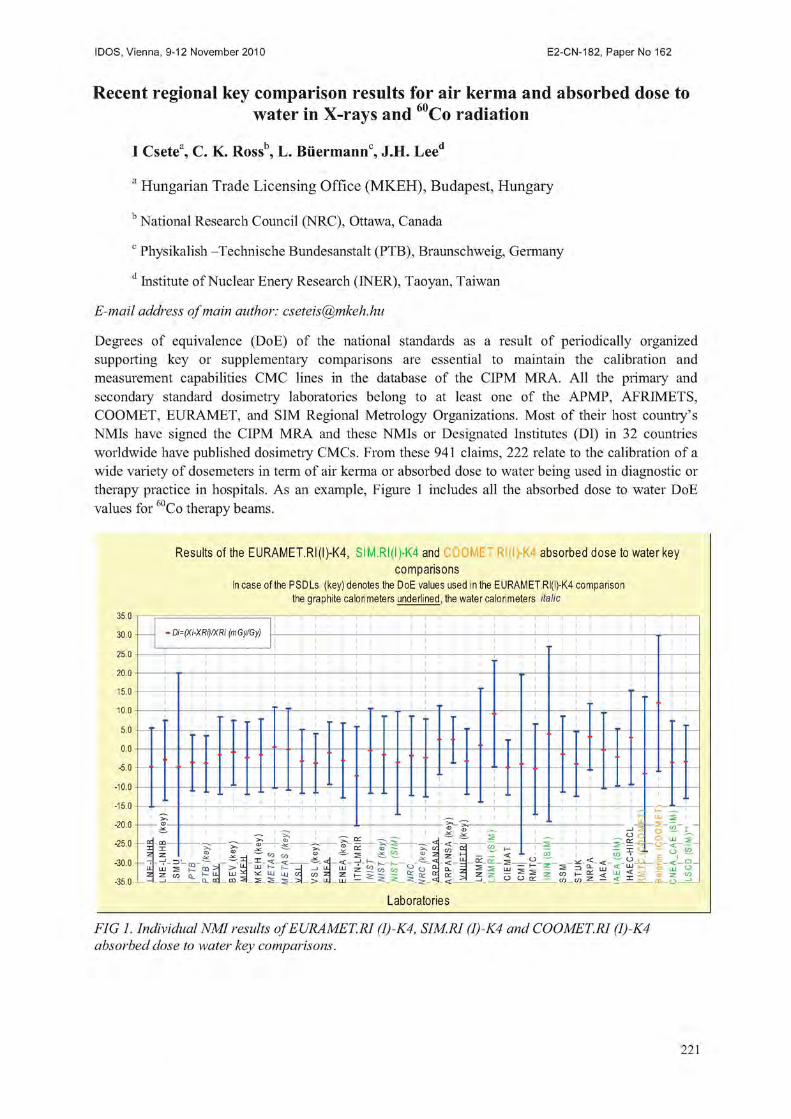
IDOS, Vienna, 9-12 November 2010 E2-CN-182, Paper No INV015
Recent regional key comparison results for air kerma and absorbed dose to water in X-rays and Co radiation
I Csete3, C. K. Rossb, L, Biiermannc, J.H. Leea
a Hungarian Trade Licensing Office (MKEH), Budapest, Hungary
b National Research Council (NRC), Ottawa, Canada c Physikalish -Technische Bundesanstalt (PTB), Braunschweig, Germany d Institute of Nuclear Enery Research (INER), Taoyan, Taiwan
E-mail address of main author: [email protected]
Degrees of equivalence (DoE) of the national standards as a result of periodically organized supporting key or supplementary comparisons are essential to maintain the calibration and measurement capabilities CMC lines in the database of the CIPM MRA. All the primary and secondaiy' standard dosimetry laboratories belong to at least one of the APMP, AFRIMETS, COOMET, EURAMET, and SIM Regional Metrology Organizations. Most of their host country's NMIs have signed the CIPM MRA and these NMIs or Designated Institutes (DI) in 32 countries worldwide have published dosimetry CMC's. From these 941 claims, 222 relate to the calibration of a wide variety of dosemeters in term of air kerma or absorbed dose to water being used in diagnostic or therapy practice in hospitals. As an example, Figure 1 includes all the absorbed dose to water DoE values for C o therapy beams.
Results of the EURAMET.RI(I)-K4, SIM.RI(I)-K4 and absorbed dose to water key comparisons
In case of the PSDLs (key) denotes the DoE values used In the EURAMET Rl(l)-K4 compar ison the graphite calorimeters underlined, the water calorimeters italic
3 b . U - Di=(Xi-XRi)/XRi (mGy/Gy) - Di=(Xi-XRi)/XRi (mGy/Gy)
-
-
• • 1 •
20.0 * I I ^ I I LU 2 20.0 1 * > ! ? 1 — 1 l(
ke
S
IM).
c ~ i i i — a
C C
5 52. LU 2
— O W 30.0
35 0 -
i JZ 1 is i 1 -ic CO CO
~ a: qj — i ^ cr. c S - g ^ co^ i ® z <*• —1 r - <
« 2 5 H
to 1— — — < OL a-
- - E Q co co • « ~ v < ^ — O .
5 52. LU 2
— O W 30.0
35 0 -LL 2
LL 2
S K . OQ > > s 1XJ
_ m S
LLJ K - h i _ ^ u j UJ a
__l LL c o z
— > - U -
LLI Z SO ^ m t : i S £ ;
- < —
s 3 LLi 5 t S => S 11] < % LiJ CJ z z G n l z m - S < y 5 Z m O O en tn tn Z — <
Laboratories
FIG 1. Individual NMI results of EURAMET.R1 (I)-K4, SIMM (I)-K4 and COOMET.RI (I)-K4 absorbed dose to water key comparisons.
221

In the case of low and medium energy X-ray beam qualities, one regional key comparison (APMP.RI (I)-K3) has been published and has some results that do not fully support the stated uncertainties of the participants. The other two similar comparisons (APMP.RI (I)-K-2, SIM.RI (I)-K-2) are still ongoing. For air kerma of the 60Co beam from the APMP.RI(I)-K1, SIM.RI(I)-K1 and EURAMET ,RI(I)-K1 comparisons there are two results among the twenty-one recently established DoE values that is outside the expanded uncertainty.
Further technical details of regional comparisons including the stated uncertainty budgets for the calibration of a typical therapy ionization chamber will be presented in the poster.
Concerning the future regional key and supplementary comparison program the most important issues are the following:
• encourage the dosimetry laboratories to organise and coordinate these comparisons,
• more economic arrangement of the X-ray comparisons on the basis of the generic beam qualities of the 85 standard qualities,
• organization of supplementary comparisons in term of air kerma length to support the CT dose measurements
• using dedicated mammography X-ray tube for air kerma comparisons of mammography beam qualities,
• new comparisons involving the radiation of the brachytherapy sources in terms of absorbed dose to water in the vici nity of the seeds,
• new Dw comparisons for high energy accelerator beams to have more information about the different high energy accelerator beams
REFERENCES
[1] BIPM, (2010) The BIPM key comparison database, http://kcdb.bipm.org
[2] ALLISY P.i , BURNS. D.R., ANDREO P., International framework of traceability for radiation dosimetry quantities, Metrologia, 2009, 46(2) SI
[3] BIPM, (1999) Mutual recognition of national measurement standards and calibration certificate issued by national metrology institutes, http://www.bipm.org/utils/en/pdf/mra 2003.pd
222
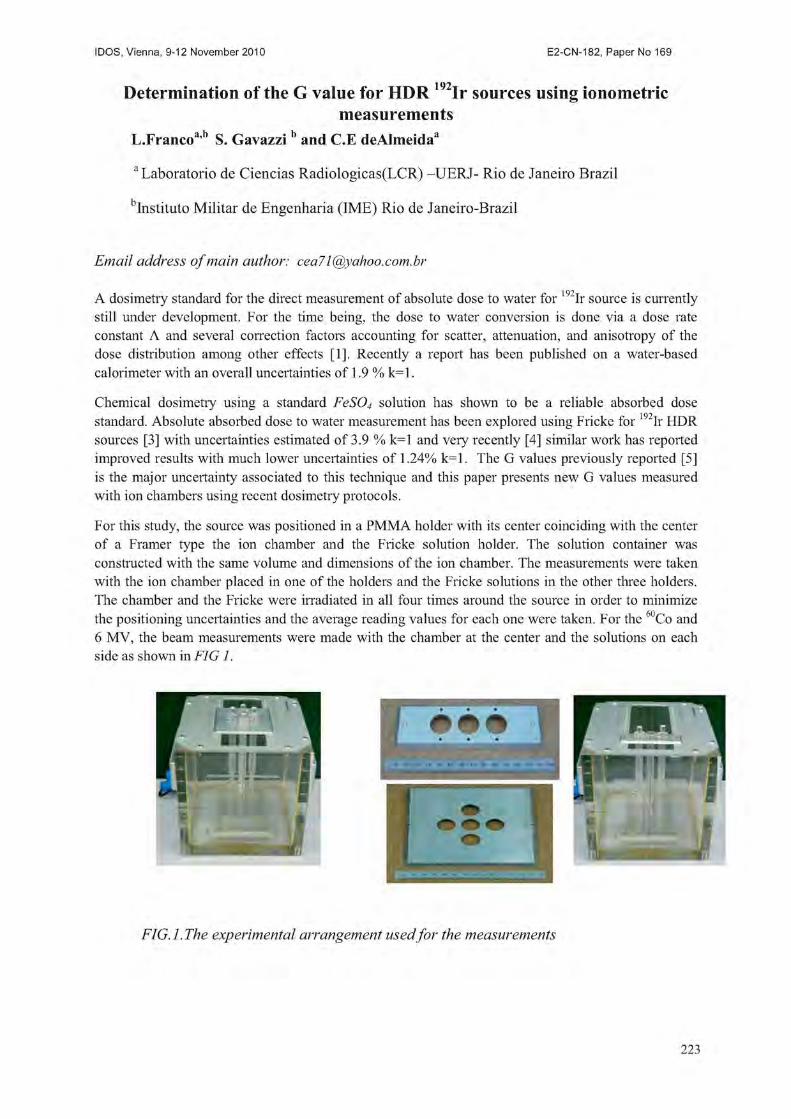
IDOS, Vienna, 9-12 November 2010 E2-CN-182, Paper No INV015
Determination of the G value for HDR Ir sources using ionometric measurements
L.Franco* b S. Gavazzi b and C.E deAlmeidaa
a Laboratorio de Ciencias Radiologicas(LCR) -UERJ- Rio de Janeiro Brazil
bInstituto Militar de Engenharia (IME) Rio de Janeiro-Brazil
Email address of main author: cea7 [email protected]
A dosimetry standard for the direct measurement of absolute dose to water for 192Ir source is currently still under development. For the time being, the dose to water conversion is done via a dose rate constant A and several correction factors accounting for scatter, attenuation, and anisotropy of the dose distribution among other effects [1], Recently a report has been published on a water-based calorimeter with an overall uncertainties of 1.9 % k=l.
Chemical dosimetry using a standard FeS04 solution has shown to be a reliable absorbed dose standard. Absolute absorbed dose to water measurement has been explored using Fricke for 1 Ir HDR sources [3] with uncertainties estimated of 3.9 % k=l and very recently [4] similar work has reported improved results with much lower uncertainties of 1.24% k=l. The G values previously reported [5] is the major uncertainty associated to this technique and this paper presents new G values measured with ion chambers using recent dosimetry protocols.
For this study, the source was positioned in a PMMA holder with its center coinciding with the center of a Framer type the ion chamber and the Fricke solution holder. The solution container was constructed with the same volume and dimensions of the ion chamber. The measurements were taken with the ion chamber placed in one of the holders and the Fricke solutions in the other three holders. The chamber and the Fricke were irradiated in all four times around the source in order to minimize the positioning uncertainties and the average reading values for each one were taken. For the 60Co and 6 MV, the beam measurements were made with the chamber at the center and the solutions on each side as shown in FIG 1.
FIG. 1. The experimental arrangement used for the measurements
223

Table 1. Comparison of the present results made with previous published values.
Energy (MeV) This work Fregene [5] deAlmeida et al [4] 0.397 ** 1.578 (1.0%) k=l NR 1.555 (1.5%) k=l 0.382 * NR 1.56 (+/-0.3) NR 1.25 1.592 (0.91%)k=l NR NR 6 .0 1.634 (0.9%) k=l NR NR
Ir [4]. NR: not reported
Table 1 show that, despite some inconsistencies in the way the data was reported in the past the results are very close and quite encouraging. Better G values for Ir will only be possible with the use of a water calorimeter with lower uncertainties presently under development.
REFERENCES
[1] RIVARD, M. J., et al., AAPM TG# 43 Report: (2004) Med Phys 31, 633-674 _ [2] SARFEHNIA, A., and SHUNT.!ENS, J., Med. Phys. (2010) Development of a Water
calorimeter-based standard for Absorbed dose to Water in HDR 192Ir brachytherapy 37, 1914-1923
[3] AUSTERLITZ, C„ SEMPAU, J., DEALMEIDA, C.E., et al. Determination of Absorbed dose in Water at the reference point D(Ro,9o) for " 'lr HDR brachytherapy source using a Fricke system. Med. Phys. (2008) 35, 5360-65.
[4] DEALMEIDA, C.E., et al. Med Phys. A Fricke based absorbed dose to water standard for 192Ir HDR brachytherapy sources. (Final acceptance procedure).
[5] FREGENE, A.O. Calibration of the Ferrous Sulphate dosimeter by ionometric and calorimetric methods for radiations of a wide range of energy. Rad. Res. (1967) 31 256-272
224

IDOS, Vienna, 9-12 November 2010 E2-CN-182, Paper No 194
Analysis of long-term stability of radiotherapy dosimeters calibrated in the Polish SSDL*
P. Ulkowski, W. Bui ski. B. Gwiazdowska
Department of Medical Physics, The Maria Sklodowska-Curie Memorial Cancer Center and Institute of Oncology, Warsaw, Poland
E-mail address of main author: [email protected]
In Poland, in 30 oncological centres, there are 7 Cobalt-60 units, and 93 accelerators which generate about 160 photon beams and 450 electron beams. The most popular electrometers are: PTW Unidos 10001, Unidos E, and Wellhofer Dose 1; the most popular ionization chambers are: cylindrical Farmer-type (30001, 30013, FC65G), and plane-parallel Markus type (23343, PPC05). According to the regulations of the Ministry of Health, the dosimeters used in radiotherapy should be calibrated once every two years.
The analysis of long term stability of the results of charge measurements for 18 electrometers (from the period 1999-2009), and of calibration coefficients for 27 ionizing chambers (from the period 2003-2009) was performed. The results of several measurements (done in the periods specified) for each instrument (electrometer or chamber) was compared.
The charge measurements were performed using the electric current calibrator/source typ Keithley Instruments Inc. The calibration coefficients were determined according to the dosimetric protocol IAEA-TRS 398, [1], Calibration in water was introduced in Poland in 2003 [2],
A very good long term stability of the charge measurements, not exceeding 0,2%, in most cases below 0,1% (related to the mean value) was recorded (Fig.l). Long term stability of calibration coefficients of investigated chambers in most cases was below 0,3%. The chamber-to-chamber differences were observed especially for plane-parallel Markus type (Fig. 2).
On the basis of this investigation, and taking into account the possibility of the damage of the instruments during transport, we propose to extend the minimal calibration period to 3 years.
The study was supported by the Polish National Atomic Energy Agency with the grant No 10/SP/2009
225

5 , 2 6
5 , 2 4
5 , 2 2
5 . 2 0
5,18 O c
5 , 1 6
5 , 1 4
5 , 1 2
5 , 1 0
5 , 0 8
X
X
x. -_x X V +
X :
X +x
8 0 1 5
• 9 5 8 2
• 1 0 8 7 2
X 1 0 7 0 8
X 1 0 4 8 7
• 1 0 6 2 0
+ 1 9 5 9 6
- 1 1 2 2 8
• 1 1 2 2 9
1 0 7 9 6
1 1 5 8 9
1 0 6 3 2
1 0 6 1 8
8 0 1 7 4
• 8 0 4 9 6
8 0 4 9 7
8 0 4 9 8
- 9 0 1 9 0
1 9 9 8 1 9 9 9 2 0 0 0 2 0 0 1 2 0 0 2 2 0 0 3 2 0 0 4 2 0 0 5 2 0 0 6 2 0 0 7 2 0 0 8 2 0 0 9 2 0 1 0
FIG. 1. Results of charge measurements for 3 types of electrometers: Dose 1, Unidos 10001, Unidos E
a o 5 5 -
• 23343 2523
• 23343 2823
A 23343 3823
X 2 3 3 4 3 3624
X 2 3343 440
• P P C 0 5 1 7 6
J- PPC05 340
PPC05 328
P P C 0 5 3 2 9
FIG. 2. Results of calibration coefficient measurements for plane-parallel chambers of Markus type
REFERENCES
[ 1 ] INTERNATIONAL ATOMIC ENERGY AGENCY. Absorbed dose determination in external beam radiotherapy. An International Code of Practice for Dosimetry Based on Standards of Absorbed Dose to Water. Technical Reports Series. Vienna, 2000; No TRS 398.
[2] BULSKI W, ULKOWSKI P, GWIAZDOWSKA B, ROSTKOWSKA J. An analysis of calibration coefficients measured in water and in air for Farmer-type cylindrical ionization chambers. Pol J Med Phys Eng. 2008; 14 (2): 113-121.
226
IDOS, Vienna, 9-12 November 2010 E2-CN-182, Paper No 196
Quality system of the Argentine SSDL
Saravi, M., Zaretzky, A., Stefanic, A., Montano, G., Vallejos, M.
National Atomic Energy Commission (CNEA), Argentina
E-mail address of main author: [email protected]. ar
The SSDL of Argentina implemented a quality system for calibration of dosemeters used in radiotherapy according to the ISO/IEC Standard 17025 [1], This system was accredited in 2004 by the Accreditation Body of Argentina (OAA), and re-accredited in 2008 by this Organism. The scope of the accreditation is the calibration of dosemeters for radiotherapy in terms of air kerma and absorbed dose to water in "°Co beams and the calibration of dosemeters in terms of air kerma for orthovoltage X-ray beams.
The SSDL has its own Quality Manual and has declared its own policy, in agreement with the quality policy of CNEA. The documentation structure of the Quality Manual includes standard and mandatoiy regulations, documentation applicable to the laboratories (i.e. normative and general procedures of the Institution), general procedures, working instructions, technical standards and laboratory records.
The national standard for dosimetry in Argentina is a secondary standard ion chamber N.E. 2611A#133, which is calibrated at BIPM every four years. The traceability to SI is maintained through a continuous chain of internal and external controls. Internal controls consist of the determination of electrical leakage, determination of stability using a 91 Sr standard source, periodic determination of air kerma in reference conditions in cobalt 60 beam and re-calibration of the transfer chamber N.E. 2571#2394.
As a member of the IAEA/WHO SSDLs Network the laboratory participates of the periodic QC audits for dosimetry organised by the IAEA: comparison of calibration coefficients for ion chambers at radiotherapy level in 60Co beam (every three years), and TLD Postal Dose Quality Audit (every year). Results are analyzed, and a corrective action is immediately started in case any result falls out of the tolerance limits.
Since 1999 the SSDL has been participating in the comparison of secondaiy standards ion chambers and in comparisons of calibration coefficients in terms of air kerma and of absorbed dose to water, in 60Co beams, organised by the SACAR SIM. In 2008 the SSDL participated of the BIPM key comparison for calibration coefficients in terms of air kerma and absorbed dose to water in 60Co beams organised by EURAMET. Also in 2008 the SDSDL participated in the comparison of calibration coefficients in terms of air kerma in orthovoltage X-ray beams organised in the frame of SIM.
The dosemeters for radiation therapy are calibrated at CRRD by the sustitution method against the transfer chamber N.E. 2571 #2394. The validation of the calibration procedure used at CRRD was made following the validation concept established in the International Metrology Vocabulary [2], The optimization of collected charges, number of readings and irradiation time was analysed comparing variation coefficients or performing statistical tests as the analysis of variance (ANOVA), depending on the situation. The robustness of the procedure was determined studying the influence of the chamber position in the beam, and the polarity and the value of polarizing voltage. The analysis of variance was used to determine the influence of these parameters on the readings.

As the radiotherapy centers in Argentina are following the IAEA TRS 398 Protocol for the determination of absorbed dose to water, most of the dosemeters are calibrated in terms of this quantity and the respective calibration coefficient, NDjW is obtained. Nevertheless, the dosemeters are calibrated in terms of air kerma too, and the calibration coefficient NK is determined.
The ratio NDJW/ N K was determined for different type of chambers calibrated at SSDL during the period 2002 to 2009. This ratio was determined for 12 PTW 31003, 11 PTW 30013, and 9 N.E. 2571 ion chambers. The mean ND ,W/NK values are: 1.097, 1.093 and 1.099 respectively and the variation coefficient is 0.4% for the three cases. This made possible to adopt a criteria to accept or reject the result of a dosemeter calibration when using these chambers. In case that a different type of chamber is used, the comparison between the Nd,w obtained during the calibration and the ND,W calculated according to [3] is used to check the result. Other controls are performed before the certificate is emitted.
The uncertainty is calculated following the Argentine Standard IRAM 35050 that is based on the ISO Guide to Expression of Uncertainty in Measurement [4]. The uncertainty values for the accredited services of the CRRD are: 0.8% (k=2) for the calibration of dosemeters in terms of air kerma in cobalt 60 beam, 1.2% (k=2) for the calibration of dosemeters in terms of absorbed dose to water in cobalt 60 beam and 1.2% (k=2) for the calibration of dosemeters in terms of air kerma for orthovoltage X-ray beams.
All the internal audits are earned out by auditors and technical experts qualified by the CNEA Department of Qualification Committee for Laboratories and Facilities. The internal audits must review all the management and technical requirements of ISO/IEC 17025 every year for each sendee and the calibration procedures during the accreditation period. External reviews are performed once a year by auditors and technical experts qualified by OAA.
Once a year the laboratory's executive management conducts a review of the quality system and calibration activities according to the requirements of the Standard ISO/IEC 17025 and to special requirements of OAA.
REFERENCES
[1] ISO/IEC Standard 17025 "General requirements for the competence of testing and calibration laboratories", Geneva (Switzerland), 2005.
[2] BUREAU INTERNATIONAL DE POIDS ET MESURES, BIPM International Vocabulary of Metrology - Basic and general concepts and associated terms JCGM 200:2008, Sevres (France).
[3] INTERNATIONAL ATOMIC ENERGY AGENCY TRS 398 "Absorbed Dose Determination in External Beam Radiotherapy", IAEA, Vienna (Austria), 2000.
[4] ISO Guide to Expression of Uncertainty in Measurement, Geneva (Switzerland), 1993.
228

IDOS, Vienna, 9-12 November 2010 E2-CN-182, Paper No INV015
Implementation of a metrological framework for dosimetry of X ray beams used in diagnostic radiology in Minas Gerais, Brazil
T. A. da Silva8, P. M. C. de 01iveira\ J. V. Pereirac, F. C. Bastosb, L. J. Souzaa, P. L. Squaira, A. T. Baptista Netoa, C. M. A. Soaresa , M. S. Nogueira Tavaresa, T. C. Alonsoa
development Center of Nuclear Technology (CDTN/CNEN), Belo Horizonte, Brazil bPost-graduation Course of Nuclear Science and Techniques (PCTN/UFMG), Belo Horizonte, Brazil cPost-graduation Course in Science and Technology of Radiations, Minerals and Materials (CCTRMM/CDTN/CNEN), Belo Horizonte, Brazil
E-mail address of main author: silvata@cdtn. br
This work was done at the Dosimeter Calibration Laboratory in the Development Center of Nuclear Technology (CDTN) aiming to implement a framework to assure a metrological reliability of air kerma and absorbed dose measurements related to dosimetry of patients submitted to diagnostic radiology examinations.
An Isovolt HS320 model Seifert-Pantak x-ray machine with 5 to 320 kV voltage and 0.1 to 45 mA tube current ranges, a 7 mmBe window and tungsten target was used to reproduce the ^internationally recommended x-ray reference radiations for calibrating or testing dosemeters[l,2].
The energy spectra of all reference radiations were measured with an EXV9 - XR-100T model Amptek Cd-Te spectrometer. The tube voltage was measured in terms of the maximum value through a linear fitting of the energy spectrum tail. The first and, if applicable, the second half-value layers (HVL) were measured based on the attenuation curves in terms of air kerma rate versus the thickness of 99.99% high purity aluminium filters. For all reference radiations, as first approximation, the nominal voltage in the x-ray machine was set as the IEC tube voltage and the additional filtration was adjusted to get the 1st HVL and the homogeneity coefficient in compliance with the IEC or the IAEA requirements [1, 2]. Air kerma measurements were done with a RC6 and, in the case of mammography, a RC6M RADCAL ionization chambers traceable to the National (Brazilian) Ionizing Radiation Metrology Laboratory (LNMRI/IRD).
Table 1 shows the x-ray parameters for nine reference radiations representative of incident beams (RQR), eight radiations of attenuated beams through the patient (RQA), three radiations of tomographic x-ray beams (RQT) and, tentatively, four radiation of mammography (RQR-M).
The IEC and CDTN tube voltage values suggested that adjustment are to be performed, but it will be done in terms of practical peak voltage that was not yet measured. The CDTN 1st HVL values acceptably agreed with the IEC values and they were chosen when the air kerma ratio in the beam with and without attenuation was within 0.491 and 0.502. The homogeneity coefficients differed by -0.03 in compliance with the IEC requirement. The achieved compliance suggests that differences are not relevant and the beam radiations implemented at CDTN can be considered similar to the IEC reference radiations as recommended by IAEA.
Performance checks, calibrations and cross-comparisons with regional metrology laboratories were done with the three standard ionization chamber types for medical conventional x-rays, tomography and mammography aiming to assure their reliability and traceability. A calibration set-up was mounted in front of the Seifert-Pantak x-ray machine for exposing ionization chambers and thermoluminescent dosemeters.
229
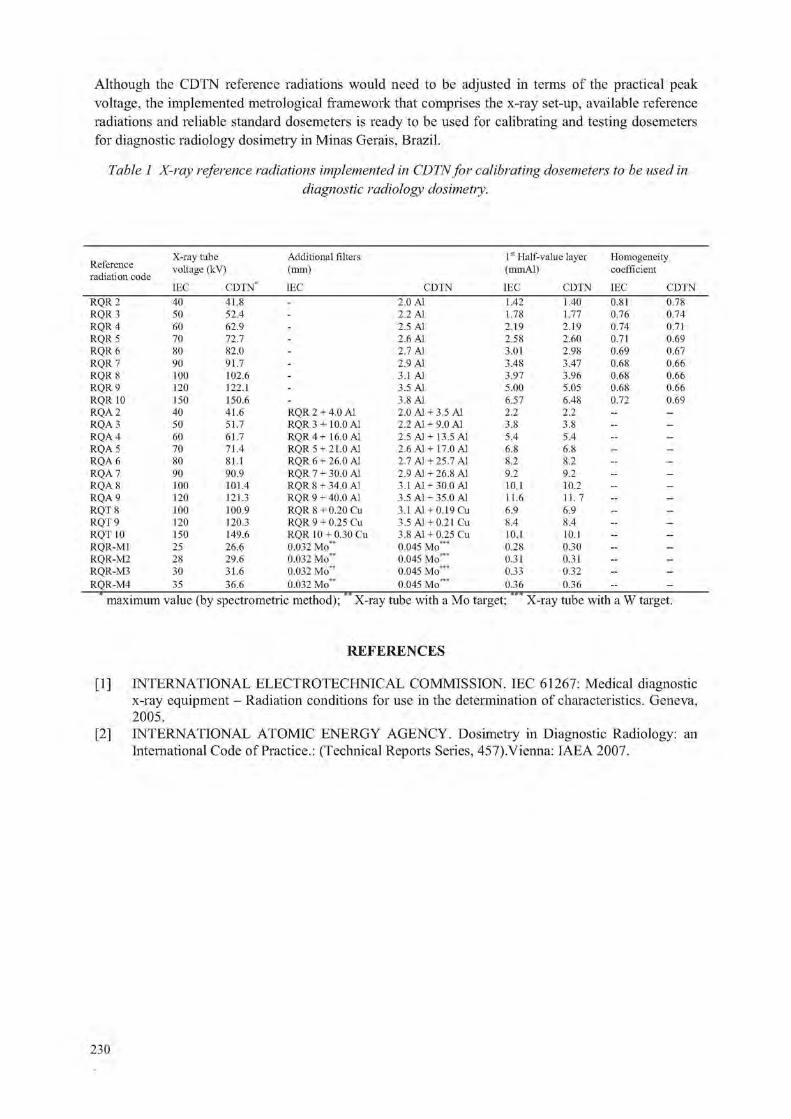
Although the C-DTN reference radiations would need to be adjusted in terms of the practical peak voltage, the implemented metrological framework that comprises the x-ray set-up, available reference radiations and reliable standard dosemeters is ready to be used for calibrating and testing dosemeters for diagnostic radiology dosimetry in Minas Gerais, Brazil.
Table 1 X-ray reference radiations implemented in CDTNfor calibrating dosemeters to be used in diagnostic radiology dosimetry.
Reference radiation code
X-ray tube Additional filters 1st Half-value layer Homogeneity Reference radiation code
voltage (kV) (mm) (mmAl) coefficient
IEC CDTN IEC CDTN IEC CDTN IEC CDTN RQR2 40 41.8 - 2.0 Al 1.42 1.40 0.81 0.78 RQR3 50 52.4 - 2.2 Al 1.78 1.77 0.76 0.74 RQR4 60 62.9 - 2.5 Al 2.19 2.19 0.74 0.71 RQR 5 70 72.7 - 2.6 Al 2.58 2.60 0.71 0.69 RQR6 80 82.0 - 2.7 Al 3.01 2.98 0.69 0.67 RQR 7 90 91.7 - 2.9 Al 3.48 3.47 0.68 0.66 RQR 8 too 102.6 - 3.1 Al 3.97 3.96 0.68 0.66 RQR 9 120 122.1 - 3.5 Al 5.00 5.05 0.68 0.66 RQR 10 150 150.6 - 3.8 Al 6.57 6.48 0.72 0.69 RQA2 40 41.6 RQR 2 + 4.0 Al 2.0 Al + 3.5 Al 2.2 2.2 - -
RQA3 50 51.7 RQR 3 + 10.0 Al 2.2 Al + 9.0 Al 3.8 3.8 - -
RQA4 60 61.7 RQR 4 + 16.0 Al 2.5 A1+13.5 Al 5.4 5.4 — -
RQA 5 70 71.4 RQR 5 +21.0 Al 2.6 A1+ 17.0 Al 6.8 6.8 - -
RQA 6 80 81.1 RQR 6 + 26.0 Al 2.7 A1 +25.7 Al 8.2 8.2 - -
RQA 7 90 90.9 RQR 7 + 30.0 Al 2.9 Al + 26.8 Al 9.2 9.2 - -
RQA 8 100 101.4 RQR 8 + 34.0 Al 3.1 A1 +30.0 Al 10.1 10.2 - -
RQA 9 120 121.3 RQR 9 + 40.0 Al 3.5 A1 +35.0 Al 11.6 11. 7 - -
RQT 8 100 100.9 RQR 8 + 0.20 Cu 3.1 Al + 0.19 Cu 6.9 6.9 - -
RQT9 120 120.3 RQR 9 + 0.25 Cu 3.5 A1 +0.21 Cu 8.4 8.4 - -
RQT 10 150 149.6 RQR 10 + 0.30 Cu 3.8 A1 + 0.25 Cu 10.1 10.1 - -
RQR-M1 25 26.6 0.032 Mo" 0.045 Mo"* 0.28 0.30 - -
RQR-M2 28 29.6 0.032 Mo" 0.045 Mo"* 0.31 0.31 — -
RQR-M3 30 31.6 0.032 Mo" 0.045 Mo*** 0.33 0.32 - -
RQR-M4 *
35 36.6 0.032 Mo" 0.045 Mo*** 0.36 0.36 - -^^ www maximum value (by spectrometric method); X-ray tube with a Mo target; X-ray tube with a W target.
REFERENCES
[1] INTERNATIONAL ELECTROTECHNICAL COMMISSION. IEC 61267: Medical diagnostic x-ray equipment - Radiation conditions for use in the determination of characteristics. Geneva, 2005.
[2] INTERNATIONAL ATOMIC ENERGY AGENCY. Dosimetry in Diagnostic Radiology: an International Code of Practice.: (Technical Reports Series, 457).Vienna: IAEA 2007.
230

IDOS, Vienna, 9-12 November 2010 E2-CN-182, Paper No INV015
Development of an absorbed dose calorimeter for use in IMRT and small field external beam radiotherapy
S. Duanea, M. Baileya , S. Galera , F. Grabera
aNational Physical Laboratory (NPL), Teddington, UK
E-mail address of main author: [email protected]
A calorimeter is in development for the absolute measurement of absorbed dose in small fields and complex fields such as those used to deliver intensity modulated radiation therapy. The probe consists of a spherical graphite core surrounded by and separated from a spherical graphite jacket, enclosed in water-equivalent plastic envelope. A spherical geometry was chosen to give approximately isotropic response and sensitivity to dose gradients. Temperature sensing and electrical heating are provided via small thermistors embedded in the graphite, and the temperatures of each component are actively controlled at a set value. Energy absorbed from radiation is measured by sustitution, using the electrical heaters. The basic measurement is one of absorbed dose rate rather than absorbed dose. The device is calibrated in terms of absorbed dose to water under standard reference conditions1 and corrections to its response, in smaller and irregular non-reference fields, are calculated using EGSnrc Monte Carlo2 and Comsol MultiPhysics' to perform finite element analysis of the heat transfer equation. Linearity of the heat equation plays a critical role in analysing measurement uncertainty and the limits on calorimeter performance.
In measurements on the central axis of a small field, volume averaging effects make the correction for beam non-uniformity become dominant when the field size is comparable to the core diameter which, in the initial prototype, is 5 mm. The jacket diameter is 7 mm. Absorbed dose in the target volume of an IMRT treatment is measured as a time integral of dose rate, summed over the component fields in a multi-field plan, or integrated over the whole arc in an arc therapy treatment. Although the IMRT planned dose is uniform over the target volume, the instantaneous dose rate (i.e. the dose within a component field, or the dose rate during the arc delivery) is spatially non-uniform. Such variations in dose rate drive heat transfers within the calorimeter whose magnitude is inversely proportional to the time constant of heat exchange between core and jacket. So in this case, calorimeter performance is limited by the time taken to complete the delivery of each field or the whole arc. The non water-equivalent components, including gaps, perturb the radiation field being measured, and Monte Carlo simulation of the interactions in the calorimeter is required to evaluate this perturbation. The fluence perturbation correction, and its uncertainty, decreases with core diameter. However this increases the surface to volume ratio of the core, and decreases the time constant associated with heat transfer between core and jacket.
In an IMRT treatment there is evidence that volume averaging effects tend to cancel provided the sensitive volume of the detector is entirely contained within the planned target volume. In a calorimetric measurement, this may indicate that the limit on core size could be relaxed so that the core is only contained within the target volume. However the non water-equivalence of the core creates a significant fluence perturbation if the core is too large.
Results will be presented from measurements with the initial prototype calorimeter, with perturbation corrections evaluated using EGSnrc Monte Carlo and heat transfer corrections calculated using finite element analysis of the heat transfer equation using COMSOL.
231

FIG. 1. Exploded view of the small-field calorimeter..
REFERENCES
[1] SEUNTJENS, J., DUANE, S„ Photon absorbed dose standards, Metrologia 46 (2009) S39-S58.
[2] KAWRAKOW, I. and ROGERS, D. W. O., The EGSnrc code system: Monte Carlo simulation of Electron and Photon Transport, NRCC Report PIRS-701 (2006).
232

IDOS, Vienna, 9-12 November 2010 E2-CN-182, Paper No INV015
Re-establishing the photon absorbed dose primary standard on the new NPL clinical linac
D. Shipley, J. Pearce, S. Duane, R. Nutbrown
National Physical Laboratory (NPL), Hampton Road, Teddington, UK
E-mail address of main author: [email protected]
A new state-of-the-art clinical linac facility has recently been opened at the NPL in addition to the existing research linac facility, which is now over 40 years old. The new machine is an Elekta Synergy Digital Linac, with iViewGT portal and XVI 3D x-ray volumetric imaging that can be configured to deliver seven X-ray beam energies (instead of the usual maximum of three on any one hospital machine). This feature, together with the ability to provide up to ten electron beam energies, will enable NPL to provide absorbed dose calibrations for the full range of energies currently in therapeutic use in the UK.
The NPL is responsible for maintaining the UK primary standards of absorbed dose to water in both high-energy photon and electron beams. For photons, the primary standard is a graphite calorimeter [1] that directly measures absorbed dose to graphite, that is, the energy deposited in a small graphite core at the centre of the calorimeter, in 6"Co gamma ray and MV X-ray beams, divided by the mass of the core. Reference standard ionisation chambers placed in a graphite phantom are then calibrated against the primary standard in terms of absorbed dose to graphite. These calibrations are then converted to absorbed dose to water using two possible methods: one through the application of the photon fluence scaling theorem [2,3] and the second involving charge measurements at a constant target-chamber distance. Secondary standard instruments are then calibrated against these reference standards at either 5cm or 7cm depth in a water phantom. Chamber calibrations are normally given in terms of kQ, the ratio of the chamber calibration factor in a given quality, Q, to that in a reference quality, Qo (60Co at NPL) where the radiation quality is defined in terms of tissue-phantom ratio (TPR20/10).
In this work, a series of NE2611 secondary ionisation chambers were calibrated against the existing primary standard in the seven new X-ray energies delivered by the clinical linac using the above procedure. Monte Carlo models of the source for each energy were also developed to determine a number of the required corrections in the procedure, in particular: corrections to account for the presence of non-graphite materials and air/vacuum gaps in the calorimeter, water-to-graphite dose ratios in the phantoms, and corrections for the different geometri cal configuration of the calorimeter and graphite chamber phantom.
The EGSnrc code system (release V4-r2-2-5) [4], together with the associated package BEAMnrc (release 2007) [5] was used to develop the source models and these were fine tuned in a 30x30 cm field by comparing both calculated depth-dose and dose profiles in water at different depths with plotting tank measurements until a match was obtained within suitable tolerances. Further calculations were then performed with the tuned sources to confirm similar agreement under reference conditions (10x10cm field at either 5 or 7cm depth in water at 100cm from the source).
Preliminary results obtained for kQ for a number of secondary standard ionisation chambers for the seven X-ray radiation qualities delivered by the new clinical linac are shown in Figure 1.
233

Also shown are kQ values and the associated polynomial fit obtained for similar NE2561/2611 type ionisation chambers for the radiation qualities used on the existing research linac, when the primary standard was originally established on this facility.
Quality Index (TPR 20/10)
FIG 1: kg for secondary standard ionisation chambers (serial nos: 122, 201, 203 & 214) on the new clinical linac compared to existing data for similar chambers obtained on the NPL research linac.
The error bars indicate the standard uncertainty currently quoted on a chamber calibration in terms of ky (0.55%). Chamber-to-chamber spread on the new values is typically better than 0.3% at a given radiation quality. As can be seen in the figure, k0 values for the new X-ray qualities are in good agreement (within one standard uncertainty) with the fit to existing qualities used on the research linac.
REFERENCES
[1] DUSAUTOY A R, The UK primary standard calorimeter for absorbed dose measurement, NPL Report RSA(EXT) 25, 1991.
[2] PRUITT J S and LOEVINGER R, The photon fluence scaling theorem for Compton scattered radiation, Med. Phys. 9 176-179, 1982.
[3] NUTBROWN R F, DUANE S, SHIPLEY D R and THOMAS R A S, Evaluation of factors to convert absorbed dose calibrations in graphite to water for mega-voltage photon beams, NPL Report CIRM 37, 2000.
[4] KAWRAKOW I and ROGERS D W O, The EGSnrc code system: Monte Carlo simulation of Electron and Photon Transport, NRCC Report PIRS-701, 2006
[5] ROGERS D W O, EWART G M, FADDEGON B A, DING G X, MA C-M, WE J AND MACKIE T R, BEAM: a Monte Carlo code to simulate radiotherapy treatment units Med. Phys. 22 503-24, 1995.
234
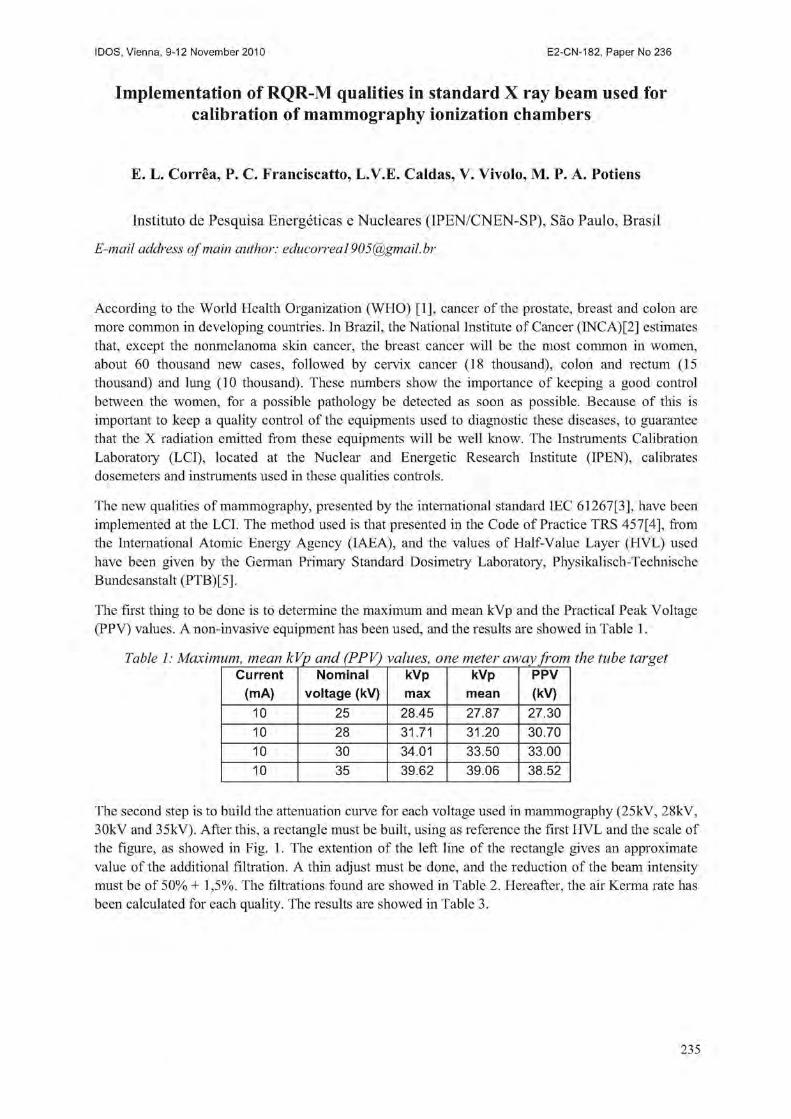
IDOS, Vienna, 9-12 November 2010 E2-CN-182, Paper No INV015
Implementation of RQR-M qualities in standard X ray beam used for calibration of mammography ionization chambers
E. L. Correa, P. C. Franciscatto, L.V.E. Caldas, V. Vivolo, M. P. A. Potiens
Instituto de Pesquisa Energeticas e Nucleares (IPEN/CNEN-SP), Sao Paulo, Brasil
E-mail address of main author: [email protected]
According to the World Health Organization (WHO) [1], cancer of the prostate, breast and colon are more common in developing countries. In Brazil, the National Institute of Cancer (INCA)[2] estimates that, except the nonmelanoma skin cancer, the breast cancer will be the most common in women, about 60 thousand new cases, followed by cervix cancer (18 thousand), colon and rectum (15 thousand) and lung (10 thousand). These numbers show the importance of keeping a good control between the women, for a possible pathology be detected as soon as possible. Because of this is important to keep a quality control of the equipments used to diagnostic these diseases, to guarantee that the X radiation emitted from these equipments will be well know. The Instruments Calibration Laboratory (LCI), located at the Nuclear and Energetic Research Institute (IPEN), calibrates dosemeters and instruments used in these qualities controls.
The new qualities of mammography, presented by the international standard IEC 61267[3], have been implemented at the LCI. The method used is that presented in the Code of Practice TRS 457[4], from the International Atomic Energy Agency (IAEA), and the values of Half-Value Layer (HVL) used have been given by the German Primaiy Standard Dosimetry Laboratory, Physikalisch-Technische Bundesanstalt (PTB) [5],
The first thing to be done is to determine the maximum and mean kVp and the Practical Peak Voltage (PPV) values. A non-invasive equipment has been used, and the results are showed in Table 1.
Table 1: Maximum, mean kVp and (PPV) values, one meter away from the tube target Current
(mA) Nominal
voltage (kV) kVp max
kVp mean
PPV (kV)
10 25 28.45 27,87 27.30 10 28 31.71 31.20 30.70 10 30 34.01 33.50 33.00 10 35 39.62 39.06 38.52
The second step is to build the attenuation curve for each voltage used in mammography (25kV, 28kV, 30kV and 35kV). After this, a rectangle must be built, using as reference the first HVL and the scale of the figure, as showed in Fig. 1. The extention of the left line of the rectangle gives an approximate value of the additional filtration. A thin adjust must be done, and the reduction of the beam intensity must be of 50% + 1,5%. The filtrations found are showed in Table 2. Hereafter, the air Kerma rate has been calculated for each quality. The results are showed in Table 3.
235

V
\
t \
S '» - X .
0 0 0,2 0,4 0,6 0,8 Espessura
1,0 1,2 1,4 1,6 (mmAI)
FIG 1 - Attenuation curve using 25kV, 10mA andHVL = 0.35 mmAI
Table 2 - Additional filtration foundfor the mammography qualities using the HVL values from the PTB
Radiation Voltage Additional Filtration HVL-PTB Reduction quality (kV) (mmAI) (mmAI) (%)
RQR-M 1 25 0.57 0.35 50.315 RQR-M 2 28 0.57 0.40 49.863 RQR-M 3 30 0.58 0.43 49.916 RQR-M 4 35 0.62 0.51 50.058
Table 3 - Air Kerma rate for the qualities RQR-M2 and RQR-M 4 Quality Voltage Filtration Measurement Kq Nk Air Kerma
fkV) (mmAI) (nC) (Gy/C) rate(mGy/min) RQR-M 2 28 0.57 6.640 1 4.806 x 10⁶ 3.191 x 101
RQR-M 4 35 0.62 9.905 1.002 4.806 x 10⁶ 4.770 x 101
The reference chamber has been calibrated in 2009, in the new qualities RQR-M 2 and RQR-M 4. This is why the air Kerma rate has been obtained only in these qualities. From now, the LCI is ready to calibrate ionization chambers from hospitals and medical clinics in the new qualities.
REFERENCES
[1] WORLD HEALTH ORGANIZATION - Regional Office for Europe. Up to 40% of cancer cases could be prevented. Available at: http://ww.euro.who.int/mediacentre/PR/2010/20100204 1 Accessed in: April 16th, 2010
[2] INSTITUTO NACIONAL DO CANCER (Ministerio da Saude). Estimativa 2010 - Incidencia de Cancer no Brasil. Rio de Janeiro, RJ (2009).
[3] INTERNATIONAL ELEGTRQTECHNICAL COMMISSION (IEC). Medical diagnostic X-ray equipment - Radiation conditions for use in the determination of characteristics. IEC 61267. Geneva 2005.
[4] INTERNATIONAL ATOMIC ENERGY AGENCY (IAEA). Dosimetry in diagnostic radiology: an international code of practice. Technical Report Series No. 457, TRS 457 (2007).
[5] PHYSIKALISCH-TECHNISCHE BUNDESANSTALT (PTB). Radiation qualities available for calibration Available at: http://www.ptb.de/de/org/6/62/625/pdf/strhlq.pdf Accessed in: April 8th, 2010
236
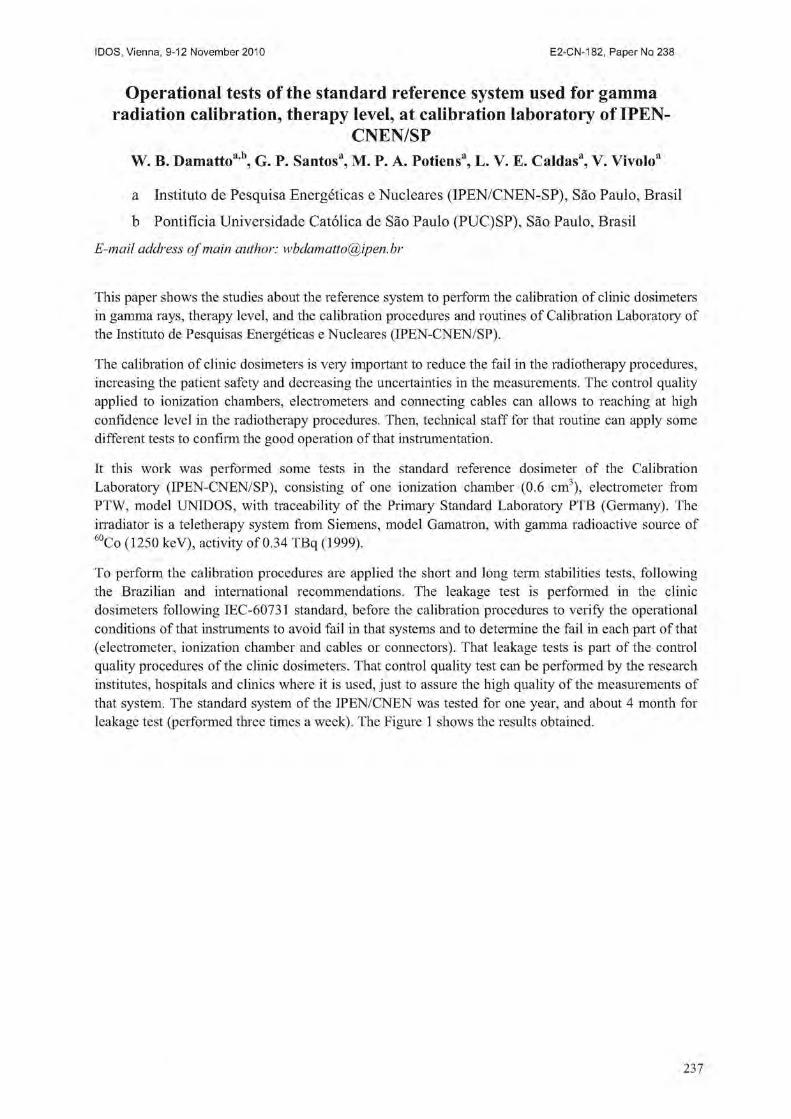
IDOS, Vienna, 9-12 November 2010 E2-CN-182, Paper No INV015
Operational tests of the standard reference system used for gamma radiation calibration, therapy level, at calibration laboratory of IPEN-
CNEN/SP W. B. Damattoa'\ G. P. Santos3, M. P. A. Potiensa, L. V. E. Caldas*, V. Vivolo3
a Instituto de Pesquisa Energeticas e Nucleares (IPEN/CNEN-SP), Sao Paulo, Brasil
b Pontificia Universidade Catolica de Sao Paulo (PUC)SP), Sao Paulo, Brasil
E-mail address of main author: [email protected]
This paper shows the studies about the reference system to perform the calibration of clinic dosimeters in gamma rays, therapy level, and the calibration procedures and routines of Calibration Laboratory of the Instituto de Pesquisas Energeticas e Nucleares (IPEN-CNEN/SP).
The calibration of clinic dosimeters is very important to reduce the fail in the radiotherapy procedures, increasing the patient safety and decreasing the uncertainties in the measurements. The control quality applied to ionization chambers, electrometers and connecting cables can allows to reaching at high confidence level in the radiotherapy procedures. Then, technical staff for that routine can apply some different tests to confirm the good operation of that instrumentation.
It this work was performed some tests in the standard reference dosimeter of the Calibration Laboratory (IPEN-CNEN/SP), consisting of one ionization chamber (0.6 cm ), electrometer from PTW, model UNIDOS, with traceability of the Primary Standard Laboratory PTB (Germany). The irradiator is a teletherapy system from Siemens, model Gamatron, with gamma radioactive source of 60Co (1250 keV), activity of 0.34 TBq (1999).
To perform the calibration procedures are applied the short and long term stabilities tests, following the Brazilian and international recommendations. The leakage test is performed in the clinic dosimeters following IEC-60731 standard, before the calibration procedures to verify the operational conditions of that instruments to avoid fail in that systems and to determine the fail in each part of that (electrometer, ionization chamber and cables or connectors). That leakage tests is part of the control quality procedures of the clinic dosimeters. That control quality test can be performed by the research institutes, hospitals and clinics where it is used, just to assure the high quality of the measurements of that system. The standard system of the IPEN/CNEN was tested for one year, and about 4 month for leakage test (performed three times a week). The Figure 1 shows the results obtained.
237

0,35%
0,30% 0) E 0,25% ffi a. C 0,20% £ o
">
a O
0,15%
0,10%
0,05%
0,00%
Energy Leakage NE 2505/03 Pre Irradiation
— < • — 3 4 5
Time (days)
0,40%
0,30%
0,20%
0,10%
0,00%
-0,10%
-0,20%
-0,30%
Energy Leakage NE 2505/03 Post Irradiation
Time (days)
FIG 1. Leakage current test realized in clinical reference of IP EN.
The reference system presented good results, such us: maximum leakage of + 0.30%, and the standard IEC-60731 allowed a maximum variation of the ± 0.58% in the readings. That results show that the reference system for calibration of clinic dosimeters of the Calibration Laboratory of the (IPEN-CNEN/SP) is operating in good conditions. These studies show the importance of the periodicity of the quality control tests.
REFERENCES
[1] IEC-60731, "Medical Electrical Equipment Dosimeters with Ionization Chambers as Used in Radiotherapy", 1997.
[2] INTERNATIONAL ATOMIC ENERGY AGENCY, Absorbed Dose Determination in External Beam Radiotherapy, IAEA, Vienna, 2000 (Technical Report Series No. 398).
[3] INTERNATIONAL ATOMIC ENERGY AGENCY. Calibration of Reference Dosimeters for External Beam Radiotherapy. IAEA, Vienna, 2009, (Technical Reports Series No. 469).
238
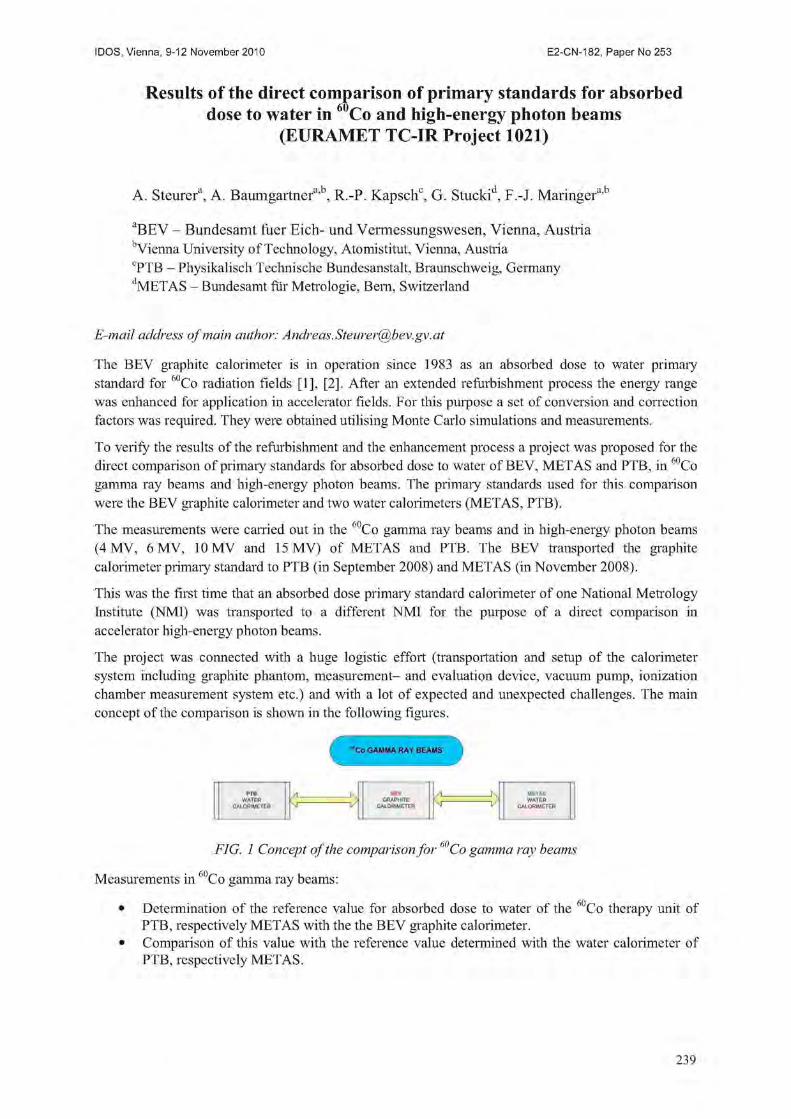
IDOS, Vienna, 9-12 November 2010 E2-CN-182, Paper No INV015
Results of the direct comparison of primary standards for absorbed dose to water in Co and high-energy photon beams
(EURAMET TC-IR Project 1021)
A, Steurer3, A. Baumgartnera,b, R.-P. Kapschc, G. Stuckid, F.-J. Maringera,b
aBEV - Bundesamt fuer Eich- und Vermessungswesen, Vienna, Austria "Vienna University of Technology, Atomistitut, Vienna, Austria CPTB - Physikalisch Technische Bundesanstalt, Braunschweig, Germany dMETAS - Bundesamt fur Metrologie, Bern, Switzerland
E-mail address of main author: Andreas. [email protected]. at
The BEV graphite calorimeter is in operation since 1983 as an absorbed dose to water primary standard for l0Co radiation fields [1], [2], After an extended refurbishment process the energy range was enhanced for application in accelerator fields. For this purpose a set of conversion and correction factors was required. They were obtained utilising Monte Carlo simulations and measurements.
To verify the results of the refurbishment and the enhancement process a project was proposed for the direct comparison of primary standards for absorbed dose to water of BEV, METAS and PTB, in 60Co gamma ray beams and high-energy photon beams. The primary standards used for this comparison were the BEV graphite calorimeter and two water calorimeters (METAS, PTB).
The measurements were carried out in the 60Co gamma ray beams and in high-energy photon beams (4 MV, 6 MV, 10 MV and 15 MV) of METAS and PTB. The BEV transported the graphite calorimeter primary standard to PTB (in September 2008) and METAS (in November 2008).
This was the first time that an absorbed dose primary standard calorimeter of one National Metrology Institute (NMI) was transported to a different NMI for the purpose of a direct comparison in accelerator high-energy photon beams.
The project was connected with a huge logistic effort (transportation and setup of the calorimeter system including graphite phantom, measurement- and evaluation device, vacuum pump, ionization chamber measurement system etc.) and with a lot of expected and unexpected challenges. The main concept of the comparison is shown in the following figures.
i ""Co GAMMA RAV BEAMS
PTS WATER
CALORIMETER A K
8CV GRAPHITE
CALORIMETER
A N METAS WATER
CALORIMETER
PTS WATER
CALORIMETER \ i 1 /
8CV GRAPHITE
CALORIMETER M V METAS WATER
CALORIMETER
FIG. 1 Concept of the comparison for60Co gamma ray beams
Measurements in 60Co gamma ray beams:
• Determination of the reference value for absorbed dose to water of the 'Co therapy unit of PTB, respectively METAS with the the BEV graphite calorimeter.
• Comparison of this value with the reference value determined with the water calorimeter of PTB, respectively METAS.
239

Measurements in high-energy photon beams:
• Determination of absorbed dose to water at the accelerator at PTB, respectively METAS and calibration of an ionization chamber.
• Calibration of the same ionization chamber using an ionization chamber of PTB respectively METAS, calibrated with the water calorimeter of PTB, respectively METAS.
The graphite calorimeter was used in quasi-adiabatic mode to obtain the absorbed dose to graphite. The conversion to absorbed dose to water were done by two methods based on the photon fluence scaling theorem [3]: conversion by calculation (applied for "'JCo measurements) and conversion with an ionization chamber (applied for accelerator beam measurements). The use of the first method at the accelerator is affected by two problems:
• The effective (virtual) point of source of an accelerator beam is not well known • There are backscatter influences to the monitor chamber from the graphite phantom as a result
of the small distance according to the photon fluence scaling theorem
For 60Co a deviation of -0,3 % (PTB) and 0,2 % (METAS) was obtained. At the METAS accelerator deviations between 0,3 % and 0,7 % for the four energies were obtained. Only the results for the PTB accelerators are problematical. Deviations between 1,5 % and 2,2 % were obtained. The reason for the discrepancy seems to be clear. The measurements with the ionization chamber in the graphite phantom were made immediately after the graphite calorimeter measurements with a working temperature of 27 °C. Therefore a temperature effect - which influences the ionization current measurement - is assumed. Considering these circumstances one obtains a shift in the right direction. Unfortunately a retrospective correction is not possible.
Nevertheless, and especially under consideration of the veiy short measuring time at PTB, respectively at METAS the project was very successful. Only five days were scheduled and necessary for five energies including setups of the graphite calorimeter and calibration of the ionization chambers and of course solving of some of the unexpected problems. The mobile application of the BEV graphite calorimeter was shown impressively. Within a very short time very satisfactory results can be obtained. The results obtained by the different NMl's are widely in agreement. Comparing the ionization chamber calibration coefficients of PTB and METAS for the four considered high-energy photon beam qualities deviations between 0,2 % and 0,9 % were obtained.
REFERENCES
[1] LEITNER A., WITZANI J.: The Realization of the Unit of Absorbed Dose at the Austrian Dosimetry Laboratory Seibersdorf, OEFZS-4740, Februar 1995
[2] WITZANI J., DUFTSCHMID K.E., STRACHOTINSKY CH. & LEITNER A.: A Graphite Absorbed-Dose Calorimeter in the Quasi-Isothermal Mode of Operation, Metrologia 20, 73-79 (1983), Springer-Verlag.
[3] PRUITT J.S., LOEVINGER R.: The photon-fluence scaling theorem for Compton-scattered radiation. Med Phys 9, 1982.
240
IDOS, Vienna, 9-12 November 2010 E2-CN-182, Paper No INV015
Re-establishing of the dosimetry laboratory in NRPI Prague
L Judas, I Horakova, J Dobesova, L Novak
National Radiation Protection Institute, Bartoskova 28, 14000 Prague 4, Czech Republic
E-mail address of main author: [email protected]
History of the dosimetry laboratory in NRPI, Prague, goes back to the 60's of the 20th century. At that time, a dosimetry calibration laboratory for X-ray and gamma beams was established as a part of the national metrology framework. Since the 70's the laboratory was recognized by the IAEA and became a part of the SSDL network. By the year 2002, the laboratory was well established and capable of performing calibrations in X-ray beams (10 to 250 kVp) and in gamma beams (60Co, 137Cs). The laboratory possessed Czech state authorization for the calibrations, and participated also in interlaboratory comparative testing and in other activities organized by IAEA. Besides routine calibrations, research activities were also constantly carried out in the laboratory (e.g. [1] - [3]).
During the years 2006 - 2008, the NRPI (dosimetry laboratory included) was moved from its previous location to newly reconstructed premises in other Prague district.
Two measuring paths are established in the new dosimetry laboratory - one with X-ray beams (path A), the other with gamma beams (path B).
In path A, two X-ray tungsten tubes (Isovolt 160, Isovolt 320) with a rotating filter wheel (32 filter positions) serve currently as the radiation source. Third tube (with a molybdenum anode) will be installed during this year. Six out of the nine RQR/RQA qualities recommended in [4] are already available in the laboratory. Some other spectra recommended in [4] or [5] are under development.
Path B is equipped with a remote controlled irradiation unit OG-8 (Czech manufacturer VF Inc.). The OG-8 unit contains five 137Cs sources (activities 55 MBq to 5.5 TBq) and one 'Co source (activity 0.2 TBq).
The position of the device-under-calibration is set either manually (A) or semi-automatically (B). The source-to-measuring-point distance is checked by a gauge .(B) or by two precise laser distance meters (A). Further laser beams are used for centering. Electrometers Keithley and ionization chambers Exradin are used as reference measuring devices.
The available values of air kerma rate are as follows:
beam quality air kerma rate (Gy/s)
beam quality min. max.
6UCo 2E-6 3E-5
1J/Cs 5E-9 1.5E-4
X-rays (various qualities) 1E-5 1.5E-3
A comprehensive system of quality control is being developed and applied continuously. By the end of this year the laboratory will be prepared to fulfil all relevant requirements concerning systems of quality management.
241

REFERENCES
[1] HECKER, O,, et al., International comparison of measurement precision of personal exposures to ionizing radiation, Health Phys. 26 4 (1974), 349.
[2] KODL, O., et al., Exposure of patients to ionizing radiation in diagnostic radiology (in Czech), Ceska Radiologic 42 1 (1988), 54.
[3] PERNICKA, F„ MICHALIK, V., KODL, 0., PACHOLIK, J., Catalogue of X-ray spectra, Czechoslovak Academy of Sciences, Prague (1991).
[4] INTERNATIONAL ATOMIC ENERGY AGENCY, Dosimetry in diagnostic radiology: an international code of practice, Technical report series No. 457, IAEA, Vienna (2007).
[5] ISO 4037-1:1996, "X and gamma reference radiation for calibrating dosemeters and doserate meters and for determining their response as a function of photon energy", Part 1: Radiation characteristics and production methods.
242
IDOS, Vienna, 9-12 November 2010 E2-CN-182, Paper No INV015
Development of a water calorimeter as a primary standard for absorbed dose to water measurements for HDR brachytherapy sources
J.A. de Pooter, L.A. de Prez
VSL, Dutch Metrology Institute, Delft, The Netherlands
E-mail address of main author: [email protected]
Purpose
Currently, dosimetry for brachytherapy sources is based on air kerma standards. The goal of the EU co-funded iMERA-plus JRP 6 (7 FP) is to establish a new dosimetric metrology chain for brachytherapy sources, fully based on absorbed dose to water, Dw. In this framework, VSL is developing a water calorimeter as a primary standard for high dose rate (HDR) brachytherapy sources to measure Dw directly. The aimed standard uncertainty is 2 % (k=2), for a source-detector distance of 2.0 cm. Water calorimetry for HDR-sources differs from water calorimetry for external beams on two main aspects. First, due to the self-heating of the source an additional undesired temperature rise will appear. Second, the radiation induced temperature signal is very sensitive to small uncertainties in the HDR-source to thermistor distance. Here the developed water calorimeter is presented, methods to reduce the influence of the source self-heat effect and the sensitivity of the temperature signal to HDR-source to thermistor distance are proposed and their effectiveness has been investigated.
Materials and methods
The developed water calorimeter is based on the existing water calorimeter for external beams with a new developed high purity cell (HPC). In contrast to the HPC of existing VSL water calorimeter, the HDR source can be positioned centrally inside the HPC of the developed water calorimeter. A nylon catheter on the central axis at the centre of the HPC is used for positioning of the source. The HPC is cylindrically shaped with two opposing thermistors on each side of the catheter. The distance between the thermistors and the centre of the catheter is 2.0 cm. To decrease the sensitivity of the temperature signal to variations in the distance between catheter and thermistor, the measured temperature increase as a result of the deposited dose and additional temperature effects, is the average of the temperature signal of both thermistors. The temperature signal is determined by extrapolation of the pre- and post-temperature drifts to the midrun. A cylindrical aluminum heat sink in a concentric configuration with the HPC and the catheter is used to reduce the influence of the source self-heat on the temperature signal. The aluminum heat sink is separated from the inside of the HPC by the central PEEK cylinder of the HPC. Due to the enhanced heat transport in the longitudinal direction of the heat sink, less heat generated in the HDR-source (self heat) reach the thermistors. Heat transport simulations (Comsol Multiphysics™) were performed, to determine the amount of source self-heat and the effectiveness of the aluminum heat sink. In addition, the heat transport model was used to determine other excess heat effects, such as the presence of glass and other materials of the HPC, and the dose gradients.
Furthermore, Monte Carlo simulations were performed to determine the perturbation corrections needed for the presence of the aluminum heat sink. Finally the relation between variation of dose with HDR-source to thermistor distance was determined using the dose distributions resulting from the Monte Carlo code, for the case of the averaged signal of the configuration with two opposing thermistors (as in the developed water calorimeter), and for the case of a single thermistor.
243

Results
The resulting temperature signal from the heat transport simulations (Fig. 1) shows that the source self-heat increases the post-drift signal up to about 61 % at maximum compared to the ideal run. The self-heat is reduced when the aluminum heat sink is applied with a maximum of 37 %. Both correction factors include the correction for excess heat due to non-water materials and dose gradients, which is 1.5 % of the signal. An additional advantage of the heat sink is the reduced stabilization time between two runs. The Monte Carlo calculated correction for the presence of aluminum heat sink is 1.4 %. Because of the opposing thermistors the variation in dose was 0.03 % in case the distance between HDR-source and thermistor varied with 0.1 mm, compared to 2 % in case only one thermistor was used.
Conclusion
The influence of the source self-heat effect and the sensitivity of the temperature signal to HDR-source to thermistor distance are effectively reduced in the developed water calorimeter, by the use of an aluminum heat sink and the two opposing thermistors. Measurements are in progress to determine the absorbed dose to water for a Ir HDR-source.
-Ideal Run •No Heat Sink Wi th Heat Sink
AT(K)/AT1 G y
50 100 150
t(s)
Fig 1. The temperature signal from the heat transport simulations.
244
IDOS, Vienna, 9-12 November 2010 E2-CN-182, Paper No INV015
Assuring the quality of the mammography calibrations in Cuban laboratory by comparison with Greek dosimetry standard
G.Walwyn a, C.Hourdakis b, A.Martineza, N.Gonzalez a, A.Vergaraa
aCentro de Proteccion e Higiene de las Radiaciones, Havana, Cuba
' Greek Atomic Energy Commission, Athens, Greece
E-mail address of main author: [email protected]
The Secondary Standard Dosimetry Laboratory (SSDL) of Cuba has recently worked on preparation of the dissemination proposal of air kerma quantities for dose measurements at mammography beams into the country. This work was supported by IAEA coordinated research project. The X-ray equipment available at the laboratory is based on tungsten anode, and then the recommended RQR-M series based on molybdenum target and specified in IEC 61267 [1] cannot be established at the SSDL. The calibration of the reference class chamber with flat response in any beams on mammography range is an option suggested in TRS 457 [2] when not all radiation qualities are available. As an alternative some authors [3] have suggested the use of radiation qualities based on tungsten anode and defined by IEC 1223-3-2 [4],
The Radcal 10X6M chamber was designated as secondary standard of the SSDL. The chamber was calibrated over the IEC 1223-3-2 range in the primary laboratory of Austria (BEV). The designation and calibration of the secondary standard was followed by the establishment of the IEC 1223-3-2 qualities at the SSDL of Cuba and preparation of the calibration procedures.
Before introducing the calibrations by alternative method it was necessary to test the quality of the results provided by SSDL of Cuba to confirm both if this procedure can be properly operated by laboratory and the needs of customer are met. For this goal it was found the experienced laboratory from Greece that use appropriate X-ray spectra for calibration of mammography dosimeters. The Hellenic Ionizing Radiation Calibration Laboratory (HIRCL) of Greece maintains the MAGNA Ref 92650 chamber as secondary standard traceable to PTB in RQR-M qualities based on molybdenum target. The X-ray system used is the clinical mammography unit with some modifications to fit the needs of calibrations.
The laboratories were agreed to initiate a bilateral comparison exercise to evaluate whether the results of calibration of both laboratories are similar. The MagnaA650 chamber provided by Greek laboratory was used as a transfer chamber. Each laboratory calibrated the transfer instrument and reported the calibration coefficients. The reference radiation qualities RQR-M2 and W28Mo60 were chosen for comparison. In addition RQR-M4 quality from Greek laboratory was included because of the similar half value layer parameter to the W28Mo60 quality. The characterizations of the radiation qualities established by both laboratories are shown in table 1.
To asses the results of comparison it was used the number En recommended by ISO/IEC 43-1 [5]. The number En consider that the results are satisfactory when En < 1 and unsatisfactory when En > 1. The number En is the quotient of the difference between the values of calibration coefficients reported and combination of the expanded uncertainties of the laboratories at 95 % of confidence level (K=2).
245

Laboratory Radiation Target Tube Filtration HVL quality code voltage (|j,m Mo) (mm Al)
(kV) fixed added
CPHR W28Mo60 Tungsten 28 — 60 0.37
HIRCL RQR-M2 Molybdenum 28 30 — 0.32 RQR-M4 Molybdenum 35 30 — 0.37
Table 1. Characterizations of the radiation qualities established by both laboratories.
The number En remains below 1 and then, it was considered that similar results were achieved by both laboratories (see table 2). The results confirm that proper procedure for calibration was implemented at Cuban laboratory and the dosimetiy standard can be disseminated to clinical users in Cuba. The method of calibration is only applied to reference class dosimeters with flat response over the mammography range.
Laboratory Radiation quality
Calibration coefficients (mGy/nC)
Difference
(mGy/nC)
Uncertainty, K=2
(mGy/nC)
En
CPHR W28Mo60 8.18 — 0.11 —
HIRCL RQR-M2 8.33 -0.15 0.18 0.71 HIRCL RQR-M4 8.31 -0.13 0.18 0.62
Table 2. R esults of comparison between Greek and Cuban laboratories in calibration of mammography dosemeters.
REFERENCES
[1] INTERNATIONAL ELECTROTECHNICAL COMMISSION, Medical Diagnostic X-ray Equipment-Radiation Conditions for Use in the Determination of Characteristics, IEC-61267, second edition, Geneva (2005).
[2] INTERNATIONAL ATOMIC ENERGY AGENCY, Dosimetiy in Diagnostic Radiology: An International Code of Practice, Technical Reports Series No. 457, Vienna (2007).
[3] WITZANI, J., et al., Calibration of Dosemeters Used in Mammography with Different X Ray Qualities: EUROMET Project No.526, Radiation Protection Dosimetry (2004), Vol.108, pp. 33-45.
[4] INTERNATIONAL ELECTROTECHNICAL COMMISSION, Acceptance Tests:Imaging Performance of Mammographic X-Ray Equipment, IEC 1223-3-2, first edition, Geneva (1996).
[5] INTERNATIONAL ORGANIZATION FOR STANDARDIZATION, Proficiency Testing by Interlaboratory Comparisons. Part-1, Development and Operation of Proficiency Testing Schemes. ISO 11X Guide 43-1, Geneva (1997)
246
IDOS, Vienna, 9-12 November 2010 E2-CN-182, Paper No INV015
Present status of SSDL and dosimetry protocol for external radiotherapy in Japan
A. Fukumuraa, H. Mizunoa, Y. Kusano\ H. Saitoh0
aNational Institute of Radiological Sciences
Association for Nuclear Technology in Medicine
c Tokyo Metropolitan University
E-mail address of main author: [email protected]
National Institute of Radiological Sciences (NIRS) has been the Secondary Standard Dosimetiy Laboratory (SSDL) for external radiotherapy in Japan. The NIRS standard ionization chambers have been calibrated in terms of 60Co exposure by National Metrology Institute of Japan (NMIJ) as the Primary Standard Dosimetry Laboratory (PSDL). In collaboration with Association for Nuclear Technology in Medicine (ANTM), more than 700 therapy-level dosimeters from hospitals were calibrated with the standard chambers and the '°Co standard field at NIRS in the last fiscal year. The uncertainty of the calibration factor in terms of exposure (NF) is estimated at 1.5% (k=2).
The Japanese dosimetiy protocol for external radiotherapy [1] has been published since 2002. Although the protocol is mostly in accordance with IAEA TRS-398 [2] and adopts Naw based formalism, the traceability of dosimetry in external radiotherapy has been maintained in terms of exposure with Nx in Japan. Then the protocol tables the calculated values of ND,JNX for each ionization chamber model, in order to use NX with the NAW based formalism. The calculated values introduce additional uncertainties of 1.3% for cylindrical ionization chamber and 1.9% for parallel plate ionization chamber, respectively, into ND%W determination. In addition, lack of the calculated values in the protocol prevents use of a new product of ionization chambers.
Recently, NMIJ is establishing the primary standard for absorbed dose to water. The details of the primary standard will be presented elsewhere. To establish the nation-wide traceability of ND,V, NIRS has developed 60Co standard field in a water phantom. An cylindrical ionization chamber is set up with an waterproof sleeve of 1mm thick PMMA wall. The sleeve can be placed mechanically in the water phantom with spatial resolution of 10~3 mm. Although the dose rate for ND,W measurement is lower than that for NX measurement due to attenuation in water, the reproducibility of NA„ measurement with stable water temperature is one digit higher than that of NX measurement. Then the new standard field in water is expected to supply NDIW with the lower uncertainty. The NIRS standard ionization chambers have already been calibrated in terms of both absorbed dose to water at IAEA Seibersdorf Laboratory. The feasibility study using several types of ionization chamber has been started. We are planning to start NDIW calibration service within the 2010 fiscal year.
As a part of the feasibility study, proton beam dosimetry intercomparison was carried out using both NDIW and /Vy with participation of seven proton/carbon beam facilities in Japan.
247
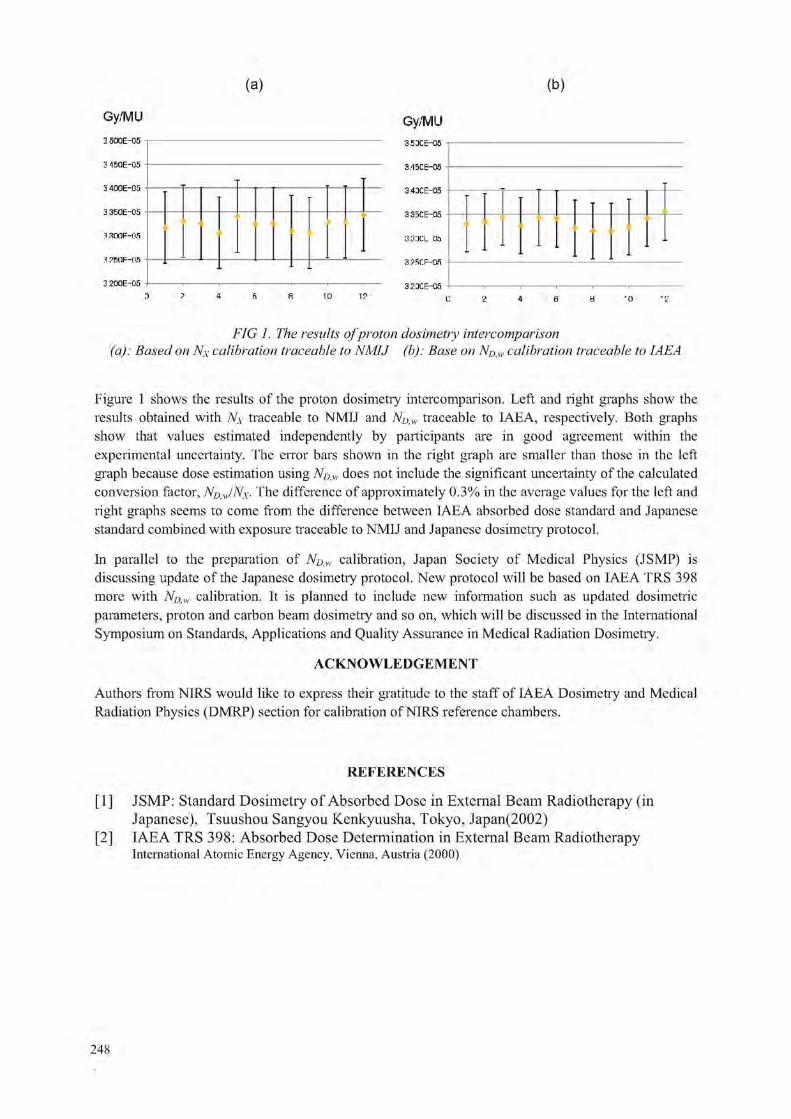
(a) (b)
Gy/MU
3 500E-05
3150E-05
3 400E-05
3 350E-05
.1 amF-us 3 ?fiOF-OS 3 200E-05
Gy/MU 3.53CE-0fi 3/I5CE-05 3.43CE-05 3.35CE-05 333CL 06 3 ?f.r:F-OR 3.23CE-OE
FIG 1. The results ofproton dosimetry inter r o mpar is on (a): Based on Nx calibration traceable to NMIJ (b): Base on Np,w calibration traceable to IAEA
Figure 1 shows the results of the proton dosimetry intercomparison. Left and right graphs show the results obtained with NX traceable to NMIJ and ND,w traceable to IAEA, respectively. Both graphs show that values estimated independently by participants are in good agreement within the experimental uncertainty. The error bars shown in the right graph are smaller than those in the left graph because dose estimation using NDIW does not include the significant uncertainty of the calculated conversion factor, NDAJNX• The difference of approximately 0.3% in the average values for the left and right graphs seems to come from the difference between IAEA absorbed dose standard and Japanese standard combined with exposure traceable to NMIJ and Japanese dosimetry protocol.
In parallel to the preparation of NDIW calibration, Japan Society of Medical Physics (JSMP) is discussing update of the Japanese dosimetry protocol. New protocol will be based on IAEA TRS 398 more with NDAV calibration. It is planned to include new information such as updated dosimetric parameters, proton and carbon beam dosimetry and so on, which will be discussed in the International Symposium on Standards, Applications and Quality Assurance in Medical Radiation Dosimetry.
ACKNOWLEDGEMENT
Authors from NIRS would like to express their gratitude to the staff of IAEA Dosimetry and Medical Radiation Physics (DMRP) section for calibration of NIRS reference chambers.
REFERENCES
[1] JSMP: Standard Dosimetry of Absorbed Dose in External Beam Radiotherapy (in Japanese), Tsuushou Sangyou Kenkyuusha, Tokyo, Japan(2002)
[2] IAEA TRS 398: Absorbed Dose Determination in External Beam Radiotherapy International Atomic Energy Agency, Vienna, Austria (2000)
248

Posters relating to Reference Dosimetry and Comparisons in External
Beam Radiotherapy


IDOS, Vienna, 9-12 November 2010 E2-CN-182, Paper No INV015
Calibration of helical tomotherapy using ESR/alanine dosimetry
T. Garcia3, P. Fran$oisb, N. Perichon3, V. Louren?oa, J.M. Bordy3
3CEA, LIST, Laboratoire National Henri Becquerel, Gif-sur-Yvette, F-91191, France
bInstitut Curie, Paris, France
E-mail address of main author: [email protected]
Helical tomotherapy treatment is provided by a 6 MV linear accelerator without flattening filter through a multileaf collimator. Because of the tomotherapy specific geometiy, classical radiation therapy calibration protocols such as AAPM TG-51 and IAEA TRS-398 cannot be used. Therefore, a specific metrological transfer protocol is required.
In this framework, the Laboratoire National Henri Becquerel and the Institut Curie decided to study the feasibility of a transfer calibration by ESR/Alanine dosimetiy. This dosimeter is suitable considering its small size, integrating capability, and low dependence as a function of dose rate and radiation quality in the radiotherapy domain.
A first calibration curve was established in standard radiotherapy conditions using a 60Co beam. The water phantom was then substituted by a polymethyl methacrylate (PMMA) orthocylindric phantom allowing to plot a new calibration curve and to derive a transfer coefficient between the two phantoms and the two irradiation geometries. The PMMA phantom was finally used in a tomotherapy beam to measure the absorbed dose.
To compare the dose rate values considering the different reference conditions, 4 methods were used: attenuation coefficients, percentage Depth Dose Curve, Tissue to Air Ratio and Monte-Carlo simulations.
Furthermore, an irradiation plan was designed at the treatment planning station. A planning target volume (PTV) including the alanine dosimeter was defined in the PMMA phantom and a homogenous dose was planned at the alanine dosimeter. After irradiating the dosimeters using the resulting TomoTherapy Inc. procedure, the doses were assessed using the calibration curve previously established in standard radiotherapy conditions associated to the correction factors.
Considering the uncertainties of the dose rate provided by TomoTherapy Inc. (2%) and of the ESR/alanine method (2%), results for calibration and verifications are in good agreement.
251


IDOS, Vienna, 9-12 November 2010 E2-CN-182, Paper No INV015
Measurement corrections for output factor measurements of small robotic radiosurgery beams formed by a variable aperture collimator
P. Francescon3, W. Kilbyb, N. Satariano3, S. Cora3
3 Medical Physics Department, Vicenza Hospital, Vicenza, Italy
' Accuray Incorporated, Sunnyvale, USA
E-mail address of main author: paolo [email protected]
The correction factors kfc'""fm" defined in a recently proposed dosimetry formalism [1] have been Qclin >Qmsr calculated using a Monte Carlo (MC) technique for output factor (OF) measurements made with a variable circular aperture collimator mounted on the Cyber Knife' Robotic Radiosurgery System [2]. The correction factors for small air ionization chambers, solid state detectors, and a liquid filled ionization chamber have been generated for field diameters 5mm - 25mm. These correction factors have been applied to measurements made using the same detectors and field diameters, and the resulting field factors have been intercompared.
In this work, a MC method previously used by our group to calculate the measurement corrections for fixed collimator output factors with the CyberKnife System [3-5] has been adapted to generate equivalent data for the Iris collimator. The treatment head geometry has been simulated using the BEAMnrc code, with the BLOCK module used to simulate the Iris collimator. The EGSChamber code was used to model each detector in order to calculate the absorbed dose within its sensitive volume. MC simulation results obtained using these models were compared with measured TMR, profiles and OF data. The EGS Chamber code takes advantage of the Intermediate Phase Space Storage volume (IPSS), a user-defined volume that contains the positions of the detector along the profile or PDD, and in the case of the OFs, a volume that contains the detector at the beam axis.
For each field size, correction factors kfc"'"fmsr were obtained by calculating the ratio of the absorbed Qclin >Qmsr dose in the sensitive volume of each detector and in a small volume of water on the central axis of the beam (0.5x0.5x0.5 mm) relative to the same ratio calculated for the reference field size (60mm). These simulations were performed for the PTW 60008 and 60012 p-type diodes, Sun Nuclear Edge n-type diode, PTW 31014 Pin-Point chamber, Exradin A16 chamber, and the PTW MicroLion chamber. Simulations were performed using electron beam energies 6.5 MeV - 7.5 MeV, electron beam FWHM 1.6 mm - 2.5 mm, Source-Detector distance 800 mm, and at depths 15 mm and 100 mm. A subset of these results is shown in figure 1. The corrections are as large as 10% for small volume air ionisation chambers, 4% for solid state detectors, and 3% for the liquid filled ionisation chamber at the smallest field diameter (5mm). The correction factor magnitude decreases with increasing field size, approaching unity at diameters > 15mm for all detectors. The variation in correction factor with electron beam FWHM was not significant for the solid state detectors, but was as large as ± 1.5 % for the air ionisation chambers and ± 0.75% for the liquid filled chamber.
The differences between raw (uncorrected) OF measured using different detectors were as large 15% at the smallest field diameter (5mm), with the differences decreasing as field size increased. As shown in our previous studies [3-4], air ionisation chambers conistently yield smaller measured output factors than solid state detectors, and in this work the liquid filled ionisation chamber is found to give results that lie between these two extremes.
253

The appropriate electron beam energy and FWHM was selected using an iterative process involving comparing the corrected measured OF and MC generated OF at each combination of simulation parameters (see [3]). When these kfc'""fmr corrections were applied, the agreement between OF's Qclin 'Qmsr obtained using different detectors was substantially improved, and the corrected results were generally within 1% of the OF obtained by direct MC simulation.
1.10
1.08
1.06
1.04
• | 1.02 M
1.00
0.98
0.94
\ E = 6.5 MeV, FWHM = 2.2 mm • PTW 60012 • PTW MicroLion X PTW 31014
• PTW 60012 • PTW MicroLion X PTW 31014
i
i ±
I ? > ± i $ 5
L I
s :
7.5 10 12.5
Field Diameter (mm) 15 25
FIG 1: kf'Un'f™' for three detectors, generated by MC simulation using electron beam energy 6.5 MeV Qclin <Q,mr and FWHM 2.2 mm. The random uncertainty in each factor is ±0.4%.
REFERENCES
[1] ALFONSO R, ANDREO P, CAPOTE R, et al. A new formalism for reference dosimetry of small and nonstandard fields, Med Phys 35, 2008, 5179-5186
[2] ECHNER GG, KILBY W, LEE M, et al. The design, physical properties and clinical utility of an iris collimator for robotic radiosurgery, Phys Med Biol 54, 2009, 5359-5380
[3] FRANCE SCON P, CORA S, CAVEDON C, Total scatter factors of small beams: A multidetector and Monte Carlo study, Med Phys 35, 2008, 504-513
[4] FRANCESCON P, CORA S, CAVEDON C, SCALCHI P, Application of a Monte Carlo-based method for total scatter factors of small beams to new solid state detectors, JACMP 10, 2009, 147-152
[5] FRANCESCON P, CORA S, CAVEDON C, Correction to "Total scatter factors of small beams: A multidetector and Monte Carlo study" Med Phys 25, 504-513 (2008), Med Phys - in press
254
IDOS, Vienna, 9-12 November 2010 E2-CN-182, Paper No INV015
Ferrous ammonium sulfate dosimeter chemical yield determination for dose measurements standardization in high energy photons
O.Moussousa, T.Medjajea, M.Benguerbab
a Centre de Recherche Nucleaire d'Alger (CRNA), 02 Boulevard Frantz Fanon B.P399 16000 Alger, Algerie b Faculte de Physique, Universite des Sciences et de la Technologie Houari-Boumediene USTHB Alger, Algerie
E-mail address of main author: [email protected]
Introduction and aim
The Algerian SSDL has developed the Fricke dosimetry as an alternative method to ionization chamber for the determination of absorbed dose in water for high-energy photon and electron beams as recommended by AAPM. In this paper we report the results of a set of measurements conducted to calibrate the Fricke dosimeter in the range of absorbed dose up to 25 Gy. The calibration of the dosimeters was performed at energies of M Co gamma radiation, 6 and 18 MV photon beams, using an ionization chamber calibrated in terms of absorbed dose to water as a reference dosimeter. Some results showing the reproducibility of the Fricke system, as well as the evaluation of uncertainty in G (Fe3 ) assessment are presented.
Material and method
The Fricke solution was prepared from analytical reagent grade chemicals and high purity water. The recipe for the Fricke solution is that given in N V Klassen et al [1], The dosimeter ampoules have the following dimensions: inner radius 0.55 cm, height 3.1 cm (referred to the top surface of the liquid in the ampoule) and pyrex side walls thick 0.05 cm.
Fricke solutions irradiation with x-rays photon beams were performed using the beam of a Varian Clinac 1800 linear accelerator at a doe rate of about 1.5 Gy.mn"1. In the 6 MV beam the dosimeters were placed in the water phantom (iaea water phantom) with their geometrical center positioned at a reference depth of 5 g cm"2, with an SSD of 100 cm and a field size of 10 cmxlO cm at the phantom surface, whereas at 18 MV a depth of 10 g cm"2 was used.
The irradiations with 60 Co gamma radiation were performed using an Eldorado therapy unit, model 78, at a dose rate of about 0.5 Gy.mn"1. The dosimeters were placed in a water phantom with their geometrical center positioned at a reference depth of 5 g cm"2, with an SSD of 80 cm and a field size of 10 cmxlO cm at the phantom surface.
Prior to irradiation, according to the IAEA's TRS-398 measurements with a calibrated ionization chamber established the absorbed dose rate to water at the reference depth in a water phantom for each radiation cited above.
Change in optical absorbance before and after irradiation was measured using a calibrated Cary 100 spectrophotometer (Varian). In this work Absorbance readings are made at a wavelength of 303 nm with a bandwidth of 1.5 nm, using a quartz micro cuvette having a path length of 10 mm, and an optical window 4 mm wide and 20 mm high.
Results FIG.l shows the variation of the net absorbance, AA, as a function of absorbed dose to water , Z)w for 60CO , 6 and 18 MV. A good linearity of the response can be observed in the range 5-25 Gy.
255

The sensibility of the Fricke dosimeter which is represented by the slop of the line seems to increase slowly with x-rays energy, but remaining acceptable in the limit of experimental errors bars.
»„ (Cl)
FIG.I. Calibration curve for the Fricke dosimeter for 60 Co, 6 MV and 18 MV photons.
3+ We performed G"(Fc ) calculations using the formula is that given in Ma et al [2]
tf T, rfKdi ^ T.fKdi CO Gspl Dwspl Where Dw is the dose-to-water (Gy) as measured by the reference ionization chamber, AA is the difference in absorbance between the irradiated and unirradiated ferrous sulphate solution, £ is the molar extinction coefficient (220.1 mol"1 .rrf determined in this work), p is the density of the Fricke solution (1.024 g/cm3), 1 is the length of the light path of the cuvette (0.01m), G (Fe3 ) is the radiation yield of ferric ions, f is the absorbed dose conversion factor which converts the dose to Fricke solution in a wall-less vessel to dose to water in the same location (1.003 the mean value taken from the literature [2] ) and Pv.M is the wall correction factor which accounts for the change in the absorbed dose in the Fricke solution resulting from the presence of wall material (Pyrex). In this work the Pwau values are determined using the data obtained from Monte Carlo calculations for Pwa\\ given in Ma et al [2] for NPL vials, because these vials are similar to those used in our laboratory. To facilitate their use these data have been fit to a simple linear expression in terms of TPR fo :
Pwau = 1.02076 - 0.04002 (TPR ^ ) (2)
The values of TPR for radiation qualities investigated in this work are measured and are found to be 0.663, 0.784 and 0.573 for 6 MV, 18 MV and MCo, respectively. Substitution of these values into the equation (2) yields Pwau-values of 0.9942, 0.9894 and 0.9978, for 6 MV, 18 MV and 60Co respectively. Using the slope (AA/BW) of the line from figure 1 for each radiation quality, and the values of all parameters cited above, we calculate G (Fe3 ) into the equation (1). The G-values are found to be 1.598 (± 0.013), 1.5972 (± 0.022) and 1.603 (± 0.022) imol j"1 at 60Co, 6 and 18 MV photon beams, respectively. Our values are in close agreement within uncertainty with those published in the literature [1]. The uncertainty given for G values is the overall uncertainty (k=l) obtained according to the guidelines given in the ISO guide for the expression of uncertainty in Measurement.
REFERENCES
[1] N V KLASSEN, K R SHORTT, J SEUNTJENS and C K ROSS Fricke dosimetry: the difference between G(Fe3+) for "°Co-rays and high-energy x-rays Phys. Med. Biol. 44 (1999) 1609-1624. Printed in the UK PII: S0031-9155(99)01037-4
[2] MA C-M, ROGERS D W O, SHORTT K R, ROSS C K, NAHUM A E and BIELAJEW A F 1992 Wall correction and absorbed-dose conversion factors for Fricke dosimetry: Monte Carlo calculations and measurements Med. Phys. 20 283-92
256
IDOS, Vienna, 9-12 November 2010 E2-CN-182, Paper No INV015
Testing the accuracy of electron transport in the Monte Carlo code FLUKA for calculation of ion chamber wall perturbation factors M. Klingebiel, K. Zink, J. Wulff
Institut fur Medizinische Physik und Strahlenschutz (IMPS), University of Applied Sciences, Giessen, Germany
E-mail address of main author: [email protected]
A reliable Monte Carlo based investigation of ion chambers in medical physics problems depends on the accuracy of the charged particle transport and implementations of the condensed history technique. Improper handling of media interfaces can lead to anomalous results or 'interface artefacts' [1], This work presents a rigorous investigation of the electron transport algorithm in the general purpose Monte Carlo (MC) code FLUKA (2008.3b.1) [2]. A 'Fano test' was implemented in order to benchmark the accuracy of the algorithm. Furthermore, the calculation of wall perturbation factors p,A;, of a Roos type chamber irradiated by electrons were performed and compared with values based on the EGSnrc MC code [3].
In order to perform the Fano test, we followed the methods of Sempau and Andreo [4]. The basic idea is to create a situation where the Fano theorem holds: under charged particle equilibrium (CPE), the fluence of charged particles is independent of the local density as long as the cross sections are independent of the density. In a MC simulation a geometry can be constructed with same material in walls and cavity but differing density. Further, full CPE can be realized and the ratio Q between the calculated and the expected energy deposition in the cavity can be determined, which must be unity for an artefact-free simulation. In our case the inhomogeneity representing an ion chamber was constructed as a cylinder with a 2 mm cavity and walls of graphite, but with differing density. According to Sempau and Andreo [4], using a line source that emits monoenergetic electrons with energy E„ the quantity Q follows:
density and Az is the thickness of wall and cavity, respectively. The wall was made thicker than the maximum range of electrons. The difference of density between wall and cavity was a factor 1000, which resembles the situation in a real ion chamber at normal air pressure. The ratio Q was determined for initial kinetic energy of electrons of 0.5 MeV, 1 MeV, 10 MeV and 20 MeV.
Being a more practical application, a model of a Roos chamber placed at reference depth in a water phantom was implemeted in FLUKA and the wall perturbation factor pwau was calculated for monoenergetic electrons of 6, 7 and 8 MeV. Two independent simulations were performed in which the energy deposition within the sensitive volume of the air cavity was calculated. In the first model the chamber wall was modelled according to the manufacturers specification and in the second the wall was replaced completely by water. The ratio between the latter and the first yields pwaU by definition. The calculated values were compared with results for an identical setup [5] obtained with the EGSnrc system, which is known to allow artefact-free ion chamber simulations [3].
In figure 1 (left) the quanity Q as a function of energy is shown. Within the energy range considered here a deviation less +/-0.75% from the expected result occurs. Hence, FLUKA's electron transport algorithm slightly fails to reproduce the correct answer.
(1)
In the above equation is the scored energy per primary particle with energy is0, p is the mass
257

At lower energies the calculated result is lower than the expected and at higher energies vice versa. Figure 1 (right) presents the determined values for pwall and demonstrates only a significant deviation compared to the EGSnrc results at the lowest used energy.
.JMI.016
2 ,4 3 P. v cm
FIG 1: Left: Ratio of calculated to expected result (quantity Q) as a funktion of kinetic energ\> of the emmitted monoenergetic electrons. The broken line represent a 0.1% level of agreement. All simulation parameters were set to maximum accuracy following FLUKA "s documentation, that is EMFFIX=0.05, single scattering for too short steps and at boundaries, STEPSIZE equalling one third of smallest dimensions. Right: Calculated perturbation factors pwa!! for the Roos chamber as a function of the beam quality specifier R50 for various monoenergetic electron beams, calculated with FLUKA and EGSnrc [5], Error bars indicate the statistical uncertainties (1 <J).
In conclusion, FLUKA's electron transport algorithm is capable to deliver the expected result in a Fano test within <1% at least for the energy ranges investigated here. Reason for the deviations might be an improper handling of the media boundary and failing of the implemented multiple scattering algorithm within the low density air. However, due to the fact that dose ratios are involved for the calculation of wall perturbation factors, the deviations to the EGSnrc results are almost within statistical uncertainties of -0.1%. Only at the lowest energy considered here, a significant deviation can be observed. One must consider that calculation times with EGSnrc are at least one order of magnitude more efficient regarding simulation times.
REFERENCES
[1] BIELAJEW, A. F„ ROGERS, D. W. O. and NAFIUM, A. E. (1985), The Monte Carlo simulation of ion chamber response to Co60- resolution of anomalies associated with interfaces, Phys. Med. Biol. 30, 419-427
[2] FASSO, A., FERRARI, A., RANFT, J. and SAI.A P. (2005), FLUKA: a multi-particle transport code, CERN-2005-10, INFN/TC-05/11, SLAC-R-773
[3] KAWRAKOW, I , MAINEGRA-HING, E„ ROGERS, D. W. 0., TESSIER, F. and WALTERS, B. R. B. (2009), The EGSnrc Code System: Monte Carlo Simulation of Electron and Photon Transport; NRCC Report PIRS-701, National Research Council of Canada.
[4] SEMPAU, J. and ANDREO, P. (2006), Configuration of the electron transport algorithm of PENELOPE to simulate ion chambers, Phys. Med. Biol. 51 (14), 3533-3548
[5] ZINK, K. and WULFF, J. (2008), Monte Carlo calculation of beam quality factors kQ for electron dosimetry with a parallel-plate Roos chamber, Phys. Med. Biol. 53, 1595-1607
258

IDOS, Vienna, 9-12 November 2010 E2-CN-182, Paper No INV015
Conceptual improvements and limitations in non-standard beam reference dosimetry
H. Bouchard1,1. Kawrakow3, J.F. Carrier1, J. Seuntjens"
1 Departement de Physique, Universite de Montreal, Pavilion Roger-Gaudry (D-428), 2900 Boulevard Edouard-Montpetit, Montreal, Quebec H3T 1J4, Canada and Departement de Radio-oncologie, Centre Hospitalier de l'Universite de Montreal (CHUM), 1560 Sherbrooke est, Montreal, Quebec H2L 4M1, Canada
2 Medical Physics Unit, Montreal General Hospital (L5-113), McGill University, 1650 Cedar Avenue, Montreal, Quebec H3G 1A4, Canada
3 National Research Council of Canada (NRC), Ionizing Radiation Standards (M-35), 1200 Montreal Road, Ottawa, Ontario K1A 0R6, Canada
E-mail address of main author: [email protected]
Introduction
Novel nonstandard beams improve target dose conformity as compared to conventional methods, but also increase the complexity of dosimetry procedures. As recent studies demonstrated the invalidity of absorbed dose-to water-based protocols [1,2] to nonstandard beams [3,4], a new workgroup of the IAEA, endorsed by AAPM, published a formalism [5] in preparation of a new protocol applicable to nonstandard beams. Although applying correction factors (k0) to nonstandard beam measurements is recommended in the upcoming protocol, conceptual problems in regards to nonstandard conditions are yet to be resolved. Furthermore, accurate measurements of k0 factors for nonstandard beams need to be performed. In such measurements, accurate uncertainty estimation is also essential, especially in the case where corrections factors are found below the percent level. Evaluations of uncertainties are also important in order to evaluate limiting factors in nonstandard beam dosimetry or to perform sensitivity studies in the design of suitable nonstandard reference fields in the lead up to the new protocol. One goal of the study is to isolate the factors responsible for non-unity corrections in modulated beams, and provide solutions to improve fundamental concepts to be used for nonstandard beams reference dosimetry protocols. Another goal is to provide methods to estimate uncertainties accurately in the measurements of nonstandard beam k0 factors, and complement experimental procedures as well as insights on the uncertainty levels achievable in nonstandard beam dosimetry.
Methods
Ionization chamber response to static and dynamic IMRT deliveries is extensively modeled using the Monte Carlo packages EGSnrc [6,7] and BEAMnrc [8,9]. The Exradin A12 and A14 cylindrical ionization chambers (Standard Imaging, WI, USA) are modeled in details in the code egs chamber [9], IMRT deliveries are simulated with BEAMnrc a model of a Varian Clinac 21 EX 6 MV photon beam with Millennium 120 multileaf collimator (MLC). Chamber perturbation factors are calculated defining a series of scoring volumes similarly to previous studies [10,11] (see figure 1). High gradient conditions are used during calculations [3] to obtain significant overall correction factors. An exhaustive characterization and uncertainty analysis method applied to radiochromic film dosimetry is performed to improve accuracy and precision to the levels required by reference dosimetry.
259

A complete account of the sources of uncertainties is considered in details (see table 1) and full variance analysis is performed, including statistical correlations of the obtained doses and improvement in film response to dose characterization. Experimental criteria for achieving required levels of uncertainties are predicted using the method.
An implementation of original unbiased statistical estimators of dose uncertainty and k0 uncertainty provoked by setup positioning is performed in egschamber, this in order to estimate these type B experimental uncertainties during nonstandard beams measurements. Models of the Exradin A12 chamber and the PTW (Freiburg, Germany) 60012 diode are used to numerically evaluate uncertainty provoked by positioning in nonstandard beams.
Results
Results show that the factor responsible for large ky in nonstandard beams is the gradient effect [12] (see figure 2), which can be decomposed into two distinctive effects which share approximately half of the overall correction: 1) volume averaging and 2) difference in density between the detection material and water. For ideal nonstandard reference fields defined by the IAEA-AAPM (PCSR), a theoretical expression of ky is obtained. For precise radiochromic film dosimetry, an extensive procedure is developed optimizing of the characterization and uncertainty analysis methods [13], where characterization curve criteria and variance analysis taking into account statistical correlations are developed. Levels of uncertainty of the order of 0.3% are achieved (see figure 3) when carefully following the defined procedure and repeating measurements 10 times [13,14]. The Monte Carlo estimation method of dose uncertainty produced by positioning is successfully constructed and implemented in egs chamber [15]. Arbitrarily defining a positioning precision of 0.5 mm (1 i), uncertainties up to 4% on k0 factors are reported using an Exradin A12 chamber in high dose gradients nonstandard beams (see table 2). For small beams down to 0.5 x 0.5 cm2, uncertainties up to 3% on in-diode OF are found using a PTW 60012 diode (see figure 4), defining a positioning precision of 0.6 mm (1 f).
Conclusions
Results suggest that reporting dose to the volume of the chamber filled with water instead of a point of measurement would cut the correction factors magnitude about in half. In future developments, if correction factors of nonstandard reference fields (PCSR) as well as clinical deliveries are in agreement with theory, in-water output factors (OF) would be obtained by dividing the in-chamber OF measurement by the gradient perturbation factor (Pgr) of the reference field used for normalization. Otherwise, in-chamber OF measurements could be used directly in QA procedures without the need for intermediate steps of in-water OF nor k0 calculations, since accurate calculations would be required to model chamber response. Limitations in accuracy would then rely on chamber response models using Monte Carlo techniques. Results of positioning-induced uncertainties in nonstandard beam suggest possible limitations in the precision achieved in clinical nonstandard beam measurements, as compared to the actual standards. Not only can this study potentially help improving concepts in the new generation of protocols, but also suggest limitations in the accuracy of nonstandard beam dosimetry, as uncertainties become crucial in such conditions.
260

Figures
Dr.
<•> b) c) J) c> 0 (I tO i) Field nu m bci j) t) i)
FIG 1: Illustration of the series of cavity doses FIG 2: Behavior of the gradient perturbation simulated to calculate the perturbation factors. effect (P„.) and the density perturbation effect (Pp)
for the Exradin A12 chamber under 14 IMRT beams.
I OS Q 3 0
£ 0.5
(3 )
pes
*--* 12 *••* 18 fb * • -V 35 pta
*--* 12 *••* 18 fb * • -V 35 pta
• k- - — - . . .
I : - I - — - - V £ h- - ^
• —. * k- • - H
i " 8
I 5 Of. Jos
OJ 0.) 0.2
(II ID <4 repcjd 0.(1
• 7 pes »"• 9 ft*
\ \ »-IK
: t •» 35pb \
**
i \ i
wg 1, 1
j lii-
- • , V I 1(1
Numtwi Fcpcutcl (newiTcmcn*
FIG 3: Uncertainty calculation as a function of the number of measurement repetition for different numbers of points used to characterize the sensitometric carve, for measurement of a) absolute dose and b) dose ratios.
7 8 Square Held size (mm)
FIG 4: Calculation results of output factors PIDU in small beam measurements using a PTW 60012 diode model with both isocenter and detector uniform displacement of±l mm.
261

Tables
Type Action for reducing uncertainly Dependence on QD Dependence on size of ROl
(1) Film manufacturing
(a) Emulsion homogeneity B
(b) Perturbation effects and energy dependence B
(c) Temperature and humidity dependence B
(d) Sensitivity to polarized tight B
(e) Stabilization of chemical reaction B
(2) Film manipulation (a) Foreign bodies (dust, scratches, fingerprints, folded B
edges)
(b) Storage environmental conditions B
(3) Irradiation process
(a) Stochastic nature of dose deposition B
(b) Measurement setup uncertainty B
(c) Linac output reproducibility A (d) Dose variation within region of interest B
(4) Digitization process (a) Stochastic nature of optical photons detection (shot B
noise)
(b) Scanner homogeneity B
(c) Scanner reproducibility and stability (dark noise, A/B readout noise, scanner mechanics, lamp stability. Newton rings)
(d) Numerical manipulation (rotation, registration) B
(5) Film characterization (a) Sensitometric curve uncertainty B
Neglected
Neglected
Keep temperature and humidity constant during digitization
Monitor film temperature and air humidity to assure constancy during digitization (within ±0.6 and ±5°)
Allow 48 hours to pass before digitization
Use gloves during manipulation, clean all contact surfaces with alcohol-free screen cleaner, use air jet to
clean dust from film, and use framed paper cutter to get film pieces
Keep film in tempered storage room
Use size of ROl greater than threshold
Neglected
Use ionization chamber during film calibration Use as ftat dose profile as possible over ROl
Parametrize uncertainty' with ROl
Correct mathematically using an OD-dependent 8-degree polynomial fit ubtained from homogenous film
bands irradiated with a flat electron beam Use average of multiple scans and warm-up scanner
before use
Neglected
Use large number of points
No
No
No
No
No
Yes (for ROl smaller Lhan threshold only)
No
No
No
Yes (for ROl smaller than threshold only)
Yes
No
No
No
No
Yes
No
No
No
Yes
Yes
Table 1: Summary of all sources of uncertainty on net optical density during the calibration process of radiochromic film dosimetry.
Field RCD RDF (chamber volume) RDF (small sphere) k 0 (chamber
volume) Ay (small sphere)
(a) t » (c) (d) (e) (0
0.3536(4) ±0.005(1} 0.4505(5) ±0.006(1)
0.2178(3) ± 0.0039(7} 0.5118(4) ±0.003(2)
0.2107(3) ±0.0026(8) 0.1622(2} ±0.0103(8)
0.3687(2) ±0.0039(3) 0.4578(2) ±0.0056(3) 0.2141(1) ±0.0045(2) 0.5181(2) ±0.0041(2) 0.2101(1) ±0.0030(2) 0.1661(1) ±0.0113(2)
0.411(1) ±0.022(3) 0.433(1) ±0.136(2) 0.1980(7) ±0.041(1) 0.518(1) ±0.064(1)
0.1619(6) ±0.0252(9) 0.284(1} ±0.058(3)
1.0428(0) ± 0.009(6) 1.0162(0) ±0.00(2)
0.9827(0) ± 0.008(5) 1.0123(0) ±0.000(4) 0.9975(0) ±0.00(1) 1.0243(0) ± 0.038(9)
1.1612(0) ±0.063(9) 0.9601(0) ±0.353(5) 0.9090(0) ±0.242(6) 1.0115(0) ±0.134(3) 0.7685(0) ±0.175(6) 1.7538(1) ±0.20(1)
Table 2: Results obtained from dynamic IMRT beam simulations with an Exradin A12 chamber placed at 5 cm depth in a 30 x 30 x 30 cm3 phantom using an SAD of 100 cm.
262

REFERENCES
[1] P. R. ALMOND, P. J. BIGGS, B. M. COURSEY, W. F. HANSON, M. S. HUQ, R. NATH, AND D. W. O. ROGERS, "AAPM's TG-51 protocol for clinical refer- ence dosimetry of high-energy photon and electron beams," Med, Phys. 26(9)", 1847-1869, 1999.
[2] INTERNATIONAL ATOMIC ENERGY AGENCY, "Absorbed dose determination in external beam Radiotherapy: An international code of practice for dosim- etiy based on standards of absorbed dose to Water," IAEA Report No. TRS-398, 2001.
[3] H. BOUCHARD and J. SEUNTJENS, "Ionization chamber-based reference dosimetry of intensity modulated radiation beams," Med. Phys. 31 (9)", 2454-5465, 2004".
[4] R. CAPOTE, F. SANCHEZ-DOBLADO, A. LEAL, J. I. LAGARES, R. ARRANS, AND G. H. HARTMANn, An EGSnrc Monte Carlo study of the microionization chamber for reference dosimetiy' of narrow irregular IMRT beamlets," Med. Phys. 31(9)", 2416-2422, 2004".
[5] R. ALFONSO, P. ANDREO, R. CAPOTE, M. SAIFUL HUQ, W. KILBY, P. KJALL, T. R. MACKIE, H. PALMANS, K. ROSSER, J. SEUNTJENS, W. ULLRICH, AND S. VATNITSKY, "A new formalism for reference dosimetry of small and nonstand- ard fields," Med. Phys. 35(11), 5179-5186,2008.
[6] I.KAWRAKOW, "Accurate condensed history Monte Carlo simulation of electron transport. I. EGSnrc, the new EGS4 version," Med. Phys. 27(3), 485-498, 2000.
[7] WULFF, K. ZINK, and I. KAWRAKOW, "Efficiency improvements for ion chamber calculations in high energy photon beams," Med. Phys. 35(4), 1328-1336, 2008.
[8] D. W. O. ROGERS, B. A. FADDEGON, G. X. DING, C.-M. MA, J. WE, and T. R. MACKIE, BEAM: A Monte Carlo code to simulate radiotherapy treatment units, Med. Phys. 22 (5), 503-524, 1995.
[9] D. W. O. ROGERS, B. WALTERS, AND I. KAWRAKOW, "BEAMnrc users manual, ionizing radiation standards," National Research Council of Canada, Ottawa, NRC Report No. PIRS-509, 2006.
[10] L. A. BUCKLEY AND D. W. O. ROGERS, "Wall correction factors, Pwall, for thimble ionization chambers," Med. Phys. 33 (2), 455-464, 2006.
[11] J. WULFF, J. T. HEVERHAGEN, AND K. ZINK, "Monte-Carlo-based perturbation and beam quality correction factors for thimble ionization chambers in high-energy photon beams," Phys. Med. Biol. 53 (11), 2823-2836, 2008.
[12] H. BOUCHARD, J. SEUNTJENS, J. CARRIER and I. KAWRAKOW, Ionization chamber gradient effects in nonstandard beam configurations, Med. Phys. 36 (10), 4654-4663, 2009.
[13] H. BOUCHARD, F. LACROIX, G. BEAUDOIN, J. CARRIER, and I. KAWRAKOW, On the characterization and uncertainty analysis of radiochromic film dosimetry, Med. Phys. 36 (6), 1931-1946, 2009.
[14] E. CHUNG, H. BOUCHARD and J. SE UN J TENS, Investigation of three radiation detectors for accurate measurement of absorbed dose in nonstandard fields, Med. Phys. (in press) 2010.
[15] H. BOUCHARD, J. SEUNTJENS and I. KAWRAKOW, A Monte Carlo estimator of setup positioning-induced dose uncertainty, Med. Phys. (submitted).
263

IDOS, Vienna, 9-12 November 2010 E2-CN-182, Paper No INV015
Experimental evaluation of reference dosimetry for non-standard fields in an aperturebased IMRT system
R. Alfonso-Laguardiaa, E. Larrinaga-Cortinaa, L. De la Fuente I. Silvestre-Patalloa
a Department of Radiotherapy, Institute of Oncology and Radiobiology (INOR), Havana, Cuba
b Department of Neurosurgey, Institute of Neurology and Neurourgery (INN), Havana, Cuba
E-mail address of main author: [email protected]
The use of the IMRT has become commonplace, even in many developing countries. However, several studies has evidenced that IMRT treatments are not as accurate as expected/desired [1], Measurements of dose in composite fields has not been standardized and reference conditions of the composite fields are not defined in the present standard dosimetiy protocols. The international initiative of IAEA for extending the ND,W based dosimetry protocols to small and non-standards fields [2], as those used in stereotactic radiosurgery and IMRT, has been implemented in a aperture-based IMRT system. For composite fields like those used in IMRT plans, the IAEA initiative suggests an intermediate calibration condition, in which a "plan-class specific reference field (fpcs,) is created by a specific delivery sequence, similar to clinically delivered irradiation patterns. This field arrangement should be able to ensure a uniform dose distribution larger than the extent of the ion chambers used for patient-specific QA, achieving CPE in that volume. Under these conditions, the absorbed dose to water irradiated by a composite field fpesr, at the reference depth in water, in a beam of quality Qpcsr, in the absence of the chamber, can be obtained with the conventional formalism, adding a correction factor that accounts for the difference in ion chamber responses between the conventional reference field /,,.. (usually the 10x10 cm2 field) and thefpcsr, as follows:
rv' pcsr _ A 4 1 1VT . 1, . t-lpcsrdref w'QPcsr QpcSr
KQ,Oa ^ O pcsr ,Q
The purpose of this study was to design a representative fpcsr for H&N treatments with static, aperture' f fpcsr ">fr %csr,Q based IMRT, and evaluate the corresponding correction factors kp^'p* for the ion chambers used in
the clinic.
IMRT treatments at the Department of Radiotherapy (INOR) in Havana have being implemented with Elekta Precise" linear accelerators and Elekta 's PrecisePLAN6 treatment planning system (TPS). This TPS uses an aperture-based inverse planning approach, which creates static apertures prior to calculating dose using several rationales. The rationale used for developing these apertures is not limited to those automatically created by the TPS since it may include user-designed apertures. For establishing a representative fpcsr, a revision of most of the local H&N IMRT plans was done, combined with the recommended structure set of test 13 (mock head/neck) in the AAPM TG-119 report [3], resulting in a averaged structure set, field arrangement and segment sequence. Two targets volumes (PTV including neck nodules and boost PTV) and two OAR (spinal cord and parotids) were defined in a slab phantom composed by water-equivalent plastic (RW3 . PTW, Freiburg). The phantom permits point measurements both with ion chambers and planar dosimeter (films). A beam arrangement consisting of 9 fields at typical angles averaged over the local plans was applied. The inverse planning protocol with representative dose goals was employed for obtaining the set of segments per beams, their shape and weights.
265
Due to the shape of the used phantom, the fpcsr was assessed for collapsed beam delivery technique, at 0° gantry angle; a measuring point was defined at the uniform dose region for this beam arrangement, as shown in Fig. 1.
In order to measure the - k g ^ ' ^ correction factors for the different ion a chamber, a suitable dose
detector is required, such as alanine, Fricke dosimeter or radiochromic films. In this study the GAFchromic EBT2 film (International Special Products) was chosen due to its good energy response, low perturbation, wide dose range and reported achievable precision. The film sheets were cut into small pieces (1.5 x 2.0 cm) and calibrated in the RW3 phantom for 6MV photons. Scanning settings of a flatbed, 48 bit colour film-scanner were optimized in order to obtain the highest precision in the net optical density. A combined uncertainty of 0.8% (la) was obtained for the dose calibration of the EBT2-scanner system. This allowed measuring the relative dose factor for the fpcsr respect to the fref with acceptable dosimetric accuracy, resulting in a value of 0.753±0.006.
The relative cavity dose factors were measured for the proposed fpcsr, with three different ion chambers (farmer 0.6cc, semiflex 0.125 cc and pinpoint 0.016 cc). Consequently, the correction factors for these chambers were found out, as shown in Table 1.
Ion chambers
Farmer PTW 30103 Semiflex PTW31010 Pinpoint PTW 31016 Relative cavity factor 0.758 0.760 0.757
3L fpcsr' fref QpcsrM 0.994 0.991 0.996
The study has evaluated a procedure for establishing the fpcsr in an aperture-based inverse planning IMRT system. The obtained correction factors, as expected for the designed fpcsr, are veiy close to unity. These results are in agreement with our routine chamber measurements of IMRT patient-specific QA. Monte Carlo computation of the relative dose factor for the proposed fpcsr is in progress.
REFERENCES
[1] DAS, I. J., CHENG, C„ CHOPRA, K. L„ MITRA, R. K„ SRIVASTAVA, S. P., GLATSTEIN, E., Intensity-modulated radiation therapy dose prescription, recording, and delivery: Patterns of variability among institutions and treatment planning systems, J. Natl. Cancer Inst. 100, (2008) 300-307
[2] ALFONSO, R„ ANDREO, P., CAPOTE, R„ SAIFUL HUQ, M„ KILBY, W„ KJALL, P., MACKIE, T. R„ PALMANS, H„ ROSSER, K„ SEUNTJENS, J., ULLRICH, W„ VATNITSKY, S., A new formalism for reference dosimetry of small and nonstandard fields, Medical Physics, Vol. 35, No. 11 (2008) 5179-5186.
[3] EZZEL, G. A. et al, IMRT commissioning: Multiple institution planning and dosimetry comparisons, a report from AAPM Task Group 119, Medical Physics, Vol. 36, No. 11, (2009) 5359-5373.
266

IDOS, Vienna, 9-12 November 2010 E2-CN-182, Paper No INV015
Response of alanine dosimeters in small photon fields
M Anton, A Krauss, R-P Kapsch, T Hackel
Physikalisch-Technische Bundesanstalt, Bundesallee 100, 38116 Braunschweig, Germany
E-mail address of main author: [email protected]
Within the framework of the European project JRP7 "External Beam Cancer Therapy" (EBCT), the response of alanine dosimeters in different non-reference conditions was investigated. The secondary standard measurement system of the Physikalisch-Technische Bundesanstalt (PTB) was used for this purpose [1], which is traceable to the PTB's water calorimetry primary standard [2]. For two x-ray qualities, the response to the dose to water relative to the response for the 60Co reference field was determined experimentally and via Monte Carlo simulation.
Alanine dosimeters were irradiated in the 6 MV and 10 MV x-ray fields of a clinical elekta accelerator which is part of the accelerator facilities of PTB. Field sizes were 10 cm x 10 cm and 3 cm x 3 cm, respectively. The dose was determined with ionization chambers (transmission and thimble) that had been calibrated using water calorimetry immediately before the alanine irradiations. Within a few days, a set of alanine dosimeters were irradiated in the Co reference field with a field size of 10 cm x 10 cm. For each quality, at least four dosimeters, each containing four alanine pellets from the manufacturer Harwell, were irradiated with doses between 12.5 Gy and 22.5 Gy in a water phantom. For the larger field, a stack of four pellets was irradiated in a watertight sleeve for a Farmer (NE2571) chamber. For the smaller field size, a stack of four pellets was shrink-wrapped in polyethylene foil (0.2 mm thickness) that was spanned in a polymethylmetacrylate frame. The response was determined with the help of the cobalt irradiated pellets as was detailed in a previous publication [3]. The irradiation and calibration procedure was repeated at least four times for each quality and field size.
In addition, the response was calculated using the EGSnrc Monte Carlo simulation package. Two simulations were carried out per quality and field size, one with a simplified (rotationally symmetric) geometry with the user code DOSRZnrc, one with a realistic geometry with the cavity user code of EGSnrc.
The results are displayed in Figure 1. The response to the dose to water relative to 60Co (10cm x 10 cm) is shown as a function of the ratio TPR10
20. On the right, the results for the 3 cm x 3 cm field are shown and on the left, for comparison, the results for the 10 cm x 10 cm field are shown. For the experimental data, error bars represent the standard measurement uncertainty including the uncertainty of the primary standard. The latter is the dominant component in the uncertainty budget; for the larger field the overall uncertainty is 0.3% whereas for the smaller field it is 0.5%. For the simulated data, the error bars represent the statistical uncertainties only. For the 10 cm x 10 cm field, the data for 8 MVX and 16 MVX published earlier are added.
267

10 cm x 10 cm field size 1.005
0.995
099
o a
• Co * measurement O MC dosri • MC cavity
0.985 0.55 0.6 0.65 0.7 0.75
TPR?° 0.8
3 cm x 3 cm field size 1 .005
0.995
0.99
0.985
• 60Co A measurements O MC dosrz • MC cavity
0.55 0.6 0.65 0.7 0.75 0.3 TPFT°
FIG. 1. Response of alanine dosimeters w.r.t. the absorbed dose to water, relative to the response in a cobalt reference field (size 10 cm x 10cm). Left: experimental and simulated data for field size
10cm x 10cm; Right: field size 3cm x 3cm The experimental data (and the 60Co reference) are represented by the full symbols while the open symbols represent the simulated data. The simulations with the realistic geometry (open squares) and the simulations for the rotationally symmetric case (open circles) agree very well within the statistical uncertainties. Comparing with the experimental data, only the measurements for 10 MVX appear to be lower; in general, the agreement between simulation and measurement is very good within the limits of uncertainty. Within these limits, it is hard to tell whether there is an effect of the field size on the alanine response: only the simulated data suggest an increase of the response by about 0.2% - 0.3%.
The experimental results for the 10 cm x 10 cm field agree very well with published data from the NRC [4]. Overall, the influence of quality and size of the high energy photon fields is very small, as was expected.
ACKNOWLEDGEMENT
The research within this EURAMET joint research project leading to these results has received funding fro the European Community's Seventh Framework Programme, ERA-NET Plus, under Grant Agreement No. 217257
REFERENCES
[1] ANTON, M„ Uncertainties in alanine/ESR dosimetry at PTB, Phys. Med. Biol. 51 (2006) 5419-5440
[2] KRAUSS, A., The PTB water calorimeter for the absolute determination of absorbed dose to water in 60Co radiation, Metrologia 43 (2006) 259-272
[3] ANTON, M„ KAPSCH, R.-P., KRYSTEK, M„ RENNER, F„ Response of the alanine/ESR dosimetry system to MV x-rays relative to o0Co radiation, Phys. Med. Biol. 53 (2008) 2753-2770
[4] ZENG, G. G„ McEWEN, M. R, ROGERS, D. W. O., KLASSEN, N. V., An experimental and Monte Carlo investigation of the energy dependence of alanine/EPR dosimetry: I. Clinical x-ray beams, Phys. Med. Biol. 49 (2004) 257-270
268

IDOS, Vienna, 9-12 November 2010 E2-CN-182, Paper No INV015
Chamber quality factors for the NACP-02 chamber in 60Co beams: Comparison of ECSnrc and PENELOPE Monte Carlo simulations
J Wulff, K Zink
Institut fur Medizinische Physik und Strahlenschutz, University of Applied Sciences GieBen, Germany
E-mail address of main author: [email protected]
Clinical dosimetiy requires a beam quality correction factor kg (see e.g. [1]). An ion chamber and beam quality dependent factor f jjn (abbreviated chamber-quality factor cf. Ref. [2]) enters the determination of kg and equals the product of the stopping power ratio between water and air sw,a and the overall perturbation factor p in the reference beam (usually Co60).
Panettieri et al used the PENELOPE Monte Carlo code to calculate f.g0=\. 1578(8) for the NACP-02 plane parallel ion chamber at a stated 0.6% uncertainty level, which was based on statistical uncertainty and approximated by the relative uncertainty for $wa [2], They compared their results with calculations by Mainegra-Hing et al. based on the EGSnrc system and demonstrated an almost perfect agreement. However, if one takes the j?wa//=l.0204(8) factor and stopping power ratios .s , , 1.1332 of Ref. [3] as well as .ep/=pcm,*prf(S=l.0065(10) by Wang and Rogers [4] (all of them based on EGSnrc) a value of fc,Qo= 1.164(1) results. This corresponds to a fairly large -0.5% deviation between the two codes. Meanwhile Chin et al have revised the data on the NACP-02 chamber's entrance window mass thickness by tuning their MC model, leading to 140 mg/cm2 instead of 104 mg/cm2 used in all other studies [5]. In the light of the mentioned discrepancies and the revised NACP-02 model, we recalculated f g 0 directly with EGSnrc (instead of multiplying single factors) and investigated the systematic uncertainties as a possible explanation for the observed deviations.
We used the egs chamber code [6] of the EGSnrc system to calculate the chamber dose in a water phantom. Dose to water was scored in a thin slab of water (0.2 mm thickness, 5 mm radius). fc,0o was calculated as the dose ratio with a combined statistical uncertainty of <0.1% (la) default transport parameters of EGSnrc. Cutoff/threshold energies of PCUT=AP=1 keV and ECUT=AE=521 keV were used. As default a C06O spectrum was used. Various tranport settings of EGSnrc were tested, including different cross-section databases, turning on/off various options and changed energy cut-offs. Further variations in the source and geometry were investigated. For this purpose, different C06O spectra and a complete phase space of a clinical Cobalt treatment unit were used as radiation source. We determined /10o as a function of entrance window mass thickness, either by changing the mass density or the thickness of the MYLAR and carbon constituting it. In a final step the contribution of electron cross section uncertainties (more precisely the excitation energy I) to the total uncertainty of fc g0 was estimated. This was accomplished by determining the sensitivity of to changes of the /-value in a linear approximation and assigning the corresponding uncertainties.
Only reducing the electron transport cutoff-energy and production threshold respectively led to a significant deviation of -0.2%. That is in agreement with the findings in Ref. [3]. Turning on Rayleigh scattering resulted in an almost insignificant change of f ga by 0.13%. All other variations in the transport parameter settings of EGSnrc did not alter the results beyond statistical uncertainties of -0.1%. Different Co-60 spectra altered the calculated values by up to 0.17%, whereas using a complete phase-space instead of its spectrum did not influence the result.
In figure 1, the chamber-quality factor f c g a is shown as a function of entrance wall mass thickness. Changing the density or thickness of the carbon layer leads to similar results, whereas a changed MYLAR thickness of up to 50% does not alter the chamber-quality factor.
269
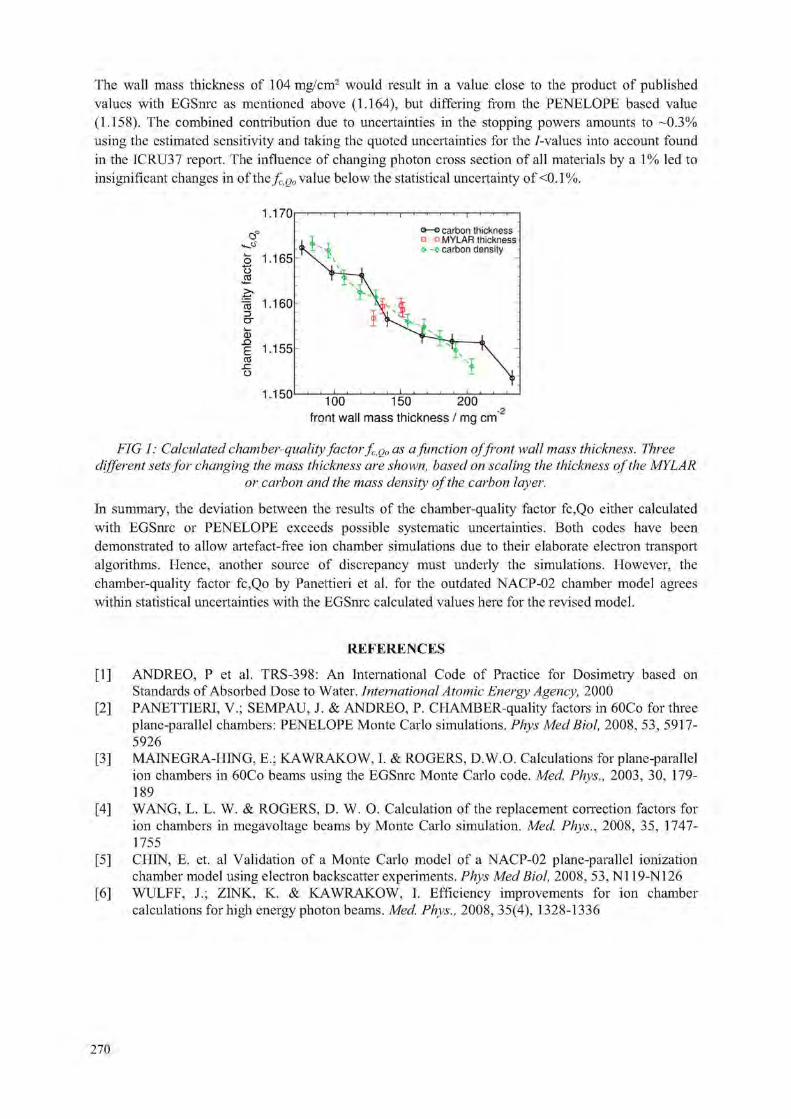
The wall mass thickness of 104mg/cm2 would result in a value close to the product of published values with EGSnrc as mentioned above (1.164), but differing from the PENELOPE based value (1.158). The combined contribution due to uncertainties in the stopping powers amounts to -0.3% using the estimated sensitivity and taking the quoted uncertainties for the /-values into account found in the ICRU37 report. The influence of changing photon cross section of all materials by a 1% led to insignificant changes in of theX.oo value below the statistical uncertainty of <0.1%.
1.170
100 150 200 front wall mass thickness / mg cm 2
FIG 1: Calculated chamber-quality factor fc,Q„ as a function offront wall mass thickness. Three different sets for changing the mass thickness are shown, based on scaling the thickness of the MYLAR
or carbon and the mass density of the carbon layer.
In summary, the deviation between the results of the chamber-quality factor fc,Qo either calculated with EGSnrc or PENELOPE exceeds possible systematic uncertainties. Both codes have been demonstrated to allow artefact-free ion chamber simulations due to their elaborate electron transport algorithms. Hence, another source of discrepancy must underly the simulations. However, the chamber-quality factor fc,Qo by Panettieri et al. for the outdated NACP-02 chamber model agrees within statistical uncertainties with the EGSnrc calculated values here for the revised model.
REFERENCES
[1] ANDREO, P et al. TRS-398: An International Code of Practice for Dosimetry based on Standards of Absorbed Dose to Water. International Atomic Energy Agency, 2000
[2] PANETTIERI, V.; SEMPAU, J. & ANDREO, P. CHAMBER-quality factors in 60Co for three plane-parallel chambers: PENELOPE Monte Carlo simulations. Phys Med Biol, 2008, 53, 5917-5926
[3] MAINEGRA-HING, E.; KAWRAKOW, I. & ROGERS, D.W.O. Calculations for plane-parallel ion chambers in 60Co beams using the EGSnrc Monte Carlo code. Med. Phys., 2003, 30, 179-189
[4] WANG, L. L. W. & ROGERS, D. W. O. Calculation of the replacement correction factors for ion chambers in megavoltage beams by Monte Carlo simulation. Med. Phys., 2008, 35, 1747-1755
[5] CHIN, E. et. al Validation of a Monte Carlo model of a NACP-02 plane-parallel ionization chamber model using electron backscatter experiments. Phys Med Biol, 2008, 53, N119-N126
[6] WULFF, J.; ZINK, K. & KAWRAKOW, I. Efficiency improvements for ion chamber calculations for high energy photon beams. Med, Phys., 2008, 35(4), 1328-1336
270

IDOS, Vienna, 9-12 November 2010 E2-CN-182, Paper No INV015
Comparison of calibration methods of plane parallel ionization chambers for electron beam dosimetry
I. Jokelainen, A. Kosunen
STUK - Radiation and Nuclear Safety Authority, Helsinki, Finland
E-mail address of main author: ilkka.jokelainen@stuk. fi
IAEA dosimetry protocol TRS 398 [1] describes tree optional methods for calibration of plane parallel (PP) ionization chambers for absorbed dose to water (ADW); calibration in a ' Co gamma beam in a SSDL, calibration at a series of electron beam qualities in a PSDL or cross-calibration in a high-energy electron beam in a clinic.
Since 1999 the calibrations of PP ionization chambers in Finland have been done by cross-calibration method in user electron beams (16 MeV or 20 MeV) by the SSDL of STUK. The reason for using the cross-calibration method was the high variation of wall correction factors (pwaii)co in 60Co beam between the same type of the parallel-plate chambers NACP-E and CALCAM which forbids the use of type-specific (pwaii)co [5]. Finnish hospitals have replaced these type of chambers with Roos and NACP-02 PP chambers. For Roos type PP chambers low chamber-to-chamber variation of (pwaii)co have been published [2,4], In Finnish hospitals the IAEA TRS 398 dosimetry protocol has been used for electron beam dosimetry since 2003.
A comparison between cross-calibration and "Co calibration methods for 13 PP chambers of Roos type (11 PTW 34001, 2 Scanditronix-Wellhofer PPC40) and 5 Scanditronix NACP-02 type chambers from Finnish hospitals was performed. Total of 22 cross-calibrations were carried out in a 16 MeV electron beam of Varian Linac iX accelerator at Docrates clinic in Helsinki and 54 calibrations in a 60Co beam at the SSDL of STUK. In both methods the reference dose was measured by cylindrical ionization chambers calibrated in c0Co beam at the SSDL of STUK traceable to BIPM.
The absorbed dose to water calibration coefficients were determined for electron beam quality (Q) Rso.ion = 3,5cm. For Roos and NACP-02 type chambers the ratio of the calibration coefficients for " 'Co calibration ( N 0 Cb) and for cross-calibration ( N n cross) are shown in Fig 1.
The experimental overall perturbation factors pFP0 for chambers were determined from results of
60Co and cross calibrations.
PP = p g PP
A/fcyI A TcyI jicv/ ~ 1V10 O.Co Po
The chamber type specific p'''' were determined by averaging over all p''' values of the same
chamber type. For Roos and NACP-02 chamber types values PcT"= 1,024 and p'^ff = 1,026 with
chamber-to-chamber variation 0,2 % and 0,3 % were determined.
The determined chamber type specific p ' '' values are consistent with earlier results reported 2001-2007 for Roos chambers [2,3,4,7] and NACP-02 chambers [6,8]. For Roos type chamber the determined p F F deviates 1 % from data used in IAEA dosimetry protocol TRS 398 [1].
271

Based on the results of this study, labour-consuming cross-calibrations of PP chambers are not necessary for the PP chambers used in Finland. However, the results of current studies for p'( '' indicate also that the data of TRS 398 needs to be updated.
1,010 1,008 1,006 1,004
| 1,002 I 1,000
? 0,998 q 0,996
z " 0,994 0,992 0,990 0,988 0,986
0 1 2 3 4 5 6 7 8 9 10 11 12 13 14 15 16 17 18 19
Chamber No.
FIG. 1. Ratio of electron beam (M$qrion = 3,5cm ) ADW calibration coefficients for 60Co calibration
(N0 Co) andfor cross-calibration (N0 cross).
REFERENCES
[1] IAEA, International Atomic Energy Agency, Absorbed dose determination in External Beam Radiotherapy. An international code of practice for Dosimetry Based on Standards of Absorbed Dose to Water, Technical reports series no. 398, 2000.
[2] CHRIST G„ DOHM O.S., Bruggmoser G„ SCHULE E„ The use of plane-parallel chambers in electron dosimetry without any cross-calibration, Phys. Med. Biol. 47 (2002) N121-N126.
[3] DOHM O.S., CHRIST G„ NUSSLIN F„ Electron dosimetry based on the absorbed dose to water concept: A comparison of the AAPM TG-51 and DIN 6800-2 protocols, Med. Phys. 28 (2001)2258-64.
[4] KAPSCH R. P., BRUGGMOSER G„ CHRIST G„ DOHM O.S., HARTMANN G.h., SCHULE E., Experimental determination of pCo perturbation factors for plane-parallel chambers, Phys. Med. Biol. 52 (2007)7167-81.
[5] KOSUNEN A., jARVINEN H„ SIPILA P., Optimum calibration of NACP type plane parallel ionization chambers for absorbed dose determination in low energy electron beams IAEA-SM-330/41 (1994), 505-513.
[6] PALMANS H„ NAFAA L„ de PATOUL N„ DENIS J-M., TOMSEJ M„ VYNCKIER S„ A three clinical electron beam energies, Phys. Med. Biol. 48 (2003) 1091-1107.
[7] PALM A., CZAP L., ANDREO P., MATTSSON O., Performance analysis and determination of the p w a n correction factor for "Co y-ray beams for Wellhofer Roos-type plane-parallel chambers, Phys. Med.Biol. 47 (2002) 631-40.
[8] STEWART K., SEUNTJENS J., Comparing calibration methods of electron beams using plane-parallel chambers with absorbed-dose to water based protocols, Med. Phys. 29 (2002) 284-9.
. . • • . * . • * A
A • PTW34001
WH PPC40 V a NACP-02 A
k
272

IDOS, Vienna, 9-12 November 2010 E2-CN-182, Paper No INV015
Influence of pulse length and high pulse dose on saturation correction of ionization chamber
L. Karsch, C. Kicliter. J. Pawelke
OncoRay - Center for Radiation Research in Oncology, TU Dresden, Medical Faculty, Germany
E-mail address of main author: [email protected]
Existing standards for dose measurement with ionization chamber (IC) in pulsed radiation fields include saturation correction with respect to pulse dose but not to pulse length. This is sufficient for radiotherapy application at pulsed beams delivered by clinical linear accelerators due to a total saturation correction lower than 1 % with a non measurable contribution by pulse length correction. However, novel technologies like laser acceleration generate particle and X-ray beams with shorter pulse duration and much higher pulse dose.
This work presents both theoretical and experimental studies of the dependence of saturation correction on pulse length and pulse dose for an Ross IC (PTW Freiburg). The investigated range of 1 to 300 |is pulse duration and 5 to 250 mGy pulse dose includes the parameters reached by conventional clinical linear accelerators (about 5 |is and 5 mGy, respectively). First, the saturation as a function of pulse length and pulse dose was experimentally determined at the superconducting electron linear accelerator ELBE at Forschungszentrum Dresden-Rossendorf. The accelerator delivers an electron beam of 20 MeV energy with micro pulses of 5 ps length and 13 MHz frequency (77 ns period between two micro pulses). The number of micro pulses to form a macro pulse can be set by the user in the range of 1 to 107. The integral dose delivered by a macro pulse was measured simultaneously with the IC and a Faraday cup placed directly behind the IC. In a second step, the pulse length influence was determined by describing the processes inside the IC by means of partial differential equations. WJ„ ,„„„„,„,„
I Wed Mar 10 14:40:07 2010
FIG. 1: The saturation correction factor in dependence on pulse dose of the present experiment (filled symbols) and iterative solution of differential equation system (line) after adjusting its free parameters. Both are in good agreement with experimental results by other groups (open circles).
273

FIG. 2: The pulse length dependence of saturation correction for three different pulse doses. The experimental results are represented by filled circles and the solution of differential equation system by solid line. For better eye guidance two constant dashed lines are shown.
The considered processes are (i) constant production of electrons and ions by irradiation during the macro pulse, (ii) attachment of electrons to neutral atoms resulting in negative ions (iii) motion of all charge carriers with constant velocities and (iv) recombination of positive and negative ions. Other physical effects, e.g. shielding of collecting electrodes by space charge, initial recombination and the micro pulse beam structure, have been neglected for simplification. The resulting differential equation system was solved iterativly. Adjusting the free parameters to the experimental results enables the determination of saturation correction factor ks for pulses with arbitrary pulse doses and durations.
The experimentally determined dose rate dependence (see FIG. 1) at constant pulse duration (5 (is) is in good agreement with measurements of other groups [1]. It is also in good agreement with the german DIN standard [2], but the latter is only valid up to 5 mGy pulse dose. After adjusting the free parameters the differential equation system describes the experimental data very well. The adapted parameters are in good agreement with literature values. The differential equation system describes also the pulse length dependence of saturation correction determined in experiment very well for pulse doses up to 120 mGy (see Fig. 2). For higher pulse doses the differential equation system gives a lower saturation correction factor compared with experiment. Obviously, more physical effects like partial shielding of the collecting electrodes by space charge has to be included in the differential equation system in order to obtain reliable results for higher pulse doses and/or shorter pulse durations. The pulse length correction can be neglected for the IC used at pulse doses up to 120 mGy if the pulse length is lower than 5 |is within an uncertainty of about 2 %. For lower pulse doses the pulse duration may be longer.
These results approved the negligible pulse length correction at conventional clinical linear accelerators which have typical pulse doses of 5 mGy and pulse durations of 5 (is. An extension of existing standards to higher pulse doses as, e.g., delivered by novel laser accelerators should include an appropriate description of pulse length dependence.
REFERENCES
[1] DI MARTINO, M. GIANELLI, A. C, TRAINO and M. LAZZERI, Ion recombination correction for very high dose-per-pulse high energy electron beams, Med Phys 32 (2005), pp. 2204-2210.
[2] DIN-Norm 6800-2:2008-3: Dosismessverfahren nach der Sondenmethode fur Pliotonen- und Elektronenstrahlung - Teil 2: Dosimetrie hochenergetischer Photonen- und Elektronenstrahlung mit Ionisationskammern, 2008.
274
IDOS, Vienna, 9-12 November 2010 E2-CN-182, Paper No INV015
The dosimetry of electron beams using the PRESAGE dosimeter
T Gorjiara3, RHilla b , Z Kuncic3, C Baldock3
a Institute of Medical Physics, School of Physics, University of Sydney, Australia
b Department of Radiation Oncology, Royal Prince Alfred Hospital, Sydney, Australia
E-mail address of main author: [email protected]
PRESAGE is a polymer dosimeter which has the potential of being an easily used three dimensional (3D) dosimeter for complex radiotherapy techniques. For a dosimeter to be used in radiotherapy, it should ideally be water equivalent in terms of radiation interactions over the energy range of interest. Two new PRESAGE polymers have recently been developed with new chemical formulas with corresponding effective atomic numbers of (Zeff) of 7.69 and 7.74. These two new formulations were developed to improve the water equivalency over a larger energy range. In this work, we have calculated the relative dose response of the original and the new two PRESAGE polymer dosimeters, in comparison to water, for high energy electron beams (6 and 12 MeV) using EGSnrc/BEAMnrc Monte Carlo code. Three different PRESAGE polymer dosimeters were evaluated: the currently available PRESAGE as well as two with a new chemical formulation. Total mass stopping powers were calculated over the energy range 10 keV-20 MeV using the NIST ESTAR database for the three PRESAGE dosimeters and water.
Monte Carlo modeling was used to determine the differences in depth doses between the PRESAGE dosimeters and water for 6 and 12MeV electron beams from a Varian 21iXs linac with a 10x10 cm2
field size. All Monte Carlo calculations were performed using the EGSnrc/BEAMnrc package (V4 r225, NRC, Canada). The phase space file for the electron beam generated by BEAMnrc were used to calculate depth dose curves for each of the three PRESAGE dosimeters and water using the DOSXYZnrc user code. The energy cutoff parameters for electron and photon transport, ECUT and PCUT, were set to 0.561 MeV and 0.01 MeV respectively for all simulations. Cross section data for the three PRESAGE dosimeters and water were generated by the PEGS4 preprocessor using the elemental compositions and mass densities of the different materials. In order to compare calculated central axis depth doses in water and in the PRESAGE dosimeters, the water equivalent depth was calculated for each case.
For electron energies of less than 2 MeV, the collisional energy losses dominate and the mass stopping power is greater for water due to having a lower Zeff than the PRESAGE dosimeters. The probability of radiation loss relative to the collisional loss increases as the electron energy and as the atomic number increase. For electron energies higher than 10 MeV where the which radiative stopping power becomes increasing more dominant, the existing PRESAGE dosimeter has the highest differences with the value of water due to having the highest Zeff.
Figure 1 shows the water equivalent Monte Carlo results for dose calculation for the three PRESAGE dosimeters and water for 6 and 12 MeV electron beams. For the calculated relative dose versus water equivalent depth, the new PRESAGE dosimeters were in better agreement with the depth doses calculated in water for the 6 and 12 MeV electron beams. In the buildup region corresponding to less than 1.5 cm water equivalent depth for the 6 MeV beam, the relative dose in water is up to 2% lower than the new PRESAGE dosimeters and 4% higher than the existing PRESAGE dosimeter. This is attributed to the higher collisional stopping power of water than the PRESAGE dosimeters. For the 12 MeV beam in the buildup region corresponding to 3 cm water equivalent depth, the relative dose in water is up to 1% lower than the new PREAGE dosimeters and 4% lower than the existing PRESAGE dosimeter.
275

The depth of maximum dose, in terms of water equivalent depth, is almost the same for the three PRESAGE dosimeters and water, with a value of 1.4 and 3 cm for the 6 and 12 MeV electron beams respectively.
6 MeV
Water equivalent depth (cm)
12 MeV
Water equivalent depth (cm)
FIG. 1. Water equivalent Monte Carlo relative dose curves for 6 and 12 MeV electron beams for the three PRESAGE dosimeters and water.
We conclude that the PRESAGE dosimeter shows potential as a 3D dosimeter for radiotherapy electron beams and can be considered water equivalent provided one uses water equivalent depth for all dosimeters.
276

IDOS, Vienna, 9-12 November 2010 E2-CN-182, Paper No INV015
A Monte Carlo investigation of 31010 ionization chamber perturbation factor for small field dosimetry
P.V.Kazantsevab, V.A.Klimanovb
aN.N.Blokhin Russian Cancer Research Center, Moscow, Russia
b National Research Nuclear University "MEPhl", Moscow, Russia
E-mail address of main author: [email protected]
With advances in technology and improved treatment delivery techniques of high-precision radiotherapy such as stereotactic radiosurgery (SRS), intensity-modulated radiation therapy (IMRT) and image-guided radiation therapy (IGRT), requirements for dosimetry control and quality assurance became much stronger. In particular, this is connected with usage of small fields in all modern techniques [1], Absolute dosimetry of small fields constitutes rather complicated problem due to absence of common protocol, which should include all necessary correction factors for detectors, computed in nonequilibrium conditions of narrow beams.
In this study we used the EGSnrc system [2] with user code egs chamber for modelling of a PTW31010 semiflex chamber, verification of a simplified photon source, evaluation of correction factors for small fields.
A simplified model of 6 MV photon source was chosen for modeling, which was simulated as an isotropically radiating disk collimated in a window of given size on the distance corresponding to the bottom side of MLC leaves. The source spectrum used was taken from NRC publications.
PTW31010 0.125 cm3 semiflex ionization chamber was used for modeling, being one of the most popular detectors for relative and absolute dosimetry. Modeling of the sensitive volume of the chamber was performed in strong accordance with specifications of the manufacturer, although stem was simplified. Both simulation and experiment were performed with vertically positioned IC on depths of 1,5 and 10 cm, SCD=100 cm, with beams size varied from 0.5x0.5 cm to 3x3 cm.
0 5 10 15 20 25 30 Field size, m m
FIG.l. Correction factor depending on the field size (PTW31010, 6MV photons).
277

As a result, profiles and correction factors were obtained. The latter were calculated as a ratio of doses to the cavity of the "real" chamber and a "cavity" of chamber made of pure water (fig. I).
The general model was experimentally verified using profiles obtained from simulation and experiment that showed good results on the depths of electronic equilibrium. Thereby correction factors calculated for 10 cm depth are in a good agreement with the real ones (fig.2).
Real PTW31010 Simulated PTW31G10
• G aim ma-index - A
-30 -20 -10 0 10 20 30' Off axis distance, mm
FIG .2. Comparison of simulated and experimental profiles for PTW31010 (25x25 mm, SSD SCD=100 cm)
=90 cm,
Finally, correction factors for the presence of PTW31010 ionization chamber in small fields according to its size were evaluated. It is expected to continue the study with complicating the source model and evaluating all the correction factors for wide range of ionization chambers, including microchambers.
REFERENCES
[1] 1NDRA J. DAS, GEORGE X. DING, ANDERS AHNESJO, "Small fields: Nonequilibrium radiation dosimetry," Med.Phys. 35, 206-215 (2008).
[2] I.KAWRAKOW et al., "The EGSnrc Code System: Monte Carlo Simulation of Electron and Photon Transport", NRCC Report PIRS-701, 2010.
278

IDOS, Vienna, 9-12 November 2010 E2-CN-182, Paper No INV015
Comparison of calibration factors of plane-parallel chambers used for high energy electron beams in the Czech Republic
I. Horakova, I. Koniarova, V. Dufek
National Radiation Protection Institute (NRPI), Prague, Czech Republic
E-mail address of main author: [email protected]
Determination of absorbed dose to water under reference conditions in radiotherapy electron beams has been carried out in the Czech Republic according to TRS-398 since 2005. Physicists in hospitals (users) use calibration factors of plane-parallel chambers determined either in 60Co beams (given in most cases by the producer) or by cross-calibration in their own clinical electron beams. There is a limited possibility to verify the calibration factor in terms of absorbed dose to water in a "Co beam in SSDL and no possibility to verify it in electron beams. In the Czech Republic calibration factors are checked indirectly through the absorbed dose verification by on-site audits after acceptance tests and by periodic postal TLD audits.
The aim of the study was to carry out by NRPI the cross-calibration of the users' plane-parallel chambers in the reference clinical electron beam at the radiotherapy department and to compare the determined calibration factors with the given/used calibration factors.
The cross-calibration procedure consists in absorbed dose determination in high energy electron beam (Rso > 7 g/cm2) with the reference cylindrical chamber calibrated in SSDL in a 60Co beam and with the calibrated plane-parallel chamber positioned alternately at the reference depth in water in accordance with reference conditions for each. The procedure for cross-calibration according to chapter 7.6 of TRS-398 [1] was applied. Reference conditions were: water phantom Scanditronix Welhoffer 2001, electron beam of Clinac 2100 C/D (Varian accelerator) with half-value depth in water R50 = 8.43 cm (20 MeV), the reference depth zref = 5 cm, the reference point of the calibrated plane-parallel chamber was positioned at the reference depth, the reference point of the reference cylindrical chamber PTW 30002 was positioned at the depth zref + 0.5rcyi = 5.1 cm (rcyi is cavity radius of the cylindrical chamber). Eveiy chamber was calibrated (set up) twice and the average value was taken into account.
The plane-parallel chamber of NRPI, type PTW 34001, was used to check the stability of the calibration procedure. This chamber was calibrated at the reference electron beam prior to the calibration of users' chambers. Its determined calibration factor was compared to the expected calibration factor - the average value from previous calibrations under the same conditions (tolerance 2%).
To be able to compare calibration factors, the beam quality correction factor must be applied, particularly for calibration factor from 60Co. In that case, the correction factor applied to the given calibration factor kQCr0SS Q0 equals to 0.89 (for Roos, PPC40 and Markus chambers). The deviation is given as ( N D , w , d e t . - N D , w , g i v e n - k Q c r o S S , Q o ) / N D , w , g i y e n - k Q c r o S S , Q o - 1 0 0 % . N D , w , d e t . is calibration factor determined by NRPI, N d , w , g i v e n is calibration factor given by the hospital.
21 plane-parallel chambers and dosemeters from 18 hospitals were calibrated in three periods. Types of ionization chambers were: PTW 34001 (11 pes.), PPC40 (7 pes.), Markus (2 pes.) and NACP (1 piece). Combined standard uncertainty of the calibration factor NDjWjdet was 1.45% (k=l).
279

Combined standard uncertainty of absorbed dose in user's beam must take into account uncertainty of calibration factor, uncertainty of perturbation factors ratio for plane-parallel chamber for Qcross and Q and uncertainty of measurement in user's beam Q. Estimated uncertainty is 1.6%.
Results of cross-calibrations are given in Fig. 1. In all cases, the deviation was less than 3%, and only in two cases, the deviation exceeded 2%. In those cases, doubts of the hospitals of slightly higher deviation were confirmed. Results also demonstrated that deviations were not influenced by the period (date), in which calibration was earned out, by the type of calibrated chamber or by the method of calibration of given calibration factor (8x cross-calibration in 20 MeV electron beam, lx cross-calibration in 15 MeV electron beam, 9x calibration in a 60Co beam by producer, 2x cross-calibration in a 60Co beam by user, lx calibration in a 60Co beam by SSDL).
No serious problems have been revealed during this independent cross-calibration. Such calibration is suitable particularly for hospitals which have not sufficient electron beam quality or which use calibration factor from cross-calibration in a 6"Co beam. This method represents independent verification of dosimetry systems used for high energy electron beams in radiotherapy. The method is prepared to undergo accreditation.
Distribution of deviations from cross-calibrations 8 7 6 5 4 3 2 1 0
> o c « 3 or «
-2 -1.5 - 1 -0.5 0 0.5 1.5 2.5
Deviation ( %
FIG. 1. Distribution of deviations between calibration factors from cross-calibration carried out by National Radiation Protection Institute and calibration factors given by hospitals.
REFERENCE
[1] INTERNATIONAL ATOMIC ENERGY AGENCY, Absorbed Dose Determination in External Beam Radiotherapy: An International Code of Practice for Dosimetry Based on Standards of Absorbed Dose to Water, Technical Reports Series No. 398, IAEA, Vienna (2000).
280

IDOS, Vienna, 9-12 November 2010 E2-CN-182, Paper No INV015
Assessment of different detectors for relative output factor measurements in small radiosurgery fields of the Leksell Gamma Knife
J. Novotny Jr., J.P. Bhatnagar, M.S. Huq
University of Pittsburgh Cancer Institute, Pittsburgh, USA
E-mail address of main author: [email protected]
Introduction
Absolute output for the Leskell Gamma Knife (LGK) is measured using the largest size collimator, i.e. 18 mm for LGK models U, B, C, 4C and 16 mm for LGK Perfexion. The relative output factor (ROF) for a given collimator is defined as the quotient of the output measured with this collimator to that measured with the largest size collimator. The outputs are traditionally measured at the center of a 160 mm diameter spherical ABS phantom provided by vendor. When the phantom is docked in the LGK for irradiation, the center of the phantom coincides with the focal point of the LGK unit with stereotactic coordinates of X=100, Y=100, and Z=100. The measurement of ROFs, especially for 4 mm collimator is not a trivial task due to demands of an accurate set up and size of measured radiosurgery fields. Both proper detector choice and geometric accuracy of placement of detector in the measurement set up, such as detector positioning in the phantom are critically important. The lack of secondary electronic equilibrium makes the choice of an appropriate dosimeter an important issue. Special attention has to be paid to the size and dimensions of the active volume of the detector, since volume-averaging effects could result in lower values of output factors.
Purpose
The goal of present study is to perform assessment of a broad variety of different detectors for the measurement of ROFs for 4 mm and 8 mm collimators for the LGK Perfexion. The measurement results are compared with Monte Carlo calculated ROFs values of 0.805 and 0.924 for 4 mm and 8 mm collimators, respectively.
Materials and Methods
Various types of detectors were used for measurement of ROFs . These are: i) Two types of micro ion chambers : Exradin A16 (volume 0.007 cm3) and PTW 31016 PinPoint 3D (volume 0.016 cm3); ii) Two types of diode detectors : IBA dosimetry PFD (diameter 2.00 mm, thickness 0.06 mm) and IBA dosimetry SFD (diameter 0.60 mm, thickness 0.06 mm), and iii) Three different film dosimeters: Kodak EDR2, Gafchromic EBT and Gafchromic MD-V2-55. The films were read on EPSON EXPRESSION 10000 XL scanner with 200 dpi resolution in 16-bit grey scale for EDR2 film. Gafchromic films were read in 48-bit color and imported in red channel. Films were analyzed using Film QA version 2.0.1215 software. Background corrections as obtained by scanning an unexposed piece of film were applied to all films. Additional measurements are currently being taken using Best Medical Canada MOSFETs TN 502 RDI (diameter 2.3 mm), TN 502 RDM (diameter 1.0 mm) and diamond detector PTW 60003 (volume 1-6 mm3, thickness 0.3 mm). All measurements have been carried out using the ELEKTA spherical ABS plastic phantom of 160 mm diameter. For each detector type special phantom cassette was manufactured to position effective volume of the detector in the center of the spherical phantom. Experimentally obtained results of the ROFs are compared with vendor recommended Monte Carlo values obtained from calculations based on Penelope system.
281

Results
Results of measured ROFs for 4 mm and 8 mm collimators are presented in Table 1. Dependence of mesured ROFs on the detector volume is shown in Figure 1. It is obvious that detectors with larger effective volume e.g. micro ion chambers are providing wrong results and should not be used for these kinds of measurements.
Detector Measured 4 mm ROF
Measured 8 inm ROF
Deviation to MC [%] Detector Measured 4 mm ROF
Measured 8 inm ROF 4 mm ROF 8 min ROF
PTW 31016 PinPoint 3D ion chamber 0.616 ±0.015 0.873 ±0.009 -23.5 -5.5 Exradin A16 ion chamber 0.675 ± 0.009 0.869 ±0.006 -16.1 -5.9 IBA dosimetry PFD diode detector 0.767 ±0.026 0.890 ±0.024 -4.7 -3.7 IBA dosimetry SFD diode detector 0.812 ±0.029 0.893 ±0.032 +0.9 -3.4 Kodak EDR2 film 0.769 ±0.010 0.904 ±0.012 -4.5 -2.1 Gafchromic EBT film 0.810 ±0.007 0.917 ±0.014 +0.6 -0.8 Gafchromic MD-V2-55 film 0.819 ±0.009 0.906 ±0.018 +1.7 -2.0
Table 1. Results of measured ROFs and percentage deviation to Monte Carlo (MC) calculated values of 0.805 and 0.924 for 4 mm and 8 mm collimators, respectively.
Measured ROF dependence on detector volume
Detector volume [mm3]
FIG 1. Dependence of measured values of 4 mm and 8 mm collimator ROFs on the volume of detector types. Strong detector volume dependence is observed for both 4 mm and 8 mm ROF measurements. The best agreement with Monte Carlo is seen for measurements performed with film dosimetry.
Discussion and Conclusion
Both detector volume and accurate detector positioning are very crucial when measuring ROFs of small stereotactic fields. The present results indicate that the best agreement with ROFs obtained by Monte Carlo for 4 and 8 mm collimators is obtained when film dosimetry is employed [1], Measurements made with micro ion chambers showed significant deviation from Monte Carlo, especially in the case of 4 mm collimator. Dependence of measured value of ROF on detector volume is observed for both 4 mm and 8 mm collimators. Proper selection of detector, especially in terms of volume, is critical when measureing relative output factors for small radiosuregry gamma knife fields.
REFERENCE
[1] NOVOTNY Jr., J., BHATNAGAR, J.P., QUADER, M.A., BEDNARZ, G., LUNSFORD, L.D., HUQ, M.S. Measurement of relative output factors for the 8 and 4 mm collimators of Leksell Gamma Knife Perfexion by film dosimetiy. Med. Phys. 36:1768-1774, 2009
282

IDOS, Vienna, 9-12 November 2010 E2-CN-182, Paper No INV015
Current worldwide practice in calibration of small Leksell Gamma Knife radiosurgery fields: Initial results from the International Calibration
Survey
J. Novotny Jr.a, M.F. Desrosiersb, J.P. Bhatnagara, J. Novotnyc, M.S. Huqa, J.M. Puhlb, S.M. Seltzerb
a>University of Pittsburgh Cancer Institute, Pittsburgh, USA b) National Institute of Standards and Technology, Gaithersburg, USA c) Na Homolce Hospital, Prague, Czech Republic
E-mail address of main author: [email protected]
Introduction and Purpose
The dose-rate calibration of a Leksell Gamma Knife (LGK) unit (Elekta Instrument AB, Stockholm, Sweden) is performed at the center of a spherical solid plastic phantom (160 mm in diameter), provided by the vendor. A dose-rate calibration is performed using the largest size collimator (18 mm for the LGK B, C and 16 mm for LGK PFX) using an ion chamber with small volume positioned at the geometric center of the phantom. Outputs for smaller collimators (4, 8 and 14 mm for the LGK B, C and 4, 8 mm for the LGK PFX) are measured as a relative output factor related to the measurement of dose for the largest size collimator. At this time, no national or international calibration protocol exists for LGK units that specifically address the calibration procedure of the small fields of LGK. Instead one of the nationally or internationally accepted calibration protocols (designed initially for the calibration of large fields), i.e. AAPM TG 21, AAPM TG 51, IAEA TRS 277 or IAEA TRS 398 is commonly employed for the calibration of the LGK units. In view of this, regional differences might be observed worldwide. The purpose of this project was to survey between 70 to 100 LGK units worldwide and: 1) gather detailed information about calibration procedures used for the LGK and 2) measure output of the surveyed LGK units using alanine dosimeter and compare these results with treatment planning system calibration value.
Materials and Methods
Each participant of the project was provided with LGK calibration questionnaire seeking the following information on LGK calibration: LGK model, calibration protocol used, phantom used, ion chamber (manufacturer, model, volume, etc.) used, LGK calibration personnel (e.g. on-site physicist, ELEKTA physicist, other), whether independent verification of calibration was performed, and collimator relative output factors used (ELEKTA default values, values measured by on-site physicist, other). Along with questionnaire were also mailed a set of 5 alanine dosimeters (dimension of each dosimeter: 4.8 mm diameter x 3.0 mm height) and an adaptor to place the alanine dosimeters at the center of calibration phantom. The participants were required to deliver a dose of 50 Gy to each of 5 dosimeters. The irradiated dosimeters were evaluated with a Bruker ECS 106 Electron Paramagnetic Resonance speedometer using the protocol described in the NIST Ionizing Radiation Division Quality System Manual. Experimental uncertainty of alanine dosimetry is at this time 1.8% at 95 % confidence level.
283
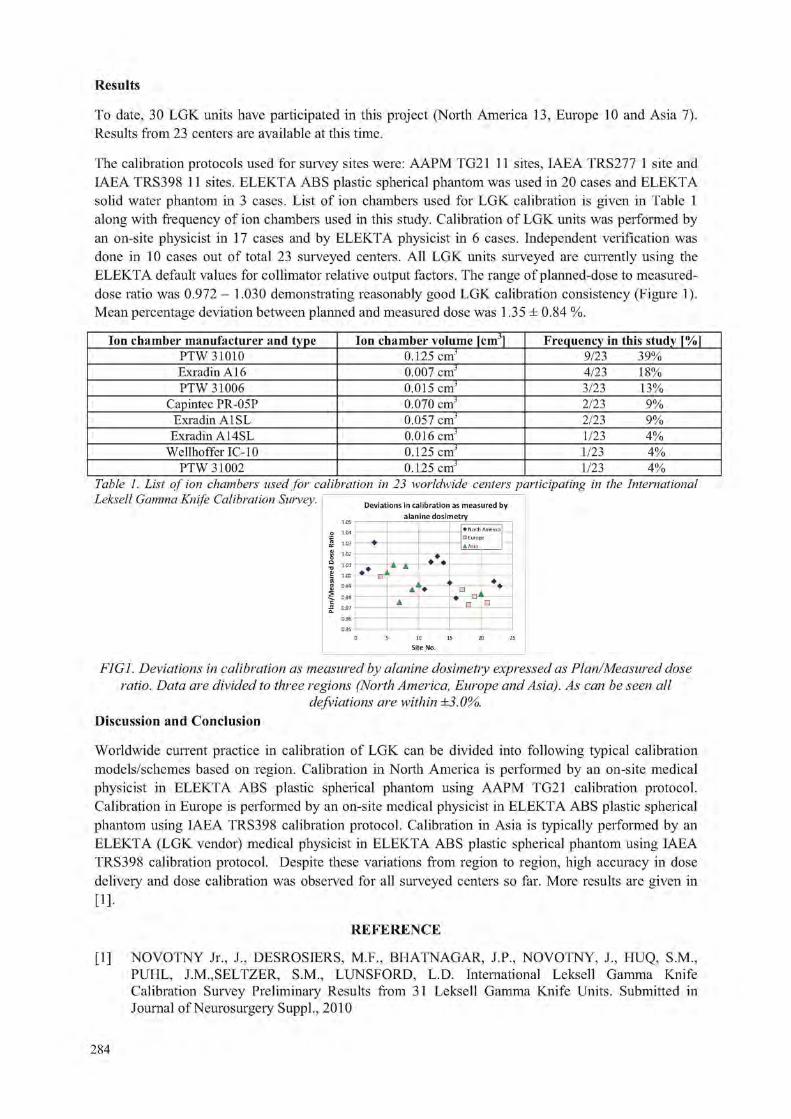
Results
To date, 30 LGK units have participated in this project (North America 13, Europe 10 and Asia 7). Results from 23 centers are available at this time.
The calibration protocols used for survey sites were: AAPM TG21 11 sites, IAEA TRS277 1 site and IAEA TRS398 11 sites. ELEKTA ABS plastic spherical phantom was used in 20 cases and ELEKTA solid water phantom in 3 cases. List of ion chambers used for LGK calibration is given in Table 1 along with frequency of ion chambers used in this study. Calibration of LGK units was performed by an on-site physicist in 17 cases and by ELEKTA physicist in 6 cases. Independent verification was done in 10 cases out of total 23 surveyed centers. All LGK units surveyed are currently using the ELEKTA default values for collimator relative output factors. The range of planned-dose to measured-dose ratio was 0.972 - 1.030 demonstrating reasonably good LGK calibration consistency (Figure 1). Mean percentage deviation between planned and measured dose was 1.35 ± 0.84 %.
Ion chamber manufacturer and type Ion chamber volume [cm3] Frequency in this study [%] PTW 31010 0.125 cmJ 9/23 39% Exradin A16 0.007 cmJ 4/23 18% PTW 31006 0.015 cmJ 3/23 13%
Capintec PR-05P 0.070 cmJ 2/23 9% Exradin A1SL 0.057 cmJ 2/23 9%
Exradin A14SL 0.016 cmJ 1/23 4% Wellhoffer IC-10 0.125 cmJ 1/23 4%
PTW 31002 0.125 cmJ 1/23 4% Table 1. List of ion chambers used for calibration in 23 worldwide centers participating in the International Leksell Gamma Knife Calibration Survey. Deviations in calibration as measured by
alanine dosimetry * North Air • Europe
^-tr W « •
FIG1. Deviations in calibration as measured by alanine dosimetry expressed as Plan/Measured dose ratio. Data are divided to three regions (North America, Europe and Asia). As can be seen all
defviations are within ±3.0%. Discussion and Conclusion
Worldwide current practice in calibration of LGK can be divided into following typical calibration models/schemes based on region. Calibration in North America is performed by an on-site medical physicist in ELEKTA ABS plastic spherical phantom using AAPM TG21 calibration protocol. Calibration in Europe is performed by an on-site medical physicist in ELEKTA ABS plastic spherical phantom using IAEA TRS398 calibration protocol. Calibration in Asia is typically performed by an ELEKTA (LGK vendor) medical physicist in ELEKTA ABS plastic spherical phantom using IAEA TRS398 calibration protocol. Despite these variations from region to region, high accuracy in dose delivery and dose calibration was observed for all surveyed centers so far. More results are given in [!]•
REFERENCE
[1] NOVOTNY Jr., J., DESROSIERS, M.F., BHATNAGAR, J.P., NOVOTNY, J., HUQ, S.M., PUHL, J.M.,SELTZER, S.M., LUNSFORD, L.D. International Leksell Gamma Knife Calibration Survey Preliminary Results from 31 Leksell Gamma Knife Units. Submitted in Journal of Neurosurgery Suppl., 2010

IDOS, Vienna, 9-12 November 2010 E2-CN-182, Paper No INV015
Validation of experimental results in small field dosimetry
T. Sabino, L. N. Rodrigues
Institute of Energy and Nuclear Research (IPEN), Sao Paulo, Brazil
E-mail address of main author: talitasabino@iisp. br
It is important to use as many detectors as possible during the implementation of Radiosurgery in clinical routine since small field dosimetry is not a very easy task due to the lack of lateral equilibrium [1]. Some theoretical issues concerning the non-reference dosimetry have recently proposed a new methodology for the determination of the quality index for photons beams, especially for very small field sizes. [2,3] One approach makes use of the zero-field percent depth dose and the tissue maximum ratio because these dosimetric parameters provide useful primary beam information. [4] In order to validate the experimental results obtained during the implementation of stereoteactic Radiosurgery fields, they were compared to the theoretical data mentioned above. For the initial analysis of this study and the validation of the small fields dosimetry, the first theoretical approximation proposed by Sauer et al, [2] which calculates the beam quality parameter (Q) and the tissue-phantom ratios (TPR) for any field size, was adopted.
The TPR20,i0 used in this investigation was derived from measurements carried out in a 6 MV phtons linear accelerator (Varian 6EX) using three different detectors: a PinPoint ion chamber (CC01), a small ion chamber (CC13) and a stereotactic diode from Scanditronix/Wellhofer. The readouts derived from each detector were used to obtain the corresponding TPR values and thus calculate the quality index for field sizes ranging from 0.6 to 10 cm2 (stereotactic fields) and up to 40x40 cm2 (conformal field sizes) according to the following expression:
_ TPR2010 (S) + 0,208 - 0,625(1 - e-""9-') • l,213-0,679(l-e^/194)
where TPR2D, IO ratios were obtained with the aid of the detectors mentioned above for all analyzed field sizes and s is the side length of the square field.
The values of quality index (Q) for each field size obtained with all detectors were compared to the values presented in the literature and are shown by Fig. 1. The experimental results obtained in this study differ from the values obtained by Sauer et al by 1.8%, 4.0% and 4.9% for the pin point chamber, the CC13 ion chamber and the stereotactic diode, respectively. Regarding the BJR-25 data, [4] one can consider the results provided by a Farmer type chamber which were more common at that time. On the other hand, the zero-field approximation [5] gives a small difference, of 0.7%, due to the fact that only the stereotactic diode has been considered in both investigations. By comparing the experimental results to those provided by Cho et al, [6] a much better agreement is found, except for the pin point chamber. Further investigations will be made with this last detector in order to clarify all possible deviations.
The comparison of the experimental results obtained with the pin point chamber, the small ion chamber and the stereotactic diode present a good agreement to the literature data, thus they provide an appropriate method for experimental results validation for small field dosimetry.
285
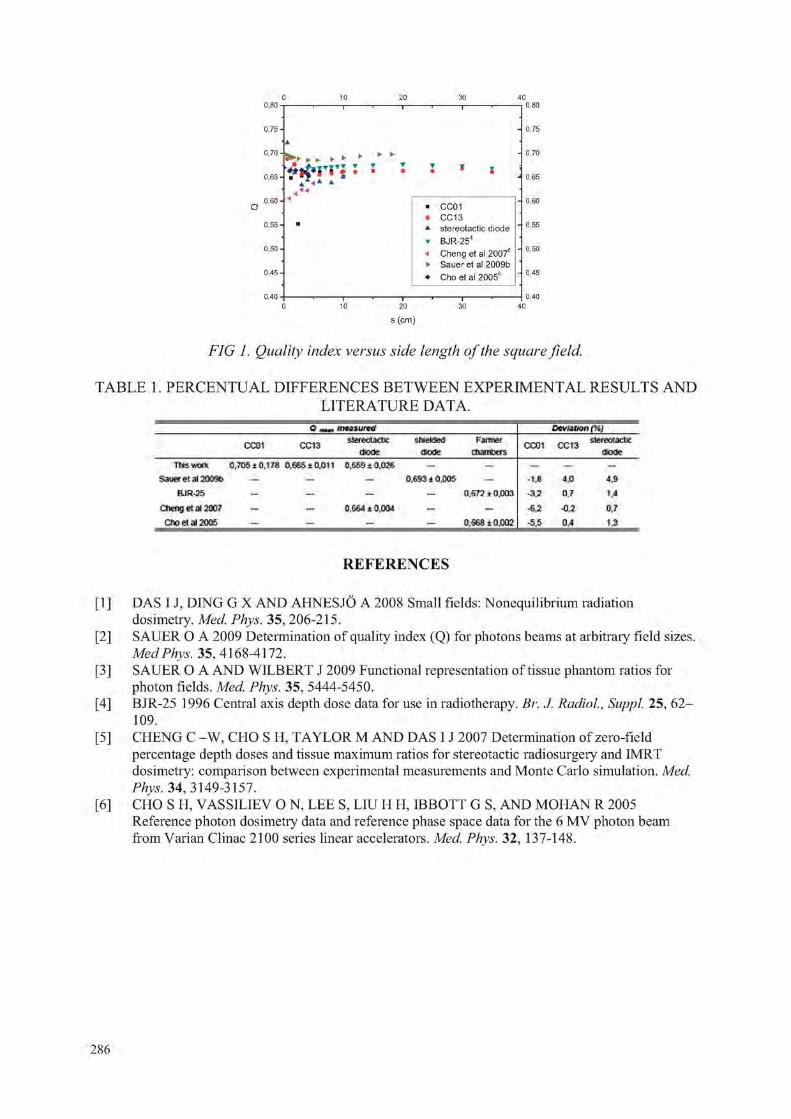
i 1 ^ * 0,60 - 4
• CC01 • CC13 * stereotactic diode • BJR-254
< Cheng et al 20075
• Saueret al 2009b • Cho et al 20056
—' j •— J .
s (cm)
FIG 1. Quality index versus side length of the square field.
TABLE 1. PERCENTUAL DIFFERENCES BETWEEN EXPERIMENTAL RESULTS AND LITERATURE DATA.
mtitu r t t f Deni t fOr l I%1
CC01 CC13 SWWOUldiC diode
Sfl i f ikM dtode
Fannef numbers CC01 CC13 stereotax*
uouc Tins ™ n C.TDSiQ,ITS 0,645 id . t ) I I 0.64& i D.OJfi — „ _ „.
&HJM EL al 20Mt> _ _ — 0,693 i O.CKIi _ • l jS 4,0 J.9 BJR-25 _ — o.sra ±o.oo3 - 3 J 0,7 t.4
Cheng e l 312007 _ - 0.564 ± O.MU — _ -SJ H.7 c i *>eta i2006 - - - - 0.668 ± 0,002 -5J5 0 A 1.3
R E F E R E N C E S
[1 ] DAS I J, DING G X AND AHNESJO A 2008 Small fields: Nonequilibrium radiation dosimetry. Med. Phys. 35, 206-215.
[2] SAUER O A 2009 Determination of quality index (Q) for photons beams at arbitrary field sizes. Med Phys. 35, 4168-4172.
[3] SAUER O A AND WILBERT J 2009 Functional representation of tissue phantom ratios for photon fields. Med. Phys. 35, 5444-5450.
[4] BJR-25 1996 Central axis depth dose data for use in radiotherapy. Br. J. Radiol, SuppJ. 25, 62-109.
[5] CHENG C -W, CHO S H, TAYLOR M AND DAS I J 2007 Determination of zero-field percentage depth doses and tissue maximum ratios for stereotactic radiosurgery and IMRT dosimetry: comparison between experimental measurements and Monte Carlo simulation. Med. Phys. 34, 3149-3157.
[6] CHO S H, VASSILIEV O N, LEE S, LIU H H, IBBOTT G S, AND MOHAN R 2005 Reference photon dosimetry data and reference phase space data for the 6 MV photon beam from Varian Clinac 2100 series linear accelerators. Med. Phys. 32, 137-148.
286
IDOS, Vienna, 9-12 November 2010 E2-CN-182, Paper No INV015
Experimental determination of beam quality correction factors in therapeutic carbon ion beams
M. Sakamaa, T. Kanaib, A. Fukumura0 and Y. Kased
aCollege of Industrial Technology, Nihon University, Chiba, Japan
bHeavy Ion Medical Research Center, Gunma University, Gunma, Japan
cNational Institute of Radiological Sciences (NIRS), Chiba, Japan
dShizuoka Cancer Center Research Institute, Shizuoka, Japan
E-mail address of main author: [email protected]
In radiotherapy, ionization chambers are usually used in dosimetry, and this method needs beam quality correction factors to obtain the absorbed dose to water for the user's beam quality. These factors include the stopping power ratios, the w values, and the perturbation factors for the ionization chamber. The factors for heavy-ion beams have large uncertainties and are assumed to be constant values for all conditions in the IAEA protocol [1], In particle therapy with passive scattering methods, Spread-Out Bragg Peaks (SOBP) with the ridge or wheel filter are used to achieve a uniform biological response for the irradiated tumor. Therefore, there are primary and fragment particles with variable energies in the SOBP,
We developed a portable graphite calorimeter to achieve the dosimetry including that of the heavy-ion beams [2]. In 290, 400, and 430 MeV/n carbon ion beams, the calorimetry and ionization chamber dosimetry were performed at the plateau region and the center of SOBP. Two cylindrical chambers (PTW 30001 and PTW 30011, Farmer) and two plane-parallel chambers (PTW 23343, Markus and PTW 34001, Roos) calibrated by the secondary standard dosimetry laboratory were used. Comparison of the calorimetry with the ionization chamber dosimetry made it possible to sophisticate the dosimetry in the carbon ion beams. The absorbed dose to graphite obtained by the calorimeter was converted to the dose to water using an ionization chamber and Monte Carlo simulation.
The beam quality correction factors were obtained by comparison and are indicated in Fig. 1. The factors revealed were about 3% larger than those from the IAEA TRS 398, and the uncertainties were reduced by approximately 1% from the conventional values. The beam quality correction factors were calculated by re-evaluating each component. With regard to the stopping power ratios, water to air will be 1.125 from the new I value [3],; the w value in air will be 35.7 J/C [4], and the perturbation factors will be 1 from the experimental comparison with a pure graphite chamber. Using these values, the beam quality correction factors for each chamber agreed very well with those obtained by direct comparison. Therefore, the absorbed dose to water in the carbon ion beams would be increased by about 3% of that using the beam quality correction factors recommended by the IAEA TRS 398.
287

1.12
1.1
-g 1 . 0 8 >2 c o D e o o f 1 .04 CD D G" E to
CO
1 .06
1 .02
0 . 9 8
• Markus • PTW 30001 • Roos • PTW 30011
• • P T W 3 0 0 1 1 - -
p" fw3000" l
Markus, Roos
IAEA TRS 398
100 150 2 0 0 2 5 0 3 0 0 3 5 0 4 0 0 4 5 0 5 0 0
Energy (MeV/n)
FIG. 1. Beam quality correction factors for cylindrical and plane-parallel ionization chambers in the carbon ion beams. The dashed lines are from the IAEA TRS 398, and the symbols indicate those values evaluated by calorimetry. The solid lines show the average of experimental remits.
REFERENCES
[1] ANDREO P, BURNS D T, HOHLFELD K, et al.: Absorbed Dose Determination in External Beam Radiotherapy: An International Code of Practice for Dosimetry based on Standards of Absorbed Dose to Water. IAEA Technical Report Series No. 398, Vienna: IAEA (2000)
[2] SAKAMA M, KANAI T, FUKUMURA A: Development of a portable graphite calorimeter for radiation dosimetry. Jpn. J. Med. Phys. Vol. 28 No. 1: 1-14 (2008)
[3] PAUL H, GEITHNER O, JAEKEL O: The ratio of stopping powers of water and air for dosimetiy applications in tumor therapy. Nucl. Instr. And Meth. in Phys. Res. B 256: 561-564 (2007)
[4] SAKAMA M, KANAI T, FUKUMURA A, ABE K: Evaluation of w values for carbon beams in air, using a graphite calorimeter, Phys. Med. Biol. 54 1111-1130 (2009)
288

IDOS, Vienna, 9-12 November 2010 E2-CN-182, Paper No INV015
Accurate dose distributions: The implications of new effective point of measurement values for thimble ionization chambers
F. Tessier
Intitute for National Measurement Standards, National Research Council Canada
E-mail address of main author: [email protected]
We propose new, chamber-specific values for the effective point of measurement (EPOM) of 25 commercial thimble ionization chambers for use in megavoltage photon beams. The EPOM is critical for accurate dosimetry: it is the point at which the measured dose would arise in the measurement medium in the absence of the probe.
Our precise calculations show that the upstream EPOM shift (relative to the geometrical centre of the chamber) is smaller than the value of 0.6 times the cavity radius recommended by the International dosimetry protocol TRS-398. This incorrect specification leads to an error in depth of about 0.4 mm when measuring a dose distribution in water with a typical 0.6 cc thimble ionization chamber.
Our work relies on Monte Carlo simulations of radiation transport through a radiotherapy treatment head, a water phantom and various ionization chambers, all modeled in realistic detail. For each chamber, we determine the location of the EPOM by comparing the depth-dose curves in water (in the absence of the chamber), Dw, and in the gas of the chamber cavity, Dg. We follow the method proposed in 2006 by Kawrakow [1], which stems from the consideration that, in practice, the proper EPOM shift is the one for which the ratio Dw/ Dg is independent of depth.
More specifically, we use the EGSnrc code system [2] for all aspects of the simulation. We use a BEAMnrc [3] model of the Elekta Precise linac installed at the NRC laboratory, for which the geometry specifications and the primary electron beam parameters have been validated in previous work [4]. We use DOSXYZnrc [5] to obtain a high-precision water depth-dose curves and the efficient egs chamber user code [6] to calculate the central axis dose to the cavity of each chamber for depths ranging from 0 to 20 cm in water.
With such data it is relatively straightforward to extract the EPOM shift: we simply perform an exhaustive numerical search to determine the EPOM shift that minimizes a % measure of the depth-dependence of the Dw/ Dg ratio.
In Figure 1 we show sample results for the EPOM shift as a fraction of the cavity radius for a subset of common ionization chambers, for a nominal beam energy and field size [7]. The difference with the currently accepted value of 0.6 (the upper limit of the graph) is striking, as is the variation between the different chambers.
We are able to verify our prediction experimentally for the A1SL chamber, which exhibits the largest relative difference [8]. Moreover, by varying parameters in the chamber models, we uncover simple dependencies of the EPOM shift on the chamber length, the central electrode radius and the thimble wall thickness and material. This allows us to predict the EPOM for a wide range of designs. Notably, we can adjust the thimble wall thickness to yield a thimble ionization chamber with a vanishing EPOM shift [8],
In our presentation, we will report new EPOM values for the majority of thimble ion chambers in use today, and discuss their implications for dose distribution measurements and for Monte Carlo beam model commissioning.
289

In light of our findings, a revision of dosimetry protocols in regards to the effective point of measurement of thimble ionization chambers for relative photon beam dosimetry seems inevitable.
0.6
0.5
5 0.4 O CL
E S 0.3
Q. =3 03
> 0.2 J5 05
0.1
" i i i i i i i i r
• •
25 MV, 10x10 cm^
« T— <
CO
< < <N <
J L (/> CM <N < <
_L <3> < m o IM O LU CO
FIG. 1. Calculated relative upstream EPOM shift for a few common thimble ionization chambers. The bottom of the graph corresponds to the centre of the chamber, and the top corresponds to the current prescription of dosimetry protocols. Error bars are not visible as they are smaller than the symbols..
REFERENCES
[1] I. KAWRAKOW. On the effective point of measurement in megavoltage photon beams. Med. Phys. 33,1829-1839 (2006).
[2] I. KAWRAKOW, DWO ROGERS. The EGSnrc Code System: Monte Carlo simulation of electron and photon transport. Technical Report No. PIRS-701 (4th printing), National Research Council of Canada (2003).
[3] D.W.O ROGERS, B.R.B WALTERS, I. KAWRAKOW. BEAMnrc users manual. NRC Report No. PIRS 509a revH (2004).
[4] E.TONKOPI, M.R McEWEN, B.R.B WALTERS, I. KAWRAKOW. Influence of ion chamber response on in-air profile measurements in megavoltage photon beams. Med. Phys. 32, 2918-2927 (2005).
[5] B.R.B WALTERS, I. KAWRAKOW, D.W.O ROGERS. DOSXYZnrc users manual. NRC Report No. PIRS 794 rev C (2007).
[6] J. WULFF, K. ZINK, I. KAWRAKOW. Efficiency improvements for ion chamber calculations in high energy photon beams. Med. Phys. 35, 1328-1336 (2008).
[7] F. TESSIER, I. KAWRAKOW. Effective point of measurement of thimble ion chambers in megavoltage photon beams. Med. Phys. 37, 96-107 (2010).
[8] F. TESSIER, B.D HOOTEN, M.R McEWEN. Zero-shift thimble ionization chamber. Med. Phys. 37,1161-1163 (2010).
290

IDOS, Vienna, 9-12 November 2010 E2-CN-182, Paper No INV015
Small field dosimetry in high energy photon beams based on water calorimetry
L.A. de Prez
VSL, Dutch Metrology Institute, Delft, The Netherlands
E-mail address of main author: [email protected]
The use of small fields in radiotherapy has increased substantially. The benefits of the use of small fields are apparent; a higher dose can be delivered to the planning target volume, PTV, while sparing healthy tissue and critical organs. However, it has been shown that dosimetric errors at small fields can be considerably larger than in conventional beams 0. Accurate absolute dosimetry is crucial because it is used as input data for treatment planning systems as well as validation of calculated treatment plans. In order to obtain acceptably small uncertainties of about 3 % (k = 2) in the absorbed dose determination of small fields, relevant detectors should be calibrated directly in terms of absorbed dose to water under non-reference conditions. Therefore it is essential that absorbed dose to water is traceable to primary standards for non-standard fields.
The objective of this study is to determine if it is feasible to perform traceable absorbed dose to water measurements, based on water calorimetry with an expanded uncertainty smaller than or equal to 3 % in square field photon beams originating from the VSL 60Co source with side lengths between 1.8 and 10 cm.
This study describes a method for determination of water calorimeter correction factors for non-standard fields, smaller than 10 x 10 cm". It is initially employed and validated in the VSL 60Co source. The method consists of a Monte Carlo model of seven fields originating from the Siemens Gammatron-3 unit and their resulting energy deposition in the VSL transportable water calorimeter 0. These calculations are followed by heat transport calculations inside the water calorimeter. Corrections are calculated for perturbation of radiation and for undesired heat flow as a result of the presence of non-water materials and 3D-temperature profiles. They have been calculated for square fields ranging from 1.8 cm to 10 cm.
Monte Carlo calculations, using the PENELOPE Monte Carlo code 0, are performed for all six non-standard fields and for the standard field of 10x10 cm2 to obtain phase-space files, 3D-dose distributions and mass restricted stopping power ratios. Variance reduction techniques are applied in order to improve the efficiency of the calculations. The Monte Carlo results have been compared to measurements using an ionisation chamber and showed good agreements. The results are used as input for the heat transport calculations.
The perturbation correction obtained from the calculated 3D-dose distributions, based on seven sets of phase-space files, results for the six largest fields in a correction factor smaller than 0.82 % (i.e. 1.0007 < kp < 1.0082). The smallest field, however, yields a perturbation correction of 1.0035. Comparison of the calculated perturbation correction of the standard 10 x 10 cm field with measurements performed in an earlier study, showed excellent agreement.
The heat transport corrections obtained from Comsol Multiphysics1V1 calculations vary between 59 % and 0.25 % (i.e. 1.59 and 0.9975 between the smallest non-standard field and the standard field, respectively, as illustrated in Figure 1.
A feasibility study for a transportable absorbed dose to water primary standard in small field sized high-energy photon beams
291

The heat conduction correction for the standard field is compared to the same heat conduction correction determined in a previous study. They show excellent agreement and it is expected that the current method provides a more realistic approach and therefore a more reliable outcome.
The output factors obtained from the water calorimeter measurements at two non-standard fields of 4.3 cm and 5.3 cm FWHM (Full Width at Half Maximum), show excellent agreement with the ionization chamber measurements and with Monte Carlo calculations. However, the uncertainties in the results obtained from these Monte Carlo calculations are quite large.
The total expanded uncertainty (k = 2) of the water calorimeter for square fields with FWHM between 1.8 cm and 10 cm varies between 28% and 2.2%. Dominant uncertainty contributions are the uncertainties in the corrections determined by the Monte Carlo calculations and the statistical uncertainty of the calorimeter measurements for fields smaller than 4.3 cm due to the smaller output factor in the VSL 60Co source.
Taking into account that several uncertainty contributions in the water calorimeter budget are expected to be reducible, it is concluded that calorimetry for small fields is feasible. The smallest non-standard square field, using the current VSL water calorimeter, in the VSL 60Co beam, and obtaining an uncertainty smaller than 3.2 % has a side length of approximately 40 mm.
The method introduced in this study shows its suitability for use in the VSL 60Co beam. Once phase-space files are available, the absorbed dose distributions and heat conduction corrections can be determined. The general methodology could well be suited for non-standard and small field sizes smaller 40 mm. Future work will be focused on water calorimetry for applications in high-energy accelerator beams in clinical settings. Subsequentley work can be focused on other types of radiation like medium- and high-energy photon beam, high-energy electron beams, proton and heavy ion beams.
so eo » Scu j re f aid size h
FIG 1: Overall heat conduction correction in the VSL transportable water calorimeter as a function of square field size in the VSL 60Co source determined using subsequent Monte Carlo calculations and heat transport calculations.
REFERENCES
[1] DAS, I. J., DING, G. X. AND AHNESJO, A., Small fields: nonequilibrium radiation dosimetry. Med. Phys. 35,206-215,2008
[2] KESSLER, C„ ALLISY-ROBERTS, P. J., BURNS, D. T„ ROGER, P., DE PREZ, L. A. AND DE POOTER, J. A., Comparison of the standards for absorbed dose to water of the VSL and the BIPM for 60Co y-rays. Metrologia 46, Tecbn. Suppl. 06009, 2009
[3] SALVAT, F„ FERNANDEZ-VAREA, J. M.AND SEMPAU, J., PENELOPE-2008: A code system for Monte Carlo simulation of election and photon transport. Workshop proceedings / Training Course OECD/NEA Report 6416. Barcelona: OECD, 2009
292

IDOS, Vienna, 9-12 November 2010 E2-CN-182, Paper No INV015
Monte Carlo modelling of dosimetric parameters for small field MV X ray beams
D. I. Thwaites, a, G. Cranmer-Sargison\ C. J. Evans" and N. P. Sidhub
aSt James's Institute of Oncology, Leeds Teaching Hospitals NHS Trust and University of Leeds. UK
bSaskatoon Cancer Centre, Saskatchewan Cancer Agency and University of Saskatchewan, Saskatoon, Canada
Email address of main author: david, [email protected]
Small field dosimetry, in beams with dimensions of less than 3 cm, is challenging [1, 2], Problems include lack of lateral equilibrium, spectral changes, choice of detector and practical measurement problems. However, small field dosimetry and its accuracy have become increasingly important in recent years, not only for stereotactic radiotherapy, but also for small sub-fields for IMRT, VMAT, SBRT and other novel radiotherapy delivery technologies. Measurements are limited by: detector size relative to field size, changes in detector response linked to spectral responses, and detector perturbation of the charged particle fluence due to material and density effects. Detector limitations and the control of experimental conditions all become more critical as field size is reduced, as the experimental uncertainties become more significant. Monte Carlo (MC) approaches provide a powerful tool to overcome some of these problems, to model and predict dosimetric parameters and to assist in interpreting measurements with different systems. However, MC modelling requires the selection of some small field dosimetiy measurements to fine-tune the model.
This work is a collaboration between centres modelling a range of Elekta and Varian linac head designs down to their limiting field sizes of 10 x 10 mm, 5 x 5 mm and 4 x 4 mm (depending on head design) [3,4], Most of the work has been done for the 6MV beams on the various linacs, but with some data and modelling at 10 and 15 MV on the Elekta linacs in one centre (L). BEAMnrc has been used for all modelling, with initial benchmarking for each linac against normal field size dosimetiy (dimensions 4 cm upwards).
Recognising that electron source parameter fine tuning may be required for small fields, further benchmarking of the models has been carried out against unshielded diode measurements of relative output factors (OF) and profiles (mainly IBA/Scanditronix SFD), with verification of profiles using radiochromic film measurements. Careful attention has been given to the control of experimental uncertainties, with one centre (S) fitting a stepper motor driven linear actuator to better position the detector in the water tank, thereby reducing the positional uncertainties by more than half that of the normal water tank drive system. In addition, modelling of the SFD detector has been performed to quantify the perturbation effects of the sensitive volume, material and construction of the detector housing and to separate intrinsic small field dosimetiy changes from specific detector perturbation effects.
The fine tuning for small fields has typically shown that a mono-energetic linac electron beam can be used to model the observed behaviour, with this energy selected to within +/- 0.1 MeV (an example being 6.0, 6.1 and 6.2 MeV for the Varian head design). The spatial distribution of the electron beam incident on the target has been established within a narrow range around a Gaussian FWHM =1.0
293

There is some indication that small differences in x and y directions may exist, but it is not fully clear whether this is due to differences or inadequacies in modelling x- and y-collimators, in using a Gaussian source or in real differences in shape and width of the electron beam in the two directions.
A geometrically correct model of the SFD detector has been used to simulate measured small field OFs. For the Varian 6 MV beam (modelled at 6.2 MeV) the percent difference between measured and simulated OFs are found to be within the statistical uncertainty (1.2-1.4%, one standard error) for all but the smallest field sizes. For the nominal 5.0 mm field size the difference is -3.0%, 0.0% and +3.0% at FWHM = 0.100, 0.110 and 0.120 respectively, indicating there is significant sensitivity in OF to source occlusion and therefore the modelled FWHM.
Modelling the SFD detector in an initially simple way, taking into account only the sensitive material and its volume indicates differences due to material composition, but more significantly to density. Modelling relative OFs in a completely water situation and then in a sensitive detector volume in water situation and comparing the two provides estimates for correction factors that can be applied to specific detector measurements. For an SFD in a 6MV beam this correction factor is unity for field sizes above 10 mm, but then falls to 0.99 at 8.5 mm field size, 0.98 at 6.5 mm and 0.97 at 5.0 mm, ie a 3% correction to the measured relative OF. Considering the possible variation of actual jaw position, which may be 4.5 mm equivalent field size, results in a correction factor of 4.0%. Uncertainties are estimated at 0.5%. The results indicate that the correction factors are statistically equivalent at depths of 1.5, 5.0 and 10.0 cm, within these uncertainties, and therefore may be easily implemented clinically. However, such correction factors need to be considered with care to ensure consistent sets of dosimetric parameters are used.
Fine tuning is required for small-field MC models, against very careful dosimetry measurements based on clear selection criteria and consistency. Different MC models may be required to give best simulations across the range of conditions for small fields and large fields. Correction factors can be estimated for specific detectors, which can then be applied to raw measurements with those detectors in small radiation fields, but are field size dependent and will require careful consideration in their application to ensure consistent dosimetry for small fields.
REFERENCES
[1] MCKERRACHER, C, and THWAITES, DI, Assessment of new small field detectors for practical stereotactic beam data acquisition, Phys Med Biol 44(1999) 2143-2160
[2] MCKERRACHER, C, and THWAITES, DI, PHANTOM scatter factors for small MV photon fields, Radiother Oncol 86 (2008) 272-275
[3] THWAITES, DI, EVANS CJ, CR ANMER-S ARG IS ON G, BABCOCK K, COSGROVE V, WESTON S, Proc WC2009
[4] CRANMER-SARGISON, G, SIDHU NP, THWAITES DI, Fine tuning the source parameters of a Varian 6 MV BEAMnrc model through the simulation of small jaw collimated photon fields, Proc COMP 2010
294

IDOS, Vienna, 9-12 November 2010 E2-CN-182, Paper No INV015
Results of calibration coefficients of plane parallel Markus type ionization chambers calibrated in Co and electron beams*
W. Bulski, P. Ulkowski, B. Gwiazdowska
Department of Medical Physics, The Maria Sklodowska-Curic Memorial Cancer Center and Institute of Oncology, Warsaw, Poland
E-mail address of main author: [email protected]
In Poland, the Markus type plane - parallel chambers (or their substitutes - PPC05 chambers) are most popular. It is due to the fact that radiotherapy centres are mostly equipped with the therapeutic beams analysers „Mephisto" from PTW, which provide Markus chambers. The calibration of plane-parallel chambers are recommended to be done in water, in an electron beam of maximum energy available, usually about 20 MeV, against a cylindrical chamber calibrated in a Co-60 photon beam (cross-calibration). However, the access to medical accelerators is seriously limited due to the heavy patient load. Therefore, a study of calibrating the plane-parallel chambers Markus type in water, in a Co-60 beam, and recalculation of the calibration factor for electron beam of a given energy, were undertaken. Calibration coefficients determined for each chamber both in high energy electron beams and in Co-60 photon beams have been compared.
The material was composed of 36 plane parallel chambers, from 20 radiotherapy centers in Poland, calibrated at the Polish SSDL.
Each chamber was calibrated in two different radiation beams: a) Varian 2300 accelerator (22MeV electron beams, (output 1.2 cGy/MU at 300 MU/min); b) Co-60 Theratron 780/403 (output about 1.0 Gy/min). A dosimeter Keithley Instruments Inc. 6517- A with cylindrical ionization chambers Nuclear Enterprises Technology Limited type 2571 was used as the reference standard. The calibrated plane-parallel chamber and reference cylindrical chamber were placed sequentially in a water phantom from PTW type 4322. The methods of IAEA Code of Practice for Dosimetry TRS 381 and 398 were adopted [1,2].
Mean values and standard deviations (1 SD) of the calibration coefficients of 36 plane - parallel Markus - type chambers established with two methods were:
in electron beam: 48.67 ±0.98 cGy/nC
in Co-60 beam: 48.72 ± 0.99 cGy/nC
Very small differences in the results (shown in Fig. 1 and 2) for the two calibration methods, confirmed by small standard deviations observed, indicate that these two calibration methods, in the case of Markus -type plane parallel chambers may be used alternatively. The value of this accuracy is in accordance with the IAEA Report TRS 398.
The study was supported by the Polish National Atomic Energy Agency with the grant No 14/SP/2008
295

5 2
51 . - X
a * X 4
49 X
CM CM CM CM CM
FIG. 1 Calibration coefficients, in the increasing order, for electron beam calibrations ND, W, Qcross (triangles) and corresponding calibration coefficients for Co-60 beam, recalculated for the 22 MeV
electron beam quality (circles);n - chamber number..
FIG. 2 Histograms of calibration coefficients in two different beams, in 22 MeV electrons - front row, and in the Co-60 beam - back row. The shape of the histograms, not following the normal distribution,
suggests the manufacturing differences between particular chambers.
REFERENCES
[1] INTERNATIONAL ATOMIC ENERGY AGENCY. The use of plane parallel ionisation chambers in high energy electron and photon beams. An International Code of Practice for Dosimetry. Technical Reports Series. Vienna, 1997; No TRS 381.
[2] INTERNATIONAL ATOMIC ENERGY AGENCY. Absorbed Dose Determination in External Beam Radiotherapy. An International Code of Practice for Dosimetry Based on Standards of Absorbed Dose to Water. Technical Reports Series. Vienna, 2000; No TRS 398.
296
IDOS, Vienna, 9-12 November 2010 E2-CN-182, Paper No INV015
Study of the formalism used to determine the absorbed dose for X ray beams
1 2 2 U. Chica , A. Lallena , M. Anguiano
1 Pontificia Universidad Jaeriana/ Centro Javeriano De Oncologia, Colombia
" Universidad De Granada, Spain
E-mail address of main author: [email protected]
Study of the formalism used to determine the absorbed dose for x-ray beams
The most common codes of practice (IPEMB, Klevenhagen et al 1996; DIN 1996; NCS 1997; AAPM, Ma et al 2001; TRS-277, IAEA 1987) recommend to use the half-value layer (HVL!) to characterize x-ray beams generated with potentials up to 400 kVp. In a previous work (Chica et al 2008), we have estimated, for low-energy x-ray beams, the uncertainty in the absorbed dose in water due to the use of HVL1 as quality index. We found that this uncertainty can be above 11% in some cases. These values are, by far, larger than the uncertainties stated by the dosimetry protocols above mentioned.
For medium-energy x-ray beams, these are those generated with potentials between 100 and 300 kVp and with HVL1 values between 0.17 and 4 mm Cu, the protocols propose to calculate the absorbed dose in water as
Dv = MNkPQ P A
where M is the reading obtained at the reference depth (2 cm) in a water phantom, corrected to normal conditions of pressure and temperature, NK is the air-kerma calibration factor for the beam quality,
(m,„ p)»,„,,- js Ujg r a t j 0 water-to-air of the mass energy absorption coefficients averaged over the photon spectrum at the reference depth in water and PQ is a perturbation factor which accounts for the presence of the ionization chamber itself.
The uncertainty in the determination of the absorbed dose in water for medium energy x-rays beams has been estimated. X-ray beams whose spectra were generated with the codes XCOMP5R and SPEKCALC, for potentials up to 300 kVp, were transported using the Monte Carlo code PENELOPE in order to calculate the perturbation factors, for the PTW 30001 ionization chamber, and the mass-energy absorption coefficients needed to determine the dose. The consideration of the half value layer as quality index induces ~5% uncertainty in the absorbed dose in water. The use of the generating potential or the homogeneity coefficient as a second quality index permits to characterize the beams in a better way and to determine the absorbed dose in water within 3% uncertainty.
297

REFERENCES
[1] ROSSER, K.E., An alternative beam quality index for medium-energy X ray dosimetry, Phys. Med. Biol. 43 (1998) 587-598.
[2] CHICA, U„ ANGUIANO, M„ LALLENA, A., M„ Study of the formalism used to determine the absorbed dose for low-energy x-ray beams Phys. Med. Biol. 53 (2008) 6963-6977.
[3] INTERNATIONAL ATOMIC ENERGY AGENCY, Absorbed Dose Determination in Photon and Electron Beams: An International Code of Practice, Technical Reports Series N° 277 (2nd edn in 1997), IAEA, Vienna (1987).
[4] INTERNATIONAL ATOMIC ENERGY AGENCY, The Use of Plane-parallel Ionization Chambers in High-energy Electron and Photon Beams. An International Code of Practice for Dosimetry, Technical Reports Series N° 381, IAEA, Vienna (1997).
298

IDOS, Vienna, 9-12 November 2010 E2-CN-182, Paper No INV015
A critical examination of Spencer-Attix cavity theory
A.E. Nahum, V. Panettieri
Physics department, Clatterbridge Centre for Oncology, bebnington CH63 4JY, UK
E-mail address of main author: [email protected]
Cavity theory is fundamental to understanding dosimeter response, and the Spencer-Attix cavity-size dependent extension of Bragg-Gray theory, formulated over 50 years ago [1], is still the most advanced form of cavity theory. However, S-A theory involves several approximations e.g. the electron fluence spectrum in the cavity is assumed to be identical to that in the undisturbed medium down to an energy delta where electrons of this energy can just cross the cavity. When Spencer and Attix developed their theory tools to critically examine such assumptions did not exist; today we have Monte-Carlo codes with electron transport schemes specifically designed to yield accurate results from ion chamber simulations [2-5]. This work describes such an examination, and involves computing the electron fluence down to energies far below that of the S-A cutoff.
Monoenergetic photons of energy lOMeV were incident on an aluminium phantom containing a wall-less air cavity (cylinder, 0.3 cm radius, 2 cm long) at 5 cm depth. The electrons were followed down to 1 keV. Aluminium was chosen as its atomic number (Z=13) is significantly different from that of air, and aluminium-walled ion chambers can easily be constructed.
All MC simulations were performed by using the 2006 version of PENELOPE [3], a general-purpose MC code widely used in dosimetry and medical radiation physics. PENELOPE is a subroutine package which requires a main program. In this work the general-purpose main program provided with the PENEASY package (v.2008-06-15) (Sempau and Badal 2008) [6] was employed. The transport algorithm involves six user-defined simulation parameters for each material. These values correspond to: cutoff energy for each particle type (EABS), CI and C2 which determine the cut-off energies for the production of hard inelastic and bremsstralung events, respectively, and distance DSMAX, an upper limit on the allowed step length. As explained elsewhere [4, 5] lower values of the simulation parameters yield shorter path lengths, increasing charged particle transport accuracy, for an increase in calculation time. Low parameter values are usually employed in very small regions, such as ion chamber air cavities. In order have the highest possible accuracy in the air cavity, analogue collision-by-collision simulation was performed by setting the CI, C2, WCC and WCR parameters to 0 and the EABS reduced to 1 keV for all particles. Similarly to previous work by Aldana ct al [5] two thin "skin" regions were also defined around the air cavity with relatively low parameter values (i.e. for skin 1, WCC and WCR equal to 0.1 keV and CI, C-2 equal to 0.01). In the volume of aluminium surrounding the skin regions conventional parameters were assigned.
The following quantities have been computed:
1. Absorbed dose (per incident photon) in a "cavity" in the uniform aluminum medium with dimensions identical to the air cavity.
2. Absorbed dose (same normalisation) in the air cavity. 3. The Spencer-Attix stopping-power ratio for a cavity of these dimensions. 4. Absorbed dose in the air cavity computed according to:
£
DZ = (E)L [LA (E) / p{m dE + {(07 (A)L[Sc o l(A) / p\ar a } A
299

where the electron fluence, differential in energy, is that in the air cavity, and the lower limit of the integration, A, is chosen to be much lower than the Spencer-Attix cutoff ASA.
5. The electron fluence spectrum in the air and aluminum cavities, down to 1 keV.
Figure 1 shows clear differences between these two fluences at energies below around 3 keV.
? o £ o £ S5 0) u
1000
1 1000
FIG j! Electron fluence spectrum in the air (AIR), and aluminium cavity (ALU) down to 1 keV. MC data uncertainties are within 0.3% (1 sigma) for ALU and within 4% (1 sigma) for AIR .
REFERENCES
[1] SPENCER, L. V. and ATTIX, F. H„ A theory of cavity ionisation, Radiat. Res., 3, 239-254, 1955.
[2] KAWRAKOW, I., Accurate condensed history Monte Carlo simulation of electron transport: II. Application to ion chamber response simulations, Med. Phys., 27, 499-513, 2000.
[3] SAL VAT F, FERNANDEZ-VAREA J M and SEMPAU J 2006 PES ELOPE 2006: A Code System for Monte Carlo Simulation of Electron and Photon Transport Issy-les- Moulineaux, France: OECD Nuclear Energy Agency. Available in pdf format at http://www.nea.fr
[4] SEMPAU J and ANDREO P 2006 Configuration of the electron transport algorithm of PENELOPE to simulate ion chambers Phys. Med. Biol 51 3533-48
[5] SEMPAU J, ANDREO P, ALDANA J. MAZURIHR J and SALVAT F 2004 Electron beam quality correction factors for plane-parallel ionization chambers: Monte Carlo calculations using the PENELOPE system Phys. Med. Biol. 49 4427-44
[6] SEMPAU J and BADAL A 2008 PENEASY, a modular main program and voxelised geometry package for PENELOPE [http://www.upc.edu/inte/downloads/penEasy.html
300

IDOS, Vienna, 9-12 November 2010 E2-CN-182, Paper No INV015
Optical-fiber guided A1203:C radioluminescence dosimetry for external beam radiotherapy
C.E. Andersen3, S.M.S. Damkjaer3, M.C. Aznarb
a Radiation Research Division, Risoe National Laboratory for Sustainable Energy, Technical University of Denmark, Roskilde, Denmark
b Department of Radiation Oncology, Copenhagen University Hospital, Copenhagen, Denmark
E-mail address of main author: [email protected]
Small luminescence point-detectors coupled to optical-fiber cables (typically 1 mm diameter and 15 m length) may be used for medical dosimetry. Currently, the main luminescence materials are A1203:C and organic scintillator materials. The potential applications include, for example, online in vivo dose verification during remotely afterloaded brachytherapy [1], in vivo time-resolved IMRT dosimetry [2,3] and dose-per-pulse measurements in megavolt x-ray beams [4].
In the present work, we specifically explored the use of a new readout protocol for A1203:C for accelerator characterization measurements, and eventually, small-field dosimetry in external beam radiotherapy. A1203:C can in principle be used for radioluminescence (RL) dosimetry as well as optically stimulated luminescence (OSL) dosimetry. In the new readout protocol, however, we have eliminated the OSL readout. The main advantage of this so-called saturated RL protocol compared with the combined RL/OSL readout protocol is that it provides an RL sensitivity which is almost constant. Furthermore, the new readout protocol is much simpler and faster to use in the clinic. In contract to the main organic scintillators, it is noteworthy that the RL signal from A1203:C has a long luminescence life-time which allows for almost complete removal of any interference from light generated in the optical fiber cable due to stray radiation from pulsed beams [3].
Measurements were conducted in a 6 MV beam (Varian iX linear accelerator, USA) using a solid-water phantom (type 457, Gammex, USA) and a 2 mg A1203:C crystal (Landauer inc, USA) attached to a PMMA optical-fiber cable. The data acquision system recorded both the RL signal from the A1203:C and the number of accelerator gun pulses (deduced from the so-called target current signal).
The new RL-protocol with saturated A1203:C was found to be highly sensitive (-5x10 counts pr. Gy) and doses in the range from 10 mGy to above 15 Gy could be measured using a single calibration factor. The reproducibility of the raw RL signal was less than 1 % relative standard deviation. The RL sensitivity was found to change by approximately -0.5% pr. 100 Gy. Figure 1 shows, as an example, the response to 63 irradiations (25 MU, 100 source-to-surface distance, 10x10 cm2 field size) with the A1203:C probe at 10 cm depth. The relative standard deviation was about 0.5%. For three of the irradiations (irradiation no. 1, 27, and 46) we noted, however, that the response deviated by approximately 2% from the mean. These deviations coincided with irradiations with a low number of gun pulses, and the data therefore may reflect accelerator variability during the 1.3 h period it took to deliver the 63 irradiations.
301

Measured dose (RL)
- - - • 1 \ - " - - * • / \
•
v v " " " " v " " i *
<
*
% • •
Mean = 0.170 Gy
Rel.stdev = 0.50 %
N = 63 exp64004A
0 10 20 30 40 50 60
No. of linac pulses • • M M • • • • l\ • /v M M -4 M — • M M M / •
• • • • M •
V • • • -
• • l\ • /v M M -4 M — • M M M / •
• • • • M •
I
•
1 1 Mean = 900.2 pulses
Rel.stdev = 0.48 % • N = 63
0 10 20 30 40 50 60
Irradiation no.
FIG. I. Top panel: Measured doses for 63 assumed identical irradiations (25 MU, 6 MV, 10 cm depth). Bottom panel: The corresponding number of accelerator pulses for each irradiation. Irradiation no. 1, 27, and 46 were preceded by delays in the sequence of irradiations by about 10 minutes.
REFERENCES
[1] ANDERSEN, C.E., NIELSEN, S.K., L1NDEGAARD, J.C., TANDERUP, K„ Time-resolved in vivo luminescence dosimetry for online error detection in pulsed dose-rate brachytherapy (2009). Medical Physics, 36, 5033-5043.
[2] AZNAR, M.C., ANDERSEN, C.E., B0TTER-JENSEN, L„ BACK, S.A.J., MATTSSON, S„ KJ/HR- KR1STOFFERSEN, F„ MEDIN, J.. Real-time optical-fibre luminescence dosimetry for radiotherapy: physical characteristics and applications in photon beams (2004) Phys. Med. Biol. 49, 1655-1669.
[3] ANDERSEN, C.E., MARCKMANN, C.J., AZNAR, M.C., B0TTER-JENSEN, L., KJ/HR-KRISTOFFERSEN, F., MEDIN, J., An algorithm for real-time dosimetry in intensity-modulated radiation therapy using the radioluminescence signal from A1203:C. (2006) Radiat. Prot. Dosim. 120, 7-13.
[4] BEIERHOLM, A.R., ANDERSEN, C.E., LINDVOLD, L.R., AZNAR, M.C.: Investigation of linear accelerator pulse delivery using fast organic scintillator measurements (in press), Rad. Meas., doi: 10.1016/j.radmeas. 2009.11.023.
302

IDOS, Vienna, 9-12 November 2010 E2-CN-182, Paper No INV015
Application of dose area product and DAP ratio to dosimetry in IMRT and small field external beam radiotherapy
S. Duane3, F. Graber3, R.A.S. Thomas3
aNational Physical Laboratoiy (NPL), Teddington, UK
E-mail address of main author: [email protected]
Absorbed dose at a point on the central axis is fundamental to the planning, measurement and delivery of megavoltage photon external beam radiotherapy. Particularly in small fields, measurement at a point becomes quite challenging, and it may be interesting to consider instead the use of integral quantities such as Dose Area Product1. For instance, it turns out that a plot of percentage DAP as a function of depth (PDDAP) retains a sensitivity to the incident beam energy which is comparable to that of the more familiar plot of CAX percentage depth dose. However unlike PDD data, the PDDAP plot is relatively insensitive to SSD, to field size, and even to field shape.
Tissue Phantom Ratio, TPR20/i0, is widely used as a beam quality parameter in reference dosimetiy protocols, but their extension to non-reference fields is made more complicated by the associated field size dependence of TPR. The properties of DAP make it natural to consider whether DAP Ratio, DAPR 2O/IO, may be useful as a beam quality parameter. In particular, one can expect DAPR to be insensitive to SSD, to field size and field shape, while retaining a sensitivity to beam energy comparable to that of TPR. Such a beam quality parameter should take essentially the same value for all the fields contributing to an IMRT plan, provided only that the plan is composed of fields of a single beam energy and having the same beam filtration. In that case, DAPR could qualify as a beam quality parameter, associated with the IMRT plan itself, for the purpose of dosimeter calibration in terms of absorbed dose. Specifically, the calibration coefficient under reference conditions would be expressed as a function of DAPR and evaluated for the measurement in an IMRT plan at the DAPR value associated with the fields composing that plan.
However an analysis of the residual small variations in DAPR associated with field size and shape suggests that these are not correlated with changes in beam quality in a way that would predict changes in dosimeter calibration. The situation is similar to that of TPR20/10 when considering the effect on ion chamber calibration of varying beam filtration at fixed energy. Accordingly, a second integral quantity is defined which is the ratio of DAP, at a depth of 10 cm in water, with and without an additional 1 cm thickness of lead placed upstream of the water. This lead attenuation factor may be combined with DAPR in a beam quality index which has the required correlation with the effective stopping power ratio, in phantom, averaged over the beam. This beam quality index can be used for the purpose of dosimeter calibration in IMRT.
Measurements have been made of DAP, percentage depth-DAP, DAPR and the lead attenuation factor in a solid water-equivalent phantom using a large area PTW 34070 transmission monitor chamber. The measured sensitivity of DAPR and TPR to nominal beam energy is shown in Figure 1, and the insensitivity of DAPR to field size and shape is shown in Figure 2.. Results will also be presented for measurements of DAP, PDDAP and DAPR, made in a water phantom using a PTW 34070 Bragg Peak chamber.
303
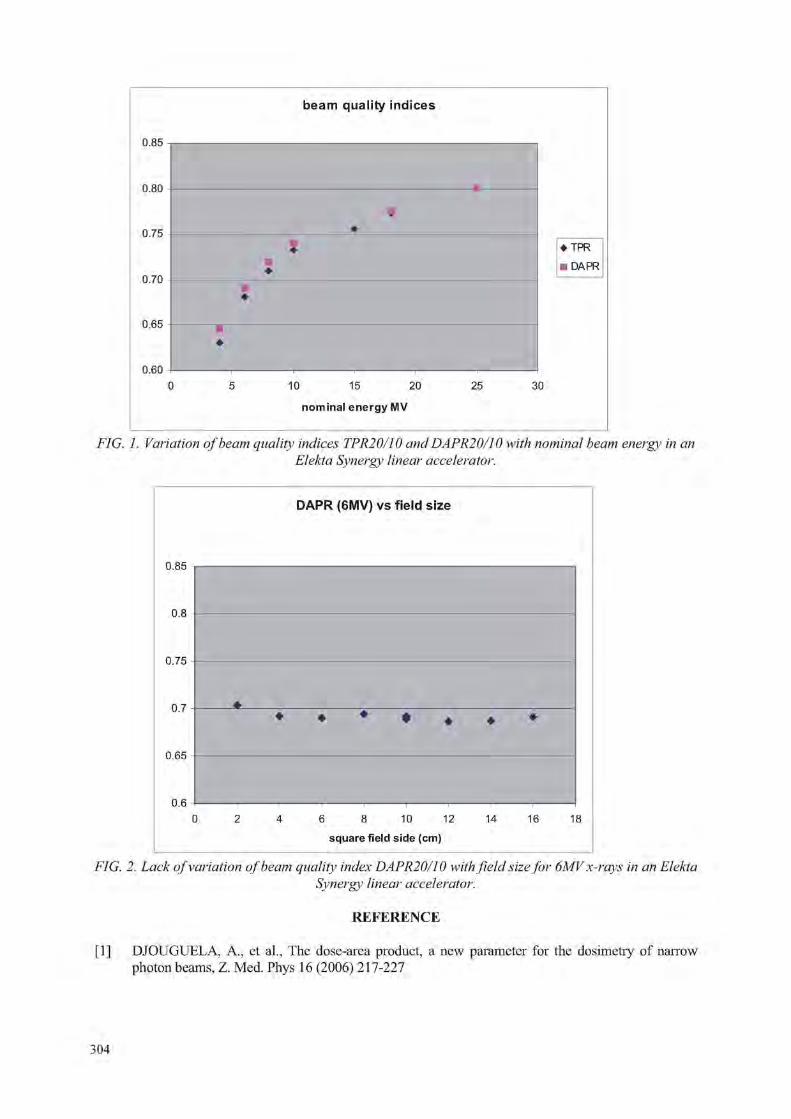
beam quality indices
0.85
0.80
0.75
0.70
0.65
0.60
• TPR
• DAPP.
10 15 20 25
nomina l ene rgy MV
30
FIG. 1. Variation of beam quality indices TPR20/10 and DAPR20/10 with nominal beam energy in an Elekta Synergy linear accelerator.
DAPR (6MV) vs field size
0.85
0.8
0.75
0.7
0.65
0.6
0 2 4 6 8 10 12 14 16 18
square field side (cm)
• • • • • • •
FIG. 2. Lack of variation of beam quality index DAPR20/10 with field size for 6MV x-rays in an Elekta Svnergy linear accelerator.
REFERENCE
[1] DJOUGUELA, A., et al., The dose-area product, a new parameter for the dosimetry of narrow photon beams, Z. Med. Phys 16 (2006) 217-227
304

IDOS, Vienna, 9-12 November 2010 E2-CN-182, Paper No INV015
Measurement and modelling of electron beam profiles and calculation of graphite calorimeter gap corrections and ion chamber wall perturbation
factors for the NPL Elekta Synergy linear accelerator
M Bailey, D R Shipley
National Physical Laboratory, Teddington, United Kingdom
E-mail address of main author: mark, [email protected]
In addition to the seven x-ray beam qualities available on the Elekta Synergy Digital Linear Accelerator recently installed at NPL, there are ten available electron beam qualities. Up to nine of these will be in common use enabling NPL to provide absorbed dose calibrations for the full range of electron beam qualities currently in therapeutic use in the UK. This will largely remove the need for the extrapolations required for calibrations carried out on NPL's aging research linac facility.
During commissioning exercises, depth-ionisation measurements were made using a Scanditronix NACP-02 parallel-plate ionisation chamber, and validated Monte Carlo models of the electron beam source are required for each electron beam quality, for the calculation of gap corrections for primary standard graphite calorimetry and wall perturbation factors for hospital ionisation chamber calibration services.
12 MeV %DD fully optimised
Depth, cm
FIG 1: Example depth-dose curve calculated using DOSRZnrc/BEAMnrc (blue) compared with measured values, for mean electron energy 12.57 MeV, with FWHM2.5 MeV
EGSnrc [1] -based calculations were performed using DOSRZnrc and DOSXYZnrc, with water-air stopping power ratios calculated using SPRRZnrc, all with a full BEAMnrc [2] model for the clinical linac head (see Figure 1). The NPL Grid [3] was used for many of these calculations, enabling a calculation taking many hundreds of CPU hours to be performed in just a few hours.
305

It is important to compare these results with those obtained using the current IPEM electron radiotherapy dosimetry code of practice [4] (see Figure 2) since the equations presented in the code of practice were obtained using Monte Carlo calculations using EGS4-based codes in 1995 [5,6]. EGSnrc contains more complete physics, particularly in relativistic spin interactions and in the Bhabha and Moller cross-sections for electron and positron scattering and there had been errors in the physics for these cross-sections until 1996 [7].
R_100 against R_50,D
4.0
3.5
3.0 I / O a 5 •p 2.5 • 5 5
" « g • R_50 from CoP Eqn 2.1
o R_50,D from Burns Equation
« R_50,D and R_100 from SPRRZnrc fits to %DD
« DOSRZnrc with BEAMnrc source
0.6R_50,D - 0.1cm
0.598R_50,D - 0.131 cm: Best fit result using SPRRZnrc
0.0 ! f 1 I I 0.0 1.0 2.0 3.0 4.0 5.0 6.0 7.0 8.0 9.0 10.0
R_50,D (cm)
FIG 2: Depth ofpeak dose on axis in reference field (RIOO,D) against depth of 50% dose (Rso.n) far NPL Elekta SynergV linac, showing comparison with equation of Burns et al [2],
The results of calculations of the gap corrections for the primary standard absorbed-dose graphite calorimeters and wall perturbation factors for parallel-plate ionisation chambers designated in the IPEM electron radiotherapy code of practice will be presented.
REFERENCES
[1] KAWRAKOW, I. AND ROGERS, D. W. 0., The EGSnrc code system: Monte Carlo simulation of Electron and Photon Transport, NRCC Report PIRS-701 (2006).
[2] BURNS, D. T„ DING, G. X., AND ROGERS, D. W. 0 „ R50 as a beam quality specifier for selecting stopping-power ratios and reference depths for electron dosimetry, Med. Phys. 23 (1996), 383-388.
[3] UNTVA UD GRID: http://www.univaud.com/hpc/products/grid-mp/ [4] IPEM Working Party: Thwaites, D. I. (Chair), DuSautoy, A. R , Jordan, T„ McEwen, M. R ,
Nisbet, A., Nahum, A. E. and Pitchford, W. G„ The IPEM code of practice for electron dosimetry for radiotherapy beams of initial energy from 4 to 25 MeV based on an absorbed dose to water calibration, Phys. Med. Biol. 48 (2003) 2929-2970
[5] DING, G. X., ROGERS, D. W. 0., and MACKIE, T. R , Calculation of stopping-power ratios using realistic clinical electron beams, Med. Phys. 22 (1995), 489-501.
[6] ROGERS, D. W. 0., EWART, G. M., FADDEGON, B. A., DING, G. X., MA, C.-M., WE, J. and MACKIE, T. R„ BEAM: a Monte Carlo code to simulate radiotherapy treatment units, Med. Phys. 22 (1995), 503-24.
[7] BIELAJEW, A. F. and ROGERS, D. W. 0., Effects of a Moller cross section error in the EGS4 code, Med. Phys. 23 (1996), 1153
306

IDOS, Vienna, 9-12 November 2010 E2-CN-182, Paper No INV015
Measurement and modelling of beam profiles in small fields produced by a 2.5 mm microMLC
S. Duanea, F. Graber3, M. Luzzarab, H. Palmans3
aNational Physical Laboratoiy (NPL), Teddington, UK
b Elekta Ltd, Crawley, UK
E-mail address of main author: [email protected]
A pre-production Apex1'"1 add-on microMLC (Elekta, Crawley), having double focussed leaves and a projected leaf width of 2.5 mm, was fitted to an Elekta Synergy linear accelerator and aspects of its performance investigated at 6 MV, 10 MV and 18 MV.
Beam profile and output factor measurements were performed in an IBA Blue Phantom2 using a stereotactic SFD diode, a PTW 60012 unshielded diode, a PTW31014 pinpoint chamber, and a PTW microLion liquid filled ion chamber, and in air using the stereotactic diode fitted with a brass build-up cap. Additional measurements were made using GafChromic EBT and EBT2 films in a solid water-equivalent phantom. The x-ray beams used the standard Elekta beam flattening filters and were collimated with the Apex1 M, using the 80 leaf MLCi and backup diaphragms to set a 12 cm x 14 cm field. The resulting beam profiles and output factors may be represented by a multi-source fluence model consisting of a geometrically small direct beam component and an extended (extra-focal) indirect source component. This model was validated by small field measurements in which the 80 leaf MLCi was set give a "primary" collimation smaller than the default size, 12 cm x 14 cm, thereby reducing the contribution from the indirect source component.
Some beam profiles measured with the SFD diode in water are presented in figure 1, which shows the variation in one leaf bank penumbra as the field size is reduced and penumbrae overlap. Further results of measurement and modelling of beam profiles, output factors and isodose contours will be presented for a range of small and irregular fields with overlapping penumbrae.
Off axis [mm]
FIG.I. SFD diode-measured single leaf bank penumbra profile, for various opposing leaf bank positions.
307


IDOS, Vienna, 9-12 November 2010 E2-CN-182, Paper No INV015
Secondary electron perturbations in Farmer type ion chambers for clinical proton beams
H. Palmans
National Physical Laboratory, Teddington, United Kingdom
E-mail address of main author: [email protected]
Introduction
Dosimetry of proton therapy has reached a reasonable level of consistency with the introduction of absorbed dose based protocols by the IAEA [1] and the ICRU [2]. Both recommendations adopted the assumption from earlier recommendations that ion chamber perturbation factors in proton beams are unity for all ionisation chamber types. However, early experiments [3, 4] indicated a difference in response of up to 2% between ion chambers with a graphite wall and those with an A150 tissue equivalent wall. A later experiment [5] demonstrated that Farmer type chambers with graphite and A150 walls exhibit on average a difference in response of 0.5%. Monte Carlo simulations [6] showed that secondary electrons are responsible for this effect but the uncertainty of those simulations was rather large due to limitations in available computation time and they were performed with EGS4.
Another potential issue is the central electrode effect of chambers with an aluminium central electrode. Two experimental papers indicate that the perturbation factor due to the aluminium electrode is unity within the experimental uncertainties [4, 5]. No Monte Carlo simulations have been reported on this. It is worth to note that in high-energy electron beams, the presently accepted value of the aluminium central electrode perturbation factor is 0.998 [1].
Method: Monte Carlo simulations
Simulations of electron transport were performed assuming that the proton spectrum over the geometry of the cavity geometry does not change. This can be retrospectively justified if the resulting perturbation factors are only slowly varying as a function of energy. The modelled geometry is a cylinder with length 24 mm, diameter 6.4 mm and wall thickness of 0.38 mm, i.e. dimensions close to that of Farmer type chambers. Both graphite and A150 as wall material is modelled. The central electrode was modelled as a 1 mm diameter and 20 mm long cylinder at the centre of the cavity protruding from its base. Electron recoil spectra in the cavity, central electrode, wall and surrounding water are calculated from the Bhabba cross section and based on the electron density in each medium. Electron transport through the geometry is simulated using DOSRZnrc for either isotropic internal electron sources or more realistic sources accounting for a simplified angle-energy double-differential distribution of recoil electrons (for which a modification to the code was required). These can be considered as two extremes.
Results
FIG. 1. shows the resulting wall and central electrode perturbation factors as a function of incident proton energy. The wall perturbations are energy dependent and increase from unity to about 1.004 for an A150-walled Farmer chamber and decrease from unity to about 0.998 for a graphite walled Farmer chamber. This is in good agreement with the experimental ratio of about 1.005 observed for the same geometries in an 75 MeV proton beam [5]. The central electrode perturbation factor for a 1 mm diameter aluminium electrode in a Farmer decreases from unity to about 0.998. This is consistent with experimental data [3, 5] as shown in fig. 1. although the experimental uncertainties do not enable to resolve the 0.2% effect.
309

1.006
1.004
1.000
f.
A150
- - - - - - graphite
1.002
1.000
s a 1.002
1 .000
- f
0.999 S 0.998 Q.
0.996
0.998 0.994
fr Monte Carlo (this work)
• Medin etal. 1995
APalmans etal. 2001 -ND,w-based
OPalmans etal.2001 -NK-based
50 100 150 200 250 100 150 200 250
pro ton energy / MeV pro ton energy / MeV
FIG. 1. Wall perturbation correction factors calculated in this work for a Farmer geometry with graphite and A-150 tissue equivalent plastic walls (left) and central electrode perturbation correction
factors for a Farmer geometry with a graphite wall and aluminium central electrode (right).
REFERENCES
[1] ANDREO, P., BURNS, D. T„ HOHLFELD, K„ HUQ, M. S„ KANAI, T„ LAITANO, F„ SMYTH, V. G. AND VYNCKIER, S., Absorbed dose determination in external beam radiotherapy: an international code of practice for dosimetry based on standards of absorbed dose to water, IAEA Technical Report Series 398, IAEA, Vienna (2000).
[2] ICRU, Prescribing, Recording, and Reporting Proton-Beam Therapy International Commission on Radiation Units and Measurements Report 78, ICRU, Bethesda MD, USA (2008).
[3] MEDIN, J., ANDREO, P., GRUSELL, E„ MATTSSON, 0., MONTELIUS, A. AND ROOS, M., Ionization chamber dosimetry of proton beams using cylindrical and plane parallel chambers. Nw versus NK ion chamber calibrations, Phys. Med. Biol. 40:1161-76 (1995).
[4] PALMANS, H„ SEUNTJENS, J,, VERHAEGEN, F„ DENIS, J.-M., VYNCKIER, S. AND THIERENS, H., Water calorimetry and ionization chamber dosimetry in an 85-MeV clinical proton beam, Med. Phys. 23:643-50 (1996).
[5] PALMANS, H„ VERHAEGEN, F„ DENIS, J.-M., VYNCKIER, S. AND THIERENS, H„ Experimental pwall and peel correction factors for ionization chambers in low-energy clinical proton beams, Phys. Med. Biol. 46:1187-204 (2001).
[6] VERHAEGEN, F. AND PALMANS, H., A systematic Monte Carlo study of secondary electron fluence perturbation in clinical proton beams (70-250 MeV) for cylindrical and spherical ion chambers, Med. Phys. 28:2088-95 (2001).
310

IDOS, Vienna, 9-12 November 2010 E2-CN-182, Paper No INV015
Ionization chamber of variable volume and the uncertainties in the chamber positioning
Silva J. L. D. F.a , Cardoso R. S. \ Peixoto J. G. P.c
a IRD, Rio de Janeiro, Brasil.
b IRD, Rio de Janeiro, Brasil. 0 IRD, Rio de Janeiro, Brasil.
E-mail address of main author: [email protected]. br
The present work is aimed at determining the uncertainties on positioning (leveling and alignment) of a free-air ionization chamber with variable volume as a primary standard in X-rays low energy beams. Usually, the ionization chamber has to be positioned perpendicular to the beam. For sure, this positioning shall hardly be 100% perpendicular, otheiwise it will induce the beam in the chamber to be inclined, thus modifying the beam's form and sensible volume, and, consequently, generating an uncertainty. The accessories used to achieve that goal were described in the material and methods of the extended version and the results are in accordance with the precision metrological mechanics, which leads to deduce that adopted procedures are viable.
Positioning procedure of the ionization chamber (alignment and leveling): The chamber alignment system consisted of an automatic table of x, y and z coordinates, installed in front of the radiation source. In order to guarantee the correct perpendicularity of the chamber, the laser at the bottom of the room was aimed to the center mark that was machinated at the center of the steel stem of the assemblage, which was centered with the collimators support by means of flanges. The bottom laser was then directed to the x-axis at the preexisting center mark behind the chamber (the alignment of various points is the operation that considers putting all of them at the same straight line. The laser beam has constant dimension at large lengths, which made it applicable to the industrial laser applications) [3]. After these actions were performed with an assemblage of mirrors at 90°, it was obtained the perpendicularity of the two lasers on the opposite lateral walls to the room bottom laser. So as to guarantee the frontal chamber alignment, it was projected and manufactured an adaptable delimiter flange on the nut that fastened the collimator at the chamber, allowing the positioning of the diameter focus of the lasers of the lateral opposite walls in the edge of the trims machined in the acrylic flange. Occurring a coincidence of the two lasers of the lateral trims in the edges with dots diametrically opposite in this flange (as the laser is frequently used to great distances alignments, it is indispensable to study the laser's beam propagation with the possible previsible perturbations and their consequences in the expected results) [3], which was not considered in the present work, thus enabling the obtention of the alignment at the horizontal plan of the chamber. The uncertainties as to the alignment and leveling at the horizontal and vertical plans will be respectively described afterwards.
Current chamber positioning (leveling): Once the previous stage was observed and using the same table of coordinates, and also sustaining and keeping the chamber alignment with its central axis to the focus of the wall laser at the bottom of the room, a bubble level was used on the ionization chamber body, having the chamber level visually adjusted with a shim.
Positioning uncertainties (alignment and leveling): Once the assemblage (dial indicator-flange stem of steel) was calibrated and the previous steps were carried out, the procedure adopted to quantify the longitudinal variations in the positioning of the chamber as to uncertainties consisted in positioning the dial indicator (instruments used to accurately measure small linear distances) [4].
311

A regular dial indicator measured linear displacement along the axis of the indicator [2]. The stem extremity of the dial indicator was positioned against the interface of the external perimeter of the collimator nut and the acrylic flange, on whose face there was a extreme trimmed dot marked and stipulated as dot 0° in the flange adaptor, and the stem extremity of the dial indicator was mechanically moved towards the aperture perimeter of the chamber collimator nut. The chamber collimator nut was addressed towards the dial indicator pointer up to the pointer reached zero in its scale, since the assemblage was previously calibrated at a height trace, which meant that the collimator nut was at a nominal distance focus chamber of 500mm. In order to follow the mechanism of the coordinates of the table moves, the ionization chamber in the vertical plan made the pointer dial indicator ran from 0°, to 90°, 180° and 270° sequence dots. In these four dots diametrically opposite and in the axis X-X' (horizontal) and Y-Y" (vertical), there were performed four series of ten measurements with the pointer dial indicator. All these measurements were carried out around the aperture perimeter of the chamber collimator nut.These ten measurements were taken by repositioning ten times the ionization chamber. The data thus obtained were converted under the form of relative uncertainty standard in the positioning (alignment and leveling) Equation 1 [1].
c 7 ( % ) = ^ x i o o (l) X
REFERENCES [1] BELL STEPHANIE, 2000 Guia do Iniciante a Incerteza da Medicao, Guia da Pratica da Boa
iVlcdicao n° 11 (Pubhcacao 2) Centra de Metrologia Basica para Calor e Comprimento, NPL. [2] HTTP://en,wikipedia,Org/wiki/ Dial lndicator, 9/1/2010. [3] MAILLET, H., 1987, O Laser Principios e Tecnicas de Aplica9oes, la ed., Rio de Janeiro,
Brasil, Manole LTDA. [4] TELECURSO 2000, 2003 Curso Profissionalizante: Mecanica: Metrologia/Antonio Scaramboni
[et al.]. Rio de Janeiro: Funda9ao Roberto Marinho.
312

IDOS, Vienna, 9-12 November 2010 E2-CN-182, Paper No INV015
Contributions of the different ion chamber walls to the fluence perturbation in clinical electron beams: A Monte Carlo study of the
NACP-02 parallel-plate chamber
K, Zink1'2, J Wulff2
University Hosptal Marburg, Germany, Department of Radiotherapy 2 "Institut fur Medizinische Physik und Strahlenschutz - IMPS, University of Applied Sciences Giefien, Germany
E-mail address of main author: [email protected]
Parallel-plate ionization chambers are widely used and highly recommended in clinical electron dosimetry. They are constructed to minimize possible electron fluence perturbations due to the presence of the chamber walls and the air-filled cavity itself, therefore the wall correction factor pwall is assumed to be unity in all current dosimetry protocols [see e.g. 1] independent of electron energy and depth.
Already early experimental investigations have given considerable evidence that the perturbations are not always negligible [2]. Especially the back wall was identified as a source of fluence perturbation as the electrons that are backscattered from the rear wall make a significant contribution to the dose within the active volume of the chamber. The influence of different backscattering materials behind the cavity of parallel-plate chambers was experimentally investigated by Hunt [3] et. al. and Klevenhagen [4]. According to their results, the electron backscatter is proportional to the atomic number of the scatterer and inversely proportional to the electron energy. Especially the rear wall of the NACP chamber is quite massive (thickness: 5.6 mm) and consists of graphite, which has an atomic number Z = 6 which is about 10% smaller than the effective atomic number of water. So the wall perturbation concerning the back wall directly reflects the backscatter deficiency due to the back wall of the NACP chamber. Several years ago McEwen [5] reinvestigated the backscattering of different parallel-plate chambers in clinical electron beams and determined the wall perturbation correction due to the rear wall of the NACP chamber experimentally (see fig. 1).
Monte Carlo simulations are a good tool for investigating perturbation corrections of ionization chambers. For the NACP chamber several studies have been performed during the last years [see e.g. 6]. In all studies the wall perturbation for the whole chamber was calculated, resulting in significant larger values than those measured by McEwen. In the light of these discrepancies we performed Monte Carlo for the NACP chamber using th eEGSnrc code calculating the contributions of the different chamber walls to the wall perturbation correction of the NACP chamber. The chamber was modeled in detail according to data given in literature [7] and was positioned with its reference point at the water equivalent depth zref within a water phantom. In figure 1 the wall perturbation correction for the whole chamber (/)"'"""'"'' ) and the contributions from the rear (//"" ) and side wall (p'"1' ) as a function of the electron energy specifier R50 is given. The data clearly show, that the perturbation due to the side wall is not negligible, despite the fact, that the NACP chamber is known as a "well guarded" ionization chamber. The contributions of the side wall to the wall perturbation correction may as as large as 0.7% for low electron energies.
313
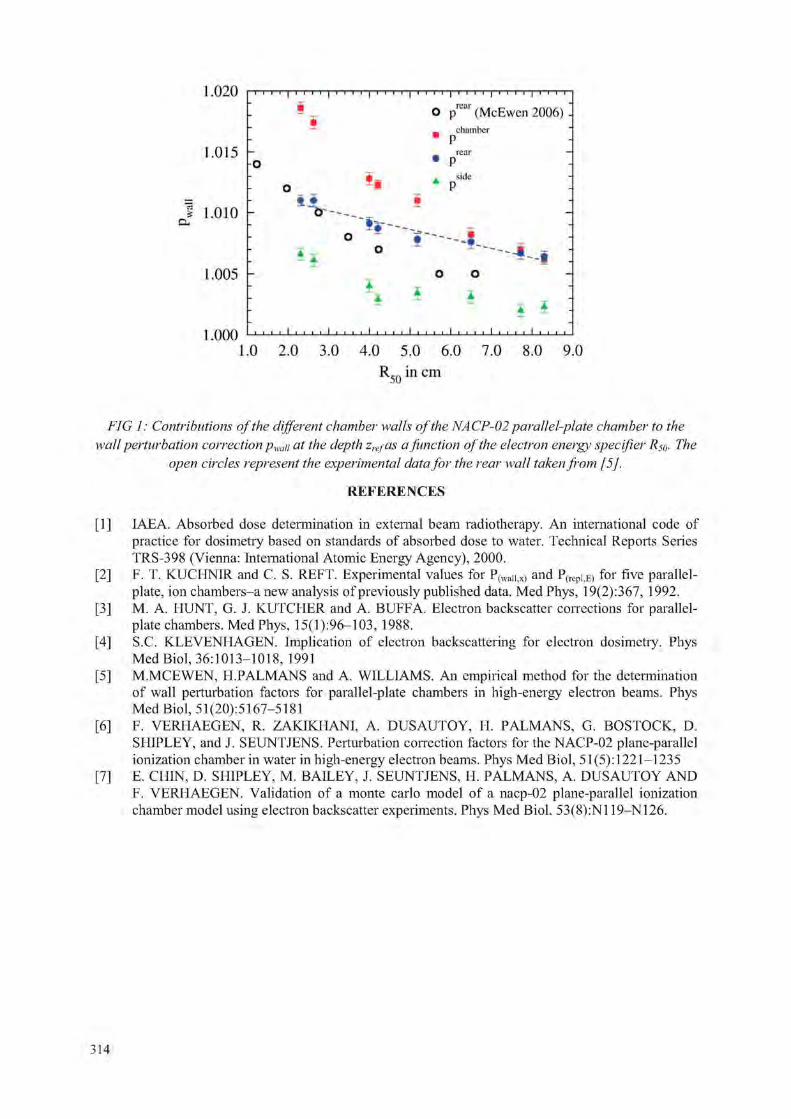
1,020 | M i i | i i i i | i i i i | i i M | i M i | i M i | i i i i | M i O prcar (McEwen 2006) -
chain her " P
1 . 0 1 5 h . prcar
. side
f 1.010 -
1 . 0 0 5 -
.000
* i -
i i J 1 I I l 1 I I L I . . . . I 1 1 I I 1 I I I I I I I t
1 . 0 2 . 0 3 . 0 4 . 0 5 . 0 6 . 0 7 . 0 8 . 0 9 . 0
R50 in cm
FIG 1: Contributions of the different chamber walls of the NACP-02 parallel-plate chamber to the wall perturbation correction pwaii at the depth zrefas a function of the electron energy specifier Rs0. The
open circles represent the experimental data for the rear wall taken from [5],
REFERENCES
[1] IAEA. Absorbed dose determination in external beam radiotherapy. An international code of practice for dosimetry based on standards of absorbed dose to water. Technical Reports Series TRS-398 (Vienna: International Atomic Energy Agency), 2000.
[2] F. T. KUCHNIR and C. S. REFT. Experimental values for P(waiijX) and P(repi,E) for five parallel-plate, ion chambers-a new analysis of previously published data. Med Phys, 19(2):367, 1992.
[3] M. A. HUNT, G. J. KUTCHER and A. BUFFA. Electron backscatter corrections for parallel-plate chambers. Med Phys, 15(1):96-103, 1988.
[4] S.C. KLEVENHAGEN. Implication of electron backscattering for electron dosimetry. Phys Med Biol, 36:1013-1018, 1991
[5] M.MCEWEN, H.PALMANS and A. WILLIAMS. An empirical method for the determination of wall perturbation factors for parallel-plate chambers in high-energy electron beams. Phys Med Biol, 51 (20): 5167—5181
[6] F. VERHAEGEN, R. ZAKIKHANI, A. DUSAUTOY, H. PALMANS, G. BOSTOCK, D. SHIPLEY, and J. SEUNTJENS. Perturbation correction factors for the NACP-02 plane-parallel ionization chamber in water in high-energy electron beams. Phys Med Biol, 51 (5): 1221—1235
[7] E. CHIN, D. SHIPLEY, M. BAILEY, J. SEUNTJENS, H. PALMANS, A. DUSAUTOY AND F. VERHAEGEN. Validation of a monte carlo model of a nacp-02 plane-parallel ionization chamber model using electron backscatter experiments. Phys Med Biol, 53(8):N119-N126.
314

IDOS, Vienna, 9-12 November 2010 E2-CN-182, Paper No INV015
Dosimetry for small size beams such as IMRT and stereotactic radiotherapy: Is the concept of the dose at a point still relevant?
Proposal for a new methodology
A. Ostrowsky, J.M. Bordy, J Daures, L, de Carlan, F. Delaunay
CEA, LIST, Laboratoire National Henri Becquerel, 91191 Gif-sur-Yvette Cedex, France;
E-mail address of main author: [email protected]•
Solving the problem of traceability of the absorbed dose to the tumour for the radiation fields of small and very small dimensions, like those used for new treatment modalities usually results in the use of dosemeters of much smaller size than those of the beam.
For the realisation of the reference in primary standard laboratories, the absence of technology likely to produce primary (absolute) small-size dosemeters leaves no possibility for the direct measurement of the absorbed dose at a point and implies the use of passive or active small-size transfer dosemeters to derive from the reference values in classical conditions (field size 10 x 10 cm2) those used for radiation fields of smaller size.
This paper intends to introduce a new kind of dose quantity for radiotherapy similar to the mean Dose Area Product concept used in radiology. For radiotherapy, the reference in terms of "absorbed dose on the whole surface of the beam" would be measured using a graphite calorimeter of a larger surface than the beam. This quantity would be used to calibrate a large surface plane-parallel ionization chamber used as a working standard. This concept is complementary to the classical one based of the absorded dose at a point since it can only be used for small irradiation fields. The large surface instruments, the graphite calorimeter as well as the plane-parallel chamber does not exist for the moment. To check the feasability of this new approach at LNHB, a small additional collimator has been built with a diameter of about 0.5 cm. This radiation field can be measured with the existing graphite calorimeter (GR9) and working standard such as plane-parallel chambers. The profile of such a beam has been measured at 12 MV on the Saturne 43 LINAC at LNHB, the calorimetric measurements are in progress. Such a new concept has to be propagated through the metrology chain, including the TPS, to the calculation of the absorbed dose to the tumour.
REFERENCES
[1] CEA Repport R-6243 Dosimetry for small size beams such as IMRT and stereotactic radiotherapy. Is the concept of the dose at a point still relevant? Proposal for a new methodology. A. Ostrowsky, JM Bordy, J Daures, L. de Carlan, F. Delaunay
[2] CEA Repport R-6184 The construction of the graphite calorimeter GR9 at LNE-LNHB. A Ostrowsky, J Daures
315

IDOS, Vienna, 9-12 November 2010 E2-CN-182, Paper No INV015
Concerns in France about the dose delivered to the patients in stereotactic radiation therapy
S. Derreumaux3, G. Boisserie , G, Brunetc, I. Buchheitd, T. Sarrazin6
a Institut de Radioprotection et de Surete Nucleaire, Fontenay-aux-Roses, France
' Groupe Hospitalier Pitie Salpetriere, Paris, France
c Centre Rene Gauducheau, Saint-Herblain, France
d Centre Alexis Vautrin, Vandoeuvre-les-Nancy, France
e Centre Oscar Lambret, Lille, France
E-mail address of main author: sylvie.derreumaux@irsn. fr
In 2006-2007 occurred the Toulouse accident that impacted 145 patients treated by stereotactic radiation therapy (SRT) for head disease. The technical expertise performed by the Institute of Radiation Protection and Nuclear Safety (IRSN) revealed that it was due to an error made during the commissioning of the installation of a Novalis system: the measurement of the scatter factors for the beams defined by the BrainLAB m3 micro MLC has been made using an inappropriate detector (a Farmer type ionisation chamber). This led to the overdose of all patients going until 200% [1]. Besides that, BrainLAB informed the IRSN that the values of the scatter factors measured by the users of the Novalis system around the world varied from 0.4 to 0.68 for the beams collimated with the 4 mm diameter cone, what represents a spread greater than 50%.
Because of these facts, the French authorities asked the IRSN to set up a working group (WG), in collaboration with the French Society of Medical Physicists (SFPM) in order to establish a national protocol for the determination of the absorbed dose in very small photon beams.
The WG first made a national survey to know the current practices in the French centres regarding beam commissioning of the small beams used for SRT. Results showed that in 2008, the irradiation technique more used in France for delivering stereotactic beams was a linear accelerator with the BrainLAB m3 micro MLC (integrated or added to the machine), and that the detector more used for measurement of scatter factors was the PTW Pinpoint chamber 31006.
The survey has also revealed that most physicists followed the recommendations of the manufacturers regarding the choice of the detector while those recommendations were not always appropriate. For instance, for the measurement of the scatter factors, BrainLAB recommended to use a "medium size detector" (Pinpoint ionisation chamber with a volume equal or smaller than 0.03 cm3) for all field sizes and Accuray recommended the use of the PTW 60008 diode for the Cyberknife. A review of the international literature on the subject shows however that a Pinpoint chamber and a PTW 60008 diode respectively underestimates by about 10% and overestimates by about 5% the measured dose in the smallest field sizes (~5 mm). None of the manufacturers encouraged physicists to use different kind of detectors in order to compare the results and have an eye criticizes on them.
For similar irradiation conditions (6 MV RX; BrainLAB m3 microMLC; SSD = 1000 mm; z = 50 mm), the spread of the measured values of scatter factors was around 5-10% for field sizes equal or greater than 12 mm x 12 mm and around 30% for the smallest field (6 mm x 6 mm), in agreement with the international literature.
317

The measurement uncertainty is a combination of uncertainties due to the size and the composition of the detector, the positioning and the centering of the detector, and the drift of the response.
The WG began a campaign of measurements of the data needed to characterize the small beams for different kinds of stereotactic systems delivering X-ray beams (standard linear accelerators with additional micro MLC, Novalis, CyberKnife). The response of commercial detectors that are usually used in the radiotherapy centres (different Pinpoint chambers and stereotactic diodes) are analyzed together with more particular but a priori more adapted detectors (various types of tissue equivalent solid state detectors).
First results have shown that regarding irradiation conditions using a micro MLC, additional uncertainty comes from the jaws' aperture and centering (~ 1-2 mm): possible large errors (until -20%) on measured scattered factors can occur if jaws are a little inside the MLC field (example with a Novalis, miniMLC, field of 6x6 mm2). A systematic few millimetres withdrawal of the jaws outside the field defined by the leaves of the MLC allows one to get free from the problem. Such a recommendation was inserted in the BrainLAB Physics Technical Reference Guide issued at the end of2008.
Another early result was that the unshielded SFD stereotactic diode better estimates the dose in the smallest fields (below 10 mm) then PTW diodes do; however, the SFD diode seems to present small diverging response in larger fields as compared to tissue-equivalent detectors.
Measurement uncertainties in small fields are not the sole problem for correct determination of the dose delivered to the patients in stereotactic radiotherapy. Indeed, one has also to take into account the uncertainties and errors due to the limits of usual algorithms for calculation of the absorbed dose in highly heterogeneous medium. It has been shown that possible large error (+10%) can occur using the Raytrace algorithm in case of lung heterogeneity (treatment with CyberKnife, 20 mm diameter beams) [3], and that the error increases when field size decreases [4], Nevertheless, more sophisticated algorithms like Monte Carlo, able to manage correctly the dose calculation in noil equilibrium electronic conditions, were not yet used in France in 2008.
Following the publication of the WG report [2], a series of measures have been taken in France to improve the knowledge and the control of the dose in small fields, including an IRSN R&D project in dosimetry and an official support of the development of a metrology standard for small fields at the LNHB laboratory in Saclay.
REFERENCES
[1] S. DERREUMAUX, C, ETARD, C, HUET, F. TROMPIER, I. CLAIRAND, J.-F. BOTTOLLIER-DEPOIS, B. AUBERT, P. GOURMELON. Lessons from recent accidents in radiation therapy in France. Radiation Protection Dosimetiy 131, 130-135, 2008.
[2] S. DERREUMAUX, G. BOISSERIE, G. BRUNET, I. BUCHHEIT, T. SARRAZIN, M. CHEA, C. HUET, I. ROBBES, F. TROMPIER. Mesure de la dose absorbee dans les faisceaux de photons de tres petites dimensions utilises en radiotherapie stereotaxique - Rapport du groupe de travail IRSN/SFPM/SFRO. Rapport IRSN/DRPH/SER n°2008-18, decembre 2008.
[3] C.-M. MA et al., Third McGill International Workshop, Journal of Physics: Conference Series 102, 2008.
[4] E. W WILCOX & G. M. DASKALOV, Med. Phys. 35 (6), 2008.
318

IDOS, Vienna, 9-12 November 2010 E2-CN-182, Paper No INV015
Analytical determination of a plan class specific reference (PCSR) field for reference dosimetry of IMRT fields
T Ohrmana, U Isacson", A Monteliusb, P Andreoa
a Medical Radiation Physics, Stockholm University and Karolinska Institute, Sweden b Hospital Physics - Department of Oncology, Radiology and Clinical Immunology,
Uppsala University Hospital, Sweden
E-mail address of main author: [email protected]
The use of intensity modulated radiotherapy (IMRT) has increased significantly since its clinical introduction in the 1990's and is used in most modern radiotherapy departments today. In IMRT the patient can be irradiated with fields that are significantly different in size and shape from those used in conventional external beam radiotherapy, posing a severe constrain to the applicabi lity of the classical 10 cm x 10 cm reference field for beam calibration used in dosimetry codes of practice and protocols such as AAPM TG-51 and IAEA TRS-398 [1, 2]. An international working group has suggested a formalism for the reference dosimetry of small and nonstandard fields [3] which introduces a new concept for reference field for IMRT, a so-called plan class specific reference (pcsr) field. The pcsr field can be a 4D delivery sequence, similar to an actual clinical treatment delivery and different treatment sites could use different pcsr-fields, to ensure a close similarity with the actual clinical conditions for each site. One important concern with the new formalism is to establish criteria for suitable pcsr-fields, which should both be close to the clinical plans in the given plan class and deliver a uniform dose to a volume exceeding the dimensions of a reference detector. The aim of this work is to develop an analytical and unbiased method to find a generic treatment plan from a group of plans in a given plan class which could become a possible pcsr field. Prostate treatments have been chosen for the analysis.
Thirty one IMRT treatment plans used to treat cancer patients at the Uppsala University Hospital were considered in the study. The patients included in the study had target volumes including the prostate and the regional lymphnodes in the pelvic region. The treatments had been planned by medical physicists and nurses on a Nucletron Oncentra MasterPlan system and delivered on an Elekta Precise linac with a nominal energy of 6 MV and fitted with a 80 leaf MLC. A step-and-shoot technique was used. The mean number of segments per plan was 70, ranging from 63 to 83, using seven gantry angles. The corresponding D1COM-RT treatment plan files containing the information on the irradiation parameters such as gantry angles, collimator positions and monitor units were analyzed using MATLAB functions specifically designed for the project. These functions iterate through the segments in the same order as they are delivered to the patient, i.e. for the first gantry angle the first segment is examined, then the second segment for that angle and so on. For each segment the positions of the MLC and jaw collimators are determined collimator by collimator.
The weighted mean and median of the collimator positions, using the number of monitor units as weighting factors, were calculated from the input plans to generate potential pcsr fields. The weighted median provided a more compact pcsr, with a smaller number of segments of reduced contribution, than the mean calculation. The results were transferred back to DICOM-RT files for input to the TPS and dose calculations on an IBA IMRT phantom were performed. The calculated plan created by the MATLAB functions have many segments and only the first few contribute significantly to the total dose, due to the many segments of small size and with few monitor units
319

To investigate the possibility of generating simplified pcsr's, segments with varying level of dose delivered were filtered out from the pcsr (FIG 1) and the dose re-calculated with the TPS for the modified configuration (FIG 2). In all cases, the calculated dose distributions show regions of dose homogeneity in the central part of the phantom that are considered suitable for an experimental absorbed dose determination (work in progress).
FIG 1. Simplification criteria for the weighted median plan. Each marker represents one segment. The dashed lines represent the four values qfX lxl a4, 5x10'4, 1x1 Q-3 and'5x1 Or3.
FIG 2. Calculated dose distributions in the IMRT phantom from the weighted median plan simplified with Xcut off= 1x10"\ The dose is normalized to the isocenter and the difference between two adjacent isodose lines is 5 percentage units. Sagittal and coronal views are shown on the left.
REFERENCES
[1] ALMOND, P. R„ BIGGS, P. J., COURSEY, B. M„ HANSON, W. F„ HUQ, M. S., NATH, R. and ROGERS, D. W. O., AAPM's TG-51 protocol for clinical reference dosimetry of high-energy photon and electron beams, Med Phys 26 (1999) 1847-1870.
[2] ANDREO, P., BURNS, D. T„ HOHLFELD, K„ HUQ, M. S., KANAI, T„ LAITANO, F„ SMYTH, V. and VYNCKIER, S., Absorbed dose determination in external beam radiotherapy: An international code of practice for dosimetry based on standards of absorbed dose to water, International Atomic Energy Agency, Vienna, IAEA Technical Report Series No. 398 (2000).
[3] ALFONSO, R., ANDREO, P., CAPOTE, R„ HUQ, M. S„ KILBY, W„ KJALL, P., MACKIE, T. R., PALMANS, H., ROSSER, K„ SEUNTJENS, J., ULLRICH, W. and VATNITSKY, S., A new formalism for reference dosimetry of small and non-standard fields, Med Phys 35 (2008) 5179-5186.
320

Posters relating to Reference Dosimetry and Comparisons in
Brachytherapy


IDOS, Vienna, 9-12 November 2010 E2-CN-182, Paper No INV015
Calibration of 192Ir sources used for high dose rate remote afterloading brachytherapy
M. Asghar, S. Fatmi1, H. Mota2, S.A. Buzdar3, M. Afzal 3
1 Bahawalpur Institute of Nuclear Medicine & Oncology (BINO), Bahawalpur, Pakistan. 2Radiation Oncology - CMC NorthEast, NC, USA.
Department of Physics, the Islamia University of Bahawalpur, Pakistan.
E-mail address of main author: [email protected]
The effectiveness and safety of brachytherapy treatment is mainly concerned with the calibration of sources and their traceability to Internationally accepted Standards. For brachytherapy sources vendors assign large uncertainties to their stated calibration values, in some cases up to ± 10% [1], Independent verification as well as exact measurement of source strength is quite significant in order to assure the quality of brachytherapy treatment. This work has been carried out to calibrate the High Dose Rate (HDR) 192 Ir sources.
Since SSDL does not offer calibration of ionization chambers with Gamma-ray spectrum of 19Tr High Dose Rate source, an interpolation procedure is employed [2], using calibrations above (60Co, 1.25MeV) and below (135 kV X-rays, 61.1 keV) the exposure-weighted average energy (397 keV) of 1QO . • 1QO • . • .
"Ir. Using this chamber HDR "Ir source has been calibrated by free in-air measurement technique and then this calibrated source has been used to calibrate well-type ionization chamber. For in-air measurement technique; scatter correction factor, non-uniformity correction factor, and correction for the attenuation of primary photons in air and for well-type chamber measurements; calibration factor, sweet point (point of maximum response), and recombination correction have been determined.
Difference between the successive measurements with in-air measurement technique remained within ± 1%, and that between in-air measurement and manufacturer remained within ± 3%, and the difference between in-air measurement and well-type chamber remained within ± 1%. Comparison between well-type measurements and manufacturer values shows differences less than ± 2%. Comparison among values of reference air kerma rate obtained by in-air measurements, well chamber measurements and vendor's certificate are shown in figure 1. All these differences are within the acceptable tolerance limits. This method can be used by brachytherapy community to calibrate their sources and to ensure the traceability of calibration.
Constancy checks of well-type chamber has been carried out after the interval of one month under Co-60 beam in reproducible position and result closely match with the accepted values ±1 % [3].
323

Graph among KR (m), KR (mw), and KR (c)
3 O f O 5.
20-Sep-2006 10-0ct-2006 30-0ct-2006 19-NOV-2006 9-Dec-2006 29-Dec-2006 18-Jan-2007 7-Feb-2007
Time
FIG 1: Comparison among values of reference air kerma rate obtained by in-air measurements, well chamber measurements and vendor's certificate.
REFERENCES
[1] S. J. GOETSCH, F. H. ATTIX, D. W. PEARSON, and B. R. THOMADSEN, "Calibration of 192Ir high-dose-rate afterloading systems," Med Phys, vol. 18, pp. 462-7, 1991
[2] IAEA, International Atomic Energy Agency, "Calibration of photon and beta ray sources used in brachytherapy. Guidelines on standardized procedures at Secondary Standards Dosimetry Laboratories (SSDLs) and hospitals". IAEA-TECDOC-1274, March 2002.
[3] IAEA, International Atomic Energy Agency. "Calibration of brachytherapy sources. Guidelines to Secondaiy Standard Dosimetry Laboratories (SSDLs) and medical physicists on standardized methods for calibration of brachytherapy sources". TECDOC-1079, IAEA, Vienna, 1999
324

IDOS, Vienna, 9-12 November 2010 E2-CN-182, Paper No INV015
Fast Fourier transform algorithm for dose computations in heterogeneous brachytherapy geometries
^ a n i E., 2Francescon P., 2Cora S., 'Amuasi J.H., 'Akaho E.H.K., 3 Afenya E.
1 Graduate School of Nuclear and Allied Sciences, University of Ghana, Ghana Atomic Energy Commission Campus, Kwabenya, Ghana 2
Unita Operativa di Fisica Sanitaria, Ospedale San Bortolo, Viale Rodolfi 37, 36100 Vicenza (VI), Italy
Department of Mathematics, Elmhurst College, 190 Prospect Avenue, Elmhurst, IL
E-mail address of main author: [email protected]
Current dose specification practices in brachytherapy introduce significant dose calculation errors by failing to account for heterogeneities such as tissue-air interfaces, shielding in applicators and tissue composition variation. Dose perturbation due to applicator shielding especially could be dramatic with differences as high as 50 % [1,2] and should be adequately accounted for in order to avoid some adverse radiobiological effects.
The Convolution and Monte Carlo techniques have become critical tools for the development of new technologies in radiotherapy and are now becoming more affordable owing to the reduction in the costs of computer hardware and software. These techniques have been clinically validated using external beam radiotherapy dose calculation algorithms and seem to be the panacea for heterogeneity corrections. By making use of analytic and Monte Carlo generated kernels, a Fast Fourier Transform (FFT) convolution model for external beam radiotherapy has been adapted to incorporate heterogeneity corrections in brachytherapy applications. The algorithm is being tweaked to direct Monte Carlo outputs so as to maintain the computational time efficiency of the FFT, whilst taking advantage of the accuracy in the Monte Carlo method (the gold standard for accurate dose calculations in radiotherapy). With the main objective of this work being improved accuracy, we considered unoptimised dose distributions, starting with the establishment of a convolution model for the calculation of the dose rate distributions at points r in a homogeneous medium of water within the vicinity of a system of brachvtheranv sources, each of air kerma strength 5*,.. as
was derived by introducing a dosimetry quantity SkA = -7- , N being the rate of change of the
initial number of photons emanating from the brachytherapy source
If D . ( r ) is the perturbation in dose rate due to the heterogeneities then the corrected dose rate was given by
60126, USA
• •
(2)
N
325

DR(r) = Dh(r) + Dke,(r) ( 3 )
To take advantage of FFT, the same kernels must be used throughout the medium, suggesting that the sources were all oriented in the same sense. This has not been the case in clinical practice therefore a hybrid approach, based on FFT and the TG 43 formalism [3] has been developed for obtaining the homogeneous component of the dose rate.
Dose formulae [4,5] for correcting heterogeneities in external beam radiotherapy based on the FFT formalism have been transformed to dose rates for correcting heterogeneities in brachytherapy geometries as
'M r
\ P J Y ) 2 ( 4 )
where / / is an analytically generated correction kernel given by
Mw \r~r
ail | r - r p ( 5 )
ES is the energy of the scattered photon at a scattered angle 9
de —^ is the differential scattering cross section per unit solid angle
Pe
P is the mass absorption coefficient of the scattered photon.
//'• is the linear attenuation coefficient of water at the scattered photon energy
pw is the electron density of water in electrons per unit volume
Pe(r') a nd pc(>") are relative electron densities at points of interaction and dose deposition respectively
A function f (het,s) was introduced to account more accurately for the geometries, composition, distribution and the quantities of the heterogeneities in the medium as well as the geometrical configuration and the distribution of the sources in space so as to obtain the perturbation in dose rate by the heterogeneities as
Dhet(r) = f(het,s)Di,exb(r) (6)
Using data obtained by the Monte Carlo method as benchmark, a mathematical relationship is under development to parameterise the differences between Monte Carlo and FFT as the function f (het, s) . The sensitivity of the output against the independent variables in the function will be assessed to cast the function in the simplest form, whilst not unnecessarily compromising the robustness and accuracy of the model.
After putting the model on a sound footing, a wide range of real clinical implants will be used to run test cases and in performing calculations with fine spatial resolution to consider further modifications. Finally theoretical calculations will be confirmed with measurements in phantoms and all results (theoretical, simulations and experimental measurements) integrated to fine tune the models.
326
Improved accuracy in dose computation could only be appreciated on the basis of efficient and precise prediction of the biological effects of therapy. The sensitivities of selected radiobiological parameters with the dose calculation errors will therefore be evaluated to assess the direct clinical impact of our algorithm. This work forms the basis for the unification of physical and biological dosimetry, supposedly, starting from the construction of tumour growth models, through physical radiation dosimetry models and the response of the tumours and normal tissues (notably organs at risk) to radiation with the FFT formalism being a common parameter at all stages of the development. This approach seeks to optimise speed, efficiency, accuracy and precision in the computational techniques being adopted for improved patient cure and survival rates.
REFERENCES
[1] GIFFORD, K. A., HORTON, J. L„ PELLOSKI, C, E„ JHINGRAN, A., COURT, L. E„ MOURTADA, F., EIFEL, P. J., A three - dimensional computed tomography - assisted Monte Carlo evaluation of ovoid shielding on the dose to the bladder and rectum in intracavitary radiotherapy for cervical cancer, International Journal of Radiation Oncology Biology and Physics Vol 63, pp. 615 - 621 (2005)
[2] MARKMAN, J., WILLIAMSON, J. F„ DEMPSEY, J. F. , LOW, D. A., On the validity of the superposition principle in dose calculations for intracavitary implants with shielded vaginal colpostats, Medical Physics Vol. 28, pp. 147- 155 (2001).
[3] NATH, R„ ANDERSON, L. L„ WEAVER, K. A., WILLIAMSON, J. F„ MEIGOONI, A. S„ Dosimetry of interstitial brachytherapy sources: Recommendations of the AAPM Radiation Therapy Committee Task Group No. 43, Medical Physics, Vol. 22, 1995, pp. 209 - 234.
[4] WONG, E., ZHU, Y„ VAN DYK, J., Theoretical developments on fast Fourier Transform convolution dose calculations in inhomogeneous media. Medical Physics, Vol. 23, 1996, pp. 1511 - 1521.
[5] ZHU, Y, BOYER, A. L., X-ray dose computations in heterogeneous media using 3-dimensional FFT convolution, Physics in Medicine and Biology, Vol. 35, 1990, pp. 351 - 368.
327


IDOS, Vienna, 9-12 November 2010 E2-CN-182, Paper No INV015
Internal clinical acceptance test of the dose rate of 106Ru/106Rh ophthalmic applicators
T.W, Kaulich3, M. Ramhergb
a Medical Physics, University Hospital for Radiation Oncology, Tubingen, Germany
b University Hospital for Radiation Oncology, Tubingen, Germany
E-mail address of main author: [email protected]
For the last forty years or so, episcleral brachytherapy using 106Ru/106Rh ophthalmic applicators has been a proven method of therapy for uveal melanomas, sparing the globe and in many cases conserving the vision [1,2,3]. In episcleral brachytherapy, a radioactive lwRu/106Rh ophthalmic applicator (BEBIG Co., Berlin, Germany) is temporarily fixed on the surface of the bulbus oculi, whereby the intraocular tumour gets irradiated protractedly through the sclera (fig. 1). i0'Ru/"J6Rh ophthalmic applicators are primarily beta sources, i.e. they generate a local dose escalation both in the vessels supplying the tumour and in the tumour itself, while simultaneously sparing the risk structures (fig.2).
FIG.l. Computer simulation of an ocular tumour therapy with ' Rn Rh ophthalmic
applicator (wire frame).
10.0
o.o
-10.0
FIG.2. Exemplary dose distribution of a 106Ru/10 Rhophthalmic applicator in the eye
(scale in mm).
In its certificates, BEBIG, the manufacturer of the product, indicates a dose rate for the 106Ru/106Rh ophthalmic applicators at a dose specification reference point [4] which ensures traceability to the NIST standard (12/2001). The dose specification reference point is situated at a distance of 2 mm from the middle of the inner (concave) surface of the applicators, and the dose rate was measured with a scintillation detector (diameter 1 mm, height 0.5 mm). The manufacturer indicates for this dose rate at the dose specification reference point a relative measurement uncertainty of ±20% within the 95% confidence interval.
Since the introduction of the NIST calibration, the quality of the calibration passed on by BEBIG to the user has been examined for n=45 ophthalmic applicators.
329

Until now, the users of 10nRu/u°Rh ophthalmic applicators are not able to measure their absorbed dose rate, because a commercial secondary standard is not yet available. Therefore, the calibration of BEBIG has been adopted and the authors have been calibrating their scintillator measurement equipment using 106Ru/106Rh ophthalmic applicators. The plastic scintillator measurement system used consists of a 0.8mm3 plastic scintillator, a photomultiplier and a high-voltage unit. The plastic scintillator was positioned at the dose specification reference point at a distance of 2 mm from the middle of the inner (concave) surface of the applicators with a MP3S (PTW Co., Freiburg, Germany) 3D water phantom . For the measurement of the current of the photomultiplier, a UNIDOS (PTW Co., Freiburg, Germany) therapy dosimeter was used which was operated as an electrometer [5].
For the measurement equipment used by the authors, a calibration factor of 38.0 Gy/[.iC was found for n=19 ophthalmic applicators in the internal clinical acceptance tests conducted between 2002 and 2004. The relative measurement uncertainty for the 95% CI was 3.7%. Considering the steep dose gradient in fig. 2, it can be derived from this small 95% CI that between 2002 and 2004 BEBIG passed on the NIST calibration to its customers very well. This calibration factor is still being used in the internal clinical acceptance tests for the ophthalmic applicators, as BEBIG continues to ensure traceability of the dose rate values to the NIST standard. Over the last six years, however, the internal clinical acceptance tests showed at times considerable deviations from the certified values.
In 2005, four ophthalmic applicators were purchased whose dose rate at the dose specification reference point was approximately 20% higher than the dose rate stated in the manufacturer's certificate. The manufacturer was informed and re-assessed its dose rate values. This examination identified an error in the manufacturer's measurement installation which was subsequently corrected.
In 2006 and 2007, the internal clinical acceptance tests did not reveal any particular deviations.
In 2008 and 2009, 16 ophthalmic applicators were purchased which had a dose rate at the dose specification reference point that exceeded the dose rate stated in the manufacturer's certificate by approximately 13 %. Again, the manufacturer was informed, but has not yet made an official statement.
Based on the experiences derived from acceptance tests of 106Ru/106Rh ophthalmic applicators over the last few years, users should examine the dose rate at the dose specification reference point to verify the calibration provided by the manufacturer in an internal clinical test.
REFERENCES
[1] LOMMATZSCH PK., Experiences in the treatment of malignant melanoma of the choroid with 106Ru-106Rh beta-ray applicators, Trans Ophthalmol Soc U K. 1973;93(0):119-32
[2] LOMMATZSCH PK, WERSCHNIK C, SCHUSTER E. Long-term follow-up of Ru-106/Rh-106 brachytherapy for posterior uveal melanoma, Graefes Arch Clin Exp Ophthalmol 2000;238:129-37.
[3] BERGMAN L, NILSSON B, LUNDELL G, LUNDELL M, SEREGARD S„ Ruthenium brachytherapy for uveal melanoma, 1979-2003: survival and functional outcomes in the Swedish population. Ophthalmology. 2005 May;l 12(5):834-40.
[4] SOARES, C. (convener), ISO 21439, Clinical dosimetiy - Beta radiation sources for brachy-therapy, ISO, Geneva, CH (2009)
[5] KAULICH TW, ZURHEIDE J, HAUG T, NUSSLIN F, BAMBERG M„ Clinical quality assurance for ' Ru ophthalmic plaques, Radiotherapy and Oncology 76 (2005) 86-92
330

IDOS, Vienna, 9-12 November 2010 E2-CN-182, Paper No INV015
Detectors for brachytherapy dosimetry: Response as a function of photon energy
I. Jokelainen, P.Sipila, H. Jarvinen
STUK - Radiation and Nuclear Safety Authority, Helsinki, Finland
E-mail address of main author: [email protected]
Introduction
At present, a number of different detectors have been used for the verification of dose distributions of brachytherapy sources, e.g., in gynaecological treatments by 192If and ophthalmic treatments by 125I. The accuracy of relative dose measurements depends on the basic characteristics of the dosimeters such as the dependence of the detector response on photon energy. In this work, the response as a function of photon energy has been determined for radiochromic film [1] (Gafchromic® EBT), diode (Scanditronic type DEB050) and scintillation detector (OPTIDOS type T10013), for x-ray beam qualities from about 20 keV to 120 keV effective energy (HVL 0,15-2,4 mmCu) and for 60Co gamma beam, using the therapy level beam qualities of an SSDL.
Methods
Irradiations for radiochromic film were carried out in RMI solid water phantom and for the other two detectors in a water phantom. The conventionally true absorbed dose rate were based on calculations from air kerma measurements with an air kerma calibrated secondary standard chamber. For measurements with a radiochromic film, a high precision automatic read-out system (XY-plane scanner) was constructed and the accuracy of measurements was ensured by careful testing of the other detector characteristics (base transmission, homogeneity, sensitivity to background light, change of transmission after irradiation, dose response). Experiments were carried out at the SSDL of STUK.
Results
The results indicate that both the diode and the scintillation detector possess a very high dependence of the response on photon energy, more than twofold in the energy region studied (Fig.l) On the contrary, Gafchromic11 EBT film had relatively small energy dependence, within about 17 % in the x-ray region and within 28 % between 100 kV x-rays and w'Co gamma energy. The estimated uncertainty of the relative calibration factors for radiochromic film was about 1,8 % (with coverage factor k=2).
Conclusions
The results suggest that Gafcromic EBT film is suitable and sufficiently accurate for the determination of relative dose distributions of brachytherapy sources, while the high energy dependence of diode and scintillation detector turn them unsuitable for these measurements.
331

ACKNOWLEDGEMENTS This work has been carried out as a part of EC funded EMRP projects T2.J06 (Increasing cancer treatment efficacy using 3D brachytherapy) and T2.J07 (External Beam Cancer Therapy-EBCT).
FIG.l. Relative response of the three detectors as a function of the mean photon energy.
REFERENCE
[1] Gafchromic® EBT film. http://onlinel.ispcorp.com/_layouts/Gafchromic/index.html
332

IDOS, Vienna, 9-12 November 2010 E2-CN-182, Paper No INV015
Measurement of low level ionization current in a new standard free air 1
chamber derived from a I brachytherapy source
Y. Unnoa, T. Kurosawa3, A. Yunokf, T. Yamadaab, Y. Sato3, Y. Hinoa
aNational Metrology Institute of Japan (NMIJ/AIST) Tsukuba, Japan
b Japan Radioisotope Association Tokyo,Japan
E-mail address of main author: [email protected]
In Japan, the number of 1-125 brachytherapy case is rapidly increasing after they were approved as medical equipment by modification to relevant domestic laws in 2003. Presently, more than 100 hospitals provide the brachytherapy. It means that the demand for 1-125 seed sources grow sharply. These leads that concern for quality assurance in practical clinic is raised up. It is our motivation to establish a primary standard for an 1-125 brachytherapy source.
In NMIJ, we have assembled a new free air chamber in order to measure reference air kerma rate (RAKR) which is defined in ICRU report 72 [1], In order to gather enough ionization current in limited size of free air chamber, a technique which changes separation distance between voltage and collecting electrode have been developed in National Institute of Science and Technology [2], The two electrodes are made from thin aluminized film. They are perpendicular to beam line through an aperture from an 1-125 brachytherapy source. In this technique, the secondary electron equilibrium state are maintained by canceling perturbation around these electrodes by subtracting obtained current at small volume from one at large volume. The collecting area between the two electrodes are surrounded by a cylindrical half voltage electrode. It prevent escaping of ionization charge from the collecting area. We applied this method to our chamber as a primary standard.
Even though the chamber has larger collecting volume than a conventional free air chamber, the ionization current derived from an 1-125 clinical level source (around 0.4 uGy h"1) is very small such as around 40 fA at 182 mm electrode separation distance. It is important to suppress electrical noise and drift less than 1 fA in terms of standard deviation. We applied TR8401 vibrating reed electrometer with charge up mode. The signal cable from collecting electrode is carefully connected as short as possible. The free air chamber were surrounded by an acrylic box in order to prevent wind from air conditioner and other disturbance. They are laid on an iron anti-vibration table. All electrical measurement instruments are powered by an isoration transformer. As shown in Fig. 1, background current at the same distance (signed as "Gross") is around 12 fA at 182 mm separation. It is undesirable that the background drift in almost one day periods because time for measurement of RAKR is half day or more. The amplitude of the drift is 4 fA in terms of peak to peak. It seems to be mainly caused by the natural radioactive gas effect such as radon gas. Fig.2 shows the difference between in cases of ventilated and unvetilated experimental room condition. It declares that the current drift is suppressed effectively by the ventilation. While the experimental room is ventillated full time, the ventilation system of the whole building is automatically shut down in the evening of weekday and all time of weekend. Therefore, the drift remained a little. On the other hand, we applied background measurement before and after pertinent on-beam measurement in order to reject the drift. We presumed that background current is averaged one by before and after pertinent on-beam measurement. We deduce NET ionization current by subtracting the averaged background from pertinent on-beam measurement. By this method, the drift disappeared well as demostraded at "Net" in
333

Fig.l. Furthermore, the standard deviation is 0.9 fA. It satisfies the our criteria (1 £A). We will provide calibration service for 1-125 brachytherapy sources under the no drift and low noise condition.
FIG. 1 Background measurement for a week at 182 mm electrode separation distance (Gross: Raw data, Net: Substracted data)
* o * " V e n t . < >n
Y e i l t O f f » •>
S > <J ' ' % ; >4»*. >
f„ • » , 4<
t'-'V';! S> Q
" V e n t . < >n
Y e i l t O f f
& • • » 1 •>. £
0 f \ v o
c % ° o «« » UM
\ a
» * . ' ' E
c J D
' i t *
0 a
° a v"
c " ° K * .Vref
a V " 5
V ^ * ' i t
a Q J • a
0:00 0:00 0:00
dock time
FIG.2 Suppressed drift by ventilation in the experimental room
REFERENCES
[1] ICRU Report 72 Dosimetry of Beta Rays and Low-Energy Photons for Brachytherapy with Sealed Sources (2004)
[2] STEPHEN M. SELTZER ET AL., New National Air-Kerma-Strength Standards for 1251 and 103 Pd Brachytherapy Seeds, J. Res. Natl. Inst. Stand. Technol. 108, 337-358 (2003)
334

IDOS, Vienna, 9-12 November 2010 E2-CN-182, Paper No INV015
1Q? Source geometry correction factors for HDR Ir brachytherapy
secondary standard well chamber calibrations
T Sander, D Shipley, R Nutbrown, H Palmans, S Duane
National Physical Laboratory, Hampton Road, Teddington, UK
E-mail address of main author: [email protected]
Brachytherapy dosimetry for gamma ray sources is currently based on source calibrations in terms of reference air kerma rate (RAKR) [1] or air kerma strength (AKS) [2|. The National Physical Laboratory (NPL) has commissioned a graphite-walled cavity ionisation chamber and an associated lead collimator as primary standard for high dose rate (HDR) 192Ir [3], This device allows the determination of RAKR of HDR 192Ir brachytherapy sources from first principles and with an overall measurement uncertainty of 0.7% (k = 2). This is an improvement on the measurement uncertainties currently achieved by other standards laboratories which use interpolation techniques to derive 192Ir calibration coefficients for their air kerma standards. With the NPL standard it is possible to calibrate ionisation chambers directly traceable to an air kerma standard using a commercially available 192Ir source.
The HDR 192Ir air kerma primary standard is disseminated to radiotherapy centres via the calibration of suitable secondary standard ionisation chambers, such as well-type ionisation chambers. At present, the primary standard used at NPL has been commissioned for use with only one 192Ir source type, the Nucletron microSelectron v-1 'classic' brachytherapy source. However, there are a number of different afterloaders and source types currently in use in hospitals in the UK. If the 192Ir source type in the hospital is different from that used for the calibration of the well chamber at NPL, a source geometry factor, ksg, is required to correct the calibration coefficient for any change of the well
chamber response due the geometric differences between the sources.
In this work, source geometry correction factors were determined for a number of different HDR 192Ir brachytherapy source types currently in use (such as the Nucletron micro Selection v-2, GammaMed Plus, Varian Varisource and Isodose Control Flexisource) for two types of well-type ionisation chambers and associated source holders.
Models of each source and well chamber were constructed using the C++ usercode cavity that forms part of the EGSnrc code system (release V4-r2-2-5) [4], Source models were validated by calculating radial dose distributions for each source type and confirming that they matched data published in the CLRP TG-43 Parameter database [5]. A series of calculations were then performed at different source dwell positions for each source type and well chamber combination and the source position that gives the maximum chamber response (the 'sweet-spot') was determined. Where possible, these response curves were validated by comparing with similar measured curves. Air kerma rate calculations were also performed for each source type using this code by calculating the air kerma in a small circular region (radius 1 cm) in vacuum at 1 m from the source. The source geometry correction factor, , for
a particular source is then obtained from the ratio of the RAKR at 1 m to the chamber response at the 'sweet-spot' for the source of interest, divided by the same ratio for the NPL source.
Preliminary results indicate that ksg is close to unity for the Nucletron microSelection v-2,
GammaMed Plus and Isodose Control Flexisource source types when used in a Standard Imaging
335

1000+ well-type chamber (with a Model 70010 source holder). This is as expected as the geometries for these sources are quite similar to the Nucletron microSelection v-1 source used at NPL. However, ksg for the Varian Varisource was found to be 0.983 (-1.7%), indicating that the length of active material together with the thinner source encapsulation in this source requires a significant change to the value of the NPL calibration coefficient.
The source geometry correction factor is included in the formalism described in a new UK code of practice (COP) for HDR 192Ir dosimetiy which was written by an IPEM working party [6], Rather than listing the k factors in the COP, the correction factors will be issued as part of the NPL calibration
certificate. Should NPL upgrade or change the source type used for the calibration of secondaiy standards, any new correction factors could easily be incorporated in the new certificate.
REFERENCES
[1] ICRU 1985 Dose and Volume Specification for Reporting Intracavitary Therapy in Gynaecology ICRU Report No 38 (Washington, DC: ICRU).
[2] NATH R, ANDERSON G, LUXTON K A, WEAVER K A, WILLIAMSON J F and MEIGOONI A S. Dosimetry of interstitial brachytherapy sources: Recommendations of the AAPM Radiation Therapy Committee Task Group No. 43. Med. Phys. 22 (1995) 209-234.
[3] SANDER T and NUTBROWN R F. The NPL air kerma primary standard TH100C for high dose rate 192Ir brachytherapy sources. NPL Report DQL-RD 004 (2006).
[4] Kawrakow I and Rogers D W O, The EGSnrc code system: Monte Carlo simulation of Electron and Photon Transport, NRCC Report PIRS-701 (2006).
[5] TAYLOR R E P , ROGERS D W O, An EGSnrc Monte Carlo-calculated database of TG-43 parameters, Med. Phys. 35 (2008) 4228-4241.
[6] Bidmead A M, Aird E G A , Flynn A, Lee C D, Locks S M, Nutbrown R F and Sander T. The IPEM Code of Practice for the determination of the reference air kerma rate for HDR 192Ir brachytherapy sources based on the NPL air kerma standard (in print)
336

IDOS, Vienna, 9-12 November 2010 E2-CN-182, Paper No INV015
1Q1) 3-D distribution measurement of the absorbed dose to water around Ir
brachytherapy source by thermoluminescent dosimeters V. Louren^o, D. Vermesse, D. Cutarella, M. P. Aviles-Lucas, I. Aubineau-Laniece
CEA, LIST, Laboratoire National Henri Becquerel, 91191 Gif-sur-Yvette Cedex, France
E-mail address of main author: valerie. [email protected]
High Dose Rate (HDR) Brachytherapy treats cancer using small encapsulated radioactive sources placed inside or in the close vicinity of the tumor volume. This treatment modality delivers a high dose to the tumor while sparing surrounding healthy tissues.
The LNE-LNHB is involved in the European Joint Research Project T2.J06 "Increasing cancer treatment efficacy using 3D brachytherapy" which aims to reduce the current uncertainty on the dose delivered to the patient from 10 down to 5 % (k=l). A critical issue is the accurate knowledge of the dose distribution at short distances from the source where dose gradients are high. As part of the T2.J06 project, the LNE-LNHB has to evaluate the spatial dose distribution around an HDR 192Ir MicroSelectronV2 source. Small cubic thermoluminescent dosimeters (TLD) of 1 mm side length (FIG. 1), also refered to as "microcubes", were the choice detector for the measurements.
FIG. 1. Microcubes of thermoluminescent dosimeters
The main characteristics of the TLD that were assessed in this work are variability in energy response and the linearity of response with dose and dose-rate. The linearity of the TLD response was studied in the 20 mGy to 1 Gy range. The rate dependance of the dosimeters was estimated within the 5 mGy .If1
to 1 Gy.h"'range. The photon energy variability of the microcubes was evaluated using several X-ray beams with effective energies in the 24 to 209 keV energy range and gamma rays emitted by '' Cs (around 662 keV) and 60Co (around 1250 keV) sources. Results were compared with published data [l].The analysis of results allowed estimate of apropriate factors which are used to correct microcube TLD measurements.
The 3D dose distribution was evaluated placing the 192Ir source at the center of a cubic tank filled with water. The microcubes were positionned between 1 and 10 cm around the source. Monte Carlo calculations were also performed. Finally, measurements and calculations for the FIDR lr source (MicroSelectron V2) were analyzed and compared with published data [2, 3].
337

REFERENCES
[1] NUNN, A. A., DAVIS, S. D„ MICKA, J. A., DeWERD, L. A., "LiF:Mg,Ti TLD response as a function of photon energy for moderately filtered X-ray spectra in the range of 20-250 kVp relative to 60Co " Medical Physics 35, pp. 1859-1869 (2008).
[2] PRADHAN, A. S„ QUAST, U. "In-Phantom response of LiF TLD-100 for dosimetry of 192Ir HDR source" Medical Physics 27, No 5, pp. 1025-9 (2000).
[3] AUSTERLITZ, C„ MOTA, H. C„ SEMPAU, J., BENABIB, S. M„ CAMPOS, D„ ALLISON, R., De ALMEIDA, C, E., ZHU, D., SIBATA, C, II., "Determination of absorbed dose in water at the reference point D(r0,90) for an 192Ir HDR brachytherapy source using a Fricke system" Medical Physics 35, No 12, pp. 5360-5 (2008).
338

IDOS, Vienna, 9-12 November 2010 E2-CN-182, Paper No INV015
Characterization of a parallel plate ionization chamber for the quality control of clinical applicators
P. L. Antonio, L. V. E. Caldas
Institute de Pesquisas Energeticas e Nucleares (IPEN-CNEN/SP), Sao Paulo, Brazil
E-mail address of main author: [email protected]
In this work, a parallel plate ionization chamber, developed at the Calibration Laboratory of IPEN (LCI), was utilized with the objective to verify the possibility of its application in the quality control program of 9,!Sr+"'Y clinical applicators at clinics and hospitals that perform brachytherapy procedures. A characterization of this ionization chamber was realized and a methodology for this practice at clinics and hospitals of brachytherapy was developed.
The parallel plate ionization chamber [1] was projected for utilization in high energy electron beam dosimetry. It was constructed in acrylic and cylindrical form, with an entrance window in aluminized Mylar and collecting electrode of graphite.
The calibration of clinical applicators is recommended by protocols of calibration and dosimetry of sources used in brachytherapy [2,3]. The extrapolation chambers are the most adequate instruments for the determination of the absorbed dose rates of these sources. Some extrapolation chambers were developed at the LCI [4,5], to calibrate dermatological (plane) and ophthalmic (curve) applicators of beta radiation. However, due to the complexity in their construction and use, they are not indicated for use in the clinics and hospitals where '°Sr+90Y clinical applicators are utilized, but at calibration laboratories. For the calibration of clinical applicators at the clinics radiotherapy, one recommended method is the use of thermoluminescent dosimeters.
At the clinics, three main tests would be recommended as a quality control program for clinical applicators, using a parallel plate ionization chamber (home-made or commercial): leakage current and repetitivity (for the ionization chamber) and measurements of the clinical applicator radiation beam, positioned at, for instance, 3 different short distances from the chamber. An extrapolation of its response to null distance will allow the determination of the absorbed dose rate at its surface, using a calibration factor previously provided for the ionization chamber at a calibration laboratory. In this work, a special simple holder for this procedure was also developed.
The characteristics of the parallel plate ionization chamber with graphite collecting electrode were studied. The measurements in this work were taken utilizing an electrometer PTW, model UNIDOS E. Initially, the leakage current and chamber response reproducibility were verified (Fig.la). The leakage currents measured before each irradiation were always less than 0.02%. The maximum variation of the response chamber obtained in the repetitivity test was less than 0.03%, and in the reproducibility test, it was less than 0.5%. The chamber response linearity was studied, in relation to the collected charge in function of the irradiation time (Fig lb). Linearity behaviour can be observed, with a correlation factor of 1.00. For these measurements, a control source of 90Sr+90Y (33 MBq, 1994), PTW, model 8921, was utilized. The null distance between source and entrance window was utilized to simulate a brachytherapy procedure.
Measurements were also taken using a 90Sr+90Y clinical applicator, calibrated at the primary standard laboratory of the National Institute for Standards and Technology, USA, called NIST applicator in this work.
339
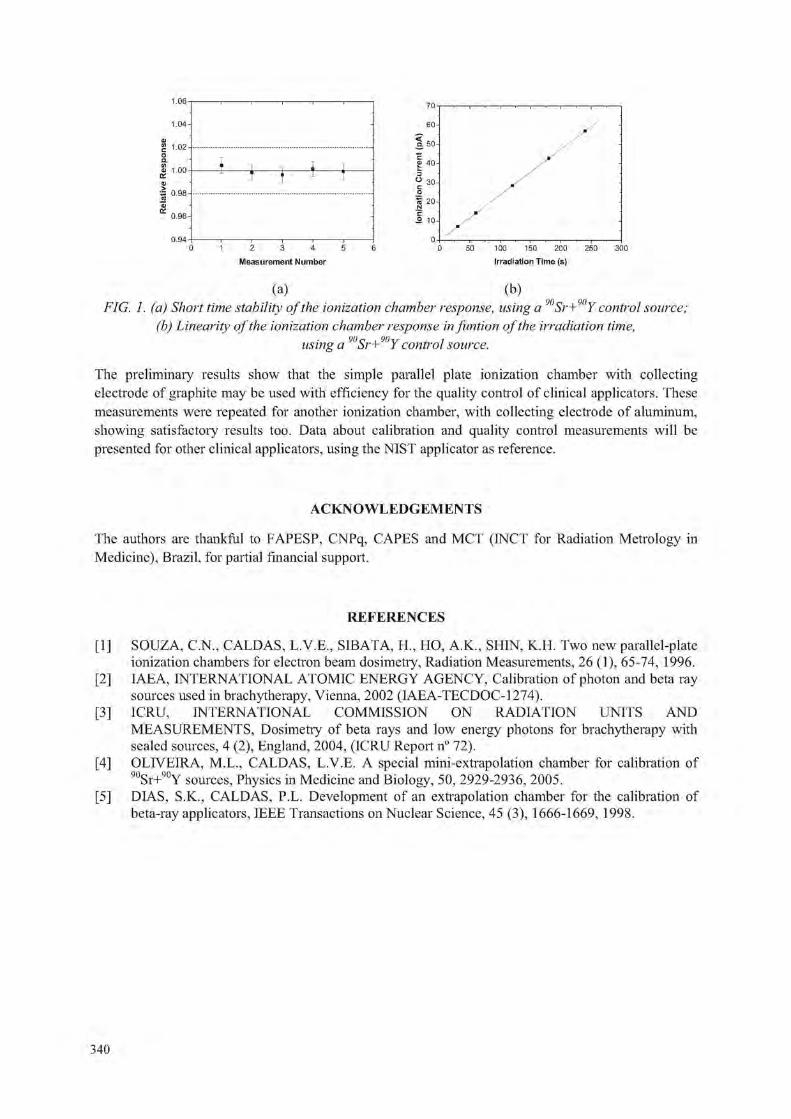
1.06
1.04-
1.02
0.96-
0.94
1 1 M
2 3 4 5 6
Measurement Number
50 100 150 200 250
Irradiation Time (s)
(a) (b) FIG. 1. (a) Short time stability of the ionization chamber response, using a Sr+ Y control source;
(b) Linearity of the ionization chamber response in funtion of the irradiation time, using a ' Sr+ Y control source.
The preliminary results show that the simple parallel plate ionization chamber with collecting electrode of graphite may be used with efficiency for the quality control of clinical applicators. These measurements were repeated for another ionization chamber, with collecting electrode of aluminum, showing satisfactory results too. Data about calibration and quality control measurements will be presented for other clinical applicators, using the NIST applicator as reference.
ACKNOWLEDGEMENTS
The authors are thankful to FAPESP, CNPq, CAPES and MCT (INCT for Radiation Metrology in Medicine), Brazil, for partial financial support.
REFERENCES
[1] SOUZA, C.N., CALDAS, L.V.E., SIBATA, H„ HO, A.K., SHIN, K.H. Two new parallel-plate ionization chambers for electron beam dosimetry, Radiation Measurements, 26 (1), 65-74, 1996.
[2] IAEA, INTERNATIONAL ATOMIC ENERGY AGENCY, Calibration of photon and beta ray sources used in brachytherapy, Vienna, 2002 (IAEA-TECDOC-1274).
[3] ICRU, INTERNATIONAL COMMISSION ON RADIATION UNITS AND MEASUREMENTS, Dosimetry of beta rays and low energy photons for brachytherapy with sealed sources, 4 (2), England, 2004, (ICRU Report n° 72).
[4] OLIVEIRA, M.L., CALDAS, L.V.E. A special mini-extrapolation chamber for calibration of 90Sr+90Y S 0 u r c e S ! Physics in Medicine and Biology, 50, 2929-2936, 2005.
[5] DIAS, S.K., CALDAS, P.L. Development of an extrapolation chamber for the calibration of beta-ray applicators, IEEE Transactions on Nuclear Science, 45 (3), 1666-1669, 1998.
340
IDOS, Vienna, 9-12 November 2010 E2-CN-182, Paper No INV015
The first experience of implementation of HDR afterloader with 60Co source into clinical practice at National Cancer Institute
Pidlubna T., Galias O., Magdych I.
National Cancer Institute, Kyiv, Ukraine
E-mail address of main author: [email protected]
A new afterloading HDR treatment machine, with a Co-60 source, was installed in the Brachytherapy Department of the National Cancer Institute, Ukraine, in 2009. The equipment was obtained in the framework of IAEA Project UKR/6/007 "Upgrade Brachytherapy Services to Oncological Patients in Ukraine", The 5-channel afterloader GyneSource (Eckert & Ziegler Bebig) was installed with the two-dimensional treatment planning system HDR Plus and a C-arm X-ray machine (Toshiba BV, Libra).
The source nominal activity is 75,11 GBq (2,03 Ci), and has an active length of 3.5 mm, and an external diameter of 1.0 mm. An afterloading calibration phantom Type 9193, Farmer chamber W30001-2112 and Unidos E (PTW Freiburg) were used for dosimetiy calibration of the source [1].
Acceptance tests of equipment were carried out. Quality control tests of afterloader safety systems including the emergency stop, room monitor, door interlock, warning light, communication equipment were implemented before clinical commissioning [2]. The afterloading system provides for its calibration test, dummy and source position visual test.
Images for treatment planning must be made using the Reconstruction box isocentric technique by C-arm X-ray machine transfer to the TPS in DICOM format. The HDR Plus treatment planning system allows calibration X-ray images, selection and identification of applicators, determination of control and normalization points, position of the dwell positions, dose optimization, dose distribution display and 3-D views.
The GyneSource HDR afterloader with a Co-60 source is used for gynecological patient treatments at the national cancer institute. Typically brachytherapy treatments are done in conjunction with external beam therapy for these patients. Brachytherapy single dose per fraction is 5-7 Gy, while the total dose is 28-35 Gy [3] delivered in 4-5 fractions.
REFERENCES
[1] User Manual - Afterloading Calibration Phantom Type 9193, PTW D402.131.0/2. [2] ESTRO. ESTRO booklet #8, A practical guide to quality control of brachytherapy equipment.
Edited by J. Venselaar, J. Perez-Calatayud,, 2004. [3] ESTRO. The GEC ESTRO Handbook of Brachytherapy. 2002.
341

IDOS, Vienna, 9-12 November 2010 E2-CN-182, Paper No INV015
Gel dosimetry for HDR Brachytherapy 3-D distribution through MRI
G. Batista Hernandez8, G. Velez1', C. Schiirrerc
a Instituto Oncologico Nacional (ION), Panama.
b Hospital Oncologico Urrutia, Cordoba, Argentine. c FaMAF, Universidad Nacional de Cordoba, Cordoba, Argentine
E-mail address of main author: [email protected] , [email protected]
Gel dosimetry using MRI is increasingly being utilized in contemporary literature. In our work we investigated the calibration of an acrilic gel by means of imaging with magnetic resonance and its aplication to the dose measurement in a 3D distribution 192Ir HDR brachytherapy treatment.
Early gel dosimetry used Fricke gels and Ti relaxation time. In 2001 Fong et al. [1] introduced a new normoxic gel known as "MAGIC" gel, the main components of which are Metacrylic Acid (polymer) and Hidroquinone ( polymerizing inhibitor). For this material, the evidence of radiation dose is indicated by a change in the T2 relaxation time on an MR image. Later studies varied concentrations of the MAGIC gel components in order to observe its effect and the behavior of the gel sensitivity, for magnetic fields over 0.5 T. In the 1980s a series of studies on dose quantification using magnetic resonance images and Fricke gels were perfomed by evaluating Ti signal through means of an Inversion Recovery technique.
Polymer gels have been developed to avoid the adverse effects of oxygen that plague Fricke gels. Normoxic gels have a component which helps to capture the oxygen dissolved in the gel (MAGIC). For these type of gels, measurements of T2 are made using a Spin-Echo technique. For both groups of gels, the Relaxativity compared to either Tj or T2 varies linearly with the absorbed dose. Novotny et al. [2] has obtained a dose response curve for BANG-2 gel showing a linear relationship of 1/T2 vs D[Gy]. In the work presented here we tested and found the same linear relation between spin-spin relaxation (R: 1/T2) versus dose up to 8.0Gy.
The MAGIC gel was prepared following the composition suggested by Crescenti et al.[3] (6% Metacrylic Acid). The irradiation for calibration purposes was performed in a 6 Co teletherapy machine TERADI 800 2c (INVAP S.E.). The corresponding images were obtained with a Siemens Magnetom Concerto, 0.2T. Special containers were designed for the gel: PVC cylinders, 3cm diameter and 3 cm heigh. These cylinders were inserted in a home-made phantom built for calibration purpose, consisting in a PMMA slab 20cm x 20cm x 3 cm with a hole for the PVC cylinders and a second slab 0.3cm thikness on the top. After evaluating the variation in the tissue-air ratio (TAR) over 6mm (+/-3mm) around 2 cm depth, the selected reference depth for the calibration curve was 2cm. Thus, the variation in dosis within a 4mm voxel was less than 1% at such depth. A special phantom was also designed to perform the measurements at the MR machine, consisting in a cylindric geometry holder, 15cm diameter which allows the fixation of 2 sets ,with 7 samples each. Consequently, it was possible to obtain a calibration curve with 14 points in one reading.
To measure the dose distribution in brachytherapy we built two similar phantoms, one with PMMA and the other with PVC. The irradiation of both were done with an HDR MicroS electron HDR V2 unit (NUCLETRON) and the corresponding images obtained were analysed and compared against the dose distribution planned from PLATO Sunrise TPS. The planning volume was designed in order to obtain a pear-shaped volume, similar to gynecologic treatment.
343

The calibration curve obtained, valid for doses ranging from 0 to 8Gy and using a 0.2T MR1 equipment, were in good agreement with the literature, A chemical reaction of the MAGIC gel with the PMMA was observed, polymerizing close to the container walls previous to irradiation. On the other hand, the PVC phantom did not show any reaction. The dose measurement on the specified points selected on the PLATO Sunrise TPS were compared with those obtained from MathLab analysis of MRI. Matrix of dose distributions were drawn for axial and sagital planes. The discrepancies obtained were on average 6.75% of values provided by the TPS, which is under tolerance for brachytherapy requirements.
Bseab1:1,0cm
FIG. 1: Sagital dose distribution, colour scale, MathLab analysis + PLATO dose distribution.
REFERENCES
[1] FONG, P. et al., Polymer gels for magnetic resonance imaging of radiation dose distributions at normal room atmosphere, Phys. in Med. & Biol. 46 (2001) 3105-3113.
[2] NOVOTNY, J,, et al., Three-dimensional polymer gel dosimetiy: basic physical properties of the dosimeter. Radiation Physics and Chemistry 61 (2001) 255-258.
[3] CRESCENTI, R., et al., Introducing gel dosimetry in a clinical environment: Customizacion of polymer gel composition and magnetic resonance imaging parameters used for 3D dose verifications in radiosurgery and intensity modulated radiotherapy, Medical Physics 34 (4) (2007) 1286- 1297.
344

Posters relating to Clinical Dosimetry in X ray Imaging

IDOS, Vienna, 9-12 November 2010 E2-CN-182, Paper No INV015
Detecting small lesions with low dose in head CT: A phantom study
M. Perez.a, A,E. Carvalho-Filho.\ H.J. Khoury.b , M.C. Casas.a, M.E Andrade.b, J.E Paz.a
a Centro de Estudios de Electronica y Tecnologias de la Information. Universidad Central de las Villas. bDpto, Energia Nuclear. Universidad Federal de Pernambuco. Recife. PE. Brazil
E-mail address of main author: [email protected]
The implementation of good acquisition/reconstruction protocols is important today, looking for an adequate relationship between image quality and dose to the patient, especially for pediatric studies. Some steps have been given towards this goal [1-4].
Thirteen axial head CT scans were acquired employing the anthropomorphic phantom OPRAMedical 2008 and using a PHILIPS Brilliance 6 scanner. The phantom contains small structures in posterior fosse which simulate tumors. The acquisition parameters were: kVp = 120, rotation effective time=1.167 seg and a Field of View = 250 mm. Tube current were varied among tomographies taking following values: 100, 150, 200, 250, 300 and 350 mA per sec. Acquisitions under collimations of 6 slices x 1.5 mm and 6 slices x 0.75 mm were done for each value of mAs. A ionization chamber PTW, model TW 30009, was used for dosimetric measurements. Air kerma was measured using the same acquisition combinations than for the phantom experiment and CT air kerma index (Ca . ioo) was calculated.
Slices corresponding to posterior fosse were used for all the tomographies to analyze image quality. They were shown to an expert observer who rated images into Excellent, Good, Regular or Poor image quality. Four objective quality metrics were also calculated for the same purpose and using Regions of Interest in posterior fosse of size 30 x 30 pixels. Two of these metrics were calculated globally: contrast to noise ratio (RCR [dB]) and signal to noise ratio (RSR) while the other two, were relative to the maximum dose condition (350 mAs and 6 x 1.50 mm collimation). The relative measures were the gain in signal to noise ratio (SNR [dB]) and the peak signal to noise ratio (PSNR [dB]).
PSNR [dB] and SNR [dB] show a linear increment with mAs although the gain of these metrics between 250 and 350 mAs is just of 0.006 dB for PSNR and 0.4 dB for SNR. The global signal to noise ratio (RSR) show a tendency fitted to second order polynomials for both collimations. The studies made with collimation 6x0.75 mm do not allow lesion detectability under 250 mAs. The gain in spatial resolution with this width was not enough to compensate image quality deterioration produced by the noise increment respect to 6 x 1.5 mm.
Analyzing the image quality and dosimetric measures in this experiment we noted that at time that dose is incremented for a factor of 4, image quality only has an increment factor of 2.
The behavior of the dose was also closely related to collimation. The values of C a , i oo[mGy] for collimation 6 x 0.75 mm showed a minimum value of 38.62 mGy, a maximum of 89.10 mGy and a mean value of 64.58 ±20.18 mGy, while for collimation of 6 x 1.50 mm C a , i oo [mGy] had a minimum
347

of 32.17 mGy, a maximum of 75.33 mGy and a mean value of 52.83 ± 16.96 mGy, for the same values of mAs.
The above results using a phantom suggest that less than 350 mAs are enough for obtaining good image quality in posterior fosse images for the correct detectability of lesions whose image patron was similar to one described with this phantom and the use of similar CT technologies and acquisition conditions. Nevertheless, real clinical data should justify this choice based on the optimization framework.
The use of the protocol proposed has permitted an air kerma reduction from the usual 89.10 mGy imparted in the hospital monitored using the acquisition reference condition of 350 mAs, 120 kVp and 6 x 1.5 mm collimation to 51.34 mGy with this optimized protocol.
FIG. 1. Image with low no ise and good lesion detectability in posterior fosse.
REFERENCES
[1] MILLER R.C., PEREZ M., MORA Y. Modelo predictivo de Ruido y Dosis: una aproximacion para aplicaciones pediatricas en Tomografia Computarizada. IEAC XXVIII (1): 33-7; 2007
[2] MC COLLOUGCi., BRUSEWITZ VI.. KOFLER J. CT Dose reduction and dose Management tools: Oveiview of available Options. Radiographics 26: 503-12; 2006
[3] HUDA W„ CHAMBERLAIN C„ ROSEMBAUM A. Radiation doses to infants and adults undergoin head CT examinations. Med Phys 28: 343-9; 2001
[4] PAGES J., BULS N„ OSTEAUX M. CT doses in children: A multicentre study. Br J of Radiology 73: 803-11; 2003.
348

IDOS, Vienna, 9-12 November 2010 E2-CN-182, Paper No INV015
Dose assesment in interventional radiological procedures in children with gafchromic films: Results of IAEA Project RAS/9/055.TSA3
A. Zamana, M. Alib, A. Ahmed0, M. Zamand
a Institute of nuclear medicine and oncology lahore
b Pakistan nuclear regulatory authority Islamabad
c
Pakistan institute of cardiology (PIC)
Lahore Medical And dental college E-mail address of main author: areeshazaman@hotmail .com
Interventional radiology is a rapidly growing area of medicine in Pakistan. Fluoroscopically guided techniques are being used by an increasing number of clinicians and technicians not adequately trained in radiation safety or radiation biology. Interventional procedures in children are generally performed in children hospitals. No data is available related to radiation doses and skin injuries in adults/children during different IR procedures where fluoro time is very high . To determine peak skin dose (PSD) a measure of the likelihood of radiation induced skin effects for a variety of common interventional radiology (IR) and IC procedures, and to identify procedures associated with a PSD greater than 2 Gy, IAEA project "Strengthening Radiological Protection of Patients and Medical exposure Control RAS/9/047"started in 2005(new no RAS/9/055). 10 hospitals in big cities where interventional procedures especially in children are performed included in the project to evaluate the radiation protection conditions. The study conducted over a period of 5 years.
Following conditions from radiation protection viewpoint are determined. Numbers of Procedures on same patient, skin doses to patients, number of patients suffering with radiation induced skin injuries and in young patients increased risk of future cancer.For the measurements of peak skin doses 180 patients are included in the project age range 1-20 years who underwent diagnostic or therapeutic interventional procedures, e.g.TCA, cardioangiography, angioplasty, stentplacement, needlebiopsy, embolization, gasrtromy (feeding tube) , genitourinary and biliary interventions with fluoro time 2-60 minutes and for which the highest peak skin dose values were expected .
To estimate the peak skin doses during fluoroscopically guided procedures, Dosimetiy films (Gafchromic films, EDR2 films) are used dose evaluation is done with semi quantative method (evaluation with comparision tablet provided with film lot number )and quantative measurements (with spot densitometer ). Equipment parameters (dose area product, total air karma) are also monitor to estimate the skin doses. Optimization of operational and technical parameters is achieved with the proper selections of filters and acquisition mode.The mean DAP values are reduced for patients who under went cardiac cahterisation and cardiac angioplasty procedures with the optimization of exposure parameter and with the use of appropriate copper filter.
For the measurements of doses in repeated procedures on the same patient, intensive follow up is carried out. Eight patients had repeated IR procedures. After first intervention procedures patients are followed up. Three patients have three repeated IR procedures and five patients have two repeated IR procedures.
Interventional procedures are increasing in Pakistan not only in adult but also in pediatric patients radiation protection conditions are better with respect to use of personnel monitoring badges, use of lead glass eye wears is 70%. Use of lead apron is 100%. There is KAP availability in 50%cath lab but
349
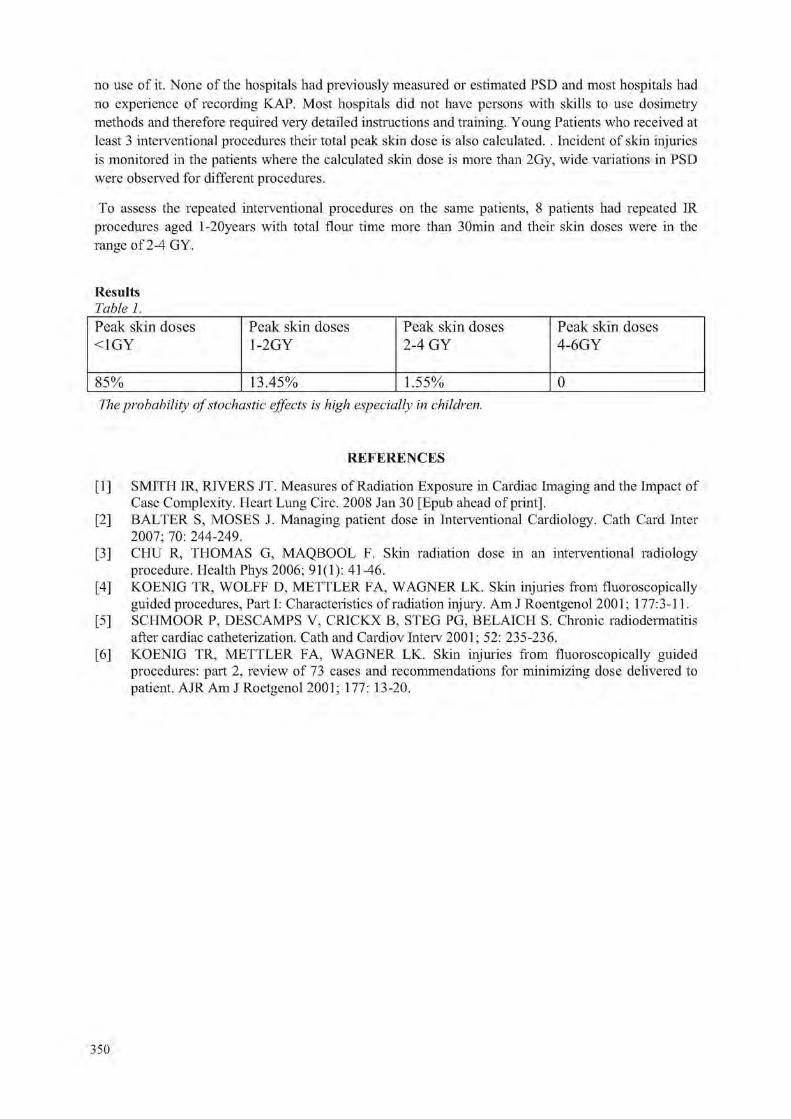
no use of it. None of the hospitals had previously measured or estimated PSD and most hospitals had no experience of recording KAP. Most hospitals did not have persons with skills to use dosimetry methods and therefore required very detailed instructions and training. Young Patients who received at least 3 interventional procedures their total peak skin dose is also calculated. . Incident of skin injuries is monitored in the patients where the calculated skin dose is more than 2Gy, wide variations in PSD were observed for different procedures.
To assess the repeated interventional procedures on the same patients, 8 patients had repeated IR procedures aged l-20years with total flour time more than 30min and their skin doses were in the range of 2-4 GY.
Results Table 1. Peak skin doses <1GY
Peak skin doses 1-2GY
Peak skin doses 2-4 GY
Peak skin doses 4-6GY
85% 13.45% 1.55% 0 The probability of stochastic effects is high especially in children.
REFERENCES
[1] SMITH IR, RIVERS JT. Measures of Radiation Exposure in Cardiac Imaging and the Impact of Case Complexity. Heart Lung Circ. 2008 Jan 30 [Epub ahead of print],
[2] BALTER S, MOSES J. Managing patient dose in Interventional Cardiology. Cath Card Inter 2007; 70: 244-249.
[3] CHU R, THOMAS G, MAQBOOL F. Skin radiation dose in an interventional radiology procedure. Health Phys 2006; 91(1): 41-46.
[4] KOENIG TR, WOLFF D, METTLER FA, WAGNER LK. Skin injuries from fluoroscopically guided procedures, Part I: Characteristics of radiation injury. Am J Roentgenol 2001; 177:3-11.
[5] SCHMOOR P, DESCAMPS V, CRICKX B, STEG PG, BELAICH S. Chronic radiodermatitis after cardiac catheterization. Cath and Cardiov Interv 2001; 52: 235-236.
[6] KOENIG TR, METTLER FA, WAGNER LK. Skin injuries from fluoroscopically guided procedures: part 2, review of 73 cases and recommendations for minimizing dose delivered to patient. AJR Am J Roetgenol 2001; 177: 13-20.
350

IDOS, Vienna, 9-12 November 2010 E2-CN-182, Paper No INV015
Mammography reference field in Japan
T. Tanaka3, T. Kurosawa3, R. Nouda3, T. Matsumoto3, N. Saito3, S. Matsumotob, K. Fukudab
National Institute of Advanced Industrial Science and Technology (AIST), NMIJ b
Chiyoda Technol Corporation
E-mail address of main author :[email protected]
Ionizing Radiation Section in NMIJ/AIST provides the X-ray, y-ray, and P-ray standards in Japan as a primary NMI. We have developed air kerma standards for mammography radiation with a molybdenum (Mo) anode X-ray tube and Mo filters. We started the dissemination of this standard in March 2009. In this symposium, we report about the mammography reference field and the evaluation of a glass dosemeter specially desigined for mammography X-ray radiation.
A schematic of the mammography calibration system is given in Figure 1. The mammography reference field consists of a Mo anode X-ray tube, a Mo filter and a free-air ionization chamber. The X-ray source is a Gulmay generator and RTW Mo anode X-ray tube. The in-herent filtration is 1 mm beryllium. IEC 61267 [1] revised in 2005 has recommended that the thickness of additional Mo filter is 32 (im. Therefore, we use the two thickness of Mo filters of 30 fim and 32 urn.
Additional filter (30 or 32 pi m Mo)
1st beam aperture —1> 2nd: beam aperture
I /
Align men f laser Free-air ionization chamber
/ Mo anode |_ X-rav tube
Lead and iron bousing
Shutter G A
X-ray beam center line
/ Alignment laser
X-Y stage Reference plane Chamber to be calibrated
FIG. 1. A schematic for the mammography calibration system (not to scale). In addition to a Mo filter, we also insert a compression paddle (3 mm thick polycarbonate) to evaluate its effect on radiation quality. The calibration distance, the distance between X-ray source and the reference plane, is 60 cm. The reference plane of the free-air ionization chamber is set at the fixed position using the laser light beams.
To disseminate the air kerma standards for mammography, we have evaluated a glass dosemeter used for quality control of mammography in hospitals. Figure 2 shows the overview of a glass dosemeter for mammography radiation.
351

FIG. 2. Picture of a glass dosemeter for mammography radiation: glass (left) and case (right)
This glass dosemeter is specially designed to measure mammography X-rays. The glass dosemeter consists of photoluminescent glass and four aluminum (Al) filters with different thicknesses. A photoluminescent glass is a silver-activated phosphate glass which has the advantage of low pre-dose and the long-term stability. The thickness of Al filters are 0.3, 0.4, 0.6 and 1.0 mm and the purity is above 99.9 %. The glass dosemeter measures the air kerma and attenuation curve, simultaneously. Tube voltage and half value layer (HVL) are estimated from the attenuation curve. According to the Japanese protocol for mammography quality control, mean glandular dose (MGD) is estimated from a set of air kerma, tube voltage and HVL. Therefore, this glass dosemeter provides air kerma, tube voltage, HVL and MGD.
We have evaluated the glass dosemeter in the mammography reference field. The radiation qualities used in this evaluation are 24, 26, 28, 30, 32 kV with a Mo filter of 30 (tm. The field size is set to be 240 mm x 180 mm. For these radiation qualities, we have evaluated air kerma, tube voltage and HVL using glass dosemeters. Consequently, we have confirmed that the glass dosemeter can measure air kerma, tube voltage and HVL within thier uncertainty of a few percent.
REFERENCE
[1] IEC 61267 Medical diagnostic X-ray equipment-Radiation conditions for use in the determination of characteristics.
352

IDOS, Vienna, 9-12 November 2010 E2-CN-182, Paper No INV015
Estimation of entrance surface doses (ESDs) for common medical X ray diagnostic examinations in radiological departments in Mashhad, Islamic
Republic of Iran 1 2 S.Esmaili ,M.T.Bahreyni Toossi
1 Academic Member in Azad University of SANANDAJ - Branch.
2 Prof, of medical physics MUMS
Background
The British national radiological protection board (NRPB) introduced the use of diagnostic reference levels (DRLs) as an efficient standard for optimizing the radiation protection of patients. The physical parameter recommended for monitoring the (DRLs) in conventional radiography is the entrance skin dose (ESD) and methods for measuring it is clearly described in NRPB standard protocol.
Method:
The data were collected for 1183 radiographs of adult patients. The sample of patients was chosen so that the weight of patients was between 50-80 kg. Eight conventional X-ray examinations were chosen for this study. Entrance surface dose (ESD) of individual patient was directly measured by thermoluminiscence dosimeter, TLD chips sealed in a plastic sachet were stuck on the skin of patient at the center of X-ray beam axis.
Results
In this study, 3rd quartiles of measured ESDs for patients undertaking a particular examination were selected as ESD for study sample, based on this assumption ESDs for X-ray examination included in this study are as follows: Chest PA- 0.37 mGy, Chest Lat- 1.8 mGy, Lumbar Spine AP- 3.6 mGy, Lumbar Spine Lat- 5.6 mGy, Pelvis AP- 3.5 mGy, Abdomen AP- 3.7 mGy, Skull PA- 2.96 and Skull Lat- 1.79 mGy.
Conclusion
The data were analysed statistically, and the minimum, median, mean, maximum, first and third quartile values of ESDs are reported. Finally, our results were compared with the proposed Iranian DRLs, the international reference dose values reported by the European Commission, the International Atomic Energy Agency and the National Radiological Protection Board. It is evident that ESDs obtained in this work for Abdomen AP, Pelvis AP, Lumbar AP and Lumbar Lat examination do not exceed DRLs values worked out by NPRB. On the contrary for Chest PA, Chest Lat, Skull PA and Skull Lat higher ESDs were acquired in this study compared with DRLs suggested by NRPB.there is no single reason for dose variations ,but,the reasons are complex,in general,low filtration, high mAs and low tube potential are associated with higher doses arising from application of various X-ray machines.
353


IDOS, Vienna, 9-12 November 2010 E2-CN-182, Paper No INV015
Patient dosimetry in conventional X ray examinations of children
M.A.S. Lacerda3, T.A. da Silvaa, H.J. Khouryb
a Development Centre of Nuclear Technology - Brazilian Commission of Nuclear Energy (CDTN/CNEN), Belo Horizonte, Brazil
bNuclear Energy Department - Federal University of Pernambuco (DEN/UFPE) -Recife, Brazil
E-mail address of main author :[email protected]
Air-kerma-area product (PKA), Organ Doses and Effective Doses were evaluated in a public pediatric hospital in Belo Horizonte, Brazil. Patient data (age, sex, weight and height) and x-ray exposure parameters (kV, mA.s, time, focus to patient surface distance and X-ray field size) were colected in the most frequent examinations. Pka was estimated by indirect method [1] and organ doses by using PCXMC software [2]. X-ray tube output measurements were done with a RADCAL/MDH 10X5-6 ionisation chamber traceable to a secondary national standard laboratory. The machines utilised by the hospital were 2 monophase full-wave rectified x-ray equipments: one for young children (without antiscatter grid) and another for older children (with antiscatter grid). Tab. 1 presents the sample size (N) and the mean kV, mA.s and PKA with the standard deviation (SD), for the most frequent examinations. Fig. 1 presents the average values of the Organ Doses and Effective Doses for chest AP/PA/LAT examinations.
TABLE. 1. MEAN EXPOSURE PARAMETERS (KV, MAS) AND Pka WITH THE STANDARD DEVIATION (SD) FOR THE MOST FREQUENT EXAMINATIONS.
N kV mA.s Pka (cGy.cm2)
SD (cGy.cm2)
Chest AP 0 a 1 20 50.1 5.2 2.42 0.73 1 a. 5 36 51.3 5.1 1.88 0.51 5 a 10 8 52.6 5.3 2.92 0.43
Chest LAT 0 a 1 20 59.2 5.4 2.42 0.73 1 a 5 36 60.4 5.3 3.47 1.04 5 a 10 8 62.6 5.3 5.43 0.77
Chest PA* 5 a 10 5 59.2 14.0 8.64 3.61 Chest LAT* 5 a 10 5 68.4 15.0 13.86 6.48 Paranasal Sinuses
Caldwell view 1 a 5 5 65.6 34.2 4.10 1.04 5 a 10 10 59.9 47.9 4.90 0.81 10 a 16 5 59.0 52.8 5.27 0.46
Waters view 1 a 5 5 68.0 34.2 4.61 1.43 5 a 10 10 62.6 47.9 5.45 0.76 10a 16 5 61.6 52.8 5.88 0.12
Examinations performed with antiscatter grid.
355

90
8 0 -
70 -
eo 50 -
40 -
30
2 0 -
10
0 ll n A
• Chest AP - 0-1
• Ches tAP- 1-5
• Chest A P - 5-10
• Ches tPA- 5-10- grid
J J ^ ^ a ) •V ov"
Organ
£
J #
50 -J „
40 -=2 40 -- /
30 -s Q 20 -
• Chest L A T - 0 - 1
• Chest LAT- 1-5
• Chest L A T - 5 - 1 0
• Chest L A T - 5 - 1 0 - gr i i
Organ
<r / f S
FIG. 1. Mean organ doses and effective doses in chest AP/PA/LAT examinations.
Table 1 shows the increment in the PK.\ due to the use of grids in children with ages between 5 and 10 years old. The use of low kV and high mAs techniques in the examinations contributes to increases the doses to patients. In examinations of paranasal sinuses the mean values of Pka varied between 4 and 6 cGy.cm2 and the increase of the Pka with the age was relatively low. Fig. 1 shows that the most exposed organs were: the lungs, stomach, thyreoid, oesophagus and breasts. For the thyreoid, the high doses are explained by the poor collimation of the x-ray field. We can conclude that the radiological procedures must be optimized in order to reduce the doses to patients of the hospital studied.
REFERENCES
[1] LACERDA, M.A.S., DA SILVA, T.A., KHOURY, H.J. Assessment of dosimetric quantities for patients undergoing X-ray examinations in a large public hospital in Brazil - a preliminary study. Radiation Protection Dosimetry, vol. 132 (2008) 73-79.
[2] TAPIOVAARA, M., SIISKONEN, T. A PC based Monte Carlo program for calculating patient doses in medical x-ray examinations. Report STUK A139, second edn (Helsinki: Finish Centre for Radiation and Nuclear Safety) (2008).
356

IDOS, Vienna, 9-12 November 2010 E2-CN-182, Paper No INV015
Variation of radiation doses from CT pediatric procedures in large medical centers in Riyadh, Saudi Arabia
A.N. Al-Haj
King Faisal Specialist Hospital & Research Centre, Riyadh, Saudi Arabia
E-mail address of main author: [email protected]
Radiation doses to pediatric patients from CT procedures were investigated for three (3) large medical centers in Riyadh, Saudi Arabia. The medical centers have different CT multislice and spiral CT systems. The doses were evaluted in terms of the weighted CT dose index (CTDiw) , dose length product (DLP) and effective dose for risk assessment. The chest and abdomen-pelvis procedures were selected for dose estimation because of the high workload.
Pediatric patients from neonate to less than 15 years old were included in the study. The pediatric patients were grouped into ages 0 (neonates), 1, 5 and 10 years old. The weight and height were taken from theNational Study of Growth Monitoring of 0-5 Years Saudi Children and from patient records. The equivalent cylindrical diameter (ECD) was determined to estimate the patient diameter. The estimation of ECD uses the relationship ECD = 2 [ weight/ 7t( height]]0 [1],
The scan protocols have about 7 models for different weight groups. The scan parameters for the commonly used model was selected for each CT system. The data on peak kilovoltage, mA, rotation time, slice thickness, pitch and total scan time were retrieved.
The CTDIW and the DLP of each unit were determined using the quality control test data. The CTDIW
and DLP values were compared with the values displayed on the monitor. The variation of the CTDIW
and DLP values for the different CT system was evaluated.
The effective doses due to CT were estimated using the IMPACT dose calculator and the mean was determined for each age group. Preliminary results show that mean effective dose of the 1 year old age group is about 7% higher that the mean effective dose for 0 age group. The effective dose for the females do not significantly vary from the males for age gropu 0 but for age group 1, the effective doses of the males differ by about 12%. This is due to the difference in the weight. Comparing the effective dose delivered by the different systems, the variation would be about 15 to 30%. The difference in the effective doses for chest between CT systems can differ by about 7% (Figure]) and for abdomen-pelvis by about 20% [2].
The Pearson correlation coefficient between effective dose and ECD was detemined and evaluated. The peak kilovoltages vary with weight and improve image quality [3].
The study is aimed to provide a data base for the CTDIW and DLP variations for the different age groups of pediatric patients using different CT systems that can be used for dose optimization [4], It is also aimed to investigate strategies for reducing pediatric doses which include scan parameters, CTDIW
and DLP values.
357

FIG.l. Average effective dose(mSv) for chest and abdomen-pelvis for two different CT systems in one medical center.
REFERENCES
[1] HART, D, WALL, BF, SHRIMPTON, PC, BUNGAY, DR , DANCE, DR, Reference doses and patient size in paediatric radiology, National Radiological Protection Board (2000), pp. 2-3.
[2] AL-HAJ, AN, Lobriguito, AM, Variation in Radiation Doses in pediatric CT procedures, Int, J. Sci. Res. Vol. 6 (2000).
[3] HUDA, W, SCALZETTI, M, LEVIN, G, Technique factors and inage quality as functions pf patient weight at abdominal CT, Radiology (2000) 217, pp. 450-435.
[4] MYHOGORA, WE, AHMED, NA, et al, Paediatric CT examinations in 19 developing countries: Frequency and radiation dose, Rad. Protect. Dosim (2010), pp. 1-10
358

IDOS, Vienna, 9-12 November 2010 E2-CN-182, Paper No INV015
Risk/benefit ratio of the breast screening program in Tuscany (Italy) for the years 2004-2008
1 1 2 3 2 4 V. Ravagiia , M. Quattrocchi , S. Mazzocchi , B, Lazzari , G. Zatelli , A. Vaiano , S. Busoni , C. Gasperi6 A. Lazzari1
^ . O . Fisica Sanitaria, USL2, Lucca, Italy 2U.O. Fisica Sanitaria, USL10, Firenze, Italy 3U.O. Fisica Sanitaria, USL3, Pistoia, Italy 4U.O. Fisica Sanitaria, USL8, Arezzo, Italy
l .O. Fisica Sanitaria, A.U.O. Careggi, Firenze, Italy 6U.O. Fisica Sanitaria, USL7, Siena, Italy
E-mail address of main author: [email protected]
The screening program in Italy is based on regional organization. In Tuscany it's performed in 12 different health local units (USL) spread all over the region. In the region all women from 50 to 69 years are invited each 2 years. The total number of women involved is about 500.000 and more than 200.000 women per year are invited to take part in the screening program. Aim of the study is to analyze the risk/benefit ratio of the screening program of Tuscany for the years 2004-2008.
Screening Programs Invited population Responding population
USL 1 Massa e Carrara 10516 7053 USL 2 Lucca 13377 7777 USL 3 Pistoia 14052 10055 USL 4 Prato 9208 6883 USL 5 Pisa 23201 13453 USL 6 Livorno 20708 14027 USL 7 Siena 14815 9001 USL 8 Arezzo 20085 11562
USL 9 Grosseto 12384 7224 USL 10 Firenze 45552 30754
USL 11 Empoli 10003 6645 USL 12 Viareggio 9304 5766 Tuscany Region 203205 130200
TABLE 1. Number of invited and attended women for the screening program in each center of Tuscany for the year 20071.
We collected the data relative to the women examinations for each center (kV, mAs, anode/filter combination, breast thickness) in order to calculate the average glandular dose (AGD) according to the European Guidelines for Quality Assurance in Breast Cancer Screening and Diagnosis2. Examples of the collected data for one center are shown in Fig. 1.
359

Compressed breast thickness distribution AGD distribution
4.50% 4.00% 3.50% 3.00% 2.50% 2.00% 1.50% 1.00%
0.50% 0.00%
25.00%
20.00%
15.00%
10.00%
5.00% •
• i l l I I I . - -21 31 41 51 61 71 81 91 101 111
Breast Thickness (mm) 0 0.2 0.4 0.6 0.8 1 1.2 1.4 1.6 1.8 2
AGD (mGy)
FIG 1. Compressed breast thickness distribution and average glandular dose distribution for the screening program of the USL 2 of Lucca.
The average glandular dose is related to a radioprotection risk in term of number of induced cancers in the population due to the radiological examinations3.
For each centre the detection rate together with the mean average glandular dose is used to calculate the benefit/risk ratio of the screening programs, in terms of number of detected cancers to induced cancers. In table 2 the results for the USL 2 of Lucca are presented as example.
Average glandular Induced cancers Detected cancers Benefit/risk ratio dose per projection
(mGy)
0.8±0.3 0.25 48.5 194 TABLE 2. Number of induced and detected cancers and calculated benefit/risk ratio for the sceening program of the USL 2 of Lucca.
REFERENCES
[1] I PROGRAMMI DI SCREENING DELLA REGIONE TOSCANA. SESTO RAPPORTO ANNUALE (2004), Settimo rapporto annuale (2005), Ottavo rapporto annuale (2006), Nono rapporto annuale (2007), Decimo rapporto annuale (2010).
[2] European Guidelines for Quality Assurance in Cancer Screening and Diagnosis, 4th Edition (2006).
[3] J. LAW, K FAULKNER "Cancers detected and induced, and associated risk and benefit, in a breast screening programme." Br J Radiol 74 (2001), 1121-1127.
360

IDOS, Vienna, 9-12 November 2010 E2-CN-182, Paper No INV015
Survey of dose after the introduction of digital mammographic system in Tuscany (Italy)
1 1 2 3 2 4 M. Quattrocchi , V. Ravaglia , S. Mazzocchi , B. Lazzari , G. Zatelli , A. Vaiano , S. Busoni5, C. Gasperi6, A. Lazzari1
^ . O . Fisica Sanitaria, USL2, Lucca, Italy
2U.C). Fisica Sanitaria, USL10, Firenze, Italy 3U.O. Fisica Sanitaria, USL3, Pistoia, Italy 4U.O. Fisica Sanitaria, USL8, Arezzo, Italy 5U.O. Fisica Sanitaria, A.U.O. Careggi, Firenze, Italy
°U.G. Fisica Sanitaria, USL7, Siena, Italy
E-mail address of main author: [email protected]. it
Aim of the paper is to show the impact of the introduction of mammographic digital systems (CR and DR) on the dose in Tuscany (Italy).
The average glandular dose is the radioprotection reference parameter in mammography and it's calculated in according with the European Guidelines for Quality Assurance in Breast Cancer Screening and Diagnosis1. It is obtained by multiplying the Ka i, entrace surface air kerma at the breast surface without back-scatter, for corrective factors calculated by Dance2 with Montecarlo simulations. The Ka>i value is estimated from output measurements during QC, for different kVp and anode/filter combinations.
We collected the data relative to about 600 women examinations (2 projections per breast) for each mammographic system used in Tuscany (kV, mAs, anode/filter combination, breast thickness) in order to calculate the mean average glandular dose (AGD). For full field digital mammography, these data were extracted from the image Digital Imaging and Communications in Medicine (DICOM) headers. For CR systems the exposure data are collected manually by radiographers during the exam. The calculated values are then compared with the EUREF limiting values.
An example of the average glandular dose distribution against the compressed breast thickness for the system Mammomat3000 (Siemens) coupled with Fuji plates is shown in Fig. 1. Mean values of the AGD for each examined breast and of the compressed breast thickness were 1.54 ± 0.54 mGy and 56 ± 12 mm, respectively.
As conclusions, digital acquisition systems in mammography can obtain the same image quality of analog ones, without significant increase of the dose to population, only if a correct optimization is performed.
361
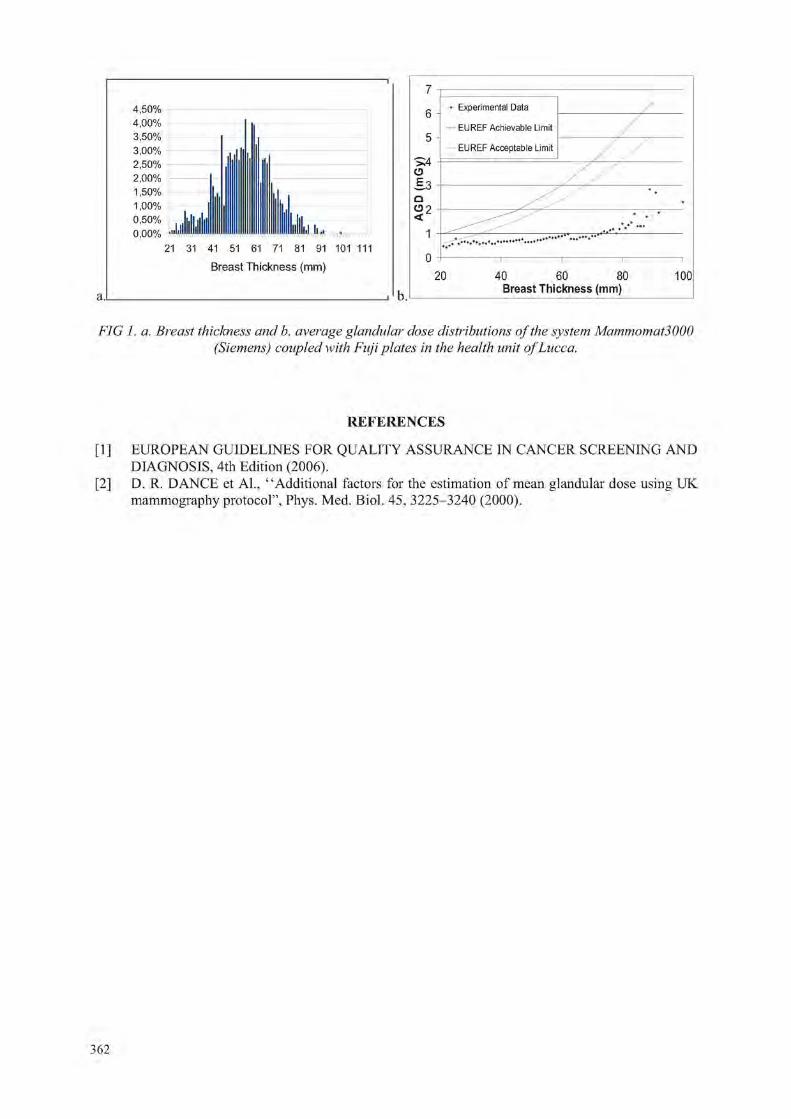
4,50% 4,00% 3,50% 3,00% 2,50% 2 , 0 0 %
1,50% 1,00% 0,50% 0,00% ...Llllllllilllllllllllllllllllll I lllllliil li.,
21 31 41 51 61 71 81 91 101 111
Breast Thickness (mm)
7
6
5
>4 a £.3 n O? t
1
0
• Experimental Data / — EUREF Achievable Limit /
EUREF Acceptable Limit j / y
b.L 20 40 60 80
Breast Thickness (mm) 100
FIG 1. a. Breast thickness and b. average glandular dose distributions of the system Mammomat3000 (Siemens) coupled with Fuji plates in the health unit of Lucca.
REFERENCES
[1] EUROPEAN GUIDELINES FOR QUALITY ASSURANCE IN CANCER SCREENING AND DIAGNOSIS, 4th Edition (2006).
[2] D. R. DANCE et Al., "Additional factors for the estimation of mean glandular dose using UK mammography protocol", Phys. Med. Biol. 45, 3225-3240 (2000).
362

IDOS, Vienna, 9-12 November 2010 E2-CN-182, Paper No INV015
Can a non-invasive X ray tube voltage measuring device (kV-meter) that reads the peak voltage, be used for the measurement of the practical peak
voltage (PPV)?
C. J. Hourdakis
Greek Atomic Energy Commission (GAEC), Athens, Greece.
E-mail address of main author: [email protected]
The measurement of the X-ray tube voltage is needed in various applications in diagnostic radiology. Although the peak voltage is often measured, it has not been sufficiently defined. It could refer to the maximum peak voltage, Up (maximum value of voltage during an exposure), the average peak voltage, Up (the arithmetic average value of all voltage peaks), the effective peak voltage Ueff (equivalent constant potential voltage producing similar image contrast), or something else. In order to define a precise quantity for comparisons of voltage related to the final effect on the film, the practical peak voltage (PPV), Uppv has been proposed and is being used as the standard quantity for the X-ray tube voltage in diagnostic radiology [1,2,3,4,5].
In diagnostic radiology, the X-ray tube voltage measurements are usually performed with non invasive portable devices often referred as kV-meters. Most commercial kV-meters measure the average peak voltage. Recently, few modem type devices have been introduced in the market that could measure the PPV. Most kV-meters analyze and process signals from their detectors, which originate from attenuation measurement of the x-ray beam and correspond to the x-ray tube voltage waveform.
This work investigates the possibility of PPV estimation by measuring the average peak voltage with a kV-meter. This attempt has practical implications, since it concerns a quite large number of kV-meters, whose output might be converted for PPV estimation by applying appropriate calibration coefficients and correction factors.
In principal, UPPr and Up are different quantities, based on different concepts; the former is related to image contrast while the latter is a pure electrical quantity. For the Up determination, only the peak values of the tube voltage waveform are considered, while UPPr takes into account all voltage values of the waveform. In this respect, the ratio of the UPPr and Up depends on the voltage ripple, r = X 100%
Home-made PC software was used to generate voltage waveforms, which resemble the X-ray generator voltage waveforms, for various ripple (0% to 1%), peak voltage (60, 80, 100 and 120 kV) and frequency (50 Hz, 300 Hz, 3kHz and 30 kHz) values. From those waveforms, the UPPr and Up
were calculated according to their definition and the relationship kPPr=f(r) was determined, where kPPr
= Uppr/ Up and r is the ripple (Figure la). The regression equations on the fitting curves kPPr=f(r) value were obtained at each tube voltage. The influence of frequency to the kPPV (for the same ripple) was proved to be negligible, as expected.
In order to test the kPPV =f(r) relationship, several waveforms from clinical X-ray radiography systems were recorded using the RTI Piranha non-invasive kV-meter, from which the ripple, the UPPy and the Up were calculated, according to their definition and kPPr as well. In all cases, the differences of kPPr
from the computed and clinical waveforms were less than ±1% (Figure lb).
363

C o m p u t e d d a t a k p pv=f( r )
60kV 80kV lOOkV 120kV
kT.,..- v s r at 80 k V
1 0.98
0.96
0.94
0 91
0.9
o.ss
• Clinical (lata
•••••• PC data
0.1 0 . 2
Ripple, r
O.J 0.4
FIG la. The conversion factors, kPPV vs the ripple. FIG. 2b. Verification of the kPPV values (PC data) kPPV converts the average peak voltage to the PPV. with measurements at clinical X-ray units.
From this data and regression analysis, the calculated corrections factors, kPPr, for a given ripple and tube voltage, could convert the Up to UPPy„ High frequency generators usually have ripple of about 2%; their voltage waveforms could resemble constant potential, where the UPPV is similar to the tube voltage. This is in coincidence with the above data, which gives kPPr of about 0.99. For the three phase - six pulses generators with ripple of about 6%, the kPPr is about 0.98.
The UPPr could be estimated from a kV-meter average peak voltage measurement, M, from the relationship Uppv = M - NUp •• kPPy, where NUp is the calibration coefficient of the kV-meter in terms of average peak voltage at the given tube voltage.
Two commercial non-invasive kV-meters (an RTI Piranha that measures both UPPV and Up and an RTI PMXIII that measures only the UB) were calibrated in terms of Up and/or UPPr against the invasive reference instrument Radcal Dynalyzer® III at the CONTROL-X high frequency (HF), W anode, 50-150 kV and the SIEMENS GIGANTOS 1000, 3 phase 6 pulses (3P6), W anode, 50-150 kV X-ray systems. The differences of the reference UPPV (as determined with the Dynalyzer®) and the UPPr
measured with the kV-meters according to Uppv = M • NUp -kppv were less than 0.8% for RTI Piranha and 0.9% for PMX for all tube voltages at the SIEMENS 3P6 X-ray system. At the Control-X HF system the differences were less than 0.5% in all cases.
In conclusion, the measurement of PPV with a kV-meter that measures the Up is not consistent from the metrological point of view. However, the use of kPPr correction factors, as described in this method, might be used when estimation of PPV is required.
REFERENCES
[1] INTERNATIONAL COMMISSION ON RADIATION UNITS & MEASUREMENTS (ICRU), Journal of the ICRU Vol 5 No 2 Report 74, 2005: 21-24.
[2] INTERNATIONAL ELECTROTECHNICAL COMMISSION, Medical electrical equipment -Dosimetric instruments used for non-invasive measurement of X-ray tube voltage in diagnostic radiology. IEC-61676 : IEC, Geneva, 2002.
[3] INTERNATIONAL ATOMIC ENERGY AGENCY, DOSIMETRY IN DIAGNOSTIC RADIOLOGY: An international code of practice. Technical reports series No 457, STI/DOC/010/457, ISBN 92-0-115406-2, 2007.
[4] KRAMER HM, SELBACH HJ AND ILES WJ. The practical peak voltage of diagnostic X-ray generators. Br J Radiol 1998; 71: 200-209.
[5] BAORONG Y, KRAMER HM, SELBACH HJ and LANGE B. Experimental determination of practical peak voltage. Br J Radiol 2000; 73: 641-649.
364

IDOS, Vienna, 9-12 November 2010 E2-CN-182, Paper No INV015
Entrance surface air kerma to patients during chest computed radiography in the United Republic of Tanzania
W.E. Muhogora, J.B. Ngatunga, U.S. Lema, L. Meza, E. Byorushengo, J. Mwimanzi, M. Nyaki, S. Mikidadi and F.P. Banzi
Tanzania Atomic Energy Commission, P.O Box 743 Arusha, United Republic of Tanzania
E-mail address of main author: [email protected]
Computed radiography (CR) has the potential to improve the image quality through its image processing capabilities as well as reducing patient doses. However, during transition period from analogue to digital modality, there can be a tendency to maintain the exposure parameters that are used in film-screen imaging. This tendency can lead to higher patient doses than is necessary [1], Such transition is currently taking place in Tanzania and 5 CR facilities are in clinical use. The main objective of this study was to determine the entrance surface air kerma (ESAK) during chest computed radiography of adult patients so as to monitor patient doses during this transition. A previously applied method [2] was used to determine ESAK to 20 adult patients at each facility. The x-ray tube output for each tube potential in clinical use was measured using model 6000-528, 30 cm" ionization chamber and Model 4000 M+-SI both manufactured by Fluke Biomedical, New York. The energy response of this dosimetry system as stated by manufacturer is 7% over 50-150 kVp range. From the x-ray output and recorded patient exposure parameters, the incident air kerma values (IAKs) were calculated. The ESAK values (ESAKs) were then derived on basis of IAKs and backscatter factor. The ESAKs obtained at 3 facilities as part of ongoing study are presented in Table 1. The results show that the mean ESAKs at two hospitals were higher than the national average value of 300 (.iGy for 400 film-screen system [2] and above the recommended diagnostic reference level of 300 (.iGy [3]. This suggests the need to train the radiology personnel towards optimized practice.
Table 1. Entrance surface air kerma (ESAK) during chest PA computed radiography of adult patients
Hospital CR model patient weight (kg)
patient thickness (cm)
tube potential (kVp)
tube current-time product (mAs)
ESAK (uGy:
range
i
mean
Arusha Kodak CR 18- 68.9-Lutheran 140 60-76 25 55-62 8-12.5 134.4 102.1
Korogwe Kodak CR 18- 253-140 59-78 24 102-117 2.3-3.2 680.6 384.8
Geita Gold Philips 20- 258.9-Mine Campano 60-82 24 102-109 3-4 366.6 302.4
365
REFERENCES
[1] WARREN-FORWARD, II.. ARTHUR, L„ HOBSON, L„ SKINNER, R„ WATTS, A., CLAPHAM, K., LOU, D., COOK, A. An assessment of exposure indices in computed radiography for the posterior chest and the lateral lumbar spine. Br. J. Radiol. (2007), 80: 26-31.
[2] MUHOGORA W.E., AHMED N.A., ALMOSABIHI A et al. Patient doses in radiographic examinations in 12 countries in Asia, Africa and Eastern Europe: Initial results from IAEA projects, Am. J. Roentgenol.(2008), 190:1453-1461
[3] DIMOND III PROJECT (contract FIGM-CT-2000-00061). Final report -Image quality and dose management for digital radiography. DIMOND (2003).
366
IDOS, Vienna, 9-12 November 2010 E2-CN-182, Paper No INV015
Dose assessement in CT examinations
W. Nyakodzwe'.G. Mukwada2
! Parirenyatwa Hospital Radiotherapy and Oncology Center, Harare, Zimbabwe
2The Cancer Center, Nassau, The Bahamas
E-mail address of main author: [email protected]
A study was conducted to assess and analyse the dose delivered to patients during CT examinations. The centers which participated in this study also participated in the International Atomic Energy Agency (IAEA) project (RAF/ 9/033) for Diagnostic Reference Levels (DRLs) in Zimbabwe.
The study was conducted in two phases, firstly the scanning protocols which were being used by the participating centers were collected and these included the Applied KV, mAs setting, Slice Thickness and the Computed Tomography Dose Index (CTDI) for common CT examinations procedures in the centers. The tube potential and mAs variation was noted from the different scanning protocols used by the different centers for the same examination, though there was generally no co-ordination between the centers the input machine values for mAs and KV did not differ much. Then secondly using a 10 cm pencil ionisation chamber with recommendations and guidelines outlined in the IAEA TRS 457 Dosimetry in Diagnostic Radiology an International Code of Practice, in air measurements were performed and in some cases in phantom measurements were done. Calculations to get CTDI as well as weighted CTDI (CTDIW) were done, a comparison between the machine reported CTDI and the calculated/measured CTDI was done for the same CT examination. Due to machine unavailability complete measurements were done on only two machines.
The study showed that there is no wide deviation between the machine reported CTDI and the calculated CTDI, since the measured CTDI gave 48.6 mGy while the machine reported gave about 45.9 mGy. The machine reported CTDI can be used as a radiation protection tool and can guide in protecting patients but should not replace dose measurements by use of an ionisation chamber and DRLs. This study shows the importance of analysing dose reports.
REFERENCES
[1] INTERNATIONAL ATOMIC ENERGY AGENCY ,TRS 457 Dosimetry in Diagnostic Radiology: An International Code of Practice(2007),IAEA
[2] KOLLER C.T et al ,Variation in Radiation dose between the same model of multi slice CT scanner at different hospitals ,British Journal of Radiology,76 (2003) 782-802, The British Institute of Radiology
[3] AMERICAN ASSOCIATION OF PHYSICISTS IN MEDICINE, Measurements, reporting and Management of Radiation Dose in CT, Report of AAPM Task Group 23 of the Diagnostic Imaging Council ,CT committe (2007),AAPM report number 96, AAPM
367


IDOS, Vienna, 9-12 November 2010 E2-CN-182, Paper No INV015
Patient dose audit of radiology departments across Ghana
J Fazakerleya, E Ofori \ D Scutt\ M Warda, BM Mooresa,
integrated Radiological Services Ltd, Liverpool, UK
"School of Health Sciences, University of Liverpool
E-mail address of main author: jason fazakerley@irs-lim ited.com
2838 dose data records were recorded from 10 radiology departments across Ghana by radiographers during x-ray examinations containing exposure factors such as kV, mAs and the focus to skin distance. Patient details such as gender, age, weight and height were also recorded. Together with tube calibration data measured during 2009 entrance surface dose has been calculated by the program 'Quality Assurance Dose Data System' or QADDS, a web based application that can house patient dose data records and calculate ESD developed by Integrated Radiological Services. The process of transferring these records into QADDS has been developed by IRS over the last few years [1],
Using CALDose-X, a free to download program from the grupodoin website calculation of the sex specific weighted whole body dose using the MAX06 and FAX06 phantoms has been performed. According to ICRP 103 (ICRP 2007), the arithmetic mean of the two sex-specific weighted absorbed doses is the effective dose. [2] As it would be a time consuming process to calculate the weighted whole body dose for every single record only those with the most common exposure factors for the chest PA and lumber spine AP examinations for each gender were processed. The calculated mean entrance air kerma for the examinations chosen has been used as the normalisation factor. Weighted whole body dose calculations are performed using typical FSD's and field sizes [2]. Table 1 shows the calculated male weighted body dose for lumbar spine exams at each site.
Male Weighted Room Mode kV Mode mAs Body Dose (mGy)
Site A 63 578 4.28 (9) Site B 85 28 0.87(10) Site C 90 50 1.61 (5) SiteD 75 22 0.37(5) SiteE 90 40 1.14(4) Site F 55 57.9 0.33 (9) SiteG 85 63 1.21(5) SiteH 73 40 0.35(5) Site I 90 50 1.49 (4) Site J 70 100 0.83 (6) Table 1. Table shown male weighted body dose for lumbar spine exams for each site for examinations with the most common exposure factors .Number inbrackets indicates number of examinations.
The mean ESD for each room has been calculated for each examination audited. The mean ESD has been compared to the Guidance Levels of Dose for typical adult patients published by the IAEA [3]. With the exception of chest PA examinations the majority of the rooms audited had lower mean doses than these reference values with the exception of one room. Doses were compared with UK NDRL's [4] and also to European dose reference levels [5]. Table (2) shows the percentage of each rooms that exceeded each reference level for each examination.
369

Examination European National (UK) Diagnostic BSS Reference Level Reference Level Guidance
Abdomen AP 70 30 10 Chest I.AT 75 50 25
Chest PA 100 70 50 Lumbar Spine AP 50 20 10
Lumbar Spine LAT 60 30 10 Pelvis AP 40 40 20 Skull PA 60 20 0
Skull LAT 50 20 20 Table 2. Percentage of rooms auidted where the mean ESD exceeded each guidance. (BSS - Basic Safety Standards)
The mean ESD for any given exam can vary from room to room. For example for abdomen AP the room with the lowest ESD had a mean of 1.30mGy where the highest had a mean of 25.27mGy. Each room had a minimum of 20 records for abdomen AP records. The standard deviation for all abdomen AP records was 6.82.
As patient details were recorded this allows further analysis of patient dosimetry [6]. An analysis of Body Mass Index against ESD can give a further indication of how well patient doses are optimised. Table 3 shows the variation of ESD with BMI.
ESD (mGy) BMI (kg/ni2) rounded to nearest 5 Site 20 25 30 35 40 45 50 All Site A 19.67 23.53 28.53 27.51 25.27 Site B 1.84 2.64 4.18 4.98 4.80 3.81 Site C 1.78 2.75 4.05 6.22 7.52 4.17 SiteD 4.13 4.32 5.48 6.61 4.97 5.04 SiteE 5.28 5.28 Site F 0.94 1.38 1.31 1.40 1.30 SiteG 6.15 6.15 SiteH 1.39 1.40 1.59 1.76 1.52 Site I 4.09 4.27 4.80 6.45 4.48 Site J 3.80 5.54 6.89 8.68 12.45 4.51 3.52 6.64 All 4.41 5.10 6.18 5.66 6.75 6.52 3.52 5.65 Table 3. Table showing ESD variation with BA41for each site for Abdomen AP examinations.
Automatic exposure control (AEC) devices are recommended for optimising dose irrespective of patient thickness however a survey performed prior to 1998 showed that AEC devices are not always available in Ghana and not all radiographic staff are familiar with them [7]
370

REFERENCES
[1] WILDE R et al, Automating patient dose audit and clinical audit using RIS data (inpress). World Congress 2009, Munich
[2] KRAMER R et al, CALDose_X-a software tool for the assessment of organ and tissue absorbed doses, effective dose and cancer risks in diagnostic radiology, Phys. Med. Biol. 53 (2008) 6437-6459
[3] INTERNATIONAL ATOMIC ENERGY AGENCY International Basic Safety Standards for Protection Against Ionising Radiation and for the Safety of Radiation Sources,, Vienna, 1996.
[4] IPEM Guidance on the Establishment and use of diagnostic reference levels for medical x-ray examinations, 2004: Report 88
[5] HART D, HILLIER MC and WALL BF. Dose to patients from radiographic and fluoroscopic x-ray imaging procedures in the UK - 2005 Review. Health Protection Agency, HPA-RPD-0292005, 2007. ISBN 9780859516006
[6] FAZAKERLEY J, CHARNOCK P, HIGGINS M, JONES R, O'CONNER J. The development of a 'gold standard' patient dose audit data set. IPEM Proceedings of the 141!l Annual Scientific Meeting, Bath, UK, pp61
[7] SCHANDORF C and TETTEH G C, Analysis of the status of X-ray diagnosis in Ghana. The British Journal of Radiology, 71 (1998), 1040-1048
371


IDOS, Vienna, 9-12 November 2010 E2-CN-182, Paper No INV015
Characterization of diagnostic radiation qualities according to the IEC 61267 at LMRI-ITN
P. Limede3, C. Oliveira , J. Cardoso13, L. Santos5
aFaculdade de Ciencias e Tecnologia, Universidade Nova de Lisboa (FCT - UNL), Caparica, Portugal
bInstituto Tecnologico e Nuclear (ITN), Sacavem, Portugal
E-mail address of main author: [email protected]
The purpose this work was to characterize the radiation qualities RQR, RQA and RQT, according to the international standard IEC 61267, to implement them in the Metrological Laboratory of Ionizing Radiation in the Nuclear and Technological Institute (LMRI - ITN) for the calibration of dosimeters used in diagnostic radiology.
In this study was used the international standard IEC 61267(2005): Medical diagnostic X-ray equipment - Radiation conditions for use in the determination of characteristics, which is based on the determination of the half-value layer - HVL, to characterize the various radiation qualities. Besides the HVL value, the standard uses two other parameters, the homogeneity coefficient - h, and the quotient y(lst HVLIEC)/y(0). [1]
Prior to the characterization of the diagnostic radiation qualities RQR, RQA and RQT, it was necessary to ensure the use of a uniform and homogeneous field in all measurements. Afterwards, it was required to determine the inherent filtration of the X-ray tube to be used. [2]
The procedure to characterize the radiation qualities RQR, consisted in determining the additional filtration of aluminum needed to obtain the values of HVL, homogeneity coefficient and quotient y(lst
HVLIEC)/y(0) established in the standard. For this purpose several thicknesses of aluminum absorbers of 99,9% purity were placed between the X-ray tube and the detector, and by determining the air kerma attenuation curve of the radiation beam, the three parameters listed above were calculated.
To characterize the radiation qualities RQA and RQT, the additional filtration determined for each radiation quality RQR was used, and an added filter was placed on the experimental setup. The air kerma attenuation measurement was repeated, in order to obtain the values of HVL. For the radiation qualities RQA the thickness of the aluminum added filter varies from 4 to 45 mm for the tube potencial 40 to 150 kV, respectively, and for the radiation qualities RQT the thickness of the copper added filter varies from 0.20 to 0.30 mm for the tube potencial 100 to 150 kV, respectively.
For the radiation qualities RQR, the exponential attenuation fitting curve has two components, as can be observed in figure 1. The first component is due to the most energetic part of the beam coming from additional filtration, which is the dominant component (primary component). The other component (secundary component) is due to the less energetic part of the beam coming from the additional filtration.
373
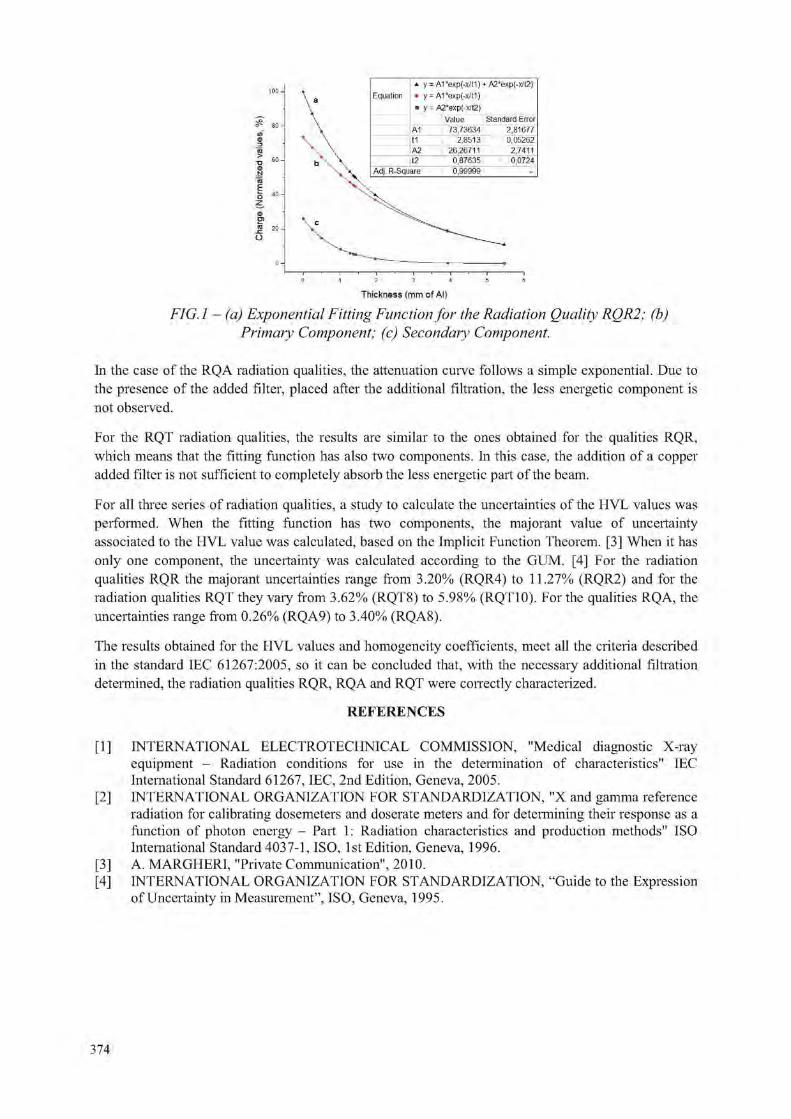
Thickness (mm of Al)
FIG.l - (a) Exponential Fitting Function for the Radiation Quality RQR2; (b) Primary Component; (c) Secondary Component.
In the case of the RQA radiation qualities, the attenuation curve follows a simple exponential. Due to the presence of the added filter, placed after the additional filtration, the less energetic component is not observed.
For the RQT radiation qualities, the results are similar to the ones obtained for the qualities RQR, which means that the fitting function has also two components. In this case, the addition of a copper added filter is not sufficient to completely absorb the less energetic part of the beam.
For all three series of radiation qualities, a study to calculate the uncertainties of the HVL values was performed. When the fitting function has two components, the majorant value of uncertainty associated to the HVL value was calculated, based on the Implicit Function Theorem. [3] When it has only one component, the uncertainty was calculated according to the GUM. [4] For the radiation qualities RQR the majorant uncertainties range from 3.20% (RQR4) to 11.27% (RQR2) and for the radiation qualities RQT they vary from 3.62% (RQT8) to 5.98% (RQT 10). For the qualities RQA, the uncertainties range from 0.26% (RQA9) to 3.40% (RQA8).
The results obtained for the HVL values and homogeneity coefficients, meet all the criteria described in the standard IEC 61267:2005, so it can be concluded that, with the necessary additional filtration determined, the radiation qualities RQR, RQA and RQT were correctly characterized.
REFERENCES
[1] INTERNATIONAL ELECTROTECHNICAL COMMISSION, "Medical diagnostic X-ray equipment - Radiation conditions for use in the determination of characteristics" IEC International Standard 61267, IEC, 2nd Edition, Geneva, 2005.
[2] INTERNATIONAL ORGANIZATION FOR STANDARDIZATION, "X and gamma reference radiation for calibrating dosemeters and doserate meters and for determining their response as a function of photon energy - Part 1: Radiation characteristics and production methods" ISO International Standard 4037-1, ISO, 1st Edition, Geneva, 1996.
[3] A. MARGHERI, "Private Communication", 2010. [4] INTERNATIONAL ORGANIZATION FOR STANDARDIZATION, "Guide to the Expression
of Uncertainty in Measurement", ISO, Geneva, 1995.
374

IDOS, Vienna, 9-12 November 2010 E2-CN-182, Paper No INV015
Applications of the IAEA code of practice TRS-457 for establishing radiation qualities at the Syrian National Radiation Metrology Laboratory
M.A. Bero and M. Zahili
National Radiation Metrology Laboratory (NRML), Atomic Energy Commission of Syria, P.O. Box 6091, Damascus, Syria.
E-mail address of main author: [email protected]
Syrian National Radiation Metrology Laboratory (NRML) has commissioned a new facility for diagnostic radiology and mammography calibrations. Tow X-ray tubes were installed in order to carry on this task. First one is the ISO VOLT 160 Titan, maximum rating 160 kV and continuous rating 640/3000W tungsten anode. The second is side window tube 100 kV, 3000W molybdenum anode. Both were used to establish required radiation qualities in order to start calibration services in radiology field.
Three steps were performed before starting the measurements; firstly by adjusting the laser beam to be horizontal and well focused. Then the X-ray tubes were altered in order to make the radiation beam horizontal and perpendicular to the laser beam. Finally, the field size is tuned to be 10x10 cm which is three times larger than the sensitive volume of the standard chamber.
Ionization chamber type TW34069 # 070 connected to an electrometer UNIDOS type 10002 # 20128 was used to obtain radiation output measurements at the focal to detector distance (FDD) equals to 100 cm. Room temperature and pressure were recorded using dual function digital thermometer and barometer model OPUS 10 # 16599. Half value layer (HVL) measurements were made using set of high purity and homogeneity Aluminum and Copper attenuator, purity of about 99.9 % [1].
The radiation measurements were started with establishing the RQR radiation qualities by fixing the X-ray tube voltage to the given values in TRS-457 [2]. Additional filtration necessaiy to achieve the desired half value layers was determined. These values were calculated using the method mentioned in TRS-457 section 6.5.2.1. [2] in comparison with given values, table 6.2. Calculation method is based on the attenuation curve, which is obtained from HVLs that were realized by calculating the ratio between two air kerma rates one with the desired HVL and the other without. Practically, this ratio was found to take values between 0.485 and 0.515, see table 1.
Next step was designed to establish the RQA radiation qualities by including the additional filtration that was modified to determine RQR. Required filtration were taken from TRS-457, table 3.3 [2], then the additional filtration needed to achieve HVLs for RQA was practically determined using the same method applied to establish RQR,
The measurement of appropriate HVLs for establishing RQT were preformed by summing up the additional filtration modified for RQR and the additional filtration that is mentioned in table 6.4. of TRS-457 protocol [2], Repeated measurements were carried out for RQR-M radiation qualities determination in order to achieve the needed HVL mentioned in table 6.5. of the IAEA guide. Adding a molybdenum filter with a thickness of 0.032 mm, the RQA-M radiation qualities were finally established with the adding together 2 mm of Al to the additional filtration related to RQR-M radiation qualities.
375
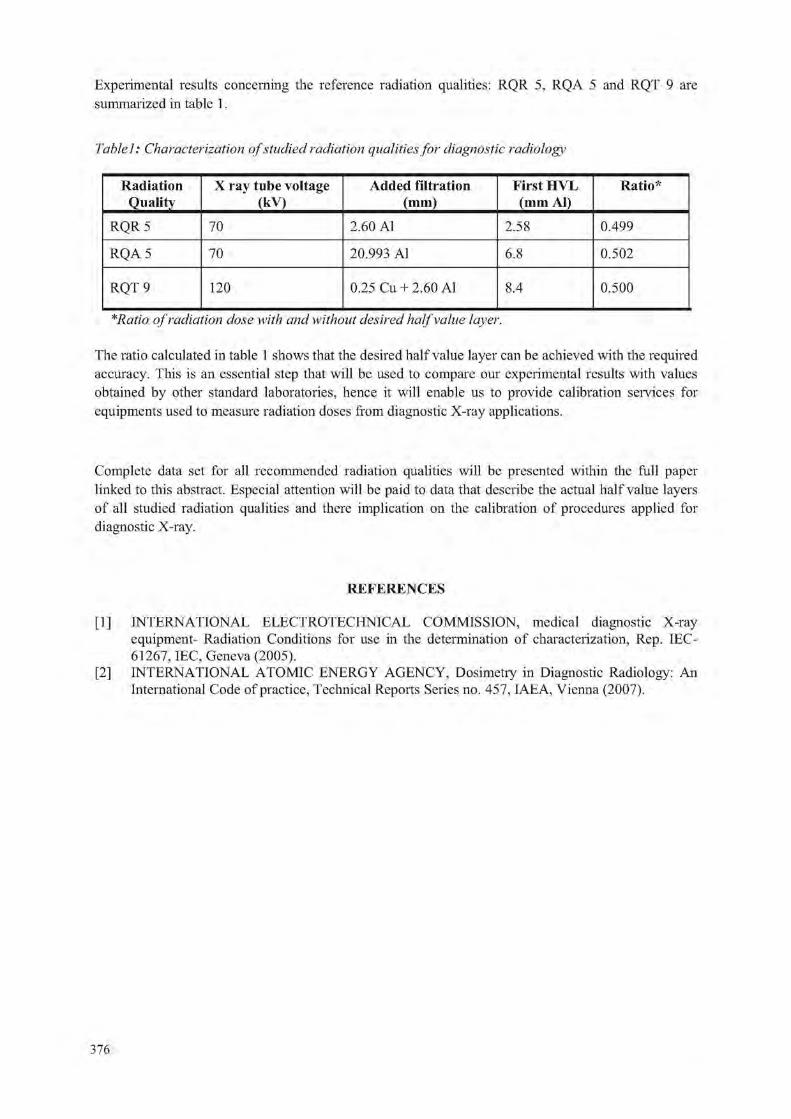
Experimental results concerning the reference radiation qualities: RQR 5, RQA 5 and RQT 9 are summarized in table 1.
Table 1: Characterization of studied radiation qualities for diagnostic radiology
Radiation Quality
X ray tube voltage (kV)
Added filtration (mm)
First HVL (mm Al)
Ratio*
RQR 5 70 2.60 Al 2.58 0.499
RQA 5 70 20.993 Al 6.8 0.502
RQT 9 120 0.25 Cu + 2.60 Al 8.4 0.500
*Ratio of radiation dose with and without desired half value layer.
The ratio calculated in table 1 shows that the desired half value layer can be achieved with the required accuracy. This is an essential step that will be used to compare our experimental results with values obtained by other standard laboratories, hence it will enable us to provide calibration services for equipments used to measure radiation doses from diagnostic X-ray applications.
Complete data set for all recommended radiation qualities will be presented within the full paper linked to this abstract. Especial attention will be paid to data that describe the actual half value layers of all studied radiation qualities and there implication on the calibration of procedures applied for diagnostic X-ray.
REFERENCES
[1] INTERNATIONAL ELECTROTECHNICAL COMMISSION, medical diagnostic X-ray equipment- Radiation Conditions for use in the determination of characterization, Rep. IEC-61267, IEC, Geneva (2005).
[2] INTERNATIONAL ATOMIC ENERGY AGENCY, Dosimetry in Diagnostic Radiology: An International Code of practice, Technical Reports Series no. 457, IAEA, Vienna (2007).
376
IDOS, Vienna, 9-12 November 2010 E2-CN-182, Paper No INV015
A comparison of full field digital mammography systems: Physical characteristics and image quality/dose performance in optimized clinical
environment N. Oberhofera, A. Fracchettf and E. Morodera
"Azienda Sanitaria dell'Alto Adige, Servizio di Fisica Sanitaria, Bolzano (Italy)
E-mail address of main author: nadia.oberhofer@asbzjt
We present a comparison of the most common full field digital mammography (FFDM) systems with respect to their dose efficiency in relation to image quality. 12 equipments representing 9 different systems are studied in clinical environment (2 Hologic Selenia with Molybdenum target and tungsten target, Ge Essential, Ge DS, Fujifilm Amulet, 2 Siemens Inspiration, Sectra Microdose, 2 analog units with Agfa computer radiography (CR) system).
The completeness of the equipment sample allows to adress 4 particular aspects: the role of the detector readout technology (2 identical units with a-Se detector, differing by detector readout), the importance of the x-ray spectrum (1 unit with two different tube assembleys) and the influence of radiation detection technique (photon counting against radiation integrating detection), besides the potentialities of direct radiography (DR) versus CR.
The study starts with the physical characterization of every system in terms of modulation transfer function (MTF), normalized noise power spectrum (NNPS) and detective quantum efficiency (DQE) following the internatioal norm IEC 62220-1-2 with radiation quality RQA-M2 and with clinical used technique.
For image quality assessment two different methods have been applied: 1) measurement of contrast to noise ratio (CNR) according to the European guidelines and 2) contrast-detail (CD) evaluation. The latter was carried out with the phantom CDMAM ver. 3.4 and the commercial software CDMAM Analyser ver. 1.1 (both Artinis) for automated image analysis. The overall image quality index IQFinv
proposed by the software has been validated elsewhere [1]. Correspondence between the two methods is verified testing the linear correlation between CNR and IQFinv. All systems were optimized with respect to image quality and average glandular dose (AGD) within the constraints of automatic exposure control (AI X ). For each equipment, a good image quality level was defined by means of CD analysis, and the corresponding CNR value considered as target value. The goal was to achieve for different PMMA-phantom thicknesses constant image quality that means the CNR target value, at minimum dose.
For comparison of the image quality performance of the systems with respect to dose, the dose indipendent figure of merit IQFinv
2/AGD has been introduced [2],
Whereas the intrinsic quality properties, expressed by DQE, of most studied systems with DR detectors were very similar, there turned out major differences in the technique choices operated by the automatic exposure control (AEC) devices, giving rise to substantial AGD differences in clinical
377
Results showed that
• a innovative photo-conductive switching readout technique for a-Se detectors may allow dose savings between 8% and 28%, depending on the phantom thickness, at equal image quality
• photon-counting detector technology may also permit dose savings.
Furthermore, the work confirmed that
• adapting target/filter combinations which produce x-ray spectra of higher mean energy compared to Mo/Mo turned out in a higher image quality at equal dose for PMMA thickness > 3 cm.
• DR systems clearly outperform CR systems in all configurations.
• in clinical use not all AEC devices follow optimal technique.
REFERENCES
[1] OBERFIOFER, N„ FRACCHETTI, A., SPR1NGETH, M„ MORODER, E.: Digital Mammography: DQE versus Optimized Image Quality in Clinical Environment - an on Site Study. In: Samei, E„ Pelc, N.J. (eds.) Proc SPIE Medical Imaging 2010, vol. 7622, ISBN 9780819480231, in press
[2] OBERHOFER, N„ FRACCHETTI, A., NASSIVERA, E„ VALENTINI, A., MORODER, E.: Comparison of two Novel FFDM Systems with Different a-Se Detector Technology: Physical Characterization and Phantom Contrast Detail Evaluation in Clinical Conditions. In: Marti, J. (ed) Proc IWDM 2010, in press
378
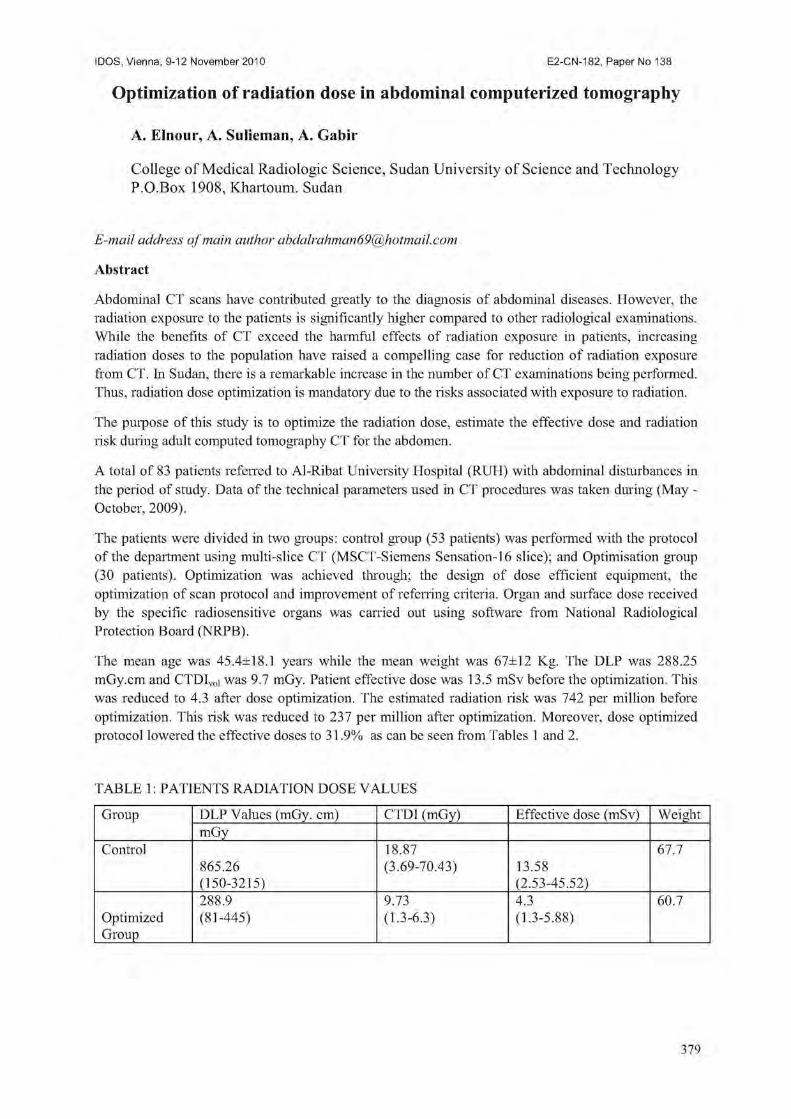
IDOS, Vienna, 9-12 November 2010 E2-CN-182, Paper No INV015
Optimization of radiation dose in abdominal computerized tomography
A. Elnour, A. Sulieman, A. Gabir
College of Medical Radiologic Science, Sudan University of Science and Technology P.O.Box 1908, Khartoum. Sudan
E-mail address of main author [email protected]
Abstract
Abdominal CT scans have contributed greatly to the diagnosis of abdominal diseases. However, the radiation exposure to the patients is significantly higher compared to other radiological examinations. While the benefits of CT exceed the harmful effects of radiation exposure in patients, increasing radiation doses to the population have raised a compelling case for reduction of radiation exposure from CT. In Sudan, there is a remarkable increase in the number of CT examinations being performed. Thus, radiation dose optimization is mandatory due to the risks associated with exposure to radiation.
The purpose of this study is to optimize the radiation dose, estimate the effective dose and radiation risk during adult computed tomography CT for the abdomen.
A total of 83 patients referred to Al-Ribat University Hospital (RUH) with abdominal disturbances in the period of study. Data of the technical parameters used in CT procedures was taken during (May -October, 2009).
The patients were divided in two groups: control group (53 patients) was performed with the protocol of the department using multi-slice CT (MSCT-Siemens Sensation-16 slice); and Optimisation group (30 patients). Optimization was achieved through; the design of dose efficient equipment, the optimization of scan protocol and improvement of referring criteria. Organ and surface dose received by the specific radiosensitive organs was carried out using software from National Radiological Protection Board (NRPB).
The mean age was 45.4±18.1 years while the mean weight was 67±12 Kg. The DLP was 288.25 mGy.cm and CTDIvol was 9.7 mGy. Patient effective dose was 13.5 mSv before the optimization. This was reduced to 4.3 after dose optimization. The estimated radiation risk was 742 per million before optimization. This risk was reduced to 237 per million after optimization. Moreover, dose optimized protocol lowered the effective doses to 31.9% as can be seen from Tables 1 and 2.
TABLE 1: PATIENTS RADIATION DOSE VALUES
Group DLP Values (mGy. cm) CTDI (mGy) Effective dose (mSv) Weight mGy
Control 18.87 67.7 865.26 (3.69-70.43) 13.58 (150-3215) (2.53-45.52) 288.9 9.73 4.3 60.7
Optimized Group
(81-445) (1.3-6.3) (1.3-5.88)
379

TABLE 2: SHOWS THE RELATION BETWEEN TWO GROUPS AND THE PERCENTAGE OF
REDUCTION ON RADIATION VALUES
GROUP CTDI DLP Effective dose (mGy) (mGy. cm) (mSv)
Control 18.8 865.26 13.5 Optimisation 9.7 288.6 4.3 Group Reduction% 48.4% 66.6% 68.1%
The study has shown a great need for referring criteria and continuous training of staff in radiation doses optimization concepts. Further studies are required in order to establish a reference level in Sudan.
The assessment of radiation dose to patients undergoing CT of abdomen investigated. Large variations of radiation dose to various organs were observed. This could be attributed to the different data in request.
The mean organ doses in this study were mostly comparable (Optimization group) to and slightly higher (Control group) than reported values from the developed countries. The use of abdomen and pelvis protocol instead of abdomen protocol leads to increase in radiation dose.
Furthermore, organ doses and the probability of cancer induction are relatively high. This justifies the need for optimization of CT scanning protocols.
Optimization could be achieved through optimal selection of scanning parameters based on indication of study, specification of the region of interest being scanned, and patient size.
REFERENCES
[1] ED YEAN, S. Type testing of CT scanners: methods and methodology for assessing imaging performance and dosimetry. Report MDA/98/25. Medical Devices Agency, London. (1998).
[2] SHRIMPTON PC, JONES DG, HILLIER MC, et al. Survey of CT practice in the UK. Part 2: Dosimetric aspects. Chilton, NRPB-R249. London: HMSO; (1991).
380

IDOS, Vienna, 9-12 November 2010 E2-CN-182, Paper No INV015
Image quality and patient dose in digital panoramic radiography
V. Brasileiroa, H. J. Khourya, R. Kramera, M. E. Andradea, J. B. Nascimento Netob c C. Borras a
a Department of Nuclear Energy, Federal University of Pernambuco, Recife, Brazil
b Radioface, Brazil
c University of Pernambuco, Brazil
E-mail address of main author: [email protected]
Panoramic radiography represents an important diagnostic imaging method widely used in dentistry. Although the organ doses in panoramic radiography are low, given the large number of procedures performed, the collective dose and associated risks can be significant. The objective of this work was to determine dose and image quality on digital panoramic radiography examinations, performed at a clinic in Recife, Brazil, in order to assess whether radiological protection could be optimized. The clinic was using two X-ray units Kodak 8000C (units 1 and 2).
Air kerma-length product ( P K L), air kerma-area product (PK,A) and entrance surface air kerma ( K E )
were determined using the methodology of the International dosimetry protocol in X-ray diagnostic radiology (TRS-457). The PK,L values were obtained through measurements performed with a calibrated pencil ionizing chamber PTW 30009-0516, for different values of mAs and kV. A function of normalized PK,L values (mGy.cm/mAs) versus kV was derived. PK,L values for 310 adult patients were calculated using the exposure parameters collected during the examination and the corresponding normalized P K L values obtained from this function. P K > A values for the patients' examinations were assessed based on the PK,L data multiplied by the radiation field length. Kc values for the sensitive organs: eyes, parotid glands, nape of the neck and thyroid were determined using thermoluminescent dosimeters (TLD-100), calibrated at an x-ray beam quality of RQR-7. The TLDs were encapsulated in plastic bags and positioned on the surface of a head phantom at points corresponding to these anatomical sites. They were irradiated using the exposure parameters in clinical use: 79 kV for unit 1 and 85 kV for unit 2 and 166.8 mAs for the both units, and they were read out with a TLD reader Harshaw 3500. .
To evaluate image quality, 100 clinical radiographs were randomly selected from each unit. Two radiologists evaluated the images and observed that 52% of the images from unit 1 and 57% from unit 2 presented errors related to incorrect positioning of the patient's tongue and the head of the mandible being out of field. These images were rejected and the remaining images were evaluated, verifying image contrast and visibility of anatomical structures. The radiologists assigned numbers between zero and three to each anatomic structure, with number three representing the best score. The sum of the scores of all structures is called the "radiography quality index (QI)". T 7 7 7 r 1 j . -1 • • • J y d J . - 1 7 J l 1 1 Ti
Minimum Mean Maximum 3rd Quartile Potential (kV) 67 73.2 90 -
Current (mA) 10 10.8 12 -
Time (s) 13.2 13.5 13.9 -
PK,L (mGy.cm) 4.7 11.1 6.89 7.9 PK,A (mGy.cm2) 68.2 87.5 129 93.7
381

Table 1 presents the exposure parameters and minimum, maximum, mean and 3 rd quartile values of PK,L and IV with the mean values being 6.89 mGy.cm and 129 mGy.cm2, respectively. In Brazil there are no reference levels for panoramic examinations of adult patients, but the values obtained in this paper are similar to those found in the literature and close to the United Kingdom reference level for adult patients [2],
Figure 1 shows the box & whiskers distributions of the entrance surface air kerma, Kc, obtained with both units on the surface of the head phantom at locations representing the eyes, parotid glands, nape of the neck and thyroid. The results show that the highest Ke values were found in the nape region, about four times higher than in the other evaluated regions. The Ke values of the parotids regions are ten times higher than the values for the eyes and the thyroid values are twice the values for the eyes. These values are similar to others taken in Recife in analog systems.
' 5
0,
— M e d i a n •p^ps Datatype
£ 0 J E
0,2
UNIT]
RE LE LP RP T N
0,6
'0,5
E 0.3
0,2
. 0 . 3
0,1
aili —Median • 25«-?5 T data.iange
RE LE LP R p T N
FIG I. Box & Whiskers distribution of Ke values measured at the two units in the clinics at different points on the surface of the phantom. RE-Right eye, LE-Left eye, LP-Left Parotid, RP-Rightparotid, T-Thyroid and N-nape.
The results of the quality index of the radiographs calculated for both units showed mean values of 69.6 and 78.4 for unit 1 and 2, respectively. Only 8.3% of the radiographs of unit 1 present a QI in the range from 85 to 95, whereas for unit 2, 30.7% of the radiographs showed a QI in this range. This result is probably due the higher kV values used by the technicians for unit 2. This fact also contributes to the lowest image contrast observed for unit 2. As the two clinics used the same type of equipment and only the exposure parameters used by the technicians were different, it is necessary to optimize the x-ray acquisition parameters and the imaging protocols. In addition, the high percentage of radiographs with pos itioning errors requires improved training of the technicians.
382

REFERENCES
[1] INTERNATIONAL ATOMIC ENERGY ATOMIC, Dosimetry in Diagnostic Radiology: An International Code of Practice. International Atomic Energy Agency Technical Report Series (IAEA-I RS) n. 457. Vienna, 2007. 372 p.
[2] DOYLE, P.; MARTIN, C.J.; ROBERTSON, J. Techniques for measurement of dose-width product in panoramic dental radiography. The British Journal of Radiology, v. 79, 2006, pp. 142-147.
383


IDOS, Vienna, 9-12 November 2010 E2-CN-182, Paper No INV015
Influence of TRS-457 on dosimetric measurements in computed tomography
W. Skrzynski, W. Slusarczyk-Kacprzvk, W. Bulski
Department of Medical Physics, Centre of Oncology, Warsaw, Poland
E-mail address of main author: [email protected]
Dosimetric information for CT scanners is usually expressed in form of quantities based on integration of dose over a length of 100 mm (CTDIair l00, CTDIW, CTDIvol). The quantities have been adopted by manufacturers and users of the scanners, and are recommended in international [1], European [2,3], as well as several national guidances and regulations. Other dose indices exist, such as one defined by the FDA [4], but they are used less commonly (even requirements formulated by ACR are now expressed in terms of CTDIvoi [5]).
The code of practice published recently by the IAEA [6] introduces several new dosimetric quantities, which include CT air kerma indices (Ca,ioo, Cw, CVOL)- Despite different definitions, they are measured with the same equipment and are numerically equivalent to the dose-based indices. This is of particular importance, as manufacturers' specifications or diagnostic reference levels are usually expressed as CTDI-based quantities.
Dosimetric measurements are routinely performed to check proper functioning of the device. Such measurements are usually done during the acceptance tests [7], and then repeated periodically [8]. In both cases the results are compared against some reference values, either given by the manufacturer or established previously as a baseline. The IAEA code of practice serves as a practical step-by-step instruction on how to perform such measurements, from selection of equipment to calculation of results. It also includes useful guidance on calculation of uncertainty of the results, as well as information on the typical sources and values of the uncertainty. It does not, however, include suggestions on how to include the uncertainty in statements of compliance with specifications.
Either the CTDI- or C- based quantities can be used to compare doses between imaging protocols, scanners (example results in Table 1), or with diagnostic reference levels. Effective doses, which can be used for estimation of risk, can be calculated from such dose indices using factors based on Monte Carlo simulations, e.g. ones quoted in European Guidelines for MSCT |4]. Still, the indices are based on measurements in standardized phantoms of fixed size, and Monte Carlo simulations are done for models of typical patients. Current code of practice does not provide methodology of dose assessment for individual patient.
The code of practice does not cover dosimetry in cone beam CT systems, such as those installed on radiotherapy accelerators, radiotherapy simulators, and C-arms. Integration of kerma over a length of 100 mm does not provide meaningful dosimetric information for the cone beam geometry. Small volume cylindrical ion chamber, calibrated for medium energy kilovoltage X ray beams in accordance with TRS-398 [9], could be used instead. Different dosimetric quantities would be then used for fan-beam and cone-beam CT systems, making comparison of doses difficult. However, comparison of doses for patients should anyway be based on effective dose to be meaningful [10].
Since TRS-457 rather standardizes existing methodology of dosimetry in computed tomography than introduces a new one, its publication did not affect our practice significantly. Still, we find it very valuable, as it clarifies terminology and methodology of the measurements.
385

Table 1. Example results of dose measurements in CT (Cw [mGy], P#Z,CT [wGyXcm]).
GE
HiSpeed DX/i
GE LightSpeed
Pro 32
Toshiba Asteion VF Siemens Somatom
Emotion Duo
Philips Gemini 16 TF
(PET-CT)
GE
HiSpeed DX/i
GE LightSpeed
Pro 32 children (age <15y) adults
Siemens Somatom
Emotion Duo
Philips Gemini 16 TF
(PET-CT)
Cw PKL,CT C w PKL,CT Cw PKL,CT C w PKL,CT C w PKL,CT C w PRL,CT
head 16,4 294 61 1288 22,5 -43
228 -460 43 460 27,4 341,5 - -
pelvis 9,1 239 - - - - - - 6,5 121,4 - -
chest 10,7 323 15 653 3 ,8 -6,8
7 0 -125 8,5 212 - - - -
whole body - - - - - - - - - - 3,5 39,4
R E F E R E N C E S
[1] INTERNATIONAL ELECTROTECHNICAL COMMISSION, Medical Electrical Equipment -Part 2-44: Particular Requirements for the Safety of X-Ray Equipment for Computed Tomography, IEC 60601-2-44, 2002
[2] EUROPEAN COMMISSION, European Guidelines for Quality Criteria for Computed Tomography, Report EUR 16262, 2000
[3] EUROPEAN COMMISSION, European Guidelines for Multislice Computed Tomography, 2004
[4] FOOD AND DRUG ADMINISTRATION, Performance Standards for Diagnostic X-Ray Systems - Computed Tomography (CT) Equipment, Federal Register Rules and Regulations Ed 1/4/00 CFR Part 1020.33, 2000
[5] AMERICAN COLLEGE OF RADIOLOGY, CT Accreditation Program Requirements, Revised 3/26/10, ACR 2010
[6] INTERNATIONAL ATOMIC ENERGY AGENCY, Dosimetiy in Diagnostic Radiology: an International Code of Practice, IAEA TRS No. 457, 2007
[7] INTERNATIONAL ELECTROTECHNICAL COMMISSION, Evaluation and routine testing in medical imaging departments - Part 3-5: Acceptance tests - Imaging performance of computed tomography X-ray equipment, IEC 61223-2-6, 2004
[8] INTERNATIONAL ELECTROTECHNICAL COMMISSION, Evaluation and routine testing in medical imaging departments - Part 2-6: Constancy tests - Imaging performance of computed tomography X-ray equipment, IEC 61223-2-6 ed 2.0, 2006
[9] INTERNATIONAL ATOMIC ENERGY AGENCY, Absorbed Dose Determination in External Beam Radiotherapy: An International Code of Practice for Dosimetiy Based on Standards of Absorbed Dose to Water, IAEA TRS No. 398, 2000
[10] MURPHY MJ et al, The management of imaging dose during image-guided radiotherapy: Report of the AAPM Task Group 75, Medical Physics 34(10), 2007
386

IDOS, Vienna, 9-12 November 2010 E2-CN-182, Paper No INV015
Quality assurance protocol for digital intra-oral X ray systems
A, Jacobs, J. Nens, R. Jacobs, B. Vandenberghe, H. Bosmans
University Hospital Leuven, Katholieke Universiteit Leuven
E-mail address of main author: [email protected]
Introduction
In December 2008, a new Belgian legislation was published that concretizes the necessary tests to be performed to assure the physico-technical quality of dental systems'. Tests had been copied from a recently released Belgian protocol for yearly tests on dental systems, as compiled in a working group of the Belgian Hospital Physicists Association (BHPA). The Belgian legislator has copied the basic aims of the BHPA text to ensure appropriate doses and assure image quality of routine dental exposures. In practice, the exposure for the maxillary molar tooth is defined as the 'clinical exposure' and is studied in detail.
In the legislation, classical tests of tube output, voltage, filtration and exposure time are imposed. Every test of a digital intra oral x-ray system starts with the measurement of the detector dose for a standard molar setting. The load of tooth and cheek are simulated by a slab of 6mm aluminium. The dose limit is a 200(.iGy. When the dose exceeds this limit, the medical physics expert (MPE) has to investigate whether the procedures (exposure time, film type, ...) can be adjusted so that the dentist can work within the acceptability criteria.
In this report we will focus on 3 less common image quality tests that are also described in the legislation:
1. Dynamic range: A stepwedge, made of 5 aluminium steps with different thickness ranging from 2.5mm to 9mm has to be imaged with the clinical exposure. On the image, the 5 steps should be clearly visible.
2. Homogeneity: An image of a homogeneous test slab is visually inspected. There should not be clinically disturbing artefacts.
3. Resolution: The resolution of clinical exposures is tested with a testobject with line pairs on top of 2 cm PMMA. The resolution should not be lower than 5 lp/mm
Material and methods
The protocol was successfully tested on 64 systems. This included 13 film systems, 33 systems with phosphorplates and 18 systems with a CCD detector. The systems are from the following vendors: Trophy (19), Kodak (4), Sirona (10), Soredex (8), Gendex (4), Planmeca (9), Philips (3), Satelec (2), Belmont (1), Villa (1), MyRay (1), Morita (1) and Owandy (1).
Results and discussion
(1) Dynamic range: Figure 1 shows on the left an example of a system where the routine settings led to overexposure. With the overexposure, only 1 step of the stepwedge is visible. In clinical practice, there was indeed no contrast in the images, only black and white. It was possible to readjust the system. On the right, a correct exposure is shown. Readjustments were proposed in more then 90 percent of the systems.
387
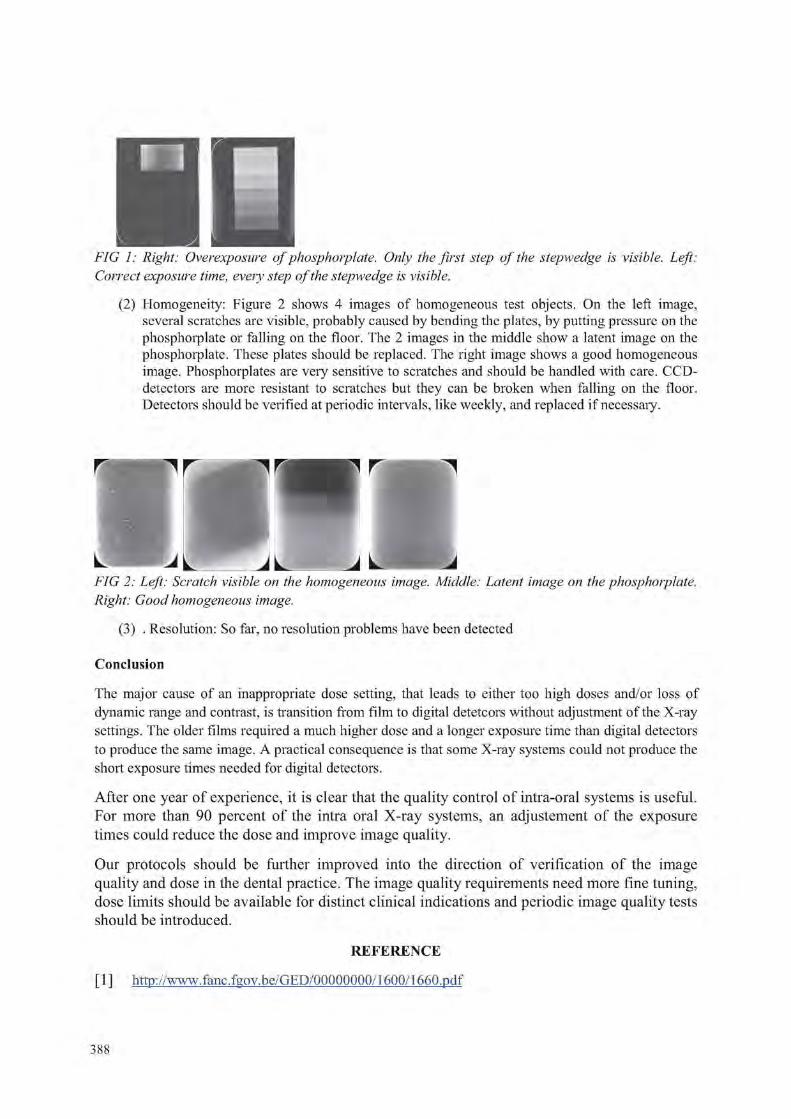
• FIG I: Right: Overexposure of phosphorplate. Only the first step of the stepwedge is visible. Left: Correct exposure time, every step of the stepwedge is visible.
(2) Homogeneity: Figure 2 shows 4 images of homogeneous test objects. On the left image, several scratches are visible, probably caused by bending the plates, by putting pressure on the phosphorplate or falling on the floor. The 2 images in the middle show a latent image on the phosphorplate. These plates should be replaced. The right image shows a good homogeneous image. Phosphorplates are very sensitive to scratches and should be handled with care. CCD-detectors are more resistant to scratches but they can be broken when falling on the floor. Detectors should be verified at periodic intervals, like weekly, and replaced if necessaiy.
FIG 2: Left: Scratch visible on the homogeneous image. Middle: Latent image on the phosphorplate. Right: Good homogeneous image.
(3) . Resolution: So far, no resolution problems have been detected
Conclusion
The major cause of an inappropriate dose setting, that leads to either too high doses and/or loss of dynamic range and contrast, is transition from film to digital detetcors without adjustment of the X-ray settings. The older films required a much higher dose and a longer exposure time than digital detectors to produce the same image. A practical consequence is that some X-ray systems could not produce the short exposure times needed for digital detectors.
After one year of experience, it is clear that the quality control of intra-oral systems is useful. For more than 90 percent of the intra oral X-ray systems, an adjustement of the exposure times could reduce the dose and improve image quality.
Our protocols should be further improved into the direction of verification of the image quality and dose in the dental practice. The image quality requirements need more fine tuning, dose limits should be available for distinct clinical indications and periodic image quality tests should be introduced.
REFERENCE
[1] http://www.fanc.fgov. be/GED/00000000/1600/1660.pdf
388

IDOS, Vienna, 9-12 November 2010 E2-CN-182, Paper No INV015
Commissioning two constant potential X ray sets for the calibration of diagnostic dose and dose rate instruments by achieving IEC 61267-2005
beam qualities using end point photon spectrometry
D H Temperton, J E Palethorpe, P R Austin, D E Delahunty
RRPPS, University Hospitals Birmingham NHS Foundation Trust, Birmingham, UK
E-mail address of main author: [email protected]
Introduction
RRPPS provides traceable calibrations for about 400 diagnostic dosemeters each year. Until July 2009, these calibrations were undertaken on Pantak HF-320 and HF-160 x-ray sets fitted with COMET (Liebfeld Switzerland) metal ceramic x-ray tubes, both with tungsten targets. The inherent filtration is 3mm Be for the MXR-320 tube and 1mm Be for the MXR-160 tube. Calibrations were performed in accordance with IEC 1267:1994-09' as described previously2. To achieve all standard radiation qualities RQR and the standard radiation quality RQC (for fluoroscopy automatic brightness control adjustment), auxiliary filters were fitted to a filter wheel with the HF-320 set and manually inserted into the beam with the HF-160 set.
In July 2009 RRPPS moved to new premises where new 160kVp and 300 kVp x-ray units (Gulmay Medical Ltd, Camberley, Surrey, UK) were installed with the XRC1 x-ray calibration system and CP160 generators. The 300 kV set utilises 2 generators. The existing tubes from the old premises were transferred to the new units.
The new sets have been commissioned against IEC 61267-20053. In order to accommodate the 9 standard radiation qualities RQR, 2 extra RQC qualities and 3 new RQT qualities for CT applications, larger filter wheels were required. The wheel on the 300 set incorporates 11 slots and the 160 set has 2 overlapping wheels enabling 21 filter combinations. The overlapping wheel provides the additional filtration required for the RQT and RQC qualities.
Method
The x-ray tube voltage, kV, was determined using the calibrated photon spectrum end point method as described previously . Photon spectrometry was performed with a GL0110P Low Energy Germanium detector (LEGe), an Eagle 5004 multi-channel analyser and Genie 2000 spectroscopy software
* ' ' ' 241 133 57
(version 3.2.1) (Canberra Ltd, Didcot, UK). The system was calibrated with ~ Am, Ba and " Co sources. Radiation air kerma rates were measured with a Radcal (Monrovia, USA) 9015 radiation monitor, 9060 electrometer and 10X5-6 chamber. The dosemeter's calibration, against the IEC 61267-2005 radiation qualities, is traceable to the National Physical Laboratory. The thickness of auxiliary aluminium filtration needed to achieve the first half value layer (HVLl) stipulated by the standard to within the required ±0.1 mm tolerance was determined via an iterative process for the RQR qualities. The second HVL (HVL2) was measured to confirm that the homogeneity coefficient (HVLi/HVLO agreed with the standard to within the required ± 0.03 tolerance.
The RQC and RQT radiation qualities were achieved by adding the thickness of copper filtration as stipulated in the standard added to the relevant RQR aluminium filtration.
All aluminium and copper filters were of at least 99.9% purity (Advent Research Materials, Oxford, UK).
389

Results
Sample resu' ts for the 300 kV system are given below as an example. Radiation Quality
Displayed kVcp
Measured kVcp
Added filter mm
Al
Measured 1IVL, mm
Al
Required value4
mm Al
Measured homogeneity
coefficient
Required value4
RQR 3 50 49.9±0.5 2.61 1.78 1.78 0.76 0.76
RQR 4 60 59.7±0.6 2.61 2.18 2.19 0.74 0.74
RQR 5 70 69.410.7 3.07 2.57 2.58 0.71 0.71
RQR 7 90 88.610.9 3.62 3.53 3.48 0.68 0.68
RQR 9 120 118.2+1.2 4.07 5.08 5.00 0.69 0.68
Radiation Quality Displayed kVcp Added filter, mm Cu
Measured HVLi mm A l
Nominal HVL mm Al
RQC 3 50 0.49 4.5 4.5
RQC 5 70 1.49 8.4 8.4
RQC 8 100 2.00 11.5 11.5
RQT 8 100 0.20 6.9 6.9
RQT 9 120 0.25 8.4 8.4
RQT 10 150 0.30 10.1 10.1
Conclusion
By using the end point spectrum method for determining tube voltage on stabilised constant potential sets and establishing the first HVL as required by the standard, the necessary homogeneity values were obtained for the RQR series and the necessary first HVLs were obtained for the RQC and RQT series.
REFERENCES
[1] CEI IEC 1267:1994 Medical diagnostic x-ray equipment - radiation conditions for use in the determination of characteristics (Geneva, Switzerland: IEC) (1994)
[2] GREEN,S. et.al. Development of a calibration facility for test instrumentation in Diagnostic Radiology. Radiat.Prot. Dosim., 67, 41-46 (1996)
[3] CEI IEC 61267: 2005 Medical diagnostic x-ray equipment - radiation conditions for use in the determination of characteristics (Geneva, Switzerland: IEC) (2005)
390
IDOS, Vienna, 9-12 November 2010 E2-CN-182, Paper No INV015
Calibration of OSL dosimeters according to the IAEA code of practice for diagnostic radiology dosimetry TRS-457
M.B. Freitas3, R.H.C. Alvesb, E.M. Yoshimurab
"Universidade Federal de Sao Paulo (UNIFESP), Sao Paulo-SP, Brazil b
Institute) de Fisica da Universidade de Sao Paulo (IFUSP), Sao Paulo-SP, Brazil
E-mail address of main author: [email protected]
Applications of optically stimulated luminescence (OSL) in medical dosimetry have increasing in recent years [1], including in diagnostic radiology. Although the use of OSL dosimeters as passive solid state detectors in x-ray dosimetry is similar to thermoluminescent dosimeters (TLD), the calibration process of the main material used as OSL dosimeter in medical dosimetry (aluminum oxide - A1203) requires more attention because its over-response to low-energy x-rays with respect to tissue.
Despite of proper calibration can be obtained by irradiation in a beam quality consistent with the field to be evaluated, many laboratories use different qualities and standards, some of which may be unsuitable, making it difficult to achieve the traceability of dose measurements in the clinic.
In this study, OSL dosimeters were calibrated considering the beam qualities and standards recommended by the IAEA code of practice for diagnostic radiology dosimetry - TRS457 [2]. The effect of accuracy and precision of a particular OSL dosimeter and reader on the overall uncertainty also were investigated.
The OSL readout was performed using a commercial system (Landauer Inc.) consisting of a portable reader (microStar™) and OSL dosimeters of carbon-doped aluminum oxide (A1203:C) as material detector (InLight™ Dot and nanoDot dosimeters). This reader uses the continuous-wave OSL (CW-OSL) stimulation modality and initial intensity as OSL signal. Reproducibility of the OSL signal for repeated irradiations and reader stability were determined. The influence of the light sensitivity and procedures of dosimeter preparation, handling, irradiation and readout, among these optical illumination (bleaching), fading, transient signals, directional and field-size dependence, were evaluated over the energy range of use and doses usually found in diagnostic radiology.
Irradiations were carried out with a constant potential X-ray system, using both calibrated ionization chambers of small volume and radiation qualities with traceable calibration. X-ray beam was characterized by measurement of first and second HVL and x-ray tube voltage was measured with a calibrated non-invasive device. OSL dosimeters were calibrated according to the beam qualities established in the IAEA code of practice TRS457 [2] for each modality in diagnostic radiology: general radiology, fluoroscopy and dental applications - RQR and RQA, computed tomography -RQT, and mammography - RQR-M and RQA-M.
The preliminary results support that the calibration of OSL dosimeters should be carried out with an X-ray quality typical of those to which the dosimeters will be exposed during the course of measurements in the clinical conditions. Special attention must be given to procedures of bleaching, irradiation and readout of OSL dosimeters in order to reduce to the overall uncertainty in the dose determination from OSL dosimeters in diagnostic radiology.
391

R E F E R E N C E S
[1] YUKIHARA, E.G., McKEEVER, S.W.S., Optically stimulated luminescence (OSL) dosimetry in medicine, Phys. Med. Biol. 53 (2008) R351-R379.
[2] INTERNATIONAL ATOMIC ENERGY AGENCY, Dosimetry in diagnostic radiology: an international code of practice, Technical Reports Series No. 475, IAEA, Vienna (2007).
392
IDOS, Vienna, 9-12 November 2010 E2-CN-182, Paper No INV015
Quality assurance of automatic exposure control devices for digital radiography: Belgian approach
J. Nens, working group BHPA, A. Jacobs, N. Marshall, H. Bosnians
UZ-Leuven, Radiologic - LUCMFR, BELGIUM
E-mail address of main author: [email protected]
Introduction
Since 2001, an annual quality control of medical X-ray equipment by a medical physics expert (MPE) is obligatory in Belgium. The minimal standards that a system should achieve are defined in the RP91 document [1], After some years of experience, there was a consensus that the MPE activities would benefit from a more explicit text that would take full acount of the challenges of the on-going digitization. A working group of Belgian physicists was formed within the Belgian Hospital Physicists Association to create a more extended and detailed protocol, to harmonize the test procedures among the physicists and to test digital detectors appropriately. The aim of the group was to make sure that image quality and patient dose are well balanced and that the automatic exposure controler functions well for all conditions of beam quality and patient thickenss.
The most important chapter of the new Belgian protocol concerns the testing of the AEC for digital radiography detectors (DR) and computed radiography plates (CR). These tests are not described in the RP91. Conventional X-ray systems using film radiography have to give similar optical densities. On digital systems, the optical density is fixed by the processing and not at all related to exposure. The approaches to test film-screen can therefore not be applied to digital detectors.
The hypothesis of the test procedure is the following: as the image quality of a digital detector is not contrast limited but dose limited, it is the amount of noise in the image which limits the image quality (1). Therefore, the goal of the AEC calibration should be to keep the SNR constant at all thicknesses and beam qualities. As described by Doyle and Martin, we aim to control the SNR by measuring the exposure indication (EI) or pixel value (PV) of the detector. We report on a practical approach, that has been developed in our team.
Material and method
We propose a 2-step approach:
L Determination of the dose response function of the detector: 1.5 mm Cu is fixed to the tube and the dosemeter is positioned on the table in the center of the X-ray beam. CR plates are put on the table; for DR detectors the grid is removed if possible. 4 exposures with 81 kV and about 1,4, 12 and 30 [.iGy are made. The dose response function between the measured doses and exposure indications (EI) or pixel values (PV) is calculated. The inverse dose response function linearizes all measured EI or PV. The value after application of the inverse function on EI or PV is called linearised exposure indication (LEI). Using this LEI allows to apply the same limiting values to all systems. Only at 81kV and when using the same geometry as for the measurements, the LEI is numerically identical to the detector dose. For other beam qualities, the LEI tells which detector dose at 81kV (and for the same geometry) would produce the same SNR. The LEI based approach simplifies tests at different tube voltages as it is not defined by the detector dose (and would hence require an energy sensitivty correction facor) but by SNR in the detector.
393

2. Verification of the LEI for different thicknesses of PMMA, for different tube voltages and for different combinations of AEC cells using the preprogrammed abdominal program. We require that deviations in LEI should be lower than 20%. For repeated exposures the LEI should not deviate more then 10%.
3. The LEI for a routine exposure at 20cm of PMMA should be lower than 5 |iGy, and ideally be in [1 - 2 |iGy] for DR and [2 - 3(.iGy] for CR
The method was developed on 5 different CR models and 4 different DR models and was then applied in the frame of the annual quality control procedures on 60 X-ray systems of different make and vendor.
Results and discussion
On all systems with access to the relevant EI or PV, the proposed procedure could be performed successfully. In Belgium, access to the so-called raw data was achieved in all hospitals. We approached the CR manufactorers to give access to EI or PV also in the private practices.Using the digital detector as a dosemeter with this method solves three practical problems. A first problem is to have to place an expensive solid state detector in an even more expensive bucky. A second problem is that a solid state detector in the buckychanges the backscatter at the AEC cells and could affect the AEC working. Third, the solid state dosimeter is not intended for this application. The introduction of the LEI has some advantages. All shapes of EI or PV as a function of dose can be input. At 81 kV and 20 cm PMMA with grid, it showed that the LEI can even be used as an estimation of the detector dose. For abdomen acquisitions made with the CR systems, the LEI fluctuated from 1 to 10 liGv (Fig 1). For DR systems, the LEI varied from 1 to 3 jrGy. On several systems, corrective actions were intitiated. The main problems were seen with CR systems that had not been readjusted after the switching from film-screen to CR. Occasionanly doses were too low.
After 3 years of performing this test, 42 systems passed the thickness compensation test, 3 systems still fail for this test. The distribution of the maximum deviation is shown in figure 2 for the tested DR and CR systems. During the last 3 years, about 7 systems were readjusted for the thickness compensation and 2 old systems had to be replaced because readjustment did not solve the problem. For the kV compensation test, 34 systems passed the test, 11 systems still fail. Figure 3 shows the maximum deviations for the tested DR and CR systems. In the beginning of this year, we contacted several manufactures with problematic systems to have a coordinated approach to solve these problems. All systems with kV compensation problems should be readjusted by the end of this year.
The protocol fulfilled 3 basic requirements: The method is applicable on all digital detectors. The test is easy and non invasive. It avoids having to place an expensive dosimeter in a bucky. Finally, the test is fast (less than 1 hour/system).
Num
ber o
f sys
tem
s M
UM
N'
OJ
.b
'-
nC
n-
^'
X'
VS
O Detector Dose with 20 cm
.III PMtVIA
1 • DR
• CR
1 1.5 2 2.5 3 3.5 More Detector dose (nGy)
FIG 1 Detector dose distribution (for DR and CR systems) measured with 20 cm PMMA and 81 kV.
394

14
12
5 10
Th ickness c o m p e n s a t i o n
i DR
ICR
I . I 5% 10% 15% 20% 25% 30% 35% More
Maximum deviation
FIG 2 Distribution of the deviations of the thickness compensation test measured on DR and CR systems.
12
10
6 -
kV compensation
I DR
ICR
J U _ L 5% 10% 15% 20% 25% 30% 35% More
Maximum deviation
FIG 3 Distribution of the deviations of the kV compensation test measured on DR and CR systems.
R E F E R E N C E S
[1] EUROPEAN COMMISSION. Criteria for acceptability of radiological (including radiotherapy) and nuclear medicine installations. Radiation Protection 91, 1997
[2] P. DOYLE and CJ MARTIN, Calibrating automatic exposure control devices for digital radiography, Physics in Medicine and Biology,2006
395


IDOS, Vienna, 9-12 November 2010 E2-CN-182, Paper No INV015
Skin doses to patients during CT perfusion of the liver
A. Beganovica, I. Sefic-Pasicb, M. Gazdic- antic". A. Drljevica, A. Skopljak-Beganovica
a Department of Medical Physics and Radiation Safety, Clinical Centre of Sarajevo University, Sarajevo, Bosnia and Herzegovina
Radiology Clinic, Clinical Centre of Sarajevo University, Sarajevo, Bosnia and Herzegovina
E-mail address of main author: [email protected]
Perfusion imaging provides the ability to detect regional and global alterations in organ blood flow. Computed tomography (CT) scanners are widely used nowadays for this purpose. One of the issues regarding this imaging technique is the high skin dose. There have been several reports on deterministic effects of radiation (erythema and hair loss).
This study shows results of skin doses for the CT perfusion of liver. The skin dose was measured using cut-out of the ISP's Gafchromic film XR-RV2 (Fig. 1) that was placed on patient's skin during the examination (on top and right side of the patient). Gafchromic films were primarly used for patient dosimetry in interventional radiology [1-3], but they can be used in computed tomography too [4], After the exposure blackening of the film was measured using transmission densitometer, optical density was converted to the dose using calibration data (Fig. 2). Calibration data was previously obtained by exposing Gafchromic films and electronic dosimeter (RTI's Barracuda with multi-purpose detector). Figure 2 shows increase in optical density with air-kerma.
The imaging parameters used on CT scanner were 120 kVp and 50 mAs/rotation. These values are part of the standardized protocol on the specific CT scanner. Number of patients evaluated was 15 (10 females, 5 males) and average size (70±10 kg). The mean value of the skin dose at the top and on the right side of the patient during this procedure was 0.49±0.07 Gy and 0.41±0.06 Gy, respectively.
The results between different patients are similar. This is due to the fact that same imaging parameters are used and patient's size was similar. If these were changed according to the patients' weight and/or size, the skin dose would have been much higher. No deterministic thresholds were breached and it very unlikely those effects will appear after one examination.
The dose is relatively high, and repeated (time-lapse) studies could cause such problems. This was the case in most of the reported cases.
FIG. 1. GAF Chromic film exposed during CT perfusion
397
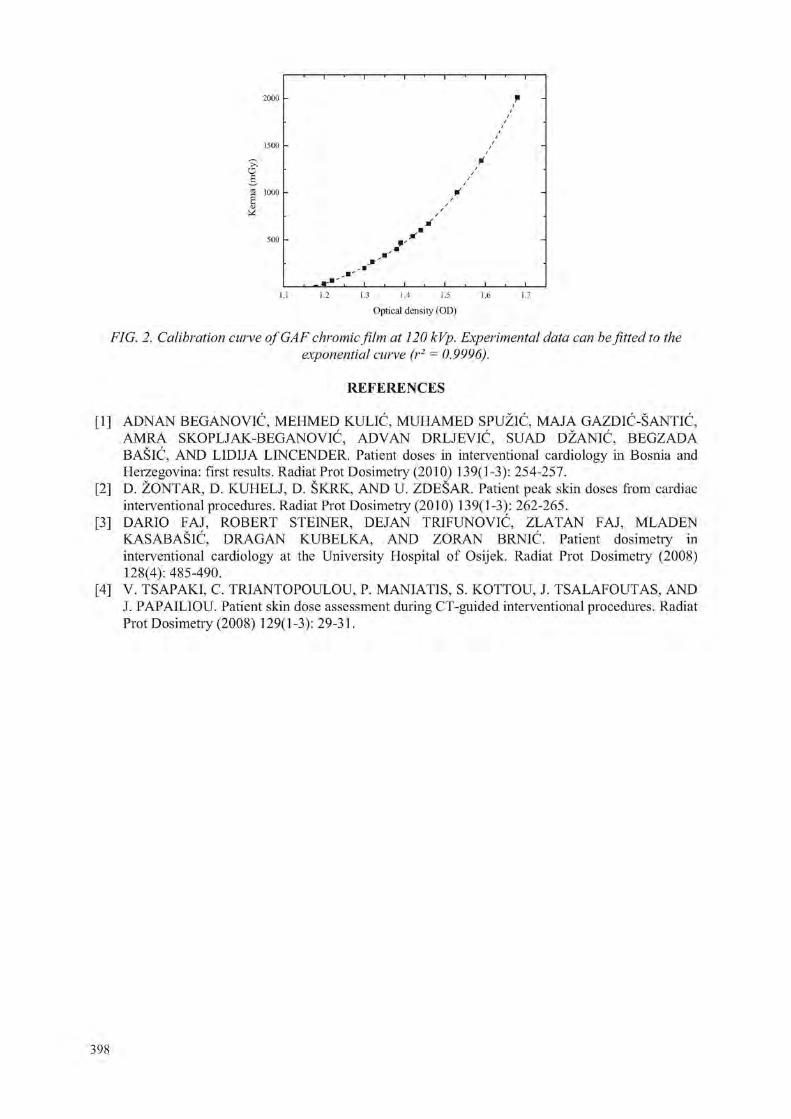
o g 1000
1.1 1.2 1.3 1.4 1.5 1.6 1.7
Optical density (01))
FIG. 2. Calibration curve of GAF chromic film at 120 kVp. Experimental data can be fitted to the exponential curve (r2 = 0.9996).
R E F E R E N C E S
[1] ADNAN BEGANOVIC, MEHMED KULIC, MUHAMED SPUZIC, MA.IA GAZDIC-SANTIC, AMRA SKOPLJAK-BEGANOVIC, ADVAN DRLJEVIC, SUAD DZANIC, BEGZADA BASIC, AND LIDIJA LINCENDER. Patient doses in interventional cardiology in Bosnia and Herzegovina: first results. Radiat Prot Dosimetry (2010) 139(1-3): 254-257.
[2] D. ZONTAR, D. KUHELJ, D. SKRK, AND U. ZDESAR. Patient peak skin doses from cardiac interventional procedures. Radiat Prot Dosimetiy (2010) 139(1-3): 262-265.
[3] DARIO FAJ, ROBERT STEINER, DEJAN TRIFUNOVIC, ZLATAN FAJ, MLADEN KASABASIC, DRAGAN KUBELKA, AND ZORAN BRNIC, Patient dosimetry in interventional cardiology at the University Hospital of Osijek. Radiat Prot Dosimetry (2008) 128(4): 485-490.
[4] V. TSAPAKI, C, TRIANTOPOULOU, P. MANIATIS, S. KOTTOU, J. TSALAFOUTAS, AND J. PAPAILIOU. Patient skin dose assessment during CT-guided interventional procedures. Radiat Prot Dosimetry (2008) 129(1-3): 29-31.
398

IDOS, Vienna, 9-12 November 2010 E2-CN-182, Paper No INV015
Dose survey in Moroccan pediatric university hospitals: Impact of a preliminary work in diagnostic radiology
F. Bentayb1, K. Nfaoui1, O. El Bassraoui1, A.C Pedrosa Azeedo1,2
1 Faculte Des Sciences, Rabat, Morocco
o " Secretaria de Saude e Defesa Civil, Sup. De Vigilancia Sanitaria
E-mail address of main author: [email protected]
The quality control in radiology and standardization of radiological practices represent key factors for optimization of patient dose and radiation protection. In this context, work done by our team [1, 2] has shown that simple and achievable initiatives can be applied to optimize radiological procedures and subsequent dose reduction. Application of suggestions proposed in the light of this work and discussed with the concerned persons in the hospitals, is in progress. Preliminary results already show that it is possible to evolve, with the mutual efforts of research team members and professionals to establish a system of quality control in radiology departments in our Country.
The preliminary study has been conducted in Moroccan university hospitals. Work consists on realisation of control quality procedures for evaluation of viewing boxes [1] and developers [2], Evaluation of patient dose has been also considered which a part of results concerning children has been submitted to an International Journal and part concerning adults is being prepared for submission. Results show that:
The major part of viewing boxes presents deficient box luminance and they are very inhomogeneous. Some simple and cheap actions can be introduced in the radiology departments such as bulbs replacement, cleaning and painting the inner surface of the viewing boxes with brilliant ink in order to help light diffusion inside the box. It should also be remembered that the fluorescent bulbs decrease their intensity at the rate of 20 % a year and should therefore be replaced annually to keep a good luminance performance.
From the evaluation of processing speed study, it can be seen that 50 % of processors present under-development and 50 % are working within the limits. Under-development may cause an increase in the dose imparted to the patient since to obtain the proper optical density and film blackening, more radiations is needed. This is generally achieved by increasing the radiographic technique (KV, mAs, time, etc...) and consequently, the risk to the patient.
Some measures such as management of developing products and machine temperature can improve the image quality.
Evaluation of patient dose study showed that in most cases the values correspond to the values of Diagnostic Reference levels. In the same hospital and sometimes in the same room, we can observe great diversity of values. This means to standardize radiological practices. A meeting was held in this direction with the staff of some hospitals and steps are underway to standardize practices.
The realisation of measurements by applying the optimisation measures in the light of suggestions made by our research team work is underway.
399

Conclusion
Quality Assurance in Diagnostic Radiology is of paramount importance in diagnostic radiology, we have seen that it is our duty to do this work in order to participate to standardize the radiological practices first and work the system basis of control quality in radiology. These methods are well established in developed countries, but in our country the way is still long to establish a quality assurance system. In my opinion there is a start to everything and this work represents a beginning of a radiation protection program in our country.
REFERENCES
[1] F. BENTAYEB, K. NFAOIU, O.BASRAOUI, A.C.P. AZEVEDO, Viewing boxes: A survey in diagnostic radiology departments of Moroccan hospitals, Received 16 May 2009; received in revised form 14 September 2009; accepted 20 November 2009; Available online 24 December 2009.
[2] K. NFAOIU, F. BENTAYEB, O.BASRAOUI, A.C.P. AZEVEDO, Using the "STEP Test" to evaluate processing speed in Moroccan hospitals, Received 8 May 2009; received in revised form 6 November 2009; accepted 20 November 2009; Available online 6 December 2009.
400
IDOS, Vienna, 9-12 November 2010 E2-CN-182, Paper No INV015
Patient dosimetry in radiography examinations and establishment of national diagnostic reference levels in Ukraine
M. Pylypenko, L. Stadnyk, O. Shalyopa, O. Gur
Grigorev Institute for Medical Radiology, Kharkiv, Ukraine
E-mail address of main author: [email protected]
Optimization of radiation protection in diagnostic radiology can be possible only due to some measures to reduce of patients doses from most wide-spread medical examinations with condition to provide the quality of diagnostic information.
With the International Basic Safety Standards (BSS-115) the guidance levels of patient doses for diagnostic radiography were established and different countries can use these values until national diagnostic reference levels are accepted.
In Ukraine in 2009 the pilot scientific investigation of patient doses in diagnostic radiology is started. The main purposes of this work are to study the structure of X-ray diagnostic examinations, current state of X-Ray diagnostic units in Ukraine and the parameters of different radiography examinations for 'standard' patient by questionnaire way of all regional X-Ray Diagnostic services in Ukraine, to determine the radiation output of X-ray units in different hospitals, to measure the patient doses for 5 main wide-spread radiography examinations (chest; cervical spine, thoracic spine, lumber spine, pelvis for PA, AP, LAT projections).
The radiation measurements of radiation parameters were carried out for 52 X-ray diagnostic units of 18 large hospitals from seven Ukrainian Regions. The entrance surface doses were determined more than for 1400 patients.
The ionization and thermoluminescence dosimetry methods were used for measurements. The radiation output was measured using dosimeter TRIAD model 10100A (Keithly, USA). The entrance surface doses were determined using TL-detectors LiF type MTS-N (Poland) and TLD-reader PCL3 (France).
The first measurements have shown that for different types of X-ray units the values of entrance surface doses could differ in 20-145 times. The maximum average patient doses were observed for thoracic spine and lumber spine diagnostic examinations.
For chest X-Ray examination (PA) the patient dose range was 0.1 - 7.4 mGy, the average dose is 0.9±0.1 mGy, third quartile - 0.8 mGy. For thoracic spine examinations (AP) the patient dose range was 0.9 - 125 mGy, the average dose is 13.7±2.4mGy, third quartile - 15.0 mGy, for thoracic spine examinations (LAT) the patient dose range was 1.1- 122 mGy, the average dose is 22.4±4.5 mGy, third quartile - 20.0 mGy. For lumber spine diagnostic examinations the patient dose ranges were 2.6 - 106 mGy (AP) and 6.5 - 130 mGy (LAT), the average doses are 17.0±1.7 mGy (AP) and 39.5±2.7 mGy (LAT), third quartiles - 22.0 mGy (AP) and 47.0 mGy (LAT). For pelvis examinations (AP) the patient dose range was 0.9-48 mGy, the average dose is 15.3±2.1 mGy, third quartile-22.0 mGy. The values of third quartiles of distributions of doses for chest examination (PA), thoracic spine examinations (AP, LAT), lumber spine examinations (AP,LAT) are more than values for corresponding values of guidance levels of patient doses for diagnostic radiography the IAEA BSS-115 in 1.5-2.0 times.
401
The measurements of patient doses in Ukrainian hospitals are continuing. For establishment of national diagnostic reference levels for main diagnostic radiography examinations the distribution of patient doses will be studied.
402

IDOS, Vienna, 9-12 November 2010 E2-CN-182, Paper No INV015
A tandem system for quality control in mammography beams
J. O. Silva, L. V. E. Caldas
Instituto de Pesquisas Energeticas e Nucleares (IPEN-CNEN/SP) Sao Paulo, Brazil
E-mail address of main author :jonas. [email protected]
A tandem ionization chamber system has been developed to be applied in mammography energy range dosimetry [1]. This system consists of two ion chambers with different collecting electrode materials: aluminum and graphite. Both chambers have a sensitive volume of 6 cm' that is suitable for the mammography range. Characteristics as saturation, ion collection efficiency, linearity of chamber response versus air kerma rate and energy dependence were determined. The results of energy dependence allowed the determination of the tandem curve. The advantage of this system is that it can be used in the determination/confirmation of half-value layers (without the use of absorbers) in quality control programs of X-rays. All measurements were carried out in the Calibration Laboratory of IPEN.
The ionization chambers were irradiated in a Pantak Seifert Isovolt 160HS X-ray system with a tungsten target that operates from 5 to 160 kV (the currents can be varied between 0.1 and 45 mA). This equipment has an inherent filtration of 0.8 mmBe. The detectors where exposed to mammography radiation qualities presented in Table 1 [2].
Table 1. Mammography radiation qualities used in this work for a current of 10 mA and an additional filtration of 0.07 mm Mo
Radiation Tube Voltage Half-Value Layer Quality (kV) (mmAl)
WMV25 25 0.36 WMV28 28 0.37 WMV30 30 0.38 WMV35 35 0.41
The measurements taken by the ionization chamber system proposed in this work were compared with those taken with the reference ionization chamber Radcal RC6M, calibrated at PTB.
The ion collection efficiency for both ionization chambers was higher than 99.0%, as recommended for ionization chambers [3]. For the linearity test the ionization chambers were exposed to the WMV28 radiation quality. Ten air kerma values were measured with the chambers; for each point five measurements were taken and the mean values were considered. The results for the linearity test are presented in Fig. la, with correlation coefficients of 0.99999 for the aluminum and 0.99997 for the graphite colleting electrode ionization chambers. For the energy dependence test the ionization chambers were exposed to the radiation qualities presented in Table 1. The calibration factors were determined using the reference ionization chamber. These test results are presented in Fig. lb, as a tandem curve, where the tandem factor is defined as the ratio between the responses of both ionization chambers. This curve allows the confirmation and determination of effective energies of unknown X-ray beams. The response variation for aluminum collecting electrode it was 3.3% and for graphite collecting electrode it was only 0.06%. The standard deviation values were lower than 1.0%, therefore not visualized in Fig. lb.
403
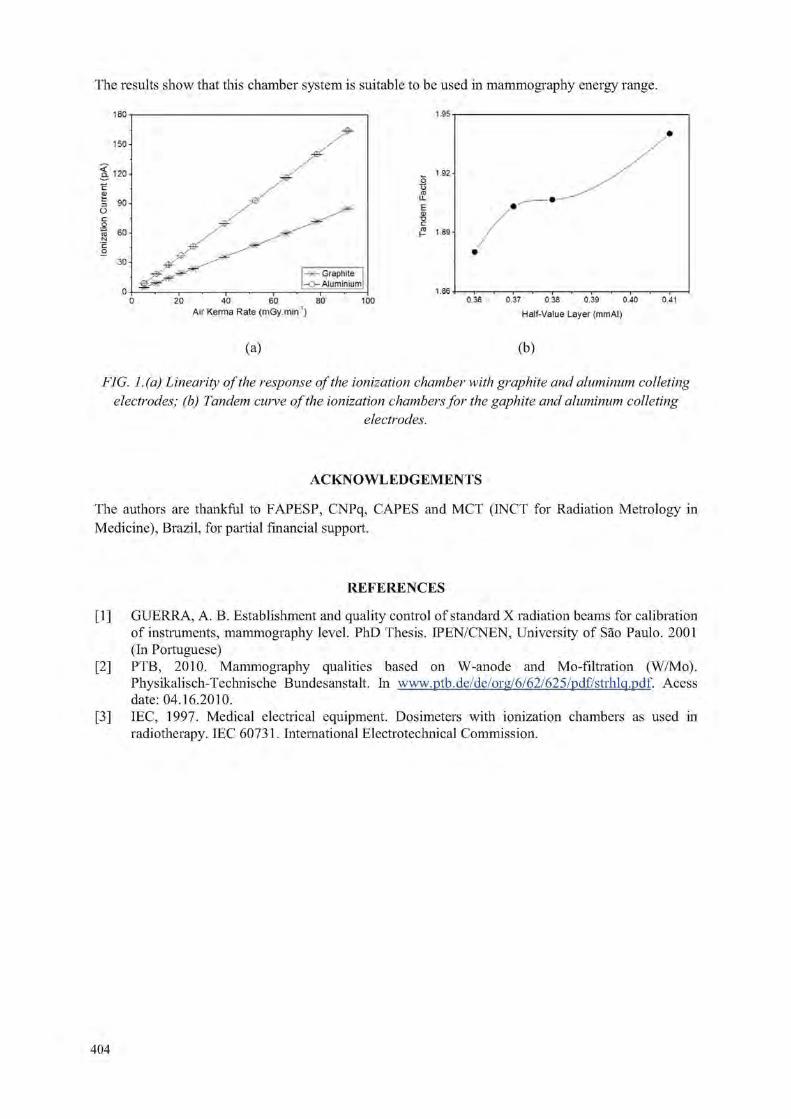
The results show that this chamber system is suitable to be used in mammography energy range.
Air Kerma Rate (mGy.min )
1.95
w 1 92
3 u- ... •—-E * oj / "O / p i.sa-
1 . 8 6 • f r> i i i i i ) i i
0.36 0.37 0.38 0.39 0.40 0.41
Half-Value Layer {mmAI)
(a) (b)
FIG. I. (a) Linearity of the response of the ionization chamber with graphite and aluminum colleting electrodes; (b) Tandem cutve of the ionization chambers for the gaphite and aluminum colleting
electrodes.
A C K N O W L E D G E M E N T S
The authors are thankful to FAPESP, CNPq, CAPES and MCT (INCT for Radiation Metrology in Medicine), Brazil, for partial financial support.
R E F E R E N C E S
[1] GUERRA, A. B. Establishment and quality control of standard X radiation beams for calibration of instruments, mammography level. PhD Thesis. IPEN/CNEN, University of Sao Paulo. 2001 (In Portuguese)
[2] PTB, 2010. Mammography qualities based on W-anode and Mo-filtration (W/Mo). Physikalisch-Technische Bundesanstalt. In www.ptb.de/de/org/6/62/625/pdf/strhlq.pdf. Acess date: 04.16.2010.
[3] IEC, 1997. Medical electrical equipment. Dosimeters with ionization chambers as used in radiotherapy. IEC 60731. International Electrotechnical Commission.
404

IDOS, Vienna, 9-12 November 2010 E2-CN-182, Paper No INV015
Evaluation of radiation dose and image quality in computed tomography in Rio de Janeiro, Brazil.
F. A, Meccaa, S. Kodlulovichb, L. Concei?aoc
a' National Institute of Cancer - INCa
c Federal University of Rio de Janeiro
E-mail address of main author: [email protected]
The aim of this work was to evaluate the dose index and the image quality in seventeen computed tomography scanners installed in radiology departments at the city of Rio de Janeiro in order to analyze adults and pediatrics protocols and to evaluate the possibility of a dose reduction in routine procedures. The age of the scanners varied between 2 and 14 years old.
The dose index weighted normalized (nCTDIw) was estimated for all equipments with the RADCAL dosimetric set and the cylindrical phantom. Pediatric and adult scanning parameters were collected for cranial, chest, high-resolution chest, abdomen and pelvis CT procedures. The CTDIvol and DLP values were estimated for each routine protocol based on the nCTDIw. To evaluate the image quality, the American College of Radiology (ACR) accreditation phantom (Gammex, 464) was used [2]. The following parameters were investigated according to the procedure manual of the ACR phantom: CT number calibration, slice thickness accuracy, low and high contrast resolution, uniformity, noise and artifacts.
The CTDIvol distribution obtained in this study is presented in the Figure 1. For the head scans, the values of CTDIvoI varied between 9 and 109 mGy and the PKL from 160 to 2000 mGy.cm for adults. Values for abdomen scans varied between 8 and 94 mGy and the DLP from 180 to 3700 mGy cm for adults and CTDIvoi from 3 to 54 mGy and DLP from 46 to 1300 mGy cm for children. Similar ranges were found for hi-resolution chest scans. The 75 percentiles in the distribution of CTDIvoi and PKL obtained in this survey was lower that the DRL European guidelines. However in all CT procedures, substantial differences were observed in patient radiation doses, for the same anatomic structure, in the different centers even in the same country. The large range of results reported reveals the differences in the techniques used at the centers of all participating radiology centers in Rio de Janeiro.
b National Comission of Nuclear Energy
120 100
f 80
I I
I I I I High resolution Chest Abdomen Head
x Pediatric abdomen
I T
o
0 0 5 10 15
Equipment
20
FIG 1: Distribution of CTDIvol for all routine procedures
405

Despite of the importance of the accuracy of CT number, only one scanner complies the international requirements. The low contrast resolution and the uniformity criteria weren't accomplished in two different scanners. The accuracy of the slice width and the recommended high contrast resolution was not verified in 16% and 11 % of the equipments respectively. The noise, expressed as a standard deviation measured in the center of the image in an adult abdomen protocol, ranged from 2.8 to 9.5. The ACR criteria of the accreditation program were not accomplished in the sample evaluated. Some parameters that failed are essential to assure the diagnostic accuracy. In the figure 2 is presented the percentage of conformity obtained for each image quality parameters for all sample.
Conformity percentage (%)
FIG 2. Distribution of the parameters evaluated and the respective percentage of conformity with ACR protocol
Routine procedures were performed according to pre-established protocols independently to the patient characteristic. Also, it was observed that adult protocols are used for pediatric patients in the centers. Special actions should be quickly implemented considering the higher sensitivity of children to the harmful effects of radiation. The technicians and radiologists don't received training in radiological protection and don't have any information about the patient doses in the different procedures. So, they don't have the necessary motivation to apply optimization actions. These results of this work indicate a large potential for optimization and dose reduction, especially in pediatric patients.
It was not verified an influence of the CT fabrication age in the patient dose neither in the image quality. On the other hand, where the new technology was available, the PKL values were much more higher than in single slices scanners [1]. This is an evidence of the tendency to increase the irradiated volume. It is possible because the multislices scanners can performed the procedures with high temporal and contrast resolution in milliseconds.
REFERENCES
[1] INTERNATIONAL COMMISSION ON RADIOLOGICAL PROTECTION 87 (2001): Managing Patient Dose in Computed Tomography, 1 st ed. Elsevier.
[2] AMERICAN COLLEGE OF RADIOLOGY (ACR) (2008) : www.acr.org.
406
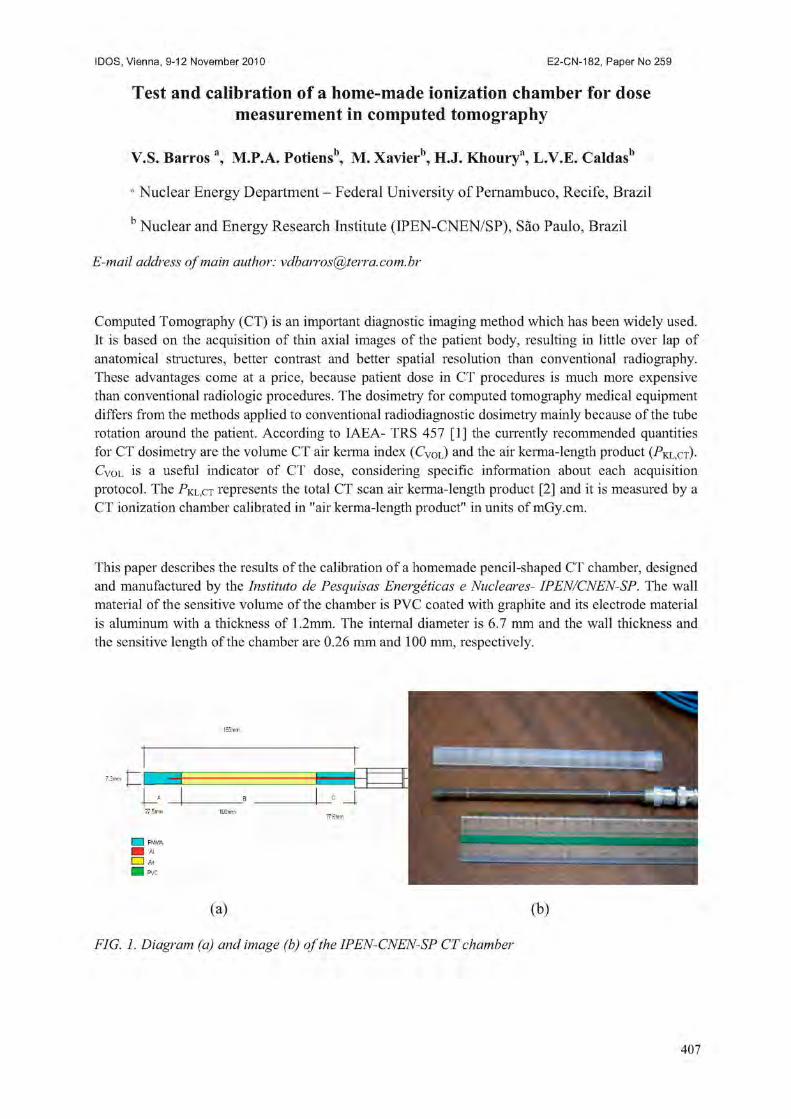
IDOS, Vienna, 9-12 November 2010 E2-CN-182, Paper No INV015
Test and calibration of a home-made ionization chamber for dose measurement in computed tomography
V.S. Barros a, M.P.A. Potiens\ M. Xavier", H.J. Khourya, L.V.E. Caldasb
a Nuclear Energy Department - Federal University of Pernambuco, Recife, Brazil
b Nuclear and Energy Research Institute (IPEN-CNEN/SP), Sao Paulo, Brazil
E-mail address of main author: [email protected]
Computed Tomography (CT) is an important diagnostic imaging method which has been widely used. It is based on the acquisition of thin axial images of the patient body, resulting in little over lap of anatomical structures, better contrast and better spatial resolution than conventional radiography. These advantages come at a price, because patient dose in CT procedures is much more expensive than conventional radiologic procedures. The dosimetry for computed tomography medical equipment differs from the methods applied to conventional radiodiagnostic dosimetiy mainly because of the tube rotation around the patient. According to IAEA- TRS 457 [1] the currently recommended quantities for CT dosimetry are the volume CT air kerma index (CVOL) A N D the air kerma-length product 0PKL,CT)-
CVOL is a useful indicator of CT dose, considering specific information about each acquisition protocol. The PKi c. represents the total CT scan air kerma-length product [2] and it is measured by a CT ionization chamber calibrated in "air kerma-length product" in units of mGy.cm.
This paper describes the results of the calibration of a homemade pencil-shaped CT chamber, designed and manufactured by the Instituto de Pesquisas Energeticas e Nucleares- IPEN/CNEN-SP. The wall material of the sensitive volume of the chamber is PVC coated with graphite and its electrode material is aluminum with a thickness of 1.2mm. The internal diameter is 6.7 mm and the wall thickness and the sensitive length of the chamber are 0.26 mm and 100 mm, respectively.
(a) (b)
FIG. 1. Diagram (a) and image (b) of the IPEN-CNEN-SP CT chamber
407

The chamber was calibrated in the Metrology Laboratory of Ionizing Radiation of Nuclear Energy Department (LMRI-DEN/UFPE) located in Recife, Brazil. The radiation exposure was performed on a Pantak 420 X-ray system using the radiation qualities established according to IEC 61267 [2], The ionization chambers were irradiated with their axis perpendicular to the anode-cathode axis of the x-ray tube, at a distance of 100 cm from the focal spot. Using lead collimators with a rectangular aperture, the field dimension at the ionization chamber was adjusted to a size of 8cm x 8cm. The chamber was connected to a PTW electrometer UNIDOS E and the current was measured by irradiating the chamber at known air-kerma rates with RQT-8, RQT-9 and RQT-10 X-ray qualities. The standard ionization chamber Radcal model RC3CT serial 8769, calibrated in the German primary standard laboratory Physikalisch-Technische Bundesanstalt (PTB), was used as a reference. For comparison, measurements were also made with the Radcal CT chamber, model RC3CT serial 8849, from the laboratory. The calibration factor, in units of Gy*cm/C, was then determined on the basis of the quotient between the air-kerma length determined by the standard chamber and the ionisation current of the chamber under study.
The values of Nk (Gy.cm/C) and KQ are presented in Table 1 with the indication of the expanded uncertainty (U) (k=2) estimated according to the IEC/ISO Guide, 1995 [3].
TABLE ENg and KQ values for the utilized ionization chambers.
Ionization chamber X-ray Quality Nk( Gy.cm/C) K 0 U (k=2) RQT-8 0.997 1.5%
Standard chamber RQT-9 9.57x10' 1.000 1.5% RQT-10 1.005 1.5% RQT-8 0.990 2.2%
IPEN/CNEN-SP RQT-9 RQT-10
7.733 x 10⁷ 1 1.010
2.2% 2.2%
Radcal RCSCT serial 8769
RQT-8 RQT-9
RQT-10 9.57 xlO7
0.996 1.000 1.006
2.2% 2.2% 2.2%
The results indicate that the IPEN/CNEN-SP ionization chamber response presents greater energy dependence than the Radcal CT chamber, but it has a sensitivity around 24% higher than the Radcal chamber. Studies on the IPEN chamber are in development to evaluate its response in clinical dosimetry conditions.
REFERENCES
[1] INTERNATIONAL ATOMIC ENERGY AGENCY. Dosimetry in diagnostic radiology: an international code of practice, TRS 457, Vienna(2007).
[2] INTERNATIONAL ELECTROTECHNICAL COMMISSION. Medical diagnostic X-ray equipment - Radiation conditions for use in the determination of characteristics, IEC 61267, Geneve(2005).
[3] INTERNATIONAL ORGANIZATION FOR STANDARDIZATION. Guide to the ecpression of uncertainty in measurement. ISO-GUM, Geneve (1995).
408
IDOS, Vienna, 9-12 November 2010 E2-CN-182, Paper No INV015
Patient doses in simple radiographic examinations in Madagascar: Results from IAEA project
aM.J. Ratnanandraibe, aT. Randriamora, aR. Andriambololona,1 E. Rakotoson
a Institut National des Sciences et Techniques Nucleaires (Madagascar-INSTN), Antananarivo, Madagascar
1 Centre de Soins et de Sante (CSS), Service de radiologie, Antananarivo, Madagascar
E-mail address of main author: [email protected]
The purpose of this study is to survey patient doses in radiographic examinations and to perform comparisons with the international Diagnostic Reference Levels (DRLs). This study is part of an International Atomic energy Agency (IAEA) project (RAF/9/033) and six hospitals located in the capital city were selected.
Doses delivered to patients were determined in terms of entrance surface dose (ESD) based on X-ray tube output measurements and X-ray exposure parameters. Before patient dose assessment, information on X-ray exposure parameters (kVp, mAs) and geometric parameters (focus-skin distance) used in radiographic examinations of the selected patients was collected. The surveyed X-ray exposure parameters were used later to estimate patient doses through a three steps protocol: X-ray tube output measurements, entrance skin air kerma measurement, and entrance surface dose calculation.
X-ray tube output measurements
X-ray tube output measurements were conducted using a Ratemeter- Timer, Model 3036, with an internal ionization chamber. The dosimeter was positioned in central beam axis such that the X-ray tube focal spot -detector-distance (FDD) was 100 cm. The radiation field size (FS) at FDD was set just to cover the dosimeter in order to avoid the possible influence of scatter radiation to the dosimeter. The tube potential was set at 50 kVp and any mAs value (depending on convenient tube load conditions), an X-ray exposure made and the dosimeter reading recorded. This step was repeated once more at same kVp and mAs settings and the average dosimeter reading determined. The X-ray tube output was determined as the ratio of average dosimeter reading (air kerma) to the tube current-time product used. Similar X-ray tube output measurements were determined for 60, 70, 80, 90, 100 and 120 kVp settings or closest values depending on typical selectable kVp values. The values of X-ray tube output were plotted against tube potential and the resulting output-kVp curve fitted to a square function.
ESD determination
The entrance skin air kerma (ESAK) for each adult patient undergoing particular X-ray examination was determined from the product of X-ray tube output (derived from output-kVp curve corrected for the inverse square effects between the patient's distance from the X-ray focus and distance of output measurements) and the mAs used during X-ray examination. The ESAK value was converted to Entrance Surface Doses (ESD) by multiplying with the appropriate back scatter factor (BSF). The BSF value of 1.35 was used in this work, as suggested in the European Guidelines [2].
409
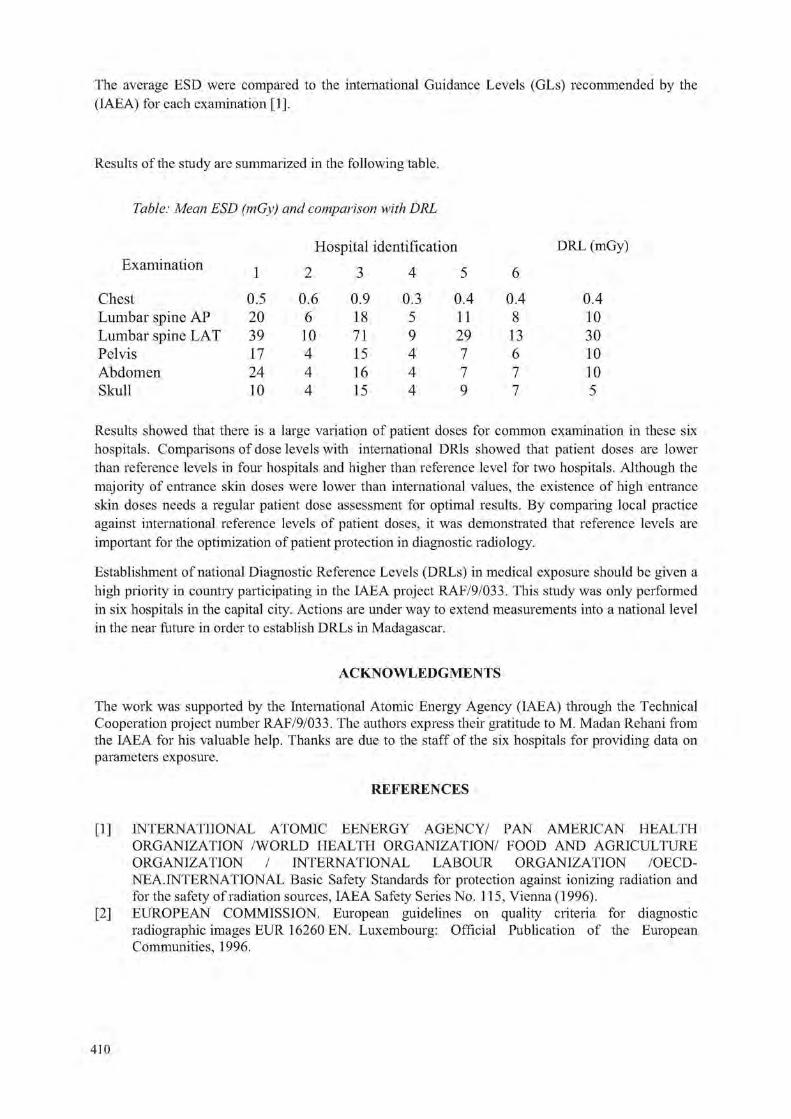
The average ESD were compared to the international Guidance Levels (GLs) recommended by the (IAEA) for each examination [1],
Results of the study are summarized in the following table.
Table: Mean ESD (mGy) and comparison with DRL
DRL (mGy)
Chest Lumbar spine AP Lumbar spine LAT Pelvis Abdomen Skull
0.5 0.6 0.9 0.3 0.4 0.4 20 6 18 5 11 8 39 10 71 9 29 13 17 4 15 4 7 6 24 4 16 4 7 7 10 4 15 4 9 7
0.4 10 30 10 10 5
Results showed that there is a large variation of patient doses for common examination in these six hospitals. Comparisons of dose levels with international DRls showed that patient doses are lower than reference levels in four hospitals and higher than reference level for two hospitals. Although the majority of entrance skin doses were lower than international values, the existence of high entrance skin doses needs a regular patient dose assessment for optimal results. By comparing local practice against international reference levels of patient doses, it was demonstrated that reference levels are important for the optimization of patient protection in diagnostic radiology.
Establishment of national Diagnostic Reference Levels (DRLs) in medical exposure should be given a high priority in country participating in the IAEA project RAF/9/033. This study was only performed in six hospitals in the capital city. Actions are under way to extend measurements into a national level in the near future in order to establish DRLs in Madagascar.
The work was supported by the International Atomic Energy Agency (IAEA) through the Technical Cooperation project number RAF/9/033. The authors express their gratitude to M. Madan Rehani from the IAEA for his valuable help. Thanks are due to the staff of the six hospitals for providing data on parameters exposure.
[1] INTERNATIONAL ATOMIC EENERGY AGENCY/ PAN AMERICAN HEALTH ORGANIZATION /WORLD HEALTH ORGANIZATION/ FOOD AND AGRICULTURE ORGANIZATION / INTERNATIONAL LABOUR ORGANIZATION /OECD-NEA.INTERNATIONAL Basic Safety Standards for protection against ionizing radiation and for the safety of radiation sources, IAEA Safety Series No. 115, Vienna (1996).
[2] EUROPEAN COMMISSION. European guidelines on quality criteria for diagnostic radiographic images EUR 16260 EN. Luxembourg: Official Publication of the European Communities, 1996.
ACKNOWLEDGMENTS
REFERENCES
410
IDOS, Vienna, 9-12 November 2010 E2-CN-182, Paper No INV015
Humidity dependence in kerma area product meter used in diagnostic X ray examinations
P.O. Hetland
SSDL, Norwegian Radiation Protection Authority, Norway
E-mail address of main author: [email protected]
The air-kerma area product, PKA, is a dosimetric quantity that can be directly related to the patient dose and used for risk assessment associated with different x-ray examinations. Pka has the unit Gym" and can be directly measured by use of a Kerma Area Product (KAP) meter placed in the radiation beam.
PKI is the recommended quantity for use in the establishment of diagnostic reference levels (DRLs) [1] for conventional x-ray examinations and is also a good indicator for when threshold doses for deterministic effects are reached in interventional x-ray procedures. Most modern x-ray equipment provides the operator with the total PKi from the examination or procedure. This PKA is either obtained from PK \ measurements from a built-in KAP meter or calculated from exposure parameters. To get a reliable estimate of DRLs and the patient dose, it is essential that the PKA measurement is correct. Thus all environmental influences on the KAP meter should be taken into account. These influences can either be corrected for or included in the measurement uncertainty. These have to be considered both in the calibration of the KAP-meters, in the use of the KAP meters and in the determination of DRLs.
A KAP meter is an electrometer and a plane parallel ion chamber with an active area of typical 15 cm X 15 cm. The KAP meter usually consist of three plastic plates (PMMA) which is coated with a conducting layer made of indium oxide doped with tin (fr^O^Sn) [2]. This coating is used due to its transparency to light. The air layers between the plates (sensitive volume) are open to the air. Thus the readings from the KAP meter have to be corrected for air pressure and temperature as for other ion chambers. It has been assumed that the humidity dependence of the KAP meter is so small that no correction has been necessary.
This work will show that KAP meter with PMMA plastic plates coated with frbO^vSn shows a humidity dependence so large that corrections should be considered.
The measurements were performed by carefully controlling the humidity in the laboratory. Between each measurement the humidity was changed with steps of 5 to 10 %RH in the range 20-60 %RH. The measurements were performed two days after the humidity change, so the humidity inside the chamber could stabilise. The setup was as for a substitution calibration with the KAP meter 100 cm from the x-ray source and exposed to a beam limited by a aperture of 5 cm X 5 cm at 95 cm as described in TRS-457 [3]. A Capintec PR-30 was used as a monitor chamber. This chamber is made of C-552 and has small humidity dependence. Two KAP-chambers were tested. Both chambers showed the same humidity dependence.
The humidity dependence for the chambers was (0.24 ± 0.10) % pr. %RH (k=2). The transmission factor of the chambers showed no humidity dependence. One of the chambers were tested at five different qualities from 40 kV to 150 kV (RQR2, RQR5, RQR8, RQR9, RQR 10 [4]). The humidity dependence was the same for all qualities.
411
In an environment with no humidity control the humidity can typically vary from 20 %RH to 80 %RH. According to the results this can lead to about 14 % change in the KAP reading. This is a larger effect than recommended for KAP meters, ± 3.0 %, in the IEC 60580 standard [5]. The observed humidity dependence means that great care have to be take when calibrating and using KAP meter for dose measurements. The humidity effect is not fully understood but it seems that the conducting layer on the PMMA is the origin of the effect.
REFERENCES
[1] INTERNATIONAL COMMISSION ON RADIOLOGICAL PROTECTION the 2007 recommendations of the. ICRP Publication 103. Orlando FL: Elsevier; 2007. Annals of the ICRP 2007; 37(2-4).
[2] LARSSON P. Calibration of ionization chambers for measuring air kerma integrated over beam area in diagnostic radiology: factors influencing the uncertainty in calibration coefficients. Akademisk avhandling. Linkoping University. Medical dissertations No. 970. Linkoping: Linkoping University
[3] INTERNATIONAL ATOMIC ENERGY AGENCY, Dosimetry in diagnostic radiology: an international code of practice. IAEA. Technical Reports Series no. 457. Vienna:; 2007. http://www-pub.iaea.org/MTCD/publications/PDF/TRS457 web.pdf (22.05.08)
[4] IEC 61267 ed2.0, Medical diagnostic X-ray equipment - Radiation conditions for use in the determination of characteristics, 2005
[5] IEC 60580, Medical electrical equipment - Dose area products meters, page 59, table 6, 2003
412

IDOS, Vienna, 9-12 November 2010 E2-CN-182, Paper No INV015
Patient dose in a breast screening program: Digital versus film mammography
A. Ramirez-Munoz, A. Domfnguez-Folgueras, M.L. Chapel-Gomez
Medical Physics Department. Ntra.Sra. de Candelaria University Hospital. Tenerife. Spain
E-mail address of main author: [email protected]
Average Glandular Dose (AGD) of women enrolled in a mammographic screening program is measured routinely at one screening centre in the Canary Island Breast Screening Program (Spain). This paper reviews a representative sample of those measurements, comparing the collected data from a Film-Screen System (SFM) and those obtained after changing the mammographic system to a Full-Field Digital Mammography (FFDM) with different beam qualities. All data belong to the same centre, so technologists were the same during the accomplishment of this study.
FFDM was performed using a direct amorphous Selenium digital system (Lorad Selenia) with W target and Rh and Ag filtration. SFM was performed using a conventional system (Senographe DMR+) and a dual track target of Mo and Rh with Mo and Rh filtration, with a dedicated screen-film combination.
AGD was estimated from each patient collected data. First, Entrance Surface Air Kerma (ESAK) was estimated, and the result was used to evaluate AGD for each exposition using:
AGD=KASE-g-c-s
Where the factor g corrects AGD to a 50% glandularity breast and it is tabulated for breast thickness and half-value layer (HVL), c applies a correction for breasts of different glandularities and it is tabulated by Dance [1] for typical breasts of women in the age groups 40 to 49 years and 50 to 64 years, and finally s corrects the differences due to the use of an x-ray spectrum other than Mo/Mo (different anode/filter combinations).
AGD was evaluated for each breast as the sum of Cranio-Caudal (CC) AGD and Medio-Lateral Oblique (MI.O) AGD.
A first analysis of our data showed that the average breast thickness was higher in the FFDM unit than that of the SFM unit [2], This increase in the thickness of the compressed breast found in the digital unit was originated by a relaxation in the procedure performance by technologists, which had decreased the applied compression force. Lack of sensitivity to compression of the image produced in a FFDM compared to a SFM may be the cause of this relaxation. Digital images have a high dynamic range that allows a post-processing of the image, selecting the level and size of the visualisation window, which provides a good image quality even if optimal compression is not reached. Technologists were informed and warned not to disregard the compression and a decrease of a 6.76% in the compressed thickness was found, obtaining values now similar to those in the SFM unit.
Regarding the received doses by patients, and even considering the studies performed with a dull compression, FFDM doses (1.13+0.01 mGy SD=0.32) are 4.42% smaller than those obtained in the SFM unit (1.1810.03 mGy SD=0.44).
Considering only studies with good compression, FFDM doses (1.1110.01 mGy SD=0.30) are 6.31% smaller than those in the SFM unit, and 1.80% smaller than those obtained when studies were performed without optimal compression.
413
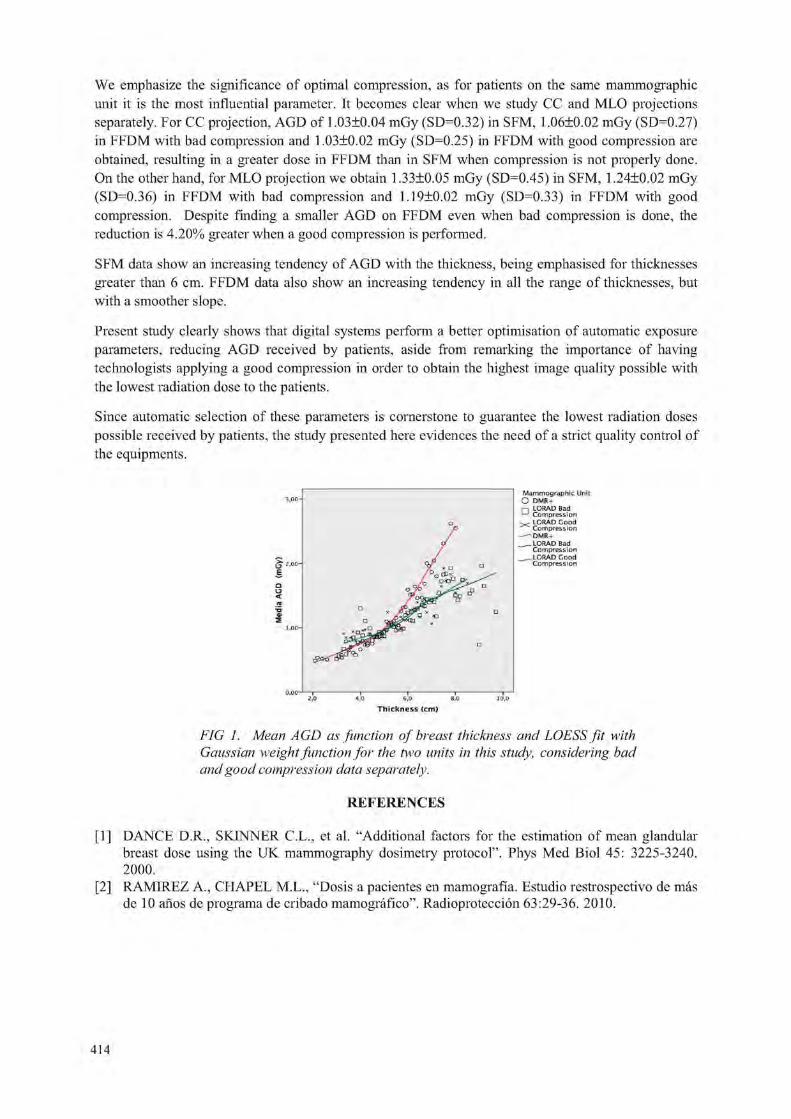
We emphasize the significance of optimal compression, as for patients on the same mammographic unit it is the most influential parameter. It becomes clear when we study CC and MLO projections separately. For CC projection, AGD of 1.03±0.04 mGy (SI ) 0.32) in SFM, 1.06±0.02 mGy (SD=0.27) in FFDM with bad compression and 1.03±0.02 mGy (SD=0.25) in FFDM with good compression are obtained, resulting in a greater dose in FFDM than in SFM when compression is not properly done. On the other hand, for MLO projection we obtain 1.33±0.05 mGy (SD=0.45) in SFM, 1.24+0,02 mGy (SD 0.36) in FFDM with bad compression and 1,19+0,02 mGy (SD=0.33) in FFDM with good compression. Despite finding a smaller AGD on FFDM even when bad compression is done, the reduction is 4.20% greater when a good compression is performed.
SFM data show an increasing tendency of AGD with the thickness, being emphasised for thicknesses greater than 6 cm. FFDM data also show an increasing tendency in all the range of thicknesses, but with a smoother slope.
Present study clearly shows that digital systems perform a better optimisation of automatic exposure parameters, reducing AGD received by patients, aside from remarking the importance of having technologists applying a good compression in order to obtain the highest image quality possible with the lowest radiation dose to the patients.
Since automatic selection of these parameters is cornerstone to guarantee the lowest radiation doses possible received by patients, the study presented here evidences the need of a strict quality control of the equipments.
FIG 1. Mean AGD as function of breast thickness and LOESS fit with Gaussian weight function for the two units in this study, considering bad and good compression data separately.
REFERENCES
[1] DANCE D.R., SKINNER C.L., et al. "Additional factors for the estimation of mean glandular breast dose using the UK mammography dosimetry protocol". Phys Med Biol 45: 3225-3240. 2000.
[2] RAMIREZ A., CHAPEL M.L., "Dosis a pacientes en mamografia. Estudio restrospectivo de mas de 10 anos de programa de cribado mamografico". Radioproteccion 63:29-36. 2010.
414

IDOS, Vienna, 9-12 November 2010 E2-CN-182, Paper No INV015
Influence of detector type and position on KAP meter calibration on fluoroscopy and angiography units
R. Borisova , J. Vassileva'
a Radiotherapy department, Tokuda Hospital Sofia, Sofia, Bulgaria
' Radiation Protection at Medical Exposure Section, National Center of Radiobiology and Radiation Protection, Sofia, Bulgaria
E-mail address of main author: [email protected]
Influence of detector type, i.e. ionisation chamber or semiconductor detector (SCD) was studied in order to assess the best choice of reference dosimeter for KAP-meter calibration on fluoroscopy and angiography X-ray units with undercouch tube. The effect of backscatter from patient couch was also explored. Ionisation chambers have been the detector of choice for absolute dose measurements and calibration due to their high sensitivity and low energy dependence. However, SCD are more readily available and are sometimes preferred owing to their built-in protection from backscatter. According to TRS 457 [1] the detector should be positioned on the patient couch thus increasing the contribution from backscatter and introducing uncertainty to the final KAP-meter calibration factor.
Measurements were performed on a conventional fluoroscopy C-arm unit. Three detectors were compared: two shadow-free ionisation chambers (6 cm3 and 75 cm3 respectively, both by PTW Freiburg, Germany) and a BARRACUDA Multipurpose semiconductor detector (RTI Electronics, Sweden). In order to assess the effect of backscatter, four positions of the detectors were used: on couch top, and at 10 cm, 20 cm and 30 cm above the couch. All exposures were done at constant filtration and tube current and at three tube voltages: 60 kV, 80 kV and 100 kV (typical for fluoroscopy procedures). The radiation field area was chosen to cover the detectors at all positions and remained constant during the measurements.
Figure 1 is a sample illustration of the trends observed in the results. Table 1 presents the results for the influence of couch-detector distance on the measured air kerma rate. All values (K ) are normalized to the air kerma rate measured at 20 cm away from the couch (K2o). Table 2 presents results for the air kerma rate measured at 30 cm, 20 cm, 10 cm and at couch top for the semiconductor detector SCD ( K S C D ) normalized to the 75 cc ion chamber ( K 7 5 ) .
The reading of the semiconductor detector remained approximately constant with distance because of its insensitiveness to backscatter. As expected, the values measured by the two ion chambers at the same distance were within the measurement unsertanty. The air kerma rate measured with the SCD was consistently lower even for greater distances from the couch, this decrease being smaller for higher kV, possibly because of the greater energy dependence of the SCD than that of ion chambers. A difference of approximately 18 % was observed between readings of the ion chambers and SCD when measuring with detectors directly on the couch, which can be contributed to the great influence of backscatter on the ion chambers.
The results of this study show that detector position with respect to the patient couch is critical when ion chambers are used for calibration of KAP-meters on undercouch tube units. Backscatter from the patient couch can increase the ion chamber reading by at least 15 % if it is positioned directly on the couch. It is debatable whether a distance of 10 cm is adequate to ensure scatter-free geometiy conditions. Optimal geometry for measurements with ion chambers is at a distance of approximately
415

20 cm above the table top. SCD can also be used and can be positioned directly on the couch top thus simplifying the calibration set-up. All these effects should be considered when calibrating KAP-meters in clinical practice in order to decrease the uncertainty of the obtained calibration factor, which is used subsequently in patient dose calculations.
Influence of detector type and distance to table top at 100 kV
1 1 1 1 1 i
* i
• lonchamber6cc Alon chamber 75 cc • Semiconductor detector
i i 0 E 10 16 20 25 30 35
Couch-detector distance, cin
FIG. 1. Air kerma rate normalized at couch level for the two ionization chambers and the semiconductor detector, measured at 100 kV
Table 1. Air kerma rate at 30 cm, 10 cm and at couch top for the two ionization chambers and the SCD normalized to the 20 cm distance
d, cm K c / K 20> % /- 3 6 cm 75 cm SCD
30 2.3% 0.3% 2.7%
10 4.5% 2.2% 1.9%
0 20.2% 15.9% 0.8%
Table 2. Air kerma rate measured at 30 cm, 20 cm, 10 cm and at couch top for the SCD (kscd) normalized to the 75 cc ion chamber (k75)
d, cm Kscd/K75, %
60 kV 80 kV 100 kV
30 -7.9% -7.2% -5.9%
20 -2.8% -2.5% -1.3%
10 -8.2% -8.4% -8.1%
0 -18.6% -18.1% -17.5%
REFERENCE
[1] INTERNATIONAL ATOMIC ENERGY AGENCY, Dosimetry in diagnostic radiology. An international code of practice. Technical Report Series No. 457, ISBN 92-0-115406-2, IAEA, Vienna (2008)
416

IDOS, Vienna, 9-12 November 2010 E2-CN-182, Paper No INV015
Dependence of mean glandular dose on compression plate position
S. Avramova-Cholakova, J. Vassileva
National Centre of Radiobiology and Radiation Protection, Sofia, Bulgaria
E-mail address of main author: s_avramova@maiJ. bg
The aim of this study is to explore the influence of the compression plate position and type of dosimetry detector used while performing radiation output measurements for determination of incident air kerma (IAK) in mammography. The European protocol on dosimetry in mammography [1] and the European protocol for the quality control of the physical and technical aspects of mammography screening [2] do not specify the precise position of the compression plate. The Code of Practice for Dosimetry in diagnostic radiology (TRS 457) of the IAEA defines the place of the plate in contact with the dosimetry detector but only for phantom measurements [3]. The last edition of the British protocol for Commissioning and routine testing of mammographic X-ray systems specifies the plate position at least 5 cm above the detector [4]. All these protocols use the same values of the conversion coefficients for calculation of mean glandular dose (MGD) from IAK [1-4],
Measurements were performed at three film-screen mammography units with Mo/Mo anode/filter combinations: Melody (Villa, Italy), Mammo Diagnost UC (Philips) and Affinity (Lorad, USA). The dosemeters used were: UNIDOS E with 1 cm3 plane parallel chamber type 77337 (PTW Freiburg, Germany) which active volume is enveloped in a metal ring; UNIDOS with 6 cm3 shadow free plane parallel chamber type 34069 (PTW Freiburg, Germany) without a metal ring; Barracuda with solid state multipurpose detector MPD (RTI Electronics, Sweden). All detectors are dedicated to mammography measurements and have appropriate calibrations for the relevant mammographic spectra. During the measurements the dosimetry detector was positioned at 6 cm from the chest wall edge of the breast support, laterally centered. The ionization chambers were 10 cm above the breast support and the MPD was positioned on it because it is backscatter protected. Thus all measurements were performed in backscatter free conditions. Air kerma was measured at different tube voltages (kV) and at 20 mAs, whithout moving the detector, in two geometries: with the compression plate positioned on the detector and with the plate away from it.
The percentage differences between the values of the air kerma, measured with the compression plate positioned 20 cm above the detector and the plate in contact with the detector are presented in Table 1. Tube voltage values are shown in the first row. The difference between the results from the measurements with the shadow free chamber 34069 and MPD in cases of the plate away and the plate in contact with the detector are within the uncertainty of the measurement. However they are systematically higher with the plate positioned on the chamber and systematically lower with the plate on the solid state detector. The solid state detector registers very small amount of scatter from the plate probably because of its small active area and big angular dependence. When measuring with the plate in contact with the chamber 77337 the difference is up to 6.9 % compared with the case of the plate away depending on kV value. Possible reason for this bigger difference is the supplementary scatter from the metal ring. The results for the air kerma value and the IAK and MGD respectively may differ up to 9.4 % depending on the compression plate position and the type of dosimetry detector used.
Radiation output measurements for dosimetry purposes should be done in conditions of minimal scatter i.e. with the compression plate at least 10 cm above the dosimetry detector. This is the condition to decrease the uncertainty of the results from the measurement.
417

TABLE 1. Percentage difference between the results from radiation output measurements with the compression plate away from the dosimetiy detector and the plate in contact with it
U(kV) 22 23 24 25 26 27 28 29 30 31 32
Chamber 77337 % difference
* 6.5 * 6.8 * * 6.9 * * * *
Chamber 34069 % difference
* * * 1.5 2.2 1.7 1.7 1.9 2.5 * *
MPD % difference -2.5 -2.1 -2.3 -1.7 -2.2 -1.3 -1.9 -1.9 -2.0 -2.0 -2.2
REFERENCES
[1] EUROPEAN COMMISSION, European protocol on dosimetry in mammography, Luxembourg (1996).
[2] EUROPEAN COMMISSION, European protocol for the quality control of the physical and technical aspects of mammography screening. In: European guidelines for quality assurance in breast cancer screening and diagnosis (Fourth edition), Luxemburg (2006) 57-104.
[3] INTERNATIONAL ATOMIC ENERGY AGENCY, Dosimetry in diagnostic radiology - an international code of practice, Vienna (2007).
[4] INSTITUTE OF PHYSICS AND ENGINEERING IN MEDICINE, The commissioning and routine testing of mammographic X-ray systems, IPEM Report 89, York (2005).
418

IDOS, Vienna, 9-12 November 2010 E2-CN-182, Paper No INV015
Evaluation of diagnostic X ray devices and patient doses in Indonesia: Preliminary result
E. Hiswara, H. Prasetio
National Nuclear Energy Agency (BATAN), Jakarta, Indonesia
E-mail address of main author: [email protected]
Diagnostic technique to study physical condition of a patient using X-rays is the most common technique used in the world. Diagnostic X-rays is basically performed to obtain image of part of a body being examined. The sophisticated development of this imaging X-rays technology requires a high accuracy in its implementation. To avoid an error that might happen, the World Health Organization has since 1982 introduced a quality assurance program in the field of diagnostic radiology [1], One of the elements of the program is the implementation of compliance test to ensure that the X-rays use is in good condition, safe for the patient and produce a good quality of image.
The widespread use of diagnostic X-rays also raises the concern on the radiation dose received by the patients. According to the United Nations Scientific Committee on Effects of Atomic Radiation (UNSCEAR) [2], applications of diagnostic and mammography using X-rays contribute to the biggest portion of radiation doses received by world's population. For the purposes of protection to the patient, the International Atomic Energy Agency (IAEA) recommends to use guidance levels so that radiation doses received by patient be optimised while maintaining quality of film image produced by these procedures [3],
In order to check the compliance of diagnostic X-rays use in Indonesia to the standard one, while at the same time assess the patient doses, the Indonesian National Nuclear Energy Agency (BATAN) has a program to carry out compliance test to those devices and measure the doses received by the patients. This paper presents the preliminary result of the program.
Compliance test of the diagnostic X-rays is performed using the protocol developed by the Radiological Council of Western Australia [4], The non-invasive beam analyzer is used for measurements related to the voltage, exposure time and output, while Al filters are used for measurements of beam quality. The results are compared to the tolerance levels recommended by the BC Center for Disease Control, Canada [5].
Determination of patient doses is earned out according to the protocol recommended by the IAEA [6], TLDs are used for most of the measurements. The results are then compared to the guidance levels set out by the IAEA.
The measurements are carried out in several hospitals in Indonesia, i.e. in Jakarta (3 hospitals), Bandung (1), Yogyakarta (4), Surabaya (2), Padang (5) and Banjarmasin (1). The numbers of diagnostic X-rays examined are 36, consists of 18 conventional, 7 mammography, 4 dental intraoral and 7 dental panoramic, while number of patients measured are 219.
By comparing results of measurements with the tolerance levels, it was found that almost all X-rays pass the levels, except some for the accuracy of working voltage (kV). Three out of 18 conventional X-rays, as well as three out of 7 dental panoramic X-rays, fail the test. In the case of beam quality, all X-rays pass the test. All X-rays also pass the test for output linearity, and the repeatibility of kV, time and output. After some adjustment, all X-rays are then used to measure the doses received by the patient.
419

Table 1 Patient doses in conventional and dental X-rays.
Type of examination
ESD (mGy) Mean ESD (mGy)
Guidance level Type of examination Maximum Minimum Deviation
Mean ESD (mGy)
Guidance level
Intraoral 13,516 0,94 2,73 4,513 7 Panoramic 0,088 0,0063 0,03 0,0403 *
Cephalometry 7,132 0,249 3,39 2,047 5 Thorax AP 0,798 0,018 0,227 0,297 10 Thorax PA 0,389 0,0097 0,297 0,389 0.4
Thorax Lateral 16,972 0,08 7,345 3,860 20 Pelvis AP 3,261 0,305 0,86 1,588 10
Abdomen AP 2,187 0,2844 0,705 1,675 10 Cervical AP 0,719 0,312 0,16 0,519 *
Cervical Lateral 1,123 0,301 0,342 0,668 *
Lumbo sacral AP 4,0724 0,6268 1,0511 2,054 10 L. Sacral LAT 6,226 0,237 2,339 4,226 30 Head AP/PA 1,743 0,775 0,484 1,249 5 Head LAT 1,346 0,156 0,565 0,855 3 Extremity 1,235 0,028 0,231 0,293 *
*) Guidance level is not given.
Results of measurement of patient doses in terms of entrance surface dose (ESD) for conventional and dental X-rays are given in Table 1. It is shown that overall the doses received are less than those given in the guidance level, except one in panoramic and one in cephalometry. For mammography, the 50% mean glandular dose (MGD) is found to be 0.84 mGy, with maximal of 4.38 mGy and minimal 0.076 mGy. The high 50% MGD which exceeds the recommended level of 3 mGy was detected in hospital not applying the automatic exposure control facility.
In conclusion, this preliminary result shows that most of the diagnostic X-rays are in good condition and the patient doses are also less than the level set out by the IAEA. To obtain a more representative value, this program of measurements will be continued and expanded.
REFERENCES
[1] WORLD HEALTH ORGANIZATION, Quality Assurance in Diagnostic Radiology, WHO, Geneva, 1982).
[2] UNITED NATIONS, Sources and Effects of Ionizing Radiation, 2000 Report to the General Assembly, with Scientific Annexes. Scientific Committee on the Effects of Atomic Radiation (UNSCEAR), UN, New York (2000).
[3] INTERNATIONAL ATOMIC ENERGY AGENCY, International Basic Safety Standards for Protection against Ionizing Radiation and for the Safety of Radiation Sources. Safety Series No. 115, IAEA, Vienna (1996).
[4] RADIOLOGICAL COUNCIL OF WESTERN AUSTRALIA, Diagnostic X-Ray Equipment Compliance Testing, Program Requirements (2006).
[5] Diagnostic X-Ray Unit QC Standards in BC: Summary of Standards/Limits for QC of Diagnostic X-Ray Equipment, BC Centre for Disease Control (2004).
[6] INTERNATIONAL ATOMIC ENERGY AGENCY, Dosimetiy in Diagnostic Radiology: An International Code of Practice, Technical Report Series No.457, IAEA, Vienna (2007).
420

IDOS, Vienna, 9-12 November 2010 E2-CN-182, Paper No INV015
Image quality and radiation dose assessment in 3-D imaging: Cone beam CT versus CT
P. Colombo1, A. Moscato '' A. Pierelli S. Pasettc F. Cardinale , A. Torresin 1
(1) Medical Physic Department, Ospedale Niguarda Ca' Granda - Milano-Italy. (2) Epilepsy and Parkinson Neurosurgery Department, Ospedale Niguarda Ca' Granda - Milano-Italy .
E-mail address of main author: [email protected]
Flat panel detectors (FPD) are more and more used for the radiological procedures; O-Arm by Medtronic® is one solution able to support the new imaging methodology. O-Arm represents a solution for intraoperative imaging; it is useful mobile imaging platform for spine, orthopeadic and cranial applications. In our Hospital the main clinical application is during procedures of the Epilepsy and Parkinson Neurosurgery Suite. O-Arm allows multi plane 2-D, 2-D fluoroscopy and 3-D imaging, and the (FPD) provides a large field of view.
We investigated image quality and 3D dose using CT methodology, and compared O-Arm images with standard CT-images.
Methods and Materials
The system is based on a conventional RX-tube and a Flat Panel Detector (40x30 cm2 a-Si/CsI Varian/Paxscan, 0.194 mm pixel size). It is used both in 2D mode, as a conventional fluoroscopic system, and in 3D mode. In this modality the tube-detector assembly rotates 360° and CT-like images of a 21x21x16 cm3 volume are reconstructed (192 slices, 0.83 mm thickness, 512x512 matrix size).
Using a general purpose CT phantom (CatPhan 600 - The Phantom Laboratory, NY USA) we investigated images performances as Contrast Scale, Slice Thickness, Spatial Resolution, Noise, Uniformity, Geometric Distortion, Artefact and Low Contrast Resolution. Dose measurements were performed with a 100 mm pencil ionization chamber and CTDIfree-air and CTDIw were measured in 16 cm PMMA phantom (head phantom) as described in IEC61223-3-5. We acquired images both with Normal Resolution (NR - 120 kV, 400 mAs, 13s rotation) and High Resolution protocol (FIR - 120 kV, 480 mAs, 24s). The two protocols differ in the number of projections used for image reconstruction: the HR protocol doubles the projections from 391 to 782 but it takes approximately the double of the time for a complete 360° rotation (from 13 s to 24 s).
Results
Contrast scale expresses the relationship between attenuation properties of different materials (linear attenuation coefficient and electron density) and digital values of the image. As a standard CT, the linearity with electron density of O-Arm images for body-like materials is good, but digital values are not exactly expressed using the standard CT scale, that is HU=-1000 for air, HU=1000 for very dense materials and HU=0 for water (HU=Hounsfield Unit).
The capability of a system to distinguish high contrast details was assessed by viewing an image of regular array of high contrast bars. The system demonstrates a very high spatial resolution compared to a standard CT passing from 6-7 lp/cm of a standard resolution CT to 11-12 lp/cm of the O-Arm.
Noise is a fundamental image quality parameter and it is related to the granularity appearance of the image.
421

Good noise level enhances the system capability to distinguish low contrast details. O-Arm system presents poor noise level (3,2%) and low uniformity (8.1%) with respect to a standard CT (noise: 0.7%; low uniformity 0.4%), but HR mode (s better than NR mode (noise: 2.5%; low uniformity 4.0 %).
Nominal values of thickness in O-Arm images is in the typical range of the thinnest CT slices. Measured values are not far from nominal ones. On the contrary the profile shape shows an irregular pattern, and is far both from ideal case and also from typical CT profile. No differences between the two acquisition modalities.
Due to its cone-beam geometry, it has been necessary to verily the degree of O-Arm cone-beam artefacts. The reconstructed images are totally free of this kind of artefacts. In addition, geometric linearity has been tested, and a high level of accuracy has been obtained (less than 0.3 mm).
The capability of a system to resolve low-contrast details was investigated through the Catphan specific section where details of different dimension and density (i.e %contrast respect background) are present.
While in a CT image some of these details are visible, this is not the case of the O-Arm image, where any detail is detectable. The reason of this fact, probably is due to the high noise level of O-Arm reconstruction process.
CTDIfree-air for rotation of O-Arm system (12.4 mGy at 100 mAs) is very similar to a standard CT (17.9 mGy at 100 mAs) because both the systems operate at the same kV and similar beam filtration. In head phantom measurements O-Arm head protocols provide less mean dose (CTDIw 14.4 mGy, DLP: 230 mGy cm) in comparison with standard brain CT (CTDIw 23 mGy, DLP: 370 mGy cm).
Conclusion
O-Arm is easy to use and represents a good compromise between acquisition time, performance and dose: very high quality in high contrast structures (bone, or contrast enhancement) but in low contrast imaging (e.g. cerebral structure) the performances are lower; good geometrical accuracy at reasonable dose values.
REFERENCES
[1] IEC61223-3-5:2004, Evaluation and Routine Testing in Medical Imaging Departements, Part 3-5: Acceptance test - Imaging performance of computed tomography X-ray equipment
[2] INSTITUTE OF PHYSICS AND ENGINEERING IN MEDICINE, IPEM report # 32, Measurements of the Performance Characteristics of Diagnostic X-Rays System used in Medicine, part III, Computed Tomography X-ray scanners, 2nd edition
[3] ZHANG J, WEIR V, FA.IARDO L, LIN J, HSIUNG H, RITENOUR ER, Dosimetric characterization of a cone-beam O-arm imaging system, J Xray Sci Technol 2009:17(4);305-317.
422
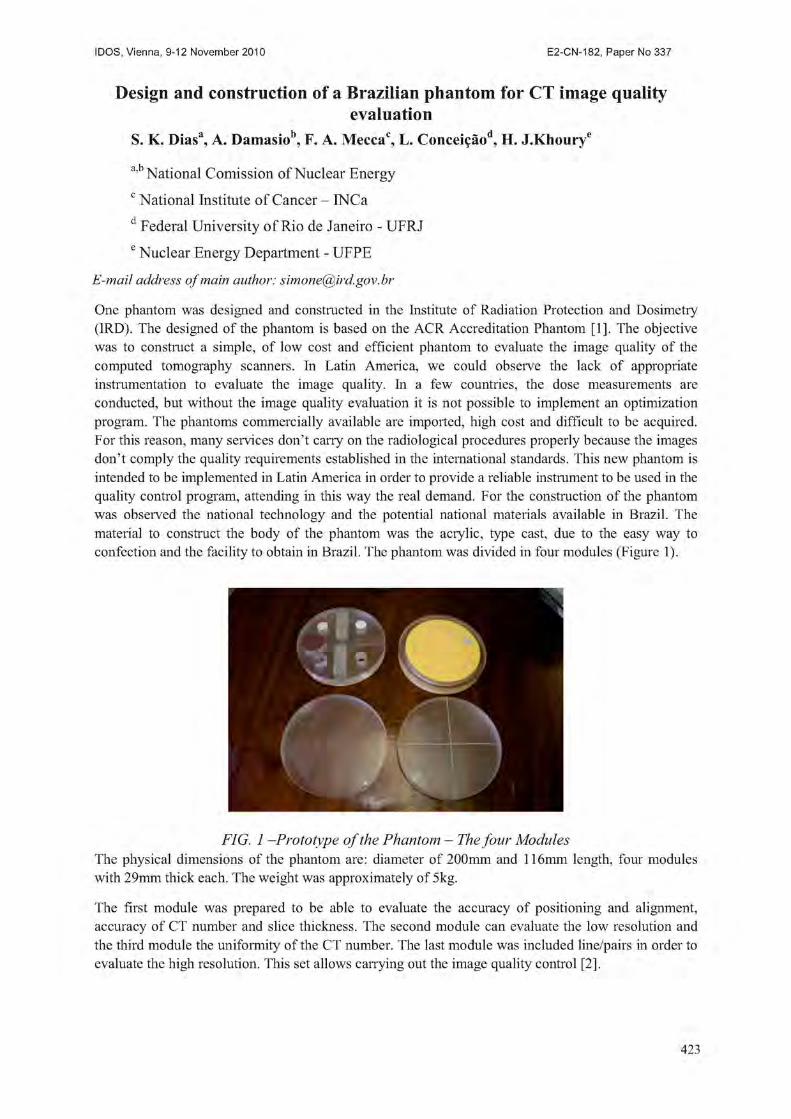
IDOS, Vienna, 9-12 November 2010 E2-CN-182, Paper No INV015
Design and construction of a Brazilian phantom for CT image quality evaluation
S. K. Diasa, A. Damasio1'. F. A. Mecca0, L. Concei?aod, II. J.Khourye
a'b National Comission of Nuclear Energy c National Institute of Cancer - INCa d Federal University of Rio de Janeiro - UFRJ e Nuclear Energy Department - UFPE
E-mail address of main author: [email protected]
One phantom was designed and constructed in the Institute of Radiation Protection and Dosimetiy (IRD). The designed of the phantom is based on the ACR Accreditation Phantom [1], The objective was to construct a simple, of low cost and efficient phantom to evaluate the image quality of the computed tomography scanners. In Latin America, we could observe the lack of appropriate instrumentation to evaluate the image quality. In a few countries, the dose measurements are conducted, but without the image quality evaluation it is not possible to implement an optimization program. The phantoms commercially available are imported, high cost and difficult to be acquired. For this reason, many services don't carry on the radiological procedures properly because the images don't comply the quality requirements established in the international standards. This new phantom is intended to be implemented in Latin America in order to provide a reliable instrument to be used in the quality control program, attending in this way the real demand. For the construction of the phantom was observed the national technology and the potential national materials available in Brazil. The material to construct the body of the phantom was the acrylic, type cast, due to the easy way to confection and the facility to obtain in Brazil. The phantom was divided in four modules (Figure 1).
FIG. 1 -Prototype of the Phantom - The four Modules The physical dimensions of the phantom are: diameter of 200mm and 116mm length, four modules with 29mm thick each. The weight was approximately of 5kg.
The first module was prepared to be able to evaluate the accuracy of positioning and alignment, accuracy of CT number and slice thickness. The second module can evaluate the low resolution and the third module the uniformity of the CT number. The last module was included line/pairs in order to evaluate the high resolution. This set allows carrying out the image quality control [2].
423

All the materials were initially tested and compared to verify the adequacy to conduct the image quality tests in a CT equipment, Picker 2000.
In the first module, the background is acrylic. The CT number measured was 129 HU. There are cylinders of the following materials: polyethylene, water equivalent material, teflon and air. Each cylinder has 25mm of diameter and a 29mm depth, except of water equivalent material; just one cylinder has 50mm of solid water. The CT number of each material was measured and the results were respectively equal to: -92.3 HU, 5.2 HU, 905 HU, -974 HU.
To verily the accuracy of slice thickness, two ramps made of aluminum; 1,5mm diameter was constructed in a 14° angle to the Z-axis. The test was conducted for the following slice thickness: 3cm, 5cm and 8cm. It was not identified any difference between the nominal and the measured values.
To evaluate the low contrast resolution, a series of cylinders of different diameters, made of nylon was inserted in the second module of the phantom. The CT number is approximately 92 HU. This material is easily to acquire with low cost in Brazil. Each group has four cylinders. In each group the diameters varies between 2mm to 6mm. To be confident in the right material, we tested four types of nylon: nylon 6.0, nylon 6.6, nylotec and nyloil. Evaluating each material in a CT scanner, it was concluded that the best material for the confection of the cylinders of module 2 with 2, 3, 4, 5, 6 e 25mm diameters were nylon 6.0 (94.6HU) and to the base the nyloil (88.1HU). During the low contrast evaluation we could observe until the fourth group (3mm).
To evaluate the CT number uniformity was developed the third module in acrylic. Also two spheres with 10cm distance were included to assess the accuracy of distance measurements. To verify the homogeneity, five measurements were made in the clock positions (12h, 3h, 6h, 9h and in the center). The maximum difference was 3HU.
The module 4 was the most complex to produce. It was prepared in a special micro-electronic laboratory in order to obtain the bar resolution patterns. The background material was cast acrylic. The high contrast spatial patterns were constructed with 4, 5, 6, 7, 8, 9, 10 and 12 line pairs per cm. For the patterns were used an aluminum alloy and polystyrene developed in a laboratory of microelectronics.
The phantom was evaluated in two CT scanners located in Rio de Janeiro hospitals. The results obtained were similar to that obtained with the ACR phantom demonstrating that it is feasible and a useful tool to assess the technical performance of CT scanner. The good results with this prototype indicate that the national technology is ready to produce phantoms and instrumentation with quality and accuracy in order to supply the demand of the Latin America. With the phantoms available in the region, we expect to contribute to the quality control of the services and patient dose reduction.
It should be observed that the image quality phantom is essential in the process of reference levels determination and also to implement a program to reduce dose without comprise the diagnostic quality.
REFERENCES
[1 ] AMERICAN COLLEGE OF RADIOLOGY ACR (2008) : www.acr.org. [2] EDYVEAN, S. (1998). Type testing of CT scanners: methods and methodology for assessing
imaging performance and dosimetry. London, Medical Devices Agency Report MDA/98/25 (London: Medical devices Agency).
424
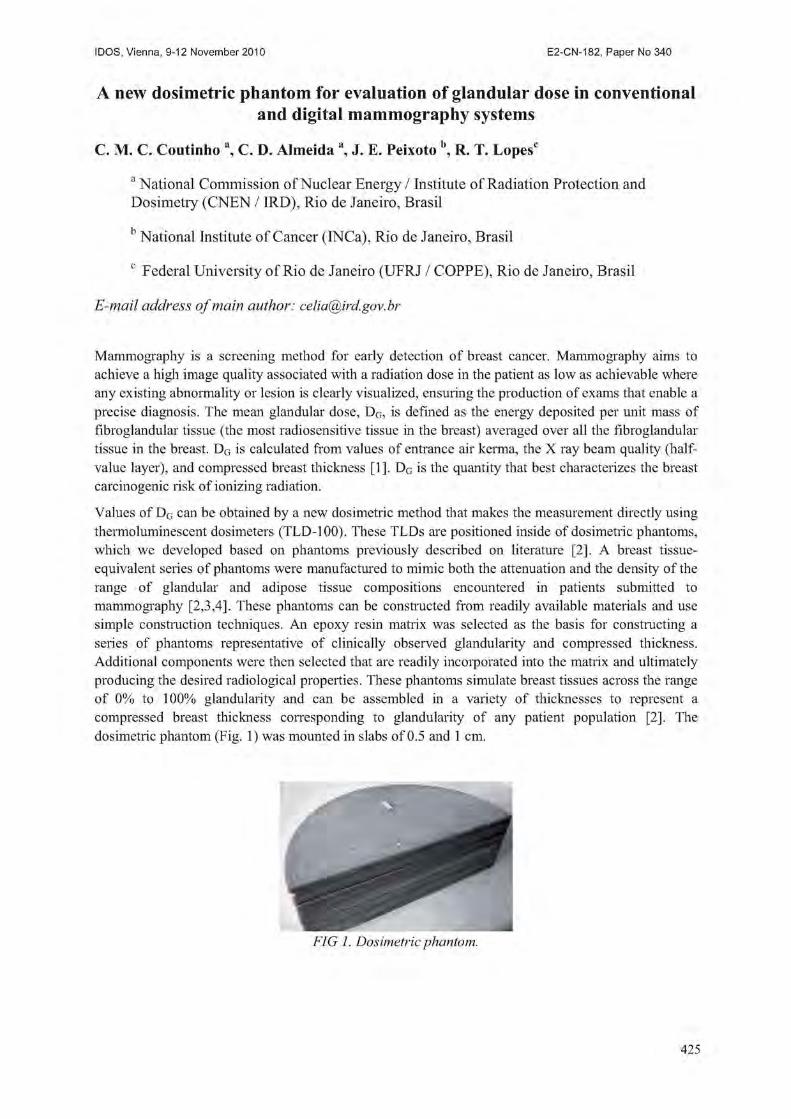
IDOS, Vienna, 9-12 November 2010 E2-CN-182, Paper No INV015
A new dosimetric phantom for evaluation of glandular dose in conventional and digital mammography systems
C. M. C. Coutinho a, C. D. Almeida a, J. E. Peixoto \ R. T. Lopesc
a National Commission of Nuclear Energy / Institute of Radiation Protection and Dosimetry (CNEN / IRD), Rio de Janeiro, Brasil
1 National Institute of Cancer (INCa), Rio de Janeiro, Brasil
c Federal University of Rio de Janeiro (UFRJ / COPPE), Rio de Janeiro, Brasil
E-mail address of main author: [email protected]
Mammography is a screening method for early detection of breast cancer. Mammography aims to achieve a high image quality associated with a radiation dose in the patient as low as achievable where any existing abnormality or lesion is clearly visualized, ensuring the production of exams that enable a precise diagnosis. The mean glandular dose, DG, is defined as the energy deposited per unit mass of fibroglandular tissue (the most radiosensitive tissue in the breast) averaged over all the fibroglandular tissue in the breast. DG is calculated from values of entrance air kerma, the X ray beam quality (half-value layer), and compressed breast thickness [1], DG is the quantity that best characterizes the breast carcinogenic risk of ionizing radiation.
Values of DG can be obtained by a new dosimetric method that makes the measurement directly using thermoluminescent dosimeters (TLD-100). These TLDs are positioned inside of dosimetric phantoms, which we developed based on phantoms previously described on literature [2]. A breast tissue-equivalent series of phantoms were manufactured to mimic both the attenuation and the density of the range of glandular and adipose tissue compositions encountered in patients submitted to mammography [2,3,4]. These phantoms can be constructed from readily available materials and use simple construction techniques. An epoxy resin matrix was selected as the basis for constructing a series of phantoms representative of clinically observed glandularity and compressed thickness. Additional components were then selected that are readily incorporated into the matrix and ultimately producing the desired radiological properties. These phantoms simulate breast tissues across the range of 0% to 100% glandularity and can be assembled in a variety of thicknesses to represent a compressed breast thickness corresponding to glandularity of any patient population [2]. The dosimetric phantom (Fig. 1) was mounted in slabs of 0.5 and 1 cm.
FIG 1. Dosimetric phantom.
425

82
A survey to estimate DG for patients undergoing mammography was conducted in Rio de Janeiro, Brazil. Clinical data and technical parameters were recorded from 1183 craniocaudal mammograms performed on six different equipments: two screen/film conventional units (SFM), two computed radiography units (CR) and two full-field digital units (DR) [5].
The mean value of compressed breast thickness during the recorded examinations of the patients was 5.4 ±1.4 cm. It was selected 392 patients, from the original sample, with compressed breast thickness in the range of 5.5 cm to 6.5 cm for DG measurement [5],
Phantoms containing TLDs inserted in suitable depths of glandular tissues were irradiated using the previously recorded data. The mean glandular dose is shown plotted against the number of patients in Fig. 2. The mean DG, value was 1.4 ± 0.5 mGy for SFM systems, 1.7 ± 0.5 mGy for CR systems and 0.9 ± 0.2 mGy for DR systems [5], The results were in the same range of those presented by other authors [6,7].
This study shows that this dosimetric phantom is a good tool to evaluate DG since it simulates realistic breasts with different thicknesses and glandular compositions.
80
a.
<u js £ 3
70
60
50
40
30
20
1 0 -
I I SFM DG= 1.4 ±0.5 mGy
CR DG= 1.7 ±0.5 mGy
El DR 1)<, = 0.9 ± 0.2 mGy
i.rfl ,rfl , n
V <V- V It- 'b Dg measured (mGy)
FIG. 2. DG distribution, measured with TLD and dosimetric phantom for the three types of technologies used in mammography.
REFERENCES [1] INTERNATIONAL ATOMIC ENERGY AGENCY, Quality Assurance Programme for Screen
Film Mammography, IAEA Human Health Series, No. 2, Vienna (2009). [2] ARGO, W. P., HINTENLANG, K„ HINTENLANG, D. E„ " A tissue-equivalent phantom
series for mammography dosimetry", Journal of Applied Clinical Medical Physics, vol.5, n. 4, pp.112-119 (2004).
[3] ALMEIDA, C.D., COUTINHO, C.M.C., PEIXOTO, J.E. et al, "Study of the Attenuation Coefficient of a Breast Phantom Used in Diagnostic Radiology". In: International Nuclear Atlantic Conference, Rio de Janeiro, Brasil (2009).
[4] INTERNATIONAL COMMISSION ON RADIATION UNITS AND MEASUREMENTS, "Tissue Substitutes in Radiation Dosimetry and Measurement", Report 44 (1989).
[5] COUTINHO, C.M.C., Avalia9ao da Dose Glandular em Sistemas de Mamografia Convencional e Digital Utilizando um Fantoma Dosimetrico. Tese de D.Sc., Universidade Federal do Rio de Janeiro, Rio de Janeiro, RJ, Brasil (2009).
[6] NHS CANCER SCREENING PROGRAMMES, "Technical Evaluation of the GE Essential Full Field Digital Mammography System", NHSBSP Equipment Report 0803 (2008).
[7] GENNARO, G„ DI MAGGIO, C,, "Dose Comparison Between Screen/Film and Full-Field Digital Mammography", Eur Radiol, v. 16, pp.2559-2566 (2006).
426
IDOS, Vienna, 9-12 November 2010 E2-CN-182, Paper No INV015
Characterization of a mammography dosimetric phantom
C. D. de Almeidaa, C. M. C. Coutinhoa, J. E. Peixotob and B. M. Dantasa
institute of Radiation Protection and Dosimetry (IRD) Rio de Janeiro, Brazil
"National Institute of Cancer (INCa), Rio de Janeiro, Brazil
E-mail address of main author: [email protected]
The radiologic pattern of the human breast is associated to age, genetic factors, etc, since its composition can vary from mostly adipose to variable quantities of radiologically dense tissues. A large variety of breast phantoms produced with tissue-equivalent materials are used in an attempt to simulate living organs in terms of attenuation and density of the glandular and adipose tissues visualized in radiographic images.
Thus, a set of breast phantoms with semi-circular shapes of different thicknesses and elemental compositions were produced aiming to simulate glandular tissues in the range of 0 to 100 % [1], breast tissue-equivalent Phantom - BTE. Such phantom can be used to evaluate the Incident Air Kerma (K.) and the Glandular Dose (Dg) delivered to the patients submitted to mammography.
Aiming a better characterization of the materials used to produce the phantom, measurements of the attenuation coefficients at 17 keV were performed by varying the tissue thickness from 0 to 5 cm. The density of the Tissue Equivalent Materials was also determined so that the mass-attenuation coefficient could be calculated [2]. The CI IN (carbon-hydrogen-nitrogen) elemental composition was determined. In order to determine K; e Dg, BTE phantom was tested in six mamography clinics using ecran-film systems, CR and DR. TLDs were positioned inside the phantom and on its surface. Data from 392 patients have been collected with including breast thicknesses compressed between 55 and 65 mm, breast composition (adipose and glandular percentage) and radiographic techniques applied in the examinations. Such data have been reproduced to obtain radiographic images of the phantom. This allowed the determination of Dg with TLDs in suitable depth of glandular tissue. Dg values were also obtained by using conversion factors based on K, determined experimentally [3]
Measured values of attenuation coefficients and density of the Tissue Equivalent Materials, as well as CNH composition, were compared to reference values available in the literature [4], Considering the uncertainties associated to the various methods applied by other authors, it is concluded that the phantom studied is appropriate to evaluate the parameters K and Dg in mammography devices. K values determined experimentally with TLDs and calculated using conversion factors are compatible. However a statistically significant difference between Dg values is observed, showing that the theoretical method may overestimate the dose up to 30% when compared to the experimental determination using TLD inserted in the phantom.
A study performed by HOFF [5] presented equivalent results obtained with a model for the calculation of D?
using Monte Carlo Method to simulated the transport of radiation in a mathematical voxel phantom of a real breast composed by 57% adipose tissue and 43% glandular tissue. The author reports reduction on the conversion coefficient of K; to Dg, for this specific breast, of 58% for the technique using 30 kV and Mo/Rh and of 70% for 28 kV and Mo/Mo, assuming the non-anthropomorphic model as the standard [6]. Results reported by DANCE et al. [7] for the same coefficients, also obtained by Monte Carlo using a structured voxel phantom which separates adipose and glandular tissues, show differences varying from -10% to -48%, depending on the type of breast, when compared to the non-anthropomorphic model.
427

Therefore, it can be concluded that the BTE phantom is useful for the determination of the Dg and for the generation of a new table of conversion coefficients from K; to Dg.
REFERENCES
[1] ARGO, W. P., HINTENLANG, K. and HINTENLANG, D. E„ "A tissue-equivalent phantom series for mammography dosimetry", Journal of applied clinical medical physics, v. 5, 112-119, (2004).
[2] SELTZER S. M„ HUBBELL J. H., "Tables and Graphs of Photon Mass Attenuation Coefficients and Mass Energy-Absorption Coefficients for Photon Energies 1 keV to 20 MeV for Elements Z = 1 to 92", National Institute of Standards and Technology - NIST.
[3] EUROPEAN GUIDELINES FOR QUALITY ASSURANCE IN MAMMOGRAPHY SCREENING, "Addendum on Digital Mammography", The European Protocol for the Quality Control of the physical and technical aspects of mammography screening, version 1.0, (2003).
[4] INTERNATIONAL COMMISSION ON RADIATION UNITS AND MEASUREMENTS ICRU, "Tissue Substitutes in Radiation Dosimetry and Measurement", Report 44, (1989).
[5] HOFF, G.., Calculo da Dose em Glandula Mamaria, Utilizando o Codigo de Transporte de Monte Carlo MCNP, para as Energias Utilizadas em Mamografia. Tese de D.Sc., Universidade do Estado do Rio de Janeiro, Rio de Janeiro, RJ, Brasil (2005).
[6] DANCE, D. R„ SKINNER C, L„ YOUNG K. C„ et al. Additional factors for the estimation of mean glandular breast dose using the UK mammography dosimetry protocol. Physics in Medicine and Biology, 2000, 45: 3225-3240.
[7] DANCE, D. R„ HUNT, R. A., BAKIC, P. R„ et al., 2005, " Breast Dosimetry Using High-Resolution Voxel Phantoms", Radiat. Prot. Dosimetry, v. 114, 354-363.
428
IDOS, Vienna, 9-12 November 2010 E2-CN-182, Paper No INV015
A new IAEA handbook for teachers and students: Diagnostic radiology physics
A. Maidment a, S. Christofides b, D. Dance c, K.H Ng d, A. Kesner e, D. McLean e
a Hospital of the University of Pennsylvania Philadelphia, USA b New Nicosia General Hospital, Nicosia, Cyprus c Royal Surrey County Hospital, Guildford, UK
' Department of Biomedical Imaging, University of Malaya, Kuala Lumpur, Malaysia e International Atomic Energy Agency, Vienna, Austria
E-mail address of main author: [email protected]
In late 2005, a consultants' meeting was initiated by the IAEA in order to provide advice on an international syllabus for a Handbook on the Physics of Diagnostic Radiology. A group of five consultants met at the IAEA in Vienna from December 12-16, 2005. The consultants gave presentations on the status of education and training in their own countries. In general, practice as a medical physicist requires specific training at the Master's or Doctoral level, and hospital-based training and experience. A necessary part of the didactic training is a course on the physics of diagnostic radiology.
The consultants reviewed the currently available syllabi and textbooks for suitability as course material. Although many are of high quality, it was felt that limitations existed that would preclude their use world-wide. None provided a sufficiently broad review of international practise. In addition, the cost of the existing materials is likely to prohibit wide dissemination in developing countries. In the light of this, the consultants recommend that an appropriate text entitled The Physics of Diagnostic Radiology be written and supporting materials be developed. This follows the successful publication of Radiation Oncology Physics: A Handbook for Teachers and Students in 2005.
Five years hence, the text is nearing completion. Twenty-five chapters are planned covering radiation physics, dosimetry, x-ray imaging, x-ray computed tomography, magnetic resonance imaging, ultrasound imaging, medical image display, processing and assessment and radiation protection and biology.
A key component in this educational resource is material on dosimetry which is covered by a number of chapters including, Fundamentals of Dosimetry, Instrumentation for Dosimetry, and Patient Dosimetry and Dose. Other chapters that are closely related include Interactions of Radiation with Matter, Radiation Biology, Justification and optimization in clinical practice and Radiation Protection.
As work progresses, additional supporting materials should be developed and include a teachers' reference book with questions and answers, a laboratory manual, provision of the images from the handbook to aid individuals developing lectures, self-instruction slide sets to accompany each chapter, and appropriate software tools and medical and phantom images for use in classroom and laboratory instruction. These can form the basis for a standardized curriculum in the physics of diagnostic radiology.
429


Posters relating to Clinical Dosimetry in Radiotherapy


IDOS, Vienna, 9-12 November 2010 E2-CN-182, Paper No INV015
Newer approaches and developments of quality assurance procedures for intrabeam intra operative radiotherapy unit
K. R. Muralidhar, B. K. Rout, A. Mallik, Poornima
Indo-American cancer institute and Research center, Hyderabad, India.
Email address of main author: [email protected]
The authors present new QA procedures for Intrabeam intra-operative radiation therapy (IORT) system which address some of the limitations of the inbuilt QA procedures and provide various other measurements over the existing QA procedures. Intrabeam System (manufactured by Carl Zeiss, Oberkochen, Germany), is an intraoperative radiotherapy unit. It is a miniature, high dose rate, low energy X-ray source (XRS) equipped with a 10 cm long (0 3.2 mm) probe [1 j.
Currently IORT systems rely on inbuilt QA methods for verification of output, beam deflection, isotropy and straightness of the probe. While manufacturer specified inbuilt QA procedures are more frequently used, it will not give full confidence especially at the time of installation and commissioning
The new approach provides isotropy, beam deflection, isodose output measurements, KVp and MAs measurements, beam quality, energy stability verification, reproducibility and linearity. These tests and measurements also help us to use the computerized planning systems in which we are able to see the 2D and 3D dose distributions on the CT data which is not available at present on this system.
In an IORT facility, the quality assurance needs to be more stringent due to the miniature x-ray source and its high dose rate. These new QA results were compared to the existing readings with the inbuilt QA procedures.
Isotropy test with EDR-2 Films: Five EDR-2 Films were used to test the isotropy of the source. All films kept at 5cm from the source in five directions (0°, 90°, 180°, 270 and perpendicular to the source). Five exposures, each of one minute duration were made. The exposed films were analyzed through Radiological Imaging Technology (RIT) Software. The difference between horizontal and vertical profiles (Fig. 1) gives the dose difference at any given point in that particular plane. A good isotropy shows a negligible difference (<1%) between these two profiles. If the difference is significant, mechanical test and dynamic offset test should be done to get the good isotropy.
Isotropy test with external chamber measurement: Soft x-ray chambers type 23342 with Standard Imaging digital dosimeter is used for this test. The chamber is kept at 5cm and 10cm from the cone from 5 sides. Readings were taken for 10 sec for all positions and compared with each other. The maximum differences among these readings were within 1% which shows the isotropy of the system.
Isotropy test with the survey meter: Inovision survey meter kept at various distances (5, 50,100, and 200cm) in four directions from the source. Dose rate measurements were taken in all positions and compared with each other. Isotropy was estimated with the help of this. The differences between these measurements were negligible (<1%) which directly shows that the system is in good isotropy.
433
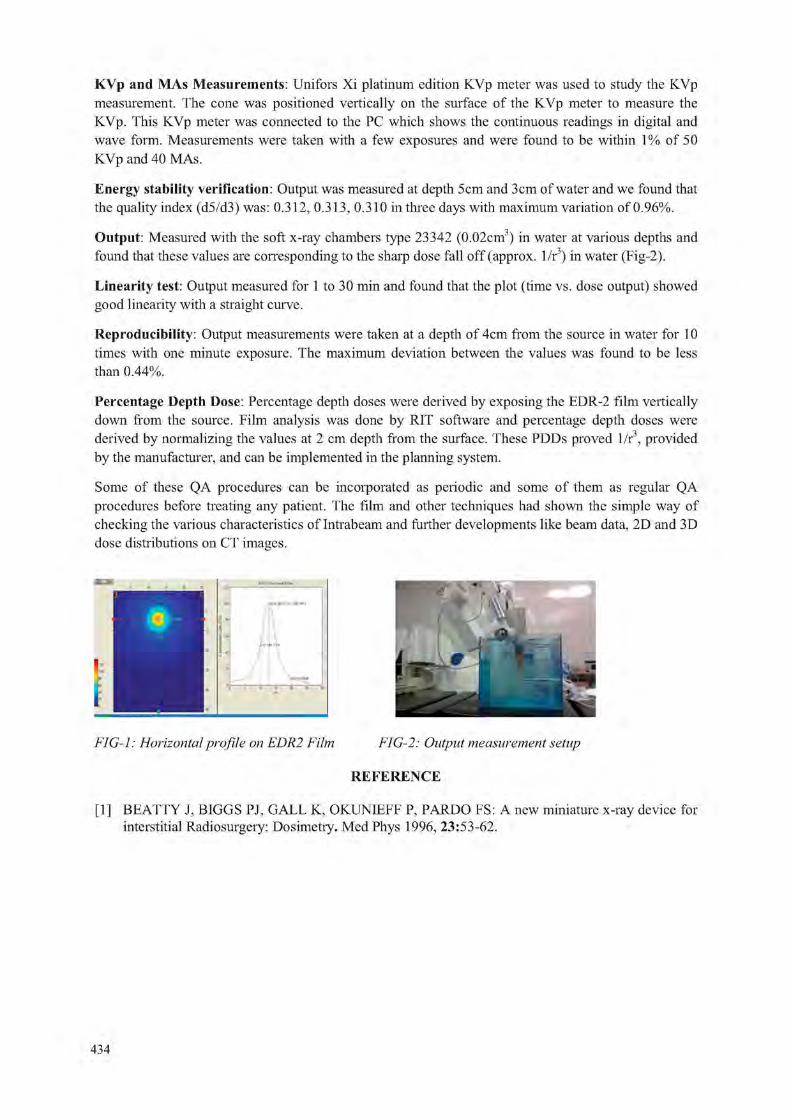
KVp and MAs Measurements: Unifors Xi platinum edition KVp meter was used to study the KVp measurement. The cone was positioned vertically on the surface of the KVp meter to measure the KVp. This KVp meter was connected to the PC which shows the continuous readings in digital and wave form. Measurements were taken with a few exposures and were found to be within 1% of 50 KVp and 40 MAs.
Energy stability verification: Output was measured at depth 5cm and 3cm of water and we found that the quality index (d5/d3) was: 0.312, 0.313, 0.310 in three days with maximum variation of 0.96%.
Output: Measured with the soft x-ray chambers type 23342 (0.02cm3) in water at various depths and found that these values are corresponding to the sharp dose fall off (approx. 1/r3) in water (Fig-2).
Linearity test: Output measured for 1 to 30 min and found that the plot (time vs. dose output) showed good linearity with a straight curve.
Reproducibility: Output measurements were taken at a depth of 4cm from the source in water for 10 times with one minute exposure. The maximum deviation between the values was found to be less than 0.44%.
Percentage Depth Dose: Percentage depth doses were derived by exposing the EDR-2 film vertically down from the source. Film analysis was done by RIT software and percentage depth doses were derived by normalizing the values at 2 cm depth from the surface. These PDDs proved 1/r3, provided by the manufacturer, and can be implemented in the planning system.
Some of these QA procedures can be incorporated as periodic and some of them as regular QA procedures before treating any patient. The film and other techniques had shown the simple way of checking the various characteristics of Intrabeam and further developments like beam data, 2D and 3D dose distributions on CT images.
FIG-1i Horizontal profile on EDR2 Film FIG-2: Output measurement setup
REFERENCE
[1] BEATTY J, BIGGS PJ, GALL K, OKUNIEFF P, PARDO FS: A new miniature x-ray device for interstitial Radiosurgery: Dosimetry. Med Phys 1996, 23:53-62.
434

IDOS, Vienna, 9-12 November 2010 E2-CN-182, Paper No INV015
Verification of newly upgraded radiation therapy treatment planning system XIO CMS at the Institute of Oncology Vojvodina
B. Petrovic3, L. Rutonjski3, M. Baucal3, M. Teodorovic3, E. Gershkevitshb
3 Institute of oncology Vojvodina, Radiotherapy department, Sremska Kamenica, Serbia
"North Estonia Regional Hospital, Tallinn, Estonia
E-mail address of main author: [email protected]
Verification of newly installed or upgraded treatment planning system (TPS) is highly recommended and number of protocols and guidelines have been published by professional organizations [1,2]. In these guidelines, a number of functionalities of TPS are needed to be checked, such as how it handles patient anatomical information, inhomogeneities, beam geometry, accessories, etc. One of the important aspect is the ability to reproduce measured dose distribution by the dose calculation algorithms. The purpose of calculation accuracy verification for treatment planning system is to ensure the agreement between planned and delivered radiation dose to a patient, and to minimize the likelihood of accidents in radiotherapy [1, 3, 4],
Within the framework of IAEA TC project SRB 6 006 the upgrade of TPS at the Institute of oncology Vojvodina has been performed. After TPS upgrade the following checks have been performed:
CT number to the relative electron density conversion table verification of accelerator input data which was entered upon first installation of the TPS at the institution, with the newly re-measured data treatment planning for the number of clinical test cases were performed on semi anthropomorphic phantom, and compared to measured data measurements with ion chamber were done in the same phantom and compared with TPS calculated values -corrective actions were done for the data observed as erroneous, comparison of algorithm previously used at the institution (convolution) and the superposition, which is used after the upgrade
The measurements were performed in the CIRS Thorax phantom, described in literature [3]. The phantom was scanned twice using local CT. For the first scan the relative electron densities reference plugs were inserted to obtain CT numbers to the relative electron density conversion curve. The curve obtained, was not significantly different from the default CT to ED table already used at the institution, so the old table was kept in use. The second scan was used for the planning of clinical test cases.
CT images of the phantom in DICOM format were transferred to the TPS via local network. The description of test cases, reference and measurement points are given elsewhere [3]. Calculation with FFT convolution algorithm, of test cases in TPS showed significant difference, in comparison with the same test cases calculated with superposition algorithm. This is confirming that more complex algorithms are more accurate, and should be used for clinical treatment planning. Measurements were performed for 6 MV and 15 MV photon beams.
The agreement between measured and TPS calculated doses with Superposition algorithm showed significant improvement over calculation with FFT convolution algorithm. Therefore, FFT convolution algorithm was abandoned.
435

In previous TPS XIO CMS version 4.2.0 we used FFT convolution calculation algorithm, to speed up the calculations due to old hardware. Otherwise, the calculation time with superposition algorithm would be unacceptably long for clinical use. After the upgrade of software (version 4.5.0) and hardware of TPS the superposition algorithm could be used without limitations.
EDW wedge factors were also checked, and very good agreement was found with the reference data.
After inspection of dosimetric data entered into TPS, it was found that the head scatter factors (Sc) for 15 MV photon beam was not correct and new measurements with the mini phantom were performed to correct it.
For electron beams only visually inspection of input data was carried out by comparing with another similar machine (feasibility check). One typographical error was found for the output value of one cone. For two other cones (15x15 and 10x10), for one energy (6 MeV), by mistake, the same output values were entered in the machine data.
As a result of the verification, few errors in the TPS were detected and corrected. The verification of previous version was actually never done, and that is the reason why these errors were never revealed. Now, more accurate algorithm is in use, and uncertainty which followed physicists of the department at the institution for years, is finally solved.
REFERENCES
[1] INTERNATIONAL ATOMIC ENERGY AGENCY, Commissioning and quality assurance of computerized planning systems for radiation treatment of cancer, Technical Report Series No. 430. IAEA, Vienna (2005).
[2] AMERICAN ASSOCIATION OF PHYSICISTS IN MEDICINE, Quality assurance for clinical radiotherapy treatment planning. Med Phys 25, (1998) 1773.
[3] GERSHKEVITSH, E., et al., Dosimetric verification of radiotherapy treatment planning systems: Results of IAEA pilot study, Radiother Oncol 89 (2009) 338.
[4] INTERNATIONAL ATOMIC ENERGY AGENCY, Commissioning of Radiotherapy Treatment Planning Systems: Testing for Typical External Beam Treatment Techniques, IAEA-TECDOC-1583, Vienna (2008)
[5] INTERNATIONAL ATOMIC ENERGY AGENCY, Specification and acceptance testing of radiotherapy treatment planning systems, IAEA-TECDOC-1540, Vienna (2007)
436
IDOS, Vienna, 9-12 November 2010 E2-CN-182, Paper No INV015
Practical use of diode array to help determine small field data in order to commission an IMRT TPS with MLC
C, Castellanos, G. Castillo
Radonic, Dominican Republic
E-mail address of main author: [email protected]
It is well known that output factors are to be determined as a part of an extensive set of data in order to comission a treatment planning system (TPS). However, in 3DRT, it is enough to measure with an ion chamber down to 2x2 cm1. For intensity modulated radiotherapy (IMRT), modulation with multileaf collimators (MLC) is done with a sequence of leaf movements or positions because radiation is actually filtered when doing so, as shown in figure 1. Note the small fields delimited during leaf positioning.
Leaves are made of materials with large attenuation factors, such as tungsten. They are to be narrow in order to conform small fields with curves and complicated forms, and also have several centimeters height in order to filter radiation down to 1-2%. A usual type of leaf is one with a curved end which provides field shaping when working throughout a range of field sizes, including asymetrical ones. This curved end does not provide the same output factor for small fields compared to those of same size obtained with main jaws due to their squared form. This fact plus interleaf transmission, provides a higher output factor for small fields conformed with MLC than the one of the same size obtained with jaws and, of course, the extrapolated value to zero field size.
This higher value will be taken into account for the TPS in order to calculate dose when dealing with highly closed leave configurations. Figure 2 shows a clear difference in dose not only within the slit but also in the penumbra. This effect will affect the whole dose map when running calculations, and also measurements for comparison. For more complex leaf configurations, we ran a test with both cases and measured the dose fluence with a diode array (Mapcheck). In this case we obtained much better agreement between fluences predicted for the TPS with those ones we measured, not only for the type of case as shown, but also when running actual patient calculations.
Materials and Methods
We used a Mapcheck along with its software and MIRS (Modular Integrated Radiotherapy System, Nuclemed, Argentina) TPS, which was already commissioned for 3DRT. Also two Varian linear accelerators: a 600C and a 2100C, There are two important factors the system takes into account in order to calculate attenuation and small field doses for each configuration of leaves. First, leaf transmission must be carefully determined trying not to measure near the leaf end. And second, by means of having leaves to configure small fields down to lxl cm2, the zero output factor was extrapolated. We must mention here that jaws were set to 10x10 cm2, which is key here because the main collimators define a beam with less penumbra than the leaves. Dose measurements were made with an absorbed dose calibrated diode array (Mapcheck) with a buildup of 2 g/cnr. Final determination of output factor for no field is acomplished by means of extrapolation when defining small field sizes with the MLC collimators and not the jaw collimators. We have checked the final results for a more complex MLC step and shoot test with results shown in figure 3.
437

FIG 1. Leaf positions when doing IMRTfields.
FIG 2. Profiles of dose fluence generated by TPS in two situations with lcm slit off axis (jaws set for a 10x10 cm2 field): uncorrected, assuming output factor for zero size beam as collimated with jaws, and corrected assuming our data. Differences are as high as 12%.
FIG 3. Actual map doses measured with a diode array device showing points that do not pass the 3%-3mm test for absolute dose. Left before the correction (62% pass), and right, after the output factor zero correction (96% pass).
Conclusions
When comissioning a treatment planning system for IMRT with MLC, small field data have to be taken defining them with leaves and not the main collimators. This is due to additional scatter and transmission at leaf ends that define small fields when delivering an IMRT treatment. The main collimators are set to delimit a rectangular region in which a secuence of leaf positions modulate the beam.
2
Diodes have a small cross section (6mm") and are more convenient than ion chambers for this kind of measurement. High conformace to the 3%-3mm test for absolute dose is achieved with this method when measuring dose maps with a diode array.
438

REFERENCES
[1] SANCHEZ-DOBLADO F et al, A new method for output factor determination in MLC shaped narrow beams. Physica Medica. 2007 June;23(2):58-66.
[2] LETOURNEAU, D et al. Evaluation of a 2D diode array for IMRT quality assurance. Radiotherapy and Oncology 2004 Feb;70(2): 199-206.
439

IDOS, Vienna, 9-12 November 2010 E2-CN-182, Paper No INV015
The choice of detector for linear accelerator & TPS commissioning 1 2 2 2 E. Gershkevitsh , A. Peraticou , D. Dimitriadis , A. V. Aritkan ,
2 2 2 2 T. Efthymioii , E. Stylianou Markidou , A. Giannos , C. Constantinou
! North Estonia Regional Hospital, Tallinn, Estonia 2 Bank of Cyprus Oncology Centre, Nicosia, Cyprus
E-mail address of main author: [email protected]
Each treatment planning system (TPS) requires a set of measured data (PDDs, profiles, output factors, etc.) form linear accelerator in order to create a beam model in TPS. It is known that there is no single detector which could suit well all measurements. Usually, the choice of detector is left upon medical physicist.
In this study we collected the data for 6 & 15 MV photon beams from Elekta Synergy accelerator to commission CMS XiO TPS. We have compared the response of different detectors for typical measurement situations required by TPS. The measurements were performed in large water tank (MP3, PTW, Freiburg) using Farmer type ion chamber (0.6 cm3, PTW30013), semiflex ion chamber (0.125 cm3, PTW31010), 3D pinpoint ion chamber (0.016 cm3, PTW31016), diamond detector (PTW60003), photon diode (PTW60008) and electron diode (PTW60012) [1,2],
The output factors for small field (lxl cm2) are more accurately measured with solid state detectors, although photon diode is overestimating the response by up to 4.6% when compared to diamond detector. For large field sizes (> 20x20 cnr) Fanner or semiflex ion chamber give similar results, while all the other detectors are overestimating the response due to large low energy scattered photon component. The highest over response of 7.2% is observed with electron diode (Figure 1). Beam profiles and penumbra values for small to intermediate field sizes (< 20x20 cm') are best obtained with photon diode due to small detector size. However, at larger field sizes and deeper depths it over responds to low energy scattered photons which alters the off-axis ratio and width of penumbra. Percentage Depth Doses are best measured by ion chambers, using pinpoint for small field sizes (< 2x2 cm2) and scmiflcx for larger field sizes. On figures 2 and 3 the percentage depth dose data (PDD) and build-up region for 6MV photon beam and field size lxl crrf are shown for different detectors.
The results were compiled into a table which can be used as a guide to select the appropriate detector for TPS commissioning. It should be noted, however, that the choice of detector is also dependent on the type of data required by particular TPS. For example, for dose profile measurements depending on which part of the profile is required (flattened area, penumbra or tail) the combination of different detectors may have to be used.
441

Figurel. Output factors for 6MV photon beam measured with deifferent detectors
0 5 10 15 20 25 30 35 40
Field size (cm)
Figure 2. PDDs for 6MV photon beam ( l x l c m 2 field size) measured w i th di f ferent detectors
-Farmer 30013
— Photon diode 60008
-Pinpoint 31016
-Electron diode 60012
-Semiflex 31010
-Diamond 60003
100 150 200 Depth (mm)
Figure 3. Build-up region for 6MV photon beam ( l x l c m 2 field size) measured w i th di f ferent detectors
Farmer 30013
Photon diode 60008
Pinpoint 31016
tlectron diode 60012 -
•Semiflex 31010
•Diamond 60003
REFERENCES
[1] GRIESSBACH, I., LAPP, M,,BOHSUNG, J. Dosimetric characteristics of a new unshielded silicon diode and its application in clinical photon and electron beams. Medical Physics 2005 32(12): 3750-3754.
[2] SCHERF, C,,PETER, J.,MOOCi, J., et al. Silicon Diodes as an Alternative to Diamond Detectors for Depth Dose Curves and Profile Measurements of Photon and Electron Radiation. Strahlenterapie and Onkologie 2009:185,530-536.
442

IDOS, Vienna, 9-12 November 2010 E2-CN-182, Paper No INV015
Quality assurance of IMRT plan evaluation and dosimetric comparison using AAPM Task Group 119
M.Ravikumar, S. Sathiyan, C.Varatharaj. Department of Radiation physics, Kidwai Memorial Institute of Oncology, Bangalore -29. INDIA.
E-mail address of main author: [email protected]
Introduction
Intensity Modulation Radiotherapy (IMRT) planning demands stringent quality assurance and accurate dose determination for delivery of highly conformal dose to the patients. Generally 3-D dose distributions obtained from a treatment planning system have to be verified by dosimetric methods (Herzen J 2007). Commissioning studies are best done by defining target and normal structure shapes on CT images of the dosimetry phantom, planning the treatment, and then comparing the measured dose in the phantom to the planned dose from the computer system. These studies should mimic the types of target and structure geometries along with the target doses and dose constraints that are likely to be encountered in the clinic. IMRT commissioning procedure based on multi institution planning and dosimetiy comparisons was proposed by AAPM task group 119 (Ezzell G A 2009). In order to verify our IMRT QA procedure and to establish the practical base line commissioning, we downloaded the AAPM TGI 19 test suite DICOM-RT images and structure sets to our treatment planning system (TPS) for planning and dosimetric comparison. The square slab phantom CT images of dimension 30 cm X 30 cm x 15 cm were loaded to the Eclipse (V8.6) TPS.
Material and Methods
In our study, we used the square slab phantom of water equivalent plastic (p=1.045 g/cm3). The phantom can permit point dose measurement with ionization chamber and planar dose measurement with film. The RK chamber of volume 0.125 cm3 was used for point dose measurement. The ratio of reading to planned dose was established by irradiating the phantom with parallel-opposed 10x10 fields arranged isocentrically. We also obtain the CT images of ion chamber array detector (I'matriXX) with the slab phantoms by positioning the array detector plane at 10 cm depth from the phantom surface and the same was transferred to the TPS to create the verification plans. The planar dose distributions were analyzed using gamma criteria of 3% dose and 3 mm Distance to Agreement(DTA). The gamma analysis was carried out in regions with a threshold dose of 10% of the maximum dose to avoid the very low dose regions.The TG-119 protocol recommends evaluation of dose distribution produced by each field individually and also with cumulative fields. The evaluation procedure consists of two preliminary tests with simple fields irradiating the phantom to demonstrate the reliability of the assessment system for non-IMRT dose delivery followed by five tests of IMRT plans with increasing complexity. The IMRT planning goals were expressed in total doses to target and organs at risk (OAR) with the daily dose of 180-200 cGy. These tests were all performed at 6 MV photons available at our Clinac - DHX linear accelerator.
443

Results and Discussion
Ion chamber measurements were obtained with averaged values over a single point at the chamber centre. The variation in dose within the chamber volume was found to be 1% in the PTV region and 2% within the OAR. The difference between the measured and planned doses was expressed as a ratio of the prescription dose as this choice was deemed more clinically relevant, especially for low dose regions, for which reporting the difference from the local dose can overstate the clinical importance of the deviation. Table 1 & Table 2 shows the results from high dose points in the PTV and low dose point in the avoidance structure measured with ion chamber.
Table: 1. High dose points in the PTV measured with ion chamber: [(measured dose)-(plan dose)]/prescribed, averaged over test plans measured with associated confidence limits.
Test Location Mean Std. dev. (o) Max. Min Multitarget Isocenter -0.0142 0.0029 -0.0117 -0.0174 Prostate Isocenter -0.0043 0.0116 0.0035 -0.0267 Head and Neck Isocenter -0.0067 0.0062 -0.0004 -0.0077 C Shape 2.5 cm anterior to isocentre -0.0013 0.0152 0.0234 -0.0141 Overall combined -0.0066 0.0090 0.0037 -0.0164 Confidence limit <{mean}+1.96o)
0.0110
Table:2. Low dose points in the avoidance structure measured with ion chamber: [(measured dose)-plan dose)]/prescribed, averaged over test plans measured with associated confidence limits.
Test Location Mean Std. dev. (o) Max. Min Multitarget 4 cm inferior to isocenter 0.0088 0.0055 0.0142 0.001 Prostate 2.5 cm posterior to isocenter -0.01037 0.0129 0.0038 -0.0263 Head and Neck 4 cm posterior to isocentre 0.0112 0.0066 0.0219 0.004
C Shape Isocenter 0.0130 0.004773 0.01912 0.00903 Overall combined 0.0070 0.0090 0.0180 -0.0030 Confidence limit <{mean}+1.96o)
0.024
The I 'matrixx results for cumulative fluence analysis for high dose planes has shown the percentage of points passing the gamma criteria <1.0, averaged over all tests was 94.48 ±1.8. For low dose planes, the percentage of points passing the gamma criteria, averaged over all the tests was 93.73±2.2. The overall results for the percentage of points passing the gamma criteria for field by field analysis were 94.60 ±0.36.
The observed difference in dose and fluence between measurement and prediction could be due to uncertainty in measurment, limitation in accuracy of the dose calculation algorithm and the inherited limitations in the dose delivery mechanisms. Though the tests carried out can not differentiate the uncertainities individually, but can test the overall accuracy of the treatment delivery system. The results obtained at our institute were comparable with the results of other institutions as mentioned in the TG 119 protocol.
REFERENCES
[1] HERZEN J, TODOROVIC M ET AL. Dosimetric evaluation of a 2D pixel ionization chamber for implementation in clinical routine. Phys Med Biol 2007; 52: 1197-1208.
[2] EZZELL G A, BURMEISTER J W ET AL IMRT commissioning: Multiple institution planning and dosimetiy comparisions, a report from AAPM Task group 119. Med Phy 2009; 36; 5359-73.
444

IDOS, Vienna, 9-12 November 2010 E2-CN-182, Paper No INV015
Comparison of four different commercial devices for RapidArc and sliding window IMRT QA
12 1 2 1 1 C. Varatharaj ' , S. Stathakis , M. Ravikumar , C. Esquivel , N. Papanikolaou
' Department of Radiation Oncology, CTRC, UTHSCSA at San antonio, Texas, USA.
o "Department of Radiation Physics, Kidwai Memorial Institue of Oncology,Bangalore, INDIA.
E-mail address of main author: [email protected]
Introduction: The evaluation between measured and calculated dose plays an essential role in the quality assurance (QA) procedures for intensity modulated radiation therapy (IMRT). The high flexibility of VMAT delivery and the complexity of the systems involved will require new methods and potentially new tools for the quality assurance of these treatments. (Letoumeau et al 2009, Buonamici et al 2007). In the present study we aim to evaluate and compare the dosimetric performances of EDR2 film and three commercial QA devices: IBA I'MatriXX (IBA dosimetry,GmbH, Germany), PTW Seven29 array (PTW Freiburg GmbH, Germany) and DELTA"* array( ScandiDos AB, Uppsala, Sweden). The evaluation of the dosimetric systems includes RapidArc and IMRT deliveries using a NovalisTX linear accelerator for plans generated and calculated using the Varian Eclipse Treatment Planning System (TPS).
Materials and Methods: Fifteen (n 15) consecutive RapidArc plans and ten (n=10) IMRT plans were used for this study. All plans were optimized using Eclipse Treatment Planning System (TPS) (Version 8.6, Varian Medical Systems, Palo alto, CA, USA). For all plans used in this study the corresponding verification dose distributions were calculated using four (n=4) geometries. These geometries include an acrylic phantom with film, the IBA Multicube (IBA Dosimetry, Schwarzenbruck, Germany) with the MatrixX, the PTW Octavious phantom with the PTW seven29 array, and the Scandidos Delta4 device. All plans and deliveries were calculated and delivered using the actual planned gantry and collimator angles respectively. For the comparison between measurements, the whole plan (field information and dose matrix) in the case of the Delta4 or a dose plane at the level of the detectors was exported to each device's analysis software. All measurements were compared against the calculated ones, first by taking into account all points in the measurement planes, and second by applying a threshold value where the points that received less than 20% of the normalized dose were excluded from the gamma index calculation.
Results: Figure 1 shows a typical comparison between measured and planned horizontal profiles for a lung RapidArclM case using the four different detectors. Figure 2 shows the measured and planned isodose distribution comparisons for the four different detectors of a liver sliding window IMRT case. Among these 25 plans, using all available points for the gamma calculation, all of them passed the criteria (3.0% and 3mm DTA) of having gamma values < 1 (more than 90% of points). A few verification plans failed to pass the set gamma criteria when the evaluated points were limited to those only receiving more than 20% of the maximum dose. In the case of RapidArc™ QA measurements several film and one PTWSeven29 measurements failed, while for the IMRT QA plans, two film and two I'MatriXX measurements failed. All of Delta4 measurements met the gamma criteria. On average all the QA devices produced very similar results. When all points were included in the calculation of the gamma index, minimal differences were observed. This was further supported by the Bland-Altman analysis that was performed and showed that all the calculated gamma values of all the detectors were within 5% from those of the film.
445

Conclusion: In the present study four different methods for patient specific RapidArc and IMRT QA were evaluated. The results showed that there insignificant differences between the detectors. All patient QAs passed the routine clinically criteria of gamma index values of 3% dose difference and 3mm DTA. We conclude that the dosimetric systems under investigation can be used interchangeably
for routine patient specific QA.
.55 o a hnaa Pup*
FIG 1 Comparisons of Measured and Planned horizontal profiles for a Lung Rapid Arc case using a. Film, b. I'matriXX, c. PTW Seven 29 Array and d, Delta4 Array.
FIG 2. Comparisons of Measured (Solid Lines) and Planned (Dotted lines) isodose distributions for a Prostate Rapid Arc case using a. Film, b. I'matriXX, c. PTW Seven 29 Arret}' and d, Delta4 Array.
REFERENCES
[1] BANCI BUONAMICI F, COMPAGNUCCI A, MARRAZZC) L et al 2007 An intercomparison between film dosimetry and diode matrix for IMRT quality assurance Med. Phys. 34 1372-79.
[2] LETOURNEAU D, PUBLICOVER J et al 2009 Novel dosimetric phantom for quality assurance of volumetric modulated arc therapy Med, Phys. 36 1813-21.
446

IDOS, Vienna, 9-12 November 2010 E2-CN-182, Paper No INV015
Isocentric electron treatments with shortened applicators
J. Niemela3, M. Tenhunenb, J. Keyrilainen0
a Radiation and Nuclear Safety Authority, Helsinki, Finland
b Department of Oncology, Helsinki University Central Hospital, Helsinki, Finland
E-mail address of main author: [email protected]
Objective
In external radiotherapy, standard electron applicators do not normally allow isocentric treatments. In Helsinki University Central Hospital they have shortened electron applicators to enable isocentric electron treatments together with photons [1], In this study we will determine the beam properties of shortened applicators including depth dose curves, central axis profiles and output factors at SSD 90-100 cm by means of measurements and Monte Carlo simulations. As well as comparing TPS calculation algorithms to Monte Carlo simulations and measurements at shorter SSDs, we will also pinpoint the beam property differences of shortened applicators to conventional ones.
Materials and methods
We have shortened the standard electron applicators by 10 cm to enable isocentric electron treatments with two Varian Clinac 2100CD accelerators. The surface of the applicator extends to 85 cm from the source. Shortened applicators were commissioned and configured for the TPS electron calculation algorithm. Measurements were done by plane-parallel ion chamber, silicon diode and EBT film, and Monte Carlo simulations by BEAM user code of EGSnrc system.
Results
Depth dose characteristics of the shortened applicators remained unchanged from standard applicators. Penumbrae were broadened by 1-3 mm depending on electron energy and depth as the air gap was increased from 5 cm of the standard applicator (SSD=100 cm) to 10 cm of the shortened applicator (SSD=95 cm); this could be modelled in the treatment planning system with the same accuracy as with normal applicators with SSD = 100 cm. Further results at SSD 90 - 95 cm will be demonstrated together with output factors and TPS dose calculation competence.
Conclusions
External radiotherapy treatment with electrons is feasible with SSD range of 90 - 100 cm with shortened election applicators. This allows us to combine the electron and photon treatments using isocentric technique in e.g. postmastectomy radiation therapy, leading to more accurate patient positioning and time sparing during treatment, as patient re-positioning between photon and electron treatment is no more necessary.
REFERENCES
[1] TENHUNEN, M. NYMAN, H„ STRENGELL, S. VAALAVIRTA, L.: Linac-based isocentric electron-photon treatment of radically operated breast carcinoma with enhanced dose uniformity in the field gap area. Radiotherapy and Oncology 93 (2009) 80-86.
447


IDOS, Vienna, 9-12 November 2010 E2-CN-182, Paper No INV015
A virtual Monte Carlo based model of an IORT electron accelerator
A. Toussaint3, J. Wulff , H.-O. Neidelb, F. Ubrichb, K. Zinkab
a University of Applied Sciences Giessen-Friedberg, Institut fur Medizinische Physik und Strahlenschutz - IMPS, Giessen, Germany
b University Hospital Giessen and Marburg GmbH, Klinik fur Strahlentherapie, Marburg, Germany
E-mail address of main author: [email protected]
Compact electron linear accelerators are capturing more and more operating theaters worldwide. To cover a wide range of intra operative radiotherapy applications, they are equipped with different electron energies and a large number of electron applicators. Therefore, extensive dosimetric measurements are required. The aim of the present study is to develop a virtual accelerator model by Monte Carlo simulations to reduce the amount of measurements and concurrently to reduce the dosimetric uncertainty.
At the University Hospital Marburg (Germany) a mobile accelerator MOBETRON manufactured by IntraOp Co. (USA) is installed. The linac provides the capability of intra-operative electron radiotherapy in the energy range 4 - 1 2 MeV. The applicators are made of surgical steel with diameters between 3 and 10 cm. To fit simple and more complex beam geometries, all applicators are delivered with plane and oblique (45°) tube endings. The Monte Carlo simulations were performed with the EGSnrc code, using the application BEAMnrc to model the accelerator head and CAVITYnrc to calculate the dose within an ionization chamber positioned in a water phantom [1;2], The ion chamber (Advanced Markus chamber, PTW Germany) was included in all dose calculations. The accelerator head was modeled in detail based on the information of the manufacturer. This information included the geometrical as well as the necessary material data. The principal simulation geometry excluding the water phantom and the ionization chamber is shown in figure 1. Unknown in all simulations of medical accelerators is the width and divergence of the primary electron beam hitting the first scattering foil as well as the spectral electron fluence.
During Monte Carlo simulations these parameters were varied and the resulting depth dose data and dose profiles were compared with measurements taken at the MOBETRON accelerator. Regarding the primary electron fluence, a Gaussian distribution was assumed for all simulations. The optimal fit of the experimental data was achieved with a simple point source model of the primary electrons and an opening angle at the exit window of one degree, resulting in a 0.44 mm beam focus at the first scattering foil. The electron energies and the width of the fluence distribution resulting from these simulations are summarized in table 1. Using these parameters, all simulations of the depth dose curves and profiles agree with the experimental data within the measurement uncertainty of ±2% and ±0.5 mm (see FIG. 1). It should be stated, that the accuracy obtained was achieved only when the ionization chamber was included in all simulations.
FIG. 1. Schematic drawing of the
accelerator model: 1) first scattering foil
2) secondary foil 3) primary collimator 4) monitor chamber
5) secondary collimator 6) applicator
449

E„ in MeV Emean m MeV FWHM in % 4 4,15 15 6 7,00 15 9 9,80 15 12 12,50 15
Table. 1. Simulation parameters concerning the primary electron fluence of the MOBETRON accelerator: EQ is the nominal energy, Emean the mean energy resulting from the simulations. For all
simulations a Gaussian distribution was assumed, the width is given in column 3.
The study shows that an accurate simulation of the mobile electron linear accelerator using Monte Carlo techniques is possible. The simulation of the complete set of applicators is in progress. After completion, the virtual accelerator model may be applied to patient related phantoms to learn more about dose distributions within the patient during intra operative applications.
FIG 2 Relative depth dose curves for the electron energies given in tab. 1. Plane
applicator, diameter 10 cm. lines: experimental data/symbols: simulation
FIG 3. Half beam profiles of the 10 cm applicator at 12 MeV
lines: experimental data /symbols: simulation
REFERENCES
[1] KAWRAKOW, I.; ROGERS, D.W.O.: The EGSnrc Code System: Monte-Carlo Simulation of Electron and Photon Transport. Technical Report P1RS-701, Ottawa: National Research Council of Canada, 2003
[2] ROGERS, D. W. 0.; FADDEGON, B. A.; DING, G. X.; MA, C, M.; WE, J.; MACKIE, T. R.: BEAM - A Monte Carlo Code to Simulate Radiotherapy Treatment Units. Med.Phys. 22:5 (1995), 503-524
450

IDOS, Vienna, 9-12 November 2010 E2-CN-182, Paper No INV015
Experimental investigation of a computed radiography system as detector for dosimetry
M. Rouijaa, R.P. Kapsch
Physikalisch-Technische Bundesanstalt (PTB), Bundesallee 100, D-38116 Braunschweig, Germany
E-mail address of main author: [email protected]
Several techniques have been developed for detecting radiation. However, very few have been established for detecting a radiation image two-dimensionally. The most widely used technique in this area is photo film. The advantages of the computed radiography (CR) systems become clear when they are compared with photo films or other radiation image sensors. They offer an ultrahigh sensitivity and can be used in a much larger dose range. One distinct advantage of the CR systems is that they have a higher spatial resolution. Depending on the purpose, the reading density with a CR plate can be selected from 5 to 40 pixels/mm. This feature particularly makes the CR plate a very useful tool in the area of dosimetiy; especially when it comes to investigate small and irregular fields. A comparative study of CR plates with ion chambers shows that the ion chambers clearly underestimate the output factors of small beams, whereas CR plates shows flatter profiles, sharper resolution and better accuracy in critical flatness and penumbra measurements.
The aim of this work is to optimize the accuracy of the CR system as a dosimetric device. This includes the evaluation of various tests and Monte Carlo simulations. A KODAK ACR-2000i system was used in this study. It comprised a laser scanner connected to a PC and Kodak CR plates. The photon radiation used for these investigations was provided by the 60<3o unit available at PTB. The CR plates were placed in a PMMA (polymethylmethacrylat) phantom at a depth of 5 cm and irradiated with a 10 cm X 10 cm field at a 100 cm source-surface distance.
First, the influence of the time span between the irradiation and the read-out as well as the light exposure during the delay time was investigated. In these studies the CR plate was irradiated with a fixed dose, namely 100 cGy. The stored image was read out with the scanner after different times. During each batch, the light exposure was kept constant at 2.5 lux and 25 lux respectively. An additional investigation was carried out in an almost completely dark room (0.0 lux).
Fig. 1 illustrates clearly a decay of the scanner unit value (SU) over time. This decay with delay time between the irradiation and the read-out appears to follow a power law. The figure illustrates also that the light exposure can largely affect the decay of SU values. Therefore, it is recommended that the room light and the light exposure must be carefully controlled in order to obtain reproducible results.
451

Dose = 100 cGrv
FIG 1: Rate of scanner unit decay in dependence on the time after exposure at different light exposures.
Furthermore, the variation of the response of the CR system with photon energy was studied. It was hypothesized that lead filters could reduce the variation of the energy response of a CR plate. Hence, different thicknesses of lead were placed on each side of the CR plate in the PMMA phantom. A simple comparison between the experiments carried out with and without lead demonstrated that the SU value was significantly influenced when a lead filter was placed at the front, at the back, or on both sides. In order to improve the dose-response reproducibility, two types of beams were used, a ~°Co beam and a 6 MV one of PTB's clinical accelerator of the type Elekta Precise.
ACKNOWLEDGEMENTS
The research within this EURAMET joint research project leading to these results has received funding from the European Community's Seventh Framework Programme, ERA-NET Plus, under Grant Agreement No. 217257.
452

IDOS, Vienna, 9-12 November 2010 E2-CN-182, Paper No INV015
Analysis of portal dose prediction verification results: Small clinic practical view
H.E. Hietala
Oulu University Hospital, Division of Oncology and Radiotherapy, Finland
E-mail address of main author: [email protected]
Patient-specific quality assurance results with Portal Dose Calculation (PDC, Eclipse™ 8.1, Varian Medical Systems, Palo Alto, CA) for pre-treatment verification of 243 sliding window IMRT fields were analyzed for a linear accelerator Clinac iX (Varian Medical Systems) with nominal 6 MV energy and Millenium MLC incorporating 120 leaves. The linac is equipped with a flat panel amorphous silicon (a-Si) electronic portal imaging device (EPID) a-SlOOO with image detection unit (IDU) and image acquisition software (IAS) versions IDU-20/IAS3. Data were collected during an approximately one-year period around 2009.
The properties of the Varian PDC method [1] and the gamma evaluation method [2] that it exploits as an error detection method have been described elsewhere. All the plans were calculated with a dose rate of 300 MU/min, source to detector distance (SDD) 105 cm, for 4 to 7 (before automatic split) field IMRT plans with different treatment doses in the range of 14 to 70 Gy (mean 52.9 Gy). The measurements were made with no additional build-up with gantry angle reset to zero. One field was excluded because the imager was not aligned to the correct distance before measurement. Three fields were excluded because the PDC routine did not correctly deal with artificial reference images for split fields that were divided into more than two subfields. Twenty-one fields were excluded because the fields extended over the detector area (crossplane axis > 14.2 cm). The remaining fields were divided into groups firstly by field size, because for field axes less than 7.5 cm the effect of nonuniform backscatter is minimal [3], secondly by split or non-split carriage property and thirdly by treatment site. The fields were analyzed using ROI covering 1 cm around the collimator positions and gamma index 3% global dose difference and 3 mm distance to agreement as acceptance values. Maximum gamma, average gamma and percentage of area with gamma >1.0 values were recorded. All fields were also visually evaluated and the findings recorded.
The parameter mean values and standard deviations for all fields and for the subgroups are presented in Table 1. Visual evaluation sorted out 59 fields. Using the criteria proposed by [4], 1 SD for the recorded gamma parameters of individual fields 31, 23 or 17 were sorted out, and the criteria of 2 SD for no more than 25% of the fields in a treatment plan, only one treatment plan was sorted out. Visual evaluation of that plan showed differences in the level between measured and predicted profiles and it was therefore compared with weekly linac output measurements and interpreted to be connected with linac output. Other visual observations were: differences near the upper or lower edge of imager interpreted as theoretically noted worse agreement between the PDC algorithm and actual imager response [1] or scatter [3], gamma > 1.0 between adjacent MLC leaves and gamma > 1.0 in geometrically small areas of high dose gradient regions. Table 1. suggests that there is a trend of larger gamma values and SDs for field axes over 7.5 cm and split carriage fields and also variation between different treatment sites. These findings are not necessarily independent of each other, but they raise questions as to wheather there is a need for a different threshold, for example for small fields. No dependency of monitor unit (MU), different numbers of control points (CP) in the fields, CP/min, absolute treatment dose, absolute or relative dose difference between treatment dose and healthy tissue dose limit or measurement date was found.
453

The analyzed IMRT plans and portal dose measurements were mostly conducted by one person, but the method, as the manufacturer provides it, is almost automatic, requiring only imager alignment correction (optional) manually. The results were in good agreement with previously published data [3, 5], Gamma evaluation criteria and visual evaluation did not agree all the way, but all fields that were sorted out with gamma evaluation also had visual comments. This study implies that further investigation of gamma evaluation criteria for different subgroups might be interesting.
Table 1. Mean values and standard deviations of gamma analysis parameters for all fields.
n maximum gamma average gamma area gamma >1.0 [%] All fields 213 1.85 ± 0.66 0.25 ± 0.08 1.66 ± 3.6 y < 7.5 60 1.52 ± 0.41 0.23 ± 0.05 0.55 ± 0.80 y >= 7.5 153 1.98 ± 0.69 0.25 ± 0.08 2.09 ± 4.14 Split - 1 82 1.54 ± 0.43 0.23 ± 0.05 0.57 ± 0.97 Split > 1 131 2.05 ± 0.82 0.25 ± 0.09 2.34 ± 4.50 Head & neck 87 2.16 ± 0.71 0.27 ± 0.10 3.09 ± 5.14 Cranium 16 1.49 ± 0.53 0.20 ± 0.04 0.34 ± 0.56 Pelvis 64 1.78 ± 0.61 0.22 ± 0.05 0.79 ± 1.43 Hip prosthesis* 46 1.50 ± 0.32 0.24 ± 0.05 0.60 ± 0.86 * pelvic patients with hip prosthesis or prostheses
REFERENCES
[1] VAN ESCH, A., et al., The Use of an aSi-based EPID for Routine Absolute Dosimetric Pre-treatment Verification of Dynamic IMRT Fields, Radiother. Oncol. 71 (2004) 223.
[2] LOW, D.A., et al., A Technique for the Quantitative Evaluation of Dose Distributions, Med. Phys. 25 5 (1998) 656.
[3] SIEBERS, J.V., et al., Monte Carlo Computation of Dosimetric Amorphous Silicon Electronic Portal Images, Med. Phys. 31 7 (2004) 2135.
[4] HOWELL, R.M., et al., Establishing Action Levels for EPID-based QA for IMRT, J. Appl. Clin. Med. Phys. 9 3 (2008) 16.
[5] VAN ZIJTVELD, M., et al,, Dosimetric Pre-treatment Verification of IMRT Using an EPID; Clinical Experience, Radioth. Oncol. 81 (2006) 168.
454

IDOS, Vienna, 9-12 November 2010 E2-CN-182, Paper No INV015
Experience of quality assurance procedures for dose calculation verification in external radiotherapy treatment planning
M. Prusova
N.N. Blokhin Russian Cancer Reserch Centre, Moscow, Russian Federation
E-mail address of main author: [email protected]
On the basis of international guidelines [1, 2], a quality assurance program was developed and a number of tests were performed to verify the accuracy of dose calculation on XiO treatment planning system (TPS) for 6 MV photons.
After all necessary dosimetry data for linear accelerator SL-75 had been entered in XiO, the commissioning process started. Testing of the following cases was performed:
Open fields 5x5, 10x10, 20x20, 5x20 cm; Wedged 60° square and rectangular fields 10x10, 5x20 cm; Different source surface distances (SSD): two extreme values - 80 cm and 120 cm, field size 10x10 cm; Oblique incidence: gantry angle 45°, field size 10x10 cm; Blocked fields: three configurations were selected (central block, block shifted from center and edge block).
Testing is based on comparison between measured and calculated data. For all above mentioned cases percent depth doses (PDD) and beam profiles at depths of dose maximum, 5, 10, 20 cm were calculated in water equivalent phantom created in TPS. Corresponding dose curves were obtained measuring in a water phantom, "Blue Phantom", with the help of a cylindrical ionization chamber.
To compare measured and calculated data, a special program tool was created in MatLab. This program allows to import PDD's and beam profiles in ASCII format, plot them and calculate deviations between measurements and calculations using gamma-evaluation method [3]. The main concept of the method is that it combines dosimetric and spatial deviation in a single figure of merit, which gives reliable and authentic assessment, especially in high dose gradient regions
The created program tool calculates and plots the gamma curve normalized to a value of 100 over the compared lines; thus if gamma lies beneath the 100% line, the deviations don't exceed acceptance criteria of dose calculation accuracy (Fig. 1). It is also possible to adjust the values of dose and spatial criteria in different regions of the beam (high and low dose gradient regions) according to the case specific and complexity of geometry. For simple geometry dose/spatial criteria about 2% / 2 mm was set and for complex geometry with beam modifiers criteria was chosen as 3% / 3 mm. Also for each case percent of points on dose profile or PDD which passed gamma-criteria (PG) was calculated.
Obtained results of comparison are considered to be in agreement with established acceptance criteria. However in some situations (penumbra, beam modifiers) the obtained deviations exceed the tolerances. Thereby a number of calculation algorithm limitations was defined particularly for scattering contribution. Maximum deviations appeared for penumbra and outside beam regions.
455

120
- 60 -
[1]
[2]
[3]
FIG. 1 Dose profiles comparison for 45° oblique incidence 10x10 cm field at 10 cm depth.
REFERENCES
INTERNATIONAL ATOMIC ENERGY AGENCY, TECDOC-430. Commissioning and quality assurance of computerized treatment planning. - Vienna, Austria, 2004. MIJNHEER B„ OLSZEWSKA A., FIORINO C, et al. Quality assurance of treatment planning systems, Practical examples for non-IMRT photon beams. ESTRO, booklet No.7, 2004. LOW D.A., HARMS W.B., MUTIC S. AND PURDY J.A. A technique for the quantitative evaluation of dose distributions. // Med. Phys., 1998, 25, P. 656-661.
456

IDOS, Vienna, 9-12 November 2010 E2-CN-182, Paper No INV015
Dosimetric comparison of intensity modulated radiotherapy treatments with step and shoot and sliding window techniques
S. M. Palaniappan , S. S. Supe , M. Ravikumar
Kidwai Memorial Institute of Oncology, Bangalore , India
E-mail address of main author: [email protected]
Aim
The aim of the study was to analyse the effects of the number of intensity levels on treatment planning outcome of Static Multileaf collimator (SMLC) method with Dynamic Multileaf collimator (DMLC) method and also to investigate the integral dose to non-target normal tissue (BodyPTV) in both the methods.
Materials and methods
The intensity modulated radiotherapy treatment planning was carried out with millenium 120 multileaf collimator system (Clinac-DHX) having 0.5 cm projected leaf width at isocentre for central 40 pairs and 1.0 cm for peripheral 10 leaves on both side. Five cases each of head and neck, cervix and esophagus cancer were selected for this study. For head and neck and cervix treatment, 7 intensity-modulated fields of 6 MV photons were used. For esophagus case 5 fields with 6 MV photons were used. For each case, planning was carried out using both delivery methods. Further for the SMLC method, different numbers of intensity levels ranging from 5 to 20 were studied. For the DMLC method, the spatial resolution used in this study was 2.5 mm. The optimization routine was kept common for both the techniques and only the leaf motion calculation was varied. The comparisons were made in terms of isodose distributions, dose volume histograms and total beam on-times. In addition, parameters associated with the DVH like Dm ax. Dm in V95, and S index were also examined for a more quantitative comparison. The integral doses (0.5 Gy to 30 Gy) of non-target normal tissues (Body PTV) were also calculated for both SMLC and DMLC techniques. Analyses were performed using a paired two-tailed Student t test to determine difference in any of the parameters examined.
Results
For the three sites studied, there were no significant changes observed between SMLC method (above 10 intensity levels) and DMLC method. However there was significant differences observed with 5 intensity level SMLC plan and DMLC plan in terms of Dmax, V9S and homogeneity index. There were no significant changes observed in normal tissue dose values between SMLC plan (above 10 intensity levels) and DMLC plan. However there was significant diffrence noticed for SMLC plan (5 intensity levels) and DMLC plan. The total number of monitor units were more for DMLC plans compared with SMLC plans for all three sites. In SMLC plan the total monitor units increased with decreasing intensity levels. The integral dose from 0.5 Gy to 30 Gy were analyzed and no significant changes were observed between SMLC plans (5, 10, 20 intensity levels) and DMLC plans.
457
Discussions
The target coverage and homogeneity in PTV was improved in SMLC plans for more than 10 intensity levels. The target coverage and homogeneity were found to be inferior for SMLC plan with 5 intensity levels. The normal tissue maximum dose values were higher for normal structures closer to target volumes for SMLC plans which could be attributed to steep dose gradients near to the target. Inspite of more monitor units in DMLC methods, there was no significant increment of the integral dose to non-target normal tissues in DMLC technique compared to SMLC method. This could be due to the forward scattering of higher energy (6 MV) photons with minimal lateral scattering. Addionally it could also be due to reduced leaf leakage as the collimator jaws comes closer to MLC's in DMLC method.
Conclusions
The findings made in this study were based on particular leaf sequencing algorithms and delivery equipment. Different algorithms and machines may yield different results. Based on our results there was no significant advantage between SMLC or DMLC method. Many factors such as number of intensity levels, target coverage, target homogeneity beam on time and delivery time should be considered in deciding the best treatment methods.
REFERENCES
[1] CHUI C, CHAN M, YORKE E et al, Delivery of intensity modulated radiation therapy with conventional multileaf collimator: comparison of dynamic and segmental methods. 2001, 28(12): 2441-2449.
[2] ALAEI P , HIGGINS P , WEAVER R et al, Comparison of dynamic and step and shoot intensity modulated radiation therapy planning and delivery. Med Dosim 2004, 29(1): 1-6.
458
IDOS, Vienna, 9-12 November 2010 E2-CN-182, Paper No INV015
Multipurpose, semi-anatomical water phantom for TPS verification
P.Sipilaa, H. Jarvinena, A. Kosunena, J. Ojalab, J. Nieinelaa
a STUK - Radiation and Nuclear Safety Authority, Helsinki, Finland
b TAUH - Tampere University Hospital, Tampere, Finland
E-mail address of main author: [email protected]
Introduction
A robust and transportable semianatomical water phantom has been developed in STUK for verifying treatment planning system (TPS) calculations in brachytherapy and external beam therapy during site visits. The phantom has a section for image quality and dimension determination and allows changeable anatomical structures for imaging. Different types of detectors and brachytherapy applicators can be inserted into the phantom without a need to change the phantom position on the treatment table. The phantom can easilly be used for point dose measurements as well as 2D and 3D dose distribution measurements. It is lightweight to transport and easy to fill for measurements.
Materials and methods
The phantom is filled with water in the upright position and turned to the horizontal position for measurements (Fig. 1). Due to vacuum effect, the water level at the open side of the phantom is lower and has free space for detector cables and allows easy insertion and removal of objects inside the phantom. The filled phantom is imaged with the CT scanner, image quality and dimensions are analysed on site and images are sent to the local TPS in the hospital. A set of different treatment plans are calculated, which include at least single fields for reference field size and some multiple field IMRT, VMAT and conventional treatments. The plan is sent to the treatment unit and the dose distribution is saved in DICOM format for later evaluation and point doses for each plan are determined.
The phantom is set on the treatment table and adjusted according the plan. From each plan a point dose is measured with an ionization chamber. If the difference between the calculation and measurement is less than 2%, Gaf-Chromic film is exposed for determination the 2D dose distribution. Also a diode or a diamond detector can be used in the phantom for single point verification. A linear array can be used for profile measurements, radiochromic film is used for 2D measurements and a stack of films can be used for 3D measurements.
Radiochromic film (Gaf-Chromic EBT and EBT2) is used in a solid water film holder for shielding the ambient light and immersion of water. Irradiated films are read after four days with a high precision automatic read-out system (densitometer) to avoid artefacts with commercial flatbed scanner normally used with the film. The film is measured with two wavelengths to take account of the small thickness changes of the emulsion. The maximum absorbance of the film measured with 630 nm light and 430 nm light is used to evaluate the base absorbance of the film. Film measurements are compared to the calculated distribution with gamma-analysis.
Results
In external beam treatments the point dose measurements with ionization chamber were generally found to be within 0.5 - 1% when no inhomogenities were inserted in the phantom. With the lung insert or an air cavity in the phantom, the point dose was generally within 1 - 3%. When the beam was directed through a hip replacement, the point dose was generally between 10-18%.
459

Conclusions
The phantom has been used to verify different treatments (IMRT, VMAT, conventional treatments and brachytherapy treatments) during site visits in different hospitals in Finland and abroad. Results indicate that the phantom is an easy and accurate method for verifying the calculation accuracy of the TPS. However, the phantom with complex inhomogenity structures is not the best way to verify the accuracy of the input data in the TPS. If the accuracy of the input data in TPS is not verified first, multiple errors can hide each other. The input data can be verified with the phantom, but without any inhomogeneties. The results suggest also that Gafchromic EBT film is suitable and sufficiently accurate for determination of relative dose distributions.
ACKNOWLEDGEMENTS
This work has been carried out as a part of EC funded EMRP projects T2.J06 (Increasing cancer treatment efficacy using 3D brachytherapy) and T2.J07 (External Beam Cancer Therapy-EBCT).
FIG. J. The phantom is filled with water in upright FIG 2. The phantom with hip replacement position (left) and tilted to lateral position for measurements.
REFERENCE
[1] GAFCHROMIC® EBT film. http://onlinel.ispcorp.com/_layouts/Gafchromic/index.html
460

IDOS, Vienna, 9-12 November 2010 E2-CN-182, Paper No INV015
On-board imaging commissioning and quality assurance program: ROV experience
M. Hegazy, W. Patterson, W. Ding
Radiation Oncology Victoria (ROV) Melbourne - Australia
E-mail address of main author: [email protected]
Currently, there have been no published recommendations and guidelines for a QA program to verify the functionality, accuracy, stability, and image quality of the radiographic mode of an on-board imaging (OBI) system. This paper evaluates a comprehensive QA program for the OBI system.
Objective
To generate and run a QA program for the OBI system and to summarize the results of these QA tests over extended periods from two Radiation Oncology Victoria (ROV) centers after implementing two new Rapid Arc machines with OBI capability. The radiographic mode of operation has been evaluated. The QA programs from the two centers have been generated through a series of tests for evaluating the performance of the On-Board Imager. Safety and functionality tests evaluate the functionality of safety features and the clinical operation of the entire system during the tube warm-up as show in the QA form. Geometry QA verifies the geometric accuracy and stability of the OBI hardware/software. Image quality QA monitors spatial resolution and contrast sensitivity of the radiographic images (see Figs. 1 & 2). All safety and functionality tests passed on a daily basis. Measurements of geometry QA tests showed stable results within tolerance throughout the test periods. Use of the tests over extended periods show that the OBI system has reliable mechanical accuracy and stable image quality. In this article we describe the procedures of test items included in the QA program and present the results of measurements over extended periods from the two ROV centers.
FIG. 2 : contrast and reselution test
FIG. 1 : mechanical and Geometrical checks
461

QA daily form
Radiation Oncology Victoria O B I S A I I I Y A X I F U N C T I O N A L I T Y O A ( I > „ i t v >
$ J5" 3 ift G
•
V t i t l l a l i an
I -3
- 1
G>
FR 5
Warning tights
3 • 5 §
1 1 |
fc
Collision
.Arm Path
anil In I t ' l l tick $ J5" 3 ift G
• *
an
I -3
- 1
G>
FR 5 |
IS"
P
t
1
A
o a
=
rr
3 • 5 §
1 1 |
fc
Collision
.Arm Path l i e cover
T* |
3"
S*= —4 Ln
H
$ J5" 3 ift G
> - c
E
O - c m
• O 3 3
'« 3 2 CO 2 .
I -3
- 1
G>
FR 5 |
IS"
P
t
1
A
o a
=
rr
3 • 5 §
1 1 |
fc O H | 3
:
£
G o "
5 Q . S £ =
| © g
1 . 1 o ' 23 •
T* |
3"
S*= —4 Ln
H
j\ u 3 3
3 A
1
K ? A f
A 5 §
Results
Use of the tests over extended periods show that the O BI system has reliable mechanical accuracy and stable image quality. In this article we describe the procedures of test items included in the QA program and present the results of measurements over more than 12 months extended period from the two ROV centers.
Conclusion
An international program of quality assurance needs to be established for maintaining quality of an OBI system. The primary focus is on geometric accuracy and precision, with a secondary focus on dose and image quality. An integrated daily check should be implemented into routine clinical use with a 15 minute time penalty. Training for the staff is required to achieve the benefits of the new technology and grantee the proper use on time.
REFERENCES
[1] MUTIC, S„ PALTA, J. R„ BUTKER, E. K„ DAS, I. J., HUQ, M. S„ LOO, L. D„ SALTER, B. J., MCCOLLOUGH, C. H., VAN DYK, J. "Quality assurance for computed-tomography simulators and the computed-tomography simulation process: Report of the AAPM Radiation Therapy Committee Task Group No. 66," Med. Phys. 30, 2762-2792, 2003.
[2] AMERICAN ASSOCIATION OF PHYSICISTS IN MEDICINE, AAPM Report No. 39., Specification and Acceptance Testing of Computed Tomography Scanners American Institute of Physics, New York, NY, 1993.
[3] AMERICAN ASSOCIATION OF PHYSICISTS IN MEDICINE , AAPM Report No. 74., Quality Control in Diagnostic Radiology, Medical Physics Publishing, Madison, WI, 2002.
462
IDOS, Vienna, 9-12 November 2010 E2-CN-182, Paper No INV015
Imaging dose to various organs at risk during image guided radiotherapy in the pelvic region
A. Palm1, M. Stock, E. Steiner, D. Georg
Dept of Radiotherapy, Medical University of Vienna, Vienna , Austria
Abstract. This work presents dose to organs at risk (OAR) for six imaging modalities when used for IGRT in the pelvic region. These data provide means to compare the cumulative imaging dose from all imaging sources, as well as the fraction of the total dose delivered by different IGRT solutions. Furthermore, they can be utilized for the development of specific image-guidance protocols, differing in imaging frequency and modality.
Imaging dose was quantified by TLD measurements in an anthropomorphic phantom. TLD-100 (LiF:Mg:Ti) chips, 3x3x1 mm, were used. The TLDs were verified to have a relative sensitivity within ±3%. Three TLDs were placed at each measurement position, and each measurement was performed twice. Six TLDs were used for background correction. For each measurement five TLDs were calibrated in a 60Co beam, at 5 cm depth in a polystyrene phantom. To account for the variation in TLD response with photon energy relative to f Co, data from Nunn et al. [1] was applied. Dose was determined for anus, bladder, bowel, femoral head, penile bulb, prostate, rectum, and skin. For large organs, such as skin, several measurement points were used. The isocenter plane is located in the middle of the phantom slab that includes the prostate. For each imaging modality the protocol that is used clinically in our institution was studied;
• Siemens Somatom Sensation multi-slice CT:120 kV, 180 mAs, 31 cm scan length;
• Nucletron Simulix Evolution CBCT: 100 kV, 1559 mAs, half beam technique, 360-degree scan, 20 cm scan length;
• Elekta XVI CBCT: 120 kV, 1661 mAs, M10F1, 360-degree scan, 12 cm scan length;
• Elekta EPID: 6MV, anterior-posterior (AP) and right lateral (RL), 5MU per image, 10.4x10.4 cm;
• Elekta XVI planar kV: 120 kV, S20F0, AP 5 mAs per image, left lateral (J.I.) 6.4 mAs per image, 26x26 cm;
• ExacTrac planar kV: 120 kV, right posterior oblique (RPO) and left posterior oblique (LPO), 20.8 mAs per image, field size -12x12 cm.
The results showed that the dose per imaging procedure in the pelvic region varied significantly with imaging modality. The EPID image pair resulted in the highest dose, in the order of 110 mGy at the maximum. The kV-planar imaging modalities (i.e. ExacTrac and Elekta XVI) showed the lowest doses, 1 mGy or less per image pair for all OARs studied. The maximum dose of the Elekta XVI CBCT, the multi-slice CT, and the CBCT at the simulator is 55 mGy, 25 mGy, and 17 mGy, respectively.
Dept of Medical Physics and Biomedical Engineering, Sahlgrenska University Hospital, Goteborg, Sweden
463

The dose to various OARs was also influenced by the position of the organ, as well as the different spatial distributions that the different imaging modalities deliver. Planar imaging modalities showed a larger spatial variation than CT modalities. For kV-planar modalities the highest dose was on the skin, on the beam entrance side. Outside the respective imaging field the dose was generally low.
Assuming a 78 Gy image guided treatment, with 1 planning CT, and 35 daily CBCT scans, the maximum cumulative imaging dose, relative to the target dose, is 2.5%, situated on the anterior skin. The cumulative imaging dose to the rectum is close to 1.5 Gy (99% from the CBCTs, 1% from the planning CT).
We conclude that the maximum absorbed dose per exam in the pelvic region from the imaging devices studied ranges from 1 mGy (kV-planar imaging) to 110 mGy (EPID imaging). Compared with the EPID, the maximum dose due to the Elekta XVI CBCT is half, however, due to the spatial variation, CBCT dose is up to six times higher than the EPID dose for certain organs. Depending on imaging modality and the imaging frequency, cumulative imaging dose might need to be taken into consideration during the treatment planning process.
FIG. 1. Absorbed dose per exam (i.e. per CT scan, or planar image pair) for organs in the pelvic region. Note that kV-planar doses have been scaled up by a factor of 20 in order to be visible in the graph. The standard deviation (SD) is the mean of two measurements with three TLDs at each position. Large SD is related to measurements at the field edge.
REFERENCE
[1] NUNN, A., et al., LiF:Mg,Ti TLD response as a function of photon energy for moderately filtered x-ray spectra in the range of 20-250 kVp relative to Co. Med. Phys. 35 (2008) 1859-1869.
464
IDOS, Vienna, 9-12 November 2010 E2-CN-182, Paper No INV015
Problems of clinical dosimetry in Russian radiotherapy centers
V.Kostylev, M.Kisliakova
Institute of Medical Physics and Engineering, Moscow, Russia
E-mail address of main author: [email protected]
Due to the general catastrophic situation of radiation oncology in Russia, its outdated equipment and shortage of medical physicists, the clinical dosimetry is also in a very poor state and doesn't meet the modern requirements of the quality assurance in radiotherapy.
In Russia there are 140 radiotherapy departments, 100 medical accelerators and 250 gamma apparatus but only 150 clinical dosimeters and 75 dose field analyzers, 90% of which are morally and physically obsolete and do not meet the requirements of the quality assurance [1], Ten percent of the radi otherapy departments are not equipped with clinical dosimeters at all. There is no national program of quality assurance in radiotherapy. Service for dosimetry equipment calibration is lacking. The national standards and protocols of clinical dosimetry haven't been elaborated.
Two-hundred-and-sixty medical physicists work in radiotherapy, 90% of whom have insufficient experience and qualification. Ten percent of radiotherapy departments do not have medical physicists in its staff at all and the rest of the departments face a shortage of medical physicists. The number of medical physicists is not enough to provide the full medical physics service. Qualified medical physicists do not stay long in clinics because of the small salary [2],
As a result of these drawbacks the accuracy of the therapeutic dose delivery to the tumour often achieves 30% instead of the 5% admissible error. This situation leads to high radiation risks, particularly for radiation overdosage or uderdosage during the patient's treatment. However, there are no radiation accident statistics in Russia; therefore it's impossible to evaluate them in terms of quantity [3].
Unfortunately, this is the outcome of the lack of the state policy in this field. Neither the Health Ministry nor the Rosatom is concerned about this problem. The only thing that the Health Ministry is undertaking now is the purchase of the new equipment, dosimetry equipment included, for the oncology institutions. But this happens without the necessary organization of the medical physicists' education and regulation based improvement.
For 17 years of its existence the Association of Medical Physicists of Russia (AMPR) have been monitoring and collecting the information on the state of affairs in this field.
465

Being a non-profit organization, AMPR
• creates and updates the database on equipment, technologies and staff strength in radiotherapy departments;
• elaborates the strategy of the radiation oncology upgrade and development; • helps the regional oncology centers to choose the equipment, dosimetry
equipment included, and train the medical physicists; • provides the continuous professional development of medical physicists and
radiotherapists in cooperation with the National Research Nuclear University "MEPhI" and N.N.Blokhin Russian Cancer Research Center;
• is involved in the IAEA/WHO TLD postal dose audit program. Only 69% of the results correspond to the admissible deviation level.
But it must be stressed that the problem of the radiation therapy modernization, clinical dosimetry included, can't be solved without the state support.
The AMPR is regularly sending its proposals to the Government which don't receive the necessary attention so far.
AMPR is interested in the cooperation and support of its activities from IAEA, IOMP, EFOMP, ESTRO, and other international organizations and institutions.
REFERENCES
[1] KOSTYLEV V.A., Why Do We Receive Inefficient Oncoradiology Centers, Meditsinskaya Fizika, Xs 2(38), P. 5-19, 2008.
[2] KOSTYLEV V.A , Analysis of the Radiation Oncology Status in the World and Russia, Meditsinskaya Fizika, JV° 3(43), P. 5-20, 2009.
[3] NARKEVICH B.YA., KOSTYLEV V.A., et al., Radiotherapy Risks and Radiation Accidents in Radiation Therapy, Meditsinskaya Fizika, JVa 1(41), P. 31-38, 2009.
466
IDOS, Vienna, 9-12 November 2010 E2-CN-182, Paper No INV015
Sensitivity study of an EPID for real-time patient specific IMRT QA
E. Larrinaga-Cortina3, R. Alfonso-Laguardia" , S. Kama?.
a Department of Radiotherapy, Institute of Oncology and Radiobiology (INOR), Havana, Cuba
" Department of Physics and Engineering, London Regional Cancer Program (LRCP), London, Ontario, Canada.
E-mail address of main author: [email protected],cu
Electronic Portal Imaging Devices (EPID) have primary applications for verification of patient setup and assessment of target and organ motion. Different studies have shown that the EPID can be used also as a dosimetric device for treatment machine Quality Assurance (QA) and patient dosimetry, including pre-treatment patient specific IMRT QA. This standard QA practice does not account for machine malfunction or unacceptable patient motion during each fraction of treatment. The goal of this study has been to evaluate the sensitivity and uncertainty of an aSi-based EPID as a real-time patient specific IMRT QA tool to manage machine and patient errors comprehensively, and to establish orientative action levels for required treatment adjustments.
Dosimetric features of an aSi-based EPID (Elekta's iViewGT), such as linearity of dose/pixel response, field size output factors and off-axis sensitivity were determined previously at the Department of Radiotherapy of the INOR [1], In order to further evaluate the capabilities of the EPID to be used as a real-time patient specific IMRT QA tool, additional measurements tests have been performed, in order to establish guidelines for the EPID's commissioning for dosimetric purposes.
Characterization of EPID's parameters, such as S/N ratio, quantum efficiency, spatial resolution, time resolution, dose resolution, short and long term stability and ghosting were studied for 6 and 15 MV photon beams.
The S/N and the spatial resolution were assessed through image acquisition of a high density object [2]. The S/N variable was determined as the ratio of the response difference at an exposed and blocked area of the image versus the standard deviations combined of both responses. This means the S/N is proportional to object's attenuation and inversely to the response's uncertainty. The spatial resolution was determined using the Modulated Transform Function (MTF) of the Edge Response (BR) for the object, allowing a quantification of this parameter and further monitoring of its behavior.
The EPID's image ghost was investigated using a 20x20cm2 field ROI pixel integration response versus a similar field image preirradiated with a 6x6cm2 field [3], The nominal average time delay between two acquired images were 23 and 27 sec for 6 and 15MV fields, although the expected operational time delay would be lesser. Results shown sensitivity increased to a maximum of 1.2% and 3.3% for 6 and 15MV for the field preirradiated with a low MU combination for the 20x20cm2 field. Further research of EPID's temporal response will be needed to assess the variation of the response in a frame by frame basis [4], This will allow necessary correction in the image ghosting effects for IMRT step-and-shoot segmented type fields like are expected to be used.
Comparison of EPID dose response against a 2D ion chamber array was performed, in order to establish the required correction matrix. Comparisons were performed locating the 2D array at the EPID's plane, using two different build-up and build-down thicknesses of water-equivalent plastic, namely, 1.5 and 5.0 cm. This was to assess the correspondance of EPID response to dose in water at the position of the EPID. For 6 MV open fields, we found that the EPID behave better as a 2D
467

dosimeter with the 5 cm build-up added, with maximum discrepancies of 3% in the high dose region, and up to 7% in the low dose tail region; this is in agreement with results of the behavior of the field-size relative dose factors. Similar results were obtained for wedged fields and for 15 MV photons. Nevertheless, corrections are required to bring the response to more tolerable levels.
Current results give confidence in the capability of the EPID for real time detection of potential inaccuracies in dose delivery during IMRT treatments. Further work is in progress to design and evaluate a set of test cases for assessing the sensitivity of the EPID in conditions closer to those expected to arise in standard clinical practice.
This work is being carried out in the framework of the IAEA's Doctoral Coordinated Research Project.
REFERENCES
[1] LARRINAGA-CORTINA, E„ ALFONSO-LAGUARDIA, R„ SILVESTRE-PATALLO, I., GARCIA-YIP, F., Dosimetric characterization of an aSi-based EPID for patient-specific IMRT QA, International Conference on Advances in Radiation Oncology (ICARO), IAEA 2009
[2] SILVESTRE-PATALLO, I., GARCIA-YIP, F„ An iViewGT Portal Imaging Device System for beam quality control in a clinical radiotherapy linear accelerator, Rev. Cub. Fisica July 2008.
[3] EZZEL, G. A. et al, IMRT commissioning: Multiple institution planning and dosimetry comparisons, a report from AAPM Task Group 119, Medical Physics, Vol. 36, No. 11, (2009) 5359-5373.
[3] WINKLER, A. HEFNER, and D. GEORG, Dose-response characteristics of an amorphous silicon EPID Medical Physics Vol.32, (2005) 3095-3105.
[4] MCDERMOTT, R.J. LOUWE, J.J. SONKE, M.B. VAN HERK, and B.J. MIJNHEER, Dose-response and ghosting effects of an amorphous silicon electronic portal imaging device, Medical Physics Vol.31, (2004) 285-295.
468
IDOS, Vienna, 9-12 November 2010 E2-CN-182, Paper No INV015
FLUKA Monte Carlo simulation for the Leksell Gamma Knife PERFEXION: Preliminary results.
A. Torresin3, N. Bertolino3, F. Cappucci3, M.G. Brambilla3, H.S. Mainardi3, G.
Battistonib
3 Medical Physics Department, Ca'Granda Niguarda Hospital, Milan
bI.N.F.N., Milan
E-mail address of main author: [email protected] The Stereotactic radiosurgery technique allows the delivering of a high-dose provided by a precisely focused radiation to a specific area or areas of the brain. In order to treat the brain disorders through this technique, various medical device models are available. One of the mostly worldwide used is the Leksell Gamma Knife PERFEXION (LGK-PFX), provided by Elekta Instruments AB, Sweden. The LGK-PFX model, presented in 2006, has a new and entirely geometrically redesigned radio-surgery unit, which differs fundamentally from previous Gamma Knife models. The collimation system is now able to focus to 4mm, 8mm and 16mm the gamma rays generated by the 192 ('°Co sources composing the radiation unit [1], Each LGK-PFX unit is accompanied by a treatment planning system, the LGP-PFX (Leksell GammaPlan Perfexion), which is a computer-based dose planning system specifically designed for simulation and planning of stereotactic Leksell Gamma Knife. The LGP-PFX dose calculation algorithm does not consider the scatter dose contributions and the inhomogeneity effect due to the skull and air cavities. The secondary electron disequilibrium in the vicinity of bone-tissue, air-tissue heterogeneity or high density inhomogeneities in the head leads to overestimation of dose by the treatment planning algorithms that assume the whole volume of interest as entirely homogeneous [2], Monte Carlo method is capable of accurately predicting standard dosimetric parameters as well as dose in regions where electronic equilibrium is lacking. In this work, using the FLUKA Monte Carlo code, a method for testing the LGP-PFX was successfully applied. FLUKA (FLUktuierende KAskade) is a multipurpose Monte Carlo code which can transport a variety of particles over a wide energy range in complex geometries. The code is a joint project of INFN (National Institute of Nuclear Physics of Italy) and CERN [3]. The implemented simulations describe all the radiation beam and all the 192 sources in the same time. We have considered the technical construction detail of the sources, the collimator system, and the physical composition of surrounding material. All the simulations have been performed under homogenous conditions of the phantom target [4], In order to validate the simulations results, two set of measurements have been performed using a homogeneous Elekta Gamma Knife Perfexion Dosimetry Phantom, Gammex 457 Solid-Water made.
The first test was an isocentre dose rate measurement performed by means of a free air I.C. (ion chamber) model 31016-PTW Freiburg with a small sensible volume. This measurement was performed in the configuration with all the 16mm collimators opened and has been compared with the results of the FLUKA simulation in the same conditions. As reported on Table 1, the estimated experimental error for the used I.C. model, as certified from laboratories of standard measurements, is 3% for 6uCo beam quality. The FLUKA dose has been calculated considering the deposited energy per primary particle provided by the simulation, the physical phantom density, the activity of the sources and the I.C. experimental exposure time. The uncertainty of this result is dominated by the measurement uncertainty in the average source activity which is indicated in the Elekta reference as 5%.
469

TABLE 1. Comparison between experimental dose and FLUKA MC dose for the 16mm collimators.
Experimental dose I.C. error FLUKA dose FLUKA dose Percentage 31016-PTW Freiburg I.C. calculation Statistical error difference
5 Gy 3% 4.8 Gy 5.5% 4%
The other relevant error factor is the simulation statistical error connected with the deposited energy per primary particle, calculated by the FLUKA code as standard deviation. As can be seen, the percentage difference between the two dose values is inside the margin of error.
The simulated 4mm and 8mm collimators isocentre dose values have been used to compare the OF (Output Factors) given, without uncertainties, by the constructor. As can be noticed from Table 2 the percentage difference between the FLUKA OF values and the Elekta OF corresponds inside the statistical error range.
TABLE 2. Comparison between OUTPUT FACTOR coefficients Collimator Elekta OF FLUKA OF FLUKA Percentage
Type Statistical error difference 8 mm 0.924 0.921 0.6% 0.4% 4mm 0.805 0.802 0.4% 0.4%
The final verification included in this study is a comparison of the relative dose profiles. For these measurements radiochromic EBT-ISP films have been used. Gafchromic films have been prepared and placed inside the phantom, by means of a proper holder, and exposed to a rising dose from 0 to 10 Gy in order to obtain a calibration curve to correct the non linear response of the film to radiation dose. After the calibration runs, three set of measurements in the coronal and the axial plane were performed for all the collimator configurations (16mm, 8mm and 4mm), for a 5 Gy dose. The films were scanned with an Epson Expression 10000XL scanner for a graphical comparison with the Monte Carlo simulation values [5], In Figure 1, as a first example, a graphical comparison between the FLUKA simulation and the radiated radiochromic EBT-ISP films, for the 16mm collimators set-up, is shown. The EBT film interval represents the experimental error of the radiochromic films, introduced by the scanner procedure, which results of about 3% [6]. The FLUKA bars instead, show, point by point, the statistical error of the simulation. Also in this case a good agreement between experiment and simulation was achieved.
470

110
100 r 9 0
80
7 0
4 0
3 0
FLUKA I—t-EET FILM
£ , •.I-
i ''k
4I % B 60 -o . w ° fi '\\
5 0
i t ' IP 10
\ f
4/ \K
-20 - 1 5 - 1 0 - 5 0 5 1 0 15 2 0
Y(mm) FIG 1. 16mm dose profile comparison.
After these experimental evaluations, the simulation based on the FLUKA Monte Carlo code appears to be a valid instrument to test the LGP software and for future studies concerning not homogeneous targets.
ACKNOWLEDGMENTS
The authors would like to acknowledge and thank Elekta Instrument AB (Sweden) for the support to plan the simulation and for the measurements made in cooperation.
REFERENCES
[1] JOSEPH NOVOTNY JR. et al. "Dosimetric comparison of the Leksell Gamma Knife Perfexion and 4c". Journal of Neurosurgeiy, 109, December 200
[2] FERAS M.O. AL-DWERI, et al. "Effects of bone and air-tissue inhomogeneities on the dose distributions of the Leksell Gamma Knife calculated with Penelope". Physics in Medicine And Biology, November 2005
[3] ALFREDO FERRARI, PAOLA R. SALA, ALBERTO FASSO, AND JOHANNES RAN FT. "FLUKA a multi-particle transport code". CERN European Organization For Nuclear Research, 2008
[4] F. CAPPUCCI "Implementation of Monte Carlo simulations for the Leksell Gamma Knife Perfexion system". Tesi di Laurea in Fisica, Universita degli Studi di Milano (2009).
[5] N. BERTOLINO "Experimental validation of Monte Carlo simulation of Leksell Gamma Knife Perfexion stereotactic radiosurgery system". Tesi di Laurea in Fisica, Universita degli Studi di Milano (2009).
[6] S. DEVIC, J. SEUNTJENS, E. SHAM, E.B. PODGORSAK, C, ROSS SCHMIDTLEIN, S. KIROV, CHRISTOPHER G. SOARES, ^'Precise radiochromic film dosimetiy using a flat-bed document scanner". Med. Phys. Vol. 32 (7), pp. 2245-2253 (2005).
471


IDOS, Vienna, 9-12 November 2010 E2-CN-182, Paper No 125
In vivo dosimetry for head and neck carcinoma: Determination of target absorbed dose from entrance and exit absorbed dose measurements
L.Farhata, M.Besbesb, A.Bridierc, J.Daoud*
a Service de radiotherapie carcinologique, CHU Habib-Bourguiba, 3029 Sfax, Tunisie 1 Service de radiotherapie carcinologique, Institut Salah-Azaiz, boulevard du 9-avril-
Bab-Saadoun, 1006 Tunis, Tunisie c Service de radiophysique, Institut Gustave-Roussy, 39, rue Camille-Desmoulins, 94805
Villejuif cedex, France
E-mail address of main author: [email protected]
Measurement of the absorbed dose in a target volume is widely considered to be an important tool for quality assurance in external radiotherapy. The aims of this work were to measure the entrance and exit doses for patients treated for head and neck tumors. The target absorbed dose was determined from the exit and entrance dose measurement
Twenty patients were evaluated. Initially, measurements with commercial diodes were performed on a polystyrene phantom in order to calibrate diodes in terms of entrance and exit doses; and to determine appropriate correction factors [1-3]. The results were compared to the calculated values, and the midline dose was determinate and compared with the prescribed dose.
100 entrance dose and 100 exit dose measurements were performed. The average difference from expected values was 1,2 % for entrance dose (SD 2,9%) and 0,5 % for exit dose (SD 5,3%). The target absorbed dose differed from prescribed dose values by 2.5% (2.8 %) for the results using the Noel method [4] and 3 % (SD:3.2 %) with the Rizzotti method [5].
The total uncertainty budget in the measurement of the absorbed entrance and exit dose with diode, including diode reading, correction factors and diode calibration coefficient, is determined as 3 % (1 SD).
Simple in vivo dose measurements are an additional safeguard against major setup errors and calculation or transcription errors that can be missed during pre-treatment chart check.
473
REFERENCES
[1] VAN DAM, J., MARINELLO, G. Methods for in vivo dosimetry in external radiotherapy. Physics for Clinical Radiotherapy, Booklet N°1 (1994)
[2] HUYKEN,D„ BOGAERTS,R„ VERTSTRAETEJ., et al. Practical Guidelines for the Implmentation of In Vivo Dosimetry with Diodes in External Radiotherapy with Photon beams (Entrance Dose). Physics for clinical radiotherapy Booklet No.5. Brussels, ESTRO (2001)
[3] AMERICAN ASSOCIATION OF PHYSICISTS, AAPM report 87, Diode in vivo dosimetiy for patients receiving external beam radiation therapy. Report of task group 62 of the radiation therapy committee published for the American Association of physicists in medicine by medical physics publishing (2005)
[4] NOEL, A., ALETTI, P., BEY, P., et al. Detection of errors in individual patients in radiotherapy by systematic in vivo dosimetry. Radiother. Oncol. 34,144-51 (1995)
[5] RIZZOTTI,A.,COMPRI,C., Garusi,G.F. Dose evaluation to patients irradiated by Co beams, by means of direct measurement on the incident and the exit surfaces. Radiother. Oncol. 3,279-83 (1985)
474

IDOS, Vienna, 9-12 November 2010 E2-CN-182, Paper No 125
Use of 2D-ARRAY seven29 in QC of photon beams
T. Antropova
Kazakh Research Institute for Oncology and Radiology, Almaty 050022, Kazakhstan
E-mail address of main author: [email protected]
Quality control (QC) procedures for external beam therapy equipment are time-consuming; thus it is important to have appropriate measuring equipment to perform fast and accurate checks of radiation beams parameters.
The ionisation chamber matrix 2D-Array seven29 (PTW-Freiburg) is very useful for fast checks in photon beams of linacs and "°Co-units. In the Kazakh Research Institute for Oncology and Radiology, we have used this device since 2009 for the following checks: radiation output constancy, flatness and symmetry, central axis dose deviation, coincidence of light field and radiation field. It is also convenient for measurements incoiporating wedge factors and attenuation factors of immobilisation devices.
Measurement results were evaluated using MultiCheck software. Dose linearity was verified for the range of 5-500 cGy in a 6 MV photon beam of a Clinac-600C/D linear accelerator and and a TERAGAM Co-beam. Deviation from linearity was within 1.5 % for the linac and within 1.0 % for ' 'Co. Dose response was checked for a central ionisation chamber and for 8 chambers within the flat region of a 20x20 cm" field.
The seven29 matrix consists of 729 vented ion chambers located in a matrix of 27x27 cm2 and allows simultaneous measurements of beam profiles along major and diagonal axes. Flatness, symmetry and central axis dose deviation data obtained from MultiCheck's analysis were compared with data obtained from a water phantom. The comparison revealed good agreement, which allowed us to begin QC measurements using the 2D-ARRAY.
For output constancy check, we compared the readout of central chambers of the matrix with dose values measured in water. The conversion factor was determined and we used it for further dose measurements. Since the measuring point of the ionisation chambers is at 5 mm below the surface of the 2D-ARRAY, we added a PMMA plate of 1 cm thickness above the array surface to create conditions for measurements at the maximum dose depth for a 6 MV photon beam. For 60Co beams it is not necessary to add a build-up material. In all cases 4 cm PMMA was placed below 2D-ARRAY. The output constancy check for our o0Co-unit is made monthly and the decay factor was taken into account in all measurements.
The measurements of wedge factors were performed in the Snapshot mode of the MultiCheck software. The comparison with in-water measurements showed agreement within 1 % and allowed use 2D-ARRAY for fast routine check of wedge factors.
The measurements of attenuation factors of immobilisation devices such as headrests were very useful for treatment plan calculations. We have made measurements for all our headrests in order to correct monitor unit calculations.
475

FIG 1.Set-up 2D-Airay for linac QC FIG 2. MultiCheck data display
Althouh our experience in using 2-dimensional detector array for quality control has not been for very long, we could appreciate its advantages. The set-up of the measurement system with 2D-ARRAY seven29 is easy and takes only a little time in comparison to the set-up of a large water phantom. The periodic quality control procedures in clinics are time-consuming and so usage of a 2D ionisation chamber matrix is very convenient. The MultiCheck software provides good representation of the data in tabular and graphic modes in both 2D and 3D. Analysed data could be saved and compared with reference data.
476

IDOS, Vienna, 9-12 November 2010 E2-CN-182, Paper No 125
Dose distributions in critical organs for radiotherapy treatment with Co beams of some common cancers
M.S. Rahman"*, M. Shamsuzzaman", Z. A lair . S. Sharminc
a Secondary Standard Dosimetry Laboratory, Institute of Nuclear Science & Technology, Bangladesh Atomic Energy Commission, Ganakbari, Savar, Dhaka, Bangladesh * Tel.: +880-2-7781678, Fax: +880-2-8130102
Department of Radiation Oncology, Delta Medical Center, Mirpur, Dhaka, Bangladesh
c Department of Physics, Jahangirnagar University, Savar, Dhaka, Bangladesh
E-mail address of main author: : [email protected]
Ionizing radiation is being used as an essential tool for the treatment of cancer patients all over the world. More than 50% out of two and half million cancer patients in Bangladesh receive radiation therapy each year, either alone or in conjunction with surgery, or chemotherapy. The application of radiotherapy technique for the treatment of malignant diseases is to deliver optimum dose to the malignant cells (tumor) with proper planning system. From the radiation protection view point, one of the basic principles of using ionizing radiation in medical fields is that the dose to surrounding tissues should be minimized by using the best available techniques and to take measures to reduce the dose as far as possible in other parts of the body. The contribution of doses to the surrounding critical organs of the body is due to the scattered or leakage radiation or lack of optimum planning in the radiotherapy processes. It has been observed that there are hardly any protective measures taken during the treatment of cancer patients by radiotherapy in Bangladesh. Moreover, like other developing countries, TPS is still not included in 60Co beam treatment in Bangladesh. The poor treatment planning could be hazardous to the cancer patients. As a result during the treatment, patients can receive hazardous scattered and leakage radiation to the critical organs of the body other than the malignant tumor, which can create a risk in developing fatal and non-fatal cancer. The unwanted radiation to the organs may be one of the reasons for secondary metastasis for long lived survivors. In the present studies, the experimental measurement of scattering dose distribution to the different nearest critical organs in the treatment of lung, larynx, and pelvis are investigated using Alderson Rando Phantom by TLD technique. The measurement is designed in comparison with the patients treated with 60Co beam at Delta Medical Center (Alcyon II, CGR, McV, France).
The most reliable and convenient Thermoluminescence Dosimeter (TLD) Lithium Fluoride (LiF) of size 1 mm x 1 mm x 6 mm (rod type) is used for the dose measurement. These TLDs were calibrated with a phantom made of Plexiglas (Cd IxO?: p = 1.136 g/cm2), a tissue equivalent material. A total number of 86 rod TLDs were chosen for their linear response of doses. The commercially available Average-Man phantom known as Alderson Rando Phantom which incorporates materials of different densities is usually used for the treatment planning and administration as do living patients of the same sizes, shapes, and skeletal structures. Unlike the real patients this phantom permits detailed mapping of dose distributions, so that treatment plans can be developed and tested realistically. A number of three TLDs were placed at the center of the critical organ inside the phantom. The irradiated TLDs were read out for the dose measurement with Harshaw TLD reader.
477
The experimental results show that when treating left lung with a single exposure of 200 eGy at a tumor depth of 9 cm, some portion of the left lung just outside the projected area received a remarkable dose of 101.38 ± 3.54 cGy, whereas the dose received by the stomach, right lung, larynx, left kidney are found to be 1.51 ± 0.10 cGy, 1.18 ± 0.12 cGy, 0.79 ± 0.06 cGy, and 0.85 ± 0.01 cGy respectively. The large contribution of dose to the left lung outside the treatment area found in the present measurement is obviously due to the field edge. Hence, it can be reduced by using proper shielding block. On the other hand, when the larynx is exposed by two-field beam of each 100 cGy, it has been observed that the lens of eye, brain, right lung, and the left lung received the dose of 4.31 ± 0.16 cGy, 2.22 ± 0.10 cGy, 2.39 ± 0.24 cGy, and 2.30 ± 0.07 cGy respectively. In case of pelvis treated with two field technique, the upper part of the cervix, upper part of the rectum, right ovary, sigmoid colon, upper part of the urinary bladder, lower part of the urinary bladder, and lower part of the cervix the dose values are limited within 0.92-0.79 cGy.
The present study demonstrates the dose distribution to the critical organ with manual treatment planning. The measured dose values received by the critical organ due to the scattered or leakage radiation in the treatment of lung, larynx, and pelvis are small that meets good in agreement with the ICRP recommendation. In the treatment of larynx, more precaution could be made by adding shielding block to minimize doses to the lens of eye.
478
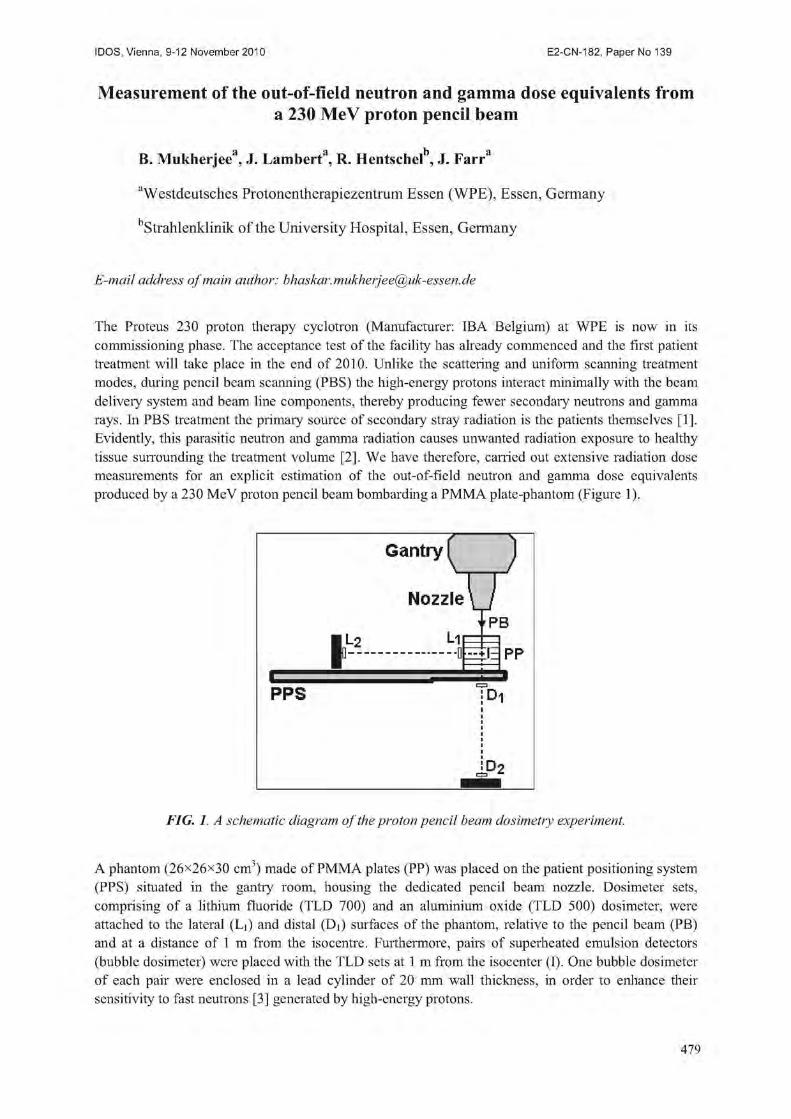
IDOS, Vienna, 9-12 November 2010 E2-CN-182, Paper No 125
Measurement of the out-of-field neutron and gamma dose equivalents from a 230 MeV proton pencil beam
B, Mukherjee*1, J. Lambert", R. Hentschet , J. Farra
"Westdeutsches Protonentherapiezentrum Essen (WPE), Essen, Germany
Strahlcnklinik of the University Hospital, Essen, Germany
E-mail address of main author: [email protected]
The Proteus 230 proton therapy cyclotron (Manufacturer: IBA Belgium) at WPE is now in its commissioning phase. The acceptance test of the facility has already commenced and the first patient treatment will take place in the end of 2010. Unlike the scattering and uniform scanning treatment modes, during pencil beam scanning (PBS) the high-energy protons interact minimally with the beam delivery system and beam line components, thereby producing fewer secondary neutrons and gamma rays. In PBS treatment the primary source of secondary stray radiation is the patients themselves [1], Evidently, this parasitic neutron and gamma radiation causes unwanted radiation exposure to healthy tissue suiTounding the treatment volume [2]. We have therefore, earned out extensive radiation dose measurements for an explicit estimation of the out-of-field neutron and gamma dose equivalents produced by a 230 MeV proton pencil beam bombarding a PMMA plate-phantom (Figure 1).
FIG. 1. A schematic diagram of the proton pencil beam dosimetry experiment.
A phantom (26x26x30 cm3) made of PMMA plates (PP) was placed on the patient positioning system (PPS) situated in the gantiy room, housing the dedicated pencil beam nozzle. Dosimeter sets, comprising of a lithium fluoride (TLD 700) and an aluminium oxide (TLD 500) dosimeter, were attached to the lateral (Li) and distal (D|) surfaces of the phantom, relative to the pencil beam (PB) and at a distance of 1 m from the isocentre. Furthermore, pairs of superheated emulsion detectors (bubble dosimeter) were placed with the TLD sets at 1 m from the isocenter (I). One bubble dosimeter of each pair were enclosed in a lead cylinder of 20 mm wall thickness, in order to enhance their sensitivity to fast neutrons [3] generated by high-energy protons.
479

The phantom was bombarded with a 230 MeV pencil beam at 3.3 nA for 5 minutes. Immediately after the termination of proton irradiation all dosimeters were removed form the gantry room, in order to avoid the enhanced background radiation exposure caused by neutron activation of gantry room walls.
The TLD 500 and TLD 700 chips were assayed using a Harshaw 3500 manual TLD reader at a heating rate of 5 °C,s"1 and the TL-Glow curve was counted within the 160 - 200 °C temperature band. The gamma dose equivalent (H) was calculated from the TLD 500 glow curve counts (A) and the corresponding gamma calibration coefficient k (|iSv/count) and presented as: H, = kA. The neutron dose equivalent (HN) at the surface of the phantom and at a distance of 1 m from the isocentre was determined by analysing the area of the high temperature (260-320 °C) peak of the TLD 700 glow curve and removing the gamma background dose, determined from the gamma dose measurement from the TLD 500 chip, for further details see the reference [4]. The neutron dose equivalent was verified at 1 m distance from the isocentre with the bubble dosimeter by using the number of bubbles counted (Nb) and the sensitivity of the bubble dosimeter/(bubbles/pSv), given as: HN = V,,//[3]. The results are summarised in Table 1.
Table. 1. Measured secondary neutron (HN) and gamma (Hy) dose equivalents due to proton pencil beam bombardment of a PMMA phantom.
Dosimeter Distance from Isocenter (cm) //y (mSv/nA/min) H7 (mSv/nA/min) Li 13 9.19 0.44 L2 100 0.17 0.01 Di 15 13.81 0.71 D2 100 0.28 0.01
Using the above data the estimated secondary (neutron and gamma) dose equivalent (mSv) to primary therapeutic proton dose (Gy) ratio calculated to be 0.097 (mSv/Gy) at 13 cm lateral to isocenter. We have assumed a treatment volume of 50 ml.
Our report will highlight the experimental technique for explicit evaluation of neutron and gamma dose equivalents in the vicinity of the high-energy proton pencil beams (i.e. out-of-field) using various types of passive devices including thermo-luminescence (TLD), optically stimulated luminescence (OSLD) dosimeters and superheated emulsion (bubble) detectors.
REFERENCES
[1] SCHNEIDER, U„ AGOSTEO, S„ PEDRONI, E„ BESSERER, J., Secondaiy neutron dose during proton therapy using spot scanning, Int. Jour. Radiat. Oncol. Biol. Phys. 53, 244-251 (2002).
[2] MESOLORAS, G„ SANDISON, G. A., STEWART, D„ FARR, J., HSI, W. C , neutron scattered dose equivalent to a fetus from proton radiotherapy of the mother, Med. Phys. 33 (7), 2479-2490 (2006).
[3] MUKHERJEE, B„ CLEMENT, W„ SIMROCK, S., Neutron field characterisation in a high-energy proton-synchrotron environment using bubble detectors, Radiat. Meas. 43, 554-557 (2008).
[4] MUKHERJEE, B„ MAKOWSKI, D„ SIMROCK, S„ Dosimetry of high-energy electron linac produced photoneutrons and the bremsstrahlung gamma-rays using TLD-500 and TLD-700 dosimeter pairs, Nucl. Instr. Meth. Phys. Res. A 545, 830-841 (2005).
480

IDOS, Vienna, 9-12 November 2010 E2-CN-182, Paper No 125
Comparison of different radiotherapy treatment techniques, radiation qualities and therapy machines with respect to neutron dose
R. A. Halga, J. Bessererb, S. Mayer", U. Schneiderb
aThe City Hospital Triemli, Division of Medical Physics, Department of Radiation Oncology and Nuclear Medicine, Zurich Switzerland
b Radiotherapy Hirslanden AG, Institute for Radiotherapy, Aarau Switzerland
cPaul Scherrer Institut, Division for Radiation Safety and Security, Villigen Switzerland
E-mail address of main author: [email protected]
It is assumed that modern radiation treatment techniques such as intensity-modulated radiotherapy (IMRT) and volumetric-modulated arc therapy (VMAT) are increasing the cancer cure rates and simultaneously reducing unwanted side effects. But there are also concerns about the increase in radiation-induced malignancies with the application of these techniques in particular for younger patients. Therefore, primary dose distribution and X-ray scatter as well as the secondary neutron radiation on secondary cancer incidence should be investigated further.
The aim of this study is to measure neutron dose induced by the irradiation of a radiotherapy patient during a typical treatment. The measured neutron dose is compared with respect to treatment technique, therapy machines and radiation quality.
The series of measurements included photon radiation delivered by treatment machines of the manufacturers Varian, Elekta and Siemens and the irradiation techniques 3D-conformal, intensity modulation (IMRT) and volumetric-modulated arc therapy (VMAT). Measurements were performed at the City Hospital Triemli, Zurich Switzerland, Radiotherapy Hirslanden AG, Aarau Switzerland, Canton Hospital Aarau, Aarau Switzerland and Canton Hospital St. Gallen, St. Gallen Switzerland.
In order to evaluate the neutron dose for a patient, an anthropomorphic Alderson-Rando phantom was used in this study to account for the patient anatomy. The dose measurements were performed using CR-39 etched track detectors [1, 2] provided by the Radiation Metrology Section of the Division for Radiation Safety and Security at Paul Scherrer Institut in Villigen Switzerland. The detectors were placed inside and on the surface of the phantom, facilitating the determination of a three dimensional dose distribution and the evaluation of the dose to radiation sensitive organs according to the ICRP recommendations [3]. For the detector positions inside of the phantom, dedicated cavities were established.
The clinical setup was the curative irradiation of a rhabdomyosarcoma of the prostate for an adolescent patient. The planning CT and the contouring of the target structures as well as of the organs were performed at one institution. This information was sent to all the participating institutions along with a planning guideline containing the CT calibration, dose prescription, dose constraints and the location of the isocenter. All measurements and detector readouts were performed by the same persons. This procedure ensures the comparability of the treatment plans as well as of the irradiations and measurements at the different sites.
The readout of the CR-39 detectors was calibrated in personal depth dose equivalent Hp(10) using the radiation field of an Am-Be neutron source and an ICRU cubic phantom.
481

The doses to the radiation sensitive tissues were determined in terms of depth dose equivalent per treatment Gray and per treatment time, respectively. In addition effective dose was calculated using organ specific weighting factors according to the ICRP recommendations [3]. The effective doses for the complete course of treatment were 4.2 mSv, 3.0 mSv, 3.4 mSv, 0.7 mSv and 2.8 mSv for Varian 3D-conformal, Varian IMRT, Varian VMAT, Elekta IMRT and Siemens IMRT, respectively. The organ specific neutron doses per treatment Gray are listed in Table 1. The differences in neutron dose between the different treatment techniques were not large. However, Elekta treatment machines produce significant lower neutron dose than Varian and Siemens machines.
Table 1. Organ specific neutron doses in /.tSv per treatment Gray for various treatment modalities.
ICRP organ Varian 3DCRT Varian VMAT Varian IMRT Elekta IMRT Siemens IMRT
liSv/trcatmcnt Gy
Bone Marrow 24 28 27 8 22
Colon 14 19 18 4 15
Lung 60 74 57 21 49
Stomach 9 9 16 4 10
Breast 102 139 109 51 124
Remainder 184 115 109 8 92
Bladder 702 366 338 16 315
Oesophagus 15 13 14 5 11
Liver 19 33 22 7 25
Thyroid 19 12 14 6 13
Bone Surface 24 28 27 8 22
Brain 26 38 22 10 16
Salivary Glands 65 102 63 24 46
Skin 230 219 195 71 233
REFERENCES
[1] FIECHTNER, A., GMUR, K., WERNLI, C,, A personal neutron dosimetry system based on etched track and automatic readout by Autoscan 60, Radiation Protection Dosimetiy, 70(1-4) 157-160, 1997.
[2] FIECHTNER, A., WERNLI, C., Individual neutron monitoring with CR-39 detectors at an accelerator centre, Radiation Protection Dosimetry, 85(1-4) 35-38, 1999.
[3] INTERNATIONAL COMMISSION ON RADIOLOGICAL PROTECTION ICRP 2007 Recommendations of the ICRP, Publication 103, Ann. ICRP 37 (2-4).
482

IDOS, Vienna, 9-12 November 2010 E2-CN-182, Paper No 125
Energy dependence of radiochromic dosimetry films for use in radiotherapy verification
K. Chelminskf, W. Bulski3, D. Georgb, Z. Maniakowskf, D. Oborskad
a Department of Medical Physics, The Maria S k lodowska-Curi c Memorial Cancer Center and Institute of Oncology, Warsaw, Poland
Division of Medical Radiation Physics, Department of Radiotherapy, Medical University of Vienna, Austria
c Department of Medical Physics, The Maria Sklodowska-Curi c Memorial Cancer Center and Institute of Oncology, Gliwice, Poland
'Department of Medical Physics, Lower Silesian Oncology Center, Wroclaw, Poland
E-mail address of main author: [email protected]
The puipose of the study was the examination of energy dependence of Gafchromic EBT radiochromic dosimetry films, in order to assess their potential use in Intensity Modulated Radiotherapy (IMRT) verifications. In this paper a new type of radiochromic films is evaluated for use in phantom dosimetry for verification of planned dose distribution in IMRT. The main goal was to determine the expected lack of energy dependence due to the atomic composition of Gafchromic EBT films similar to the typical tissue equivalent phantom materials. The radiochromic films are based on organic Pentacosa-10,12-diynoic acid (PCDA) active component [1], The PCDA monomer immediately polymerizes when irradiated by high energy photon beams and becomes blue proportionally to the absorbed dose.
EBT films were cut into rectangular pieces of size 4 x 5 cm2 keeping the original orientation of a longer side. The samples were sent by post and irradiated in Warsaw, Gliwice, Vienna and Wroclaw radiotherapy centres with beams from the energy range 1.25 MeV-25 MV.
Each film sample was sandwiched between the 20 x 20 x 5 cm3 slabs of water equivalent phantom parallel to the largest surface of the slab and irradiated. The films were exposed to doses of 10, 20, 50, 100, 200, 400, 600, 800, 1000 and in few cases to 1200 cGy with 60Co photon beam and and with 4, 6, 10, 15, 20, 25 MV photon beams generated with medical accelerators of electrons. After irradiation the samples were sent back to Warsaw and read out. The radiochromic films are practically not sensitive to room light and do not need further processing. However they should be kept away from UV radiation present in sunlight or emitted from glow-tube lighting. The films were handled in accordance with the recommendations outlined in the AAPM TG-55 report [2].
The films were digitized with a desktop flat-bed scanner. Also an unexposed film was scanned for background correction. The color separation was done and only the red channel was chosen for further examination because irradiated EBT films have two absorption peaks located at 636 nm and 585 nm |3], For each dose the mean pixel value (PV) from 3 of 5 scans was taken as a film response result. The two most deviant results were neglected.
In Figure 1, the film responses for all delivered doses are presented for all beams investigated in the study.
The study was supported by the Polish Ministry of Science and Higher Education Grant nr R13 040 02
483

Figure 2 presents the standard deviation from 3 scans for each investigated dose and beam energy. A high uncertainty in readout of PV was observed for doses below 1 Gy. The relative uncertainty exceeds 20 % for doses below 1 Gy while in the dose range 1-12 Gy the measured film responses differ by less than 5 % for the whole energy range examined.
Concluding, the examination of Gafchromic EBT films do not show energy dependence for the beam energy range investigated and for the achieved 5% precision of the measuring procedure. However measurements of the doses in the range below 1 Gy with Gafchromic EBT films demand special attention. If EBT films are used in pretreatment dosimetric verifications of IMRT plans, the verified doses should exceed 1 Gy.
3 . 5
1 . 5
0 . 5
C o 6 0 I WAR C o 6 0 I I WAR X
X - 4 MV WRO *
X - 6 MV WAR • X - 6 MV G L I
X - 1 0 MV WRO X - 1 5 MV WAR + X - E 0 MV G L I X
X - £ 5 MV I V I E *
X - S 5 MV I I i i
V I E a i
8 0 0 1 0 0 0 1 2 0 0 0 S 0 0 4 0 0 6 0 0
D o s e C c G y ]
FIG. 1. The response of the film samples irradiated with different doses for the beam energy range 1.25 MeV-2 5 MV. The PVs were corrected using the background of an unexposedfilm
l i
"T" "T" C o 6 S I WAR
C o 6 0 I I WAR MV WRO MV WAR MV G L I MV WRO
X - 1 5 MV WAR X - £ 0 MV G L I
X - E 5 MV I V I E X - S 5 MV I I V I E
X - 4 X-6 X - 6 X-1C
600 S00 Dose CcGy]
FIG. 2. Standard deviation of measured PV against the delivered dose for different energy beams
484
REFERENCES
[1] RINK, A., LEWIS, D.F., VARMA, S„ VITKIN, LA, JAFFRAY, D.A., Temperature and hydration effects on absorbance spectra and radiation sensitivity of a radiochromic medium, Med, Physics 35 (2008) 4545-55.
[2] NIRO OM AND -RAD, A., BLACKWELL, C.R., COURSEY, B.M., et al., Radiochromic film dosimetry. Recommendations of AAPM Radiation Therapy Committee Task Group 55, Med. Physics 25 (1998) 2093-2115.
[3] BUTSON, M.J., CHEUNG, T., YU, P.K.N., Absorption spectra variations of EBT radiochromic film from radiation exposure, Physics in Med. and Biol. 50 (2005) N135-N140.
485

IDOS, Vienna, 9-12 November 2010 E2-CN-182, Paper No 125
Performance evaluation and dosimetry of CT I CRT systems
R. Lindsay3, J. Sykes3 R. Dickinson", D.I. Thwaitesa
aSt James's Institute of Oncology, Leeds Teaching Hospitals NHS Trust and University of Leeds. UK
b MAGNET, Imperial College, London, UK
Email address: [email protected]
As part of a UK national health service programme of evaluating medical equipment to inform local and national purchasing decisions, a technical evaluation has been carried out on x-ray CT-based IGRT systems. This was carried out between 2008-2009 and reported recently [1], Three x-ray volumetric systems from different manufacturers were evaluated at ten radiation oncology centres. The basic technical protocol is available [2], as is the report summarising the outcomes [1], The systems included are Elekta Synergy v4.2, Tomotherapy HiArt v 3.2 and Varian OBI v 1.5. The work is currently being further extended outside the programme with more clinically realistic phantoms and tests.
The objective of the technical evaluation was to test each system to assess its capability in delivering accurate image guidance and, where possible, to test parameters on more than one example of each system to assess variability. Tests were carried out to measure
• image quality in a range of conditions, using the Catphan 504 phantom and analysis either on the system itself or a consistent independent approach, such as IQWorks [3]. Parameters considered include contrast-to-noise, HU accuracy, axial plane resolution, MTF, slice sensitivity, uniformity and spatial integrity. Pseudo-clinical image quality was assessed using the Virtually Human Male Pelvic (VHMP) phantom (CIRS, Norfolk, Virginia), where images were obtained for visual inspection.
• imaging dose, using CTDI and Farmer chambers in doubled up pairs of CTDI phantoms for a range of scanner settings and clinical protocols
• IGRT geometric accuracy, including o Registration of imaging volume to treatment isocentre for the kV systems, ie where
the source and associated geometry is not the same as the treatment beams [4], using the Modus Pentaguide Qasar phantom (Modus, Ontario, Canada)
o Image-shift-verify tests to verify the ability of the system to correct for patient misalignment to within a required tolerance. This used the Pentaguide phantom in the report protocol, but this approach was further extended outside the project to utilise the VHMP phantom to provide a more clinically realistic test, considering the prostate area alone for soft tissue alignment. [5].
All systems assessed had accurate alignment between the tomographic image geometry and the treatment volume, to within 1 mm. Automatic couch corrections accurately re-positioned treatment isocentres to within 1.5 mm following translational shifts. Where rotations could be corrected, these were typically to within 1°. Imaging doses measured for typical clinical protocols were within the range of 1,4mGy per scan for a low dose head protocol to 25mGy for the highest exposure pelvis protocol.
These were comparable to or lower than the maximum dose associated with most planar MV portal imaging protocols. All systems were able to differentiate contrast between muscle and fat in the VHMP phantom and from this point of view all were able to provide 3D soft tissue information.
487

Differences were observed between the measured image quality parameters on the three systems and these varied with image dose. Significant differences were observed between HUs obtained from the different images.
Overall, all three systems fulfil the basic requirements of IGRT and can correct within acceptable tolerances for discrepancies in patient position based on comparison with reference planning CT scans. Image quality is adequate at standard imaging protocols, for doses that are acceptable compared to MV portal imaging. Other work indicates that there is scope to optimise doses further. There is potential in each system for some aspects of performance to be further improved. Further work is required to optimise and set standards for clinical practice.
REFERENCES
[1] CENTRE FOR EVIDENCE-BASED PURCHASING (CEP), Evaluation report: X-ray tomographic image-guided radiotherapy systems, CEP 10071, 2010, www.db.gov.uk/cepproducts/catalogue.aspx
[2] CENTRE FOR EVIDENCE-BASED PURCHASING (CEP), Protocol: Technical evaluation of X-ray tomographic image-guided radiotherapy devices, CEP 10070, 2010, www, dh. gov.uk/cepproducts/c atalo gue. aspx
[3] IQWORKS, automated image analysis software for use with DICOM images, http ://wiki. iq works. org/main
[4] SYKES, JR, LINDSAY R, DEAN C.I. BRETTLE DS, MAGEE DR, and THWAITES DI, Measurement of cone beam CT coincidence with megavoltage isocentre and image sharpness using the QUASAR Penta guide phantom, Phys. Med. Biol. 53 (2008) 5275-93
[5] SYKES J, LINDSAY R, FAIRFOUL J, EMMENS D, DICKINSON R, THWAITES DI, Development of a clinically realistic test for evaluation of x-ray tomographic IGR systems, Radiother Oncol 92, suppl 1 (2009), SI29
488

IDOS, Vienna, 9-12 November 2010 E2-CN-182, Paper No 125
VMAT planning and verification of delivery and dosimetry using the 3-D delta4 dosimetry system
S.J. Derbyshire, J. Lilley, V.P. Cosgrove, D.I. Thwaites
St. James's Institute of Oncology, Leeds Teaching Hospitals NHS Trust and University of Leeds. UK
Email address: [email protected]
VMAT can provide advantages over IMRT and 3DCRT, by reducing treatment delivery time and total number of monitor units, as well as improving dose conformity. VMAT plans produced using Oncentra MasterPlan (Nucletron) and delivered with an Elekta Synergy linac were evaluated. Verification dosimetry measurements were earned out as part of a pre-clinical commissioning programme, using a Semiflex ionisation chamber in a CIRS humanoid pelvis phantom, and using a ScandiDos Delta system. The Delta incorporates two orthogonal 2D arrays of semiconductor diodes, enabling assessment of delivered dose distributions in 3D. These techniques have been previously verified during an on-going development of IMRT pre-treatment verification dosimetry that has evolved from film to the Delta" arrays [1,2].
Initially treatment plans were generated using the RayArc VMAT optimiser (RaySearch Laboratories) in Oncentra MasterPlan v3.3 for a range of treatment sites, including single 360° arc plans for prostate patients, single arc SBRT lung plans for small peripheral lung tumours and single and dual arc plans for head and neck patients. Files were transferred to Mosaiq vl.6, and plans were delivered using 6 MV beams on an Elekta Synergy linac with an MLCi2 head using Desktop v7.0 and compared to measurements. More detailed planning and dose verification studies were then performed for single volume post-operative prostate patients, to give 52.5 Gy in 20 fractions. Restricted single arc VMAT plans were generated using a 260° to 0° to 100° gantry rotation (i.e. total arc of 200°), with 4° control point spacing. Restricted arcs were used to avoid attenuation by the treatment couch, which also gave more straightforward dose calculations. Dose criteria from the RADICALS trial [3] were used for planning. Conformal VMAT plans were achieved, which provided comparable or improved sparing of rectum and bladder relative to the current 3DCRT technique. In particular, rectal volumes receiving low doses can be substantially reduced, making it possible to meet dose-volume objectives that cannot be met for some patients with the current treatment method.
Doses delivered to the isocentre in a CIRS pelvis phantom from test plans and measured using a 0.125cc Semiflex chamber were within ±2.5% of calculations. Measurements made in the Delta"1
indicated that dose at the isocentre was within ±1.5% (±3% where collimator twists were applied) of calculations. Gamma analysis of these Delta4 measurements for detectors within the 20% isodose showed that >99.5% (or 97%) of points were within a 3%, 3mm measurement tolerance (Fig. 1, Table 1). Repeated measurements with the Delta4 for one of the plans, to assess repeatability of VMAT delivery, gave 100% of detectors passing gamma analyses comparing the one delivery to another down to a tolerance of 1%, 1mm.
Single and dual arc VMAT plans fulfilling required dose-volume objectives have been generated and successfully delivered for a number of treatment sites using Oncentra VMAT and a VMAT-enabled Elekta Synergy linac, including for the RADICALS prostate clinical trial. Dosimetry has indicated that acceptable dose distributions can be achieved using a restricted arc where required. Verification dosimetry gives confidence that the dose to the isocentre and the overall dose distribution are delivered within acceptable tolerances.
489
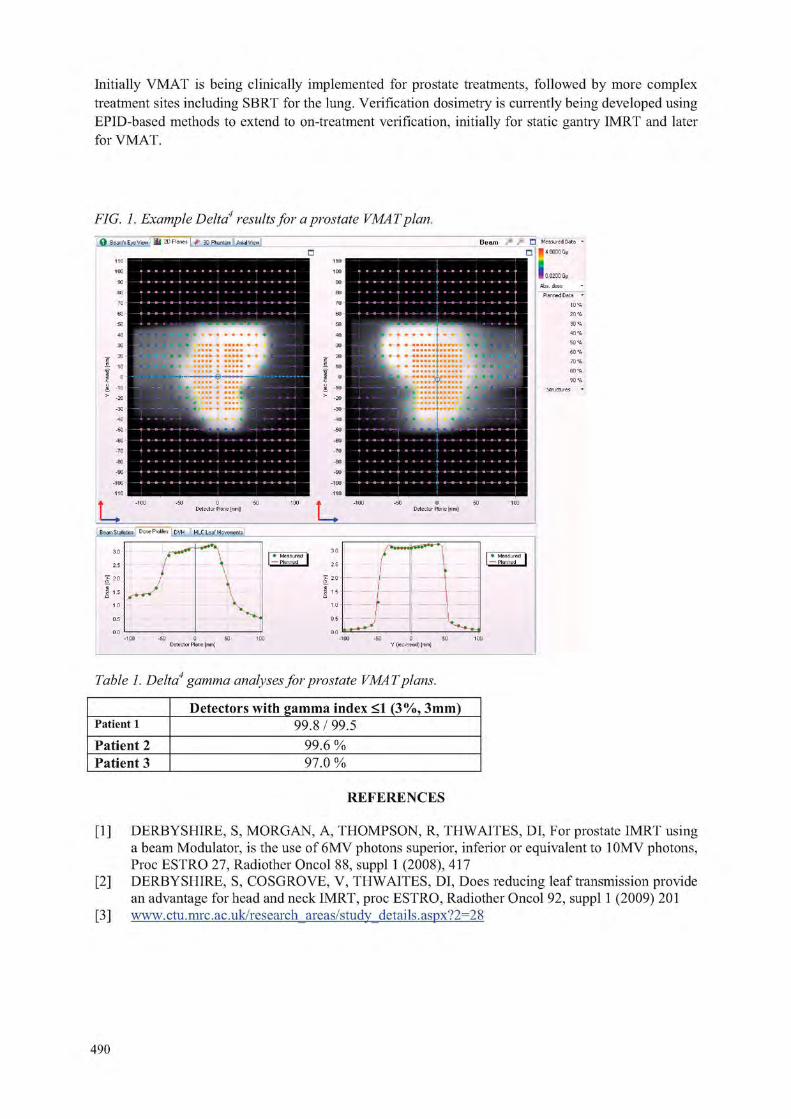
Initially VMAT is being clinically implemented for prostate treatments, followed by more complex treatment sites including SBRT for the lung. Verification dosimetry is currently being developed using EPID-based methods to extend to on-treatment verification, initially for static gantry IMRT and later for VMAT.
FIG. 1. Example Delta4 results for a prostate VMAT plan + " • Measured Data
• • 4.0000 Gy
| 0.0200 Gy
Abs, dose
Planned Data
10 7
B earn S tatistics & ose Profiles DVH MLC Leaf Mo vements
© Beam's Eye View j I I I 2D Planes | + 3D Phantom | Axial View
Table 1. Delta4 gamma analyses for prostate VMAT plans.
Detectors with gamma index <1 (3%, 3mm) Patient 1 99.8/99.5 Patient 2 99.6 % Patient 3 97.0 %
REFERENCES
[1] DERBYSHIRE, S, MORGAN, A, THOMPSON, R, THWAITES, DI, For prostate IMRT using a beam Modulator, is the use of 6MV photons superior, inferior or equivalent to 10MV photons, Proc ESTRO 27, Radiother Oncol 88, suppl 1 (2008), 417
[2] DERBYSHIRE, S, COSGROVE, V, THWAITES, DI, Does reducing leaf transmission provide an advantage for head and neck IMRT, proc ESTRO, Radiother Oncol 92, suppl 1 (2009) 201
[3] www.ctu.mrc.ac.uk/research_areas/study_details.aspx?2=28
490

IDOS, Vienna, 9-12 November 2010 E2-CN-182, Paper No 125
OSL detector for in-vivo dosimetry in pelvis and head & neck cancer treatment
C. Viegas ' 2, A. Viamont . A.M. Campos1
1 Institute Nacional de Cancer (SQRI/INCA/MS) - Rio de Janeiro, RJ. 2 ~ Universidade Estacio de Sa - Rio de Janeiro, RJ. 3 Fundacao Tecnico Educational Souza Marques - Rio de Janeiro, RJ,
E-mail address of main author: [email protected]
The use of ionizing radiation for therapeutic purposes has a great importance for success in the fight against cancer. The technology used for this purpose is, each day, more refined and accurate. The control of doses delivered to the patients is a vital necessity. If the goal is the eradication of primary tumor [1], the absorbed dose to the target volume should have an accuracy of ± 5%. Therefore, methods to verify the accuracy of the dose-planned values are basic and part of any quality control program.
Clinical dosimetry uses dosimetric data to calculate the dose required for the treatments. However, you must be sure about the dose received daily by each patient, because many factors can influence treatment failure, in vivo dosimetry is the method used to assess and verify the delivered dose in almost real time, since the equipment in operation can suffer different changes. Different types of detectors are available [2] to perform in vivo measurements. TLDs and diodes are the most used nowadays. Both have advantages and disadvantages. The use of TLDs involves high costs, a process of reading and annealing, and the results are not instantaneous. The diodes, universally used for in vivo dosimetry, offer an immediate reading of the delivered dose, but their calibration factors present a temperature dependence [3].
Recently a new detector has been proposed and used to perform measurements in real time. It is based on the physical phenomenon of optically stimulated luminescence (OSL) [4]. The OSL technique has been already widely used in personal, environmental and retrospective dosimetry. Currently it has been tested as a new dosimetric alternative in radiotherapy [5].
This method uses light (laser) instead of heat to cause the light emission by the irradiated material. The luminescence emitted by the dosimeter during the time of optical stimulation is a measure of the absorbed radiation dose to which the material has been exposed. Using an ionization chamber, it is possible to perform a proper calibration of the OSL signal emitted, and than evaluate the dose value, the aim of this study [6].
The OSL dosimeters do not need any heating or thermal treatment, as the TLD dosimeters do. They can be read many times, allowing a proper statistical evaluation of the signal versus the delivered dose. The A1203:C stands out for having TL properties with an extremely high degree of sensitivity. Some authors state that it is between 40 and 60 times the TLD sensitivity.
In order to generalize the use of OSL dosimetry in radiotherapy, the Landauer Inc. has developed a simple and efficient commercial OSL system (InLight ™) for dosimetry. This system, used for individual monitoring in radiation protection, has been tested with radiotherapy dosimetric purposes and gave good results [6]. We used the Landauer dosimeters (A1203:C) called Dots. They are prepared as chips and encased in plastic cassettes to be protected from light.
The purpose of this study is to verify the possibility of using the OSLD produced by Landauer Inc. for in vivo dosimetry in radiotherapy. For this reason the detectors were tested in different configurations used in radiotherapy treatments for the anatomical regions of the pelvis (using 6 and 15M V beams)
491

(Fig. 1) and head and neck (in Co-60 beam). Part of this work was taken under the IAEA-CRP 2E.40.14. A single Dot is positioned on the surface of the patient and always in the center of the treatment field with a proper stainless steel build-up cap to promote electronic equilibrium.
For a patient measurement the 'entrance dose', D, is defined as the dose at the depth of dose maximum. From the in vivo detector reading this is calculated as the product of the detector reading
D = M N cal SSD -d„
\2
vSSD + d m x y ' kLin • kE
V . k • k .ft field Ang SSD ^W kT • kDot
(M), the calibration factor (Ncai) and correction factors:
where k's are the relevant correction factors applicable for a given detector in a specific clinical setup: kun is used for dose non-linearity corrections, kE for energy correction, kfieid for a small field size, kAllg
for angular beam incidence, kSSD for an extended SSD, kw is used in a wedged beam geometry, kT for trays and kDot is the sensitivity factor for a individual Dot.
1,20
1,15
1,10 S 1,05 Si 1,05
£ 1,00
g 0,55 Q 0,90
0,S5
0,80 10 15 20
Patients I Field
25 30 35
FIG.l. In vivo measurements in Linac with 15MV beam.
An essential feature for any detector to be used in in vivo measurements is good spatial resolution, as shown by the AhC^C material. Its high sensitivity allows the construction of detectors with veiy small dimensions.
Thus, the use of OSL detectors in clinic quality control programs has been recommended. The reproducibility of the OSL signal of radiation detectors for multiple readings is about 1% and the uncertainties of the measurements for the same dose value stands at 0.7%. In a batch of non-selected Dots, about 60% show sensitivity factor less than 3%, resulting in a final uncertainty for in vivo dose evaluation, between 1.8% and 2.5% depending on the complexity of treatment (extended SSD, wedge, tray, etc.).
REFERENCES [1] ICRU REPORT 50. Prescripcion, Registro y Elaboracion de Informes en la Terapia con Haces
de Fotones, Sociedad Espanola de Fisica Medica, November, 1999. [2] GRAY J.E. OSL, Dosimetry for the Twenty-First Century. First RCM on development of
procedures for in-vivo dosimetry in radiotherapy (e2-rc-982.1). IAEA. 4 - 8 , April 2005. [3] VIEGAS, C.C.B., Dosimetria in vivo com uso de detectores semicondutores e
termoluminiscentes aplicada ao tratamento de cancer de cabe9a e pesc090. Tese de Mestrado, UFRJ. Rio de Janeiro, RJ. 2003
[4] BOTTER-JENSEN L„ MCKEEVER S.W.S. AND WINTLE A.G. Optically Stimulated Luminescence Dosimetry. Elsevier Science B.V, Amsterdam. 2003.
[5] JURSINIC P.A. Characterization of optically stimulated luminescent dosimeters, OSLDs, for clinical dosimetric measurements. Med. Phys. 34 (12), December 2007.
[6] VIAMONTE A., DA ROSA L.A.R., BUCKLEY L.A., CHERPAK A. AND CYGLER J.E. Radiotherapy dosimetry using a commercial OSL system. Med. Phys. 35 (4), 1261-1266, April 2008.
492

IDOS, Vienna, 9-12 November 2010 E2-CN-182, Paper No 125
Evaluation of the dosimetric perturbation introduced by an esophageal nitinol stent
Garcia Yip F.a, Padilla Cabal F . \ Silvestre Patallo I.a, Perez Liva M . \ Morales Lopez J, L., De la Fuente Rosales L.a
a Department of Radiotherapy, Institute de Oneologia y Radiobiologia (INOR), Havana, Cuba b Institute Superior de Tecnologias y Ciencias Aplicadas, Havana, Cuba
E-mail address of main author: yipUt infomed.sld.cn
The insertion of a metallic stent prior to the combined chemo-radio treatment in cases with advanced stage tumors may improve patient's nutrition during the treatment period and consequently help them withstand the morbidity of these procedures until all fractions are completed.
The dose perturbation around the stent has been previouslly investigated for a variety of models by Monte Carlo methods [1], The aim of the present study is to quantify the pertubations of the NiTi-type stent in three ways: a) By the treatment planning system, b) Simulated by Monte Carlo, and c) Measured by gafchromic EBT-2 film rolls. The stent investigated is the uncovered oesophageal NiTi El 810 (Euromedical, Brescia, Italy) of 18 mm in diameter and 100 mm length as shown in Fig. 1. The diamond geometry of the mesh can be seen in Fig.2, its dimensions and the filament diameter of 250 [.im were measured with an Olympus BX51 microscope. The alloy composition is assumed to be 56% Ni and 44% Ti.
FIG. 1 NiTi Stent used FIG. 2 1 OX photo of the in this study stent mesh
FIG. 3 Experimental array to irradiate the stent
To mimic the clinical set-up, a simple phantom consisting in a plastic tube filled of air simulating the oesophagus lumen and surrounded by the stent was immersed at 10 cms depth in a water tank (see Fig.3). The phantom was scanned on two different CT scanners (Siemens and Shimatsu) for a subsequent planning and irradiated for the dosimetry measurements.
The treatment planning system calculations needs to be involved in this study since it will be the tool for patient planning. The relative electron density (RED) vs CT number calibration curve commissioned into our TPS (Elekta Precise Plan, v2.16), is reliable within density values that are typically found in the human tissue. The density of the Nitinol alloy (6.42 g/cm3) falls outside this interval. Then, it is expected that the artefacts will alter the density of the adjacent tissues in the images, and that the accuracy of the calculated dose distribution around the stent will fail. The dose distributions obtained for both treatment techniques with and without stent were not very different, so in the immediate vicinity of the stent wall (oesophagus mucose), TPS calculations will be further corrected according to the results of the other two methods.
Monte Carlo calculations of the dose distribution around the stent are performed with MCNP representing the real (diamond) geometry of the NiTi stent.
493

A phase space previously computed and tested for our Elekta precise linac (Elekta, Crowley, UK) was applied to the 10x10 cm field size defined by the MLC collimator. The axis of the 10 cm length stent cylinder was at 10 cm depth in a SAD set-up. The radius of the air cavity (lumen) is 0.975 cm. Distributions were obtained for both linac photon energies (6 and 15 MV) and for single and parallel opposed irradiation techniques. As an example, Fig.4 shows the dose ratio (with and without stent) along the beam axes for a direct field of 15 MV.
FIG.4 Monte Carlo (MCNP) computed dose ratio (with and without stent) along the beam axes around the stent for a direct field of 15 MV. (stent axes is at 0 cm depth).
The dose perturbation of the stent is under investigation by dosimetry measurement with gafchromic waterproof EBT-2 films. Foils of 6x1 cm" were cut and rolled around the stent to cover its whole outer surface. A dose of 200 cGy was delivered to the axes of the stent in two different series, with and without the stent. Following a procedure already established at the department (which is mainly based on references [2] and [3]) films were processed in an Agfa Duoscan CCD scanner after 24 hours of self-developing. Three problems arose in the gafchromic measurement: 1. When attaching and taking out the foils to the very flexible and thin stent wall, 2. When trying to bend the somewhat rigid foils to the small radius of the stent and 3. When drying out the foils after irradiation without altering its information. It was evident that the handling of the films is an important error source and a number of foil readings had to be discarded.
Experimental work is not yet concluded, irradiation and further scanning of gafchromic films is still going on at this moment and we expect to find a perturbartion in the doses few millimeters from the investigated stent wall to be in the same order of the Monte Carlo results.
REFERENCES
[1] LI, X.A. et al "Radiotherapy Dose Perturbation Of Metallic Esophageal Stents" Int. J. Radiation Oncology Biol. Phys., Vol. 54, No. 4, pp. 1276-1285, 2002.
[2] DEVIC S.et al , "Precise Radiochromic Film Dosimetry Using a Flat-bed Document Scanner", Med Phvs. 2005 Jul;32(7):2245-53.
[3] ARRANS R. et al, "Dosimetria con Peliculas Radiocromicas", Fisica Medica. Vol. 10. N.2. 2009. Pag. 83-104.
494
IDOS, Vienna, 9-12 November 2010 E2-CN-182, Paper No 125
Dosimetry of proton spot beam profiles of the scanning beam nozzle at the Proton Therapy Center in Houston
N. Sahoo, X. R, Zhu, A. Anand, G. O. Sawakuchi^, G. Ciangaru, F. Poenisch, K. Suzuki, U. Titt, R. Mohan, M. Gillin
Department of Radiation Physics, UT MD Anderson Cancer Center, 1515 Holcombe Boulevard, Box 1150, Houston, TX 77030 USA
E-mail address of main author: [email protected]
Purpose The measured lateral profiles (LP) by small ion chambers (IC) and the planar integral spot dose (PISD) by large area IC can be affected by their sizes and both need to be corrected. The purpose of this study is to: (a) quantify the detector size effect on the LP of the proton pencil beam spots (PPBS) and (b) to devise a procedure to accurately determine the PISD. Methods and material
In-air fluence and in-water dose LP, P(x), of 72.5, 146.9 and 221.8 MeV energy PPBS of the Hitachi ProBeat machine at the Proton Therapy Center in Houston were measured by a PTW Pinpoint IC (Model 31014, 1 mm radius). The measured LP were fitted to a sum of Gaussian functions,
Pm(x) = EA, exp (- x2/2cmi2) (1).
The P,„(.x) was then deconvolved with a Gaussian detector response kernel,
K(z) = B. exp (- Z2/2Ck2), (2)
with aK taken as equal to the radius of the IC. The resulting deconvolved LP are given by a sum of Gaussians,
P(x) = EC, exp (- x2/2op2), (3)
with C P I2 = cmi
2 - Gk2. The magnitudes of the detector size effect on LP of PPBS were quantified by
comparing the full width at half maximum (FWHM) and full widths at 0.9 and 0.01 of the maximum, (FW0.9M, FW0.01M) of the LP with and without the detector size corrections. The corrected and uncorrected LP were also compared to assess the differences.
For an isotropic planar spot dose distribution (PSDD), the PISD can be computed from
PISD (d) = D„ Jl'(r) 2 %x dr, (4)
' Presently at: Department of Physics, Carleton University, 1125 Colonel By Drive
Ottawa, ON, K1S 5B6, Canada
495

where P(r) is the radial profile function and D0 is the dose at the peak of the LP, which was measured using a PTW Advanced Markus IC (Model 34045) in broad fields created by the supeiposition of PPBS.
The PISD was computed using both the measured P(r) by numerical integration and the fitted ones [Eq. (3)] analytically. For anisotropic PSDD, an average of PISD values, which were computed by using P(r) at different angles with the principal axes, were calculated.
The effect of detector size correction of measured LP on PISD were evaluated by comparing its values obtained using the Gaussian fitted LP with and without the correction. The computed PISD values were compared with values measured with a PTW Bragg Peak Chamber (BPC) (Model 34070, 4.08 cm radius) to determine correction factors (CF) for this chamber's size limitations.
Results
The largest change in the values of FWHM, FW0.9M and FW0.01M for LP of PPBS of all the three energies used for this study, were found to be less than 0.3, 0.1, 0.5 mm for in-air and 0.2, 0.1, 0.3 mm for in-water LP, respectively, after the detector size effect corrections were applied. There is a 0.2 mm uncertainty in the measured values of these quantities due to scanning system detector positioning accuracy limitations. Additionally, the statistical uncertainties in IC charge measurements is below 0.5% for the central, and is about 10% in the low dose tail regions of the LP. These uncertainties are not expected to affect the magnitudes of the detector size corrections. The detector size corrected and the measured LP were found to be very close to each other. The smallness of detector size effect on PPBS lateral profiles is attributed both to the small size of the Pinpoint chamber and the absence of large second gradient beyond the peak of the Gaussian like LP. The ratio of the PISDs calculated using the detector size corrected and uncorrected measured LP, ranged from 0.995 to 0.970, being higher for lower energy PPBS and at deeper depths. The CF for BPC measured PISD ranged from 1.01 to 1.11, being higher for the lower energy PPBS, which have longer tails in the profiles. The CF is also found to be higher at depths where the nuclear interaction component may lead to longer tails in the LP. The CF values from the PISD calculation using the measured LP were found to be in satisfactory agreement with the results from Monte-Carlo simulation [1].
Conclusion
The Pinpoint IC size effect on the LP of PPBS were found to be rather small. We have devised practical procedures for precise determination of the peak dose and the PISD of PPBS.
REFERENCE
[1] SAWAKUCHI, G. 0., et. al, Med. Phys. (to be published).
496

IDOS, Vienna, 9-12 November 2010 E2-CN-182, Paper No 125
Treatment delivery reproducibility of an helical tomotherapy system evaluated by using 2-D ionization chamber and imaging detector arrays
E. Cagni, M. Paiusco, A, Botti and M. Iori
Medical Physics Department, Arcispedale S. Maria Nuova, Reggio Emilia, Italy
Email address of main author: [email protected]
The Tomotherapy Hi-Art system (HT) is a radiation therapy machine that integrate the delivery of intensity modulated radiation therapy (IMRT) in a helical fashion together with a real time computed tomography (CT) image-guided radiation therapy (IGRT). The radiation source (Linac, 6 MV) is collimated into a fan beam and modulated by means of a binaiy multileaf collimator (MLC). A xenon detector array, opposite the radiation source, allows a megavoltage-CT (MVCT) acquisition of patient images for set-up verification and collect exit dosimetry data during the treatment delivery [1], The HT treatment unit can in principle provide a treatment verification method called "dose reconstruction" that allows the daily treatment to be reconstructed in the form of delivered dose images. These delivered dose images could be compared to images of planned dose to determine if following treatments should be modified to correct for errors in completed treatments - a process called "adaptive radiation therapy". The combination of daily CT imaging and dose reconstruction capabilities could therefore allow an extremely high accuracy in treatment delivery process. Although this type of validation dosimetry is not yet available on current HT units, the acquisition system is increasingly used for dosimetry purposes as well as for imaging purposes.
The scientific guidelines recommend a quality assurance program, based on patient-specific tests, for evaluating the agreement between measured and calculated plan dose for the intensity modulated treatments. However, to realize an accurate process of validation of the radiation treatments is also crucial to check the overall reproducibility of the dose delivered for the entire course of treatment. Aim of this work is to investigate the dose reproducibility of an HT unit during the delivery of different plans with an increasing level of complexity. Measurements were performed with two different dosimetric systems: the HT on-board MVCT detectors and a conventional two dimensional array (Seven29, PTW) coupled with a dedicated Octavius phantom (2D-OCTAVIUS) . The array consists of 27x27 vented cubic ion chambers of 0.125 cm3, with an inter-centre spacing of 1 cm. The Octavius phantom contains a compensation cavity to optimise the detector response when the 2D array is irradiated from the rear during the helical delivery [2].
Five clinical HT plans with increased level of complexity, ranked using the Webb's Modulation Index (MI) [3], were selected for the analysis. All plans were delivered several times (repeatability condition) in different days (reproducibility condition) and acquired, simultaneously, with both 2D-OCTAVIUS and MVCT systems. Both detectors data were analysed with an in-house MATLAB tool. In order to evaluate the repeatability and reproducibility of the multiple treatment deliveries, an extension of "Reproducibility Distribution" (RD) and "Reproducibility Index" (RI), defined in the paper of M.S. Padro [4], were used. The dependence of RD and RI by the complexity level of treatment deliveries were investigate.
The measurements performed with 2D-OCTAVIUS have shown a repeatability distribution within 1 % for all plans, while for the reproducibility distribution the values varies within 1% and 3% depending on plan complexity. Analogous results were found for the data acquired by the MVCT. Relatively to the RI index, a similar agreement was obtained with both dosimetric systems, who's linear behaviours are shown in FIG. 1 a) by means of a correlation graph.
497

The RI factors derived from the two measurement datasets have shown a linear correlation with the MI index, pointing out higher RI values for the most complex plan deliveries ( FIG. 1 b)).
x 0) T) C
-3 o Z) u o D. <D cr
0.08
0.06
Z 0.04 o 0) 'O "a O >
a)
0.02
o /
•4 /
a-
/ ;
y
0 o
o o /• % 0
/
o o
o
t •M
"" 6 / o O
0 0.2 0.4 0.6
0 . 0 9
X (L)
• a 0 . 0 8 0 . 0 8
> •
Zi 0 . 0 7
o
TJ o 0 . 0 6
D. cr
0 . 0 5 o <i •a a) 0 . 0 4 TD 1— u > 0 . 0 3
b) 0.02
o
o o
o
o
0 0 . 0 5 0 . 1 0 . 1 5 0
Webb Ml Index 2DArray-Octavius Reproducibility Index FIG.l. a) Correlation graph of RI measured with 2D-OCTA VIUS and MVCT systems for all clinical plans considered in this study, b) Linear behaviour ofRIfactor, derived from MVCT detector data, with the Ml index of the five clinical plan considered.
The dose reproducibility of different clinical HT plans using the 2D-OCTAVIUS system and the MVCT detectors has been investigated. Both systems measure the same level of treatment reproducibility confirmed by a similar trend of the RI and RD values. Additional measurements are required to confirm these preliminary results.
REFERENCES
[1] JERAJ R„ MACKIE T.R., BALOG J., OLIVERA G„ PEARSON D„ KAPATOES J., RUCHALA K. AND RECKWERDT P., Radiation characteristics of helical tomotherpy. Med Phys., 31(12), pp396-404, 2004.
[2] VAN ESCH A., CLERMONT C„ DEVILLERS M„ IORI M„ HUYSKENS D.P., On-line quality assurance of rotational radiotherapy treatment delivery by means of a 2D ion chamber array and the Octavius phantom. Med Phys., 34(10), pp3825-3837, 2007.
[3] WEBB S., Use of a quantitative index of beam modulation to characterize dose conformably: illustration by a comparison of full beamlet IMRT, few-segment IMRT (fsIMRT) and conformal unmodulated radiotherapy, Physic in Medicine and Biology, Vol.48, pp.2051-2062, 2003.
[4] SASTRE-PADRO M„ LERVAG C„ EILERTSEN K„ MALINEN E„ The performance of multileaf collimators evaluate by the stripe test, Medical Dosimetry, Vol.34 (3), pp.202-206,2009 .

IDOS, Vienna, 9-12 November 2010 E2-CN-182, Paper No 125
Quality assurance in radiotherapy with anthropomorphic phantoms
P Alvarez, A. Molineu, D Followill, G. Ibbott
UT MD Anderson Cancer Center, Radiological Physics Center, Houston, Texas, USA
E-mail address of main author: [email protected]
The Radiological Physics Center (RPC) uses mailable anthropomorphic phantoms to evaluate treatment delivery at institutions wishing to participate in National Cancer Institute (NCI) sponsored clinical trials. The phantoms simulate lesions to be treated in the head and neck, prostate, liver, spine or lung, and allow verification of 3D-CRT, SBRT and IMRT plans. A reciprocating table, which is able to reproduce different breathing cycles, is also included when a technique to account for target motion is required for the credentialing process. The phantoms contain imageable targets as well as organs at risk (OAR). Densities and dimensions provide realistic conditions for dose constraints used during the planning and delivery process. Participating institutions are instructed to image the phantom, plan a treatment following guidelines, perform all the quality assurance (QA) procedures used in clinic and deliver the plan as if it were a patient. The analysis of the irradiation is a two steps process. Thermoluminescent dosimeters (TLD) are used to determine absolute dose at specific points inside the target. The ratio between the TLD dose and the dose from the treatment planning system (TPS) at the same points must be within ±7% (the exception is the lung and spine phantoms with a ±5% criterion). Radiochromic film can be placed in orthogonal planes through the center of the target. These films allow the evaluation of the dose distribution over the target area and into the surrounding OAR. A comparison of profiles through three different axes between film and TPS data is performed. The agreement must be < 4 mm in high-dose gradient regions (for the lung phantom this value is 5 mm). Gamma analysis is used for the lung and spine phantoms.
Since 2001, when the program started with the head and neck phantom, more than 1200 cases have been analyzed. The number of irradiations that failed to meet the criteria and the total number of irradiations done is shown on Table 1.
Table I: Results from irradiation ofphantoms. Percentage of failure is shown in parentheses.
Phantom in Acceptable Irrad. / Irrad. analyzed ist. failed on first attempt / Total Inst.
H&N 175 / 805 (22%) 133 /582 (23%)
Prostate 33 / 188 (18%) 3 1 / 1 6 6 ( 1 9 % )
Liver 11 / 2 3 (48%) 8 / 1 6 (50%)
Spine 1 0 / 2 9 (34%) 1 0 / 2 6 (38%)
Lung 5 8 / 2 1 6 (27%) 43 / 153 (28%)
499

The ratio between the number of institutions able to meet the criteria and number of irradiations done in a year has increased since the program started but the failure rate remains at about 30% for the lung and spine irradiations. Reason for failures include beam modeling, set up errors, incorrect data entered into the TPS, software malfunction, errors in couch indexing, incorrect conversion from CT number to electron density as well as inadequate heterogeneity algorithms. Regarding this last item the experience from the irradiation of the lung phantom provide criteria to defined accepted algorithm of dose calculation for sites were difference in tissue densities is significant. Dose calculations based on Clarkson or pencil beam algorithm are considered unacceptable for clinical trial because of problems in differences in predicted dose and coverage at edges of the target.
Conclusions
The phantoms provide a comprehensive evaluation of new external beam treatment technologies currently used in radiotherapy. The existence of a quality assurance program that audits the entire treatment process is very important. The analysis of these phantom results allow the RPC to detect and resolve important planning as well as delivery problems. Credentialing with phantoms helps to improve the quality of the data used by the clinical trial groups by resolving any errors discovered. This audit program benefits not only trial patients but all the patients treated under similar conditions at the participant institutions.
This work was supported by PHS CAO10953 and CA081647 awarded by NCI, DHHS
REFERENCES
[1] MOLINEU, A.,"RPC's IMRT phantoms" SWAAPM October 2007 [2] MOLINEU, A, et al, "Has IMRT delivery improved in the last 5 years?" Medical Physics Vol.
5, (2008)2762 [3] FOLLOWILL, D., et al. "Design, development, and implementation of the Radiological Physics
Center's pelvis and thorax anthropomorphic quality assurance phantoms". Medical Physics, Vol. 34, Issue 6 (2007)
500

IDOS, Vienna, 9-12 November 2010 E2-CN-182, Paper No 125
Nemo X: Freeware independent monitor units calculation for external beam radiotherapy
S. Agostinellf, S. Garellia, F. Foppianob, G. Taccinia
a S.C. Fisica Medica, National Cancer Research Institute, Genova, Italy
b S.C. Fisica Sanitaria, ASL n.5, La Spezia, Italy
E-mail address of main author: stefano.agostinelli@istgedt
In External Beam Radiotherapy (EBRT) the check of dosimetric calculations is a major concern in the quality assurance of the treatment. This is true not only for conventional conformal techniques but also for special techniques including Intraoperative Radiotherapy (IORT), Total Body Irradiation (TBI) and Intensity Modulation (IMRT).
As evidenced by primary international organizations dealing with radiation dosimetry and quality assurance (ESTRO[l], ICRP[2], IAEA[3]), a fundamental aspect of the treatment planning process is the independent verification of Monitor Units (MU). Moreover in some situations (backup of commercial planning systems, urgent palliations, TBI and IORT treatments) there is a concrete need for a system of dosimetric calculation alternative to Treatment Planning Systems (TPS).
To address this kind of exigency the National Cancer Research Institute of Genova started in year 2000 a research project which put as its main objective the development of a software application (Nemo X) for the independent dosimetric calculation and verification of the MU with the following features:
• Running on Windows platform • Management of all dosimetric data through graphical user interface • MU calculation for EBRT with photon and electron beams including IMRT • TBI calculations for anterior-posterior and lateral-lateral techniques • MU calculation for IORT treatments • Data interface to commercial Treatment Planning and Record&Verify systems with automatic
import of Multileaf Collimator (MLC) shape • Print out of treatment and QA data
The dose algorithm for photon and electron beams is based on the formalism presented by Khan in [4] and includes scatter separation and integration. Commissioning of the system has been done using the recommendations given by TPS QA protocols [5][6][7]. Deviations of calculated dose vs. measured dose in water phantom on beam central axis (or at the center of asymmetric or irregular beams) were always within ± 3%, a result very similar to what is achievable by commercial TPS. Actually Nemo X is in use at the National Cancer Research Institute for the independent verification of the MU provided by different TPS for all conformal EBRT treatments and for calculations for Total Body Irradiations. Ongoing developments include IORT calculations and independent check of IMRT and Tomotherapy treatments. Fig.l reports the histogram of the percent deviations between the MU calculated by Nemo X and the MU computed by three different Treatment Planning Systems (Varian Eclipse, Elekta CMS XiO and Elekta Ergo) recorded during the last year of routine use. Percent deviations are within ± 3 % in 87 % and within ± 5 % in 96 % of the examined beams, a result which proves that the MU check performed by Nemo Xis consistent and can really detect anomalies in the dose calculations. In our experience the regular usage of Nemo X allowed us to reduce the occurrence of some treatment planning pitfalls and dose prescription mismatches. Another advantage is the standard treatment report printed for the radiation therapists independently by the TPS on which the treatment was planned.
501

1000
900
800
ifi ^
-10 -9 -8 -7 -6 -5 -4 -3 -2 - 1 0 1 2 3 4 5 6 7 8 9 10
DEV% (Nemo X vs TPS MU)
FIG. 1. Histogram of percent deviations between the MU calculated by Nemo Xand three different commercial Treatment Planning Systems.
Currently supported systems include: • Linear accelerators with physical, dynamic and virtual wedges • MLC: Varian 52 and 80-leaves, Siemens 58-leaves and Elekta Moduleaf |iMLC • Data interface to Varian MLC files and Lantis Record&Verify
In order to share our project with the international community working with clinical dosimetry in EBRT, Nemo X will be soon available as freeware through a dedicated Internet site. Download will require only a free registration and the activation of a personal keyword.
REFERENCES
[1] EUROPEAN SOCIETY FOR THERAPEUTIC RADIOLOGY AND ONCOLOGY. Monitor unit calculation for high-energy photon beams. Physics for Clinical Radiotherapy Booklet No. 3, ESTRO, 1997.
[2] INTERNATIONAL COMMISSION ON RADIOLOGICAL PROTECTION. Preventing accidental exposures from new external beam radiation therapy technologies. Ref.32/147/07, ICRP, 2007.
[3] INTERNATIONAL ATOMIC ENERGY AGENCY. Lessons Learned from Accidental Exposures in Radiotherapy, Safety Report Series No. 17., IAEA, 2000.
[4] THE PHYSICS OF RADIATION THERAPY. Faiz M. Khan, Lippincott Williams. [5] INTERNATIONAL ATOMIC ENERGY AGENCY. Commissioning and Quality Assurance of
Computerized Planning Systems for Radiation Treatment of the Cancer. Technical Reports Series No. 430, IAEA, 2004.
[6] EUROPEAN SOCIETY FOR THERAPEUTIC RADIOLOGY AND ONCOLOGY. Quality Assurance of Treatment Planning Systems Practical Examples for non-IMRT Photon Beams. Physics for Clinical Radiotherapy Booklet No. 7, ESTRO, 2004.
[7] INTERNATIONAL ATOMIC ENERGY AGENCY. Specification and Acceptance Testing of Radiotherapy Treatment Planning Systems. TECDOC-1540, IAEA, 2007.
502

IDOS, Vienna, 9-12 November 2010 E2-CN-182, Paper No 125
Beam matching of Primus linacs for step and shoot IMRT
D. Venenciaa, E. Garrigoa, C. Descampsa, E. Gomeza, R. Mainardib, Y. Pipmanc
a Instituto de Radioterapia, Cordoba, Argentina
b Facultad de Matematica, Astronomia y Fisica, FaMAF - UNC, Cordoba, Argentina
c Long Island Jewish Medical Center, New York, USA
E-mail address of main author: ([email protected]
Introduction Patient treatment flow in radiotherapy can be optimized by having linacs with identical dosimetric characteristics. The aim of this work was to compare the dosimetric characteristics of two linacs with beam-matching adjustments and its effect on step and shoot IMRT fields and to compare the results of patient specific quality control of IMRT treatments plans on both linacs.
Materials and method
Two linacs Primus, Siemens with 6MV photon beams were used. One of the linacs was taken as reference and the second one was adjusted in terms of energy and flatness following the manufacture beam-matching procedure. Comparison of percent depth dose (PDD,0 and P D D 2 0 ) i o ) , output factors (Scp and Sc), inplane and cross plane profiles, diagonal profiles, primary collimators and MLC transmission and performances for small MU delivery, were done. Both MLC were calibrated following the same factory procedure and the leaf positions were verified with a slit pattern test [1], The reference linac data was used in the commissioning of the treatment planning system (TPS) (Konrad v2.2, Siemens) to represent both linacs. Standard IMRT patterns (uniform fields, wedge, pyramid, chair, holes and peaks patterns) were calculated and measured on both linacs for verification [2]. For a set of 50 IMRT treatment plans (prostate, head and neck, rectum) we created verification plans in order to compare calculated versus measured dose for both linacs. Absolute doses were measured in a water-equivalent phantom with a Farmer type ionization chamber. Moreover, for 10 IMRT treatments, a total plan and individual field dose distributions were calculated on a water-equivalent phantom. Total plans and individual fields were irradiated with both linacs and measured using EDR2 and X-OmatV films respectively. Calculated and measured dose distributions were compared using a gamma analysis criteria [3] implemented on the RITv4.2 software (AD=3%, DTA=3mm for total plan and AD=5%, DTA=3mm for individual fields).
Results
The PDDio and PDD2o,io variations were 0.1% and 0.4% for 1 Ox 1 0cm field. The Scp and Sc variation was less than 0.9%, down to field sizes of 3x3 cm'. All profiles passed a 2%/2 mm gamma evaluation criteria (y2«/ 1). Variations of the transmission of the primary collimators and MLC's were lower than 0.1%. Both MLC successfully passed the slit pattern test with leaf position variations smaller than 1mm. A minimum of 3MU per segment was used to assure a variation between calculated and measured dose lower than 2% for both linacs. The comparison between calculated and measured doses for all patterns showed that the number of pixels with 3mm>l was less than 5% and corresponded to the same high dose regions for both linacs measurements. For IMRT plans, mean variations between calculated and measured point doses were -0.6±0.7% [-2.1, 0.7] (linac 1) and -0.2±0.6% [-1.5, 1] (linac 2). The variation between linacs was -0.5±1% [-2.9, 1.2]. Total plan comparison showed that the pixel number with y3o/0) 3mm>l was 1.7±0.7% [0.4, 2.5] (linac 1) and 0.9±0,9% [0.3, 2.7] (linac 2).
503

Individual field comparison showed that the pixel number with y5%y ;;„„„> 1 was 1.0±1.2% [0, 1.3] (linac 1) and 0.6±0.6% [0.1, 2.2] (linac 2).
Conclusions
When the dosimetric characteristics of two linacs are within clinically accepted accuracy, it is possible to model just one in the TPS, and still be within clinically acceptable recommendations in the delivery of open and IMRT fields. From a dosimetric point of view, changing linacs that are beam-matched in this way does not require additional changes or extra verifications of the IMRT treatment plans.
REFERENCES
[1] BAYOUTH J.E., WENDT D„ MORRILL S.M. "MLC quality assurance technique for IMRT applications", Medical Physics 30(5), May 2003.
[2] VENENCIA CI).. BESA P. "Commissioning and quality assurance for intensity-modulated radiotherapy with dynamic Multileaf collimator: Experience of the Pontificia Universidad Catolica de Chile", Journal of Applied Clinical Medical Physics, Vol. 5, N°2, spring 2004.
[3] LOW D.A., HARMS W:B:, MUTIC S„ PURDY J.A., "A technique for the quantitative evaluation of the dose distributions", Medical Physics 25(5), May 1998.
504

IDOS, Vienna, 9-12 November 2010 E2-CN-182, Paper No 125
A method to enhance spatial resolution of a 2-D ion chamber array as a filmless tool for quality control of MLC
R. Diaz Moreno11, D. Venenciab, E. Garrigob, Y. Pipman0
a Instituto de Neurologia y Neurocirugia, La Habana, Cuba
b Instituto de Radioterapia, Cordoba, Argentina
c Long Island Jewish Medical Center, New York, USA
E-mail address of mains authors: [email protected]; [email protected]
Introduction
Verification of the accuracy of multileaf collimator (MLC) leaf positioning is a vital component in a quality control program in any Radiation Therapy Department [1], The decline of film-based dosimetric systems reinforces the trend to use 2D detector arrays. This work introduces a quantitative method to increase the spatial resolution of a 2D ion chamber array to replace film based methods for performing quality assurance (QA) of MLC leaf positioning. This method is based on the principle of varying signal response of a volumetric detector to partial irradiation [2, 3].
Materials and method
The method was applied to a PTW-729 2D ion chamber array and an Optifocus MLC, Siemens. The partial volume response curves for chambers in the array were obtained by irradiating them with the leaves of the MLC progressively covering various portions of the chamber and correlated with the leaf positions. The readings from the array's software and the linear fit of the chambers response were processed with an application developed in the Matlab environment. The program generates a reference response for each chamber that translates readings into leaf positions. Slit patterns of leaf positions similar to the Bayouth Test [4], but with purposefully introduced errors of various magnitudes and directions were generated and used to test the effectiveness of the method. The same patterns were exposed on radiographic film and analyzed with the RIT software v5.2 for validation.
Results
The method was successfully used to detect the errors introduced in individual leaves, in magnitude and direction. For variants tests patterns with a total of 100 errors of ±lmm, ± 2mm and ± 3mm, all were correctly determined in magnitude and sign. The average of the detected errors for the 1 mm, 2 mm and 3 mm groups were 0.97 ±0.17 mm, 1.84 ± 0.16 mm and 2.8 ± 0.1 mm, respectively. In comparison, the analysis of the same pattern with film using the RIT software resulted in either somewhat low true positives combined with a large fraction of false positives, or a low true positive rate with a low false positive ratio. The results being significantly affected by the threshold selected for the analysis. This method also allows discriminating errors in pairs of opposing leaves that could combine to cancel their detection in the MLC Fast Checker analysis that also uses the PTW-729 2D ion chamber array.
505

Conclusions
This method provides a superior substitute for film based QA methods of MLC performance, with excellent spatial resolution. It detected and correctly quantified all the positioning errors intentionally introduced, with a minimum number of false errors.
It provides an effective and easy to use tool for quantitative measurement of MLC leaf positions, without compromising resolution. It can be easily applied to other 2D arrays as long as they exhibit a partial volume detector response.
REFERENCES
[1] BOYER A., BIGGS P., GALVIN J., KLEIN E„ LOSASSO T„ LOW D„ Mah K„ Yu C„ "Report of task Group N°50 Radiation Therapy Committee, Basic Applications of Multileaf Collimators", AAPM Report N°72, 2001.
[2] YANG Y., XING L., "Using the volumetric effect of a finite-sized detector for routine quality assurance of multileaf collimator leaf positioning", Medical Physics 30(3), March 2003.
[3] SPEZI E„ ANGELINI A., ROMAN! F„ FERRI A., "Characterization of a 2D ion chamber array for the verification of radiotherapy treatments", Physics Medicine and Biology 50, 3361-3373,2005.
[4] BAYOUTH J.E., WENDT D„ MORRILL S.M. "MLC quality assurance technique for IMRT applications", Medical Physics 30(5), May 2003.
506

IDOS, Vienna, 9-12 November 2010 E2-CN-182, Paper No 125
Physical aspects of radiotherapy quality assurance: quality control protocol - Update of IAEA TECDOC-1151
R. Alfonso*'1, P. Andreob l , M. Brunetto0, E. Castellanosdl, E. Jimeneze, I. Silvestrea, D. Venenciae
aInstituto Nacional de Oncologia Radiante, La Habana, Cuba b Stockholm University, Sweden cInstituto Medico Dean Funes, Cordoba, Argentina
Hospital San Ignacio - Universidad Javeriana, Colombia eSociedad de lucha contra el cancer del Ecuador, Matriz Guayaquil, Ecuador eInstituto Privado de Radioterapia, Cordoba, Argentina 1 These authors have done their eontrubutions while working at thelAEA,
E-mail address of main author: [email protected], [email protected]
An International Atomic Energy Agency (IAEA) regional project for Latin America (ARCAL XXX) entitled "Improvement of Quality Assurance in Radiotherapy" was completed in 2000. One of its more relevant contributions was the development of a quality control protocol for radiotherapy physics, published as an IAEA TECDOC [1], This was the first document of this type published entirely in Spanish, having a marked practical approach, and focused on the situation of the radiotherapy in Latin America at that time. The document found broad application and was widely adopted in the region. The recommendations and guidelines of the document were also applied in other countries having a similar level of development in radiotherapy.
Since the publication of TECDOC-1151 [1], the status of radiotherapy has changed significantly in many of the radiotherapy institutions in the Latin American region. Technological advances and improvements have created the need for a thorough revision of the protocol to reflect the current situation regarding radiotherapy equipment and techniques, keeping it a suitable and practical tool to guarantee high quality in the nowadays rather complex radiotherapy treatments.
To fulfill this goal, a specific task was included in the IAEA regional project "Improvements in Quality Assurance in Radiotherapy in the Latin American Region" (ARCAL XC), running during the period 2007-2009, where a group of experts was formed and commissioned with the document revision.
The general criteria and procedures given in TECDOC-1151 are still valid for basic radiotherapy equipment, widely disseminated and playing an important role in clinical practice in the region. It was then considered to develop additional criteria and recommendations for the new advanced technologies in the form of a supplement to the existing protocol. The supplement describes procedures and provides recommendations for newly introduced radiotherapy equipment, followed by a series of appendixes where practical ways for their implementation are suggested, and a comprehensive list of references. Spreadsheets for absorbed dose determination based upon the IAEA TRS 398 Code of Practice [2] are also included for Co-60 gamma-rays and high-energy photons.
Six major topics have been included, starting with mould room equipment, multileaf collimators, electronic portal imaging devices (EPID), CT in radiotherapy, dynamic wedges, and new measurement equipment not considered in the initial protocol. Each topic includes an introduction with the
507

generalities of the technology and its impact in the improvement of radiotherapy treatments, a table summarizing recommended quality control procedures, their frequency and accepted tolerances with respect to reference values. QC procedures include beam dosimetry tests, dosimeter control tests and image control test for CT and EPID.
Finally the appendixes provide detailed explanations and examples of the required procedures and setup to carry out the measurements, as well as illustrative samples to record the results of each process.
The first draft of the document was developed by the group of experts and revised during a meeting in Buenos Aires, Argentina, in December 2008. A considerably amended version was prepared subsequently. This document served as basic guide for the implementation of an IAEA Regional Training Course on "Physical aspects of the quality assurance in 3D conformal radiotherapy: Update of the TEC-DOC-1151", which took place in Sao Paulo, Brazil, in March 2009. The course consisted on theoretical lectures and practical sessions during which the validity of the quality controls and the procedures proposed in the document were tested. 28 medical physicists from Latin American countries attended the course.
Feedback was received from the participants and trainers of the course, which led to a final revision. This document is now ready for distribution among the Medical Physics Societies in Latin America, to have the protocol tested by a wide range of radiotherapy institutions using different types of equipment. Subsequent feedback and recommendations will be incorporated into the final version of the document, which will then be submitted to the IAEA for publication.
REFERENCES
[1] INTERNATIONAL ATOMIC ENERGY AGENCY, Aspectos Fisicos de la Garantia de Calidad en Radioterapia: Protocolo de Control de Calidad, Tecdoc 1151, IAEA, Vienna (2000).
[2] INTERNATIONAL ATOMIC ENERGY AGENCY, Absorbed Dose determination in External Beam Radiotheray: An International Code of Practice for Dosimetiy based on Standards of Absorbed Dose to Water, Technical Reports Series No. 398, IAEA, Vienna (2000).
508

IDOS, Vienna, 9-12 November 2010 E2-CN-182, Paper No 125
A proposal for process QA in modern radiation therapy
L. J. Schreinera,b, T. Olding", J. Darkoa,1'
a Department of Physics, Queen's University, Kingston, Ontario, Canada
1 Medical Physics Department, Cancer Centre of Southeastern Ontario, Canada
E-mail address of presenting author: [email protected]
Conformal and intensity modulated radiation therapy (IMRT) have become the standard of care for radiation treatment in modern radiation therapy; in most centres these therapies are used with image guidance (with the acronym TGRT) to ensure target localization for precise treatment. These developments have also enabled the move to adaptive approaches (often designated IGART) where a patient treatment can be modified at various points taking advantage of information acquired during the process. A simple example would be patient setup modification immediately prior to dose delivery resulting from imaging at the treatment unit. These processes require considerable data processing for image registration and analysis. More sophisticated approaches envisage adaptation over each fraction. The proposals for inter-fraction IGART are not limited to corrections for tissue geometry. The potential for on-line dosimetry (perhaps via exit beam dosimetry with portal images or tomotherapy CT detectors) during each treatment raises the feasibility of dose delivery monitoring with subsequent correction as fractions continue through the treatment course. This implies that each fraction may delivery slightly different doses via slightly different MLC sequencing.
While other tools may be more convenient and appropriate to validate individual steps in IGART (for example, validating IMRT fluence patterns for a particular patient or verifying 3D-3D matching of CBCT and planning CT), these quality assurance (QA) tests validate only set points. By its very nature the IGART process involves a number of points where professional judgment is required (for example, to assess whether a patient is to be repositioned or if replanning is required). These decision points and process steps are not easily tested by conventional approaches. Therefore, we believe a process QA system is warranted.
We envisage that the IGART process QA would not be performed solely by the physics team. Rather, physics would prepare some dosimeter (we will illustrate this with a gel dosimetry system [1,2,3] we have available in our clinic) and insert it into an anthropomorphic phantom. The phantom would then be given to the radiation therapy team to process as a patient. Planning therapists would perform CT simulation, oncologists might contour structures which could be delineated in the target, planners or dosimetrists would plan the delivery on the treatment planning system, and treatment therapists would deliver the treatment using the IGART approaches being assessed. This could be whatever adaptive processes were in clinical practice. In this report we will illustrate the proof of concept by limiting the approach to simple patient set up with CBCT although the process to be tested could be more challenging
Conclusions: Modern adaptive radiation therapy involves complex processes that are typically evaluated by tests at single points in the process. It would be beneficial to develop tests more appropriate to evaluating the whole treatment protocols used in some IGART technique. A model based on gel dosimetry is proposed and will be illustrated with results from a patient localization study..
509
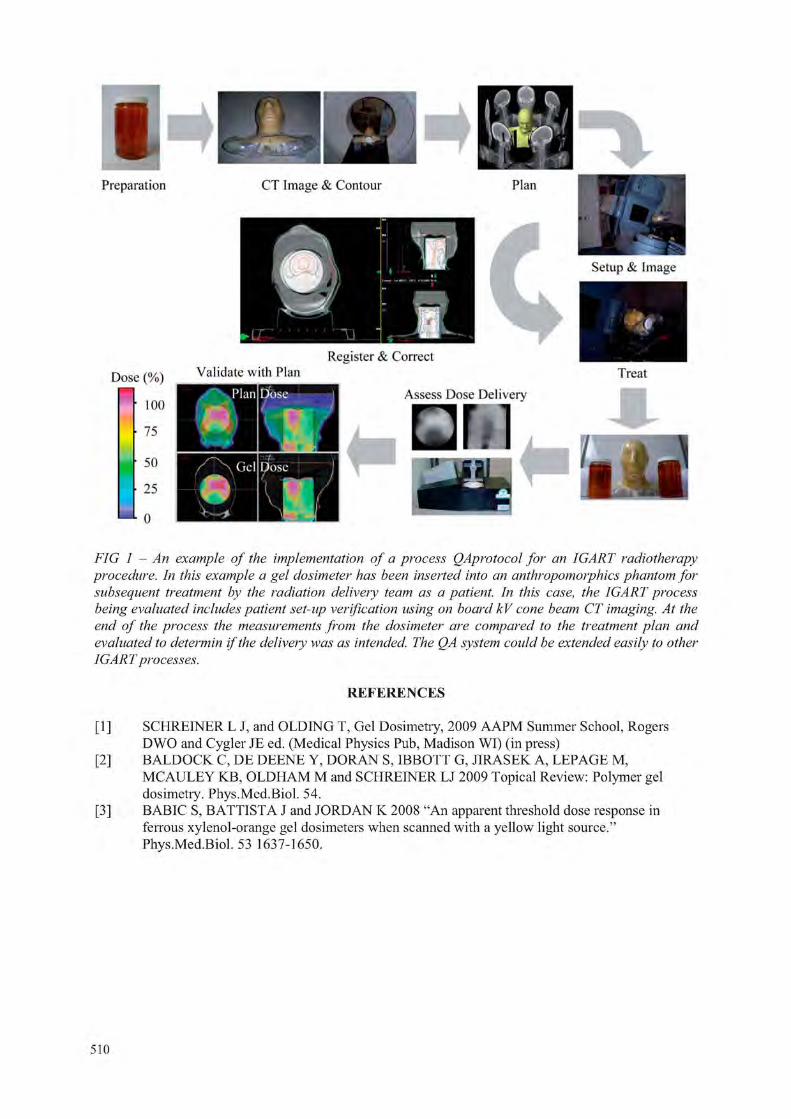
I Preparation CT Image & Contour Plan
Setup & Image
Dose (%) Validate with Plan Treat
Assess Dose Delivery 100 H N W 1
• i l l 75
50
25
0 I
FIG 1 - An example of the implementation of a process QAprotocol for an IGART radiotherapy procedure. In this example a gel dosimeter has been inserted into an anthropomorphi.es phantom for subsequent treatment by the radiation delivery team as a patient. In this case, the IGART process being evaluated includes patient set-up verification using on board kV cone beam CT imaging. At the end of the process the measurements from the dosimeter are compared to the treatment plan and evaluated to determin if the delivery was as intended. The QA system could be extended easily to other IGART processes.
REFERENCES
[1] SCHREINER L J, and OLDING T, Gel Dosimetry, 2009 AAPM Summer School, Rogers DWO and Cygler JE ed. (Medical Physics Pub, Madison WI) (in press)
[2] BALDOCK C, DE DEENE Y, DORAN S, IBBOTT G, JIRASEK A, LEPAGE M, MCAULEY KB, OLDHAM M and SCHREINER LJ 2009 Topical Review: Polymer gel dosimetry. Phys.Med.Biol. 54.
[3] BABIC S, BATTISTA J and JORDAN K 2008 "An apparent threshold dose response in ferrous xylenol-orange gel dosimeters when scanned with a yellow light source." Phys.Med.Biol. 53 1637-1650.
Register & Correct Validate with Plan
Assess Dose Delivery
510

IDOS, Vienna, 9-12 November 2010 E2-CN-182, Paper No 125
Comparative study of spectrophotometric response of the 270 Bloom Fricke gel dosimeter to clinical photon and electron beams
C. C. Cavinato3, R. K. Sakurabir , J. C. Cruzb, L. L. Campos3
a Institute) de Pesquisas Energeticas e Nucleares (IPEN-CNEN/SP), Sao Paulo, Brazil
b Hospital Israelita Albert Einstein (HIAE), Sao Paulo, Brazil
E-mail address of main author: [email protected]
The objective of this study is to compare the spectrophotometric response of the Fricke xylenol gel (FXG) dosimeter developed at IPEN, prepared using 270 Bloom gelatine from porcine skin produced in Brazil, replacing the FXG solution produced using 300 Bloom gelatine which is imported, hard to acquire and cost about forty-five times more, for clinical 6 MV photon and electron beams with energies between 6 and 16 MeV to the reference depth using solid and liquid water phantoms. The optical absorption spectra, dosimetric wavelengths, dose dependent response, sensitivity, lower detection limits and energy dependent response were evaluated and compared for both clinical beams.
The FXG solutions were prepared using 5% by weight of 270 Bloom gelatine, ultra-pure water, 50 mM of sulphuric acid, 1 mM of sodium chloride, 1 mM of ferrous ammonium sulphate hexahydrate and 0.1 mM of xylenol orange [1], The samples were conditioned in polymethyl methacrylate (PMMA) cuvettes ( 1 0 x 1 0 x 4 5 m m ) and stored under refrigeration ((4 ± 1) °C) and light protected during about 1 2 h [ l ] after preparation and maintained 30 min at room temperature and light protected before irradiation.
The samples were irradiated in the reading cuvettes with clinical photon (VARIAN® linear accelerator model CLINAC 6EX) and electron beams (VARIAN® linear accelerator model CLINAC 2100C) using a solid water RMI-457 (p = 1.03 g.cm"3) and liquid water (p = 1.00 g.cm" ) phantoms, respectively, with doses between 0.05 and 40 Gy, photon energy of 6 MV and electrons with energies between 6 and 16 MeV using radiation field size of 1 0 x 1 0 cm" and different reference depth to ensure the maximum dose in the centre of each FXG sample. The spectrophotometric measurements were performed using SHIMADZU® spectrophotometer model UV-2101PC.
The FXG solution presents two absorption bands, as expected: one at 441 nm (Fa" ) and other at 585 nm [2], corresponding to Fe ions generated by induced oxidation of Fe ions by radiation.
The dose-response curves to photon and electron beams (corrected to energy dependent response) are presented in Fig. 1.
The OA sensitivity is 0.08 au. Gy"1 for 6 MV photons and 0.07 au.Gv ' for 6 MeV electrons.
The lower detection limits experimentally obtained for photons and electrons are of 0.4 and 0.05 Gy, respectively in the clinical dose range studied. The energy dependent response for clinical electron beams is presented in Fig. 2.
511

a b FIG, 1. Spectrophotometric dose-response curves of the Fricke gel solutions irradiated with
clinical photon (a) and electron (b) beams.
Energy (MeV)
FIG. 2. Energy dependent spectrophotometric response of the Fricke gel solution irradiated with clinical electron beams.
The spectrophotometric response of the FXG solution presents maximum dependence of ± 10% for 9 MeV in the energy range studied. No energy dependence for electron energies greater than ±12 MeV and photon energy (6 MV) is observed.
The obtained results indicate that 270 Bloom FXG dosimeter provides excellent results when irradiated with clinical photon and electron beams. All results obtained in this study are similar to those obtained for 60Co gamma radiation [3] and also indicate the viability of implementing this dosimeter in photon and electron 3D dosimetry.
The authors are grateful to the HIAE and HC-SP to allow the samples irradiations in VARIAN® linear accelerators and CAPES, CNPq and IPEN by financial support.
REFERENCES
[1] OLSSON, L.E., PETERSSON, S„ AHLGREN, L„ MATTSSON, S„ Ferrous Sulphate Gels for Determination of Absorbed Dose Distributions Using MRI Technique: Basic Studies, Phys. Med. Biol. (1989) 43-52.
[2] BERO, M.A., GILBOY, W.B., GLOVER, P.M., Radiochromic Gel Dosemeter for Three-dimensional Dosimetry, Radiat. Phys. Chem. (2001) 433-435.
[3] CAVINATO, C.C., Padronizaijao do Metodo de Dosimetria Fricke Gel e Avalia9ao Tridimensional de Dose Empregando a Tecnica de Imageamento por Ressonancia Magnetica, Instituto de Pesquisas Energeticas e Nucleares, Sao Paulo (2009) 1-127.
512

IDOS, Vienna, 9-12 November 2010 E2-CN-182, Paper No 125
Simulated clinical effect of in-vivo diode perturbation in megavoltage photon beam radiotherapy
D.R. McGowan, R.Francis, R.W.Roberts, P.Dvorak
Oxford Radcliffe Hospitals NHS Trust, Department of Medical Physics and Clinical Engineering, Oxford, 0X3 7LJ, UK
E-mail address of main author: [email protected]
A method for simulating the clinical effect of in-vivo diode perturbation in megavoltage photon beams was investigated using Eclipse (version 8.5) treatment planning system (TPS) and the Anisotropic Analytical Algorithm (version 8817). This is achieved by using fields with an overlapping multi leaf collimator (MLC) configuration. The monitor unit (MU) ratios between the three subfields were chosen to give a 5 and 10% reference perturbation on the beam central axis for reference field size at 5 cm depth. These diode perturbations were chosen as they are representative of the perturbation caused by in-vivo dosimetry diodes, as reported in the literature [1,2,3]. An example dose profile for a 10% diode perturbation is shown in Figure 1.
An initial treatment plan was created by splitting each original field into three separate subfields: a central open field and a left and right half field. A second plan was created by duplicating this plan but extending the two central MLCs for the left and right subfields by 0.5 cm. This simulated a diode with 1 cmf cross sectional area, which is representative of diode dimensions reported in the literature [2,3]. A schematic showing the MLC simulated diode is shown in Figure 2. The effect of the diode perturbation on a clinical target volume was calculated by comparing these two plans.
FIG 1. Dose profiles for the three subfields and total
513

Collimator and MLC& MLC tooth simulates the diode
\ / \
Subfield 1 Subfield 2 Subfield 3
FIG 2. MLC simulating a diode
Five clinical prostate plans were investigated. Each plan consisted of an anterior and two lateral oblique fields. Also, the attenuation of the diodes (EDP-15 and EDP-20, IBA Dosimetry, Belgium) used in this hospital was measured in solid water using a Matrixx ion chamber array. This was found to be 5 and 6% respectively for the two types of diodes used (in agreement with the manufacturer specification of 5-6% [4]).
It was shown that the use of diodes does reduce the dose to the tumour volume. In the simulation it is assumed that the diodes are in place for each field on every treatment fraction and so this gives a worse case scenario. For a simulated 10% diode perturbation, the dose reduction is 6-9% over sub-volumes 0.25-1 cm3. Thus a smaller 3D dose effect is seen compared to the reference diode perturbation. This was calculated by subtracting the dose volume histograms (DVH) from the two plans to give the effect of diode perturbation. These cold spot volumes will be used to calculate the reduction in tumour control probability (TCP).
REFERENCES
[1] SEN A, PARSUI E,I, MCNEELEY S,W, AYYANGAR MS and KM 1996 Quantitative assessment of Beam Perturbation caused by silicon diodes used for in vivo dosimetry Int J Radiation Oncology Biol Phys 36 205-211
[2] ALECU R, FELDMEIER JF, and ALECU M 1997 Dose perturbations due to in vivo dosimetry with diodes. Radiotherapy and Oncology 42 289-291
[3] ROBERTS R, and PHILP, A 2008 Correction factors for low perturbation in-vivo diodes used in the determination of entrance doses in high energy photon beams Medical Physics 35 25-31
[4] IN VIVO DOSIMETRY IBA Dosimetry http://www.iba-dosimetry.com/sites/default/files/ressources/InVivo.pdf
514
IDOS, Vienna, 9-12 November 2010 E2-CN-182, Paper No 125
Performance of a CVD diamond detector for dosimetry in radiotherapy photon beams
M. Pimpinella3, V. De Coste3, G. Conteb, A.S. Guerra3, F.P. Mangiacottf, A. Petruccf
3 Istituto Nazionale di Metrologia delle Radiazioni Ionizzanti, Agenzia nazionale per le nuove tecnologie, l'energia e lo sviluppo economico sostenibile (ENEA-INMRI), Roma, Italy
bDipartimento di Ingegneria Elettronica, Universita Roma Tre, Roma, Italy
cU.O. Fisica Sanitaria, Azienda Ospedaliera S. Filippo Neri, Roma, Italy
E-mail address of main author: maria.pimpineUa@enea. it
A prototype radiation detector was built starting from a single crystal CVD diamond produced by Element Six [1,2]. Particular care was addressed to minimize the energy dependence of the detector response by using appropriate materials. The diamond tile has size 3.0 mm x 3.0 mm and thickness 0.5 mm. Silver contacts, 200 nm thick, were thermally evaporated on both sides of the diamond tile and connected to the external cable. The detector was then encapsulated in a water-equivalent housing made of Rexolite® and an epoxy filling was used to minimize air in the space between housing and diamond. The detector was connected to a Keithley 6514 electrometer through a low noise cable. A Keithley high-voltage power supply was used for biasing the detector.
Firstly the detector was investigated in a Co-60 gamma beam with a dose rate of about 1.3 Gy min"1 to determine the best operating parameters. The detector response was studied as a function of the applied polarizing voltage, V, in the range from 2 V to 300 V for determining the optimum operating voltage. On the basis of this study a voltage of 50 V was selected for biasing the detector. At this voltage the leakage current is about 10 pA and the detector sensitivity 77 nC Gy"'.
Pre-irradiation effects, signal rise time and signal reproducibilty were also investigated in the Co-60 beam. The results show that a pre-irradiation with a dose value in the range from 1 Gy to 5 Gy is required to stabilize the detector response. After the pre-irradiation, at a dose rate of 1.3 Gy min"1 the detector signal reaches the 90% and 99% of its equilibrium value in about 8 s and 20 s, respectively. The rise time slightly decreases when the dose rate increases. When the current has been stabilized the signal noise is within 0.3%. Due to the quite long rise time of the signal, the absorbed dose values measured by the diamond detector can be underestimated. Thus to improve the measurements accuracy a procedure has been adopted in which the current values obtained soon after starting the detector irradiation are not accounted for in the dosimetric measurement. With this procedure a signal long term reproducibility of about 0.5% (1 SD) has been obtained in the Co-60 beam.
The detector was tested in 6 MV and 10 MV beams produced by a Varian DHX clinical accelerator. Measurements were performed in a water phantom at the reference depth of 10 cm. The short term stability, determined as relative standard deviation of the measured current, was about 0.3% and the measurement repeatability was 0.2%. The detector dose-rate dependence was investigated in the 6 MV photon beam varying the pulse repetition frequency of the accelerator from 100 MU min"1 to 600 MU min"1. The dose-rate range was from 0.8 Gy min"1 to 5.7 Gy min"1.
515

In this range, the detector response is linear within 1%. Indeed, using the Fowler's relationship of current to dose rate [3] to test the data linearity, the fitting parameters A and R resulted 0.993 and 1.000, respectively (Fig. 1).
Finally the diamond detector was used to perform measurements of the accelerator output as a function of the beam field size from the reference size 10 cm x 10 cm to 2 cm x 2 cm. The results normalized to the reference field size were compared with measurements performed with a pin point ionization chamber with a sensitive volume of 0.015 cm3. A general agreement of ± 1 % was found both at 6 MV and 10 MV (Fig. 2).
In conclusion the detector prototype exhibited high sensitivity, acceptable signal to noise ratio, and good measurement reproducibility. The signal rise time of several seconds can be a drawback for integrated charge measurements especially when low levels of absorbed dose are measured. On the other hand the results obtained in this work demonstrate the detector suitability for accurate dose rate measurements in radiotherapy photon beams.
8.0
6.0 < 4.0 hH
2.0
0.0 0 . 0 0 0 .02 0 . 0 4 0 . 0 6 0 . 0 8 0 . 1 0
D /Gy s 1
FIG. 1. 6 MV accelerator photon beam: diamond detector net current as a function of dose rate. 1.05
1.00 b O £ °-95 to = 0.90 & s
° 0.85
0.80
0.75 0 2 4 6 8 10 12
Side of square field /cm
FIG. 2. Output factor value as a function of the beam field size obtained with the diamond detector and with a PTW 31014 PinPoint ionization chamber• in 6 MV and 10 MV photon beams.
I-I0 = kDA
J i I i I i L
516
REFERENCES
[1] SYNTHETIC CVD Diamond products from Element Six, http://www.e6cvd.com. [2] CAPORALI, C., et al., "Study of a CVD diamond detector for absorbed dose measurement in
photon beam with small field size", IFMBE Proc. vol. 25/1, World Congress on Med. Phys. & Biomed. Eng., Munich, Germany (2009) pp 1016-1019.
[3] FOWLER, J.F., "Solid State Electrical Conductivity Dosimeters" in RADIATION DOSIMETRY, F.H. Attix and W.C, Roesch, Eds., New York: Academic Press (1966).
517


IDOS, Vienna, 9-12 November 2010 E2-CN-182, Paper No 125
Comparison of dose distributions for various applicators for treatment of rectal cancer
Kozlov O.V., Mukhina N.E.
N.N. Blokhin Cancer Research Center RAMS, Moscow, Russia
E-mail address of main author: [email protected]
In this report, we compare various methods of rectal cancer treatment using different implants for different target configurations. We represented the target as a sector of a circle with an angle of 120°, and each case has a different thickness of 5,10,15 and 20 mm. The tumor has a length of 5 cm. The tumor configuration is shown in fig.l. We calculated 16 treatment plans for various tumors using 4 different applicators for the MicroSelectron:
1. Simple proctostat with central channel. The applicator can be completed with various shields: 90, 180 and 270 degree.
2. MUPIT applicator set. 3. Miami Applicator Set. 4. Interstitial implant. Needles were separated as in the Paris dosimetry system.
Comparison was performed with the following parameters: Coverage index (CI), External volume index (EI), Relative Dose Homogeneity index (HI), Overdose volume index (OI)
The PLATO brachytherapy planning system was used for dose and DVH calculations. The dose calculation algorithm in PLATO is based on the recommendation of the American Associaciation of Psysicists in Medicine (AAPM) Task Group 43. Geometrical optimization was used for 1-3 applicators, CDS was used for the interstital applicator.
— - , - ,F
CI; E l C2;E2 C3;E3
C5.E5
FIG.L Tumor configuration relative to the applicator and reference points.
519
Also we determined the dose at 12 reference points - six of them were at 2 mm from the applicator and defined maximum observed dose in the rectum, and the other six were at a distance of 5 mm from the tumor and these defined the dose decrease over the tumor.
The reference points have clinical significance, but we do not have complete control over the tumor dose and the overdose of normal tissues; therefore we introduced dose-volume parameters.
Criteria for evaluating treatment plans were determined. 01, EI should be as low as possible, while HI should be as high as possible. The main parameter should be determined in accordance with the task.
Interstitial implants have the best parameters. The Miami Applicator Set is good for intracavitary brachytherapy, but if you want to control the overdose of the tumor, you should use simple proctostat with central channel.
REFERENCES
[1] POTTER R„ HAIE-MEDER C„ VAN LIMBERGEN E.et al., "Recommendations from gynaecological (GYN) GEC ESTRO working group (II): Concepts and terms in 3D image-based treatment planning in cervix cancer brachytherapy- 3D dose volume parameters and aspects of 3D image-based anatomy, radiation physics, radiobiology". Radiotherapy and Oncology, 2006, 78, P. 67-77.
[2] PAUL J.M., KOCH R.F., PHILIP P.C, AND KHAN F.R. Uniformity of dose distribution in interstitial implants. Endocuriether. Hypertherm. Oncol. 2: 107-118. 1986.
[3] MAJOR T, POLGAR C, FODOR J, SOMOGYI A, NEMETH G. Conformality and homogeneity of dose distributions in interstitial implants at idealized target volumes: A comparison between the Paris and dose-point optimized systems. Radiother Oncol 2002;62:103-11.
520

IDOS, Vienna, 9-12 November 2010 E2-CN-182, Paper No 125
Patient-specific quality assurance of whole pelvic intensity modulated radiotherapy (WP-IMRT) with hypofractionated simultaneous integrated
boost (SIB) to prostate for high risk prostate cancer
Moretti E., Malisan M.R., Crespi M., Foti C., Padovani R.
Department of Medical Physics - University Hospital "S. Maria della Misericordia" -Udine - Italy
E-mail address of main author: [email protected]
The current paradigm for the quality assurance (QA) program for IMRT includes QA of the treatment planning system TPS, QA of the delivery system and patient-specific QA. The aim of patient-specific QA is to verify the agreement between the dose distribution calculated by the TPS and the effectively delivered one. Because of complex fluence-modulation, each beam often includes several small irregular off-axis sub-fields. So the typical resulting sharp dose-gradients make the deviations between calculated and real dose critical, especially in areas close to organs at risk. Furthermore, each IMRT plan is strictly specific to the patient since the various segments configurations and monitor units (in static modality) or leaf position and leaf speed (in dynamic modality) may be significantly different, even if the shape of the targets and organs at risk are similar. These features impose a dosimetric verification of every IMRT plan'1 '.
In this study, we show the results of our patient-specific QA experience in the validation of whole pelvis IMRT (WP-IMRT) with hypofractionated simultaneous integrated boost (SIB) to prostate. For patients with localized prostate cancer (high-risk), IMRT-SIB plans were generated by employing the optimization module (Direct Step&Shoot) of MasterPlan TPS (Nucletron) for the treatment of the prostatic gland, seminal vesicles and pelvic lymph nodes, prescribing in 25 fractions doses of 65 Gy, 56.25 Gy, 50 Gy, respectively. The IMRT treatments consisted of 5 to 7 6-MV beams from a Varian Clinac 600C, linac fitted with a Milleniuml20 leaf collimator.
Our pre-treatment QA strategy relied on planar and point absolute dose measurements for each treatment beam. As a 2D-phantom, we used a 445-diode-array (MapCheck, Sun Nuclear). The measurement depth was 5 cm water-equivalent. For the corresponding dose calculation, we applied the IMRT plan to be verified to the CT-study of MapCheck device and extracted, field by field, the 2D-dose matrix to be compared to the experimental dose distribution obtained exposing the phantom. In order to increase the effective detector density and to map properly the wide fields of WP-IMRT, we merged successive exposures with regular shifts in MapCheck position. The average number of the sampled points was about 400 for every single field.
A NE2571 0.6 cm Farmer-type ionization chamber (IC) was used to assess the dose in a clinically meaningful point of a high-dose region in a PMMA-phantom, delivering all beams with their original gantry-angles. The measurement site corresponds roughly to the prostate in the patient-plan.
For the fluence verification method, we compared planned versus experimental maps by means of the gamma function analysis'"', adopting a dose-difference criterion of 3% and a distance to agreement (DTA) criterion of 3 mm. A plan was accepted if the percentage of points with gamma below one is higher than 90%. Concerning the IC, we accepted a maximum discrepancy of 5% between prediction value and measured one. The major uncertainty in the dose determination is correlated to the IC large collection-volume that can implies the lack of lateral electron equilibrium.
521

FIG 1. Example of the comparison between dose measured (image on the leftj by diode-matrix and dose predicted by TPS (central image) in a coronal plan, for the posterior field of a WP-IMRT plan. The image on the right shows the resulted match in terms of gamma index (red points have values above criteria).
For the first 10 patients, all the plans satisfied the acceptance criteria. Regarding the 2D-verification, the mean value of percentage of points having gamma below unity was observed better than 95%. A statistical analysis of gamma evaluation of the whole QA pre-treatment data was made. The results are useful to properly define confidence limits of the agreement between expected and experimental dose values based on our experience.
IC dose measurements agreed with the corresponding previsional values within the 5%-limit. The position of the measurement often resulted critical because of the chamber size and the peculiarity of IMRT dose distribution, but not such to impair the good results obtained, probably due to compensation effects when the total plan is delivered.
The outlined plan verification based on matrix plus IC measurements is actually time-consuming and may become the bottleneck for a more intensive clinical IMRT use. So, to curtail the workload of QA in IMRT, we are investigating the possibility of using the portal imager (based on a-Si technology) in combination with the independent dose prediction software EPIDose (Sun Nuclear), which gets the dose distribution from the fluence-image acquired by the EPID (Electronic Portal Imaging Device). The preliminary results are encouraging.
REFERENCES [1] ALBER M„ BROGGI S„ DE WAGTER C, et al., "Guidelines for the verification of IMRT\
Booklet ESTRO, Brussels, 2008. [2] LOW D. A., HARMS W.B., Mutic S. et al. "J technique for the quantitative evaluation of dose
distributions" Med. Phys. 25 : 656-661; 1998.
522
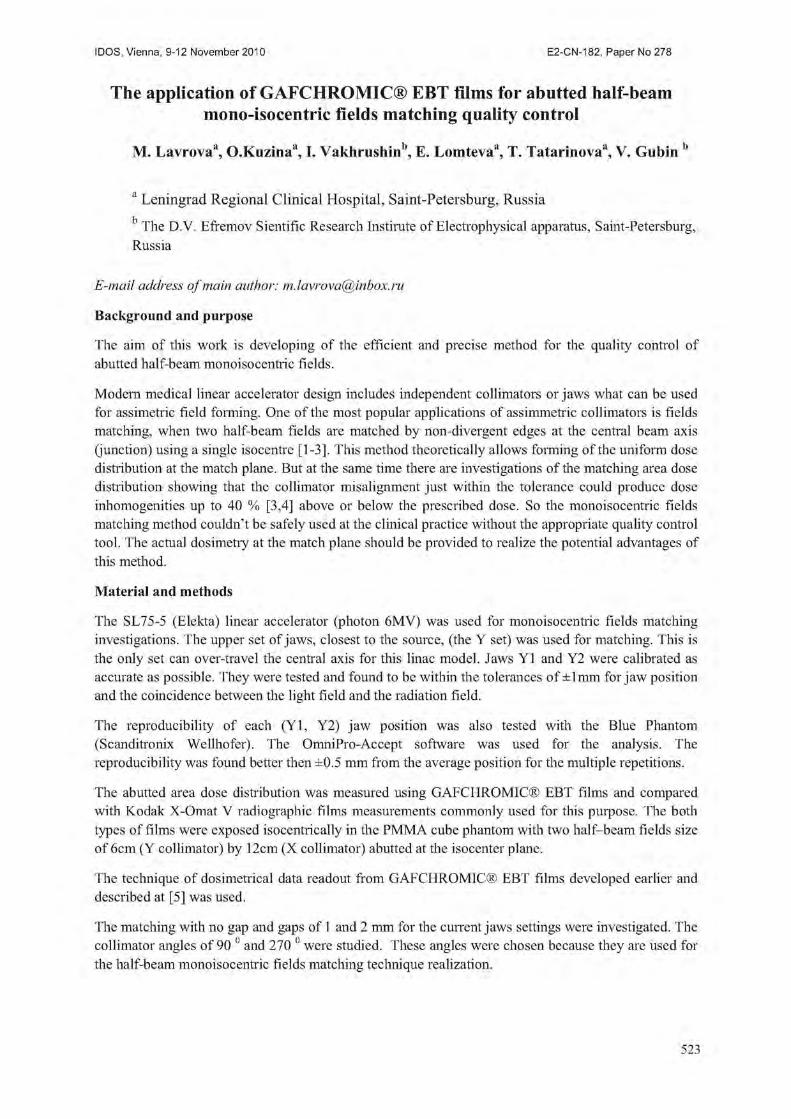
IDOS, Vienna, 9-12 November 2010 E2-CN-182, Paper No 125
The application of G AFCHROMIC® EBT films for abutted half-beam mono-isocentric fields matching quality control
M. Lavrovaa, O.Kuzinaa, I. Vakhrushin\ E. Lomtevaa, T. Tatarinovaa, V. Gubin b
a Leningrad Regional Clinical Hospital, Saint-Petersburg, Russia b The D,V. Efremov Sientifie Research Instirute of Electrophysical apparatus, Saint-Petersburg, Russia
E-mail address of main author: [email protected]
Background and purpose
The aim of this work is developing of the efficient and precise method for the quality control of abutted half-beam monoisocentric fields.
Modern medical linear accelerator design includes independent collimators or jaws what can be used for assimetric field forming. One of the most popular applications of assimmetric collimators is fields matching, when two half-beam fields are matched by non-divergent edges at the central beam axis (junction) using a single isocentre [1-3]. This method theoretically allows forming of the uniform dose distribution at the match plane. But at the same time there are investigations of the matching area dose distribution showing that the collimator misalignment just within the tolerance could produce dose inhomogenities up to 40 % [3,4] above or below the prescribed dose. So the monoisocentric fields matching method couldn't be safely used at the clinical practice without the appropriate quality control tool. The actual dosimetiy at the match plane should be provided to realize the potential advantages of this method.
Material and methods
The SL75-5 (Elekta) linear accelerator (photon 6MV) was used for monoisocentric fields matching investigations. The upper set of jaws, closest to the source, (the Y set) was used for matching. This is the only set can over-travel the central axis for this linac model. Jaws Y1 and Y2 were calibrated as accurate as possible. They were tested and found to be within the tolerances of i lmm for jaw position and the coincidence between the light field and the radiation field.
The reproducibility of each (Yl, Y2) jaw position was also tested with the Blue Phantom (Scanditronix Wellhofer). The OmniPro-Accept software was used for the analysis. The reproducibility was found better then ±0.5 mm from the average position for the multiple repetitions.
The abutted area dose distribution was measured using GAFCHROMIC® EBT films and compared with Kodak X-Omat V radiographic films measurements commonly used for this purpose. The both types of films were exposed isocentrically in the PMMA cube phantom with two halt-beam fields size of 6cm (Y collimator) by 12cm (X collimator) abutted at the isocenter plane.
The technique of dosimetrical data readout from GAFCHROMIC® EBT films developed earlier and described at [5] was used.
The matching with no gap and gaps of 1 and 2 mm for the current jaws settings were investigated. The collimator angles of 90 0 and 270 0 were studied. These angles were chosen because they are used for the half-beam monoisocentric fields matching technique realization.
523
Results and discussion
The relative dose distribution at the matching area for different gaps shown in Figure 1 for collimator angle of 90 0
G A F C H R O M I C E B T f i l m s f i l m s
FIG 1. Profiles of the two half beam split fields show the good correspondence between results for both used methods. The difference between measurements is inside of the method uncertainty range of ±4% [5], '
-5 0 5
distance, mm
The presented in Figure 1 matching case with no gap shows a collimator overlap, hence there is a cold spot at the matching area of about 96 %. The underdose and overdose not exceeding of 5 % were also discovered for all investigated cases. So the decision was made not to pass any additional correction due to the difference value was within the tolerance range of ±5 % for the prescribed dose.
Conclusion
The quality control routine of the abutted half-beam monoisocentric fields based on GAFCHROMIC® EBT films usage was developed and acceptance criteria were defined. Developed routine was included in the regular (monthly) quality control schedule. The developed measurment technique allows to ensure the appropriate dose distribution at the clinically important junction area.
REFERENCES
[1] ABDEL-HAKIM, K„ NISHIMURA, T„ TAKAI, M„ et al. Abutment region dosimetry for the monoisocentric three-beam split field technique in the head and neck region using asymmetrical collimators, Brit J Rad 2002, 75: 428-434.
[2] ROSENTHAL, DI., MCDONOUGH, J., KASSAEE, A., The effect of independent collimator misalignment on the dosimetiy of abutted half-beam blocked fields for the treatment of head and neck cancer, Radiother Oncol 1998, 49:273-278.
[3] SOI IN, JW., SUH, JH., POHAR, S., A method for delivering accurate and uniform radiation dosages to the head and neck with asymmetric collimators and a single isocenter, Int J Radiat Oncol Biol Phys 1995, 32:809-813.
[4] SAW, CB„ KRISHNA, KV., ENKE, CA., et al. Dosimetric evaluation of abutted fields using asymmetric collimators for treatment of head and neck, Int J Radiat Oncol Biol Phys 2000, 47:821-824.
[5] LAVROVA, M„ REBYAKOVA, V., TATARINOVA, T„ Practical aspects of radiochromic films Implementation for clinical QA, ICARO 2009, Vienna, Austria, 193-194.
524
IDOS, Vienna, 9-12 November 2010 E2-CN-182, Paper No 125
Comparison of doses on organs at risk for patients with cervix cancer for 2-D and 3-D methods of treatment planning
N. Muhina, O, Kozlov, O. Kravetz
N.N. Blokhin Cancer Research Center RAMS, Moscow, Russia
E-mail address of main author: [email protected]
In the research, which was made in our Cancer Center, there were compared dose distributions using X-rays images for 2D treatment planning and CT images for 3D. Obvious disadvantage of 2D treatment planning is that we do not have necessary data about target, so we can assume only on anatomical standards. Lack of data about doses in organs at risk can lead to wrong choice optimal dose distribution, which can lead to overdose bladder or rectum and have an influence on long-term effects.
Twenty one patients of cervix cancer have been examined. Prescription dose for brachytherapy was 7.5 Gy per fraction. Relative target covering with average volume 79 srn ' is noted. When we have compared 2D and 3D dose distributions, doses on organs at risk and analysis target coverage by 100 % and 80% isodose lines, firstly we have obtained treatment plans using X-rays and CT images for the same patient. In 2D treatment plan we prescribed dose at point A and in 3D at target volume. Then dwell-times in 3D treatment plan were replaced by dwell-times, which were calculated in 2D treatment plan. In such a way we obtained 3D reconstruction of 2D dose distribution. For each plan cumulative dose-volume histograms (DVH) were calculated and analyzed using D100, D90, VI00, Dlcc, D2cc parameters recommended by GYN GEC-ESTRO. For treatment plans which are based on CT images average values of D90 and V100 of IR-CTV were 106% h 91%, accordingly, average values of D2cc and Dlcc for bladder were 81% and 88%; for rectum 69% and 76%, accordingly. For treatment plans based on X-rays images with using 3D reconstruction the average values of D90 and V100 of IR-CTV were 85% h 74%, accordingly, average values of D2cc and Dlcc for bladder were 67% and 74%; for rectum 55% and 62% , accordingly. Average dose for bladder ICRU point was 53% and for rectum ICRU point was 51 %.
Dose at points of organs at risk, which are presented according to ICRU Report No.38 for 2D treatment planning, does not agree with real absorbed dose. It depends on possible deflection of Foley catheter in bladder and radiopaque catheter in rectum. 3D image brachytherapy planning allows to receive more accurate dose distribution in dependence on applicator geometry. 3D planning helps us to optimize dose distribution for realizing the maximal therapeutic doze to all target volume as much as possible not to exceed tolerance dose for organs at risk. For small target volume we can decrease doses on organs at risk.
REFERENCES
[1] POTTER R. et al. Recommendations from gynaecological (GYN) GEC ESTRQ working group (II): Concepts and terms in 3D image-based treatment planning in cervix cancer brachytherapy - 3D dose volume parameters and aspects of 3D image-based anatomy, radiation physics, radiobiology.// Radiotherapy&oncology, 2005, N° 3, 235-245.
2] LANG S., NULENS A., BRIOT E. and all. Intercomparison of treatment concepts for MR image assisted brachytherapy of cervical carcinoma based on GYN GEC-ESTRO recommendation. // Radiotherapy & oncology., 2006, JVa2, 185-193.
525


IDOS, Vienna, 9-12 November 2010 E2-CN-182, Paper No 125
Dosimetric evaluation of a 2-D ion chamber array for verification of big gradient areas in small segments of IMRT plans
Cordero-Ramirez A.
Radiotherapy Department, Hospital Mexico, San Jose, Costa Rica
E-mail address of author: [email protected]
A commercial system based on ion chamber detectors is evaluated by several dosimetric measurements, in order to use it as part of an IMRT QA program at Hospital Mexico.
In this study, the device 2D Array Seven29™ (PTW, Freiburg, Germany) was evaluated for clinical assessment of IMRT plans. This is a two dimensional detector array with ionization chambers uniformly arranged in a 27 x 27 matrix with an active area of 27 x 27 cm2. The 2D Array is calibrated together with the PTW Array Interface.
The detector's area consists of 729 air-filled ionization chambers that are covered with a 5 mm thick PMMA front plate that is a fixed part of the construction.
In figure 1 is shown the set up configuration for measurements with the Array. The SSD is set to 95 cm. According to manufacture recommendation 5 cm of RW3 are used in the back of the device for backscatter production and 4.5 cm are used in from of it for build up.
FIG 1. Away measurement set-up. Grey squares correspond to ion chamber positions.
The MLC configuration and the point selected as measurement positions, to be assessed are shown in Figure 2. The irradiation source is a Clinac iX with a Millenium-120 MLC (Varian Medical Systems, Palo Alto, CA), for a series of different square fields. The fields were applied in first irradiation open, and all of them with the same quadrant blocked by the MLC afterwards, using the MLC Shaper of Varian. For comparing with the 2D array measurements, a 3D PinPoint chamber of 0.016 cm" (PTW, Freiburg, Germany) was irradiated for the same configurations in a water phantom (SSD = 95 cm, 5 cm depth, gantry and collimator in 0°).
527

a) b)
FIG 2. Irradiated shapes obtainedfrom film, a) One of the open square fields (5, 4, 3, 2) shown the point of readings for the 2D Array and the chamber, b) Same field with a blocked quadrant keeping
the measurement points.
As shown in Figure 3a, there exists a good agreement between measurements. Although the normalized values present a difference of about 10 % between data from 2D Array and the chamber, this is good enough considering that both methods had a different distance to effective point of detectors (purposely added variation from the two methods in order to asses manufacture recommendations). So, this implies that if the set up for the array is defined at 95 cm SSD, the 100 cm distance is in the entrance plane of the air-fdled chamber volumes, while in the PinPoint chamber the 100 cm SSD was collocated in its central point for absolute measurement.
Additionally, the behaviour of fields of 4 x 4 cm2, 3 x 3 cm" is reasonably similar to the above description, not showing variations higher to 2 % of the expected values depicted in Figure 3 a.
1.100-,-
1.000 -J-
0 a 0.900 T-73
1 0.800 -r o Z 0.700 j-
0.600 j -
0
FIG 3. Graphic comparison of data obtainedfrom 21) Array and PinPoint chamber. Data for each field were normalized to the same field size open, a) Graph for 5x5 cm2 open/blockedfields, b)
Graph for 2x2 cm2 open/blocked fields. In Figure 3b, is possible to see that reducing the field size, the PinPoint chamber keeps its response. On the other hand, the response of the 2D Array takes not expected values especially in the points out of the centre. The fact that the PinPoint has a very small volume gives it a better resolution in very small fields as is known, but the bigger volume size of the chambers in the array (0.125 cc) added to its fixed position between centres (1 cm), restricts its detection capabilities producing such unexpected values in big gradient areas.
Field 5 x 5 cm
Open Field Pin Point Chamber
Open Field 2D Array
Blocked Reld Pin Point Chamber
Blocked field 2DArray
1 2 Measurement Point
Field 2 x 2 cm
Open Reld Rn Point Qi amber •Open Reld 2D Array Blocked Reld Rn Point Chamber Blocked Reld 2D Array
Measurement Point
528
Finally, the evaluated system herein shows a good performance and similar values than novel methods applied in clinic. Consequently, this system might be a good tool to be incorporated in a patient dependent Quality Assurance program even for absolute dose, taking in account the issues regarding to position of detectors as discussed above.
REFERENCES
[1 ] SPEZI E., ANGELINI A. L„ ROMANI F. and FERRI A. Characterization of a 2D ion chamber array for the verification of radiotherapy treatments. Phys. Med. Biol. 50, pp 3361-3373. (2005).
[2] POPPE B„ BLECHSCHMIDT A., DJOUGUELA A., KOLLHOFF R„ RUBACH A., WILLBORN K. and HARDER D. Two-dimensional ionization chamber arrays for IMRT plan verification. Med. Phys. 33 (4), pp 1005-1011, (2006).
[3] VAN ESCH A„ CLERMONT C„ DEVILLERS M„ LORI M. and HUYSKENS D. On-line quality assurance of rotational radiotherapy treatment delivery by means of a 2D ion chamber array and the Octavius phantom. Med. Phys. 34 (10), pp 3825-3838, (2007)
529

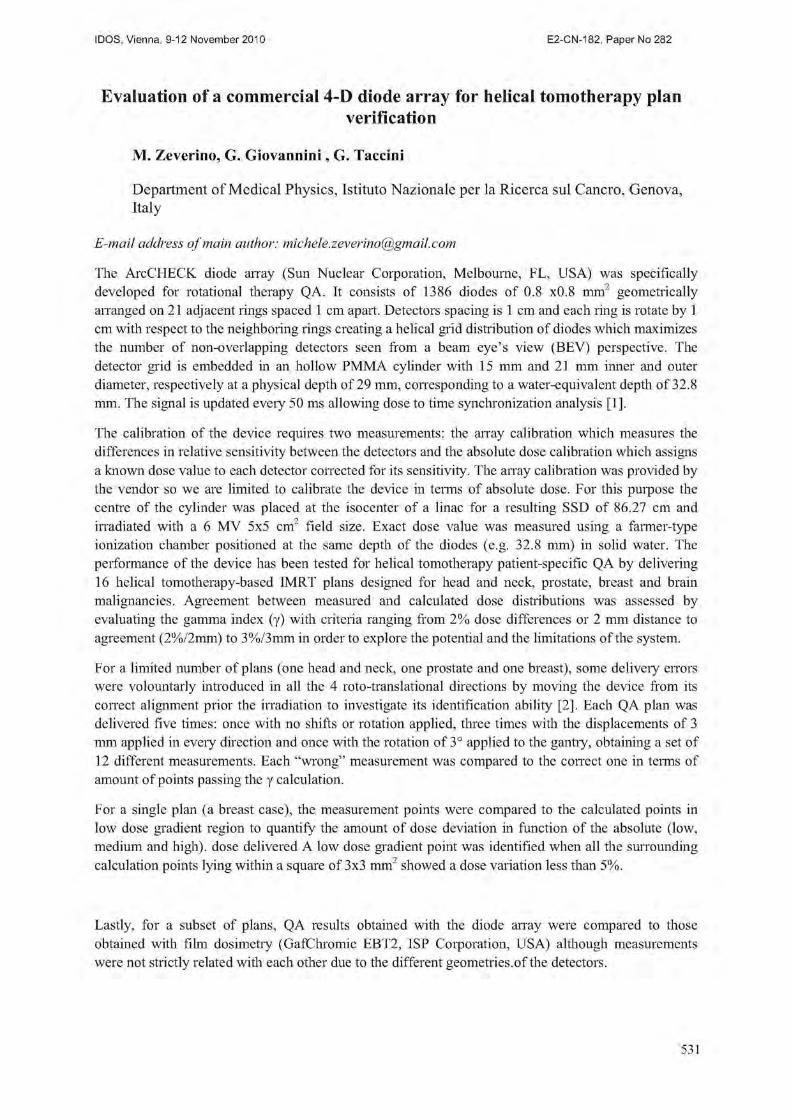
IDOS, Vienna, 9-12 November 2010 E2-CN-182, Paper No 125
Evaluation of a commercial 4-1) diode array for helical tomotherapy plan verification
M. Zeverino, G, Giovannini, G. Taccini
Department of Medical Physics, Istituto Nazionale per la Ricerca sul Cancro, Genova, Italy
E-mail address of main author: [email protected]
The AreCHECK diode array (Sun Nuclear Corporation, Melbourne, FL, USA) was specifically developed for rotational therapy QA. It consists of 1386 diodes of 0.8 x0.8 mm2 geometrically arranged on 21 adjacent rings spaced 1 cm apart. Detectors spacing is 1 cm and each ring is rotate by 1 cm with respect to the neighboring rings creating a helical grid distribution of diodes which maximizes the number of non-overlapping detectors seen from a beam eye's view (BEV) perspective. The detector grid is embedded in an hollow PMMA cylinder with 15 mm and 21 mm inner and outer diameter, respectively at a physical depth of 29 mm, corresponding to a water-equivalent depth of 32.8 mm. The signal is updated every 50 ms allowing dose to time synchronization analysis [1],
The calibration of the device requires two measurements: the array calibration which measures the differences in relative sensitivity between the detectors and the absolute dose calibration which assigns a known dose value to each detector corrected for its sensitivity. The array calibration was provided by the vendor so we are limited to calibrate the device in terms of absolute dose. For this purpose the centre of the cylinder was placed at the isocenter of a linac for a resulting SSD of 86.27 cm and irradiated with a 6 MV 5x5 cm" field size. Exact dose value was measured using a farmer-type ionization chamber positioned at the same depth of the diodes (e.g. 32.8 mm) in solid water. The performance of the device has been tested for helical tomotherapy patient-specific QA by delivering 16 helical tomotherapy-based IMRT plans designed for head and neck, prostate, breast and brain malignancies. Agreement between measured and calculated dose distributions was assessed by evaluating the gamma index (y) with criteria ranging from 2% dose differences or 2 mm distance to agreement (2%/2mm) to 3%/3mm in order to explore the potential and the limitations of the system.
For a limited number of plans (one head and neck, one prostate and one breast), some delivery errors were volountarly introduced in all the 4 roto-translational directions by moving the device from its correct alignment prior the irradiation to investigate its identification ability [2], Each QA plan was delivered five times: once with no shifts or rotation applied, three times with the displacements of 3 mm applied in every direction and once with the rotation of 3° applied to the gantry, obtaining a set of 12 different measurements. Each "wrong" measurement was compared to the correct one in terms of amount of points passing the y calculation.
For a single plan (a breast case), the measurement points were compared to the calculated points in low dose gradient region to quantify the amount of dose deviation in function of the absolute (low, medium and high), dose delivered A low dose gradient point was identified when all the surrounding calculation points lying within a square of 3x3 mm2 showed a dose variation less than 5%.
Lastly, for a subset of plans, QA results obtained with the diode array were compared to those obtained with film dosimetry (GafChromic EBT2, ISP Corporation, USA) although measurements were not strictly related with each other due to the different geometries, of the detectors.
531
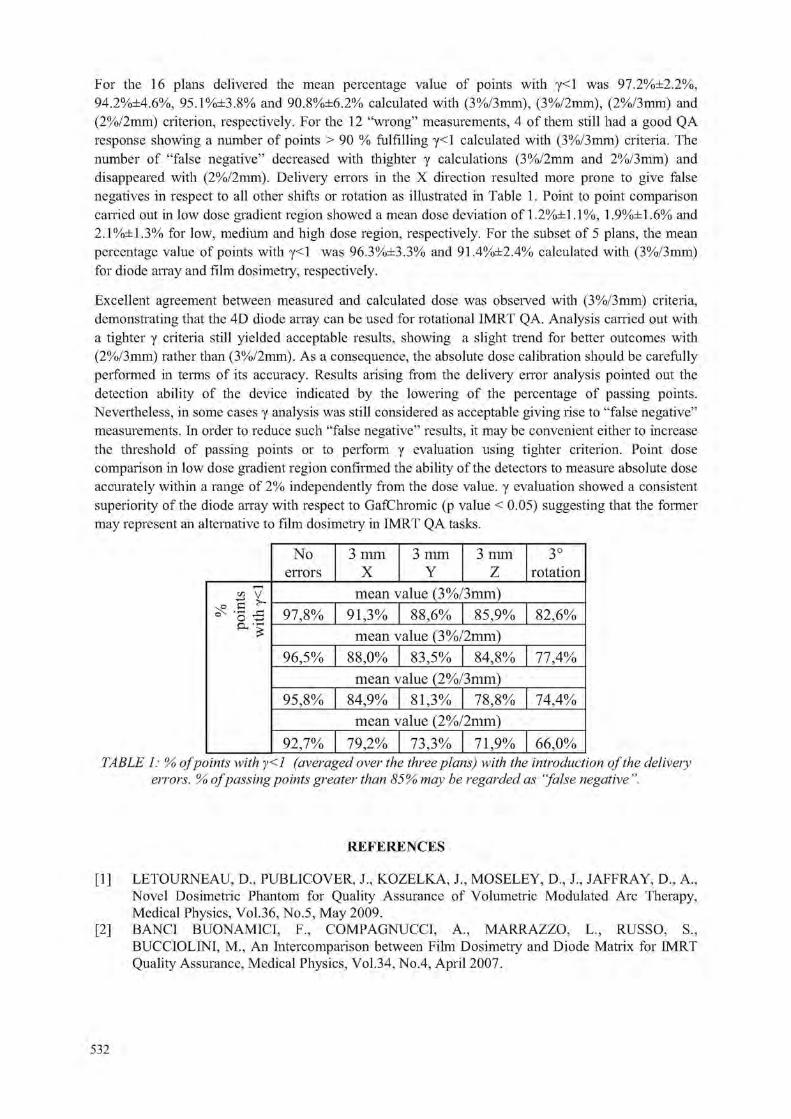
For the 16 plans delivered the mean percentage value of points with y<l was 97.2%±2.2%, 94.2%±4.6%, 95.1%±3.8% and 90.8%±6.2% calculated with (3%/3mm), (3%/2mm), (2%/3mm) and (2%/2mm) criterion, respectively. For the 12 "wrong" measurements, 4 of them still had a good QA response showing a number of points > 90 % fulfilling y<l calculated with (3%/3mm) criteria. The number of "false negative" decreased with thighter y calculations (3%/2mm and 2%/3mm) and disappeared with (2%/2mm). Delivery errors in the X direction resulted more prone to give false negatives in respect to all other shifts or rotation as illustrated in Table 1. Point to point comparison carried out in low dose gradient region showed a mean dose deviation of 1.2%±1.1%, 1.9%±1.6% and 2.1%±i,3% for low, medium and high dose region, respectively. For the subset of 5 plans, the mean percentage value of points with y<l was 96.3%±3.3% and 91.4%±2.4% calculated with (3%/3mm) for diode array and film dosimetry, respectively.
Excellent agreement between measured and calculated dose was observed with (3%/3mm) criteria, demonstrating that the 4D diode array can be used for rotational IMRT QA. Analysis carried out with a tighter y criteria still yielded acceptable results, showing a slight trend for better outcomes with (2%/3mm) rather than (3%/2mm). As a consequence, the absolute dose calibration should be carefully performed in terms of its accuracy. Results arising from the delivery error analysis pointed out the detection ability of the device indicated by the lowering of the percentage of passing points. Nevertheless, in some cases y analysis was still considered as acceptable giving rise to "false negative" measurements. In order to reduce such "false negative" results, it may be convenient either to increase the threshold of passing points or to perform y evaluation using tighter criterion. Point dose comparison in low dose gradient region confirmed the ability of the detectors to measure absolute dose accurately within a range of 2% independently from the dose value, y evaluation showed a consistent superiority of the diode array with respect to GafCbromic (p value < 0.05) suggesting that the former may represent an alternative to film dosimetry in IMRT QA tasks.
No 3 mm 3 mm 3 mm 3° errors X Y Z rotation
^ f J ^ o 6
mean value (3%/3mm) ^ f J ^ o 6 97,8% 91,3% 88,6% 85,9% 82,6%
mean value (3% 2mm) 96,5% 88,0% 83,5% 84,8% 77,4%
mean value (2%/3mm) 95,8% 84,9% 81,3% 78,8% 74,4%
mean value (2%/2mm) 92,7% 79,2% 73,3% 71,9% 66,0%
TABLE 1: % ofpoints with y< / (averaged over the three plans) with the introduction of the delivery errors. % of passing points greater than 85% may be regarded as "false negative".
REFERENCES
[1] LETOURNEAU, D„ PUBLICOVER, J., KOZELKA, J., MOSELEY, D„ J., JAFFRAY, D„ A., Novel Dosimetric Phantom for Quality Assurance of Volumetric Modulated Arc Therapy, Medical Physics, Vol.36, No.5, May 2009.
[2] BANCI BUONAMICI, F„ COMPAGNUCCI, A., MARRAZZO, L„ RUSSO, S„ BUCCIOLINI, M., An Intercomparison between Film Dosimetry and Diode Matrix for IMRT Quality Assurance, Medical Physics, Vol.34, No.4, April 2007.
532

IDOS, Vienna, 9-12 November 2010 E2-CN-182, Paper No 125
The comparison of different control charts to analyze patient specific IMRT QA
T. Sanghangthuma,b, T. Pawlickf , S. Suriyapeeb, S, Srisatit8
department of Nuclear Technology, Faculty of Engineering, Chulalongkorn University, Thailand
^Department of Radiology, Faculty of Medicine, Chulalongkorn University, Thailand c Department of Radiation Oncology, University of California, San Diego, USA
E-mail address of main author: [email protected]
Quality assurance (QA) process has variation, most variation is natural error that can not be reduced but some variation is due to special causes that can be removed. Control chart is a statistical tool used to observe process stability over time by separating systematic error from random error. Recently, it has been applied as a modern QA tool to verify patient-specific intensity modulated radiotherapy (IMRT) QA [1,2]. However, the differenct types of charts may detect different systematic errors, so the purpose of this study is to compare advantages, disadvantage and the efficiency of error detection by X/MR, X-bar/R, and X-bar/S charts for the nasopharyngeal carcinoma IMRT plans verification.
The IMRT dose delivery process of 285 composite plans was verified with Mapcheck 2D diode array during March, 2007 to March, 2010. All plans used DMLC-IMRT technique with 6 MV photon beams from Varian Clinac 21 or 23EX linear accelerators. The SAD technique with 5 cm depth buildup and zero degree gantry angle were set. The radiation dose between MapCheck measurement and Eclipse treatment planning calculation were compared. The dose differences at only the center point were used to construct X/MR charts, while five points of dose differences at center and 3 cm displaced on radial and lateral planes (except in high dose gradient point) were selected to create X-bar/R, and X-bar/S charts. The first fifty points were employed to calculate the center line, upper control limit (UCL), and lower control limit (LCL) of IMRT QA results, the formula of each chart is shown as follow:
for individual (X) chart; UCL r = X + i M R . d2
CLX = x , LCLX = X - 3 m
d2 0 )
for moving range (MR) chart; UCL m = D4MR, CLm , =MR, LCLm = D3MR (2)
for average ( X) chart (with R); UCL- = X + A2R, Ch = X, LCL- = X-A2R (3) for range ( R) chart; UCL- = D4R. c h = R, LCL-R = D3R (4)
for average (.V ) chart (with S); UCL- •• = X + A}S, = x . LCh = X-A3S (5)
for standard deviation (S) chart; UCLS = B4S. CLS = s, LCLS --= B3S (6) The constants are based on n value, where n is the number of subgroup size. In this case, n=2 for X/MR, so da, D3, and D4are 1.128, 0, and 3.267, respectively but n=5 for X/R and XIS charts, so A;. A3, B3, B4, D3, and D4 are 0.577, 1.427, 0, 2.089, 0, and 2.114, respectively [3], The results of those charts for Nasopharyngeal Carcinoma IMRT QA are shown in FIG 1.
533

I n d i v i d u a l ; \ i C h a r t
A v e r a g e (X-ba r ) C h a r t f r o m R C h a r t
M o v i n g R a n g e (MR) C h a r t
( [~)) P l a n > u m b c r
R a n g e (R> C h a r t
FIG. 1. The control charts of patient specific Nasopharyngeal Carcinoma IA A for (a) X chart, (b) MR chart, (c) X-bar chart, and (d) R chart
The results show the systematic errors present in the charts due to non-levelling of MapCheck setup (points 74, 77, 78, 279), SSD setup error (point 116-118), wrong case comparison (point 26), incomplete combined field (point 80), using wrong energy calibration factor (points 161-163), MLC interlock (point 57), and plan complexity. X/MR charts are easy to use and less time consuming to prepare the charts because it uses only one point to analyze. However, there are few points out of control but X/MR charts can not detect (e.g. point 279) and also there are some points that in control but X/MR charts show out of control (e.g. point 75). Moreover, range and SD can present the dispersion in each plan while MR just show the variation in only consecutive plans. So, X-bar/R and X-bar/S charts are more accurate than X/MR charts. When we compare between X-bar/R and X-bar/S charts, almost all of both charts illustrate the same result. However, if subgroup size is more than 10, X-bar/S charts may be more accurate because R chart use only two points of dose difference (the absolute value between max. dose difference and min. dose difference) but S chart uses all points.
The control charts are a very new and powerful tool for quality control of IMRT QA process that can effectively separate the systematic error from random error immediately. X-bar/S charts are the best chart to analyze the patient specific IMRT QA.
ACKNOWLEDGEMENT
This present work was financially supported by the IAEA's Doctoral Coordinated Research Project on "QA of the Physical Aspects of Advanced Technology in Radiotherapy" (E2.40.15).
REFERENCES
[1] PAWLICKI T„ YOO S„ COURT C, E„ et al. Moving from IMRT QA measurements toward independent computer calculation using control chart. Radiothe&Oncol, 2008, 89(3):330-7.
[2] BREEN S. L„ MOSELEY D. J., ZHANG B„ SHARPE M. B. Statistical process control for IMRT dosimetric verification. Medical Physics, 2008; 35, 4417-4425.
[3] WHEELER DJ, CHAMBERS DS. Understanding Statistical Process Control. Knoxville: SPC Press: 1992.
534
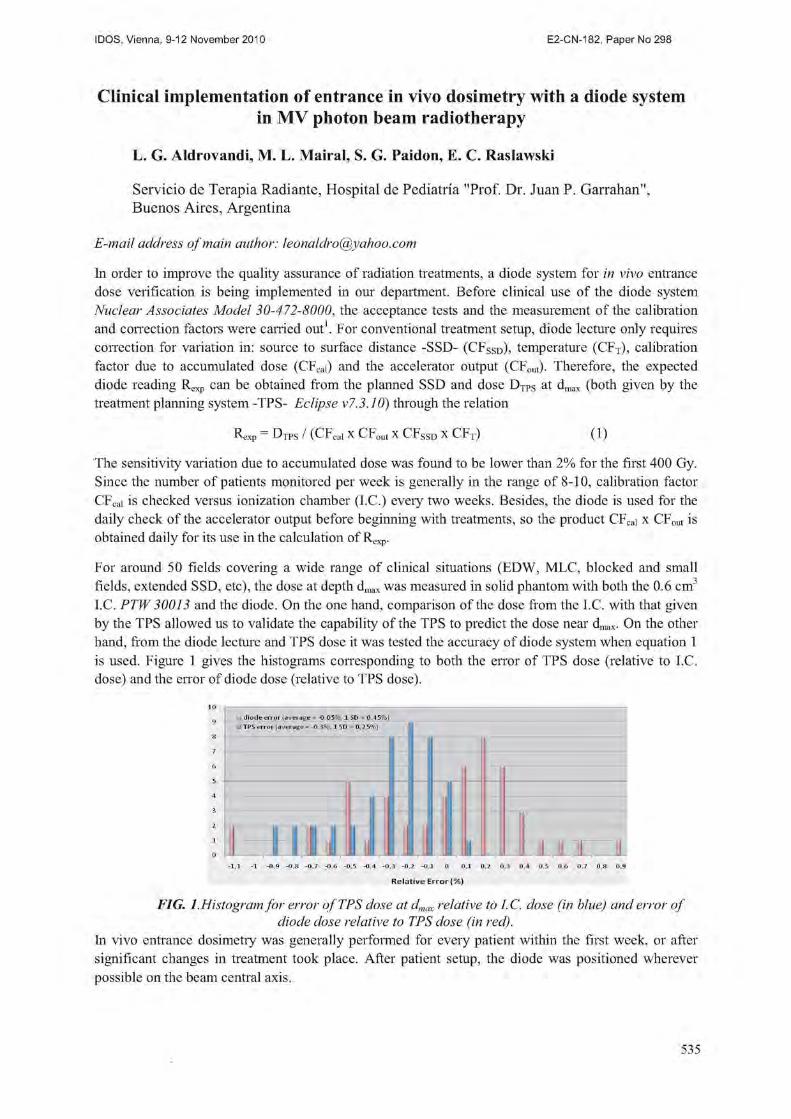
IDOS, Vienna, 9-12 November 2010 E2-CN-182, Paper No 125
Clinical implementation of entrance in vivo dosimetry with a diode system in MV photon beam radiotherapy
L, G. Aldrovandi, M. L. Mairal, S. G. Paidon, E, C. Raslawski
Servicio de Terapia Radiante, Hospital de Pediatria "Prof. Dr. Juan P. Garrahan", Buenos Aires, Argentina
E-mail address of main author: [email protected]
In order to improve the quality assurance of radiation treatments, a diode system for in vivo entrance dose verification is being implemented in our department. Before clinical use of the diode system Nuclear Associates Model 30-472-8000, the acceptance tests and the measurement of the calibration and correction factors were carried out1. For conventional treatment setup, diode lecture only requires correction for variation in: source to surface distance -SSD- (CFSSD), temperature (CFT), calibration factor due to accumulated dose (CFcai) and the accelerator output (CFout). Therefore, the expected diode reading Rexp can be obtained from the planned SSD and dose DTPS at dmax (both given by the treatment planning system -TPS- Eclipse v7.3.10) through the relation
Rexp = [ > , P S / ( C F c a i X C F o u t X C F S S D X C F T ) ( 1 )
The sensitivity variation due to accumulated dose was found to be lower than 2% for the first 400 Gy. Since the number of patients monitored per week is generally in the range of 8-10, calibration factor CFcai is checked versus ionization chamber (I.C.) every two weeks. Besides, the diode is used for the daily check of the accelerator output before beginning with treatments, so the product CFcai x CFout is obtained daily for its use in the calculation of Rexp.
For around 50 fields covering a wide range of clinical situations (EDW, MLC, blocked and small fields, extended SSD, etc), the dose at depth dinax was measured in solid phantom with both the 0.6 cm3
I.C. PTW 30013 and the diode. On the one hand, comparison of the dose from the I.C. with that given by the TPS allowed us to validate the capability of the TPS to predict the dose near dinax. On the other hand, from the diode lecture and TPS dose it was tested the accuracy of diode system when equation 1 is used. Figure 1 gives the histograms corresponding to both the error of TPS dose (relative to I.C. dose) and the error of diode dose (relative to TPS dose).
i diode error {average = -0.0596,1 SD = 0.45%) u TPS error (average = -0.396,1 SD = 0.25%)
— —
- h h - h h i D 11 II U -1,1 -1 -0,9 -O 8 -0,7 -0,6 -0,5 -0,4 -0,3 -0,2 -0,1 0 0,1 0,2 0,3
Relat ive Error {%)
0,4 0,5 0,6 0,7 0,8 0,9
FIG. 1.Histogram for error of TPS dose at dmax relative to I.C. dose (in blue) and error of diode dose relative to TPS dose (in red).
In vivo entrance dosimetry was generally performed for every patient within the first week, or after significant changes in treatment took place. After patient setup, the diode was positioned wherever possible on the beam central axis.
535

The flowchart, guiding the actions to be undertaken after an in vivo entrance dose measurement, is given in figure 2. As in the majority of the radiotherapy centers2, we have chosen a 5% tolerance level, which coincides with the action level.
FIG. 2.Flowchart with the actions to be taken after the measurement of entrance dose
Figure 3 is a summary of the results of the in vivo measurements carried out since the implementation of the diode system. It shows a histogram for the frequency distribution of relative error AR% = 100*(Rdiode-Rexp)/Rexp- For the first 80 fields measured, only two lectures were outside the tolerance limits. In one case (with AR% = 8.2%), in vivo dosimetry allow us to detect a data transfer error. In the other case (with AR% = -7.3%), diode lecture fell within ±5% when it was repeated at the next session.
lecture eii o i A R % ( a v e r a g e = 0 28°o . 1 S D =
1 It 1 1 ~ t echire Reiative "Enoj3(%) ^
FIG. 3. Histogram for error of the diode reading Rdiode relative to the expected Rexp.
REFERENCES [1] L. G. Aldrovandi, M. L. Mairal, S. G. Paidon and E. C. Raslawski. Response characterization of
a diode system for in vivo dosimetry during megavoltage photon beam therapy. In preparation [2] BROGGI, N. JORNET, M. RIBAS, D. I. THWAITES. Practical Guidelines for the
Implementation of in vivo Dosimetry with Diodes in External radiotherapy with Photon Beams (Entrance Dose). ESTRO Physics for Clinical Radiotherapy Booklet No. 5 (2001).
536
IDOS, Vienna, 9-12 November 2010 E2-CN-182, Paper No 125
Response characterization of a diode system for in vivo dosimetry during megavoltage photon beam radiotherapy
L, G. Aldrovandi, M. L. Mairal, S. G. Paidon, E, C. Raslawski
Servicio de Terapia Radiante, Hospital de Pediatria "Prof. Dr. Juan P. Garrahan", Buenos Aires, Argentina
E-mail address of main author: [email protected]
The response of a diode system to be used for in vivo dosimetry was investigated. The study included short-term reproducibility, dose linearity, sensitivity variation with source-to-surface distance (SSD), field size, temperature, beam incident direction and the presence of wedge, multi-leaf collimator (MLC), blocks and block tray. The analysis allows us to obtain the entrance dose in a phantom/patient in terms of the diode reading and the correction factors.
The Radiation Therapy Department at the "Prof. Dr. Juan P. Garrahan" Children's Hospital has a linear accelerator Varian CJinac 23 EX-S, which operates at a single Rx energy of nominal 6 MV. The dosimetry system consists on n-type hemispherical diodes Nuclear Associates Model 30-472-8000 and an electrometer Nuclear Associates VeriDose Model 37-705.
Prior to the measurements leading to the calibration and correction factors, simple acceptance tests of the new diode recommended by the AAPM Task Group 62 were done1. These tests consist in evaluating: post irradiation signal drift, short-term reproducibility, dependence on average dose-rate and dose linearity.
We define the diode calibration factor CFcai as the ratio of the dose to water Dw at dmax to the diode reading Rdiode, both obtained under the same reference conditions (100 cm SSD and 10x10 cm2 field size)1"3. Dw was determined before beginning diode calibration, with a 0.6 cm ionization chamber (I.C,) PTW30013 following the IAEA TRS-398 protocol. The calibration factor was obtained with the diode placed on the surface of a solid phantom PTW SP34 and measuring simultaneously with an I.C. (at depth dmax) to accounts for unexpected Clinac output fluctuations. The correction factor CFX, accounting for a change in parameter X from calibration condition, was determined through the ratio between the reading of an I.C. (at depth dinax) and the reading of the diode for an irradiation situation with changed X parameter, relative to the same ratio for the reference situation2'3. It was assumed that the correction factors are independent of each other.
For variations in SSD from 80 cm to 130 cm, SSD correction factor CFSSD increased from 0.92 to 1.02. This confirms the expected over response of the diode with lower SSD due to higher dose per pulse and the presence of more contamination electrons and head scattered low energy photons. As shown in fig. 1, a second order polynomial was used to model CFSSD. The observed variation in sensitivity due to change in field size (evaluated for sizes ranging from 5x5 enf to 35x35 cm2) and the presence of dynamic wedge, multi-leaf collimator (MLC), blocks and block tray, was always within ±0.5%. Therefore, no correction factor was considered necessary in these cases. No correction was needed for angular variation of the beam incidence, since the decrease in sensitivity respect to normal incidence (gantry at 0°) was found to be smaller than 1% for gantry angles in the interval ±30°.
537

FIG. 1. SSD correction factor and the result of a second order polynomial fitting
Concerning sensitivity variation with temperature (SVWT), it was measured with the diode at thermal equilibrium with a water phantom (fig. 2a) which superficial temperature varied from 21°C (calibration temperature) to 34°C. SVWT was also measured as a function of time after the diode was placed in contact with a water phantom whose internal and superficial temperatures were 37°C- and 31.5°C, respectively. Figure 2b shows this variation in two cases: when the diode was positioned directly (solid line) and after keeping it in hand for 1-2 minutes (dotted line).
FIG.2. SVWT vs.: a) temperature of the diode and b) time after diode in contact a phantom
Then, it was decided that diode must be termalized in the hand for 2 minutes before every use and the diode lecture must be corrected with a temperature factor C F T = 0 . 9 6
Based on the results given above, the dose D in a phantom or a patient, at depth dinax, can be obtained from the diode reading Rdiode through the relation
D = Rdiode x CFcai x C F s s d x C F t (1 )
REFERENCES
[1] AAPM REPORT NO.87 Diode in vivo dosimetiy for patients receiving external beam radiation therapy. Report of Task Group 62 of the Radiation Therapy Committee (2005).
[2] J. VAN DAM and G. MARINELLO. Methods for in vivo Dosimetiy in External Radiotherapy. ESTRO Booklet on Physics for Clinical Radiotherapy No. 1. (1994).
[3] BROGGI, N. JORNET, M. RIB AS, D. I. THWAITES. Practical Guidelines for the Implementation of in vivo Dosimetiy with Diodes in External radiotherapy with Photon Beams (Entrance Dose). ESTRO Physics for Clinical Radiotherapy Booklet No. 5 (2001).
538

IDOS, Vienna, 9-12 November 2010 E2-CN-182, Paper No 125
Experience on total plan dose verification in step & shoot and sliding window IMRT
D. Venenciaa, Garrigoa, Descampsa, Vieira b, Mainardic, Pipman'1
a Instituto de Radioterapia, Cordoba, Argentina; b Pontificia Universidad Catolica de Chile, Chile;c Facultad de Matematica, Astronomia y Fisica, Argentina; dLong Island Jewish Medical Center, USA
E-mail address of main author: [email protected]
Introduction Intensity Modulation Radiation Therapy (IMRT) uses radiation beams with non-uniform intensity in order to obtain dose distributions with optimal sparing of organs at risk. The IMRT total plan quality control includes comparison between measured and calculated doses [1], IMRT quality control should be accurate and reproducible in a fast and easy way. Small sized ionization chambers are recommended for total plan dose verification [2]. However, the smaller the ionization chamber, the smaller the signal, the higher the relative contribution of noise sources such as leakage and the longer the stabilization time required [3]. On the other hand, Farmer type ionization chambers have better signal to noise ratios, but their larger size can lead to problems related to a loss of electronic equilibrium and spatial resolution.
The aim of this study is to show our experience during the last 8 years, in the comparison of calculated versus measured doses using a Farmer type ion chamber for 1800 dynamic and step&shoot IMRT plans. For some of the step&shoot IMRT plans the influence of the detector size was studied comparing calculated versus measured doses using PinPoint and Farmer type ion chambers.
Materials and method
A linear accelerator Varian Clinac 21 EX, with 120-leaf MLC was used for dynamic IMRT and a Siemens Primus, with 82-leaf MLC was used for step&shoot IMRT. The photon energy employed was 6MV. Dynamic IMRT plans were done using Cadplan v6.2.7 and Eclipse v7.3/v8.1 treatment planning system. Step&shoot IMRT plans were done using Konrad v2.2 TPS with a beamlet size of 1 x 1 cnr A total number of 1400 plans were done using dynamic IMRT and 400 plans using step&shoot IMRT modality. For total plan dose verification the fields were exported to a square solid water phantom used for measurement. The position of the isocenter in the verification plan was selected to have a uniform dose within the volume representing the ion chamber. The mean dose for a volume which represents the ion chamber was obtained. Measurements were done using a PTW30001 (0.6cm3) ion chamber connected to a CNMC206 electrometer for dynamic IMRT verifications and a NE2571 (0.6cm3) ion chamber connected to a PTW UNIDOS electrometer for step&shoot IMRT verifications. A group of 45 step&shoot IMRT plans were selected and following the same verification procedure, calculations and measurements were repeated using a PTW TN31013 PinPoint (0.015cm3) ion chamber connected to a PTW UNIDOS electrometer.
539

Results
The mean variation between calculated and measured dose for dynamic IMRT plans using a Farmer type ion chamber was -0.5±1.4% [-4.5,4.9]; 98.8% and 94% of the data were within 4% and 3% respectively. The mean variation between calculated and measured dose for step&shoot IMRT plans using a Farmer type ion chamber was -0.8±1.2% [-4.6,3.8]; 99.8% and 94.3% of the data were within 4% and 3% respectively.
For the group of 45 step&shoot IMRT plans the mean variation between calculated and measured doses was -0.51±0.61% [-1.54,0.88] for the Fanner type ion chamber and 0.02±0.93% [-1.25,2.47] for the PinPoint ion chamber.
Conclusions
The agreement between calculated and measured dose for total plan dose verification was within clinically accepted accuracy for both IMRT modalities. A Farmer type ion chamber located in a uniform dose region could be used for total plan dose verification without influence of the IMRT technique used.
For the group of 45 step&shoot IMRT plans the results shows that either of these detectors can be used without affecting the acceptability criteria of clinical cases. The chamber size does not influence the dose variation. The low signal to noise ratio of the PinPoint chamber complicates its use and a larger spread between calculated and measured doses was observed. For IMRT plans with large uniform dose regions the Farmer type ion chamber seems to be more practical for patient specific dosimetry QA of IMRT treatments even if its volume is comparable to the beamlet size.
The under estimation of the measured dose is shown in both IMRT technique and it could be attribute to a lack of handling of the treatment couch attenuation in the TPS but should be analyzed. Further statistical analyses of the data are necessary.
REFERENCES
[1] EZZELL, et.al. "Guidance document on delivery, treatment planning, and clinical implementation of IMRT: Report of the IMRT subcommittee of the AAPM radiation therapy committee", MP 30(8), 2003.
[2] MARKUS, et.al. "Guidelines for verification of IMRT", ESTRO Booklet N°9, 2008. [3] LEYBOVICH, et.al. "Comparison of ionization chambers of various volumes for IMRT
absolute dose verification", Medical Physics 30(2), 2003.
540
IDOS, Vienna, 9-12 November 2010 E2-CN-182, Paper No 125
Assessment of the dosimetry effect of the embolization material in stereotactic radiosurgery
O.O. Galvan de la Cruza, J.M. Larraga-Gutierreza,b, S. Moreno-Jimeneza, O.A, Garcla-Gardunoa b, M.A. Celisa
aUnidad de Radioneurocirugia, Instituto Nacional de Neurologia y Neurocirugia, Mexico, D.F., Mexico
b Laboratorio de Fisica Medica, Instituto Nacional de Neurologia y Neurocirugia, Mexico, D.F., Mexico
E-mail address of main author: [email protected]
Pencil beam (PB) is a well known approximate algorithm for dose deposition based on precalculated Monte Carlo (MC) data in a semi-infmte homogeneous water medium [1], This algorithm handles changes in electron density (pe) using Path Length Correction [2]. This kind of approximation fails when the beam crosses an interface [1]. It is in this situtation that direct MC dose calculations are a useful tool for treatment planning systems (TPS) to perform accurate estimation of the dose deposited in high gradient pe regions. An example of this problem is the application of stereotactic radiosurgey (SRS) to arteriovenous malformations (AVMs) that have been embolized. Embolization material has tungsten (W), which is used as contrast agent during the endovascular procedure. The incorporation of this high Z material to the target has dosimetric implications. This work compares the dose calculation between PB and MC for a single beam interaction and for complete intracraneal SRS treatments that incorporate high Z material (as W) to the dose calculation.
A single beam experiment was performed in a water phantom containing a syringe of 5.0mm diameter and 3cm length filled with a mixture of Lipiodol®, Histoacryl® and W, in clinical proportions. The long axis of the syringe was oriented perpendicular to the beam (field size: 2.4x2.4 cm2) at 2.8 cm depth in SAD mode. A radiographic film X-OMAT V2 (Kodak) was used to measure the dosimetric effect of the embolization material. Carrying on with the study, 20 patients that have been previously embolized and treated by SRS using PB dose calculation algorithm have been analyzed. A treatment template was designed with 9 conformal beams in order to standardize the treatments with 20 Gy at isocenter. A new target has been defined as the subtraction of the embolization material from the original AVM. The TPS used is Iplan RT Dose 4.1 (BrainLAB Germany). This TPS has the possibility to perform the calculation of the dose deposition with MC or PB algorithm. Direct MC dose calculation engine of this TPS is based on a virtual source model, allowing fast MC dose calculations [3]. The dosimetry analysis and comparison was carried out using DoseLab 4.11. To analyze the agreement between both algorithms the difference of the average dose calculated and the gamma index (2%/2 mm) between both distributions has been calculated.
In FIG. 1 it is shown that for a single beam, PB overestimates the dose deposition if there is an interaction with a high Z material. The overestimation of PB from the dose measured is 5.5%. The MC simulation and measurements done with the radiographic film have a good agreement.
From the analysis done to the patients, the results show that in all the cases PB overestimates the dose deposited, even with a template of 9 conformal beams and different distribution of material with high electronic density. There is at least one case in which the difference in the average dose is 0.9Gy (4.5%). The second histogram from Fig. 2 shows that the percentage of points under the 90% of the gamma test (2%/2mm) is 65% of the patients.
541

Distance (mm) FIG 1.- Comparison of measurements done of radiographic film with and without embolization material, MC simulation has been performed with iPlan RT Dose TPS and dose distribution has
been calculated with BrainScan TPS
If the calculation of the dose deposition is done with PB algorithm the model of the interaction with high Z material does not have a good accuracy, even for a single beam or a standard SRS template of conformal beams. This dose overestimation has as a consequence the subirradiation of the target. Further studies have to be done with the incorporation of radiobiological models to establish the clinical impact of the dose overestimation.
0.60 0.70 0 80 0.90 1.00
Difference of average dose (Gy)
85.DO 90.00 95.00
Percentage of points that pass gamma test
FIG 2.- The first histogram shows the difference of the average dose between both algorithms. It can be seen that there are cases with differences of 0.9Gy. The second histogram shows the values of the percentage of points that pass the gamma test. The mean for the 20 patients is 89.05% which are considered as non passing the gamma criteria. The third figure is a map ofpercentage of differences between the two algorithms with the same plan. The red points indicate that PB calculation is over MC calculation.
REFERENCES
[1] WANG, L. YORKE, E. CHUI, CS. Monte Carlo evaluation of tissue inhomogeneity effects in the treatment of the head and neck, Int J Radiat Oncol Biol Phys 50 5 (2001) 1339
[2] BRAIN LAB, Brain SCAN Version 5.31 Software Guide, BrainLAB, Germany (2004) [3] FIPPEL, M. HARYANATO, F. DOHM, O. NUSSLIN, F. A virtual photon energy fluence
model for Monte Carlo dose calculation, Med Phys 30 3 (2003) 301
542

IDOS, Vienna, 9-12 November 2010 E2-CN-182, Paper No 125
A Monte Carlo based model for the photoneutron field evaluation in an Elekta Precise linear accelerator
M. Perez-Liva1, F. Padilla-Cabal1, E. Lara", R. Alfonso-Laguardia, J.A Garcia1
and N. Lopez-Pino
1 Instituto Superior de Tecnologias y Ciencias Aplicadas, Havana, Cuba.
2 "Department of Radiotherapy, Instituto de Oncologia y Radiobiologia (IN OR), Havana, Cuba
E-mail address of main author: [email protected]
In this study we simulated the complete head of an Elekta Precise linear accelerator (FIG. 1) from the National Institute of Oncology and Radiotherapy (INOR) using the MCNPX 2.6 code. Detailed information of the accelerator components and materials was supplied by the manufacturer. Parallel electron beams (1 mm spot size) of different energies hitting the target were tested using the detailed linac head structure in the photon mode. Approximately 10 million particles were collected in a phase-space file (scored at 100 cm from the source) for monoenergetic electron beams with the nominal values of 6 and 15 MeV, and using Gaussian distributions ( 1 W I I Y 1 1 MeV) and a mean energy between 4-6 MeV or 12-15 MeV respectively. In order to investigate the performance and accuracy of the simulation the curves of Percent Depth Dose (PDD) and Dose Profiles using the photon mode in a MP3 water phantom were calculated and directly compared with experimental measurements using a PTW 31010 Semiflex ionization chamber. Results for different rectangular fields of 3x3, 5x5, 10x10 and 20x20 cm2 reveal good agreement between measured and calculated dose values as is shown in FIG. 2.
Depth in the phantom (cm) Distance to isocenter (cm)
FIG 1. Schematic view of the FIG 2 Comparison of the MC PDDs (A) and dose profiles (B) for accelerator head model. different operational clinical conditions.
High energy bremsstrahlung photons created in the X-ray target for an operational condition of 15 MV of the linac will generate undesired fast neutron contamination [1, 2] by means of direct photoneutron reactions in the main shielding and modulating materials such as steel, Re, W and Pb. The energy, angular and radial distribution of neutrons in the plane of the patient were studied to create an equivalent source model for three typical square fields of 20x20, 10x10 and 0x0 cm displayed in FIG. 3 and 4. The fact that Monte Carlo techniques have been an important tool for dosimetry characterization in clinical radiotherapy facilities [3] allows us to estimate also the neutron ambient equivalent doses in the same plane for the three typical irradiation fields using the flux-dose quality conversion factors recommended by the ICRP-74 norm.
543

The dose distribution around the isocenter is plot in FIG. 5, showing also very good agreement with similar data reported in [2, 4-6],
In the transport of primary and secondaiy radiation through the entire accelerator neutron interaction cross sections of ENDF VI data library were used and the photoneutron generation was implemented in the transport for heavy materials using the LANL01 and
KAERI01 data libraries. Neutron scattering and albedo effects were taking into account including the treatment room walls, floor and ceiling in the MCNPX input files.
FIG. 3. Photoneutron spectra in the patient plane
FIG 4. Radial fluence distribution in the patient plane
FIG 5. Neutron ambient equivalent dose distribution in the patient plane
Distance from isocenter (cm)
Elekta SL Total Photoneutron spectrum Monoenergetic electron beam 15 MeV
Energy (MeV) -50 -40 -30 -20 -10 0 10 20 30 40 50
Distance from isocenter (cm)
Finally, the total neutron fluence (f>t in different positions at 116 cm from the electron target was calculated and measured using an activation technique. Five different 99.99% pure Au foils were placed inside a cylinder of paraffin wax of 26 cm diameter and 32 cm height covered by 1mm of a Cadmium sheet at the isocenter and 5 cm away in the perpendicular plane. The entire system was irradiated with 100 Gy of photons of 15 MV with a gamma dose rate of 303 cGy/min. Afterwards, the activated foils were measured in a low background HPGe spectrometric gamma system to determine the neutron source strength Q per unit X-ray dose using the McCall equation reported by [6]
f a 5Aa 1.261
where Ci is the transmission factor for the linac head (1 for Pb and 0.85 for W), d the distance between the measured point and the target, and S the total area of the treatment room. Direct MC simulations show a neutron source intensity of (6.7±0.6) 10n n/Gy while experimental measurements using the five foils obtain a mean value of (5.9±0.9) 1011 n/Gy with a standard deviation of 5.7% among them.
Neutron calculation and measurements earned out prove the presence of an undesirable neutron field and its effect must be quantified for different standard therapies. Further work is performed to evaluate the total equivalent dose to the main organs by means of MC calculations and experimental measurements. The obtained results were compared with similar work using Elekta-Precise clinical accelerators [4, 5].and the NCRP report 151 and not very big discrepancies arise, even when the consulted data doesn't correspond exactly with our calculation and measurement conditions.
544
REFERENCES
[1] KIM, H.S., et al. "Evaluation of the photoneutron field produced in a medical linear accelerator" Rad. Prot. Dosimetry, Vol.123, No.3, pp 323-328. 2007.
[2] CARINOU, E., et al. "An MCNP-based model for the evaluation of the photoneutron dose in high energy medical electron accelerators" Physica Medica, Vol.XXI, N.3, pp 95-99. 2005.
[3] ONGARO, C., et al. "Analysis of photoneutron spectra produced in medical accelerators" Phys. Med. Biol. 45, L55-L61. 2000.
[4] HOWELL, R., et al. "Secondary neutron spectra from modern Varian, Siemens and Elekta linacs with multileaf collimators" Med. Phys.36 (9), 4027-4038. 2009. [5] D. Followill et al. "Neutron source strength measurements of Varian, Siemens, Elekta and General Electric linear accelerators" Journal of Applied Clinical Med. Phys. Vol4, No.3, 189-194. 2003.
[6] A. ZANINI et al. "Neutron spectra in tissue equivalent phantom during photon radiotherapy treatment by linacs" Rad. Prot. Dosimetry, Vol.110, No. 1-4, pp 157-160. 2004.
545


IDOS, Vienna, 9-12 November 2010 E2-CN-182, Paper No 125
Dosimetric evaluation of the BlueFrame-FiMe treatment planning system: Results of IAEA-TECDOC-1540
A. Bruna* , L. Ojedab, G. Velezc
aFi.Me S.R.L., Cordoba, Argentina. bNuevo Centra de Tratamiento Oncologico, CTO, Venado Tuerto,Argentina. c Hospital Oncologico Urrutia, Cordoba, Argentina.
E-mail address of main author: [email protected] , [email protected]
Acceptance testing of a new treatment planning system BlueFrame, from FiMe (Argentine) was performed to verify if it meets the specifications as defined by the manufacturer. The methodology suggested by the IAEA Tecdoc 1540 [1] was applied and the results were summarized in graphs and tables as proposed in such the document. The set of tests were performed by both the manufacturer and the final user, and focused on the accuracy of dosimetric calculations during type and site testing. The definitions of tests and specifications follow the standard IEC 62083 [2],
This paper shows the accuracy of dosimetry calculations for 6MV photon beams comparing measured and calculated dose, following the criteria established in the Tecdoc 1540. Different beam configurations (open, wedged, asymmetric, irregular fields) as well as presence of heterogeneities or homogeneous phantom were tested. Dosimetric data employed in this work are found in the CD ROM accompanying the Tecdoc; however, we also performed measurements in a 6MV photon beam from a Siemens MD2 linac.
The main algorithm implemented in the commercial BlueFrame TPS is a divergent pencil beam [3] convolution model, with grid sizes 4x4 mm" and 8x8 mm2. The convolution is done in the time domain rather than in the frequency domain in order to avoid restrictions imposed by the Fourier transform. The pencil beam is obtained from the PDD table input to the system and produced by measurements, by using the method of automatic deconvolution [4],
To summarize the results we used the suggested graphs and tables proposed in the Tecdoc 1540, as a quick way of checking the performance of the TPS. The following graphs show some of the results, which and are summarized in Table 1.
square fields
50.00 • 45.00 • 40.00 -35.00 • 30.00 -25.00 2 0 0 0 -
15.00 • 1 0 . 0 0 -
5.00 0.00 • 3 I .
CD in *t CO n r- O v CJ CO
relative error (%)
10.00 9.00 8.00
g 6.00 S 5.00 J 4.00 t 3.00
2.00 1.00 0.00
Wedged field
10.00 9.00 8.00
g 6.00 S 5.00 J 4.00 t 3.00
2.00 1.00 0.00
10.00 9.00 8.00
g 6.00 S 5.00 J 4.00 t 3.00
2.00 1.00 0.00
10.00 9.00 8.00
g 6.00 S 5.00 J 4.00 t 3.00
2.00 1.00 0.00
10.00 9.00 8.00
g 6.00 S 5.00 J 4.00 t 3.00
2.00 1.00 0.00
10.00 9.00 8.00
g 6.00 S 5.00 J 4.00 t 3.00
2.00 1.00 0.00
•6MV
10.00 9.00 8.00
g 6.00 S 5.00 J 4.00 t 3.00
2.00 1.00 0.00
•6MV
10.00 9.00 8.00
g 6.00 S 5.00 J 4.00 t 3.00
2.00 1.00 0.00
10.00 9.00 8.00
g 6.00 S 5.00 J 4.00 t 3.00
2.00 1.00 0.00
10.00 9.00 8.00
g 6.00 S 5.00 J 4.00 t 3.00
2.00 1.00 0.00
10.00 9.00 8.00
g 6.00 S 5.00 J 4.00 t 3.00
2.00 1.00 0.00 1
10.00 9.00 8.00
g 6.00 S 5.00 J 4.00 t 3.00
2.00 1.00 0.00
-6 O
O -5
OO
-4 O
O -3
00
-2 O
O 5.
-1
OO
£u I 0.
00
ft> I
100
sS
2 00
3
00
400
5 00
6
00
7 00
Table 1 summarizes the results obtained with BlueFrame-FiMe TPS for 6MV photon beams. The fifth column was added to compare the BlueFrame performance against typical values from other TPS listed in reference [5].
547

Test Number Description Mean St. Dev. Conf.limit* Tolerance Typical Conf.
limits5
1 .a-c Square Fields -0.09 0.77 1.25 3.0 0.9 to 2.1 2.a-b Rectangular Fields 0.23 1.34 2.24 3.0 2.1 to 4.0 3.00 Short SSD (85) -0.28 0.64 1.25 3.0 1.0 to 1.6 4.00 Wedged Field -1.01 0.96 2.45 4.0 1.7 to 4.1 5.00 Central Block -0.66 1.72 3.24 4.0 2.1 to 3.9 6.00 Off Centre Plane 0.58 0.92 1.95 4.0 2.1 to 3.4 7.00 Irregular Block 0.84 1.89 3.68 4.0 3.3 to 10.7 8.a-b Lung Inhomogeneity 0.08 1.74 2.70 4.0 1.2 to 3.5 8.c Bone Inhomogeneity 0.23 0.46 0.92 4.0 1.6 to 4.3
9.00 Oblique Incidence 0.73 0.59 1.62 4.0 1.2 to 1.9 10.a-b Missing Tissue 0.68 0.69 1.70 4.0 1.3 to 4.3
11 Asymmetric Open 1.67 1.56 4.00 4.0 2.0 to 4.9 12 Asymmetric Wedge 3.88 3.22 8.70 5.0 4.8 to 10.1
* Confidence limit = | mean | + 1.5 * s.d Table 1. Tests results for 6MVphoton beam - BlaeFrame TPS
We conclude that the Blue Frame TPS passed the IAEA Tecdocl540 tests and the mean values of its errors are under the tolerance specified.
The calculated doses for simple geometries were in excellent agreement with measurements and wedged fields, off-axis calculations, or those performed with presence of heterogeneities were under specification. These results are as good as or better than other popular TPS in the market.
For complex cases as asymmetric-wedged fields or central block, the errors obtained with BlueFrame exceed the tolerance recommended; however, its errors are in concordance with other typical TPSs.
REFERENCES
[1] INTERNATIONAL ATOMIC ENERGY AGENCY, TECDOC N°1540, Specification and Acceptance Testing of Radiotherapy Treatment Planning Systems, Vienna, Apr 2007.
[2] CEI/IEC 62083:2000, Medical Electrical Equipment - Requirements for the Safety of Radiotherapy Treatment Planning Systems, Geneva, Switzerland.
[3] ANDERS AHNESJO et col. A pencil beam model for photon dose calculation. Med. Phys. 19 (2), Mar/Apr 1992.
[4] THOMAS BORTFELD et col. Decomposition of pencil beam kernels for fast dose calculations in three-dimensional treatment planning. Med. Phys.20 (2), Pt. 1, Mar/Apr 1993.
[5] VENSELAAR J., WELLEWEERD H., Application of a test package in an intercomparison of the photon dose calculation performance of treatment planning systems used in a clinical setting. Radiother. Oncol. 60 (2001) 203-213.
548

IDOS, Vienna, 9-12 November 2010 E2-CN-182, Paper No 125
In vivo dosimetry study in total body irradiation performed for 54 patients
M. Besbes . H. Mahjoubb, L. Kochbati3, A. Ben Abdennabi3, L. Farhatc, S. Abdessaied3, L. Salem3, H. Frikha3, C. Nasr Ben Ammar3, D. Hentati3, W. Gargouri3, T. Messai3, F, Benna3, M. Maalej3
3Institut Salah AZAIZ, service de radiotherapie oncologique de Tunis
bInstitut Superieur des Technologies medicales, departement de biophysique de Tunis
c CHU Habib Bourguiba , service de radiotherapie oncologique de Sfax
E-mai address of main author I: [email protected]
Aim
The objective of this work is to study in-vivo dosimetry performed in a series of 54 patients receiving total body irradiation (TBI) at the Salah AZAIZ Institute (ISA) of Tunis since 2004. In-vivo dosimetiy measurements were compared to calculated doses from monitor units delivered.
Materials and methods
The irradiation was conducted with a linear accelerator (Varian Linac 180) using nominal energies of 6 MV and 18 MV, depending on the thickness of the patient's abdomen. The in-vivo dose was measured by semi-conductors, p-type EPD-20. These diodes were calibrated prior to the treatment with an ionization chamber, PTW Farmer of 0.6 cm3. A plexiglas phantom was used for this calibration under the same TBI conditions.
A study of the dosimetric characteristics of semi-conductors, EPD-20, was earned out relative to beam direction, temperature and dose rate. We compared the in-vivo measured dose with the retrospectively calculated doses derived from the MU delivered to the patient.
Results
Our experience has show that semi-conductors are sensitive to the angle (0°-90°) of beam radiation, the temperature (22°C-40°C) and the dose rate (80cGy/min-400cGy/min). The maximum variation is 5%, 7% and 1.5%, respectively, but in our irradiation conditions these correction factors are less than 1.5%.
The comparison of average measured and calculated mean doses in abdomen, mediastinum, right lung and head has shown the respective ratios of 1.005, 1.006, 1.01 and 1.004 and with a standard deviation of of 2.98%, 2.28%, 4.1% and 3.96%, respectively.
Conclusion
In vivo dosimetry by semi-conductors correlates with calculated dosimetry. However in vivo dosimetry using semiconductors is the only technique that can reflect the dose actually received instantly by the patient during TBI taking into account patient and organ movements and the heterogeneity of the medium.
549
REFERENCES
[1] AAPM. AMERICAN ASSOCIATION OF PHYSICICTS IN MEDICINE. The physical aspects of total and half body irradiation. Report N° 17, American Institute of Physics, Inc. (New-York), 1986.
[2] AIEA. AGENCE INTERNATIONALE D'ENERGIE ATOMIQUE. International New Code Practice on Dosimetry in Photon and Electron Beam Therapy, TRS-398. Vienne: AIEA, 2000.
[3] ALECU R., ALECU ML, OCHARAN T. G. A method to improve the effectiveness of diode in vivo dosimetry. Med. Phys. 1998, 25 (5), 746-749
[4] BESBES M., SIALA W., DAOUD J. Dosimetrie in vivo pour evaluer la dose rescue par la thyroide en radiotherapie des cancers du cavum et du sein. Cancer/ Radiother. 2003, 7, 297-301.
[5] ESTRO: EUROPEAN SOCIETY FOR THERAPY RADIOLOGY AND ONCOLOGY. Methods for in vivo dosimetry in external radiotherapy. Booklet N°l, 1994 first edition.
[6] JURSINIC P. A. Implementation of in-vivo diode dosimetry program and changes in diode characteristics over a 4-year clinical history. Med. Phys; 2001, 28 (8), 1718-1726
[7] KENNETH E., KATRYN G. QINGRONG W. The influence of X-ray energy on lung dose uniformity in total body irradiation. Int. Radiation Oncology Biol. Phys. 1997, 38, 1131-1136.
[8] KOHBATI L., BESBES M., FRIKHA H., SELLAMI D. GARGOURI W., NASR C ET AL. Irradiation corporelle totale: techniques et indications. La Tunisie Medicale 2005, 83-N° 10,581-585
[9] ROBERTS R. Correction factors for low perturbation in vivo diodes used in the determination of entrance doses in high energy photon beams. Med. Phys. 2008, 35 (1), 25-31.
[10] SAINI A. S. Energy dependence of commercially available diode detectors for in vivo dosimetry. Med. Phys. 2007, 34 (5), 1704-1711
550

Posters relating to Internal Dosimetry for Diagnostic and Therapeutic
Nuclear Medicine

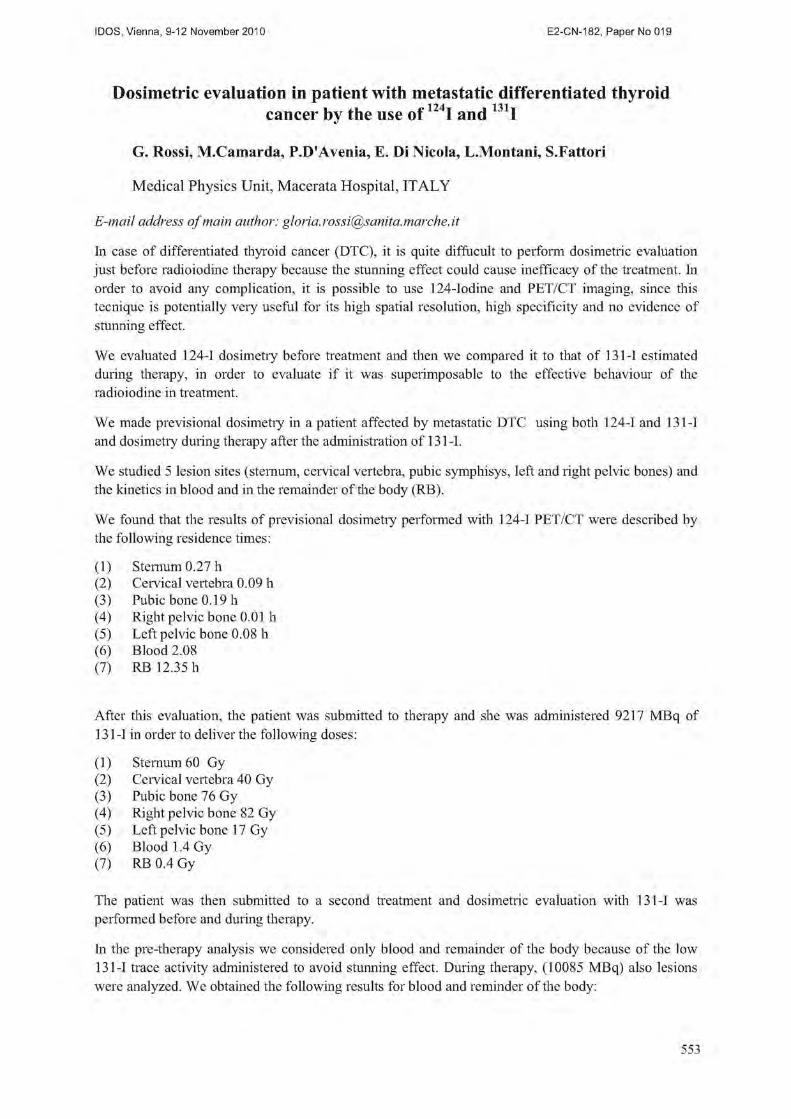
IDOS, Vienna, 9-12 November 2010 E2-CN-182, Paper No 125
Dosimetric evaluation in patient with metastatic differentiated thyroid cancer by the use of1' I and 1 I
G. Rossi, M.Camarda, P.D'Avenia, E. Di Nicola, L.Montani, S.Fattori
Medical Physics Unit, Macerata Hospital, ITALY
E-mail address of main author: [email protected]. it
In case of differentiated thyroid cancer (DTC), it is quite difficult to perform dosimetric evaluation just before radioiodine therapy because the stunning effect could cause inefficacy of the treatment. In order to avoid any complication, it is possible to use 124-Iodine and PET/CT imaging, since this tecnique is potentially very useful for its high spatial resolution, high specificity and no evidence of stunning effect.
We evaluated 124-1 dosimetry before treatment and then we compared it to that of 131-1 estimated during therapy, in order to evaluate if it was superimposable to the effective behaviour of the radioiodine in treatment.
We made previsional dosimetry in a patient affected by metastatic DTC using both 124-1 and 131-1 and dosimetry during therapy after the administration of 131 -I.
We studied 5 lesion sites (sternum, cervical vertebra, pubic sympbisys, left and right pelvic bones) and the kinetics in blood and in the remainder of the body (RB).
We found that the results of previsional dosimetry performed with 124-1 PET/CT were described by the following residence times:
(1) Sternum 0.27 h (2) Cervical vertebra 0.09 h (3) Pubic bone 0.19 h (4) Right pelvic bone 0.01 h (5) Left pelvic bone 0.08 h (6) Blood 2.08 (7) RB 12.35 h
After this evaluation, the patient was submitted to therapy and she was administered 9217 MBq of 131-1 in order to deliver the following doses:
(1) Sternum 60 Gy (2) Cervical vertebra 40 Gy (3) Pubic bone 76 Gy (4) Right pelvic bone 82 Gy (5) Left pelvic bone 17 Gy (6) Blood 1.4 Gy (7) RB 0.4 Gy
The patient was then submitted to a second treatment and dosimetric evaluation with 131-1 was performed before and during therapy.
In the pre-therapy analysis we considered only blood and remainder of the body because of the low 131-1 trace activity administered to avoid stunning effect. During therapy, (10085 MBq) also lesions were analyzed. We obtained the following results for blood and reminder of the body:
553

Pre-therapy: blood 0.34 hRB 17 h
In therapy: blood 0.5 h RB 21 h
Among the lesions studied with 124-1 in the first treatment, only one (left pelvic bone) was still visible in the second cycle.The dosimetric evaluation in this lesion resulted in a residence time of 0.08 h, as in the previsional estimation by the use of 124-1.
New lesions appeared in the skull area, for which we obtained a residence time of 0.8 h.
Our conclusion is that 124-1 PET/CT dosimetiy is a good predictor for lesions kinetics, but for the blood we found a poor correlation with the 131 -Iodine data.
554
IDOS, Vienna, 9-12 November 2010 E2-CN-182, Paper No 125
Estimation of internal dose to patients undergoing myocardial perfusion scintigraphy
P. Tandon", B.S. Gillb, M. Venkateshc
aRadiological Safety Division, Atomic Energy Regulatory Board, Mumbai, India
bDepartment of Nuclear Medicine, INHS Asvini, Mumbai, India
Radiopharmaceuticals Division, Bhabha Atomic Research Centre Mumbai, India
E-mail address of main author: [email protected], [email protected]. in
Myocardial perfusion imaging is a procedure that utilizes an intravenously administered radiophar-maceutical to depict the distribution of nutritional blood flow in the myocardium. Perfusion imaging is useful to identify areas of relatively or absolutely reduced myocardial blood flow associated with is-chemia or scar. The distribution in perfusion following radiopharmaceutical injection can be assessed at rest, cardiovascular stress or both.
These images can be recorded with either single photon or positron imaging techniques utilizing radiopharmaceuticals that are extracted and retained for a variable period of time by the myocardium. The relative regional distribution and clearance of a radiopharmaceutical in the myocardium can be recorded with planar or tomographic single photon techniques, or quantitated using positron imaging techniques.
The data can be analyzed utilizing visual inspection and or by quantitative techniques. Some FDA approved single photon tracers / radiopharmaceuticals employed for myocardial perfusion imaging are thallium-201, and the technetium-99m labeled radiopharmaceuticals such as sestamibi, tetrofosmin, and teboroxime. In this study our objective is to estimate the doses received by the heart and other two critical organs, intestine and bladder after the administration of these radiopharmaceuticals. For the measurement of these doses, a plastic sachet containing three LiF:Mg,Cu,P dosimeter chips of dimension (3 x 3 x 0.89 mm ) were sealed. These sachets were then pasted on the surface of the heart, intestine and bladder region of the patient before the administration of desired radiopharmaceutical. Here, we have chosen the three most commonly used radiopharmaceutical in our country and performed the study on 100 patients each. Two of them, 99mTc (Ti/2 = 6 hrs and Ey =140 keV) based radiopharmaceuticals were methoxy isobutyl isonitrile (MIBI) and tetrofosmin and the third one was 201 j j (YV1 = 73 hrs and Ey = 167 keV) based radiopharmaceutical, thallous chloride. The activity administered in case of "mTc based radiopharmaceuticals was about 1110 MBq (both in rest and stress) whereas, the activity administered in case of201Tl was 111 MBq respectively. After the study, the patients were allowed to go home with the dosimeter affixed by giving them necessary instructions.
These dosimeters were removed only after the completion of five half lives of the radionuclide used and read out in the indigenously developed thermoluminescent dosimeter (TLD) reader. The similar study was performed on the REMCAL Alderson phantom by keeping the dosimeter in the organs of the phantom filled with radioactivity for the stipulated time period so as to find the calibration factor. The calibration factor was used on the doses received by the dosimeter placed on the human body to calculate the doses received by the organ of interest.
From the results obtained, it is noticed that the average dose received by the heart, intestine and bladder for "mTc based MIBI was 0.70E-02, 1.10E-02 and 1.19E-02 mSv/MBq respectively, whereas, for tetrofosmin, it was 0.42E-02, 0.95E-02 and 0.83E-02mSv/MBq respectively. Similarly, the average dose to the organs received due to "01T1 based Thallous Chloride was 1.07E-02, 1.01E-02 and 1.17E-
555
02 mSv/MBq respectively. From the results, we can conclude that !"Tc based radiopharmaceuticals gives less dose to the heart as compared to the 201T1 based radiopharmaceutical per unit of activity administered. The effective half-life of the radionuclide and its retention period is also one of the major contributing factors in giving dose to the heart and other critical organs. It is also observed that these values are comparable with the values quoted in the literature by ICRP.
REFERENCES
[1] INTERNATIONAL COMMISSION ON RADIOLOGICAL PROTECTION (ICRP-59), Report of Committee II on Permissible Dose for Internal Radiation, Publication 2 (Peramon Press, Ox for Snyder W.S., Ford, M.R., Warner G.G.and Fisher H.L. "Estimates of absorbed fraction for monoenergetic photon sources uniformly distributed in various organs of a heterogenous phantom". J. Nucl. Med. Supplemet 3,5 (Medical Internal Radiation Dose Committee Pamphlet (5) (1969). y. J. Nucl. Med., Supp. No. 1, 27, 1968.
[2] INTERNATIONAL COMMISSION ON RADIOLOGICAL PROTECTION (ICRP-23), Reference Man: Anatomical, Physiological and Metabolic Characteristic, Peragamon Press, Oxford (1975).
[3] INTERNATIONAL COMMISSION ON RADIOLOGICAL PROTECTION (ICRP-53), Annals of ICRP Vol. 18 No. 1-4, 1988), Radiation Dose to Patients from radiopharmaceuticals.
[4] INTERNATIONAL COMMISSION ON RADIOLOGICAL PROTECTION (ICRP-56), Annals of ICRP Vol. 20 No. 2, 1990), Age-dependent Doses of the Public from Intake of Radonuclides: Part 1
[5] INTERNATIONAL COMMISSION ON RADIOLOGICAL PROTECTION (ICRP-60), Annals of ICRP Vol. 21 No. 1-3, 1992), 1990 Recommendations of the International Commisiion of Radiological Protection.
[6] INTERNATIONAL COMMISSION ON RADIOLOGICAL PROTECTION (ICRP-80), Addendum 2 to ICRP Publications 53, Radiation Dose to Patients from radiopharmaceuticals.
[7] DANG H.S., JAISWAL D.D, PARMESHWARAN M. AND KRISHNAMONY R. PHYSICAL, Anatomical, Physiological amd Metabolic data for Reference Indian Man- A proposal published as Report BARC/1994/E/043
556
IDOS, Vienna, 9-12 November 2010 E2-CN-182, Paper No 125
Applicability of semiconductor detectors and related ANGLE software for QA in medical radiation dosimetry
S. Jovanovic, A. Dlabac
University of Montenegro, Centre for Nuclear Competence and Knowledge Management (UCNC)
G. Washington Str. 2, MNE-20000, Podgorica, Montenegro
E-mail address of main author: bobo [email protected], [email protected]
Semiconductor detectors (mostly HPGe) are widely used in X and ^-spectrometry. In principle, they register radiation energy being deposited in the detector crystal in various interaction processes. While high energy-resolution is essential for qualitative characterization of the radiation source, detector efficiency is crucial for quantitative aspects of the analysis. This fact connects X and spectrometry with radiation dosimetry, where determination/characterization of the deposited radiation energy is the matter of primary concern, too.
For instance, dose rate constants of brachytherapy seeds are measured in parallel by gamma-spectrometry and thermoluminescent dosimetry [1], Or, air crew radiation exposure can be reliably determined from background radiation gamma-spectrometry, not only by personal dosimetry [2], Recent EU project on radiation dosimetry network included this topic as well [3], producing a handbook on the subject [4], HPGe detectors are, thus, directly applicable in QA for medical radiation dosimetry, while the here presented software enables their full/ proper utilization (efficiency calibration). This work is aimed at contributing to spectrometry-dosimetry bridging.
ANGLE software for semiconductor detector efficiency calculations in its various forms has been in use for 15 years now in numerous gamma-spectrometry based analytical laboratories all around [5-11]. Its purpose is to allow for the accurate determination of the activities of gamma spectroscopic samples for which no "replicate" standard exists, in terms of geometry and matrix. It employs a semi-empirical "efficiency transfer" approach, which combines advantages of both absolute (Monte Carlo) and relative (traceable-source-based) methods to determine sample activity by gamma-spectrometry, while reducing the practical limitations of the latter methods and minimizing potential for systematic errors in the former.
The physical model behind is the concept of the effective solid angle [8] - a parameter calculated upon the input data on geometrical, physical and chemical (composition) characteristics of (i) the source (incl. its container vessel), (ii) the detector (incl. crystal housing and end-cap) and (iii) counting arrangement (incl. intercepting layers between the latter two).
The program can be applied to practically all situations encountered in gamma-laboratory practice, e.g. for environmental monitoring, radioactivity control, radwaste management, NAA, scientific research applications, etc. Point, disc, cylindrical or Marinelli samples, small or large, of any matrix composition, measured on coaxial, planar LEPD or well-type detectors, HPGe or Ge(Li) can be treated. No standards are required, but a start-up "reference efficiency curve" (REC) must be obtained, generally as a one-time procedure. Although calibrated point sources are generally recommended for this purpose, any source/geometry can be chosen as the reference to provide the REC. More than one REC per detector might prove valuable in the interests of better accuracy: The closer the match between the REC and the actual efficiency for the sample, the smaller the efficiency transfer and the more accurate the result.
557

ANGLE is characterized by (i) a wide range of applicability, (ii) high accuracy, (iii) ease-of-use, (iv) short computation times, (v) flexibility in respect with input parameters and output data, including easy communication with another software and (vi) suitability for teaching/training purposes. The ANGLE architecture also offers (vii) potential for accommodating other efficiency calculation methods of semi-empirical or absolute (Monte Carlo) type. In addition, its current scope of applicability (viii) can readily be extended to further/particular user's needs and/or fields of interest - it can be thus regarded as an "open-ended" computer code. A key aspect (and difference from some other approaches), which greatly enhances practicality is that (ix) no "factory characterization" of the detector response is required. In fact any HPGe detector may be used so long as some basic knowledge concerning its construction is available.
A recent IAEA-organized intercomparison exercise was conducted by European Commission JRC-IRMM (Geel, Belgium). Ten laboratories took part, applying nine prominent efficiency transfer calculation codes: semiempirical (source derived) and absolute (Monte Carlo). The exercise revealed that systematic errors (differences occurring between experimental and calculated efficiency results) are mostly due not so much to the calculation methods/procedures themselves (including attenuation coefficients, cross sections and other physical parameters used), but more to uncertainties in input data (detector, source, materials, geometry). ANGLE was one of participating codes, scoring 0.65% average discrepancy from the exercise mean values (Ey > 20keV), with no evidence of systematic bias [9].
ANGLE is commercially distributed by AMETEK/ORTEC, U.S.A. [13], Demo version can be downloaded from the host sites [14,15], whereby more detailed information is also found.
EBB G e o m e t r y H e l p
<3 0 O New Edit Detector
detector detector info Delete
detector
Modify
tnJ Detector example #1 Demo detector example #1
Detector example #2
Demo detector example #2
Detector example #3
Demo detector example #3
Detector example #4
Demo detector example #4
m Detector example #5
Demo detector example #5
Detector example #6
Geometry
No holder
n Geometry example #1
Container
No container
U Container example #1
Container example #2
Source height: 5
Source radius: 1.1
Source material: Water
Other
Energies: None
Reference efficiency curve: Curve example
Gauss coefficient order: 20
All dimensions a re in: Centimeters
FIG 1. ANGLE main screen
558

REFERENCES
[1] Z. CHEN, P. BONGIORNI, R. NATH, Med. Phys., 32/11 (2005) 3279. [2] B.J. LEWIS, P. TUME, L.G.I. BENNETT, M. PIERRE, T. COUSINS, B.E. HOFFARTH, T.A.
JONES, J R. BRISSON, Radiat. Prot. Dosimetry, 86/1 (1999) 7. [3] EC, DG for Research, Nucl. Science and Technology Project "Radiation Dosimetiy Network",
Contract No. 11R1-C I 2000-20104. Final Report, 2007. [4] Neutron and Photon Spectrometry Techniques for Radiation Protection, in Radiat. Prot. Dosim.,
107 (2003)1 [5] S. JOVANOVIC, A.DLABAC, N. MIHALJEVIC, Nucl. Instr. Meth. A (2010),
doi: 10.1016/j.nima.2010.02.058 [6] S. JOVANOVIC, A. DLABAC, N. MIHALJEVIC, P. VUKOTIC, J. Radioanal. Nucl. Chem.,
218 (1997) 13. [7] N. MIHALJEVIC, S. JOVANOVIC, F. DE CORTE, B. SMODIS, R. JACIMOVIC, G. MEDIN,
A. DE WISPELAERE, P. VUKOTIC, P. STEGNAR, J. Radioanal. Nucl. Chem., Articles, 169 (1993)209.
[8] F. DE CORTE, S.M. HOSSAIN, S. JOVANOVIC, A. DLABAC, A. DE WISPELAERE, D. VANDENBERGHE, P. VAN DEN HAUTE, J. Radioanal. Nucl. Chem., 257/3 (2003) 551.
[9] T. VIDMAR, N. CELIK, N. CORNEJO DIAZ, A. DLABAC, I.O.B. EWA, J.A. CARRAZANA GONZALEZ, M. HULT, S. JOVANOVIC, M-C, LEPY, N. MIHALJEVIC, O. SIMA, F. TZIKA, M. JURADO VARGAS, T. VASILOPOULOU, G. VIDMAR, Appl. Rad. Isot. 68 (2010)355.
[10] P. VUKOTIC, N. MIHALJEVIC, S. JOVANOVIC, S. DAPCEVIC, F. BORELI, J. Radioanal. Nucl. Chem., 218 (1997) 21.
[11] K. ABBAS, F. SIMONELLI, F. D'ALBERTI, M. FORTE, M.F. STROOSNIJDER, APPL. Rad. Isot. 56 (2002) 703.
[12] L. MOENS, J. DE DONDER, LIN XILEI, F. DE CORTE, A. DE WISPELAERE, A. SIMONITS, H. HOSTE, Nucl. Instr. Meth., 187 (1981) 451.
[13] http://www.ortec-online.com/Solutions/applications-software.aspx [14] http://www.dlabac.com/angle [15] http://angle.dlabac.com
559


IDOS, Vienna, 9-12 November 2010 E2-CN-182, Paper No 125
PET with 124I-beta-CIT: Imaging-based dosimetry for a new radiopharmaceutical
P. Salettf, V. Berti\ P. Panichellf, G. Valentinic, A. Pupib, C. Goria
a Medical Physics Unit, Azienda Ospedaliero-Universitaria Careggi, Florence, Italy
b Department of Clinical Physiopathology, University of Florence, Italy
c ACOM SpA, Montecosaro, Macerata, Italy
E-mail address of main author: [email protected]
123I-lahelled methyl 3P-(4-iodophenyl)tropane-2p-carboxylate (P-CIT) has proven to be an excellent method for the study of the dopaminergic system and for the evaluation of patients with movement disorders, such as Parkinson's disease. Since 123I is a gamma-emitter, brain SPECT acquisitions are performed with the limits intrinsically related to the spatial resolution and sensitivity of such technique. 124I-P-CIT, a p emitter, could overcome these limits by means of PET technique, but no study has ever evaluated dosimetric issues and biodistribution of the tracer neither in animals nor in humans. The aim of the present project is to perform an imaging-based dosimetry for the evaluation of the activity of I24I-P-CIT to be injected, in order to obtain satisfactory images within radioprotection patient constraints. The clinical phase I protocol has been approved by competent authorities.
First of all, comparative experiment in rats was performed measuring the time-course radioactivity * * * * . . • 123 124 * * accumulation in various tissues after injection of " I-P-CIT and I-P-CIT, with the following results:
TABLE I - EQUIVALENCE OF BIODISTRIBUTION OF 123I-B-CIT AND 124I-B-CIT % ID. q (tissue)
TIME (h) 0,25 0,5 1 2 3 4 6 24 48 72 96 O R G A N
Striatum 1-124 4.132 4.549 4.878 4,731 4,064 3.280 2,725 0,222 0,005 0,000 0,000 Striatum 1-123 4,159 4,562 4.788 4,723 4,113 3,318 2,780 0,223 0,005 0,000 0,000 Hypothalamus 1-124 3,455 3,553 3,622 2,972 2,435 2,205 1,610 0,084 0,003 0,000 0,000 Hypothalamus 1-123 3,400 3,532 3,616 2,917 2.469 2,240 1,580 0,083 0,003 0,000 0,000 Cerebellum 1-124 2,347 2,066 1,689 0,901 0,640 0,481 0,319 0,046 0,002 0,000 0,000 Cerebellum 1-123 2,317 2,068 1.683 0,888 0,640 0.487 0,323 0,046 0,002 0,000 0,000 Lunq 1-124 1:3,218 7,193 3,953 2,474 1,616 1,455 0,997 0,881 0,531 0,000 0,000 Lunt) 1-123 1 3,464 7,241 3.888 2,484 1,608 1,456 0,984 0,874 0,539 0,000 0,000 Liver 1-124 2,080 1.983 2.443 2,589 2,503 2,685 2,688 1,470 0,724 0,000 0,000 Liver 1-123 2,077 1,985 2,456 2,603 2,541 2,676 2,680 1,485 0,726 0,000 0,000 Kidney 1-124 3,021 2,551 1,574 1,250 0.981 0.894 0,658 0,120 0,015 0,000 0,000 Kidney 1-123 3,057 2,519 1,557 1,253 0,980 0,896 0,656 0,122 0,014 0,000 0,000 Blood 1-124 0.922 0,724 0,457 0,431 0,311 0.268 0,254 0,062 0,000 0,000 0,000 Blood 1-123 0.934 0.717 0.460 0,438 0.310 0.268 0,258 0,060 0,000 0,000 0,000 Heart 1-124 1,840 1,301 0,760 0,548 0,401 0,355 0,286 0,054 0,000 0,000 0,000 Heart 1-123 1.876 1,324 0,752 0,540 0,399 0.349 0,284 0,056 0,000 0,000 0,000 Remainder of the Ijody 1-124 0.268 0,233 0,211 0,201 0,190 0,182 0,175 0,090 0,030 0,010 0,000 Remainder of the body 1-123 0,266 0,230 0,208 0,203 0,191 0,184 0,176 0,092 0,032 0,011 0,000
The equivalence of biodistribution of the two tracers allows us to use available 123I-P-CIT time-activity curves in humans, mean and peak uptake as described in literature [1] for a gross dosimetric evaluation of 124I-P-CIT. As a matter of fact, since only data from lungs, liver, intestine and brain are known our estimates, performed by means of Olinda software according to MIRDOSE model, are limited to such organs.
561

TABLE 2 - DOSE FROM 124I-B-CIT FOR SELECTED ORGANS organ T(123) ura A-biol T(124) dose
Brain l,59h 0.14 0.0355 h"1 3.3h 0.512mGy/MBq
Liver 3.94h 0.37 0.0414 h"1 7.66h 0.9mGy/MBq
Lungs 3.86h 0.75 0.148 h"1 5.04h 0.786mGy/MBq
This approach leads us to assess for each organ 124I-p-CIT dose and effective dose nearly one order of magnitude over the 123I-P-CIT dose. Nothing can be said about total effective dose, since accumulated activity and retention time are not completely known.
For this reason, l24I-p-CTT injected activity should be decreased at least one order of magnitude under the mean 123I-P-CIT injected activity [2], Moreover, we considered convenient a further reduction to 1/10 in order to achieve the most conservative first ' 4I-P-CIT injected activity.
In particular, 3.7 MBq of 124I-P-CIT will be injected to the very first patients, which will be acquired by means of a Gemini TF PET/CT scanner. A rough estimate of recorded counts based on system sensitivity should imply a statistical uncertainty of no more than 5%, enough to ensure a good image quality.
Whole-body PET acquisitions will be performed at 10, 30, 60 minutes post-injection and then at 2, 4, 8 hours post-injection, in order to obtain accumulated activity in each organ. Particularly, at each time point a region of interest will be drawn on selected organs from 2D axial slices, to get specific organ uptake curves.
This approach will provide not only a more specific organ dosimetry even in terms of effective dose, but also a feedback evaluation of the injected activity, which could be properly targeted depending on patient or scanner characteristics.
REFERENCES
[1 ] JOHN P. SEIBYL ET AL. "Whole Body Biodistribution, Radiation Absorbed Dose and Brain SPECT Imaging with Iodine-123-fj-CTT in Healthy Human Subjects" The Journal of Nuclear Medicine vol.35 No.5 May 1994
[2] JOHN P. SEIBYL ET AL. "Reproducibility of Iodine-123-p-CIT SPECT Brain Measurements of Dopamine Transporters" The Journal of Nuclear Medicine vol.37 No.2 May 1996
562

IDOS, Vienna, 9-12 November 2010 E2-CN-182, Paper No 125
Equivalent therapy model for non-Hodgkin's Lymphoma: Uncertainty analysis for radiobiologic parameters
PL Roberson3, SJ Wildermanb, AM Avram\ MS Kaminskf, MJ Schippera, YK Dewaraja1
department of Radiation Oncology; bDepartment of Radiology; "Division of hematology and Oncology, Department of Internal Medicine, University of Michigian, Ann Arbor, Michigan, USA
E-mail address of main author: [email protected]
Purpose: Therapy effect models represent an improvement over traditional methods of comparing total absorbed dose to patient outcome to demonstrate a therapy-outcome relationship. However, use of therapy effect modeling is more complex and deserving of a careful error analysis. Improved data collection methods have improved absorbed dose estimation by tracking activity distributions and tumor extent at multiple time points, allowing individualized therapy effect estimation. Treatment with Tositumomab and Iodine-131 tositumomab anti-CD20 radioimmunotherapy (Bexxar) yields a cold anitbody anti-tumor response (cold protein effect) and an absorbed dose response. Biologically effective treatments, including the absorbed dose effect, cold protein effect and cell proliferation, were used to build an equivalent therapy model with some success in correlating therapy effect to outcome1.
Methods: Fifty-six tumors in 19 patients were followed using 6 SPECT/CT studies, 3 each post tracer (5 mCi) and therapy (-100 mCi) injections. Both injections used identical antibody mass, a flood dose of 450 mg plus 35 mg of 131I tagged antibody. The SPECT/CT data were used to calculate dose rate distributions and tumor and whole body time-activity curves, yielding a space-time dependent dose rate and cold antibody density description for each tumor. Tumor volume contours entered on CT were used to derive the time dependence of tumor size for tracer and therapy time points. A combination of an equivalent therapy model and an inactivated cell clearance model was used to fit absorbed dose sensitivity (a) and cold effect sensitivity (Ap) parameters, from which equivalent therapy values are calculated. Optimized parameter fits were determined using least square fitting.
Results: Case-averaged model 'by-eye' fit parameters for a ranged from 0.11 to 1.3 (ave 0.34) Gy"1
and for X,, 0.0 to 0.35 (ave 0.097) gT/mgp-hr. Model parameters and fit values determined from least square and 'by-eye' methods for tumors in three representative cases are given in Table 1. The cell clearance half-time was allowed to vary, with an imposed 1 d minimum (see Casel). Changes in the radiation sensitivity parameter correlated with cell clearance half-time. Tumor size error estimation from least square fitting can be used to gauge the relative quality of the fit. The uncertainty analysis will allow improved determination of mean sensitivity parameters for use in calculating therapy effect values, E=-ln[S(tmin)], where S(tmin) is the time minimum of the cell survival curve. Therapy effect values are used to compare to therapy outcome.
563

TABLE 1. LEAST-SQUARE FIT (LSF) VALUES WITH UNCORRELATED 1 o UNCERTAINTIES IN PARENTHESES COMPARED TO 'BY-EYE' (B-E) FIT PARAMETERS. HALF TIME FOR PROLIFERATION WAS 150 D.
Parameter Sym Case 1 Case 2 Case 3
LSF b-e LSF b-e LSF b-e
Radiation Sensitivity,
Gy1
a 0.22
(0.03)
0.28 0.56
(0.04)
0.95 0.30
(0.02)
0.27
Cold Effect Sensit,
gT/(mgp-hr)#
0.063
(0.015)
0.046 0.027
(0.009)
0.023 0.015
(0.005)
0*
Cell Clearance
Half-Time, d
TC1 1.0 (min) 3* 1.59
(0.17)
3* 4.55
(0.32)
3*
Cell Clearance Delay
Time, d (rad only) td 3.40
(0.32)
1.5* <0.04
(0.17)
0* 1.87 (.09) 1.5*
Relative Tumor Size
Normalization
7 ^iiarni 1.033
(0.022)
1.053" 1.057
(0.037)
1.10* 1.010
(0.006)
1.00*
Tumor Size Error (%) 5.3 9.0 1.5 1? gram tumor per mg(protein)-hr. mgp-hr is time integral exposure to antibody Values selected based on time dependence of tumor size. Tumor size is normalized to first (day 0)
measured tumor size
REFERENCE
[1 ] DEWARAJA YK, SCHIPPER MJ, ROBERSON PL, WILDERMAN SJ, AMRO H, REGAN
DD, KORAL KF, KAMINSKI MS, Avram AM, 1-131 tositumomab radioimmunotherapy:
initial tumor dose- response results using 3-D dosimetry including radiobiological modeling,
JNM in press.
564
IDOS, Vienna, 9-12 November 2010 E2-CN-182, Paper No 125
Equivalent therapeutic response model for non-Hodgkin's lymphoma: Tumor specific cell proliferation and analysis of follow-up studies
SJ Wildermana, PL Roberson", AM Avramc, MS Kaminskid, MJ Schipper\ YK Dewarajac
^Department of Nuclear Engineering and Radiologic Sciences; bDepartment of Radiation Oncology; cDepartment of Radiology; Division of Hematology and Oncology, Department of Internal Medicine, University of Michigian, Ann Arbor, Michigan, USA
E-mail address of main author: [email protected]
Purpose: A model of the response of non-Hodgkin's Lymphoma to radioimmunotherapy (using Iodine-131 tositumomah), which incorporates the therapeutic effects of both the absorbed radiation dose and the response to the cold antibody, has recently been developed,' In this model, which involves the computation of the time-evolution of tumor sizes over the course of the therapy, cell proliferation is assumed to be uniform for all tumors and all patients. In the current work, we introduce tumor-specific cell proliferation and apply the model to the analysis of tumor size data from two-month and six-month follow-up studies.
Methods: The current study protocol, which to date has involved 18 patients with 55 total tumors, calls for a tracer study (with roughly 5 mCi of 131I) followed eight days later by a therapeutic phase (using approximately 100 mCi). Both studies begin with the administration of a flood dose of 450 mg of the antibody, followed by the injection of 35 mg of the tagged antibody. Date from three SPECT/CT measurements taken after tracer administration and three taken during the therapy course is used in computing time-dependent tumor response of the model. First, fitted whole-tumor time-activity curves are derived. The six sets of SPECT/CT measurements are then registered to each other, using a deformable registration model applied to tumor contours drawn on each CT. Time dependent 3D maps of the activity distribution are then computed at one hour intervals by interpolating the six registered SPECT maps, using the whole-tumor activities as a normalization. Fully 4D maps of the absorbed dose and cumulative antibody exposure are computed by integrating the 4D activity maps, using Monte Carlo derived values of absorbed dose per unit activity to compute dose and the radiologic half-life of 131I to compute antibody distribution. Tumor size can then be computed at all times using a cell clearance model, and parameters defining the sensitivity of a given tumor to radiation (a, in Gy"1) and to the cold antibody (Ap, in gT/mgp-hr, or Tp = In 2 / XP ) can then be determined by a fit of the computed tumor size curve to the tumor volumes measured during each of the six scans. In this paper include measurement data from two-month and six-month follow-up scans (where available), and, because the wide range in clinical response implies a similar variability in proliferation rates, we include (again by fitting computed curves to measured data) the calculation of tumor-specific proliferation doubling times, TPot. When necessary, we have also refit the radiation sensitivities and cold antibody sensitivities parameters.
Results: Three illustrative examples are described here.
Tumor 1 (original sensitivities: a = .42 hr"1, Tp = 6.0 mgp-hr / gT, and TPot= 150 day.) Measured tumor size (relative to size on initial scan) at 60 days was .628, while the computed value using the original sensitivities was .644, indicating that the assumed proliferation rate was substantially correct.
565

Tumor 2 (original sensitivities: a = .20 hi"1. Tpwas infinite (no response to the cold antibody), and TPot
= 150 day.) Measured relative size at 60 days was 1.09, while the compute size was .042. Refitting yielded a = .10 hr"1, Tp = 10.0 mgp-hr / gT, and TPot = 22 day, and a computed 60-day relative size of .992. This patient suffered from progressive disease, which was not evident at the time of the final therapy phase scan, at which time the tumor had actually shrunk by 50%.
Tumor 3 (original sensitivities: a = .30 hr"1. Tp = 7.0 mgp-hr / gT, and TPot = 150 day.) Measured relative 60-day size was .163,vs. a computed size of .375. Setting proliferation to zero yielded a computed 60-day relative size of .26.
This work was supported by grant 2R01EB001994 awarded by the National Institute of Health, USA.
REFERENCE
[1 ] DEWARAJA YK, SCHIPPER MJ, ROBERSON PL, WILDERMAN SJ, AMRO H, REGAN DD, KORAL KF, K A MINSK! MS, A VRAM AM, 1-131 tositumomab radioimmunotherapy: initial tumor dose-response results using 3-D dosimetry including radiobiological modeling, JNM in press.
566

Posters relating to External Quality Audits

IDOS, Vienna, 9-12 November 2010 E2-CN-182, Paper No 125
A TLD based postal audit method for source strength verification of high dose rate t92Ir brachytherapy sources
S, D. Sharrna, V. Shrivastava, A, Philomina, G, Chourasia, Y. S. Mayya
Radiological Physics & Advisory Division (RPAD), Bhabha Atomic Research Centre, CT&CRS Building, Anushaktinagar, Mumbai - 400094, India
E-mail address of main author: [email protected], [email protected]
High dose rate (HDR) brachytherapy treatment using high activity 192Ir source is commonly used worldwide. In India, more than 155 HDR remote afterloading brachytherapy units with 192Ir sources are in clinical use. To date, no viable audit programme for verifying brachytherapy source strength is available in the country. A TLD based postal source strength measurement method was developed for HDR ,92Ir sources to fulfil the national requirement.
Strength of HDR brachytherapy sources is commonly specified in terms of air kerma strength (AKS) which is defined as the product of air kerma rate in free space along the perpendicular bisector of the source and the square of the distance from the centre of the source [1]. To measure AKS of HDR 192Ir, a specialised PMMA source calibration jig was designed and fabricated. As shown in FIG. 1, this jig has the provision to hold an HDR I92Ir source, ten IAEA/WHO TLD capsules at 10 cm distance from the source and a 0.6 cm3 thimble ionization chamber with its build-up cap. TL dosimeter used in this audit method was the one which is routinely used by IAEA for postal dose audit in radiotherapy. This TL dosimeter constitutes a polyethylene cylindrical capsule which is filled with about 155 mg of TL powder (TLD-700). Before each exposure, the TL powder was annealed at 400°C for 1 hour followed by fast cooling and subsequent annealing at 100°C for 2 hours.
The thimble ionization chamber was used to find the correct dwell position of the source for irradiation of TL capsules. TLD capsules were then placed in their grooves and irradiated by the HDR 192Ir source for about 900 seconds. The TL powder was calibrated in 60Co gamma rays in terms of air kerma following the method outlined in IAEA TRS 277 [2], Relative energy correction factor of 0.98 was applied to convert air kerma from "Co to air kerma to 192Ir [3]. Attenuations of radiation by stainless steel tube and by wall of the TLD capsule holders were determined analytically and applied during source strength calculation from TLD measurements. To verify the suitability of the TLD postal method, the AKS of an HDR 192Ir source was also measured by the reference well type ionization chamber and compared with the AKS value determined using TLD method. The two values of AKS of the source were found in agreement within 2.5% variation. The TLD postal audit for AKS measurement was then conducted at eight different centres in India as a trial run.
Table 1 presents the AKS of HDR 192Ir source determined by the RPAD TLD postal method and its comparison with the hospital well type chamber measured AKS values. The combined standard uncertainty in the AKS measurement using TLD postal method was found to be 3.8% (k=2). Under the acceptability criteria of ±5%, the results of five hospitals found to be within the acceptable limit. However, AKS of other three hospitals are over 6%. The human error in calculation of AKS from the measured current of well type chamber was found as the source of error on thorough technical investigation of the AKS measurement method of these three hospitals. The proposed TLD based postal method for AKS measurement is a simple capable of detecting error in measurements and is simple to implement.
569

FIG. 1. Photograph of the PMMA source calibration jig designedfor postal source strength verification of HDR Ir-192 brachytherapy sources.
TABLE I. AKS of 192Ir source determined by the RPAD TLD postal method and its comparison with hospital well type chamber measured AKS values.
Hospital ID Air Kerma Strength (cGy" .cnr.hr") measured by % Difference Hospital ID RPAD (TL-700) Hospital (Well chamber)
% Difference
HI 32749.62 33690.00 2.79 H2 16276.43 16932.00 3.89 H3 26018.37 26839.98 3.06 H4 15995.40 15608.19 -2.48 H5 20686.98 22241.00 6.99 H6 31744.40 29798.57 -6.53 H7 22312.16 21366.28 -4.43 H8 39954.76 37582.44 -6.31
REFERENCES
[1] AMERICAN ASSOCIATION OF PHYSICISTS IN MEDICINE, Specification of brachytherapy source strength. Report No. 21, American Institute of Physics, New York (1987).
[2] INTERNATIONAL ATOMIC ENERGY AGENCY, Absorbed dose determination in photon and electron beams - an international code of practice. TRS 277, IAEA, Vienna (1997).
[3] PIERMATTEI A., FIDANZIO A., AZARIO L„ RUSSO A., PERRONE F., CAPOTE R„ TONI M.P., A standard dosimetry procedure for 1 * ir sources used for endovascular brachytherapy. Phys. Med. Biol. 47 (2002) 4205-21.
570
IDOS, Vienna, 9-12 November 2010 E2-CN-182, Paper No 125
The SSDL-ININ experience in TLD postal pilot program for radiotherapy external beam audit at Mexican hospitals
J. T. Alvarez R. and V.M. Tovar M.
SSDL, Department of Ionizing Radiation Metrology, ININ.Carretera Federal Mexico Toluca S/N, La Marquesa, Ocoyoacac, Estado de Mexico 52 750, Mexico
E-mail address of main author: [email protected]
It is described a postal TL-dosimetry pilot program carried out during the period 2007-2009. On the first phase 2007-2008, 18 beams of 13 hospitals are audited: 11 ' Co beams and 7 high-energy accelerator photon beams. On the second phase 2009, 29 beams of 18 hospitals are verified: 8 60Co beams and 21 high-energy accelerator photon beams. Although, this program is similar to IAEA, RPC and ESTRO programs, it differs in how: the absorbed dose to water Dw is evaluated with an inverse regression model, and the use of ANOM mean test [1] for: i) to correct the stability of the reader during the second phase, ii) the statistical validation of the Dw values determined by the hospitals, and iii) to find the calibration points that are outside of ± 5% for nominal Dw = 2 Gy.
The ININ program consists of six steps: 1). Preparation of the TLD-100 powder: washing, drying and annealing [2]. 2). distribution of two IAEA type capsules to the hospitals to be irradiated to the nominal Dw during the irradiation window. 3). Construction and validation of the calibration curves (CC): rtl = a0 + a1- Dw + a2 • D?v. The TLDs are irradiated in a 60Co beam, for the first phase: seven CC's are constructed during the irradiation window, where the Dw is traceable to the NRC-Canada. On the second phase: eight CC's are constructed during the irradiation window traceable to the BIPM. The CC's are fitted using the weighted and quadratic least squares regression models [3,4]. These models are validated using the lack of fit test LOF, and the Anderson-Darling AD normality test [3, 4], see Table I.
Table I. Regression models for CC at the SSDL-ININ
Phase N «o±SD «i±SD «2±SD Normality Test [3] LOF test nC fiC Gy"1 fiC Gy"2 a= =0.05 a=0.05,[3,4] nC fiC Gy"1 fiC Gy"2
AD P FEXP P 1st 499 0.014643 4.57161 0.10206 21.507 <0.005 1.68 0.187 7 CC 0.001955 0.03121 0.01000 2nd 234 0.004554 4.58092 0.13479 0.858 0.027 1.76 0.138 8 CC 0.000871 0.02119 0.01109
4). Reading of the TLD peak 4 and 5 with a Harshaw 3500 reader. 5). Evaluation of Dw performed with the inverse model regression using the TLD reading RTL corrected by the reader's stability and the energy conversion factor from high-energy photon beams to °'!Co [5]. The correction factor for reader stability is determined with the readings for reference light, and with application of the ANOM test [1]. The uncertainty uc R is determined with GUM guide. The u c for Dw is estimated using the
inverse calibration curve corresponding to the interval confidence (Rtl 1 u, Kj; ), as shown in Table II.
571
Table II. Uncertainty budget for the Dw determination at the SSDL-ININ (Capsule 1/1027) 6 MV Factor Value Unit Sensivity
Coeff. Uncertainty A Si
B Hi
Remarks
H Control chart r a o
Dw rate 0.0514 Gy/min 39 0.0002 -for Dw rate traceable to
EL BIPM -i Irradiation time 2326 s 0.001 - 0.02 1 s in 2000 s o" Posicionated 0.80 m 0.082 - 0.12 3 mm at 0.80 m M
Decay 1.0 1 5.3xl0"7 - 5 At=4 days
At0=0.25 m < p
Reproducibility r V T T
9583.6 nC 1 104.4 -10 readings
§•
I L ,
deader stability 1.032 1 1 0.020 - reference light o° f 1 energy 1.015 1 1 0.015 Figure 3, [5] o o
Regression model See Table I, the s
aO al a2 Dw
4.5547 nC 1 0.087 (Dw ± A£>w) is aO al a2 Dw
4580.9 nC/Gy 1.9762 21.19 - the associated aO al a2 Dw
134.79 nC/Gy2 3.9052 11.09 to TLD
aO al a2 Dw 1.98 Gy 5113.7 0.012 calibration
Ri 10044.3 nC u c,RT1 133 nC GUM guide
A, 1.98 Gy
U(k=2)
u, 1.3 %
2.6 %
Feedback t 0
inverse CC
6). Evaluation of the Dw irradiated. The maximum deviation allowed between the value of Dw
determined at the reference laboratory and the one stated by the hospital is ± 5%; however, this work uses the ANOM mean test with a = 0. 05 as a criterion for the acceptance limits in the determination of Dw at the hospital.
REFERENCES
[1] NELSON, LS„ Factors for the Analysis of Means. J. Qual. Tech. 6 (1974) 175. [2] MCKEEVER, W.S., et al., Thermoluminescence Dosimetry Materials: properties and Uses,
Nuclear Technology Publishing, Ashford, (1995). [3] DRAPER, N.S. et al, Applied Regression Analysis, John Wiley & Sons, N.Y. (1998). [4] ALVAREZ-ROMERO, J.T., TOVAR-MUNOZ, V.M., , Pilot Quality Control Program for
Audit RT External Beams at Mexican Hospitals (AIP Conf. Proc. 1032 Mexico City, 2008) American Institute of Physics, N.Y. (2008) 203.
[5] NYSTROM, H., et al., "Beam Quality Dependence of IAEA TLDs Irradiated in Standardized Geometry", Measurements Assurance in Dosimetry (Proc. IAEA Int. Sym. Vienna, 1993) IAEA, Vienna (1994) (IAEA SM-330/72).
572

IDOS, Vienna, 9-12 November 2010 E2-CN-182, Paper No 125
External quality audit of IMRT planning and delivery: Preliminary results
R. Alfonso-Laguardiaa, Y. Sola-Rodriguezb, J. L. Alonso-Samperc, E. Larrinaga-Cortinaa, L. De la Fuented
a Department of Radiotherapy, Institute of Oncology and Radiobiology (INOR), Havana, Cuba b Department of Radiation Protection, Institute of Oncology and Radiobiology (INOR), Havana, Cuba c Center for Control of Medical Devices (CCEEM), Havana, Cuba d Department of Neurosurgey, Institute of Neurology and Neurourgery (INN), Havana, Cuba
E-mail address of main author: [email protected]
The Cuban Nuclear Regulatory Body (CNSN) has made mandatory for all radiotherapy services to receive External Quality Audit Visits (EQAV) from an acredited institution, in order to receive and preserve their operational licences. Since 2001, the Center for Control of Medical Equipment (CCEEM) has the mandate from the Minitry of Public Health (MINSAP) to perform such EQAV along the country. According to this, all radiotherapy sendees are visited at least once every two years, and from 2007, the CCEEM has been adjusting the EQAV structure to the relevant IAEA recommendations [1, 2], Quantification of EQAV has been implemented [3] and more recently, procedures for auding the treatment planning process has been put into practice, based on IAEA TECDOC 1583 [4]
Anytime a new technology or procedure is intended to be introduced in the clinical practice, after commissioned, it should be audited by the CCEEM, in order to obtain the corresponding licence from the CNSN. Recently, three radiotherapy services have started the commissioning of IMRT systems treatment. All systems are based on Elekta Precise® linear accelerators and Elekta's PrecisePLAN' treatment planning system (TPS). Procedures for auditing such IMRT systems have not being in place during their clinical implementation at the Institute of Oncology and Radiobiology (INOR), which is the reference institution in Cuba for cancer treatment and care. In order to support the CCEEM in expanding the scope of the current EQAV, we have developed and tested at INOR a procedure for IMRT auditing. The proposed procedure is based on the combination of the recommendations of the AAPM Task Group 119 for commissioning of IMRT systems [5] and those of the IAEA TECDOC 1583. As this TECDOC if focused only in typical (non IMRT) external beam treatment techniques, the rationale of the combination has been to adapt the IMRT test cases recommended by AAPM TG-119 to the CIRS IMRT phantom used in the EQAV.
Firstly, the DICOM structures provided by TG-119 have been imported into the CIRS CT images, and repositioned, in order to ensure that the measuring points recommended by TG-119 coincide with the CIRS inserts for the ion chamber. Three IMRT test cases have been implemented for the EQAV, namely, prostate test case, H&N test case and C-shape test case. Treatment planning calculations have been performed following recommendations of TG-119 for beam arrangements and dose goals.
As all institutions to be audited with IMRT systems have the same 2D detector array (PTW Seven!9), analysing software (PTW Verisoft) and water equivalent plastic phantom (PTW RW3), the recommended TG-119 preliminary tests (parallel opposed 10x10 cm and parallel opposed bands) have been kept invariable for per-field measurements; comparison of calculated coronal DICOM dose distributions were performed for this simple tests and for the IMRT tests, but collapsed beam arrangement.
573

These comparisons were made with PTW Verisoft , using the gamma criteria of 3% dose and 3 mm DTA, restricted for the region of dose over 10% of maximum dose, and reporting the percentage of points passing this gamma criteria.
In order to quantify the degree of agreement that should be expected between the auditor's measurements and the calculated data provided by the audited facility, the concept of "confidence limit" suggested by TG-119 has been adopted. For assessing reasonably confidence limits, the whole procedure has passed a pilot implementation at INOR's IMRT system, as the rest of the institutions to be audited have the same system. The results of this pilot testing are shown in Table 1.
Test Chamber measurements 2D array meas. ( D m e a s D c a l ) / D p r e s c % L (3%/3mm)
High dose point Low dose point Prostate -0.5% -6.6% 97.2%
H & N -1.1% 0.4% 99.2% C-shape -6.2% -4.0% 100%
Conf. Limit 9.2% 10.4% 7.1% Table 1. Results of test cases at reference institution
As observed in Table 1, discrepancies in chamber measurements for C-shape test are high, while per field gamma agreement is excellent; so discrepancies are likely associated to precision in CIRS phantom setup due to actual beam arrangement. This increases significantly the confidence limits, making them too broad for auditing purposes. We are investigating the way to reduce these sources of uncertainties in order to start the pilot implementation of the system in other institutions.
REFERENCES
[1] INTERNATIONAL ATOMIC ENERGY AGENCY, Comprehensive Audits od Radiotherapy Practices: A Tool for Quality Improvement: Quality Assurance Team for Radiation Oncology (QUATRO). IAEA STI/PUB/1297, Vienna 2007.
[2] INTERNATIONAL ATOMIC ENERGY AGENCY, On-site Visits to Radiotherapy Centres: Medical Physics Procedures. IAEA TECDOC 1543, Vienna, March 2007.
[3] ALONSO-SAMPER, J.L., ALFONSO-LAGUARDIA, R„ GARCIA-YIP, F„ Quantification of Results of External Quality Audit Visits in Radiotherapy. Proc. 4th Latin American Congress on Medical Physics, Cartagena de Indias, Colombia, 2007.
[4] INTERNATIONAL ATOMIC ENERGY AGENCY, Commissioning of Radiotherapy Treatment Planning Systems: Testing for Typical External Beam Treatment Techniques. IAEA TECDOC 1583, Vienna, 2008.
[5] AMERICAN ASSOCIATION OF PHYSICISTS IN MEDICINE. IMRT commissioning: Multiple institution planning and dosimetry comparisons, a report from AAPM Task Group 119. Med. Phys, 2009; 36 (11): 5359-5373
574

IDOS, Vienna, 9-12 November 2010 E2-CN-182, Paper No 125
Development of national radiotherapy audit in the UK
S Bolton3
a Leicester Royal Infirmary, Leicester UK
E-mail address of main author: [email protected]
Introduction
Clinical Audit within the UK National Health Service was introduced in 1989. Audit with reference to radiotherapy physics was an obvious application especially in the wake of major radiotherapy incidents that had occurred within the UK during the 1980s.
National Photon Audit
This national audit program commenced with the introduction of a minimum megavoltage photon audit. The purpose of this was to set a baseline whereby all radiotherapy departments in the UK would have demonstrated that they had achieved, within a calendar year, a dosimetry standard that is clearly documented and comparable. The aim was to measure a clinically relevant situation using both host and auditors equipment. It was decided that it would be essential to see the comparison between a field, planned on the local radiotherapy treatment planning system (TPS), and the actual radiation dose delivered, measured by the auditors, and corrected for daily output variation. This consisted of a single beam, planned at a specified field size and depth. A calculated dose of 2 Gy was delivered and the actual dose measured. The audit consisted of sufficient mechanical quality assurance (QA) performed to ensure accuracy of set up, followed by measurement of ion recombination factor, standard output, quality index (tissue phantom ratio (TPR) 20/10) as a measure of beam energy and the planned wedge field output. In addition, the use of a spreadsheet meant that the results were available instantly to exclude set up errors, and enable further investigation of any unexpected results. The measured values were all entered into the spreadsheet and a final report was generated with all the comparisons.
Output
This is the comparison between the host and auditors values for the standard output. The majority were at 6MV. Most values were within 1 per cent of each other. Just one department showed a disagreement greater than 2 per cent.
Energy
This is the comparison between the host and auditors values for the TPR 20/10 value (see diagram) Again 67 per cent of the measurements were at 6MV. Most values were within 0.5 per cent of each other with one department varying from the auditor by greater than 1.5 per cent.
575

Photon Energy by Department Planned Wedge Field by Department
Planned Wedge Field
The majority of values are negative, meaning that less than 2Gy is actually delivered. 4 departments show a difference greater than 2 per cent with 2 of those greater than 3 per cent (see diagram). The mean value overall was -0.49 per cent but the standard deviation was 1.3 per cent. The range of differences is quite broad showing that for the departments who contributed data, the actual dose delivered varies by up to 3 per cent. The 2 departments who demonstrated the largest difference in delivered dose attributed the cause to be the calculation algorithm in use, and perhaps the data, in the planning system.
National Electron Audit
A initial national audit took place in 1996 and a new minimum electron audit has been performed between summer 2009 and summer 2010. This is a national audit to be delivered via regional audit groups which will then give a picture of the accuracy of electron dosimetry, to compare with the results published in 1997.
National IMRT Audit
The uptake of IMRT has been slow in the UK, despite national recommendations1 and expectations that it should be clinically implemented. Only a small number of radiotherapy departments in the UK are using IMRT regularly even though all departments have had the equipment capability for some time. Difficulty accessing external validation is a significant barrier for centres wishing to progress towards this treatment modality. As a consequence, the National Radiotherapy Implementation Group (NRIG), who wish to encourage the wider take up of routine IMRT within the UK, has commissioned an IMRT audit. The expectation is that this national audit is an independent check on the efficient implementation on IMRT in the UK which will identify problems in modelling and delivery.
Conclusion
Within radiotherapy in the UK, there is an established audit network, which if utilised properly and fully would allow institutions to not only demonstrate compliance with national standards, but also provide assurance that patients are receiving the prescribed dose accurately. The audit network will ensure accurate basic radiation dosimetry and also be the means of motivation to modernise techniques and enable support from peers in so doing. Research and development, modernisation and application of state-of-the art techniques from all specialities in Medical Physics for the benefit of radiotherapy patients are key goals; this must however be accompanied by robust audit methodologies.
REFERENCE
[1] BRITISH INSTITUTE OF RADIOLOGY "Development and Implementation of Conformal Radiotherapy in the United Kingdom" The Royal College of Radiologists, London, UK (2002)
576

IDOS, Vienna, 9-12 November 2010 E2-CN-182, Paper No 125
The role of dosimetry audits in radiotherapy quality assurance: The 8 year experience in Greek radiotherapy and brachytherapy centers
C. J. Hourdakis, A. Boziari
Greek Atomic Energy Commission (GAEC), Athens, Greece.
E-mail address of main author: [email protected]
Twenty six (26) radiotherapy (RT) centers (public and private) operate in Greece up to date (Apr. 2010), where 36 linacs and 8 Co-60 teletherapy units are being used, producing 64 photon beams (Co60, 6-23 MV) and 126 electron beams (4-21 MeV) in total. Furthermore, 7 HDR hi 92 and 2 MDR/LDR Csl37 remote afterloading brachytherapy systems operate. The Ionizing Radiation Calibration Laboratoiy (IRCL) of the Greek Atomic Energy Commission (GAEC) runs dosimetry audits in all Greek radiotherapy centers by means of on-site visits, in order to assess the dose accuracy, to identify and resolve problems on dosimetiy, to provide intercomparisons to hospitals and disseminate the IAEA TRS 398 protocol [1,2], Additionally, the GAEC's IRCL calibrates the reference dosimetiy equipment of all RT centers, in terms of absorbed dose in water at Co60 beam quality and air kerma strength at Irl92 qualities [3].
The GAEC's dosimetry audit is a continuous process: The 1st round has been completed for the photons beams (2002 - 2006), electrons (2002 - 2008) and brachytherapy (2006-2009). The 2nd round is at the final stage for photons (2006-2010) and in progress for the rest, while a 3rd round for photons has already been initiated. The audit results for the photons 1st round have been published in [4]. This work presents the results of these audits and focuses on the improvements of RT centers' dosimetiy during the successive audit rounds.
The dosimetry audits took place by means of on-site visits, where certain parameters of the beams were measured. The functional performance characteristics of the irradiation units were assessed, through mechanical and radiation tests, relative dosimetry measurements, i.e. TPRao.io R50 and PDD were performed and the dose in water Dw(z) was determined according to IAEA TRS 398 dosimetry code of practice. The dosimetry equipment used for the measurements has being calibrated at the GAEC's IRCL against the reference equipment, which provide traceability to the BIPM. For the brachytherapy beams the air kerma strength was measured using well type ionization chamber, which has been calibrated in LNE-LNHB primary standard laboratoiy.
For each photon or electron beam, the measured dose at the reference depth in water (DM) was compared to the relevant dose value stated by the radiotherapy center (Ds) and the ratio r = Ds/ Du as well as the % relative deviation dr = / ( D s / D M ) - l]xl00% were recorded. For brachytherapy, the Kair strength values were recorded. The deviations, d, were compared to the actions levels of ±3% (preventive actions needed) and ±5% (immediate corrective actions needed). The uncertainties of measurements for photons, electrons and brachytherapy were 0.8%, 1.0% and 1.5% respectively at 1 SD (k=l, with 68% confidence level approximately).
a. Photon beams: The average (from all assessed beams) values of the ratio r were 0.990 ± 0.021, 0.996 ± 0.013 and 1.000 ± 0.057 for the three audit rounds respectively. The ranges of the r values (i.e. rinax- rmin) were 0.106, 0.059 and 0.013 for the three audit rounds respectively, indicating that the spread of r values was decreased successively between the rounds. The % number of beams with deviations, | dr | < 3% were 79.2% ( Ist round) and 96.9% (2nd round), the beams with deviations within 3%< | dr | <5% were 16.7% (1st round) and 3.1% (2nd round), and with j dr | > 5% were 3.1% (1st round) and 0.0% (2nd round). Only 4 of the beams exhibited detectable (i.e. over the uncertainty of measurement) worse dose accuracy at the 2nd than at the 1st round; however, the differences between 2nd and 1st round were less than 1.6%.
577

The main sources of discrepancies in photon dosimetry were: lack of recent check/calibration of photon beams; malfunctioning of optical distance indicator and laser; errors of effective point of measurement; lack of recent measurement of TPR20)i0-
b. Electron beams: 140 and 38 electron beams were assessed at the 1st the 2nd rounds respectively (the 2ud is still in progress). The average values of the ratio, r were 0.998 ± 0.047 and 0.994 ± 0.028 for the 1st and 2nd audit rounds respectively. The ranges of r (i.e. rmax- rmin) were 0.408 and 0.091 respectively; the spread of r values was decreased successively. During the 1st round, 76.4%, 10.7% and 12.9% of the electron beams showed deviations | dr | < 3%, 3%< | dr | < 5% and | dr | > 5% respectively. As expected, larger deviations, dr exhibited the lower and the higher energy electron beams, where the dosimetry is more error prone. All major deviations (i.e. j dr | > 5%) recorded during the 1st audit round were corrected or eliminated. However, the 2,ld round recorded 10 beams which exhibited worse detectable (i.e. over the uncertainty) dose accuracy than at the 1st
round. The main sources of discrepancies in electron dosimetry were: the conversion of ionization to dose depth curves in PPD measurement; the measurement of R50; the effective point of measurement zref; lack of recent check/calibration of electron beams.
c. Brachytherapy: 7 HDR Irl92 and 2 MDR/LDR Csl37 brachytherapy systems were assessed; the average values of the ratio, r were 1.002 ± 0.009 and 1.002 respectively. The ranges of the r values (i.e. rmax- rmin) were 0.028 and 0.007.
The dosimetry quality audits with on site visits have been proved to be a very useful tool for improving the quality in radiotherapy. Guidance and recommendations had been provided to the hospitals to improve accuracy, to correct pitfalls and to eliminate sources of errors. An improvement in dose accuracy has been recorded during the successive rounds of the audit. These audits succeeded to disseminate the IAEA TRS 398 dosimetry protocol at all radiotherapy centers, achieving homogenization and consistency of dosimetry within the country.
REFERENCES
[1] INTERNATIONAL ATOMIC ENERGY AGENCY (IAEA), Absorbed dose determination in external beam radiotherapy : An international Code of Practice for dosimetiy' based standards of absorbed dose to water, Technical Report Series 398, 2000
[2] INTERNATIONAL ATOMIC ENERGY AGENCY (IAEA), Implementation of the international Code of Practice on dosimetry in radiotherapy (TRS398) : Review of testing results, TECDOC-1455,2005
[3] INTERNATIONAL ATOMIC ENERGY AGENC Y (IAEA),, Calibration of photon and beta ray sources used in brachytherapy, IAEA TECDOC 1274, 2002.
[4] HOURDAKIS C-J and BOZIARI A. Dosimetry quality audit of high energy photon beams in greek radiotherapy centers. Radiother Oncol, Apr;87(l):132-41, 2008.
578

IDOS, Vienna, 9-12 November 2010 E2-CN-182, Paper No 125
Good practice for QA of nuclear medicine equipment:
National guidance in Finland
R. Bly, H. Jarvinen, H. Korpela
STUK - Radiation and Nuclear Safety Authority, Helsinki, Finland
E-mail address of main author: ritva.bly@stuk,fi
Introduction
The EC Medical Exposure Directive (MED) requires member states to ensure that appropriate quality assurance (QA) programmes, including quality control measures are implemented by the holder of the radiological installation. Clinical audits must be carried out in accordance with national procedures. Detailed requirements on QA in nuclear medicine in Finland have been given in the guide ST 6.3, Use of Radiation in Nuclear Medicine, 2003. Clinical audits and the survey by STUK in 2006 showed that QA was carried out in various ways and there was a need for further guidance to ensure a consistent approach [1], To establish good practice in Finland and to harmonize the routine QA at nuclear medicine (NM) hospitals STUK collboratively developed and published guidance on quality control (QC) of gamma cameras, coincidence cameras, SPECT-CT and PET-CT cameras, gamma probes, activity meters and gamma counters of all the types in use in Finland [2], Optimal use of all possible national resources for establishing guidance required good co-operation between authorities and radiation users [3].
Methods
The guidance was established by STUK and a joint working group of 12 members. They represented expertise in medical physics, nuclear medicine and radiography and also clinical auditing. The working group utilized the NEMA standards (NU 1-2007, NU 2-2007 and NU 3-2004), the IEC standards, IAEA guidance [4,5,6] and publications of professional societies, for example IPEM [7] and EANM [8]. The draft guidance was discussed in national conferences in 2005, 2007 and 2009 organized by the STUK. Users were encouraged to give comments and suggestions before the guidance was finalised.
Clinical audits are carried out by two private companies in Finland. Auditors are experts in NM and an auditing team consists of a physician, a medical physicist and a radiographer. Auditing frequency is five years. Regulatory inspections are earned out every three years.
Results
QC of different imaging or measuring modalities is presented in separate chapters of the published guidance. The standards are presented in the guidance because they are especially useful for acceptance testing. The main focus is however routine QC during use of the equipment. The recommended QC tests for NM equipment are shown in seven tables, one table for each modality and one table for QC of softwares in use. In each table there are three columns: a test, a recommended frequency of the test and comments or explanations.
The guidance is general and suitable for all manufacturer's equipment. However, the equipment specific guidance given by the manufacturer is emphasized. The relative importance of the parameters and the frequency of the tests are dependent on the type of use of the equipment. For example in dynamic examinations it is important to have a good count rate performance. If the camera is used for SPECT studies the field uniformity is the critical parameter.
579

The guidance gives practical advice for establishing a QC protocol for each individual NM equipment. As national good practice, it will be also be used as a reference in clinical audits.
Conclusions
Each hospital needs a QC programme for their NM equipment. However, national good practice for QA has to be agreed taking into account the regulatory requirements. External audits are also needed to maintain good quality of NM examinations and treatments. Co-operation of regulators, users and clinical auditors is therefore of importance when establishing national guidance on good practice for the QA of NM equipment. The national guidance provides practical advice to the users and can be used as a national reference of good practice in clinical audits.
ACKNOWLEDGEMENTS
The work was conducted in co-operation with Helsinki University Hospital, Oulu University Hospital, Tampere University Hospital, Turku University Hospital, Kuopio University, Joensuu Central Hospital, Mikkeli Central Hospital and Satakunta Central Hospital.
REFERENCES
[1] KORPELA, H., PARKKINEN, R.: Survey on quality control measurements of nuclear medicine imaging equipment in Finnish hospitals Proceedings of an International Conference 1 3 - 1 5 November 2006, Vienna, Austria LAEA-CN-146, p. 552-553
[2] STUK QC of nuclear medicine equipment, tiedottaa 1/2010 (in Finnish) [3] PARKKINEN, R., JARVINEN, H.: Impelmentation of QA in medical radiological practices: A
national cooperation model. Proceedings of an International Conference 13-15 November 2006, Vienna, Austria IAEA-CN-146, p. 114-115
[4] INTERNATIONAL ATOMIC ENERGY AGENCY (IAEA) Safety Reports Series No. 40. Applying Radiation Safety Standards in Nuclear Medicine. 2003
[5] INTERNATIONAL ATOMIC ENERGY AGENCY (IAEA)Nuclear Medicine Recources Manual., 2006
[6] INTERNATIONAL ATOMIC ENERGY AGENCY (IAEA). Quality assurance for PET and PET/CT systems, IAEA Human Health Series No 1., IAEA 2009
[7] INSTITUTE OF PHYSICS AND ENGINEERING IN MEDICINE (IPEM) Report No. 86. Quality Control of Gamma Camera Systems. Institute of Physics and Engineering in Medicine, York, 2003
[8] EUROPEAN ASSOCIATION OF NUCLEAR MEDICINE, (EANM) Physics Committee. Routine Quality Control Recommendations for Nuclear Medicine Instrumentation., V080509 (draft)
580

IDOS, Vienna, 9-12 November 2010 E2-CN-182, Paper No 125
Dose quality audits activity via mailed TLDs in the last five years
(2005 - 2009)
K. Sergieva, Z. Bouchakliev
SSDL Sofia, Queen Giovanna University Hospital, Sofia, Bulgaria
E-mail address of main author: [email protected]
The accuracy in the dose determination in radiotherapy should be as high as possible due to the critical balance between tumor eradication and complications in healthy organs. This supposed the need of the QA programme in dosimetry of the radiotherapy beams. A fundamental step in any dosimetiy QA programme is an audit performed by an independent external body, a national or international organization. [1]
The aim of the paper is to present the activity of the SSDL Sofia in the field of the Dose Quality Audit via mailed TLDs in the last five years (2005 - 2009).
The IAEA's Dosimetry Laboratory is the central laboratory of the IAEA/WHO Network of SSDLs and provided range of the services to Member States. The SSDL Sofia is regularly participated in the services using thermoluminescent dosimeters (TLDs) in the form of powder as the type of mailed dosimeter in the reporting period are namely:
IAEA/WHO TLD postal dose quality audits for therapy level dosimetry for SSDL. In 2005 we are participated with two "Co beams and with one "'Co beam in the other years of the reporting period 2005 - 2009.
IAEA TLD dose quality audits for radiation protection level dosimetry for SSDL. The Lab is taken part with gamma rays from 137Cs in the first TLD run during March - May 2008.
National TLD dose quality audits in reference and non-reference conditions off - axis for 60Co radiotherapy beams is performed by External Audit Group (EAG) in the period 2006 - 2009. EAG has been organized the TLD Audit with a new modified IAEA TLD holder for measurements in the non - reference conditions off axis since 2006. The methodology of the TLD Audit is comprehensive reported in [2],
Results from IAEA/WHO TLD postal dose quality audits for therapy level dosimetry for SSDL.
The results of the SSDL Sofia participation during the review period 2005 - 2009 are represented in Figure 1, where ratios of the IAEA's dose to that stated by SSDL are plotted for 60Co gamma rays.
581

IAEA/WHO TLD Postal Dose Quality Audit's Results for SSDL (2005 - 2009)
1,04
1,02
O l/l 10 S 1,00 o _1 I-Q
0,98
0,96 2004 2005 2006 2007 2008 2009 2010
Years of the participation
FIG. L Results from the IAEA/WHO TLD Audit for SSDL-Sofia for the delivery of dose to water under reference conditions. Data in the graph correspond to the ratio of the dose determined by the IAEA from the TL-response (Dtld) to that stated by the SSDL (DSSDL)- Each data point corresponds to the average of three dosimeters. The deviations between the doses stated by us and the doses measured at the IAEA are as follow as: - 0.2% and - 0.7% (2005), - 0.7% (2006), - 1.3 % (2007), 0.0% (2008) and -1.7%> (2009). The all results are in the acceptance limits of ±3.5 %>.
Results from IAEA TLD dose quality audits for radiation protection level dosimetry for SSDL -results. The accuracy of the beam output for gamma rays from 137 Cs is checked by participation in the first TLD run for 2008. The ratio Kair (SSDL)/ Kair (IAEA) is 0.94. The result is in the tolerance limit ±7.0 %.
Results from the National TLD dose quality audits in reference and non-reference conditions off - axis for 60Co radiotherapy beams. The total of the 17 beams are checked according to the limitation of the staff resources. The reference beam output, open and wedged field profiles and ratios D(20X20)/D( 10X10) and Dwedged(R)/Dopen(R) are estimated using TLD measurements. The results of the National TLD audit in reference and non-reference conditions off - axis are given in Figure 2. The ratios between SSDL TLD - measured dose D(TLD) to the participant - stated dose D(stated) in reference conditions and in non - reference conditions off - axis for open and wedged fields are illustrated in Figure 2.
FIG. 2: Data points are represented are two TLDs for the reference and one TLD for non-reference conditions. The statistical distribution of the ratios D(TLD)/D(stated) is: N=187, mean=1.008 ± 0.020 (one standard deviation).
582
The statistical distribution of the TLD measured relative parameters to those stated by participants, i.e. off - axis ratios for open and wedged fields at - 5 and +5 cm, relative output factors for open fields and wedged factors is: N=136, mean=1.002 ± 0.022 (one standard deviation). The checked beams are in the acceptance limit of ±5% during the reported period. The Quality Audit (QA) is a control of the Quality Control System (QCS). Therefore the QA should be expended by international and national organizations in the directions to cover the high requirements for accuracy by advanced modern radiotherapy techniques like as a complete PARSPORT QA process including both the dosimetry audit and pre-trial exercises leading to an IMRT credentialing program. [3]
REFERENCES
[1] IZEWSKA. J, SWENSSON. H, IBBOTT. G. Worldwide Quality Assurance Networks for radiotherapy dosimetry. Proceedings of an International Conference on Quality Assurance and New Techniques in Radiation Medicine, Organized by the IAEA, Vienna, 1 3 - 1 5 Nov 2006, 139- 155.
[2] IZEWSKA J, GEORG D, BERA P, THWAITES D, ARIB M, SARAVI M, SERGIEV A K, LI K, YIP FG, MAHANT AK, BULSKI W. A methodology for TLD postal dosimetiy audit of high-energy radiotherapy photon beams in non-reference conditions. Radiother Oncol. 2007;84(l):67-74.
[3] CATHARINE H. CLARK, VIBEKE NORDMARK HANSEN, HANNAH CI I AMI.HR et all. Dosimetry audit for a multi - centre IMRT head and neck trial. Radiother Oncol 2009; 93:102 -108.
583


IDOS, Vienna, 9-12 November 2010 E2-CN-182, Paper No 125
THE IAEA/WHO TLD postal dose audit programme for radiotherapy in the Russian Federation
T. Krylova3
a Association of Medical Physicists in Russia, Moscow, Russia
E-mail address of main author: [email protected]
The International Atomic Energy Agency (IAEA), together with the World Health Organization (WHO) have been conducting postal TLD audit for verifying calibration of radiotherapy beams of linear accelerators and cobalt machines in developing countries for more than 40 years [1, 2], Russia participates in this programme for ten years. During this time more than 100 radiology departments took part in TLD external audit, some of them more than once.
Unfortunately, only 69% of results are corresponding to the established acceptance limit of the relative deviation between the participant's stated dose and the TLD determined dose (which is ±5%) for comparison with more than 90 % of results within the 5% limit for other countries.
Dosimetry and Medical Radiation Physics Section in IAEA, which organizes this programme, analyzes TLD results together with information provided by the participants, that helps to trace the sources of discrepancy between the TLD measured dose and the user stated dose.
Unsatisfying results relate not only to wrong calibration of the machine. A lot of mistakes are caused by incorrect understanding of the irradiation procedure, for example wrong placement of dosimeters or confusion in definition of SSD/SAD. Other reasons are:
• incorrect calculation of the dose • wrong data about characteristics of the machine or source • obsolete dosimetry equipment • huge amount of Co-60 units, which results are usually worse than linacs' • insufficient knowledge of staff
In Russia, more attention should be paid to follow-up programme for hospitals, whose results were found outside the 5% range, especially as the IAEA experience shows the increase of dosimetry quality in developing countries exactly due to follow-up irradiation.
For the resolution of problems related to the radiotherapy beam calibration and for improving the quality of dosimetry in Russia at least two more points besides foresaid should be considered.
Practically no one uses new codes of practice based on standards of absorbed dose to water, although the proper implementation of dosimetric protocols would correct most of the mistakes. And at the same time Secondary Standart Dosimetiy Laboratories should be organized to apply and promote secondary standards in the calibration of dosimetry equipment and to maintain high level of dosimetric accuracy all over the country.
Using the conclusions of the IAEA/WHO TLD audit programme and making an adjustment to Russian reality the Association of Medical Physicists in Russia can create recommendations that will help to improve the quality of dosimetry in Russia.
585

REFERENCES
[1] IZEWSKA J., ANDREO P., VATNITSKY S„ SHORTT K.R. The IAEA/WHO TLD postal dose quality audits for radiotherapy: a perspective of dosimetry practices at hospitals in developing countries. Radiotherapy and Oncology, 69 (2003), 1 (October), 91-97
[2] IZEWSKA J., ANDREO P. The IAEA/WHO TLD postal programme for radiotherapy hospitals. Radiotherapy and Oncology, 54 (2000), 1 (January 01), 65-72
586

IDOS, Vienna, 9-12 November 2010 E2-CN-182, Paper No 125
General audit strategy using large scale diagnostic radiology examination data
P Charnock, R Wilde, J Fazakerley, R Jones, BM Moores
Intergrated Radiological Services ltd, Liverpool, UK
E-mail address of main author: [email protected]
During 2008 and 2009, a method was devised for the collection of large scale patient dose data through means other than manual collection by radiographers [1], Data was collected direct from the hospital Radiology Information System (RIS) and entered into a bespoke database system [2] for analysis. Mean doses were then compared with national diagnostic reference levels [3,4], and local diagnostic reference levels could be established.
Preliminary studies showed that although further work would be required with the data, clinical audit would be possible [5] and perhaps level A Quality Assurance (QA) tests would be possible. This paper will show how all the componants from data collection to reporting of patient dose, clinical and QA audit fit together and would operate over a large number of hospitals, even at national or international level (Figure 1).
Whilst provision of data from RIS is a valid and working approach, it has been found that there is still the human element entering the data. For example, from a total of 58815 data records submitted, it was noted that 14.2% were of insufficient quality to audit further. This lead to the investigation of data from other sources. Other studies have shown that data can be retrieved from the DICOM header of an image [6] and this method is currently being trialed in the North West of England.
Before data is entered into the database, it is error checked against a number of criteria. The first criteria is to confirm that all the basic data that is required to perform a patient dose audit is included [7]. In the case of RIS data, the statistics for the number of incomplete records can be reported to the department as part of clinical audit. A second form of filtration is then used to remove records where data is present but is clearly in error. A two stage approach is used whereby an upper limit of kV and mAs is chosen based on generator practicalities, and then Chauvenet's criteria [8] is used to further refine the data. Again, the statistics are reported back to hospital management.
Following filtration, the data can then be used to perform patient dose audits both for comparison with national diagnostic reference levels and the establishment of local diagnostic reference levels. This has successfully be trialed in the North West of England [9] and a current study of 731,653 records is under way in addition to the service being rolled out to North Lincolnshire. A major RIS supplier in the UK has also been approached to collaborate in rolling this service out to a large number of hospitals in the UK by supplying data directly (Figure 2)
Preliminary and as yet unpublished work indicate that the data can also be used to fulfill national quality assurance requirements. Clinical examinations have been mapped to the equivalent QA test from IPEM 91with the data from those examinations used as an indicator of equipment performance.
With this system in place, a number of large scale audits are possible that employ actual patient data. Use of DICOM will remove human element but where the human element cannot be removed, it is possbible to audit the actual data entry process. QA is possible using the patient as the phantom. All of this will help medical physicists underpin radiology and demonstrate complience with UK regulations [10,11]
587

FIG 1 - Flowchart of data from hospital systems to audit reports
FIG 2 - Flowchart showing data across multiple sites
REFERENCES
[1] WILDE R et al, Automating patient dose audit and clinical audit using RIS data. World Congress 2009, Munich
[2] COLE PR et al, Computer applications in radiation protection. Radiat. Protect. Dosim., 1995: 57(1-4): 203-206
[3] INSTITUTE OF PHYSICS AND ENGINEERING IN MEDICINE (IPEM) Guidance on the Establishment and Use of Diagnostic Reference Levels for Medical X-Ray Examinations, 2004: Report 88
[4] HART D, HILLIER MC and WALL BF. Dose to Patients from Radiographic and Fluoroscopic X-ray Imaging Procedures in the UK - 2005 Review. Health Protection Agency, HPA-RPD-0292005, 2007. ISBN 9780859516006
[5] CHARNOCK P et al, Radiology workload analysis: Role and relevance in radiation protection in diagnostic radiology. World Congress 2009, Munich
[6] VANO E et al, Patient dosimetry and image quality in digital radiology from online audit of the X-ray system. Radiat. Protect. Dosim., 2005: 117(1-3): 199-203
[7] FAZAKERLEY J et al. The development of a 'gold standard' patient dose audit data set. IPEM Proceedings of the 14h Annual Scientific Meeting, Bath, UK, pp61
[8] CHAUVENET'S CRITERION [9] FAZAKERLEY J et al, Application of Statistica for Analysis of Large Patient Dose Data Sets.
Third Malmo Conference on Medical Imaging, Malmo 2009 [10] THE IONIZING RADIATION (Medical Exposure) Regulations 2000, SI 2000 No 1059.
London: HMSO 2000. [11] THE IONIZING RADIATION REGULATIONS 1999, SI1999 No 3232. London: HMSO 1999
588

IDOS, Vienna, 9-12 November 2010 E2-CN-182, Paper No 125
Mailed megavoltage photon TLD audit program for radiotherapy providers in Australia
C. P. Oliver, D. J. Butler and D,V. Webb
Australian Radiation Protection and Nuclear Safety Agency (ARPANSA)
E-mail address of main author: [email protected]
ARPANSA provides a megavoltage photon thermoluminescence dosimetry (TLD) audit service for radiotherapy providers in Australia. The service has been continuously offered since 2007 and has been run on a number of occasions prior to this. The main purpose of the audit is to provide an independent check of the reference dosimetry being performed in participating radiotherapy centres. Such checks are an important part of the quality assurance program for a radiotherapy provider. The audit results of centres whose dosimetry is based upon ARPANSA calibrated ionisation chambers is of interest to ARPANSA. It provides a check on the calibration factors being issued for secondary standard chambers assuming that the dosimetry protocol has been followed correctly.
The audit is based on the program which has been run by the IAEA/WHO for many years[l]. Participants are mailed a PMMA irradiation jig for simple experimental setup. The TLD material is LiF:Mg, Ti type TLD-100 (Harshaw). It is contained within polyethylene capsules of length 20mm and diameter 3mm. The irradiation jig is set up in the client's water phantom and contains slots for simple positioning of the TLD capsules at depths of 5, 10 or 20cm. The centre is asked to deliver 2 Gy absorbed dose to water to the capsule in reference conditions (100cm SSD/SAD, 10cm x 10cm field size, 10cm (or 5cm) depth in water phantom). Centres can also perform beam quality measurements by irradiating two capsules at depths of 10cm and 20cm to provide a D2O,IO or TPR2O,IO measurement for constant SSD or SAD setup respectively.
The jig and the materials are then mailed back to ARPANSA and the dose to the capsules calculated using the following formula
D = M'N\fiadf\\o\'feagy'f]m
where Mis the mean of the TLD readings, N is the calibration coefficient of the TLD powder, and the factors fyd, /hoi, fengy, fim are corrections for fading, TLD holder, energy correction and linearity correction respectively. Each capsule contains approximately 155mg of powder which corresponds to nine readings per capsule on a manual Teledyne System 310 TLD reader.
Twenty four separate audits have been completed since 2007. Beam output measurements have been made on a total of 61 photon beams which is approximately 25% of all photon beams in Australia. Measurements have been made for energies from 6MV to 23MV with the most common being 6, 10 and 18MV. The results are shown in Figure 1. The average ratio of clinic stated beam output to ARPANSA measured beam output is 0.997. A total of 20 beam quality measurements have also been performed since 2007. The average ratio of clinic stated beam quality to ARPANSA measured beam quality is 1.014. Further investigation of the holder correction factors is being undertaken to investigate this deviation.
589

0) Cfi o TJ TJ 0) >_ 3
TJ « d) CD - (1)
d) t/> o TJ
5 £ CD +J Cfi
.E ^ < 3 2
DC <
1.06
1.04
1.02
1
0.98
0.96
0.94
• • • •••
• •
•
V « • • V * •
• •
• • • • •
•A
h'K] 1, Ratio of clinic stated and ARPANSA measured beam output for all beam energies.
Almost all the results have been within the expanded uncertainty of the TLD method of 4.2% (k=2). The one outlying result was repeated with the subsequent measurement being well within the expanded uncertainty. The most recent results will have an uncertainty greater than 4.2% due to the calibration coefficient being determined using capsules irradiated by ARPANSA's new linear accelerator. This was previously done using a Co-60 source however this was not available in 2010 due to a new Co-60 source being installed at ARPANSA. The most recent results show a trend above unity. Further results need to be obtained to determine whether this is a systematic shift or not.
REFERENCE
[1] IZEWSKA, J., BERA, P., VATNITSKY, S„ IAEA/WHO TLD postal dose audit service and high precision measurements for radiotherapy level dosimetry, Rad. Prot. Dos. 101 (2002) 387-392
590

IDOS, Vienna, 9-12 November 2010 E2-CN-182, Paper No 125
Dosimetry audits based on NCS report 18: Assessment of absorbed dose to water in external beam therapy
T. Perik3, A. Aalbers L. de Pre M. Dwarswaardc, K. Feyei . J. Hermans6, E. Loefff, J. Martens6, A. Monseuxg, E. Peeters-Clevenh, N. Planteydt1, S. van het Schip1, F. Sergen^, F. Wittkiimper3
aNKI-AVL, Amsterdam, The Netherlands b VSL - Dutch Metrology Institute, Delft, The Netherlands c MCA, Alkmaar, The Netherlands dAZ St. Maarten, Duffel, Belgium 6Maastro Clinic, Maastricht, The Netherlands
ErasmusMC, Rotterdam, The Netherlands 8 CHL\ Montigny-le-Tilleul, Belgium hMST, Enschede, The Netherlands
ZRTI, Vlissingen, The Netherlands J Catharina Hospital, Eindhoven, The Netherlands kCMSE, Namur, Belgium
E-mail address of main author: [email protected]
In 2008 the Netherlands Commission for Radiation Dosimetiy (NCS) published a new code of practice (NCS-18[1]) for the absorbed dose determination in high energy photon and electron beams. NCS-18 replaces NCS-2'2 and NCS~5[3] for absolute dosimetry of clinical photon and electron beams, respectively. In contrast to NCS-2 and -5, it is based on absorbed dose to water calibration coefficients in 60Co beams. Most radiotherapy centres in Belgium and the Netherlands are currently implementing NCS-18. To monitor and verify the implementation of NCS-18, the Dutch Association of Medical Physics Engineers (NVKFM) in collaboration with the NCS established the NCS-subcommittee Dosimetiy Audits. The aim of the audit is to verify local measurements of absorbed dose under reference conditions. Initially only clinical photon beams are being audited. In total 26 radiotherapy centres have been audited before the summer of 2010. In this study preliminary results of the audits until April 2010 are reported. Measurements are performed for two or three photon beams at one linear accelerator at each centre. The beam quality index and the absorbed dose to water are determined. Additionally, the correction factor for recombination for the audit chamber is measured in each photon beam. The beam quality index is used to calculate the beam quality correction factor, kg, according to NCS-18. The audit measurements are performed by an NCS audit team using dedicated equipment. The absorbed dose to water is independently determined for all selected photon beams by staff members of the radiotherapy centres using local measurement equipment. The audit equipment includes an electrometer (PTW TN10023 Webline), a Farmer type graphite ionisation chamber (PTW TN30012) and a water phantom (PTW T41033 MP1). Furthermore a digital barometer, digital thermometers and a humidity sensor are used. All measurement equipment is repeatedly calibrated at VSL, the Dutch Metrology Institute. The bar graph below shows preliminary results of 29 photon beams measured in 12 radiotherapy centres using NCS-18. The audit results are given as relative deviations of the absorbed dose to water determined by local staff compared to the corresponding values determined by the NCS team. Each bar represents an interval of relative deviations (0.5 %) and the corresponding frequencies are stated.
591

The specification of the beam quality is divided in three ranges; low (4 and 6 MV), medium (10 MV) and high (15, 18 and 23 MV). Results with deviations smaller than 1.5 % are considered acceptable. Deviations larger than 1.5 % required immediate investigation by the audit team. The preliminary results show no deviations larger than 1.3 % with respect to the audit measurements for NCS-18. At one institute, a deviation larger than 1.5 % was found. This institute still used NCS-2, and is therefore not included in the graph. Additional measurements, performed by the institute, showed that PDD values, used for the measured energies, contained errors at larger depths. After implementing the correct PDD values the deviations from the audit were within 1.5%. In conclusion, based on these preliminary results, the implementation of the NCS-18 code of practice for photon beams introduced no significant deviations in absolute dose determination. However, the audit did show that evaluation of local absolute dosimetry methods is necessaiy to ensure uniformity between institutes.
1 0 -
9 -
8 -
7-
o a) 5 -ET aj 4 _
u.
3 -
2 -
1 -
0--2 0% -1.5% -1.0% -0.5% 0.0% 0.5% 1 0% 1.5% 2.0% Deviat ion Bin size = 0.5%
FIG. 1. Binned results of the audit, showing the frequencies of deviations expressed as the measurement performed by the institute normalized to the reference measurement performed by the
audit team.
REFERENCES
[1] NCS REPORT #18, Code of practice for the absorbed dose determination in high energy photon and electron beams, Delft, The Netherlands, 2008
[2] NC S REPORT #2, Code of practice for the absorbed dose determination in high energy photon beams, Delft, The Netherlands, 1986
[3] NCS REPORT #5, Code of practice for the absorbed dose determination in high energy electron beams, Delft, The Netherlands, 1989
Deviation to Audit
] X low 0.626 <>0.684 ] X med 0.727 <>0.740 ] X high 0.754 <>0.779
Avg: -0.3% StDev: 0.6%
Max: -1.3%
592

IDOS, Vienna, 9-12 November 2010 E2-CN-182, Paper No 125
Independent dosimetry audits for radiotherapy practices in the Syrian Arab Republic using standard instrumentation kit
M. Alnassar, M. Hammudi, M. A, Bero
National Radiation Metrology Laboratory (NRML), Atomic Energy Commission of Syria, P.O. Box 6091, Damascus, Syria.
E-mail address of main author : [email protected]
Quality assurance and dose audits in radiotherapy application are important procedures for optimizing treatment and avoiding any undesirable consequences. Accurate dosimetry calculations as well as radiation dose distribution measurements arc essential parts of treatment planning and outcome verifications [1], Aiming to improve the accuracy and consistency of clinical radiotherapy dosimetry in hospitals worldwide, the International Atomic Energy Agency (IAEA), together with the World Health Organization (WHO) have been performing mailed thermo-luminescence dosimetry (TLD) audits in order to verify external beams calibration for radiation therapy departments in developing countries.
Taking part in this program, the National Radiation Metrology Laboratory (NRML), which is the Syrian SSDL, has initiated a pilot national programme of dosimetiy audits that includes, in phase one, a few radiotherapy centers. The pilot programme will be expanded to the national programme to include all radiotherapy departments in Syria. Verifying the dosimetry and calibration methodology used for radiotherapy beams will be accomplished according to the IAEA-TECDOC-1543 [2]. This programme is composed of a planned on-site team visit (Quality Assurance Team in Radiation Oncology, QUATRO) to the radiation treatment centers in Syria and independent measurement of dose rate using transportable standard instrumentation kit.
The kit consists of a therapy ionization chamber together with an electrometer (dosimeter) type Unidos from PTW. It is also equipped with a water phantom 1 5 x 1 5 x 1 0 cm' with a hole a depth 5 g/cnr to place the ionization chamber. Other tools and measuring instruments such as a thermometer, barometer, accurate distance measuring device and a radiation survey meter are also included. The dosimetry system described above was firstly calibrated at the manufacturer accredited dosimetry laboratory with the calibration coefficient traceable to the BIPM. It was then re-calibrated in terms of air kerma [3] and absorbed dose to water [4] at NRML against our national reference standards. Calibration experimental results were used to obtain the following calibration factors:
Nk = 49.31 mGy/nC NIXW = 52.81 mGy/nC
As a first step, two " Co radiation fields were checked using the standard kit. The absorbed dose to water was measured at a distance SCD = 100 cm with the field size 10x10 cm2 and at 5 g/cm depth in water. The results of the dosimetry audits for both "'Co fields performed in the box phantom experiment are summarized in the following table.
593

Table 1: A comparison between the locally measured and the independently verified absorbed dose to water.
Radiation Beam Dose, Dw [mGy] Dw measured in the audit [mGy] Ratio
Beaml: 6UCo 173.56 175.4 ±2.1 0.989
Beam2:6UCo 270.81 272.7 ±3.2 0.993
Beam3: 6 MV Linac 1000 988 ±2.8 1.012
Ambient conditions that affect the measurements were also checked and a comparison between clinically used values and independently measured parameters were summarized for three main factors that is field size, temperature and air pressure, see table 2.
Table 2: Calculated differences in the measurement condition parameters for the studied beams.
Radiation Beam Field size differences [mm] AT [°C] AP [kPa]
Beam J:ht Co 1 0.2 0.3
Beam2:6UCo 1 0.5 0.5
BeamS: 6 MV Linac 1 0.5 0.6
This audit programme is designed to cover all radiotherapy centers in Syria and it will be performed periodically with the possibility of being extended to twice a year test for each treatment beam.
REFERENCES
[1] INTERNATIONAL ATOMIC ENERGY AGENCY, Comprehensive Audits of Radiotherapy Practices: A Tool for Quality Improvement Quality Assurance Team for Radiation Oncology (QUATRO), IAEA, Vienna (2007).
[2] INTERNATIONAL ATOMIC ENERGY AGENCY, On-site Visits to Radiotherapy Centers: Medical Physics Procedures, TECDOC-1543, IAEA, Vienna (2007).
[3] INTERNATIONAL ATOMIC ENERGY AGENCY, Absorbed Dose Determination in Photon and Electron Beams: An International Code of Practice, Technical Report Series No. 277, 2nd edition, IAEA, Vienna (1997).
[4] INTERNATIONAL ATOMIC ENERGY AGENCY: Absorbed Dose Determination in External Beam Radiotherapy: An international Code of Practice for Dosimetry Based Standards of Absorbed Dose to Water, Technical Reports Series No. 398, IAEA, Vienna (2000).
594
IDOS, Vienna, 9-12 November 2010 E2-CN-182, Paper No 125
Testing, commissioning and validating an optically stimulated luminescense (OSL) dosimetry system for mailed dosimetry at the
Radiological Physics Center
J. F. Aguirre3, P. Alvarez3, G. Ibbott3, D. Followill3
3U.T. M.D. Anderson Cancer Center, Radiological Physics Center, Houston, TX, USA
E-mail address of main author: [email protected]
Thermoluminescent Dosimetry has been used extensively by the Radiological Physics Center (RPC) for remote audits of standard output verification for photon beams and output and energy for electron beams. Lithium fluoride (LiF) TLD-100 disposable powder positioned in acrylic blocks has been used by the RPC for more than 30 years. With an acceptance criteria of ±5% for beam output and 5 mm for depth the RPC has evaluated treatment units on an annual or biannual basis. The accumulated data shows that the agreement between the measured dose versus that stated by the institutions has a standard deviation of 1.7 % and under very controlled conditions the agreemen is within 0.7%.
The data from this experience provides a justification to use the dosimeter to flag units with beam output outside 5% although the system may be reliable within 3.5%, that is, two standard deviations from the average expected deviation. TLD powder has an expected uniformity of dose response better than 1.5%, a correction for nonlinearity of up to 10% over the range of 50 to 400 cGy, fading of the stored signal of up to 5.5% in 25 days and energy dependence that requires corrections of up to 7%. Under the best controlled circumstances the agreement between measured and predicted dose for a cobalt beam is better than 1%. The confidence on these results is maintained through a quality assurance program that includes readers, powder, sessions and customer results.
Optically Stimulated Luminescent (OSL) dosimeters have been previously used for personnel dosimetry and tested for dose measurements in the therapeutic range. The general characteristics of the microStar System™ with InLight™ dosimeters to use in the RPC mailed dosimetry program were studied with favourable results and a decision was made to purchase two readers and a batch of InLight nanoDot™ dosimeters, a smaller version of the previ ous design with the purpose of accepting, commissioning and validating it for regular use.
Acceptance of the system was subject to the condition that the performance of the system had to be at least as good as that of the TLD system.
Commissioning an OSL system included the design of a methodology to irradiate the dosimeters, the steps for a reading session, the criteria for the number of dosimeters to be read per session, readings per dosimeter, interspersing of "standard" and "control" dosimeters, important quality control steps, an algorithm to calculate dose, annealing and reading cycles and identification of the important properties of the dosimeters such as depletion, reader dependence, individual dosimeter correction factors, dose response characteristics, signal fading and energy/block corrections.
The validation of the process and an assessment of the accuracy of the system were performed through comparisons with TLD banking on our long experience with the latter. TLD and OSL were irradiated sequentially multiple times with photon and electron beams for a range of energies at our own facility as well as at several other institutions. The results from both dosimeters were compared.
595

Results are presented detailing the dose calculation algorithm, the signal depletion, liearity, fading and energy corrections for OSL, the reading procedures and the calculated levels of agreement between OSL and TLD measurements as well as ion chamber measurements obtained through the validation process performed at eleven test institutions and at the MD Anderson Cancer Center for photon energies (M'CO-23MV) and electron energies (5-23MeY).
REFERENCES
[1] AGUIRRE J, ALVAREZ P, FOLLOWILL D, IBBOTT G. Optically Stimulated Light Dosimetiy: Commissioning of an OSL System for Remote Dosimetry Audits: The Radiological Physics Center Experience. Medical Physics 36: 2591,2009.
[2] AGUIRRE J, TAILOR R, IBBOTT G., STOVALL M. ., Thermoluminescence Dosimetry as a Tool for the Remote Verification of Output for Radiotherapy Beams: 25 Years of Experience, Proc. Int. Symp. Standards and Codes of Practice in Med. Rad. Dosim, IAEA-CN-96/82, Vienna, IAEA. (2002) 191-199
596

IDOS, Vienna, 9-12 November 2010 E2-CN-182, Paper No 125
A system for mailed dose revision in radiotherapy using lithium formate EPR dosimetry
S Olssona, Z Maikeb, P Larssona, A Carisson Tedgrenh t
a Dept of Radiation Physics, Linkoping University Hospital, Sweden
b Dept of Medical Radiation Physics, Linkoping University, Sweden
c Swedish Radiation Safety Authority (SSM), Stockholm, Sweden
With an increasing complexity in radiotherapy techniques, the need for independent dose revisions has increased. This work presents a system under development for mailed dose revision of the complete radiotherapy treatment chain. The intention is to create a means to check the whole chain from CT-scanning, via contouring and dose planning, to positioning and treatment. The system includes a semi-anthropomorphic PMMA phantom (diameter: 20 cm) relevant for the head-and-neck region. Pellet shaped dosimeters can be placed in various positions in the phantom using PMMA tubes prepared by the sending institute. The phantom contains PMMA inserts corresponding to tumour, parotis and medulla in order to make these volumes easily distinguishable for contouring. It also contains inhomogeneities of both Teflon, corresponding to the spinal column, and air. The air cavity can be filled with a plug of foam plastic with density 0.14 g/cm to mimic lung tissue. A transversal slice of the phantom is shown in figure 1.
Medulla 5
FIG 1: Transversal slice of phantom for mailed dose revision
The dosimeters intended for this dose revision system are pellets (diameter 4.5 mm, height 5 mm) made of lithium formate [1], which are analysed by means of electron paramagnetic resonance, EPR. When lithium formate is irradiated, radicals with a net electron spin are formed. The crystalline structure of the material makes the radicals stable over time and the radical concentration, which is recorded by means of EPR, is proportional to the absorbed dose in the material. Signal stability makes EPR dosimetiy attractive for use in mailed dose revisions since it eliminates the need for thorough time schedules as required using thermoluminescence (II,) dosimetry systems. The linear dose response of EPR over a wide dose range (0.2-1000 Gy) is another advantage over TL dosimetry that shows a supralinearity starting around 1 Gy.
597

The sensitivity is lower with EPR than with TL dosimetry, but doses above 2 Gy are sufficient to reach an uncertainty level below 3% (k=l). When irradiating a phantom, doses higher than those used clinically can be used in order to lower the uncertainty level. Lithium formate has a higher sensitivity than the more commonly used material alanine, and is more tissue equivalent regarding density and energy absorption properties. In recent years, EPR dosimetry with lithium formate has been employed for clinical applications, both in external beam therapy [2,3] and in brachytherapy [4].
The described system has been tested locally in a MSc project [5]. The phantom was CT scanned and the reconstructed and measured volumes were compared. They agreed within 2.5% for smaller structures and within 5% for larger structures. The phantom and the structures were contoured in the treatment planning system (Varian, Eclipse) and a dynamic IMRT plan giving 5 Gy to the target was created. The plan consisted of seven coplanar 6 MV fields and was delivered with a Varian, Clinac iX accelerator. The dose was measured in seven locations: three points in the target, one in each parotis, one in the medulla and one in the air cavity. The measured doses agreed with the planned within 4% for all locations except the air cavity.
The work will continue with a regional dose revision including the Swedish radiotherapy clinics in Linkoping, Jonkoping and Kalmar. The three sites represent three types of clinics: a clinic at a university hospital, a clinic at a regional hospital and a small local clinic. The system, including standardized treatments, needs to be adapted to fit all three types. Further testing and evaluation of the system is also needed and a thorough instruction for the users must be written. The long term aim of this work is to introduce EPR dosimetry as a standard method for independent dose revision in Sweden.
REFERENCES
[1 ] VEST AH TA, MALINEN E, LUND A, HOLE EO, SAGSTUEN E, EPR dosimetric properties of formats, Appl. Radiat. Isot. 59, 181-188 (2003)
[3] GUSTAFSSON H, LUND E, OLSSON S, Lithium formate EPR dosimetry for verifications of planned dose distributions prior to intensity-modulated radiation therapy. Phys. Med. Biol. 53, 4667-2247 (2008)
[4] WALDELAND E, HORLING M, HOLE EO, SAGSTUEN E, MALINEN E, Dosimetiy of stereotactic radiosurgery using lithium formate EPR dosimeters, Phys. Med. Biol. 55, 2307-2316 (2010)
[5] ANTONOVIC L, GUSTAFSSON H, ALM CARLSSON G, CARLSSON TEDGREN A, Evaluation of a lithium formate EPR dosimetry system for dose measurements around Ir-192 brachytherapy sources, Med. Phys. 23, 2236-2247 (2009)
[6] MALKE Z, System for dose revision for external radiation therapy based on EPR dosimetry with lithium formate, Thesis for MSc, Stockholm University, Manuscript

IDOS, Vienna, 9-12 November 2010 E2-CN-182, Paper No 125
Development of guidelines for the use of IMRT and IGRT in clinical trials
T. Krona, A. Haworth3, D. Cornes\ M. Grand"
a Peter MacCallum Cancer Centre, Melbourne, Australia
b Trans-Tasman Radiation Oncology Group, Newcastle, Australia
E-mail address of main author: [email protected]
Intensity Modulated Radiation Therapy (IMRT) [1] and/or Image Guided Radiation Therapy (IGRT) [2] are included in an increasing number of clinical trials in radiotherapy. Their inclusion in a trial may be incidental, it could be essential for achiving the objectives of the trial or IMRT and/or IGRT could be part of the trial question itself. In any case, both technologies are complex and it is likely that different centres use different equipment and different approaches for IMRT and IGRT. It is therefore essential to provide guidelines for the inclusion of these techniques in clinical trials in order to standardise its use. The aim of the present work is to describe the efforts of the Trans-Tasman Radiation Oncology Group (TROG) (www.trog.com.au) to develop guidelines for the use of IMRT and IGRT in clinical trials including physical dosimetric assessments for credentialling of participating centres.
Both, IMRT and IGRT are considered in multidisciplinary working parties comprising radiation oncologists, radiation therapist (RTTs) and medical physicists. In addition to this membership in the working parties allows for regional representation and aims to ensure expertise with all relevant technology is available, leading to a group size of approximately 10 to 15 members, who meet mostly by teleconference and e-mail exchange. The aim is to produce a set of documents which can be used by trial proponents to ensure the advanced technology is included appropriately into the protocol. As such the groups are developing a framework for inclusion of advanced technology into clinical trials rather than performing actual measurements. It is up to the trial management committee for each individual trial to select the appropirate elements of the framework and determine the required QA procedures to support the trial question.
The IMRT working party was founded in 2007 while the IGRT working party commenced its work in 2009. Both groups report to the TROG Board via the Quality Assurance Development Group which is charged with overseeing all quality assurance activities of the clinical trials group including dosimetric intercomparisions using relevant anthropomorphic phantoms.
The IMRT working party has produced a number of documents to support trial investigators:
• A guidelines document that includes guidance for credentialing of participating centres, case review requirements (real time and final) and quality assurance advice
• Samples for relevant protocol sections • A sample for a facility questionnaire
Key elements are the inclusion of at least one RTT and physicist in the trial management committee, a requirement for credentialling that includes physical measurements and test plans, and the need to perform real-time review of plans. At the moment, the recommended physical measurements are based on passing an independent level III dosimetric test with an anthropomorphic phantom that verifies the whole treatment chain from imaging to planning and delivery [3], Several trials are supported in this way including a trial of hypofrationated radiotherapy for prostate cancer (http://www.clinicaltrials.gOv/ct/show/NCT00304759, PROFIT) where ion chamber and radiochromic film measurements were performed using a customised anthropomorphic pelvis phantom [3]. More than 12 facilities are credentialled to date using a 5% dose and 3mm distance to agreement criterion.
599

In order to reduce workload and atreamline procedures this dosimetric assessment is also accepted as credentialling requirement for the use of IMRT in a trial on adjuvant versus early salvage radiotherapy for post-prostatectomy patients (RAVES, TROG 08.03, compare www.trog.com.au).
The IGRT working party aims to produce similar documents and is also in the process of developing fact sheets of selected image guidance options. It was felt that this was required as the variety of image guidance solutions available makes it unlikely that an investigator is familiar with all of the approaches. The IGRT group is also concerned with defining training requirements for RTTs who perform image guidance procedures on a daily basis [4],
In Australia and New Zealand, the home countries for TROG, dosimetric intercomparisons have traditionally been performed during site visits [5]. The guidelines reflect this practice. As several of the trials involving IMRT and/or IGRT introduce technology which may be new in participating centres (eg TROG 09.02 studying extracranial stereotactic radiotherapy for lung cancer and TROG 10.01 aimed at determining the feasibility of adaptive radiotherapy for bladder cancer - details at www.trog.com.au), the site visit also offers an opportunity to clarify technical questions. Of particular interest is the extension of phantom dosimetric measurements to diagnostic procedures, a process that is currently under development for adaptive radiotherapy using TLDs.
The working parties also advise TROG on appropriate physical phantoms that can be used for credentialing of centres. Initial feedback from investigators has been positive and it is hoped to extend the range of documentation in the future to other technologies such as motion management.
REFERENCES
[1] WEBB, S. Intensity-Modulated Radiation Therapy, Bristol: IoP Publishing, 2001.
[2] VAN HERK, M. Different styles of image-guided radiotherapy. Semin Radiat Oncol 17, 258-267, 2007.
[3] EBERT, M., HARRISON, K„ CORNES, D„ IIOWLETT, g , JOSEPH, D„ KRON, T„ HAMILTON, C., DENHAM, J. A comprehensive Australasian multi-centre dosimetric intercomparison - issues, logistics and recommendations. J. Med. Imag. Radiat. Oncol. 53, 119-131,2009.
[4] FOROUDI, F„ WONG, J., KRON, T„ ROXBY, P., HAWORTH, A., ROLFO, A., PANEGHEL, A., STYLES, C„ LAFELITA, M„ WILLIAMS, S„ BAILEY, A., DUCHESNE, G., TAI, KH. Development and Evaluation of a Training Program for Therapeutic Radiographers as a Basis for Online Adaptive Radiation Therapy for Bladder Carcinoma Radiography. Accepted for Radiography, September 2009.
[5] KRON, T„ HAMILTON, C„ ROFF, M., DENHAM, J. Dosimetric inter-comparison for two Australasian clinical trials using an anthropomorphic phantom. Int. J. Radiat. Oncol. Biol. Phys. 52, 566-579, 2002.
600

IDOS, Vienna, 9-12 November 2010 E2-CN-182, Paper No 125
TLD postal quality audits for radiotherapy dosimetry in Cuba: Past, present and future developments
S. Gutierrez Lores, G. Walwyn Salas
Center for Radiation Protection and Hygiene, Havana, Cuba
E-mail address of main author: [email protected]
Since 1999, the Secondary Standard Dosimetry Laboratory (SSDL) of Cuba has established a TLD postal dose quality audit service for 60Co beams in reference conditions for radiotherapy centres in the country. In addiction the SSDL of Cuba has been involved in the audits programme through IAEA/WHO TLD postal dose quality audit activities for SSDLs and since 2001 the TLD dose comparison results, all results are within the 3.5% acceptance limit. Under IAEA Co-ordinated Research Project (CRP) E2.40.07 "Development of a Quality Assurance programme for Radiation Therapy Dosimetry in Developing Countries a National External Audit Group in Radiotherapy (EAG ) was constituted to performing quality audit for radiotherapy dosimetry, whose aim is to ensure adequate precision in the dosimetry of clinic beams. The EAG is composed of experts from the National Control Center for Medical Devises (CCEEM), as the regulatory entity for the control and supervision of the medical devices in the country, from the Institute of Oncology and Radiobiology (INOR) and other hospitals representing the National Group Oncology (GNO) and from the Cuban SSDL-Measuring Center (CPHR). Under CRP mentioned above 100 microrods (TLD-100) type 1152F made in China were characterized. The methodology for the characterization of the 100 microrods, the TLD system used respectively and the results obtained has been explained in detail in the reference [1],
During 2002-2006, Cuba participated in the IAEA CRP (E2.40.12) for to extend the scope of activities of the EAG from TLD audits in reference conditions, i.e simple TLD checks of radiotherapy beams calibrations, to complex audit measurements in a variety of clinically relevant irradiation geometries, i.e. in non-reference conditions. At he same time, the work of EAG was consolidated. During 2003-2004 a number of TLD capsules were interchanged between the Cuban SSDL and the IAEA Dosimetry laboratory in the so called "blind test" in order to verify the calibrations of the Cuban TLD system for 60Co. The Cuban SSDL used TLD in the form of microrods by using the same procedure performed in the previous CRP E2.40.07. The plastic capsules for irradiation at radiotherapy levels are filled with 3 microrods each, providing 3 readings from each capsule as described in [2]. To reduce the uncertainty declared to be around 2.5%, the Cuban TLD laboratory TLD powder was implemented. For that reason a fellowship was executed. From January/2005 to July/2005 a training on "Thermoluminescent Dosimetry techniques for quality audits in radiotherapy" was carried out at the IAEA's Dosimetry Laboratory Unit, Seibersdorf for to assimilate the methodology for execution of TLD dose quality audits for external radiotherapy beams, using powder TLD. As part of this project, a lot of approximately 50 g of LiF powder, type TLD-100 (Hasrhaw) was characterized. The T1 dosimeters consist of about 165 mg of LiF powder filled into a watertight polyethylene capsule with dimensions of 20 mm inner length and 3 mm inner diameter. A HARSHAW 2000C/B manual reader is used for the measurements. The Cuban Measuring Center (MC) SSDL took part in a blind test intercomparison of their TLD system with the IAEA. This external trial took place on 29 November 2005, when 18 polyethylene capsules filled with approximately 165 mg of annealed LiF powder, type TLD-100, were irradiated using the IAEA's Co-60 beam. A set of 15 capsules were irradiated for calibration propose with doses between 1.5 and 2.5 Gy; the others 3 capsules (#16 to #18) were irradiated with unknown dose to test our accuracy in the dose determination. On 26 January 2006, the MC-SSDL sent a message with the results obtained from readouts of the TLDs irradiated by the
601

IAEA. After that the IAEA sent an encouraging message with the value of the dose delivered to these capsules, shown in Table 1. The uncertainty in the TLD measurement of the dose is 2.2 % (1 standard deviation). The results within 2 % are considered fully acceptable. These results showed that the TLD system was satisfactory for the external audit purposes. The description of the methodology and the global results obtained are detailed in [3].
At the present the Cuban SSDL a new TLD manual reader analyser TL-RA-04, a TLDO annealing oven controlled by a programmable microprocessor, a powder dispenser and electronic precision balance were acquired under IAEA Technical Co-operation Project CUB6017 "Quality Assurance in Measurements and Calibration for New Medical Technologies in Cuba". At the moment of writing the present paper a lot of LiF powder, type TLD-100 is being characterized and the parameters of the TLD system are being studied. We have planned to participate in the so called "blind test" in order to verify the calibrations of the Cuban TLD system for6 "Co for next June.
For the future work is intended to extend the TLD postal dose quality audit service for 01 Co beams in reference conditions to photon and electron beams in non-reference conditions on-the beams axis for all radiotherapy centre in the country.. Later, extend for photon beams in non-reference conditions off
Actually, there are 13 high energy radiotherapy units in Cuba to cover a population of about 11 million habitants. There nine 60C-o machines and 3 recently linear accelerator with the capability for new treatment techniques such as intensity modulated radiotherapy (IMRT). IMRT requires very complex dosimetry, QA and verification. For that reason in the future immediate is to develop and make available a methodology for dose measurements of complex radiotherapy parameters used in cancer treatment. This will include TLD based dosimetry irregular MLC field for conformal radiotherapy, for heterogeneous situations, and for small MLC shaped field relevant to stereotactic radiotherapy and applicable to dosimetry for IMRT.
Capsule Dose Dose Discrepancies N° measured by deliveries D T L D / D i a e a
MC-SSDL bv IAEA D t l d (Gy) D I A E A
(Gy) 16
1.964 1.939 1.013 17 1.964 1.939 1.013 18
1.964 1.939 1.013
Table 1, Results of external tr ial with IAEA
REFERENCES
[1] S.GUTIERREZ LORES, G. WALWYN SALAS, Experiences of the Cuban's SSDL in the implementation of the Quality Postal audit Service in Radiotherapy for Co-60 in reference conditions, using TLDs, 14th International Conference of Medical Physics, Nuremberg, Germany, Sept. 14-17, 2005.
[2] S.GUTIERREZ LORES, G. WALWYN SALAS, Pilot Postal Audits in Radiotherapy for Co-60 in non-reference conditions in Cuba: Practical considerations and preliminary results, 14th
International Conference of Medical Physics, Nuremberg, Germany, Sept. 14-17, 2005. [3] IZEWSKA, J., GEORG, D„ BERA, P., THWAITES, D„ ARIB, M„ SARA VI, M„ SERGIEV A,
K„ LI, GARCIA YIP, F„ MAHANT, A. K„ BULSKI, W„ A methodology for TLD postal dosimetiy audit of high-energy radiotherapy photon beams in non-reference conditions, Radiotherapy and oncology, 84, 92007), 67-74.
602

IDOS, Vienna, 9-12 November 2010 E2-CN-182, Paper No 125
Development of methodology for TLD quality audits of MLC shaped photon beams in radiotherapy
S. Luoa, Z. Hea, J. Yuana, B. Yang\ K. Lia
a National Institute for Radiological Protection, Chinese Center for Disease Control and Prevention
b Peking Union Medical College Hospital The People's Republic of China
E-mail address of main author: [email protected]
This work has been performed within a framework of an IAEA Coordinated Research Project"Development of quality audits for radiotherapy dosimetry for complex treatment techniques". The purpose of the dosimetry audit exercise described below was to test the procedures for audit of radiotherapy fields shaped with a multileaf collimator (MLC). The MLC audit procedure testing consisted of two parts including dosimetry verification (with ionization chamber in a solid phantom) of a sequence of MLC field arrangements and participation in an IAEA multicentre pilot study to test TLD audit procedures for these fields. Seven MLC shaped fields including the reference field, small square , circular, inverted"Y ", irregular field without and with wedge (30 °), and a small rectangular field were included for 6 MV and 18 MV beams from a Varian linac. The solid water phantom was CT scanned and the image was imported to the treatment planning system (Eclipse 7.3). The number of MU was calculated using pencil beam convolution (PBC) in Eclipse to deliver 2 Gy to the point of interest located at the isocentre, at a 10 cm depth.
The exercise was repeated using water phantom where doses were measured using a ionization chamber (0.65 cc) at 10 cm depth in water for the same 7 fields shaped with MLC for 6 MV and 18 MV beams. Similarly, the number of MU was determined by TPS to deliver 2 Gy to the point of interest. Following the ionization chamber measurements, TLDs were placed in a water phantom for irradiation with MLC shaped fields using the same 6 MV and 18 MV beams. The centre of TLD capsules was located at 10 cm depth in water and the holder was provided by IAEA together with TLDs. The irradiation details were recorded in datasheets specially developed for this MLC audit and TLDs were returned to the IAEA for evaluation. The results are shown in Table 1.
Table 1. The results study of MLC fields for photon beams
Field MLC Field Field size DIAEA D T P S Dev(%) No. (cm) (Gy) (Gy)
6MV 18MV 6MV 18MV 6MV 18MV 1 reference condition 10x10 1.996 2.080 2.000 2.000 0.2 -3.8 2 Small square MLC 5x5 2.056 2.010 2.000 2.000 -2.7 -0.5 3 MLC "Circular" field 5.6 2.050 2.046 2.000 2.000 -2.4 -2.2 4 Inverted "Y" MLC 15x10 2.036 2.034 2.000 2.000 -1.8 -1.7 5 Irregular MLC field 10x7.5 2.032 2.027 2.000 2.000 -1.6 -1.3 6 Irregular MLC 10x7.5 2.010 2.051 2.000 2.000 -0.5 -2.5
30° wedge
7 Small rectangular field 3x5 2.033 2.067 2.000 2.000 -1.6 -3.2 8 reference condition 10x10 2.049 2.005 2.000 2.000 -2.4 -0.2
603

Following the IAEA multicentre pilot study, the MLC audit methodology was tested in trial TLD run China involving the TLD laboratory at the National Institute for Radiological Protection (NIRP) and five radiotherapy centres to whom TLDs were sent together with Chinese adaptation of TLD instructions and data sheets. The purpose of this exercise was to review the newly developed dosimetry audit methodology in the local conditions and implement improvements, where appropriate, before extending the MLC audit to a larger number of hospitals in China. As per the MLC auditing procedure, during the TLD trial run, hospitals irradiated TLDs provided by the NIRP laboratory with 7 MLC fields with 2 photon beams each, using the beam qualities of 6 MV, 10 MV and 18 MV. The TLD holder from the IAEA was used for these irradiations. On this occasion, the absorbed dose was verified using 0.6 cc, 0.015 cc, 0.3 cc ionization chambers for each of the MLC shaped fields at 10 cm depth in water, at SAD=100 cm or SSD=100 cm, depending on the usual hospital practices. For the dose determination, either TRS 277 or TRS 398 Codes of Practice were used by the hospitals. The irradiated TLDs were returned to the NIRP TLD laboratory for evaluation together with the data sheets where TPS doses were reported. The results are presented in Figure 1, in terms of the relative difference between the TLD determined dose and TPS calculated dose.
14 r
12 -
10 i—i |—i i—i a
z 4 -
2 |—i
0 1 1 1 ' * ' * ' * I I I I I I I I I I I I I I I - 9 % - 6 % - 5 % - 4 % - 3 % - 2 % - 1 % 1% 2% 3% 4% 5% 6% 9%
&ev (%)
FIG 1. The results of the trial TLD audit performed with 5 Chinese hospitals for shaped MLC fields for high energy photon beams.
Altogether, the total number of measurement points was 80 in this trial run. The mean of the results distribution in terms of DNIRP/Duser was 0.988, and the standard deviation was 0.024. Approximately 94% of results were within the acceptance limit of 5%.
604
IDOS, Vienna, 9-12 November 2010 E2-CN-182, Paper No 125
Development of national TLD-audit network in Ukraine for postal quality control of radiotherapy dosimetry
M. Pylypenko, L. Stadnyk, O. Shalyopa
Grigorev Institute for Medical Radiology, Kharkiv, Ukraine
E-mail address of main author: [email protected]
In accordance with the recommendations of International Commission on Radiation Units and Measurements for effective radiotherapy and prevention of radiation effects the maximum discrepancy between stated and delivered absorbed dose in tumor does not exceed ± 5 %.
In Ukraine the quality control of main radiation parameters of radiotherapy units are carried out by metrological services not less than once per 2 years in according to operative State Standard 23154-78. The medical physics of oncological hospitals have to carry out a current control of radiation beam calibration using own clinical dosimeters once per quarter. But the most of radiotherapy departments in Ukraine (65 %) have the old clinical dosimeters (type 27012 or VAJ-18), and only 28 % of hospitals have the modern clinical dosimeter UNIDOS. So it is very important for Ukraine to organize the independent external quality audits of the calibration of high energy photon beams in radiotherapy.
In 1998 Ukraine has been involved in the IAEA/WHO TLD postal dose quality audit for developing countries. The Grigorev Institute is the co-ordinator of this programme in Ukraine. During 1998-2009 the 182 radiation beam checks for 79 radiotherapy units of 36 radiotherapy departments were carried out. In view of the fact that the participation of hospitals in IAEA/WHO TLD-audit was voluntary and confidential about 25 % of radiotherapy centers have been never took part in this programme.
Unfortunately the results of IAEA/WHO TLD dose audit of hospitals-participants showed not satisfactory results. So after first stage of TLD-audit only 50-75% (in different years) of radiation beams (average - 64,5%) were within the acceptance limit of ± 5%, and for 10-15 % of radiotherapy beams errors of dose calibration were outside ± 10%. After two stages only 70-89% (average - 77,6 %) of radiotherapy beams were in the acceptance limit of ± 5 %.
At present thank to technical and methodological support of IAEA Ukraine has a possibility to organize the national dosimetry network for the quality control of radiotherapy beam calibration.
In frame of IAEA TC-project the Dosimetry Laboratory of Grigorev Institute for Medical Radiology had received the PCL3 TLD automatic reader, lithium fluoride (LiF) powder, polyethylene capsules and holders. The standardized IAEA methodology of TLD-audit was studied and implemented. According to this methodology every year the calibration and the external quality control of TLD-system (the reference and 'blind' check irradiations TLDs in 6'Co beam in absorbed dose units) are provided by Primary Standard Dosimetry Laboratory of National Center of Metrology (Kharkov, Ukraine).
605

In 2008-2009 the Dosimetry Laboratory of Grigorev Institute carried out the trial TLD-audits for 8 radiotherapy beams of 5 hospitals. As in the case with international TLD-audit the prepared TLDs were sent to hospitals with instructions and data sheets. The medical physics of radiotherapy departments were requested to irradiate TLDs a water phantom in reference conditions using irradiation techniques of hospital normal practice. The dose to water at the position of the TLD-capsule should be calculated in the same way as for patient treatments. The results of trial TLD-audits of our Dosimetry Laboratory (determination of absorbed dose to water) were in good agreement with the results of IAEA TLD-audit for the same hospitals: (discrepancy was less 2%).
The main reasons for deviations outside acceptance limits were analysed due to on-site visits to some hospitals and phone connection with medical physics. It showed that there are the inadequate states of radiotherapy units and clinical dosimeters in hospitals; the mistakes of medical physics in dose calculations (percentage depth dose, misunderstanding of applied correction factors) and absence of qualified medical physics in clinics; the using of old methodology of absorbed dose estimation in tissues; the absence of national dosimetry protocol, etc.
At present the set of necessary documents for approval of legal status of the Center of National TLD-audit is in process of agreement with Authority. The organization of national TLD network will make available the postal dose audit of all radiotherapy.
606
IDOS, Vienna, 9-12 November 2010 E2-CN-182, Paper No 125
Development of TLD audits for radiotherapy dosimetry in Argentina A. M.Stefanic % G. Montano,L. Molina% M. Saravf8
a Comision Nacional de Energia Atomica, Ezeiza, Argentina
E-mail address of main author: [email protected]
Since 1978 the Regional Reference Center for Dosimetry in Argentina (Secondary Standard Dosimetry Laboratory belonging to the IAEA-WHO SSDLs Network) has been performing a dose intercomparison programme for cobalt 60 therapy units operating in the country. Applied methodology was similar to that of the IAEA TLD audit service and the dose at a reference point on the radiation beam axis was checked by this programme. The results of this audits showed that dose deviations obtained were within the acceptance limits.
In the frame of the first Co-ordinated Research Programme CRP E2.40.07 "Development of a Quality Assurance Programme for Radiation Therapy Dosimetry in Developing Countries", conducted during 1995-2001 to assist IAEA Member States, Argentina developed a National Programme for TLD based QA audits in radiotherapy dosimetry to assure proper calibration of radiotherapy beams. Procedures and instructions to organize and perform TLD audits for Cobalt 60 machines and LINACs were written.
A new CRP, CRP E2.40.12 "Developement of TLD-based Quality audits for Radiotherapy Dosimetry in Non-Reference Conditions" extended the scope of activities of the national External Audit Groups (EAGs) from TLD audits in reference conditions, to complex audit measurements in a variety of clinically relevant irradiation geometries, i.e. in nonreference conditions.
The External Audit Group in Argentina is composed by the SSDL, belonging to the National Atomic Energy Commission, and two medical physicists of the same Institution who are working at the Radiation Therapy Department in the "Angel Roffo" National Institute of Cancer Research and Treatment. The EAG organizes and carries out TLD external audits in reference and non-reference conditions on axis, in the central point of a beam for high energy photon beams. In the frame of the IAEA Technical Cooperation Project ARG/1/027 an automatic TLD reader, PTW FIMEL PCL3, was installed in year 2004.
In the frame of the IAEA CRP E2.40.12 "Development of TLD based Quality Audits for Radiotherapy Dosimetry in Non-Reference Conditions" these tasks were performed:
• TLD AUDITS ON PHOTONS (Co-60 AND HIGH ENERGY X RAYS): • STEP 2a: REFERENCE AND NON-REFERENCE ON AXIS BEAM • STEP 3 a: REFERENCE AND NON- REFERENCE OFF- AXIS • TLD AUDITS ON HIGH ENERGY ELECTRON BEAMS: STEP 2b:
REFERENCE CONDITIONS Routine audits for stepl (high energy photon beams under reference conditions) and step 2a were performed using the new TLD system. Pilot audits for step 2b and step 3 were carried out, with very good results.
General policies for quality audit have been adopted and new centres were checked under reference conditions as first step of quality audit. Follow-up TLDs were sent for mesauring only those parameters where a large deviation was found. Efforts were taken (and still will be taken) to improve relationships with the oncologists.
607

Nowadays the situation in Argentina about Complex Treatment Techniques is the following: more and more linear accelerators are being installed (photon an electron beams). The TLD service therefore, is being expanded accordingly by providing calibration checks for high energy X-ray and electron beams under non-reference conditions.
All the centers with cobalt units perform 2D dosimetry; about 70% of the centers perform 3D dosimetry. Almost all of the centers with LINACs have TPS 3D.
During the following years, more machines will be installed with the capability for new treatment techniques such as intensity modulated radiotherapy (IMRT), and multileaf colimators.
Argentina has joined a new IAEA CRP "Development of Quality Audits for Radiotherapy Dosimetry for Complex Treatment Techniques" to manage audit new complex machines in the future.
There will be three audit steps involved in this CRP: dosimetry of MLC-shaped irregular fields, dosimetry in the presence of heterogeneities and 2D dosimetry of small MLC shaped fields. The action plan for each audit step will involve a feasibility study, a multi-centre pilot study and a trial audit run with a few local hospitals. First step will be completed by the end of this year
TLD A u d i t resu l t s in Reference and Non- re fe rence c o n d i t i o n s J u l y 2 0 0 9
• $ l i / S
t 9 • v • • • y
a
• ri • • 10cmx10cm ref cond
• 7cmx7cm 20cmx20cm
• 7cmx20cm • 0cmx10cm with edge
- Upper limit of acceptation Lower limit of acceptation
0 1 2 3 4 5 6 7 8 9 10 11 12
Participant code
• 10cmx10cm ref cond • 7cmx7cm
20cmx20cm • 7cmx20cm • 0cmx10cm with edge
- Upper limit of acceptation Lower limit of acceptation
608
IDOS, Vienna, 9-12 November 2010 E2-CN-182, Paper No 125
Use of an anthropomorphic phantom to improve the external beam audits in radiotherapy
Alonso Samper J. L. a, Alfonso Laguardia R.b , Garcia Yip F.b, Larrinaga Cortina E. \ Silvestre Patallo b
a Center for Control of Medical Devices (CCEEM), Havana, Cuba b Department of Radiotherapy, Institute of Oncology and Radiobiology (INOR), Havana, Cuba
E-mail address of main author: pepe. samper @infomed,sld.cu
The Cuban National audit program in radiotherapy is based on systematic on-site visits to the radiotherapy services. During the visit not only the whole radiotherapy process is reviewed but also some pre-defined dosimetry test cases are measured. This is a valuable tool to detect any significant discrepancy between prescribed and delivered dose. At the present stage these measurements are performed in non-reference conditions. In 2006 we received a CIRS thorax phantom through an IAEA Technical Cooperation Project. This phantom allows absolute and relative measurements with Ion chamber in different drilled positions. Since 2006 this phantom have been used intensively in the National Audit program and during the clinical commissioning of the recently acquired technology, mainly when testing treatment planning systems (TPS). Radiotherapy centers with high energy photon beams were audited and contributed with the following energies: Co-60, 6 MV and 15 MV. Four different TPSs were included in the study to calculate irradiation parameters and doses for the test cases: AMEPLAN (in-house), NUCLETRON Theraplan Plus, ELEKTA Precise Plan and WIN-PLT. During all the visits the measurements were acquired by the auditing team using the anthropomorphic CIRS phantom, a semiflex PTW 31010 and a PTW UNIDOS electrometer.
The set of test cases was adopted from those proposed by IAEA in the report TRS 430 and adapted according to our experience.
The four test cases are relative measurements able to detect problems in the whole treatment chain. They can be divided into the following categories:
• Mechanical problems inherent to the treatment unit • Patient data acquisition (CT) • Input data in the TPS. (PDD, profile, output factors, wedge factors, etc.) • Calculation algorithms, tissue inhomogeneities, lateral dispersion
approximation, block transmission, field shape considerations, etc. • Data transmission/communication between the TPS and the treatment machine. • Human error during planning • Human error during positioning and inmovilization
Description of test cases
Case 1 Output, 10x10 cm field. SSD set up. Gantry 0° to check in reference conditions and PDD curve. Measurements in holes 1, 3 ,5, 9 and 10 of the phantom
Case 2. Tangential fields to verify wedged fields, off-axis profiles and the lack of lateral dispersion in the frequent tangential breast fields. A lateral beam of 10Wxl5 with gantry 90° and collimator of 270° is used. Measurement are performed in holes 1 and 3 of the phantom
609

Case 3. Four fields box (isocentric) to verify the planning of the common four fields box with heterogeneities. Measurement are performed in the holes 5, 6 and 10 of the phantom.
Case 4. Irregular fields to verify lateral scatter and estimate the dose below the block. Measurement are performed in the holes number 2, 3 and 8 of the phantom
The discrepancies found between the prescribed and measured dose were due mainly because one TPS do not consider the lack in lateral dispersion and for that reason the results of the calculations failed in complex situations. Based on this finding this TPS is being gradually replaced. The results of this pilot testing are shown in Fig. 1.
HTPS1
BTPS2 TPS3
TPS4
FIG 1. Discrepancies between measured and prescribed doses per hole per test case according to the TPS used.
Since its implementation 10 years ago the external audit system for radiotherapy beams in non reference conditions has brought an improvement in the clinical aspects of the treatments, the radiation protection of patients and in the quality controls.
REFERENCES
[1] INTERNATIONAL ATOMIC ENERGY AGENCY, (IAEA) Commissioning and Quality Assurance of Computerized Planning Systems for Radiation Treatment of Cancer, Technical Reports Series No.430, Vienna October 2004, STI/DOC/010/430.
[2] INTERNATIONAL ATOMIC ENERGY AGENCY, (IAEA) Comprehensive Audits of Radiotherapy Practices: A Tool for Quality Improvement. Quality Assurance Team for Radiation Oncology (QUATRO), (STI/PUB/1297), 2007
610

IDOS, Vienna, 9-12 November 2010 E2-CN-182, Paper No 125
The status of dosimetry practices in radiotherapy hospitals in developing countries in 2000-2009: An evaluation using the IAEA/WHO TLD postal
dose audits
G. Azangwe, P. Bera, J. Izewska
International Atomic Energy Agency, Vienna, Austria
E-mail address of main author: [email protected]
The IAEA/WHO postal dose audits for radiotherapy using thermoluminescence dosimetry (TLD) have been in operation for more than 40 years [1], In this period the IAEA/WHO service performed dosimetry audits of high energy photon beam calibrations in approximately 1700 hospitals in 120 countries. Based on the TLD audit results and the information provided in TLD data sheets by participating hospitals it was possible for the IAEA to overview basic dosimetry practices in developing countries [2], The present paper analyses the TLD audit data from the last 10 years. Datasheets from the IAEA/WHO TLD audits performed in radiotherapy hospitals in developing countries in 2000-2009 were analysed. During this period the number of beams checked was 4266. Of these 2355 were from linacs and 1911 were from Co-60 machines. These were from in 1053 hospitals in 98 countries in Africa (AF), the Eastern Mediterranean (EM), central and Eastern Europe (EU), Latin America and the Caribbean (AM), Southeast Asia (SE) and the Western Pacific (WP). Out of all the participants, 689 hospitals were new to the service.
The fraction of TLD results within the 5% acceptance limit was 0.89 for all hospitals. Approximately 0.92 of beams audited were from old participants and 0.80 from new hospitals were within the acceptance limit of 5%.
Table 1 shows fraction of results with discrepancies that occurred in TLD audits in the last 10 years for linacs and Co-60 units. It can be seen from Table 1 that the calibrations are more accurate for linacs (0.06 results outside the 5% limit) than for Co-60 beams (0.18 results outside the 5% limit). About 60% of these discrepancies were corrected in the follow-up process.
TABLE 1. Discrepancies in TLD audit results occurred between 2000 and 2009. Co-60 beams High-energy x-ray beams
Number of beams 1911 2355 Fraction of results outside the 5% limit: 0.18 0.06
> 20% 0.03 0.01 10-20% 0.06 0.01 5-10% 0.09 0.04
TABLE 2. Ratio of TLD measured dose to the dose stated by the users, DTLD/Dstat and standard deviation of the results distribution grouped according to the dosimetry CoPs used by participants in TLD audits in 2000-2009.
CoP used Number of beams Mean DILD/D I SD (%)
ND>W 1798 (12)* 1.003 2.5 Nk 1128 (10) 1.006 3.3 Nx 327 (6) 1.020 4.8
Incomplete data sheets 124 (1) 1.021 5.5 No dosimetry data 823 (37) 1.011 5.1
*66 deviations greater than 20% were excludedfrom the statistics, 37 of which were from the group with no dosimetry data. The number excluded in each set is shown in brackets.
611
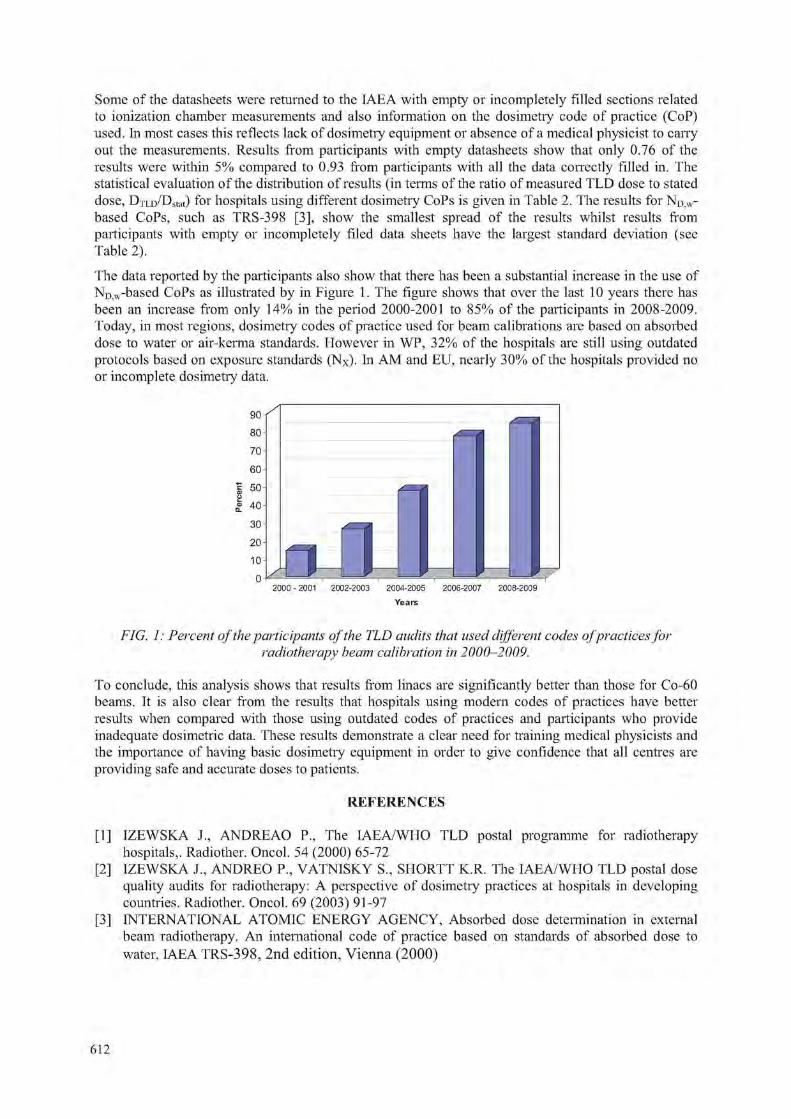
Some of the datasheets were returned to the IAEA with empty or incompletely filled sections related to ionization chamber measurements and also information on the dosimetry code of practice (CoP) used. In most cases this reflects lack of dosimetry equipment or absence of a medical physicist to carry out the measurements. Results from participants with empty datasheets show that only 0.76 of the results were within 5% compared to 0.93 from participants with all the data correctly filled in. The statistical evaluation of the distribution of results (in terms of the ratio of measured TLD dose to stated dose, DxLD/Dstat) for hospitals using different dosimetry CoPs is given in Table 2. The results for ND)W-based CoPs, such as TRS-398 [3], show the smallest spread of the results whilst results from participants with empty or incompletely filed data sheets have the largest standard deviation (see Table 2).
The data reported by the participants also show that there has been a substantial increase in the use of ND w-based CoPs as illustrated by in Figure 1. The figure shows that over the last 10 years there has been an increase from only 14% in the period 2000-2001 to 85% of the participants in 2008-2009. Today, in most regions, dosimetry codes of practice used for beam calibrations are based on absorbed dose to water or air-kerma standards. However in WP, 32% of the hospitals are still using outdated protocols based on exposure standards (Nx). In AM and EU, nearly 30% of the hospitals provided no or incomplete dosimetry data.
90
80
70
60
1 50
I 40
30
20
10
0
FIG. 1: Percent of the participants of the TLD audits that used different codes ofpractices for radiotherapy beam calibration in 2000-2009.
To conclude, this analysis shows that results from linacs are significantly better than those for Co-60 beams. It is also clear from the results that hospitals using modern codes of practices have better results when compared with those using outdated codes of practices and participants who provide inadequate dosimetric data. These results demonstrate a clear need for training medical physicists and the importance of having basic dosimetry equipment in order to give confidence that all centres are providing safe and accurate doses to patients.
REFERENCES
[1] IZEWSKA J., ANDREAO P., The IAEA/WHO TLD postal programme for radiotherapy hospitals,. Radiother. Oncol. 54 (2000) 65-72
[2] IZEWSKA J., ANDREO P., VATNISKY S„ SHORTT K.R. The IAEA/WHO TLD postal dose quality audits for radiotherapy: A perspective of dosimetry practices at hospitals in developing countries. Radiother. Oncol. 69 (2003) 91-97
[3] INTERNATIONAL ATOMIC ENERGY AGENCY, Absorbed dose determination in external beam radiotherapy. An international code of practice based on standards of absorbed dose to water, IAEA TRS-398, 2nd edition, Vienna (2000)
r i
n i f i 2000 -2001 2002-2003 2004-2005 2006-2007 2008-2009
Years
612

IDOS, Vienna, 9-12 November 2010 E2-CN-182, Paper No 125
IAEA support to national TLD audit networks for radiotherapy dosimetry
J. Izewska, G. Azangwe, P. Bera
International Atomic Energy Agency, Vienna, Austria
E-mail address of main author: [email protected]
For several years the IAEA has encouraged and supported the development of methodology and establishment of national TLD-based quality audit networks for radiotherapy dosimetry. The main motivation was to extend the availability of radiotherapy dosimetry audits to as many radiotherapy centres as possible throughout the world. National auditing activities complement the IAEA/WHO TLD postal dose audit service that has been provided by the IAEA Dosimetry Laboratory to 120 countries worldwide. Thanks to the national developments, the IAEA can cost-effectively utilize its resources and focus on the provision of dosimetiy audits to these centres in low and middle income countries that do not have, other than the IAEA access, to the dosimetry audit.
A series of three Co-ordinated Research Projects (CRPs) has been conducted by the IAEA as of 1995 to assist its Member States to develop such national programmes. The first CRP started from beam calibration audits in reference conditions [1], This development was then extended for audits in non-reference conditions [2] through a second CRP. The third CRP was initiated in 2009 with the aim of expanding the dosimetry audit tools to be suitable for complex treatment techniques used for treatment of cancer patients. New procedures are being developed that address more complex irradiation techniques and the participating national audit networks are incorporating in their programmes procedures for checking hospital dosimetry for these techniques. The scope of the dosimetry parameters included in the audit corresponds to the demands of evolving complexity of radiotherapy.
Specifically, the programme of dosimetiy audits developed within these CRPs involves six steps that are implemented progressively, from simple to more complex conditions in geometries closer to the dose delivery to the patient. They are as follows:
STEP 1. Beam output in reference conditions, high energy photons.
STEP 2. Dose in reference conditions and in non-reference conditions on-axis:
a) high energy photons
b) high energy energy electron beams, at the reference depth.
STEP 3. Dose in reference conditions and in non-reference conditions off-axis for open and wedged fields, high energy photons; part 1: symmetric fields, part 2: asymmetric fields.
STEP 4. Dose for irregular fields shaped with an MLC, high energy photons.
STEP 5. Dose in the presence of heterogeneities, high energy photons.
STEP 6. TLD and film 2D profile for small photon MLC shaped field sizes.
The IAEA Dosimetry Laboratory has actively participated in the experimental part of the programme above, developed new phantoms and conducted multicentre pilot studies to test the newly developed methodology.
613

The results of the recently performed such a multicentre pilot study for the audit Step 4, defined above, are given in Figure 1. The CRP participants irradiated TLDs as per newly developed instructions using high energy photon beams available in their centres and several field arrangements. They calculated the dose to TLD using their treatment planning systems.
They reported the irradiation details in newly developed datasheets and returned TLDs to the IAEA for evaluation together with comments regarding the exercise details and the quality of documentation developed under the CRP. Following this study, the participants adopt the methodology to the national level and organize pilot exercises involving a few local radiotherapy centres and the local TLD laboratory.
1 . 0 8
1.06
I 1.02
T 1.00
t 0.98
° 0.96
0.94
0.92
10x10 5x5 5.6 <t> Inv. Y, Irre. Open, lire. 2x5 10x10 10x15 7.5x10 Wedge,
7.5x10
Field size (cmxcm)
FIG. 1. Results of a multicentre pilot study for the audit step 4. Individual symbols correspond to the results by different CRP participants. Linacs beam used are 6 MV, 10 MV, 15 MV and 18 MV.
This way the national audit networks closely cooperate with the IAEA at the consecutive stages of developing the methodology locally and by carrying out cross-measurements.
In addition, the IAEA contributes to strengthening QA of the national TLD systems by exchanging dosimeters with the national TLD laboratories on a yearly basis. These interactions with the IAEA ensure that national radiotherapy dosimetry audit networks are working to the same levels and standards.
Although the importance of a dosimetry audit is clearly recognised and the impact of the regular participation in the audit has been significant, it is estimated that a large number of radiotherapy centres world-wide still do not participate in an independent dose quality audit. Therefore the IAEA continues working towards the encouragement of the setting-up of national audit programmes with the goal to make such an audit available to as many radiotherapy centres world-wide as possible.
ACKNOWLEDGEMENT: The development of dosimetry audit programmes for national TLD networks has been conducted through a series of IAEA consultancies. Special contributions to these developments have been provided by A. Dutreix (France), D. Thwaites (UK), D. Georg (Austria) and D. Followill (USA).
REFERENCES
[1] IZEWSKA, J, and THWAITES, D.I., IAEA Supported National Thermoluminescence Dosimetry Audit Networks for Radiotherapy Dosimetry, Proc. Int. Symp. Standards and Codes of Practice in Med. Rad. Dosim., IAEA-CN-96/137, IAEA, Vienna, (2002) 249-268.
[2] IZEWSKA, J., et al., A methodology for TLD postal dosimetiy audit of high-energy radiotherapy photon beams in non-reference conditions, Radiotherapy and Oncology, 84, 67-74 (2007).
•
; i " 5 • I . O
» ? s ; ; : * ! S ?
» s
•
614

IDOS, Vienna, 9-12 November 2010 E2-CN-182, Paper No 125
TLD audits for symmetric and asymmetric photon beams and electron beams in radiotherapy centers in Poland
J. Rostkowska, M. Kama, W. Bulski, B, Gwiazdowska
The Maria Sklodowska-Curie Memorial Cancer Centre and Institute of Oncology
E-mail address of main author: [email protected] i.waw.pl
Introduction
The Secondary Standard Dosimetry Laboratory (SSDL) of the Medical Physics Department of the Centre of Oncology in Warsaw has become a member of the IAEA/WHO international network of such laboratories in 1988. The SSDL has been carrying-out external postal TLD audits in teletherapy centres in Poland since 1991. Regular yearly audit runs have been carried out in reference conditions. Yearly audit runs have been extended to non reference conditions since 2003. The results of selected runs, performed in the period 2005 -2009, are presented.
Materials and methods
TLD system consists of Fimel PCL3 TLD automatic reader, Niewiadomski & Company LiF: Mg,Ti powder, IAEA holders, IAEA waterproof capsules, Unidos E with ion. chamber type PTW 30013, water phantom: MT - 150T (Med - Tec) and Co-60 unit - Theratron 780 E (Theratronics).
After successful pilot runs in selected centres, a nation-wide run of the on-axis, off-axis measurements for symmetric open and wedged fields and for fields formed by MLC has been performed. In 2009 the run for asymmetric open and wedged fields were performed.
The participants determined the doses with their treatment planning systems.
TLD runs for on axis measurements in non-reference conditions were performed in Co-60 beams, in X-ray beams and in electron beams. The TLD capsules were irradiated at 10 cm and 5 cm (or 20 cm) depth for open fields (8x8 cm2, 10x10 cm2, 10x20 cm2) and wedged field (10x10 cm2) in Co-60 and X-ray beams. In electron beams the TLD capsules were irradiated at depth of dmax for 6x6 cnr and 10x10 cm2 fields.
TLD runs for off-axis measurements in non-reference conditions were performed in X-ray beams. The TLD capsules were irradiated at 10 cm depth for symmetric open and wedge fields (20x20 cm2, +/- 5 cm off-axis).
TLD runs for fields formed by MLC were performed in X-ray beams. The TLD capsules were irradiated at 10 cm depth for six MLC fields: reference, small, circular, inverted Y, irregular and irregular with wedge.
TLD runs for off-axis measurements for asymmetric fields were performed in X-ray beams. The TLD capsules were irradiated at 10 cm depth, in various asymmetric set-ups.
Results
The results of the audit in non-reference conditions for on-axis measurements are in the majority of cases within the 3.5% tolerance limit which is usually used for reference conditions (Fig . 1).
615
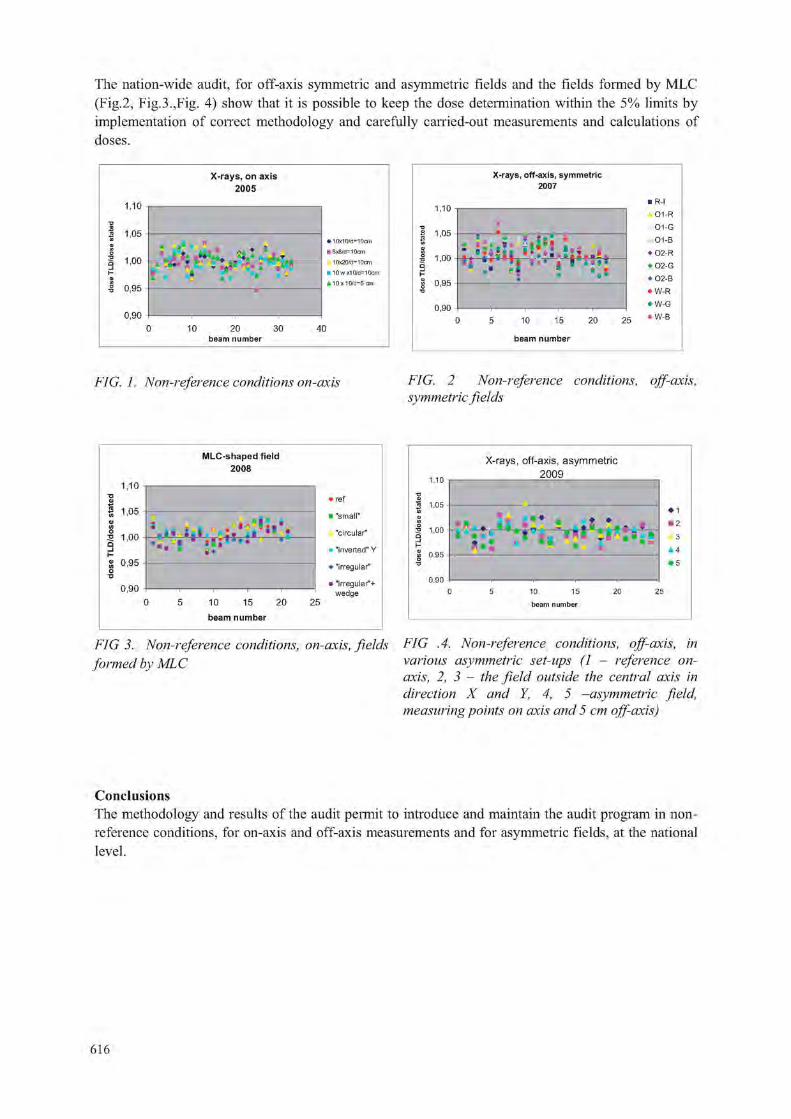
The nation-wide audit, for off-axis symmetric and asymmetric fields and the fields formed by MLC (Fig.2, Fig.3.,Fig. 4) show that it is possible to keep the dose determination within the 5% limits by implementation of correct methodology and carefully carried-out measurements and calculations of doses.
X - r a y s , o n a x i s
2 0 0 5
2 0 3 0 beam number
• 10x10/d-10cm 8x8/d-10cm 10x20/d-10cm 10wx10/d-10cm
i 10x 10/d-5 cm
X - r a y s , o f f - ax i s , s y m m e t r i c 2007
10 15
b e a m n u m b e r
FIG. 1. Non-reference conditions on-axis FIG. 2 Non-reference conditions, off-axis, symmetric fields
M L C - s h a p e d f i e l d
2 0 0 8
1 ,10 •c 0
1 1 .05
I 100 . j ' V l ' l i i M ' « 0 , 9 5 o
0 , 9 0
10 15
b e a m n u m b e r
2 0 2 5
ref
' "small"
k "circular"
"inverted" Y
"irregular"
»"irregular"+ wedge
1.10
•c
« 1.05 W a) u) I 1.00
X - r a y s , o f f - a x i s , a s y m m e t r i c
2 0 0 9
• • • 1
• 2
A 3
A 4 • 5
10 15
beam number
FIG 3. Non-reference conditions, on-axis, fields FIG .4. Non-reference conditions, off-axis, in formed bv MLC various asymmetric set-ups (1 - reference on-
axis, 2, 3 - the field outside the central axis in direction X and Y, 4, 5 -asymmetric field, measuring points on axis and 5 cm off-axis)
Conclusions The methodology and results of the audit permit to introduce and maintain the audit program in non-reference conditions, for on-axis and off-axis measurements and for asymmetric fields, at the national level.
616

Posters relating to Radiation Protection Dosimetry


IDOS, Vienna, 9-12 November 2010 E2-CN-182, Paper No 125
Personnel monitoring services in Kenya
S. Kitia, B. Kaboro\ R. Kinyuac
a Radiation Protection Board (RPB), Ministry of Health, Kisumu, Kenya b Department of Physics, Jomo Kenyatta University (JKUAT), Thika, Kenya
E-mail address of main author: [email protected]
The Harshaw thermoluminescence dosimetry (TLD) reader model 4500C is a state-of-the-art instrument that is used to measure a variety of Tl materials in many forms and sizes. It is discussed in detail somewhere else [1]. The design incorporates two multiplier tubes in a sliding housing for rapid manual reading. The gas heating system uses a stream of hot nitrogen or air at a precisely controlled maximum temperature of 400°C to heat two chipstrates in a carrier card or two positions in a four-chip card. The four-chip cards are then moved automatically into positions for a second readout cycle to complete the card.
All cards were checked for contamination in form of dirt accumulation or long-term drift before measurements were made to ensure that the pattern of the dosimeters' readings confirmed to the nature of the radiation field in which the dosimeters were used. Workers' dosimeters from four departments (nuclear medicine, radiology, radiotherapy and training and research) were analyzed.
The cards were calibrated to ensure that all would give virtually the same response to a given exposure. They were then annealed at 135°C for one hour and re-annealed over one Tl read out cycle. This annealing regime has been demonstrated to be adequate [2], The 1000 dosimeters were further irradiated using an irradiator.
The effective dose Hp(d) was estimated using equation 1 below as recommended by the International Atomic Energy Agency (IAEA) Basic Safety Series (BSS) 115, Vienna (1996) [3],
H p ( d ) = ( Q x E C C ) / R C F ( 1 )
Where: Q = Charge, ECC = Element Correction Coefficient, RCF = Reader Calibration Factor Hp = Effective dose. The personal doses were periodically analyzed to confirm that radiation working conditions remained unchanged.
An average dose of 0.50 mSv was reported. All measurements were found to be within acceptable limits of radiation protection as seen in figure 1. No cases of overexposure were reported. The results have shown that radiation workers in Kenya are in safe working conditions of radiation protection. The results also show that age and gender have no relation with dose absorption as seen in figure 2. This is because radiation safety has been enhanced by improvement in shielding design, good working practices and quality assurance policies.
619

1 . 2
1 -
Q 8 -
Q 6 -
Q 4
Q 2
O-J a n Felo IV3r y^pr f\A*s JLI S p Gfct D t e
FIG. I. Monthly dose for the four Laboratories
[Series l=Radiotherapy, Series 2 Radioing}-. Series 3= Training & Research, Series 4= Nuclear medicine]
FIG. 2. Gender comparison for the four Laboratories
REFERENCES
[1] SI I ADR A OK ANTHONY KTTT, Assessment and Evaluation of personnel dose in Nairobi, Kenya 2006.
[2] INTERNATIONAL ATOMIC ENERGY AGENCY, International basic safety standards for protection against radiation and for safety of radiation sources (1996).
[3] INTERNATIONAL COMMISSION ON RADIATION PROTECTION, Radiation Protection of workers, 75. Annals of the ICRP Vol 27/1
620
IDOS, Vienna, 9-12 November 2010 E2-CN-182, Paper No 125
Characterization of secondary radiation field in radiotherapy facilities with reference to a staff
K. Polaczek-Grelika, B. Karaczyn", A. Orlef0, A. Konefaib, M. Janiszewskr . J. Regulae
aDepartment of Medical Physics, University of Silesia, Katowice, Poland bDepartment of Nuclear Physics and Its Applications, University of Silesia, Katowice, Poland
department of Medical Physics, Centre of Oncology Institute of Oncology M. Sklodowska-Curie Memorial, Gliwice Branch, Poland dDepartment of Medical Physics, Lower Silesian Centre of Oncology, Wroclaw, Poland
department of Radiotherapy, S. Leszczyhski Memorial Hospital, Katowice Poland
E-mail address of main author: [email protected]
Secondaiy' neutron flux and induced radioactivity generated during emission of high-energy therapeutic X-ray beams from linear medical accelerators were investigated using several high-energy photon modes (from 15 to 20 MV) and field sizes relevant for standard and total body therapy. Neutron source strength, neutron effective doses and induced y-radiation dose rates in several radiotherapy facilities in Poland were characterized with respect to the room area and beam energy. The fast and slow components of neutron doses, mechanisms of inducing activity and main radionuclides with regard to their activity, dose contribution and half-life were distinguished.
Prompt gamma neutron activation analysis (PGNAA) and spectrometry system with high purity germanium detector (HPGe) were used. Photopeaks from registered "/-energy spectra were taking into account. This allowed for measurements of the weak neutron fluence outside treatment room applying the method based on germanium crystal activation (peak at 595.85 keV) and paraffin moderators' set described in [1], identification of a main induced radioactivity sources because of the high energy resolution of semiconductor spectrometer and photon flux calculations [2], Neutron and photon dose rates in places accessible for medical staff during various therapeutic and dosimetric operations were estimated using relevant conversion coefficients [3].
The precision of applied method was affected mainly by y-ray counting statistics, since the highest discrepancies in conversion factor values are of the order of 10 % [3]. Therefore maximum uncertainty of neutron doses in clinical conditions is 40 % and gamma radioactivity of 26 %.
Portable in-situ gamma spectrometry system consisting of HPGe detector, DART Ml multichannel analyzer and PC with Gamma Vision software version 5.13 was used for registration of post-irradiation activity of accelerators' heads within an hour after the therapeutic beam was off as well as on-line measurements of activity of treatment room doors and germanium crystal caused by neutrons.
Neutron flux decreases very rapidly at the distance of 50 cm from therapeutic room door, showing an exponential decline of its intensity. The major components of gamma radiation field outside the treatment room are neutron capture in hydrogen 111(n,y)2l I and positron annihilation processes. Photon ambient dose equivalents H (10) 50 cm from accelerator room door are from 0.3 to 2.7 nSv/cGy whilst neutron dose amounts 60 to 85 % of photon dose. These results are dependent on linac accelerating potential as well as shielding constructions of radiotherapy facility. Irradiation field size, additional equipment (e.g. wedge) and gantry position affect on these values. Studies performed by us indicate
621

that at least 50 % of linac radioactivity is induced in its interior parts, therefore accelerator head's casing is lowering the photon dose rate with the main contribution of 5oMn, l24Sb and 8 Br nuclides generated in neutron capture reactions. Therapeutic equipment (e.g. wedge) effective dose can reach the order of 0.1 nSv/cGy when it is used. Nevertheless it decays very rapidly, since it is connected mainly with 28A1 activity.
Obtained results indicate the locations of increased radiation in radiotherapy facilities where high-energy linacs are operating and therefore are useful from radiation protection point of view. The time and energy scale of secondary radiation as well as its main sources were shown. These informations could be helpful in matching behavior of staff aimed at minimizing unnecessary doses.
REFERENCES
[1] CHAO, J.-H., NIU, H., Measurement of neutron dose by a moderating germanium detector. Nuclear Instruments and Methods in Physics Research A (1997), 385: 161 - 165.
[2] KONEFAt, A., POLACZEK-GRELIK, K„ ZIPPER, W„ Undesirable nuclear reactions and induced radioactivity as a result of the use of the high-energy therapeutic beams generated by medical linacs. Radiation Protection Dosimetry (2008), 128(2): 133 - 145.
[3] ICRP Publication No. 74 Conversion coefficients for use in radiological protection against external radiation; Annals of the ICRP (1996).
622

IDOS, Vienna, 9-12 November 2010 E2-CN-182, Paper No 125
Determination of the optimum frame of an entrance door to a treatment room with a linear accelerator generating high energy X rays
A, Konefal, W. Zipper
Institute of Physics, Department of Nuclear Physics and Its Application, Silesian University, Katowice, Poland.
E-mail address of main author: [email protected]
The high-energy therapeutic X-ray and electron beams generated by linear accelerators are contaminated by neutrons originating from photonuclear (y,n) and electronuclear (e,e'n) reactions. The neutron production yield is related to the type of the beam i.e. the cross sections of photonuclear reactions are about 3 orders of magnitude greater than those for electronuclear reactions in the energy range of the therapeutic beams. The energy threshold of the (y,n) reactions is about 8.5 MeV for most isotopes. Majority of the neutrons reach the concrete walls of the accelerator bunker. Concrete is a good moderator. In this medium the neutrons undergo elastic collisions with nuclei of hydrogen mainly. The slowed-down neutrons may get out of concrete and return to air, contributing to the specific distribution of neutron energy in the treatment room [1], As our Monte Carlo calculations have shown the kinetic energy of neutrons reaching the door to a treatment door are distributed according to the Maxwell-Boltzmann distribution law (a number of neutron with energy greater than 100 eV do not exceed 2% of all neutrons). Usually this door separates a treatment room from an operator room. Typically the door consists of 2 several centimeter thick layers: moderator (paraffin or polyethylene) and lead. Such frame is unsuitable because neutrons as well as gamma radiation appear close to the door in an operator room [2]. This radiation can be an additional contribution to a dose to staff operating the accelerator. The purpose of the presented investigations was the determination of the optimum frame of an entrance door to a treatment room with a linear accelerator generating high-energy X-rays. The investigations were based on the Monte Carlo calculations realized by computer simulations. The simulation program was based on GEANT4 code (version 4.7.1). The High Precision model was applied for the simulations of neutron physical processes and the Low Energy model was used for simulations of interactions of photons and electrons with matter. In the simulations the uniform neutrons flux with the Maxwell-Boltzmann energy distribution hit the door. Trajectories of the entrance neutron beam were perpendicular to the surface of the first layer of the door. The transmission T of the neutrons (i.e. ratio of a number of neutrons passing through a layer to a number of neutrons hitting a layer), spectra of the neutrons passing through the layer and spectra of gammas produced by neutrons in the layer were determined. Paraffin (C.">(iI I density 0.9 g/cm3) - material reach in hydrogen and two optional materials borax (Na^B^V101LO, 1.72 g/cm3) and boron (natural boron, 2.34 g/cm3) were considered as a material reducing a number of neutrons i.e. as the fist layer of the door. Lead (natural lead, 11.35 g/cm3) was taken into account as the second layer. The neutron transmission T and the photon productions for considered materials with various thicknesses are presented in Figure 1. The spectrum of neutrons passing through the door and photons produced in the layers for a typical door consists of the 4cm thick paraffin layer and the 4cm thick lead layer are presented in Figure 2. The add of the 1mm thick boron layer before paraffin or displacement of this paraffin layer by the 2cm thick borax layer reduces neutrons as well as photon radiation completely.
623
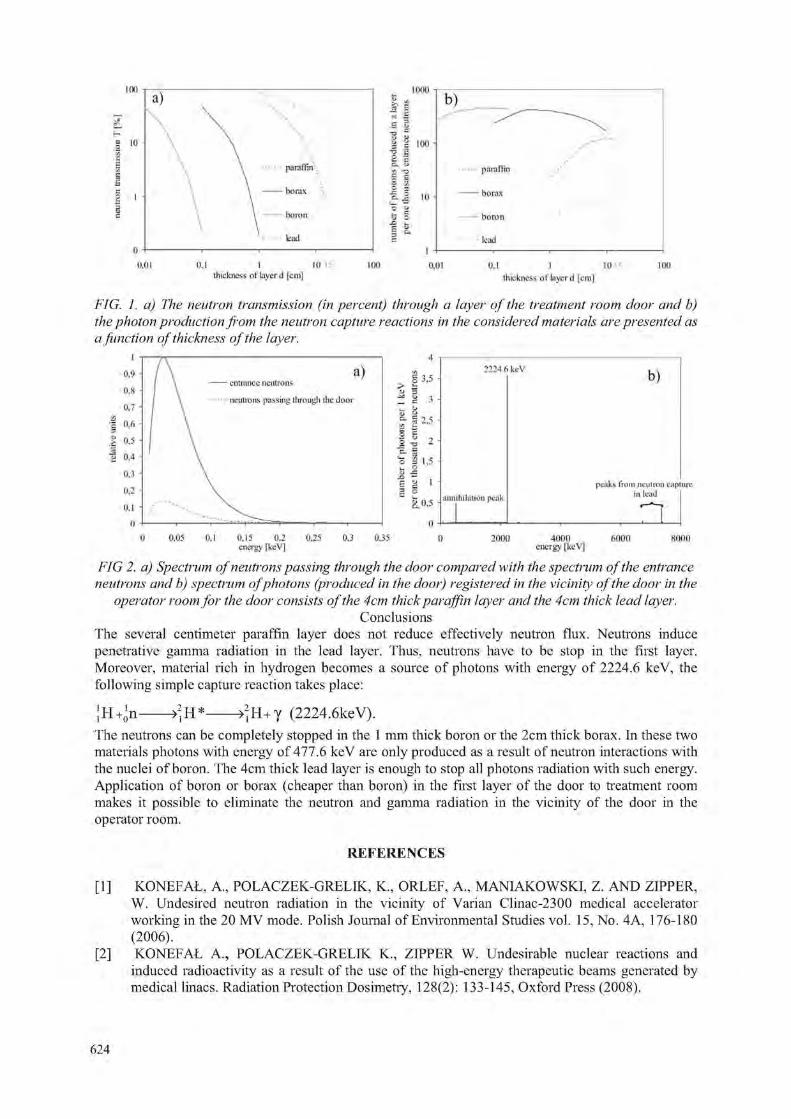
- borax boron bad
c. M if) B o - b
- borax boron lead
0,1 I II) i luck [loss of layer d [cm]
1(K) 0.01 0.1 I 1015 ihidincss of layer d [cm]
100
FIG. 1. a) The neutron transmission (in percent) through a layer of the treatment room door and b) the photon production from the neutron capture reactions in the considered materials are presented as a function of thickness of the layer.
- ciitnavee neutrons neutrons passing llirough die door
g 3.5 > is ^ u -J . L.
? 12*5
1 i , 2 -a 2 e. -a I 1,5 ^ 2 e 'i I 3 o
§.0,5
2224 6keV
unmhilaliun peak
b)
peaks from neutron capture in lead
n 0.15 0,2 energy [keV] 0,35 20011 4000 energy [krV] fiOOO fioon
FIG 2. a) Spectrum of neutrons passing through the door compared with the spectrum of the entrance neutrons and b) spectrum ofphotons (produced in the door) registered in the vicinity of the door in the
operator room for the door consists of the 4cm thick paraffin layer and the 4cm thick lead layer. Conclusions
The several centimeter paraffin layer does not reduce effectively neutron flux. Neutrons induce penetrative gamma radiation in the lead layer. Thus, neutrons have to be stop in the first layer. Moreover, material rich in hydrogen becomes a source of photons with energy of 2224.6 keV, the following simple capture reaction takes place:
; h ->jH+y (2224.6keV). The neutrons can be completely stopped in the 1 mm thick boron or the 2cm thick borax. In these two materials photons with energy of 477.6 keV are only produced as a result of neutron interactions with the nuclei of boron. The 4cm thick lead layer is enough to stop all photons radiation with such energy. Application of boron or borax (cheaper than boron) in the first layer of the door to treatment room makes it possible to eliminate the neutron and gamma radiation in the vicinity of the door in the operator room.
REFERENCES
[1] KONEFAt, A., POLACZEK-GRELIK, K„ ORLEF, A., MANIAKOWSKI, Z. AND ZIPPER, W. Undesired neutron radiation in the vicinity of Varian Clinac-2300 medical accelerator working in the 20 MV mode. Polish Journal of Environmental Studies vol. 15, No. 4A, 176-180 (2006).
[2] KONEFAt A., POLACZEK-GRELIK K„ ZIPPER W. Undesirable nuclear reactions and induced radioactivity as a result of the use of the high-energy therapeutic beams generated by medical linacs. Radiation Protection Dosimetry, 128(2): 133-145, Oxford Press (2008).
624
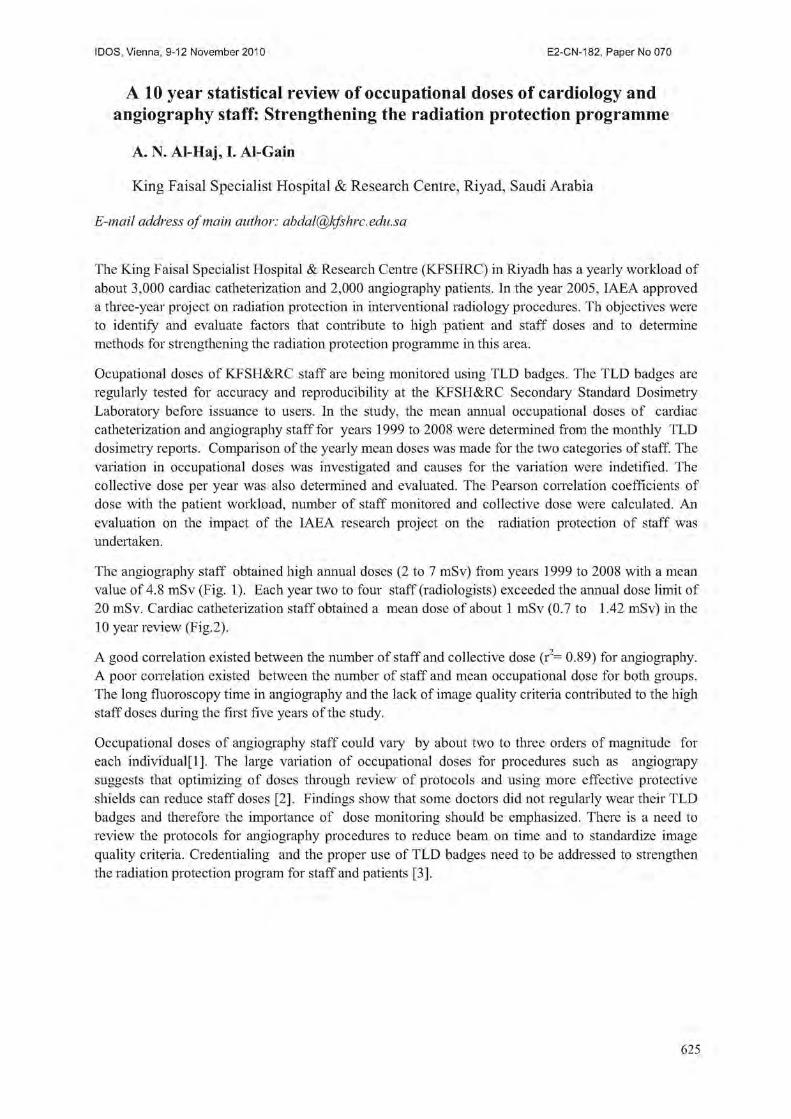
IDOS, Vienna, 9-12 November 2010 E2-CN-182, Paper No 125
A 10 year statistical review of occupational doses of cardiology and angiography staff: Strengthening the radiation protection programme
A. N. Al-Haj, I. Al-Gain
King Faisal Specialist Hospital & Research Centre, Riyad, Saudi Arabia
E-mail address of main author: [email protected]
The King Faisal Specialist Hospital & Research Centre (KFSHRC) in Riyadh has a yearly workload of about 3,000 cardiac catheterization and 2,000 angiography patients. In the year 2005, IAEA approved a three-year project on radiation protection in interventional radiology procedures. Th objectives were to identify and evaluate factors that contribute to high patient and staff doses and to determine methods for strengthening the radiation protection programme in this area.
Ocupational doses of KFSH&RC staff are being monitored using TLD badges. The TLD badges are regularly tested for accuracy and reproducibility at the KFSH&RC Secondary Standard Dosimetry Laboratory before issuance to users. In the study, the mean annual occupational doses of cardiac catheterization and angiography staff for years 1999 to 2008 were determined from the monthly TLD dosimetry reports. Comparison of the yearly mean doses was made for the two categories of staff. The variation in occupational doses was investigated and causes for the variation were indetified. The collective dose per year was also determined and evaluated. The Pearson correlation coefficients of dose with the patient workload, number of staff monitored and collective dose were calculated. An evaluation on the impact of the IAEA research project on the radiation protection of staff was undertaken.
The angiography staff obtained high annual doses (2 to 7 mSv) from years 1999 to 2008 with a mean value of 4.8 mSv (Fig. 1). Each year two to four staff (radiologists) exceeded the annual dose limit of 20 mSv. Cardiac catheterization staff obtained a mean dose of about 1 mSv (0.7 to 1.42 mSv) in the 10 year review (Fig.2).
A good correlation existed between the number of staff and collective dose (r2= 0.89) for angiography. A poor correlation existed between the number of staff and mean occupational dose for both groups. The long fluoroscopy time in angiography and the lack of image quality criteria contributed to the high staff doses during the first five years of the study.
Occupational doses of angiography staff could vary by about two to three orders of magnitude for each individual[l]. The large variation of occupational doses for procedures such as angiograpy suggests that optimizing of doses through review of protocols and using more effective protective shields can reduce staff doses [2], Findings show that some doctors did not regularly wear their TLD badges and therefore the importance of dose monitoring should be emphasized. There is a need to review the protocols for angiography procedures to reduce beam on time and to standardize image quality criteria. Credentialing and the proper use of TLD badges need to be addressed to strengthen the radiation protection program for staff and patients [3]
625

• 1999 • 2000 • 2001 • 2002 • 2003 • 2004
• 2005 • 2006 • 2007 • 2008
• 1999 • 2000 • 2001 • 2002 • 2003 • 2004
• 2005 • 2006 • 2007 • 2008
• 1999 • 2000 • 2001 • 2002 • 2003 • 2004
• 2005 • 2006 • 2007 • 2008
1
• 1999 • 2000 • 2001 • 2002 • 2003 • 2004
• 2005 • 2006 • 2007 • 2008
-
1
• 1999 • 2000 • 2001 • 2002 • 2003 • 2004
• 2005 • 2006 • 2007 • 2008
-[ - -
1
1 1 II
-
1 l l - -
1
i i IT 1 11 1 < 0 . 1 0.1 to <1 1 to < 5 5 to < 1 0 10 to < 2 0 > 2 0
Dose range (mSv)
FIG. 1. Distribution of angiography staff in different dose ranges each year over a monitoring period of 10 years.
• 1999 • 2000 • 2001 • 2002 • 2003 • 2004 • 2005 • 2006
2007 • 2008
• 1999 • 2000 • 2001 • 2002 • 2003 • 2004 • 2005 • 2006
2007 • 2008
-I
• 1999 • 2000 • 2001 • 2002 • 2003 • 2004 • 2005 • 2006
2007 • 2008
y
• 1999 • 2000 • 2001 • 2002 • 2003 • 2004 • 2005 • 2006
2007 • 2008
y
I • 1999 • 2000 • 2001 • 2002 • 2003 • 2004 • 2005 • 2006
2007 • 2008
y
I -• 1999 • 2000 • 2001 • 2002 • 2003 • 2004 • 2005 • 2006
2007 • 2008
y
I - f T r - n I~1 n
<0,1 0.1 to <1 1 to < 5 5 to <10 10 to <20 >20
Dose range (mSv)
FIG. 2. Distribution of cardiology satff in different dose ranges each year over a monitoring period of 10 years.
REFERENCES
[1] AL-HAJ, A, LAGARDE, C, LOBRJGIJITO, A. Dose trend analysis of selected occupational categories at a large medical center. Presented in the IM 2005
[2] KIM, KP, MILLER, DL, BALTER, S, KLEINERMAN, R, et al, Occupational radiation doses to operators eprforming cardiac catheterization procedures, Health Phys., 94(3) (2008), pp. 211-227.
[3] KUIPERS, G, VELDRS, X. Effective dose to staff from interventional procedures : estimations from single and double dosimetry. Radiat Prot Dosim, 2009; 136(2): (95 100).
626

IDOS, Vienna, 9-12 November 2010 E2-CN-182, Paper No 125
Staff dosimetry in interventional cardiology using electronic personal dosimeters
I.I. Suliman, M.K. A. Bashier, S. G. Elnour, I. Salih
Sudan Atomic Energy Comission, P.O. Box 3001, Khartoum, Sudan
E-mail address of main author: i [email protected]
Study was performed to measure radiation dose to staff involved in fluoroscopically guided interventional cardiology (IC) procedures. 33 staffs were monitored in 39 IC procedures performed during 4 week period in two most occupied cardiology centers in Khartoum, Sudan. Staffs were 15 cardiologist, 13 nurses and 5 radiographers. Radiation doses were measured using electronic personal dosimeters (EPD) type RAD-60 with Energy compensated Si-Diode detectors (RADOS, Finland). Perior to experimental measurements, EPDs were calibrated in three X-ray qualities described in the ISO 4037 narraw spectrum series avialble at the secondary standard dosimetry laboratory. EPDs were calibrated to measure personal dose equivalent, Hp(10) using ICRU slab phantom.
For occupational dose assessments, each staff was provided one EPD worn on chest above the lead apron and read immediately after the procedures. Effective doses were estimated from the measured personal dose equivalent, Hp(10) using single dosimetry algorithm [1]. Based on the calibration resulted , the selected EPDs performed satifactorily in X-ray qualities indicated. Cardiologist received the highest doses, followed by nurses and then technologists.
Estimated median and maximum effective doses per year are presented in Fig. 1. Maximum effective doses up to 1.4 mSv per year was estimated. The calculated effective doses were well below the annual dose limits of 20 mSv per year recommended by ICRP [2], However, the absent of continuous radiation servialence is the major source of concern since individual doses may vary according to the length, type and complexity of these procedures.
The study could encourage staffs to acquire electronic dosimeters as a way for individual dose measurements in the absent of legal dosimetry service in the country. EPDs could replace passive dosimeters owing to direct reading and alarm features whoever, it is not practical for double dosimetry as more than one EPDs will be required for each staff and also owing to difficulties in their use in some organs such as neck and at the extremities.
627
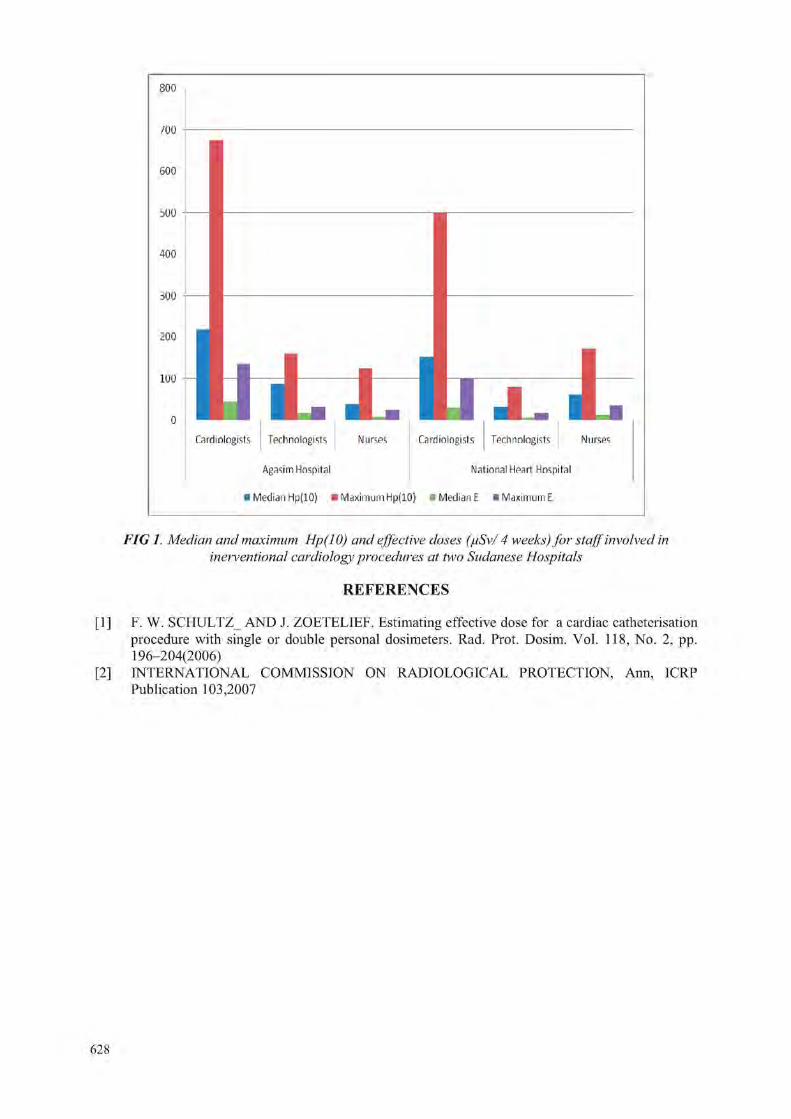
800
/oo
600
bOO
400
iOO
200
100
Technologists
J. Cardiologists Tfifhnnlngists Nurses Carrliningists
Agasim Hospital National Hpart Hospital
• Median Hp(10) • Maximum Hp(10) • Median E • Maximum E
Nurses
FIG 1. Median and maximum Hp(10) and effective doses (juSv/ 4 weeks) for staff involved in metventional cardiology procedures at two Sudanese Hospitals
REFERENCES
[1] F. W. SCHULTZ_ AND J. ZOETELIEF. Estimating effective dose for a cardiac catheterisation procedure with single or double personal dosimeters. Rad. Prot. Dosim. Vol. 118, No. 2, pp. 196-204(2006)
[2] INTERNATIONAL COMMISSION ON RADIOLOGICAL PROTECTION, Ann, ICRP Publication 103,2007
628

IDOS, Vienna, 9-12 November 2010 E2-CN-182, Paper No 125
Evaluation of radiation protection status in some health centers in the Sudan
A. Sulieman*, S. Khalifa, M. Elfadil
College of Medical Radiologic Science, Sudan University of Science and Technology, P.O.Box 1908, Khartoum, Sudan
* Corresponding Author: Tel: +249910874885,Fax: +249 183 785215,
E-mail address of main author; [email protected]
Abstrract
This study is intended to evaluate the radiation protection status in some health centers, in Omdurman city in the Sudan. It was carried out in four health care centers (Aldaw-Hajoj, Abo-Sed, Wad-Nobawi and Alraklia).
The following parameters were investigated; X ray machine performance, ambient dose, patient dose, X ray room design, radiation protection knowledge for technologists and staff and room design. The data was collected by the way of measuring patient dose using TLD placed on the patients' skin surface at the point of insertion of the central axis beam using very thin envelopes made of white polyethylene plastic foil, each contains 3 TLDs. All the centers investigated are equipped with mobile machines and serve the local community. Due to the poor facilities in the departments, these departments receive only the cases of routine (plain) films.
Radiation exposure surveys were earned out using survey meters and quality control test tools. The remaining data was collected using questionnaires.
The patient dose was measured to 108 patients in four centers in Omdurman city. The patient data, dose and questionnaires were statistically analyzed and were computed and graphically represented.
The results of the tests were acceptable in all parameters except the test of filtration, which showed that the filtration was not enough. The machines at Aldaw-Hajoj and Alrakha lacked light beams to check the collimations. The results are summarized in (Table 1).
Table:! Presents the result of QC tests in those centers. Name of test Aldaw-I Iajoj Abo-Sed Wad-Nobawi Alrakha Reproducibility of exposure
<0.05 <0.05 <0.05 <0.05
Radiation out put < 10% < 10% < 10% < 10% Filtration check <0.5 <0.5 <0.5 <0.5 kVp accuracy <4 of each
other <4 of each other <4 of each other <4 of each
other mAs linearity 0.0008 0.0007 0.001 0.005 Perpendicularity - acceptable acceptable -
Beam restriction system - acceptable acceptable -
629
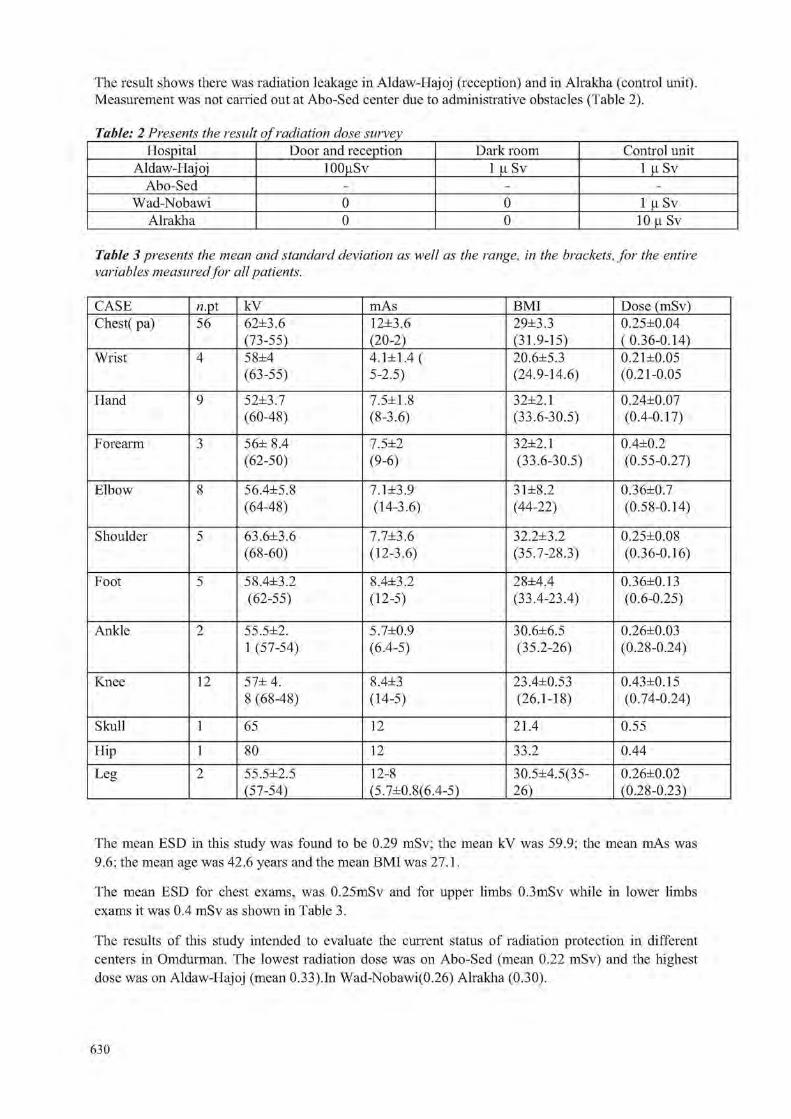
The result shows there was radiation leakage in Aldaw-Hajoj (reception) and in Alrakha (control unit) Measurement was not carried out at Aho-Sed center due to administrative obstacles (Table 2).
Table: 2 Presents the result of radiation dose survey Hospital Door and reception Dark room Control unit
Aldaw-Hajoj 100(.iSv 1 u Sv 1 u Sv Abo-Sed - - -
Wad-Nobawi 0 0 1 u Sv Alrakha 0 0 10 n Sv
Table 3 presents the mean and standard deviation as well as the range, in the brackets, for the entire variables measured for all patients.
CASE 72.pt kV mAs BMI Dose (mSv) C-hest( pa) 56 62±3.6 12±3.6 29±3.3 0.25±0.04
(73-55) (20-2) (31.9-15) (0.36-0.14) Wrist 4 58±4 4.1 t 1.4 ( 20.6±5.3 0.21±0.05
(63-55) 5-2.5) (24.9-14.6) (0.21-0.05
Hand 9 52±3.7 7.5±1.8 32±2.1 0.24., 0.07 (60-48) (8-3.6) (33.6-30.5) (0.4-0.17)
Forearm 3 56± 8.4 7.5±2 32±2.1 0.4±0.2 (62-50) (9-6) (33.6-30.5) (0.55-0.27)
Elbow 8 56.4±5.8 7,1 ±3,9 3lJ=8.2 0.36±0.7 (64-48) (14-3.6) (44-22) (0.58-0.14)
Shoulder 5 63.6±3.6 7.7±3.6 32.2±3.2 0.25±0.08 (68-60) (12-3.6) (35.7-28.3) (0.36-0.16)
Foot 5 58.4±3.2 8.4±3.2 28±4.4 0.36±0.13 (62-55) (12-5) (33.4-23.4) (0.6-0.25)
Ankle 2 55.5±2. 5.7±0.9 30.6±6.5 0.26±0.03 1 (57-54) (6.4-5) (35.2-26) (0.28-0.24)
Knee 12 57± 4. 8.4±3 23.4±0.53 0.43±0.15 8 (68-48) (14-5) (26.1-18) (0.74-0.24)
Skull 1 65 12 21.4 0.55
Hip 1 80 12 33.2 0.44 Leg 2 55.5±2.5 12-8 30.5:4.5(35- 0.26±0.02
(57-54) (5.7±0,8(6.4-5) 26) (0.28-0.23)
The mean ESD in this study was found to be 0,29 mSv; the mean kV was 59.9; the mean mAs was 9,6; the mean age was 42.6 years and the mean BMI was 27.1.
The mean ESD for chest exams, was 0.25mSv and for upper limbs 0.3mSv while in lower limbs exams it was 0.4 mSv as shown in Table 3.
The results of this study intended to evaluate the current status of radiation protection in different centers in Omdurman. The lowest radiation dose was on Abo-Sed (mean 0.22 mSv) and the highest dose was on Aldaw-Hajoj (mean 0.33).In Wad-Nobawi(0.26) Alrakha (0.30).
630

The dose exceeded the DRL suggested by the NRPB in some situations in the four centers as follows: Abo-Sed center; (10%), Aldaw-Hajoj center; (55%), Wad-Nobawi center; (45%) and Alrakha center; (55%).
The protection status associated with co-patients was good in three centers and high on Aldaw-Hajoj center where the dose at the reception reached 100|iSv. The dose for technologist was acceptable in two centers as recommended by (ICRP) and high in one center (Alrakha 21.12mSv per year).
The knowledge of medical doctors in the field of radiation protection concepts was veiy poor. Therefore, unnecessary exposure and optimization and justification principles were hard to be applied.
Reduction of the patient dose can be achieved by using collimation-fast speed screen-high kV techniques. Periodical monitoring of patient doses should be performed every 3 years as recommended at international levels. Quality control tests are crucial in radiation dose optimization and diagnostic reference levels. Continuous training in radiation protection is vital for medical doctors and technologists.
REFERENCES
[1] A SULIEMAN, K. THEODOROU, M. VLYCHOU, T. TOPALTZIKIS, C, ROUNDAS, I. FEZOULIDIS AND C. KAPPAs. Radiation dose optimisation and risk estimation to patients and staff during hysterosalpingography Radiation Protection Dosimetiy 2008 128(2):217-226.
[2] A SULIEMAN, K THEODOROU, M VLYCHOU, T, TOPALTZIKIS, D KANAVOU , I FEZOULIDIS KAPPAS. Radiation dose measurement and risk estimation for paediatric patient undergoing micturating cystourethrography. The British Journal of Radiology. (2007) 80, 731-737.
[3] BROADHEAD DA, CHAPPLE, BA, AND K FAULKNER. The impact of digital imaging on patient doses during barium studies. The British Journal of Radiology (1995) 68, 992-996.
[4] ROBIN J WILKS BCSPHD- Principle of radiological physics Churchill Livingstone Edinburgh London Newyouk 1981 page 395-402 . 281.
631


IDOS, Vienna, 9-12 November 2010 E2-CN-182, Paper No 125
Uncertainty assessment in the biokinetic and dosimetric models of 210Po: New ingestion dose coefficients
S. Saidoua \ S. Baechlerc, J Guilhermed
aNuclear Technology Section/Institute for Geological and Mining Research, Yaounde, Cameroon
bDepartment of Physics/University of Yaounde I, Yaounde, Cameroon
cUniversity Institute for Radiation Physics, Lausanne, Switzerland
dNational Ionizing Radiation Metrology Laboratory/Institute for Radiation Protection and Dosimetry, Rio de Janeiro, Brazil
E-mail address of main author: [email protected]
"°Po is one of the most radiotoxic radionuclide met in the environment and is present in all of its compartments. Thus 210Po is also present in foodstuffs at different concentrations. Many studies of 210Po in seafood, meat and vegetables were reported. To assess the corresponding ingestion dose, the ingestion dose coefficients of ICRP 67 [1] for the members of the public and workers are frequently used. These coefficients stem from the simple biokinetic model using gastro-intestinal tract and dosimetric models of alpha emitter described in [2]. A new biokinetic model more detailed and realistic was published by Leggett and Eckerman [3]. New anatomical and physiological data [4], new human gastrointestinal tract [5] and new nuclear data [6] were published. All these reports imply new calculations of the ingestion dose coefficients for all the radionuclides of interest. During recent reported study on environmental natural radioactivity measurements in the uranium-bearing region of Poli in Cameroon, high concentrations of21< Po in vegetables were found leading to an ingestion dose
210 210 * * * of 2.2 mSv/year whose 62% and 36% for " Po and ~ Pb respectively [7], This constitutes one of the reasons that led us to reevaluate ingestion coefficient dose of 210Po and uncertainty stemming from its biokinetic and dosimetric models. New values 0.23(xSv/Bq and 1.68(xSv/Bq respectively for the members of the public and for the workers were brought out to replace old values 0.24(iSv/Bq and 1.2(.iSvyBq. First calculations of uncertainties led to the values around 100%. The uncertainty assessment to establish a clear and well estimated uncertainty budget is ongoing.
References
[1 ] INTERNATIONAL COMMISSION ON RADIOLOGICAL PROTECTION, ICRP 67, 1994.
[2] INTERNATIONAL COMMISSION ON RADIOLOGICAL PROTECTION, ICRP 30, 1979.
[3] LEGGETT, R.W, ECKERMAN, K.F., 2001. Science of the Total Environment 275 (109-125).
[4] INTERNATIONAL COMMISSION ON RADIOLOGICAL PROTECTION, ICRP 89, 2003.
[5] INTERNATIONAL COMMISSION ON RADIOLOGICAL PROTECTION, ICRP 100, 2006.
[6] INTERNATIONAL COMMISSION ON RADIOLOGICAL PROTECTION, ICRP 107, 2009.
[7] SAIDOU ET AL. Environmental Natural Radioactivity Measurements and dose calculations to the public: case of the uranium-bearing region of Poli in Cameroon. Radiation Measurements, in press.
633


IDOS, Vienna, 9-12 November 2010 E2-CN-182, Paper No 125
Otimization of position of skin dose monitor on hands of nuclear medicine staff
M. Fulopa, P. Povinecb, I. Makaiovac, J. Veselyc, L. Hornanska\ A. Vondrakd, Z. Cesnakova', S. Skraskova0, K. Aksamitova0, D, Bacekb, P. Vlkb, J. Kantova0, A. Fiiriovac
aSlovak Medical University, Bratislava, SLOVAKIA, bBIONT, Bratislava, SLOVAKIA, cOUSA, Bratislava, Slovakia, dIzotopcentrum, Nitra, Slovakia
Email address of main author: [email protected]
In nuclear medicine departments, the skin of worker's hands is the most exposed to radiation. The 2
skin dose limit is applied to the dose averaged over area of 1cm at the location with the highest equivalent dose (Hpmax(0,07)). The specific nature of work performed with radiopharmaceuticals causes significant differences in the position of Hpmax(0,07).
Inhomogeneous radiation fields causes difficulties in reliable determination of absorbed dose. To obtain received Hpmax(0,07) value from the measured dose value, correction factors must be used..
At the location of extremity dosimeter at the base of middle finger (in palmar orientation) the relative standard deviations in experimental determination of the correction factor can reach rather high values (up to 65%) [1],
It is of crucial importance to wear the extremity dosimeter at proper position, where the correction factor is determined with a good accuracy (about 30% of relative standard deviation) for hand irradiation during routine manipulation with radiopharmaceuticals.
MCNPX simulations with hand phantoms showed, that the proper place, where Hpmax(0,07) could be monitored with good accuracy, is at index finger intermediate phalange (in dorsal orientation) [2],
In this work the accuracy of Hpmax(0,07) determination using extremity dosimeter located at the intermediate phalange of index finger (in dorsal orientation) was verified experimentally in real conditions of routine 18F-FDG manipulation.
Since index finger tip and thumb belong among locations with the highest values of skin dose, the measurements of Hpmax(0,07) were performed at pad and nail of index fingers and at ball of the thumbs. Thin TLDs MCP-Ns for measurement of positron and gamma dose to skin were used. The TLDs were encapsulated in a polyethylene foil with the thickness of 0.03 mm and attached under latex gloves.
Based on about 80 preliminary measurements the value of relative standard deviation of ratios of Hpmax(0,07) and response of extremity dosimeter located at index finger intermediate phalange (dorsal orientation) was determined on level of 33%. In addition, wearing the extremity dosimeter at index finger intermediate phalange does not hamper nuclear medicine staff during work with radiopharmac euticals.
Presented preliminary results will be completed with further measurements in real conditions of handling with radiopharmaceuticals at nuclear medicine departments and at radiochemical laboratories for radiopharmaceutical production and quality control.
635

This work was supported by project MZ SR No.2005/26-SZU-04.
REFERENCES
[1 ] WRZESIEN, M., OLSZEWSKI, J., JANKOWSKI, J., Hand Exposure to Ionising Radiation of Nuclear Medicine Workers, Radiation Protection Dosimetry (2008), Vol.130, No. 3, pp.323-330
[2] FULOP, M„ POVINEC, P., BACEK, D„ VLK P., Study of Hand Skin Dose During Administration of FDG, Book of abstracts, Annual Congress of the Euroepean Associ ation of Nuclear Medicine, Barcelona, 2009
636

IDOS, Vienna, 9-12 November 2010 E2-CN-182, Paper No 125
Comparing calibration factors for gamma and beta radiations of portable detectors
F.B.C.Nonato, V.Vivolo, L.V.E.Caldas
Instituto de Pesquisas Energeticas e Nucleares, IP EN - CNEN/SP, Sao Paulo, Brazil
E-mail address of main author: [email protected]
Eighteen Geiger-Miiller detectors of seven manufactures and eleven different models, and five ionization chambers of two manufactures and three different models were calibrated/tested in standard fields of gamma (1 Cs and ''"Co) and beta (%Sr +90Y) radiations. Initially, the calibration factors were obtained for the instruments using gamma radiation.
At the Calibratin Laboratory of IPEN, the radiation detectors are usually adjusted and calibrated with gamma radiation (137Cs). In this work, most of the radiation monitors calibrated with gamma radiation presented calibration factors close to the unit value for (137Cs). The calibration factors of the Geiger-Miiller detectors varied betweem (0,91± 0.01) and (1.28 ± 0.02). In the case of the ionization chambers, they varied between (0.81 ± 0.01) and (0,98 ± 0,02). In the case of the 60Co source, the calibration factors varied between (0.69 ± 0.01) and (0,96 ± 0,01), and for the ionization chambers they varied between (0.82 ± 0.01) and (0,97 ± 0,02). According to the Brazilian recommendations [1], the mean value obtained by reading the instrument at 50% of the scale should not vary more than ± 10% compared to the conventional true value. Most instruments showed satisfactory results.
For the tests with radiation detectors in beta radiation fields, it was observed, for the source of (90Sr +90Y), that the values obtained for the calibration factor were substantially higher, even in the case of the ionization chambers. The radiation detectors were tested in beta radiation beams of the secundary standard of the laboratory, Buchler, BSS1, traceable to Physikalisch-Technische Bundesanstalt (PTB). The calibration factors obtained for beta radiation sources is a multiplicative factor to be applied to the instrument reading.
Sometimes, users simply ask for gamma calibration of their beta-gamma instruments, and they erroneously use the radiation monitors to detect and quantify sources of beta radiation too. The calibration factors of the Geiger-Miiller detectors varied from (3.20 ± 0.03) mGy/R to (32.39 ± 0.32) mGy/R for (90Sr +90Y), and the calibration factors of the ionization chambers varied from (11,07 ± 0,11) mGy/R to (13,29 ± 0,3) mGy/R. Although the calibration factors of the ionization chambers are lower compared to the values obtained by the Geiger-Mueller detectors, they are significant.
The results of the study of energy dependence of the detectors for beta radiation sources shows the enormous mistakes that can be committed if the measurements obtained by the users are not properly understood and corrected. In this type of performance test no radiation detector would be approved by the international standard EN 60846 [2], which determines that the energy dependence can not vaiy more than 40%.
The dependence of the detector response on the radiation type (gamma and beta) was also studied. This dependence was obtained by comparing the calibration factors to beta sources in relation to the calibration factors for gamma sources. The values of the dependence of detector response on the radiation type were very high, even in the case of the ionization chambers. These results show the calibration importance of the beta-gamma detectors with both kinds of radiation. The radiation detectors calibrated only with gamma radiation shall not be used to quantify measurements of beta radiation fields.
637

ACKNOWLEDGEMENTS
The authors are thankful to CNPq, FAPESP, CAPES and MC I' (lNCT for Radiation Metrology in Medicine), Brasil, for partial financial support.
REFERENCES
[1] INSTITUTO DE RADIOPROTECAO E DOSIMETRIA, CRIOLAB 06.DOC. Requirements for operation of calibration laboratories of ionizing radiation detectors used in radioprotection/ Brazilian Ionizing Radiation Metrology Laboratory, IRD / RJ / CNEN / Rio de Janeiro: Instituto de Radioprote9ao e Dosimetria; 2004. (In Portuguese)
[2] EUROPEAN STANDARD. Radiation protection instruments - Ambient and/or directional dose equivalent (rate) meters and/or monitors for beta, X and gamma radiation. EN, Brussels, 2004. (EN 60846).
638

IDOS, Vienna, 9-12 November 2010 E2-CN-182, Paper No 125
Comparative study of Brazilian and North American unshielded primary air kerma of radiological equipment
P. R. Costaa, 1. T. Taniguti\ T. A. C. Furquim0
TJniversidade de Sao Paulo
Institute de Fisica - Departamento de Fisica Nuclear - Laboratorio de Dosimetria
bUniversidade Estadual Paulista "Julio de Mesquita Filho" - Campus de Botucatu
Medical Physics student - sponsored by CNPq (INCT project on Radiation Metrology)
cInstituto de Eletrotecnica e Energia da Universidade de Sao Paulo
Sao Paulo, Brazil
The philosophy of shield design in diagnostic radiology has changed in recent years, due to the more restrictive dose limits to workers and public adopted in various countries. According to report 147 of the National Council of Radiation Protection and Measurements (NCRP 147, 2004) [ 1], the structural shielding design is based on the quantity of unshielded primary air kerma, measured at the distance of one meter. Due to the fact that air kerma presents a strong dependent on the workload and output of the x-ray tube, NCRP 147 [1] provides reference values for these parameters, all of them based on North-American clinical routine. The present work surveyed Brazilian values of workload, patient workflow and X-ray tube output, in order to estimate the unshielded primary air kerma at one meter for different diagnostic modalities.
For this purpose, 2213 workload values [mA.min/week], patient workflow [number of patients per week] and x-ray tube output [mGy/mA.min] were surveyed. These values were distributed in thirteen clinical modalities. These data were collected in 2002 radiometric surveys and quality control reports performed during the period of 1999 to 2009. Forty-three different institutions, located in the southern and southeastern geographic regions of Brazil participated in this survey.
As an example of the normalized workloads results, for general radiography modality the obtained value was (1.33 ± 6.35) mA.min.patient-1 and for chest radiography (0.56 ± 0.40)mA.min.patient-l. These values presented differences of -27.5% and -6.7% respectively, compared to the data published at NCRP 147 [1], In contrast, mammography presented a positive difference of 49.5%, with the estimated value of (10.00 ± 18.77) mA.min.patient-1 compared to (6.69 ± 3.4) mA.min.patient-1 from the publication.
The high standard deviations observed in the evaluation were mainly attributed to the indirect data collection and the differences presented in the radiographic techniques conducted by the radiographers. In contrast, the results of x-ray tube output showed relative lower standard deviation. In this case the survey methodology had a defined procedure which was well controlled.
Differences of 18.7% for conventional radiology and -17.7% for chest radiography were found comparing the results obtained by the calculation of Kpl(0) and the values suggested by the NCRP 147 [1], This shows that significant differences can be observed when comparing local data to NCRP 147 [1] standard.
639
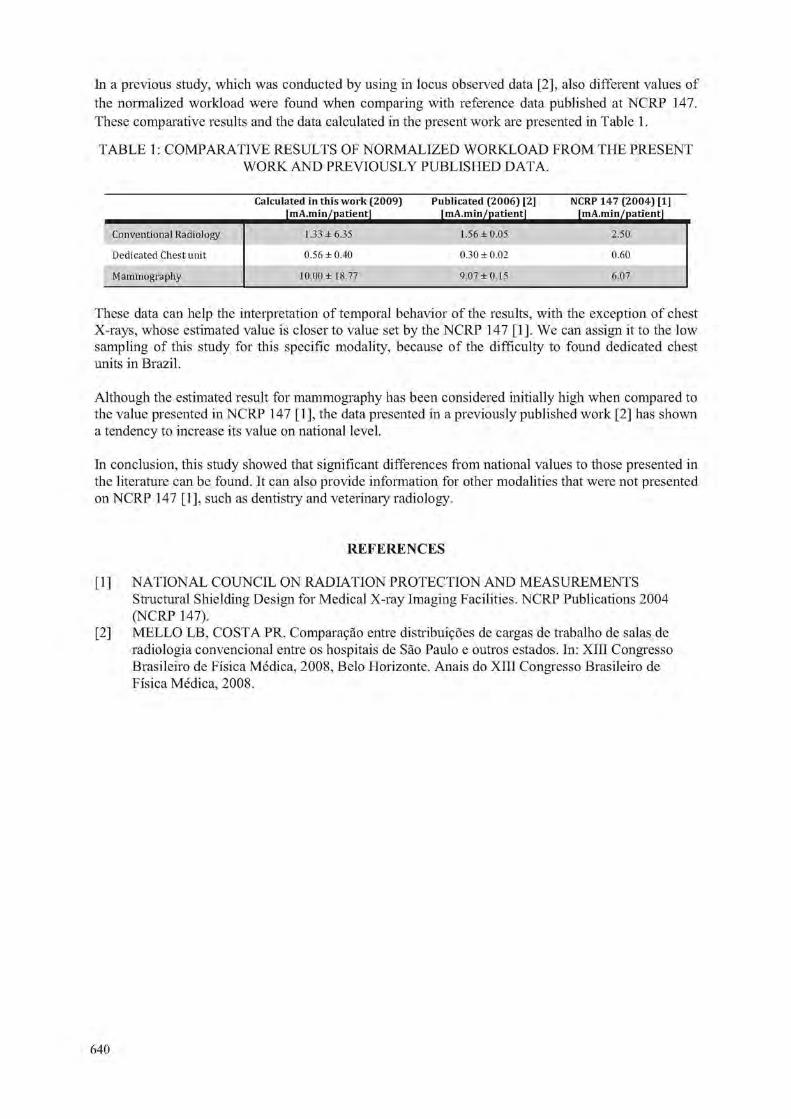
In a previous study, which was conducted by using in locus observed data [2], also different values of the normalized workload were found when comparing with reference data published at NCRP 147. These comparative results and the data calculated in the present work are presented in Table 1.
TABLE 1: COMPARATIVE RESULTS OF NORMALIZED WORKLOAD FROM THE PRESENT WORK AND PREVIOUSLY PUBLISHED DATA.
Calculated in this w o r k (2009) J m A j n i n ^ j j a t i e n ^ ^
Publicated (2006) [2] f m A . m i n / p a t i e n ^ ^
NCRP 147 (2004) [1] fmA.min /pa t ien t j
Conventional Radiology 1.33 ±6.35 1.56 ±0.05 2.50
Dedicated Chest unit 0.56 ± 0.40 0.30 ± 0.02 0.60
Mammography 10.00 ± 18.77 9.07 ±0.15 6.07
These data can help the interpretation of temporal behavior of the results, with the exception of chest X-rays, whose estimated value is closer to value set by the NCRP 147 [1]. We can assign it to the low sampling of this study for this specific modality, because of the difficulty to found dedicated chest units in Brazil.
Although the estimated result for mammography has been considered initially high when compared to the value presented in NCRP 147 [1], the data presented in a previously published work [2] has shown a tendency to increase its value on national level.
In conclusion, this study showed that significant differences from national values to those presented in the literature can be found. It can also provide information for other modalities that were not presented on NCRP 147 [1 ], such as dentistry and veterinary radiology.
REFERENCES
[ 1 ] NATIONAL COUNCIL ON RADIATION PROTECTION AND MEASUREMENTS Structural Shielding Design for Medical X-ray Imaging Facilities. NCRP Publications 2004 (NCRP 147).
[2] MELLO LB, COSTA PR. Compara9ao entre distributors de cargas de trabalho de salas de radiologia convencional entre os hospitais de Sao Paulo e outros estados. In: XIII Congresso Brasileiro de Fisica Medica, 2008, Belo Horizonte. Anais do XIII Congresso Brasileiro de Fisica Medica, 2008.
640

IDOS, Vienna, 9-12 November 2010 E2-CN-182, Paper No 125
Determination of transmission properties of baryte concretes
P. R. Costa1, E. M. Yoshimura1
1 Instituto de Fisica da Universidade de Sao Paulo
Departamento de Fisica Nuclear, Sao Paulo, Brasil
E-mail address of the main author: [email protected]. hr
The philosophy of shield design in diagnostic radiology has changed in recent years, due to the more restrictive dose limits to workers and public adopted in various countries. The trend of these modifications points to the use of more accurate calculations, instead of the traditional methods. One of the modifications is the use of more realistic models for the attenuation of X rays in the shielding materials, as the one developed by Archer et. al.[l] and adopted by NCRP 147[2].
In this work, this model was applied to a set of five barite concretes, which are available in the Brazilian market, in order to help the introduction of the new shielding philosophy in Brazil. Samples were manufactured with the tested materials, shaped in plates with useful areas of 70x70 cm2 and nominal thicknesses of 5, 10, 15, 20, 25, 30 and 50 mm. The transmission through the plates was experimentally determined, and the transmission curves were fitted using a non-linear least-square method with the parametric Archer equation defined as:
K"'(V jc) K0(V)
r Pm(V)\a„.(fir(r)x p f f V ) 1-H am(V)
e \ V > J am(V)
CD
Where K(V,x) is the experimental value of air-kerma per unit of workload (mA.min) per week, at 1 m of the x-ray source operated at a voltage V, transmitted by the thickness X of the shielding material m. K0(V) is the value of K(V,x) without shielding material and (X(V), j3(V) and y(V) are fitting parameters.
The voltages used ranged from 40 to 150 kV in intervals of 5 kV. The tube current was 22.5 mA and the exposure time 30 s (675 mAs). The beam quality selected was equivalent to a RQR5 [3].
The resulting transmission curves for the furnisher 1 are presented in Figure 1. These transmission curves can be used for direct estimations of the thickness required for an adequate protection of the external areas of a radiological room. Comparison of the attenuation capabilities of the materials shows that they are very different, as the example in Figure 2, were the five materials are compared for one of the beams (100 kV). This comparison shows that it is very important to divulge this information among the radiation protection community in Brazil.
The parameters CC, f3 and /, conveniently tabulated, turn possible the use of these attenuation data with different workload distributions to generate weighted transmission curves similar to the curves presented on NCRP 147 for the shielding materials used in United States.
641

E < E > e> E_ (3 | O 3
10 20 30 40
Barite Concrete Thickness (mm)
FIG 1. Transmission cwves resulting from the application of the equation 1 using the E, E e E for the five shielding materials studied.
0 01
FIG 2. Fitted transmission cwves (solid lines) and corresponding experimental data of barite concretes produced by five different furnishers, for a 100 kVx ray beam.
REFERENCES
[1] ARCHER, B.R.; THORNBY, J.I.; BUSHONG, S.C, Diagnostic X-ray Shielding Design Based on an Empirical Model of Photon Attenuation. Health Physics, v. 44, n.5, p.507-517, 1983
[2] NATIONAL COUNCIL ON RADIATION PROTECTION AND MEASUREMENTS. Structural Shielding Design for Medical X-ray Imaging Facilities. NCRP Publications, Bethesda, MD, 2004 (NCRP Report 147).
[3] INTERNATIONAL ELECTROTECHNICAL COMMISSION - Medical diagnostic X-ray equipment - Radiation conditions for use in the determination of characteristics. IEC standard 61267, 2005
642

IDOS, Vienna, 9-12 November 2010 E2-CN-182, Paper No 125
Medical workers dosimetry comparisons in Kenya, 2005 - 2009
B. Kaboro, J. Keter
Radiation Protection Board, Kenya
E-mail address of main author:kaborobeth@gmail. com
Abstract. Kenya through the Radiation Protection Board (RPB) established a regulation in 1982 on Radiation Protection Act under Chapter 243 laws of Kenya in aid to promote a radiation safety culture and protection of medical workers. There are more than 1,500 professional and technical personnel in medicine, dentistry, and veterinary medicine in the country, that are exposed to radiation while administering various radiological procedures-namely, diagnostic, therapeutic, interventional, and nuclear medicine procedures.
Medical workers are required to register with relevant radiological societies and obtain licence from RPB in order to administer ionizing radiation to persons. Under the regulation, they are also required to have personnel monitoring carried out at least once every month. The occupational dose limit is set in accordance with International Commission on Radiological Protection recommendation [1], The limit is an average of 20 mSv per year averaged over a 5-year period and 50 mSv in any single year, with a further stipulation for expectant radiation workers, that the exposure dose should not exceed 10 mSv for foetus throughout the pregnancy period.
There are 4 Personnel Monitoring Service (PMS) providers in the country, and they use film-badge dosimeters and thermoluminescent dosimeters (TLDs) based on LiF for equivalent dose and environmental monitoring. National Radiation Protection Laboratory (NRPL) is one of them and maintains the inventory for personal dosimetry records for all individuals monitored in Kenya and Kenyan nationals. These exposure records are periodically analyzed for anomalies of concern.
From the statistical evaluation of exposure data, it has been observed that most of the larger doses, both from the point of view of their values and their occurrences, are received by persons working with sealed and unsealed radiation sources in isotope diagnostics as seen in nuclear medicine and radiotherapy. These high doses may be brought about by improper control of the use of sealed and unsealed sources during treatment of cancer, lack of shielding and lack of quality assurance [2],
Further, overexposure may likely occur due to the x-ray equipment e.g. exposure timer failure, poor equipment maintenance, default settings, use of inappropriate equipment for a procedure, poor maintenance procedures, non-compliant x-ray equipment, inaccurate exposure factors like low filtration, inaccurate tube voltage, timer errors. Radiation worker may also be the cause e.g. incorrect selection of exposure parameters, user not trained, complacency and lack of safety culture.
Kenya, through the RPB recently banned the importation of 50 mA generators in the country and gave a stringent measure on facilities currently operating with them to use high speed intensifying screen sensitive films. This aims in reducing exposure dose to patients and the medical worker. The RPB enhances radiation safety by conducting regular inspection of radiation facilities in the country and improving safety in terms of proper shielding design, good working practices and good quality assurance and control, technology on radiation protection keeps on increasing. Study show that medical workers dose exposures is gradually reducing due to improvement in radiation safety [2],
643

However, these improvements are hindered by many factors mainly; luck of funds, accessibility of marginalized areas characterized by poor terrain especially in northern parts of Kenya, ignorance of personnel and luck of awareness. The RPB decentralized its operation in measures to combat these problems and currently there are 6 regional offices distributed throughout the country as opposed to one station in the year 2005. This has improved on service delivery in enforcing the law in different parts of the country.
This paper gives dosimetry comparison and exposure trend for medical workers in the country during the study period. Further, the paper will contribute raw data for future studies on occupational dosimetry for medical workers.
ACKNOWLEDGEMENTS
This work was supported by National Radiation Protection Laboratory of Kenya.
REFERENCES
[1] COMMISSION ON RADIOLOGICAL PROTECTION; International Commission on Radiological protection publication No. 60, Oxford, England: Pergamon, 1991.
[2] MUIRHEAD C.R., Goodill AA. Haylock RG., Occupational radiation exposure and mortality: second analysis of the National Registry for Radiation Workers. J. Radiol Prot 1999; 19: 3-26.
644
Related Documents