Welcome message from author
This document is posted to help you gain knowledge. Please leave a comment to let me know what you think about it! Share it to your friends and learn new things together.
Transcript

IDFC Securities - London Roadshows
Mr. Bipin Kabra
December 9 - 10, 2010
Agenda
1 Overview
2 A Bank in Transformation
3 Financials - How the Numbers Stack up?

Overview
1

An Emerging Private Sector Bank
Incorporated at Thrissur, Kerala in 1927
Pan - India presence through a network of 274 branches and 452 ATMs covering 14 states
A broad and loyal customer base of 1.5 million as at Sept 30, 2010
Total asset base of Rs. 114 billion as at Sept 30, 2010, increasing at a rapid pace of 73% (y-o-y)
Capital adequacy of 14.6%, with a Tier-I ratio of 11.7% as at Sept 2010
Employee strength increased to 4,508 as on Sept 30, 2010 from 4,490 as at June 30, 2010
151.1
198.5229.2
Q2-2010 Q1-2011 Q2-2011
6,618
9,027
11,413
Sep-09 June-10 Sep-10
6.3 6.0
1.6
Q2-2010 Q1-2011 Q2-2011
Total Income (Rs. cr) Total Assets (Rs. cr) PAT (Rs. cr) Gross NPA (%)
1.74%
1.41%
1.26%
Sep-09 June-10 Sep-10

A Rich History
2009
2002
2007
2008
1927
1937
1975
1977
1980
1996
2000
Year of Incorporation
1st Branch established
1st Branch set up outside Kerala
Granted status of a Scheduled Commercial Bank
Increased the branch network to 100
IPO - raised Rs. 24 crores and listed on NSE, BSE & Cochin Stock Exchange
1st ATM rolled out
Rights issue - raised Rs. 27 crores
Change in Board with induction of highly reputed professionals having extensive banking / financial services experience
Mr. Raja Mohan Rao, the largest shareholder diluted to 10% as per the revised RBI guidelines
Mr. Amitabh Chaturvedi joins Dhanlaxmi as MD & CEO
Rights issue of Rs. 199 crores - Networth increased to over Rs. 300 crores
Opened 45 new branches and 102 new ATMs
Tie-up with Bajaj Allianz to distribute their life and non-life products
Built scale and a technological platform to capture future growth
Awards / Recognition: “India’s Fastest Growing Mid-size Bank” by Business Today (KPMG survey); Awarded
“Best bank in the private sector” by the State Forum of Bankers’ Clubs at their Banking Excellence Awards
2010 Opened 22 new branches and 278 new ATMs
Launched new brand identity; created platform for a unified image
Product distribution agreement with five of the largest MFs
QIP of Rs. 381 crores - Networth increased to over Rs. 820 crores
A Bank in Transformation
2

Where Do We Want to be ?
Asset Quality: to be the best in class
Profitability: to be in top quartile
Branch Network: setting up a pan - India network
Balance Sheet: gaining size

Reincarnation
Experienced Board and a New management team1
Introduced a new brand identity
Ramped up customer touch points
Change in employee profile towards a younger work force
Revitalised product portfolio
Business segments reorganized
Creation of capacity
2
3
4
5
6
7
Revamp of technology platform and operational processes8
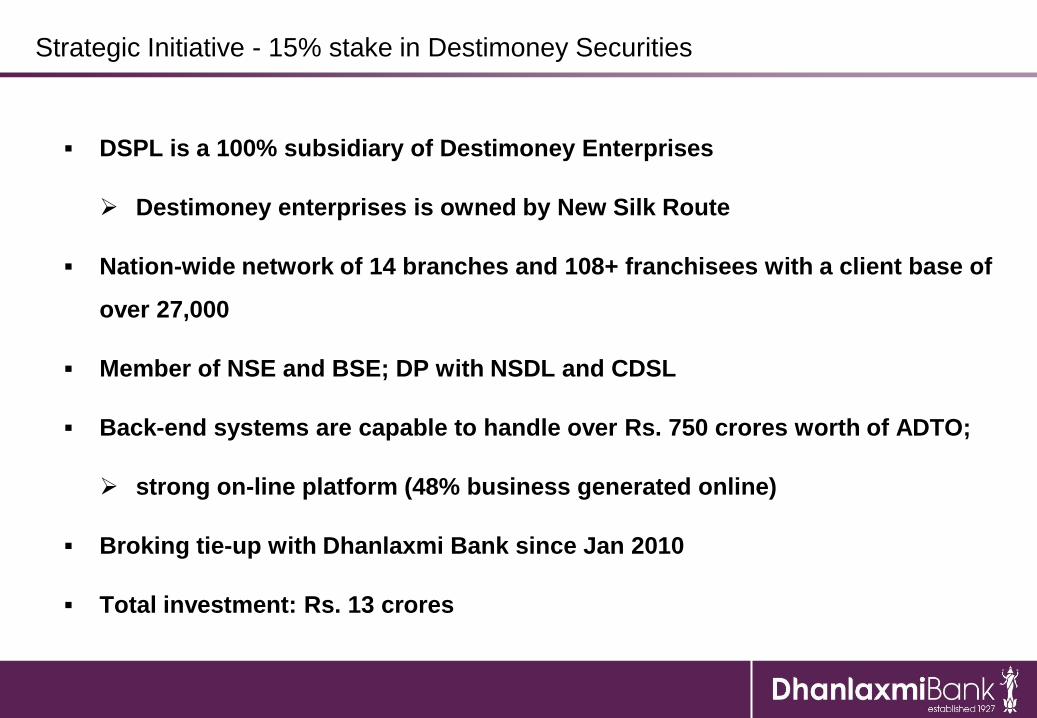
Strategic Initiative - 15% stake in Destimoney Securities
DSPL is a 100% subsidiary of Destimoney Enterprises
Destimoney enterprises is owned by New Silk Route
Nation-wide network of 14 branches and 108+ franchisees with a client base of
over 27,000
Member of NSE and BSE; DP with NSDL and CDSL
Back-end systems are capable to handle over Rs. 750 crores worth of ADTO;
strong on-line platform (48% business generated online)
Broking tie-up with Dhanlaxmi Bank since Jan 2010
Total investment: Rs. 13 crores

Key benefits for Dhanlaxmi Bank
Sole and exclusive banking partners
Key contributions to the overall CASA deposits
Improved visibility for the Bank driven by:
a complementary product portfolio
more customer touch points
additional marketing opportunities

Financials - How the Numbers Stack up?
3
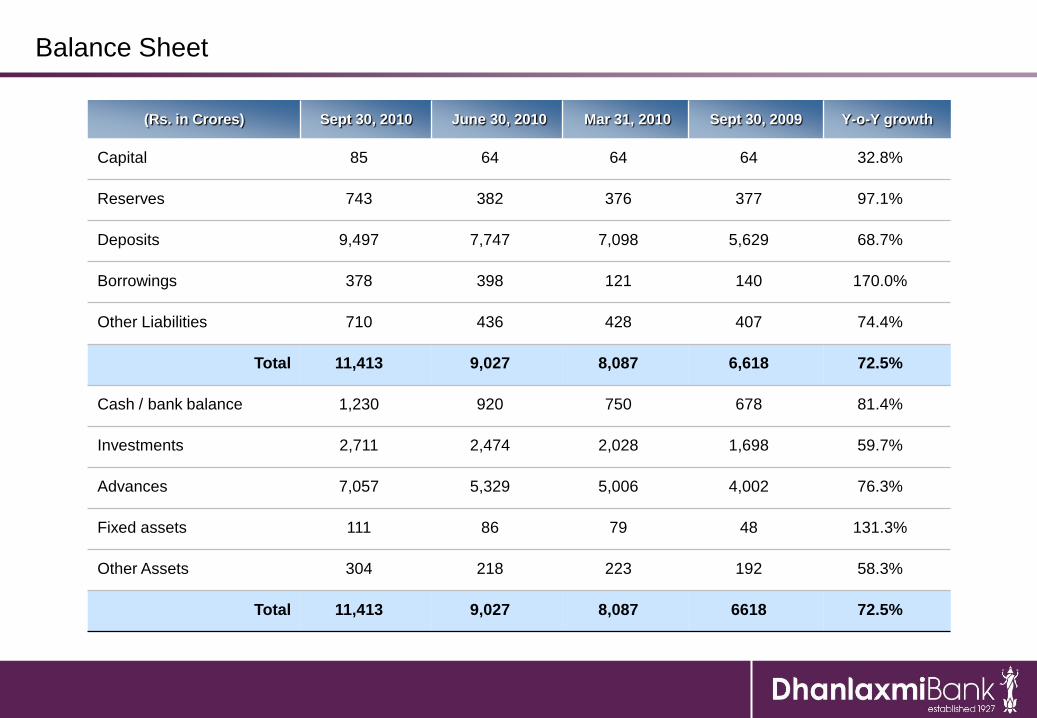
Balance Sheet
(Rs. in Crores) Sept 30, 2010 June 30, 2010 Mar 31, 2010 Sept 30, 2009 Y-o-Y growth
Capital 85 64 64 64 32.8%
Reserves 743 382 376 377 97.1%
Deposits 9,497 7,747 7,098 5,629 68.7%
Borrowings 378 398 121 140 170.0%
Other Liabilities 710 436 428 407 74.4%
Total 11,413 9,027 8,087 6,618 72.5%
Cash / bank balance 1,230 920 750 678 81.4%
Investments 2,711 2,474 2,028 1,698 59.7%
Advances 7,057 5,329 5,006 4,002 76.3%
Fixed assets 111 86 79 48 131.3%
Other Assets 304 218 223 192 58.3%
Total 11,413 9,027 8,087 6618 72.5%
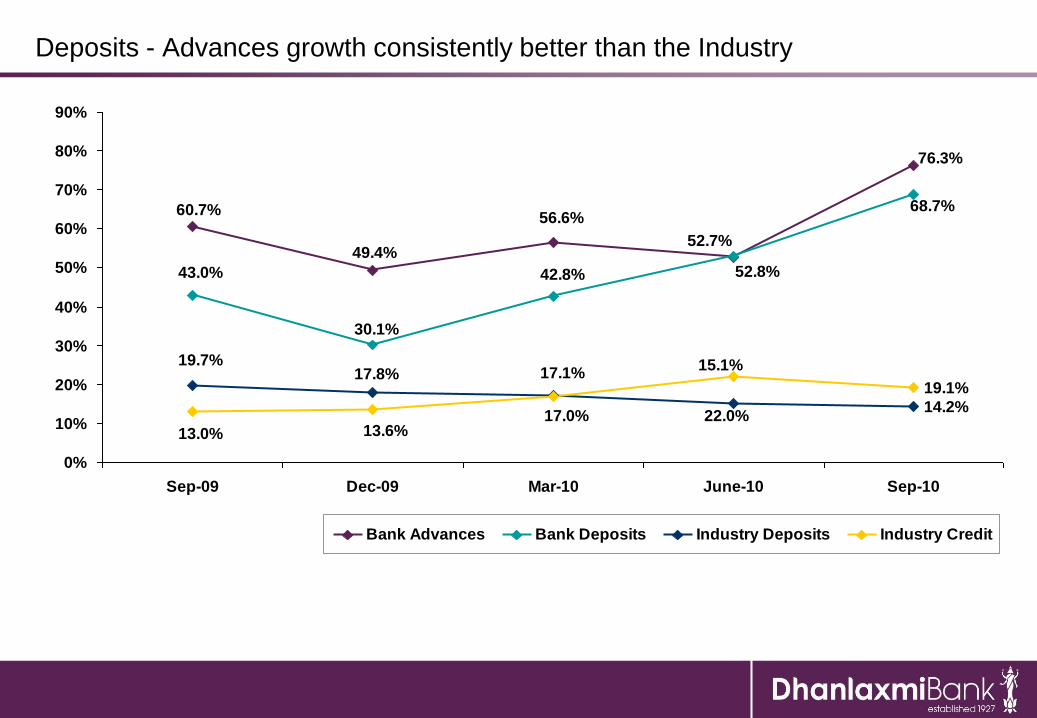
14.2%
19.1%
76.3%
60.7%
49.4%
56.6%
52.7%
68.7%
43.0%
30.1%
42.8% 52.8%
19.7%17.8% 17.1%
15.1%
22.0%17.0%13.6%13.0%
0%
10%
20%
30%
40%
50%
60%
70%
80%
90%
Sep-09 Dec-09 Mar-10 June-10 Sep-10
Bank Advances Bank Deposits Industry Deposits Industry Credit
Deposits - Advances growth consistently better than the Industry
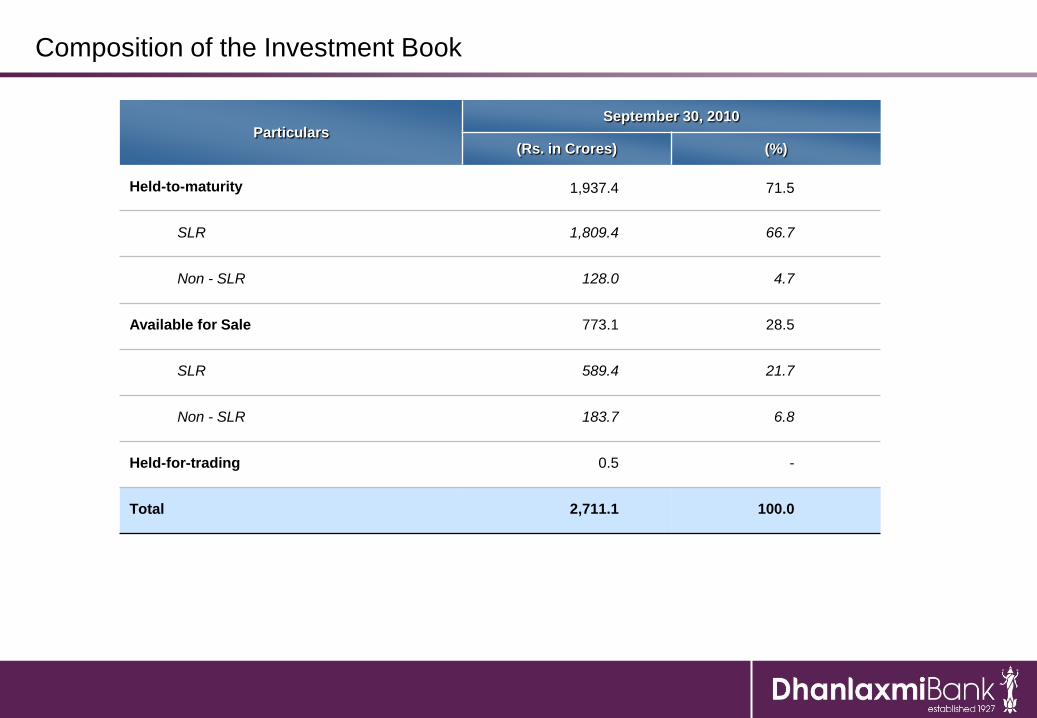
Composition of the Investment Book
ParticularsSeptember 30, 2010
(Rs. in Crores) (%)
Held-to-maturity 1,937.4 71.5
SLR 1,809.4 66.7
Non - SLR 128.0 4.7
Available for Sale 773.1 28.5
SLR 589.4 21.7
Non - SLR 183.7 6.8
Held-for-trading 0.5 -
Total 2,711.1 100.0

Profit and Loss Statement
(Rs. in Crores)H1 -
FY2011
H1 -
FY2010Y-o-Y growth
Q2 -
FY2011
Q2 -
FY2010Y-o-Y growth
Interest income 360.4 244.3 47.5% 192.4 123.7 55.5%
Interest expenses 259.3 186.8 38.8% 139.7 96.5 44.8%
Net interest income 101.1 57.5 75.8% 52.7 27.2 93.8%
Non Interest income 67.3 42.4 58.7% 36.8 27.4 34.3%
Operating expenses 147.2 75.8 94.2% 77.4 43.5 77.9%
Staff cost 89.2 44.2 101.8% 49.1 26.0 88.8%
Provisions 10.3 4.2 145.2% 8.3 2.8 196.4%
Profit before tax 10.9 19.9 (45.2)% 3.8 8.3 (54.2)%
Profit after tax 7.7 16.4 (53.0)% 1.6 6.3 (74.6)%

Trend in Net Interest Margin
9.3%
6.2%
2.4%
10.6% 10.4%9.9% 10.0%
6.9%6.4% 6.4% 6.6%
1.9%2.5% 2.7% 2.6%
0%
2%
4%
6%
8%
10%
12%
Q2 - FY2010 Q3 - FY2010 Q4 - FY2010 Q1 - FY2011 Q2 - FY2011
Yield on Advances Cost of Funds NIM

Trend in Operating Expenses
13 16 17 17 1826
3035
40
49
1212 13 14 14
18
23
29
30
28
77
70
2528
29 31 32
44
53
64
0
10
20
30
40
50
60
70
80
90
Q1-09 Q2-09 Q3-09 Q4-09 Q1-10 Q2-10 Q3-10 Q4-10 Q1-11 Q2-11
(Rs. in
Cro
res)
Staff Cost Others
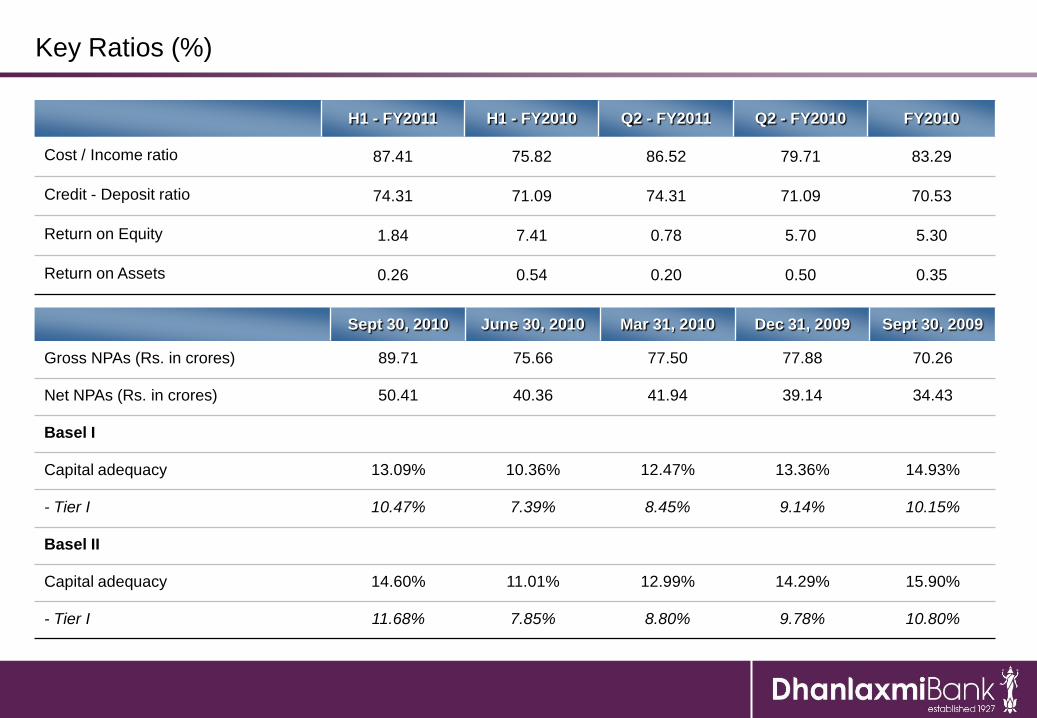
Key Ratios (%)
H1 - FY2011 H1 - FY2010 Q2 - FY2011 Q2 - FY2010 FY2010
Cost / Income ratio 87.41 75.82 86.52 79.71 83.29
Credit - Deposit ratio 74.31 71.09 74.31 71.09 70.53
Return on Equity 1.84 7.41 0.78 5.70 5.30
Return on Assets 0.26 0.54 0.20 0.50 0.35
Sept 30, 2010 June 30, 2010 Mar 31, 2010 Dec 31, 2009 Sept 30, 2009
Gross NPAs (Rs. in crores) 89.71 75.66 77.50 77.88 70.26
Net NPAs (Rs. in crores) 50.41 40.36 41.94 39.14 34.43
Basel I
Capital adequacy 13.09% 10.36% 12.47% 13.36% 14.93%
- Tier I 10.47% 7.39% 8.45% 9.14% 10.15%
Basel II
Capital adequacy 14.60% 11.01% 12.99% 14.29% 15.90%
- Tier I 11.68% 7.85% 8.80% 9.78% 10.80%

Asset Quality
0.71%0.76%0.84%0.88%
0.96%0.86% 0.89%
1.41%
1.26%
1.54%
1.99%1.92%
1.73% 1.76%
0.0%
0.5%
1.0%
1.5%
2.0%
2.5%
Mar-09 Jun-09 Sep-09 Dec-09 Mar-10 June-10 Sep-10
Net NPA Ratio Gross NPA Ratio
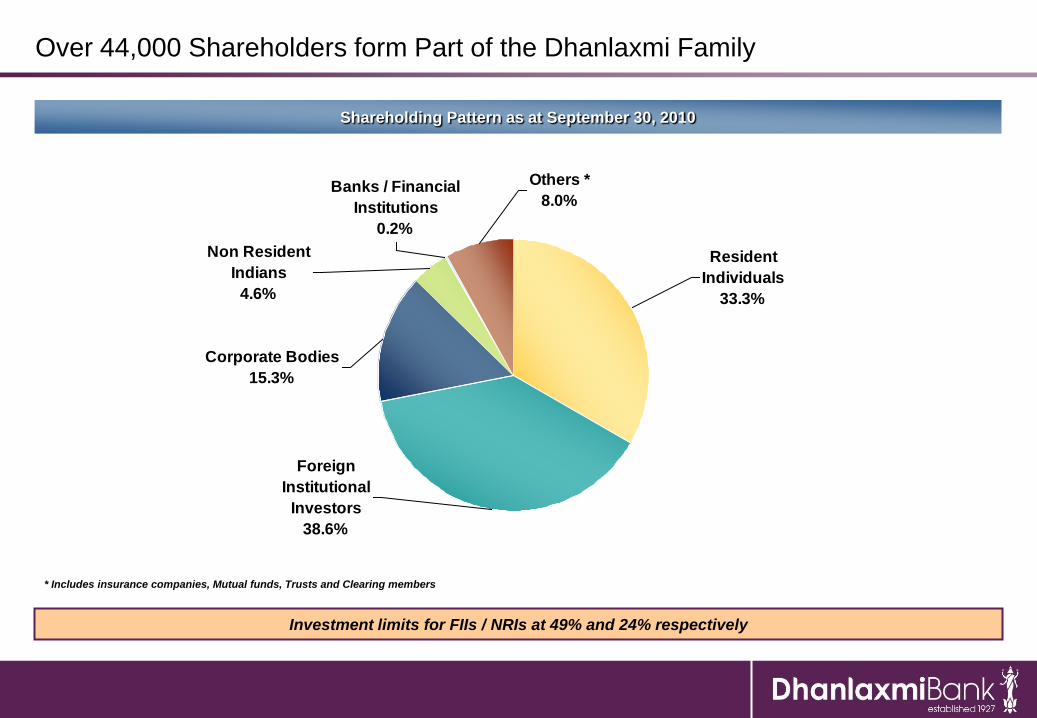
Over 44,000 Shareholders form Part of the Dhanlaxmi Family
Investment limits for FIIs / NRIs at 49% and 24% respectively
* Includes insurance companies, Mutual funds, Trusts and Clearing members
Shareholding Pattern as at September 30, 2010
Corporate Bodies
15.3%
Foreign
Institutional
Investors
38.6%
Others *
8.0%
Non Resident
Indians
4.6%
Banks / Financial
Institutions
0.2%
Resident
Individuals
33.3%
Thank You

Appendix

Name Age Total Work Experience
Mr. G.N. Bajpai, Chairman 66 He has served as chairman of LIC and Securities Exchange Board of India (SEBI)
Mr. Amitabh Chaturvedi, MD & CEO 42 He has served as the Group President at Reliance Capital Limited
He was also earlier in charge of the Retail Banking group at ICICI
Mr. Sateesh Kumar Andra 41
He is on the board of start-ups like Metromela Internet Services Private Limited, Ginger Soft Media Private
Limited, Pressmart India Limited and Metrikus India Private Limited, started by young and first generation
entrepreneurs
He was the Promoter and CEO of EUCLID software, a leading provider of Business Intelligence for IT
He is engaged as venture partner with DFJ (Draper Fisher Jurvetson) India, which lends support to
enterprising entrepreneurs
Mr. Ghanshyam Dass 57
He was the Managing Director of NASDAQ QMX for Asia Pacific until February 2009
He was also the CEO of British Bank of Middle East in India & Majan International Bank in the Sultanate of
Oman. Currently, he is the Senior Advisor of KPMG and Advisor, Intel Capital
Mr. Shailesh Haribhakti 53
A C.A. by qualification, he is the only Indian Member on the Standards Advisory council of the IASB. He is
the Chairman of FPSB, India. He is a Committee member of Futures & Options segment of NSE, SEBI
Committee on Disclosure and Accounting Standards, Managing Committees of ASSOCHAM & IMC, and
Corporate Governance Committees of ASSOCHAM & CII. He has been awarded “The Best Non Executive
Independent Director Award - 2007” by the Asian Centre for Corporate Governance and IMC in Jan 2008
Mr. S. Santhanakrishnan 64 He retired as Deputy Managing Director of SBI after 36 years of service
He was also the executive Chairman of Credit Information Bureau (India) Limited (CIBIL)
Mr. K. S. Reddy 56
He has been in Indian Civil Services for over 16 years and worked in Ministries of Planning and
Programme Implementation, Food Processing Industries, Defense, Communications, Welfare and Tourism
and Civil Aviation
Mr. Vidyadhara Rao Chalasani 64
An additional / independent director on board
He has over three decades experience in financial services. Currently, he is the Director of Advice America
(California, USA). During 1987-2000, he was the chief investment strategist of Wachovia Securities
Experienced Board of Directors

New Execution Focused Management Team
Management Team Designation Previous Organization Experience (yrs)
Amitabh Chaturvedi Managing Director & CEO Reliance Capital, ICICI Bank 19
Bipin Kabra Chief Financial Officer Reliance Capital, ICICI Bank, SBI 18
Manish Kumar Head - HR & CSR ICICI, Reliance, IDFC 15
Rajeev Deoras Head - Wholesale Banking Kotak Mahindra Bank, ICICI Bank, SBI 25
P. G. Jayakumar Head - Credit Dhanlaxmi Bank 32
Salil Datar Head - Branch Banking ICICI Bank 19
S. Balasubramanian Head - Trade & Advances Kotak Mahindra Bank 23
Arvind Hali Head - Retail Assets Reliance Capital, GE Money, Standard Chartered Bank 12
Muralidharan R. Head - Operations & IT BRICS Online Services, ICICI, SBI 24
H. Rangarajan Head - Planning Syndicate Bank 35
Asok Hastagiri Head - Integrated Risk Management Arthur Andersen & Co. 24
Sheran Mehra Head - Marketing Barclays, HSBC 11
Deepak Singh Head - Insurance & Gold HDFC 14
Recruited senior management, largely from new private sector and foreign banks
Introduction of ESOPs (6% of the total equity)
Increase in manpower to 4,508

New Execution Focused Management Team (Cont’d.)
Management Team Designation Previous Organization Experience (yrs)
Gopikumar V. Head - IFIG & Trade Finance (Sales) ICICI Bank 28
Mini Nair Head - Finance & Accounts Raheja QBE GIC 13
Jaya Janardanan Head - Banking Operations BRICS Online Services, ICICI Bank 14
Ashwini Naik Head - Retail Asset / Credit Card Ops. ICICI Bank, IDBI 13
Sandeep Wirkhare Head - Retail Credit & Policy Reliance, ICICI Bank 16
D. A. Dhanajaya Head - Broking & MF Distribution Reliance Money 11
Sachin Saraf Head - Infrastructure HSBC, ICICI Bank 13
Manish Sarraf Head - Treasury Citibank, Siemens 18
Anand Gupta Head - Alternate Channels ICICI Bank 14
Rajrishi Singhal Head - Policy & Research Economic Times 24
Ramesh Padmanabhan Head - Credit Mid-Office ICICI Bank 20
J. Renganathan Head - Credit Sanction SBI 24
P. S. Ravikumar Head - Inspection & Vigilance Dhanlaxmi Bank 31
Ravindran Warrier Head - Company Secretary Keltron 24
S. Suresh Kumar Head - Credit Monitoring & Review UBI 30

Evolution into a Contemporary and Modern Brand Identity
Past
Re-
Branded

Unified Brand Presentation

Branches - Old Look

Branches - New Look

ATMs
Old Look New Look

Augmentation of Customer Touch Points
Branch Network ATM Touch Points
Branch Branch network will expand to 275 (currently 274) by December 2010, covering 140 locations
ATM Increase from 72 (March 2009) to 452 (currently) - No. of transactions rose from 1.7 lakhs p.m. to over 4 lakhs p.m.
Internet Banking Retail banking transactions have increased by 5x in October 2010 vis-à-vis December 2009.
Mobile Banking Launched on 7th December 2010
Customer Contact Centre To launch IVR, Voice, Email, Chat in FY11
Total touch points more than doubled to 726 from 280 as at June 2009
KER
TN
KK
AP
MAH
GUJ
RAJ
MP
UP(E)
UP(W)
PB
HAR
BH
AS
NE
HP
JK
JH
OR
CH
139
150
32
37
1418
912
1Goa
725
115
WB
53
8New
Delhi2
1
26
11
PresentPast KER
TN
KK
AP
MAH
GUJ
RAJ
MP
UP(E)
UP(W)
PB
HAR
BH
AS
NE
HP
JK
JH
OR
CH
160 73
Goa
WB
New
Delhi
38
2
65
36
14
212
112
28
64

A New and Young Employee Base
3548 Average age 13 yrs1,375 4,508
Sep-08 Sep-10
Employee base 3x
Sep-08 Sep-10
Strengthening Customer Interface Average Age of Employee
Average age of new recruits - ~29 years
Unionized workforce reduced to less than 25%
Redeployment of employees to improve productivity
Invested in workforce training

Product Suite - Created an Extensive Bouquet of Services
Liability
Products
Loan Products
Transaction
Products
Payment Services - Bill Pay,
Money Transfer, Charity,
Religious Offerings etc.
Liabilities - Current, Saving,
Term, Recurring, Roaming
Account etc.
Bill Discounting, BGs, LCs,
Working Capital Finance,
Term Loan, Project Finance
etc.
Third Party Products -
MF, Insurance, Gold, forex,
Depository etc.
Retail Loans - Mortgages,
Vehicles, Gold / Shares,
Property etc.
Investment Banking Credit / Debit Card
New initiatives for enhanced customer acquisition

Secured Category of Retail Asset Business
Mortgages
Home Loan, Commercial Property
LAP, LRD
Vehicles
Commercial vehicles
Dealer funding
Auto loan
Construction Equipment
Loan against Gold / Securities
Launched Credit Cards’ business in March 2010
Retail Asset Products launched in July 2010

Retail growth and share of various sub-segments (Sept 30, 2010)
Mortgages11%
Vehicle Loans33%
Construction Equip.
1%
Gold Loans40%
Others15%
0
500
1,000
1,500
2,000
2,500
3,000
Mar-10 Jun-10 Sep-10
Business size (Rs. in crores)

Revamp towards a favourable business mix on track - Growth in loan book
7,057
2,4903,196
5,006 5,329
Sep-08 Mar-09 Mar-10 Jun-10 Sep-10
+183%
19.1%
76.3%
60.7%
49.4%
56.6%52.7%
22.0%17.0%13.6%13.0%
0%
10%
20%
30%
40%
50%
60%
70%
80%
90%
Sep-09 Dec-09 Mar-10 June-10 Sep-10
Bank Advances Industry Credit
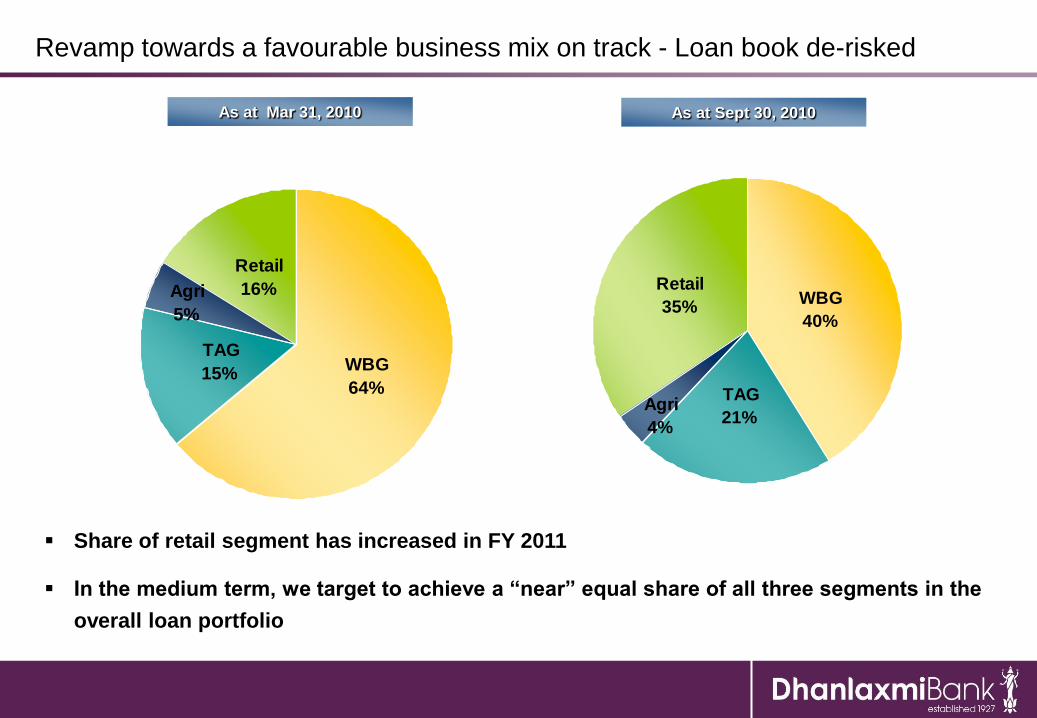
Revamp towards a favourable business mix on track - Loan book de-risked
Agri
5%
TAG
15%
Retail
16%
WBG
64%Agri
4%
TAG
21%
Retail
35%WBG
40%
As at Sept 30, 2010As at Mar 31, 2010
Share of retail segment has increased in FY 2011
In the medium term, we target to achieve a “near” equal share of all three segments in the
overall loan portfolio

Revamp towards a favourable loan mix on track - Region-wise
44.0%
35.3%
27.0%25.9%
56.0%
64.8%
73.0%
74.1%
0%
10%
20%
30%
40%
50%
60%
70%
80%
Mar-09 Sep-09 Mar-10 Sep-10
Kerala Non-Kerala
81.1%
69.9%
57.5%
48.0%
52.0%
42.6%
30.1%
18.9%
0%
10%
20%
30%
40%
50%
60%
70%
80%
90%
Mar-09 Sep-09 Mar-10 Sep-10
South India Non-South

Revamp towards a favourable business mix on track - Liabilities
Change of culture at Branches from Lending to Liabilities
Approx. 39% of the incremental liabilities from new branches
2,047
1,6561,5521,3241,1261,2081,166
1,245
21%22%
22%22%22%
22%
24%25%
0
500
1,000
1,500
2,000
2,500
Dec-08 Mar-09 Jun-09 Sep-09 Dec-09 Mar-10 Jun-10 Sep-10
19%
20%
21%
22%
23%
24%
25%
26%
CASA (Rs. Cr) Ratio

Leverage our Multichannel distribution network
Insurance distribution tie up with Bajaj Allianz
Business rose to Rs. 44 crores in Q2 - FY11 (10 crores in Q2 - FY10)
No. of policies increased to 22,022 in Q2 - 2011 from 5,654 in Q2 - 2010
MF product distribution tie-ups with ICICI Prudential, Kotak, UTI, Fidelity & HDFC
Over 21,000 mutual fund accounts opened in Q2 vis-à-vis 9,059 in Q1 - 2011
2nd largest private sector bank in terms of fresh SIPs mobilised in Sept and Oct
2010 (CAMS)
Strengthened existing relationship with Destimoney Securities

Business volumes vis-à-vis personnel and branch infrastructure
ParticularsBanking sector
in India
Private Sector
Banks
Dhanlaxmi
Bank
Business per employee 8.7 crores 8.0 crores 3.7 crores
Advances per branch 48.6 crores 60.9 crores 25.8 crores
Deposits per branch 66.0 crores 79.2 crores 34.8 crores
Cost per employee 10.6 lakhs 12.4 lakhs 8.2 lakhs
Considering the above banking sector averages, our current employee and branch infrastructure is
sufficiently capable to generate the following business volumes:
Business Average utilisation of current capacity
Advances 13,000 crores
Deposits 18,000 crores
Business 31,000 crores

Revamp of Technology and Operational Processes
Moving to a Managed Data centre model to free
branch time
62% of the branch time is now free to focus on
customer acquisition and service
CBS architecture was already in place
Upgraded to the latest version of Flex Cube
End-to-end online tracking system of account
opening forms
KYC compliance ensured for all past customers
Centralisation of CASA opening produced
remarkable improvement in KYC compliance
Bank carried out successful rollout of
Loan Flow software, Treasury and Risk
Management software
Oracle Financial, Payroll System etc.
Branch Activities Vs DCS / RPCs Centralised Activities
Outsourced
7%
Branch
38%
Centralisation
55%
Related Documents