Welcome message from author
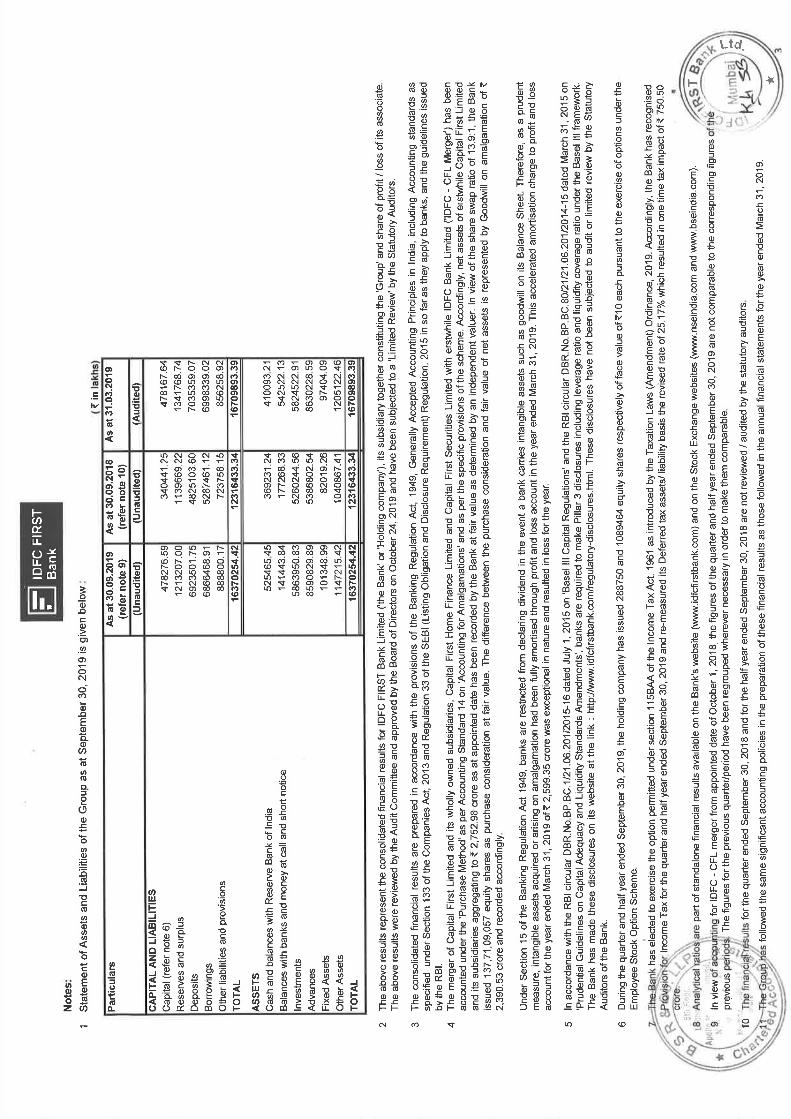
This document is posted to help you gain knowledge. Please leave a comment to let me know what you think about it! Share it to your friends and learn new things together.
Transcript
IDFC FIRST Bank Q2 FY20 Profit Before Tax at Rs. 100 crore; Strong and sustained growth in CASA Deposit franchise, Retail loans
Highlights:
Profit Before Tax of Rs. 100 crore for the quarter ended September 30, 2019, as compared to a
Loss of Rs. 583 crore in the corresponding period last year and loss of Rs 963 crore last quarter
Bank decides to mark down Deferred Tax Assets as a result of reduction in Corporate Tax Rates
from 35% to 25%
Because of the DTA markdown, Net Loss (after tax) of Rs. 680 crore for the quarter, as a result
of one-time tax impact of Rs 751 crore due to markdown of existing Deferred Tax Assets
CASA Deposits posted strong growth rising 99% YoY and 30% sequentially to Rs. 12,473 crore as
of September 30, 2019
Retail CASA & Retail Term Deposits (which the bank calls Core Retail Deposits) as percentage of
the overall liability book increased sharply to 16.72% as compared to 8.04% as on December 31,
2018, at merger
Gross Loan Book stood at Rs. 1,07,656 crore
Total Retail Loans as a percentage of Total Loans increased to 45% post-merger from 13% as on
September 30, 2018 (pre-merger)
NIM for the quarter rose sharply to 3.43% from 3.01% in the previous quarter Q1 FY 20, and as
compared to 1.56% pre-merger.
Net worth of the Bank was strong at Rs. 16,866 crore
Tier 1 Capital Adequacy was strong at 14.51%. Total Capital adequacy is 14.65%
Total Balance Sheet size of the Bank was at Rs. 1,63,777 crore
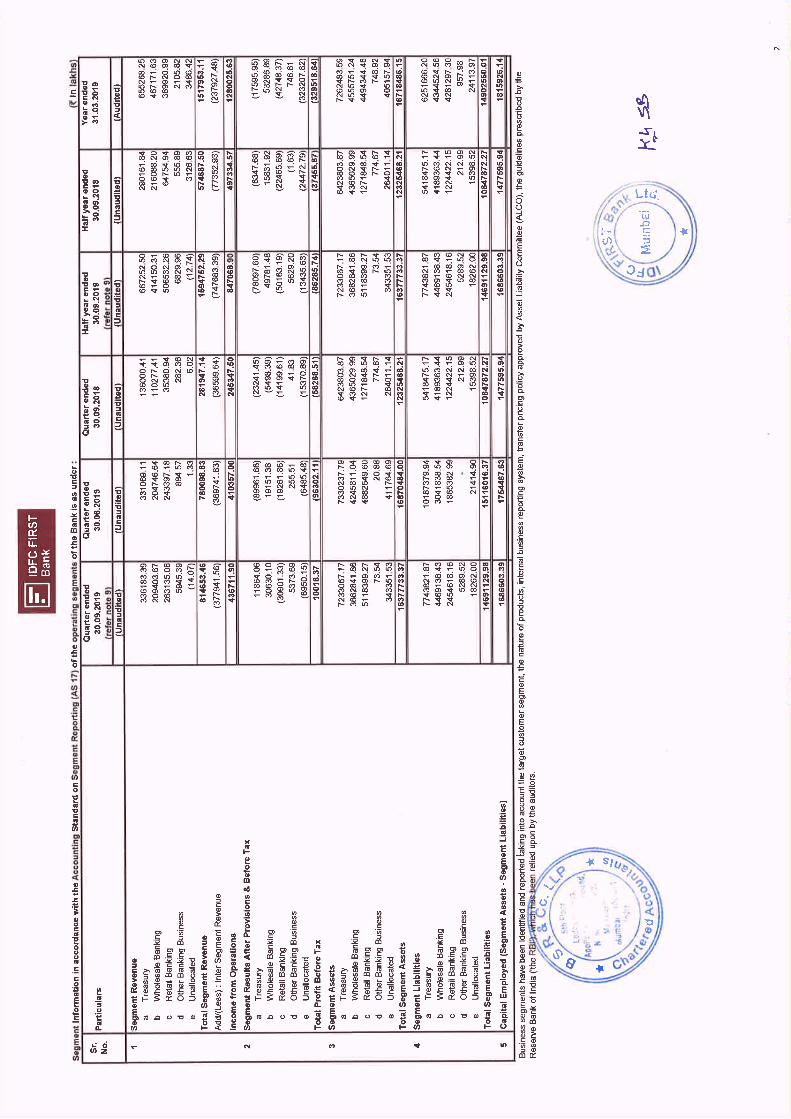
Mumbai, October 24, 2019: The Board of Directors of IDFC FIRST Bank founded by the merger of IDFC
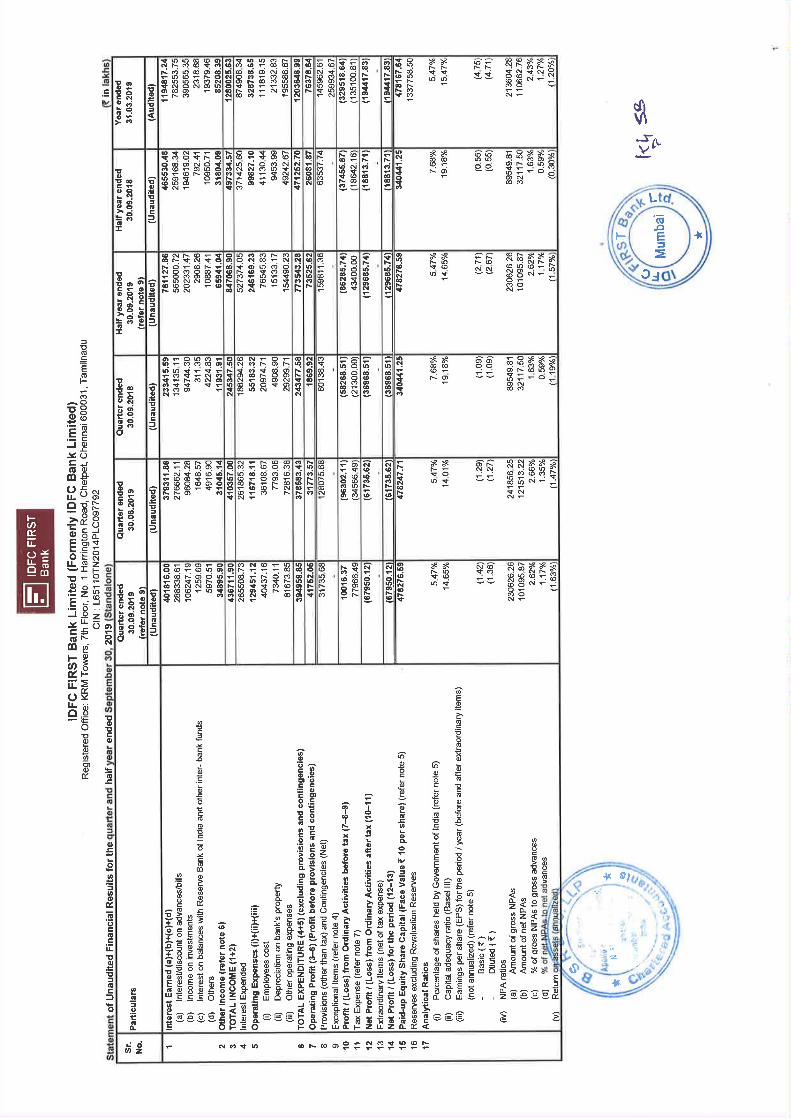
Bank and Capital First recently, in its meeting held today, approved the combined unaudited financial
results for the quarter and half year ended September 30, 2019, as summarized below.
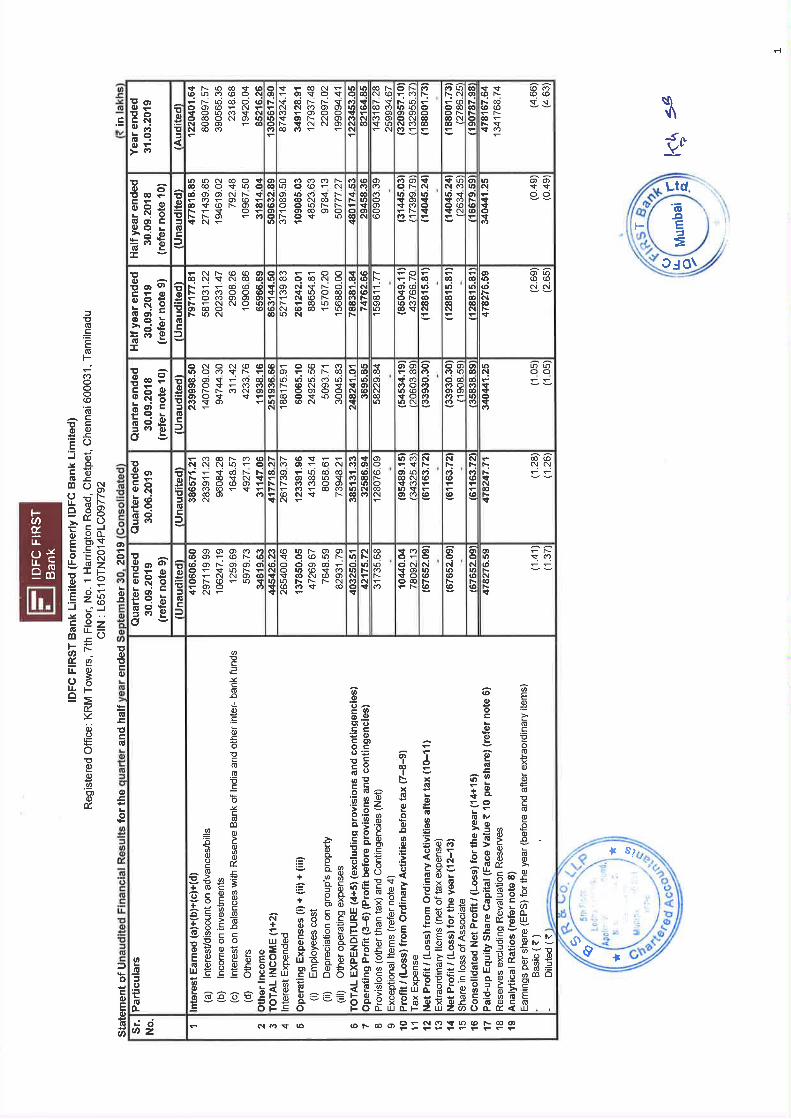
PROFIT & LOSS ACCOUNT FOR THE QUARTER ENDED SEPTEMBER 30, 2019
The Bank reported a Profit Before Tax of Rs. 100 crore for the quarter ended September 30, 2019, as
compared to a Loss of Rs. 583 crore as on September 30, 2018.
The Bank chose to exercise the option permitted under section 115BAA of the Income Tax Act, 1961,
introduced by the Taxation Law Amendment Ordinance, 2019, to move to new corporate tax rate of 25%
which will give long term benefits to the Bank. After considering the tax impact of Rs. 751 crore due to
markdown of existing Deferred Tax Assets, the Bank reported a Net Loss of Rs. 680 crore for Q2 FY20. The
full impact of this change has been incorporated in the tax line of the Profit & Loss Statement.
Net Interest Income for the reported quarter was at Rs. 1,363 crore, up 202% Y-o-Y from Rs 451 crore
(pre-merger), and up 16% QoQ (Rs. 1,174 crore).
Total Income (Net Interest Income plus fees and other revenues) for the quarter was at Rs. 1,712 crore,
up 200% Y-o-Y (Rs. 571 crores), and up 15% QoQ (Rs. 1485 crore).
The Net Interest Margin for the Bank grew to 3.43% for the quarter, from 1.56% pre-merger, in a span of
just nine months since merger.
The Cost to Income ratio of the Bank improved to 75.61% for the quarter, from 96.72% per-merger, and
compared to 78.60% last quarter Q1 FY20.
The Pre-Provisioning Operating Profit of the Bank has increased to Rs. 417 crore, up 2133% YoY from Rs.
19 crore in the corresponding period last year, and by 31% sequentially (Rs. 318 crore in Q1 FY20)
The Profit Before Tax of the Bank for the quarter was at Rs. 100 crore, as against a loss of Rs. 583 crore in
the corresponding period last year and as against a loss of Rs. 963 crore in Q1 FY20.
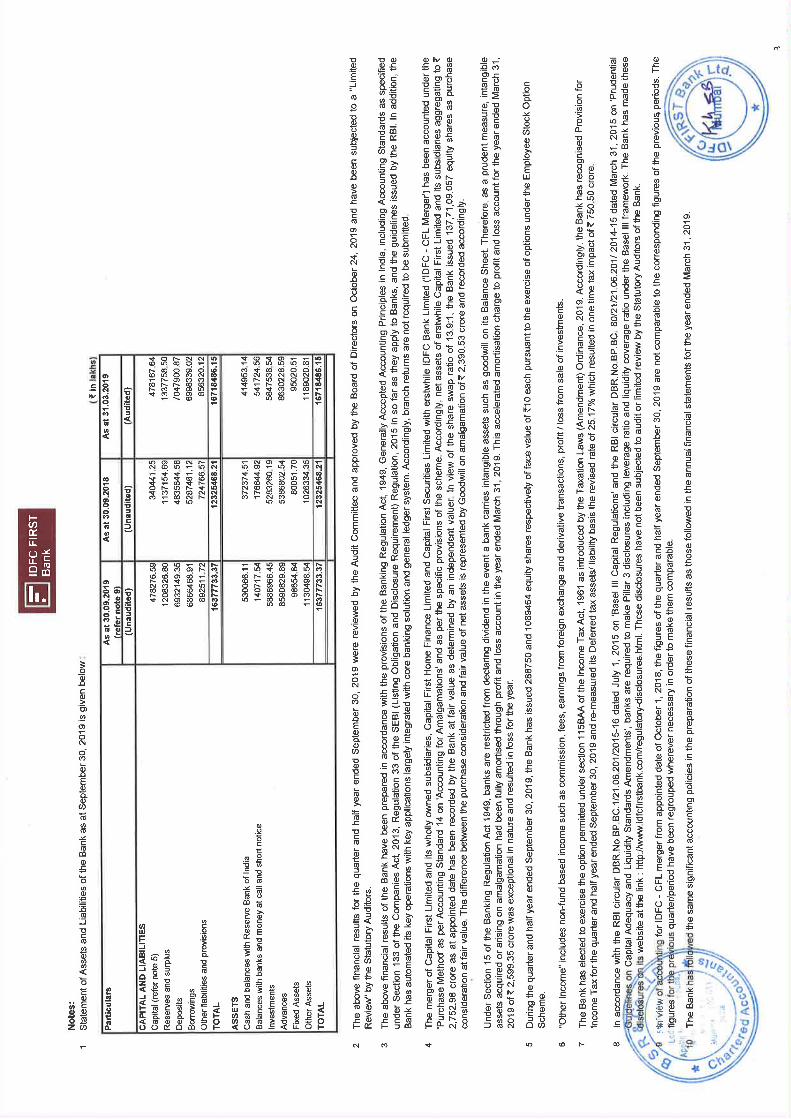
BALANCE SHEET AS OF SEPTEMBER 30, 2019
The total Balance Sheet size of the Bank as of September 30, 2019, was Rs 1,63,777 crore.
The Gross Loan Book, including credit investments, stood at Rs. 1,07,656 crore.
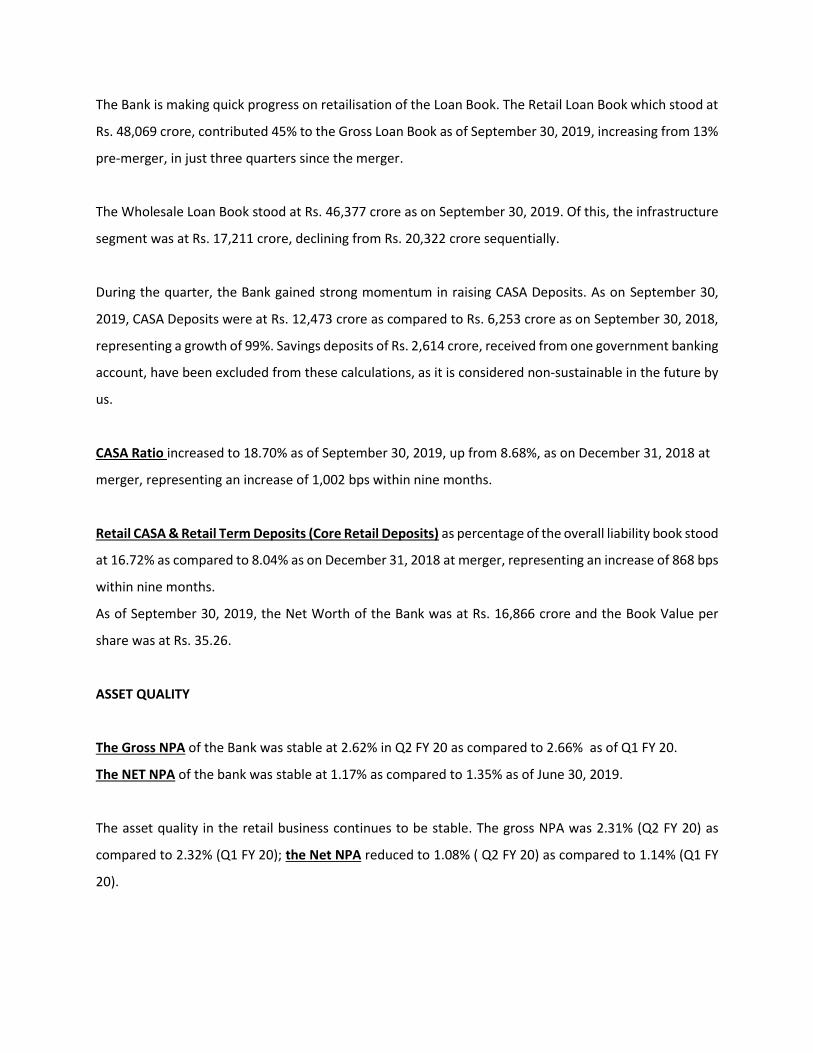
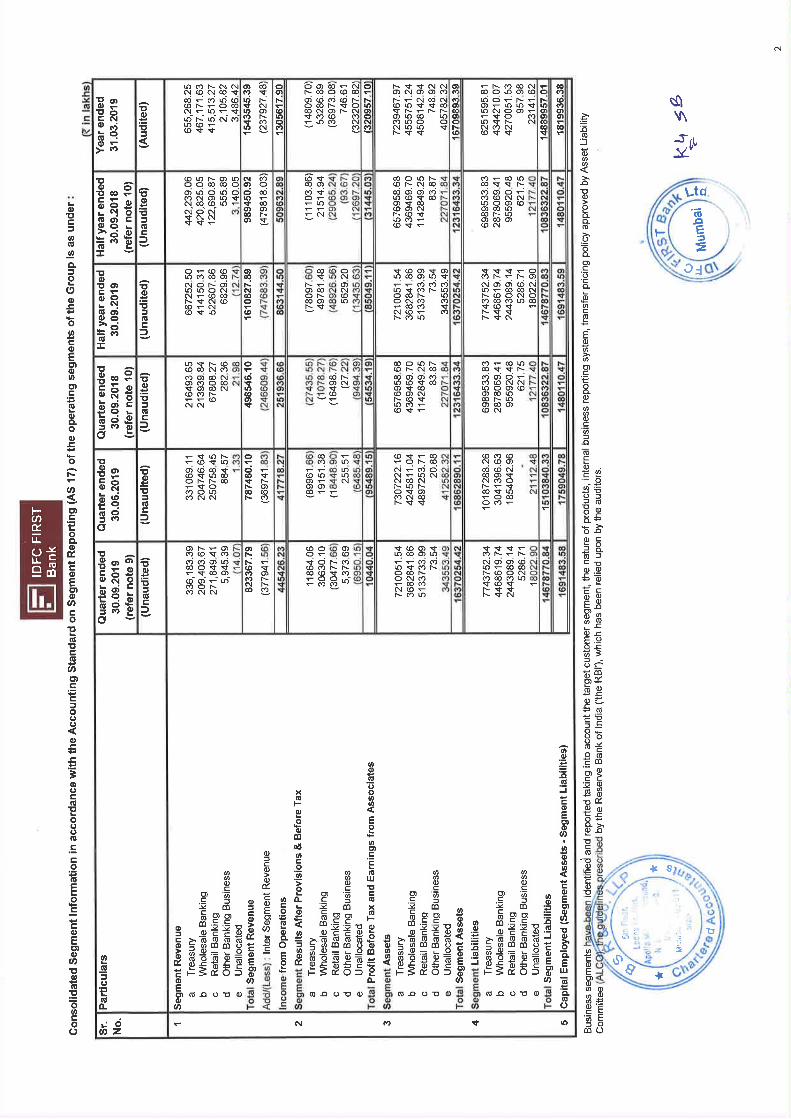
The Bank is making quick progress on retailisation of the Loan Book. The Retail Loan Book which stood at
Rs. 48,069 crore, contributed 45% to the Gross Loan Book as of September 30, 2019, increasing from 13%
pre-merger, in just three quarters since the merger.
The Wholesale Loan Book stood at Rs. 46,377 crore as on September 30, 2019. Of this, the infrastructure
segment was at Rs. 17,211 crore, declining from Rs. 20,322 crore sequentially.
During the quarter, the Bank gained strong momentum in raising CASA Deposits. As on September 30,
2019, CASA Deposits were at Rs. 12,473 crore as compared to Rs. 6,253 crore as on September 30, 2018,
representing a growth of 99%. Savings deposits of Rs. 2,614 crore, received from one government banking
account, have been excluded from these calculations, as it is considered non-sustainable in the future by
us.
CASA Ratio increased to 18.70% as of September 30, 2019, up from 8.68%, as on December 31, 2018 at
merger, representing an increase of 1,002 bps within nine months.
Retail CASA & Retail Term Deposits (Core Retail Deposits) as percentage of the overall liability book stood
at 16.72% as compared to 8.04% as on December 31, 2018 at merger, representing an increase of 868 bps
within nine months.
As of September 30, 2019, the Net Worth of the Bank was at Rs. 16,866 crore and the Book Value per
share was at Rs. 35.26.
ASSET QUALITY
The Gross NPA of the Bank was stable at 2.62% in Q2 FY 20 as compared to 2.66% as of Q1 FY 20.
The NET NPA of the bank was stable at 1.17% as compared to 1.35% as of June 30, 2019.
The asset quality in the retail business continues to be stable. The gross NPA was 2.31% (Q2 FY 20) as
compared to 2.32% (Q1 FY 20); the Net NPA reduced to 1.08% ( Q2 FY 20) as compared to 1.14% (Q1 FY
20).
CAPITAL ADEQUACY
The Bank’s total Capital Adequacy Ratio (CAR) as per Basel III guidelines was at 14.65%, and Tier I CAR was
at 14.51% as on September 30, 2019, significantly higher than regulatory requirements.
Mr. V Vaidyanathan, Managing Director and CEO, IDFC FIRST Bank, said, “the Bank is making excellent
progress on all parameters. CASA growth is 99% year on year. Including retail deposits and retail casa, the
bank raised nearly ₹ 6000 crores during Q2 FY20, giving us a strong liquidity surplus. Our liquidity coverage
ratio was 125%, much higher than regulatory requirements of 100%. Finally, we are delighted to post a
profit before tax of Rs. 100 crores for Q2 FY 20, which represents a strong revival of profitability. The Bank
is ahead of its plans for the 5-year strategic growth path guided earlier.”
About IDFC FIRST Bank
IDFC FIRST Bank was founded by the merger of IDFC Bank and Capital First in December 2018. The Bank
provides a range of financial solutions to individuals, small businesses and corporates. The Bank offers
savings and current accounts, NRI accounts, salary accounts, demat accounts, fixed and recurring
deposits, home and personal loans, two wheeler loans, consumer durable loans, small business loans,
forex products, payment solutions and wealth management services. IDFC FIRST Bank has a nationwide
presence and operates in the Retail Banking, Wholesale Banking and other banking segments. Customers
can choose where and how they want to bank: 351 bank liability branches, 103 asset branches, 216 ATMs
and 534 rural business correspondent centres across the country, net banking, mobile banking and 24/7
toll free Banker-on-Call service.
For media queries, contact: Freeda D’souza 9892962607 [email protected] For investor queries, contact: Saptarshi Bapari [email protected]
Corporate Presentation – Q2 FY20
This presentation has been prepared by and is the sole responsibility of IDFC FIRST Bank (together with its subsidiaries, referred to as the“Company”). By accessing this presentation, you are agreeing to be bound by the trailing restrictions.This presentation does not constitute or form part of any offer or invitation or inducement to sell or issue, or any solicitation of any offer orrecommendation to purchase or subscribe for, any securities of the Company, nor shall it or any part of it or the fact of its distribution form the basisof, or be relied on in connection with, any contractor commitment therefore. In particular, this presentation is not intended to be a prospectus oroffer document under the applicable laws of any jurisdiction, including India. No representation or warranty, express or implied, is made as to, andno reliance should be placed on, the fairness, accuracy, completeness or correctness of the information or opinions contained in this presentation.Such information and opinions are in all events not current after the date of this presentation. There is no obligation to update, modify or amendthis communication or to otherwise notify the recipient if information, opinion, projection, forecast or estimate set forth herein, changes orsubsequently becomes inaccurate.Certain statements contained in this presentation that are not statements of historical fact constitute “forward-looking statements.” You cangenerally identify forward-looking statements by terminology such as “aim”, “anticipate”, “believe”, “continue”, “could”, “estimate”, “expect”,“intend”, “may”, “objective”, “goal”, “plan”, “potential”, “project”, “pursue”, “shall”, “should”, “will”, “would”, or other words or phrases of similarimport. These forward-looking statements involve known and unknown risks, uncertainties, assumptions and other factors that may cause theCompany’s actual results, performance or achievements to be materially different from any future results, performance or achievements expressedor implied by such forward-looking statements or other projections. Important factors that could cause actual results, performance or achievementsto differ materially include, among others: (a) material changes in the regulations governing our businesses; (b) the Company's inability to complywith the capital adequacy norms prescribed by the RBI; (c) decrease in the value of the Company's collateral or delays in enforcing the Company'scollateral upon default by borrowers on their obligations to the Company; (d) the Company's inability to control the level of NPAs in the Company'sportfolio effectively; (e) certain failures, including internal or external fraud, operational errors, systems malfunctions, or cyber security incidents; (f)volatility in interest rates and other market conditions; and(g) any adverse changes to the Indian economy.This presentation is for general information purposes only, without regard to any specific objectives, financial situations or informational needs ofany particular person. The Company may alter, modify, regroup figures wherever necessary or otherwise change in any manner the content of thispresentation, without obligation to notify any person of such change or changes.
Disclaimer
2
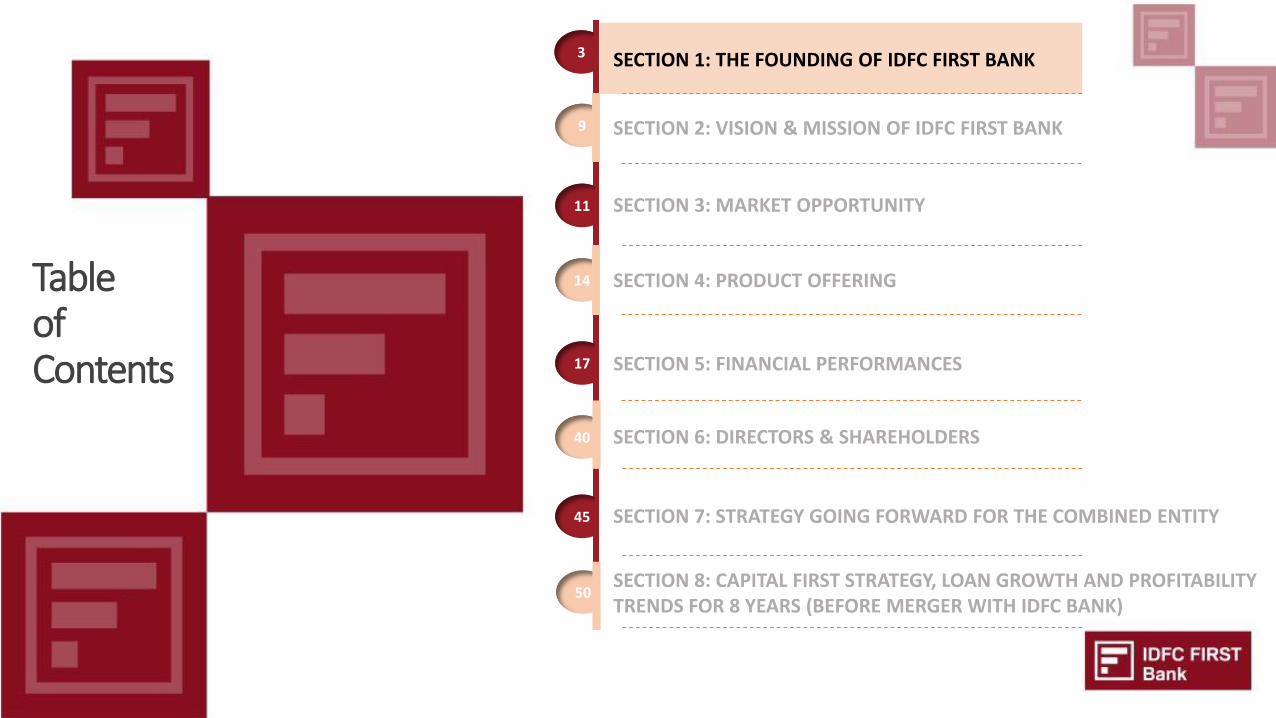
Table of Contents
9
11
17
40
14
SECTION 3: MARKET OPPORTUNITY
SECTION 6: DIRECTORS & SHAREHOLDERS
SECTION 5: FINANCIAL PERFORMANCES
SECTION 7: STRATEGY GOING FORWARD FOR THE COMBINED ENTITY
SECTION 4: PRODUCT OFFERING
45
SECTION 8: CAPITAL FIRST STRATEGY, LOAN GROWTH AND PROFITABILITY TRENDS FOR 8 YEARS (BEFORE MERGER WITH IDFC BANK)
3 SECTION 1: THE FOUNDING OF IDFC FIRST BANK
50
SECTION 2: VISION & MISSION OF IDFC FIRST BANK
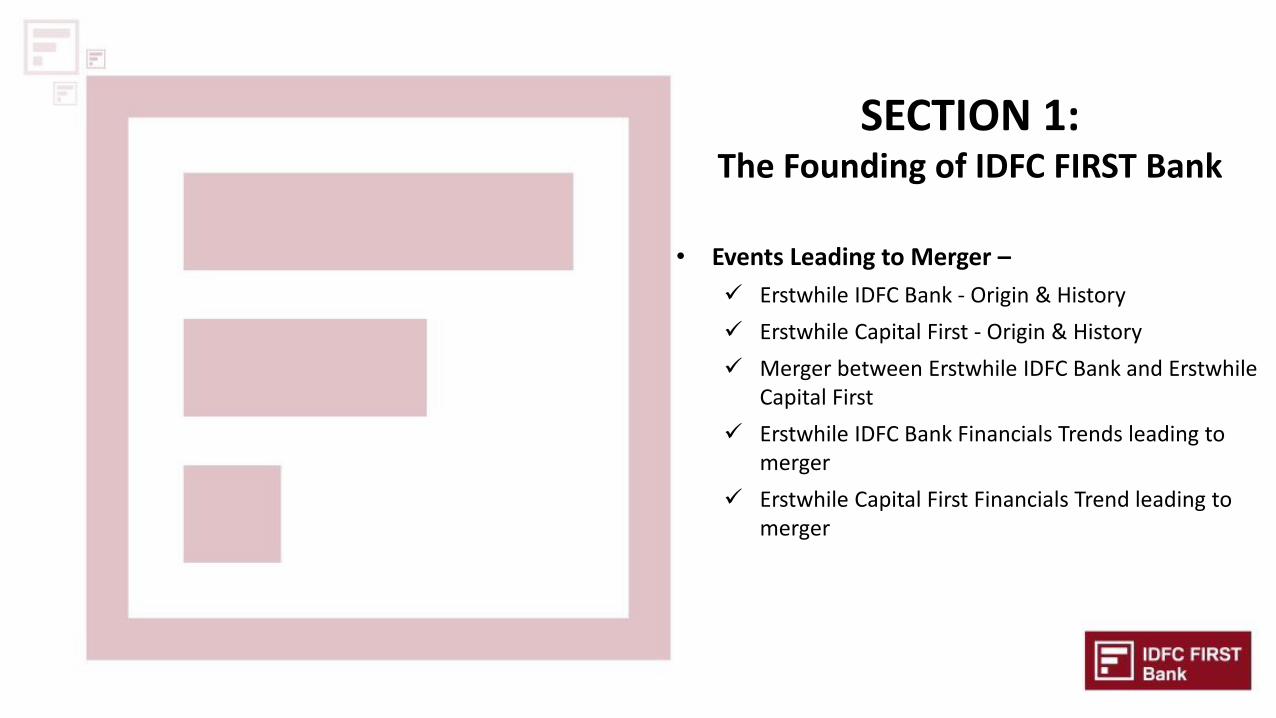
SECTION 1:The Founding of IDFC FIRST Bank
• Events Leading to Merger –
Erstwhile IDFC Bank - Origin & History
Erstwhile Capital First - Origin & History
Merger between Erstwhile IDFC Bank and Erstwhile Capital First
Erstwhile IDFC Bank Financials Trends leading to merger
Erstwhile Capital First Financials Trend leading to merger
5
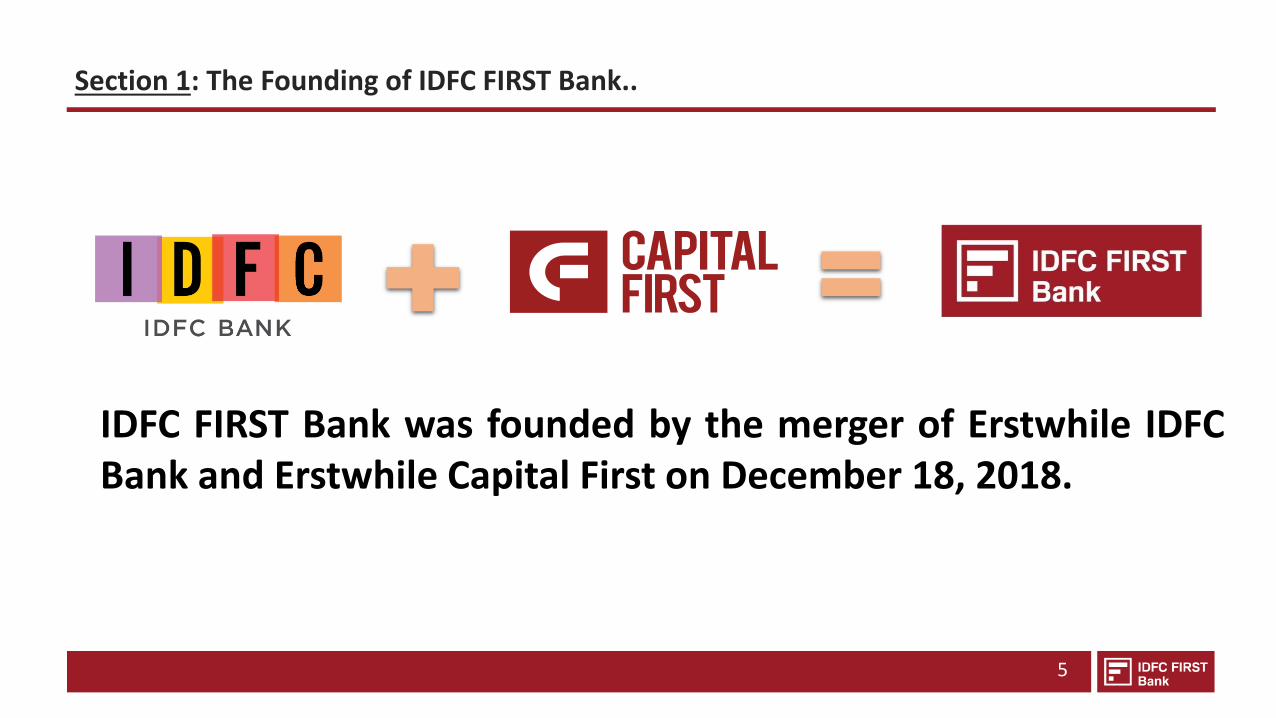
IDFC FIRST Bank was founded by the merger of Erstwhile IDFCBank and Erstwhile Capital First on December 18, 2018.
Section 1: The Founding of IDFC FIRST Bank..
Section 1: The Founding of IDFC FIRST Bank..
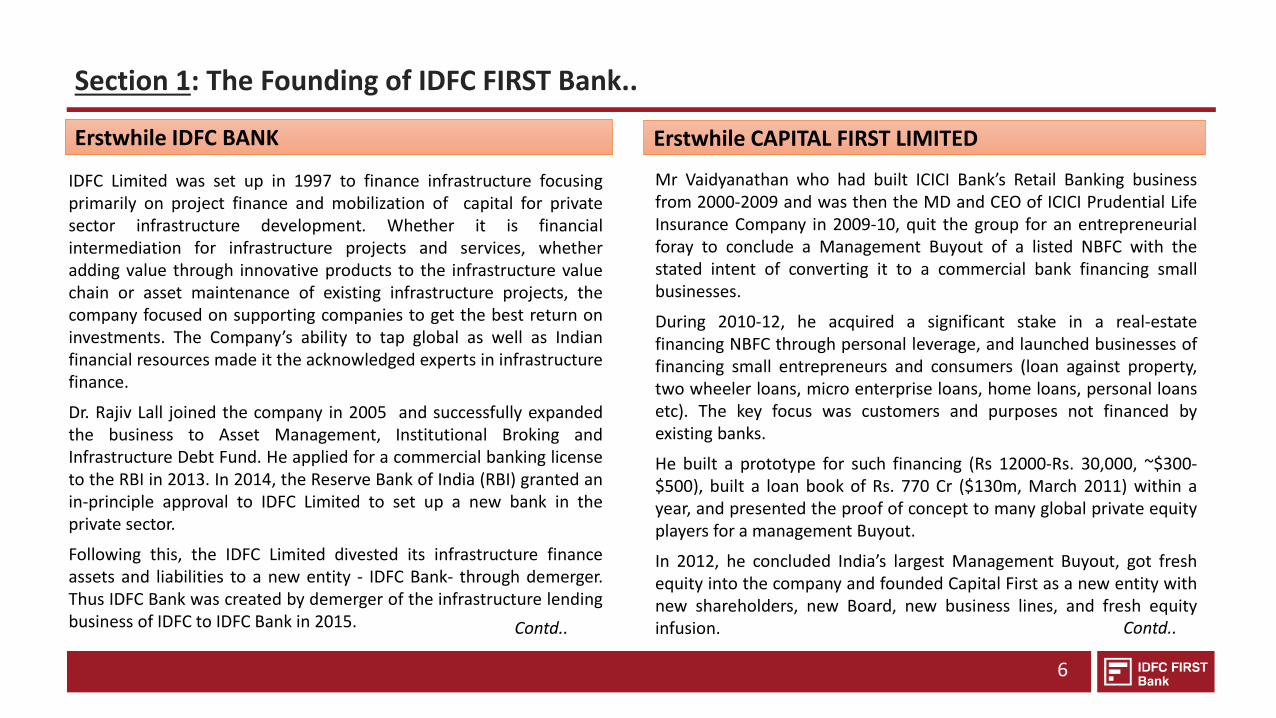
IDFC Limited was set up in 1997 to finance infrastructure focusingprimarily on project finance and mobilization of capital for privatesector infrastructure development. Whether it is financialintermediation for infrastructure projects and services, whetheradding value through innovative products to the infrastructure valuechain or asset maintenance of existing infrastructure projects, thecompany focused on supporting companies to get the best return oninvestments. The Company’s ability to tap global as well as Indianfinancial resources made it the acknowledged experts in infrastructurefinance.
Dr. Rajiv Lall joined the company in 2005 and successfully expandedthe business to Asset Management, Institutional Broking andInfrastructure Debt Fund. He applied for a commercial banking licenseto the RBI in 2013. In 2014, the Reserve Bank of India (RBI) granted anin-principle approval to IDFC Limited to set up a new bank in theprivate sector.
Following this, the IDFC Limited divested its infrastructure financeassets and liabilities to a new entity - IDFC Bank- through demerger.Thus IDFC Bank was created by demerger of the infrastructure lendingbusiness of IDFC to IDFC Bank in 2015.
6
Erstwhile IDFC BANK
Mr Vaidyanathan who had built ICICI Bank’s Retail Banking businessfrom 2000-2009 and was then the MD and CEO of ICICI Prudential LifeInsurance Company in 2009-10, quit the group for an entrepreneurialforay to conclude a Management Buyout of a listed NBFC with thestated intent of converting it to a commercial bank financing smallbusinesses.
During 2010-12, he acquired a significant stake in a real-estatefinancing NBFC through personal leverage, and launched businesses offinancing small entrepreneurs and consumers (loan against property,two wheeler loans, micro enterprise loans, home loans, personal loansetc). The key focus was customers and purposes not financed byexisting banks.
He built a prototype for such financing (Rs 12000-Rs. 30,000, ~$300-$500), built a loan book of Rs. 770 Cr ($130m, March 2011) within ayear, and presented the proof of concept to many global private equityplayers for a management Buyout.
In 2012, he concluded India’s largest Management Buyout, got freshequity into the company and founded Capital First as a new entity withnew shareholders, new Board, new business lines, and fresh equityinfusion.
Erstwhile CAPITAL FIRST LIMITED
Contd.. Contd..
Section 1: The Founding of IDFC FIRST Bank..
Continued from page 6
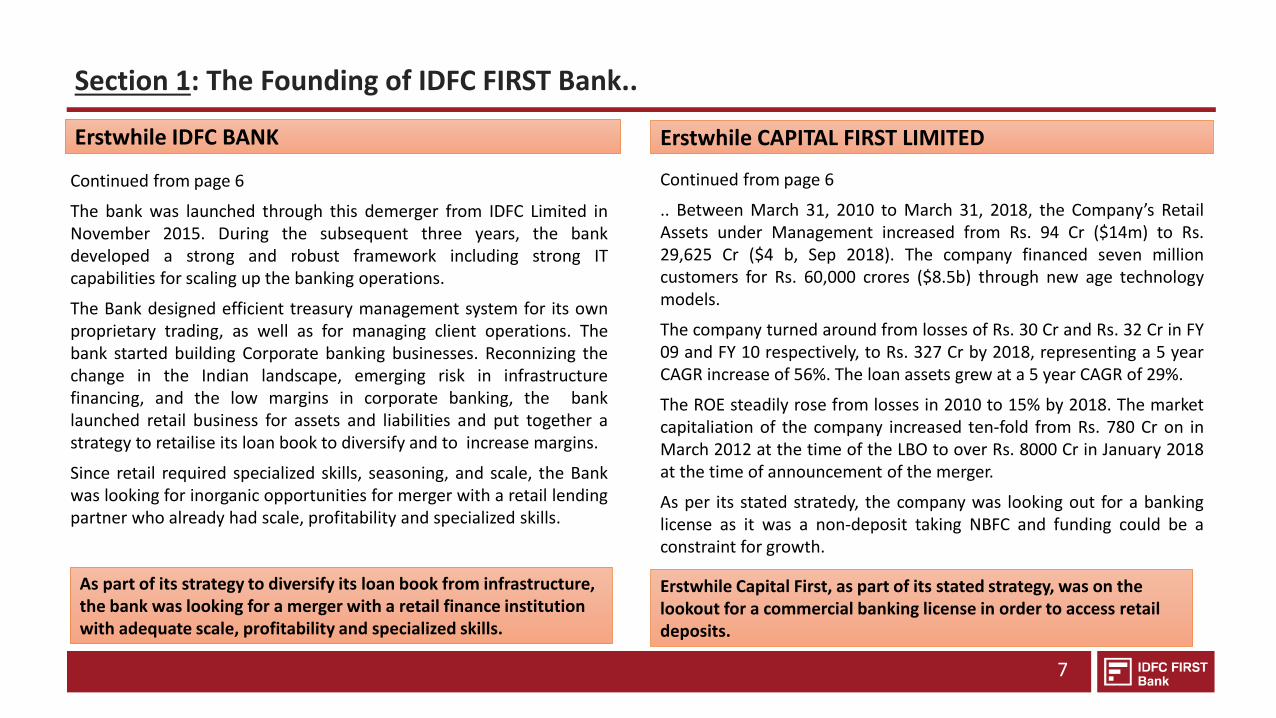
The bank was launched through this demerger from IDFC Limited inNovember 2015. During the subsequent three years, the bankdeveloped a strong and robust framework including strong ITcapabilities for scaling up the banking operations.
The Bank designed efficient treasury management system for its ownproprietary trading, as well as for managing client operations. Thebank started building Corporate banking businesses. Reconnizing thechange in the Indian landscape, emerging risk in infrastructurefinancing, and the low margins in corporate banking, the banklaunched retail business for assets and liabilities and put together astrategy to retailise its loan book to diversify and to increase margins.
Since retail required specialized skills, seasoning, and scale, the Bankwas looking for inorganic opportunities for merger with a retail lendingpartner who already had scale, profitability and specialized skills.
7
Erstwhile IDFC BANK
Continued from page 6
.. Between March 31, 2010 to March 31, 2018, the Company’s RetailAssets under Management increased from Rs. 94 Cr ($14m) to Rs.29,625 Cr ($4 b, Sep 2018). The company financed seven millioncustomers for Rs. 60,000 crores ($8.5b) through new age technologymodels.
The company turned around from losses of Rs. 30 Cr and Rs. 32 Cr in FY09 and FY 10 respectively, to Rs. 327 Cr by 2018, representing a 5 yearCAGR increase of 56%. The loan assets grew at a 5 year CAGR of 29%.
The ROE steadily rose from losses in 2010 to 15% by 2018. The marketcapitaliation of the company increased ten-fold from Rs. 780 Cr on inMarch 2012 at the time of the LBO to over Rs. 8000 Cr in January 2018at the time of announcement of the merger.
As per its stated stratedy, the company was looking out for a bankinglicense as it was a non-deposit taking NBFC and funding could be aconstraint for growth.
Erstwhile CAPITAL FIRST LIMITED
As part of its strategy to diversify its loan book from infrastructure, the bank was looking for a merger with a retail finance institution with adequate scale, profitability and specialized skills.
Erstwhile Capital First, as part of its stated strategy, was on the lookout for a commercial banking license in order to access retail deposits.
Section 1: The Founding of IDFC FIRST Bank..
8
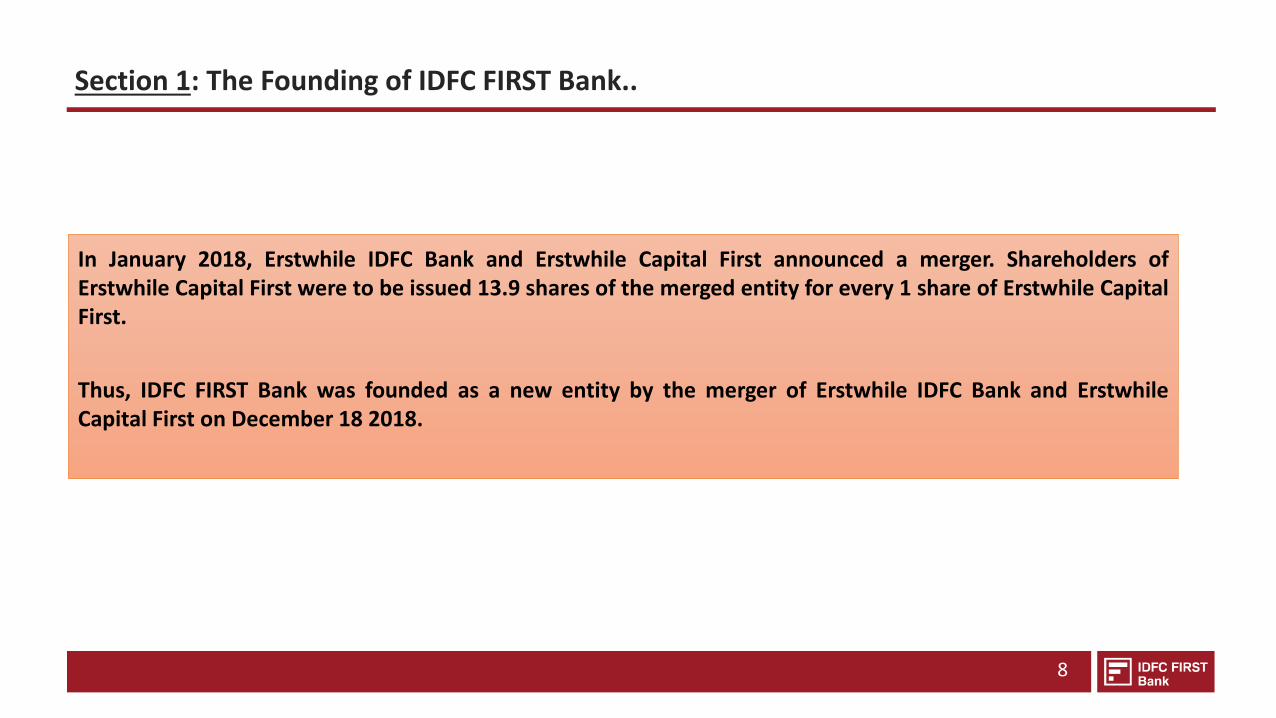
In January 2018, Erstwhile IDFC Bank and Erstwhile Capital First announced a merger. Shareholders ofErstwhile Capital First were to be issued 13.9 shares of the merged entity for every 1 share of Erstwhile CapitalFirst.
Thus, IDFC FIRST Bank was founded as a new entity by the merger of Erstwhile IDFC Bank and ErstwhileCapital First on December 18 2018.
9
11
17
40
14
SECTION 3: MARKET OPPORTUNITY
SECTION 6: DIRECTORS & SHAREHOLDERS
SECTION 5: FINANCIAL PERFORMANCES
SECTION 4: PRODUCT OFFERING
3 SECTION 1: THE FOUNDING OF IDFC FIRST BANK
SECTION 2: VISION & MISSION OF IDFC FIRST BANK
SECTION 7: STRATEGY GOING FORWARD FOR THE COMBINED ENTITY45
SECTION 8: CAPITAL FIRST STRATEGY, LOAN GROWTH AND PROFITABILITY TRENDS FOR 8 YEARS (BEFORE MERGER WITH IDFC BANK)
50
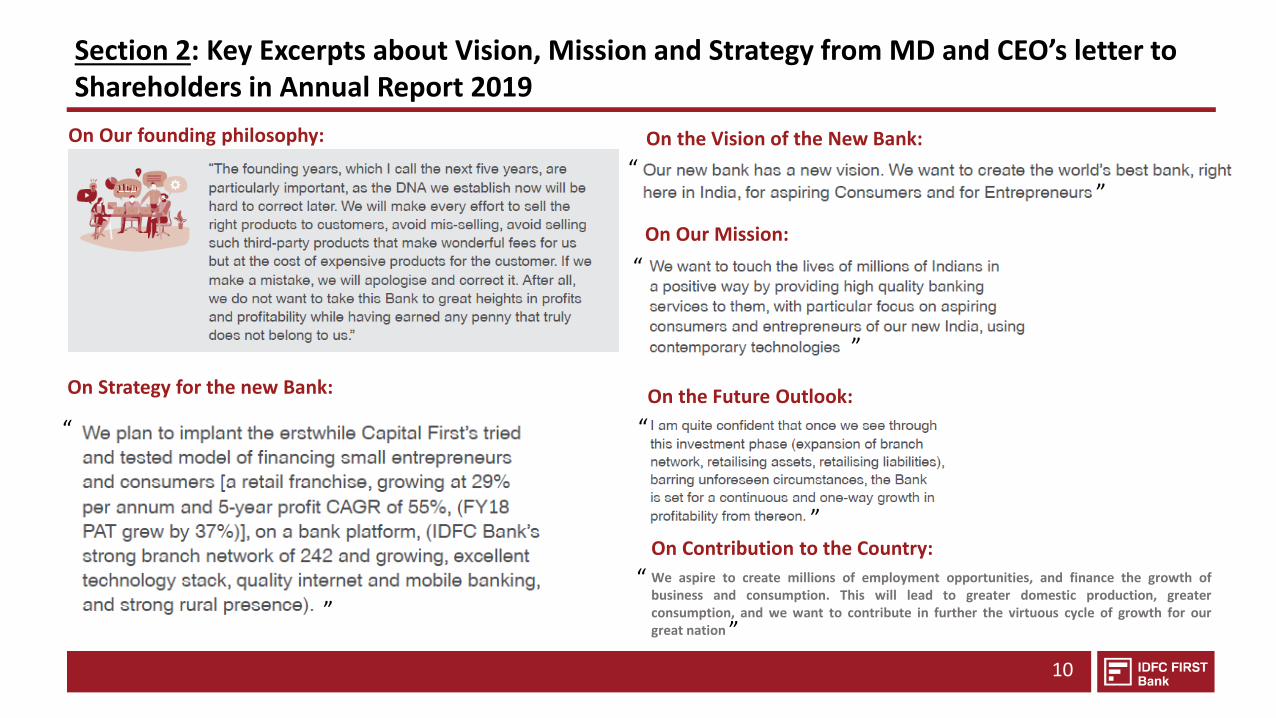
Section 2: Key Excerpts about Vision, Mission and Strategy from MD and CEO’s letter to Shareholders in Annual Report 2019
10
On Strategy for the new Bank:
“
On the Future Outlook:
On Our Mission:
On the Vision of the New Bank:
On Contribution to the Country:
We aspire to create millions of employment opportunities, and finance the growth ofbusiness and consumption. This will lead to greater domestic production, greaterconsumption, and we want to contribute in further the virtuous cycle of growth for ourgreat nation
”
“
”“
”
“
”
“
”
“
On Our founding philosophy:
SECTION 3: MARKET OPPORTUNITY
SECTION 6: DIRECTORS & SHAREHOLDERS
SECTION 5: FINANCIAL PERFORMANCES
SECTION 4: PRODUCT OFFERING
SECTION 1: THE FOUNDING OF IDFC FIRST BANK
SECTION 2: VISION & MISSION OF IDFC FIRST BANK
SECTION 7: STRATEGY GOING FORWARD FOR THE COMBINED ENTITY
SECTION 8: CAPITAL FIRST STRATEGY, LOAN GROWTH AND PROFITABILITY TRENDS FOR 8 YEARS (BEFORE MERGER WITH IDFC BANK)
9
11
17
40
14
3
45
50
28.58 33.46
40.77 47.83
55.06 62.64
68.81 75.21
79.27 86.83
98.18
Mar-09Mar-10Mar-11Mar-12Mar-13Mar-14Mar-15Mar-16Mar-17Mar-18Mar-19
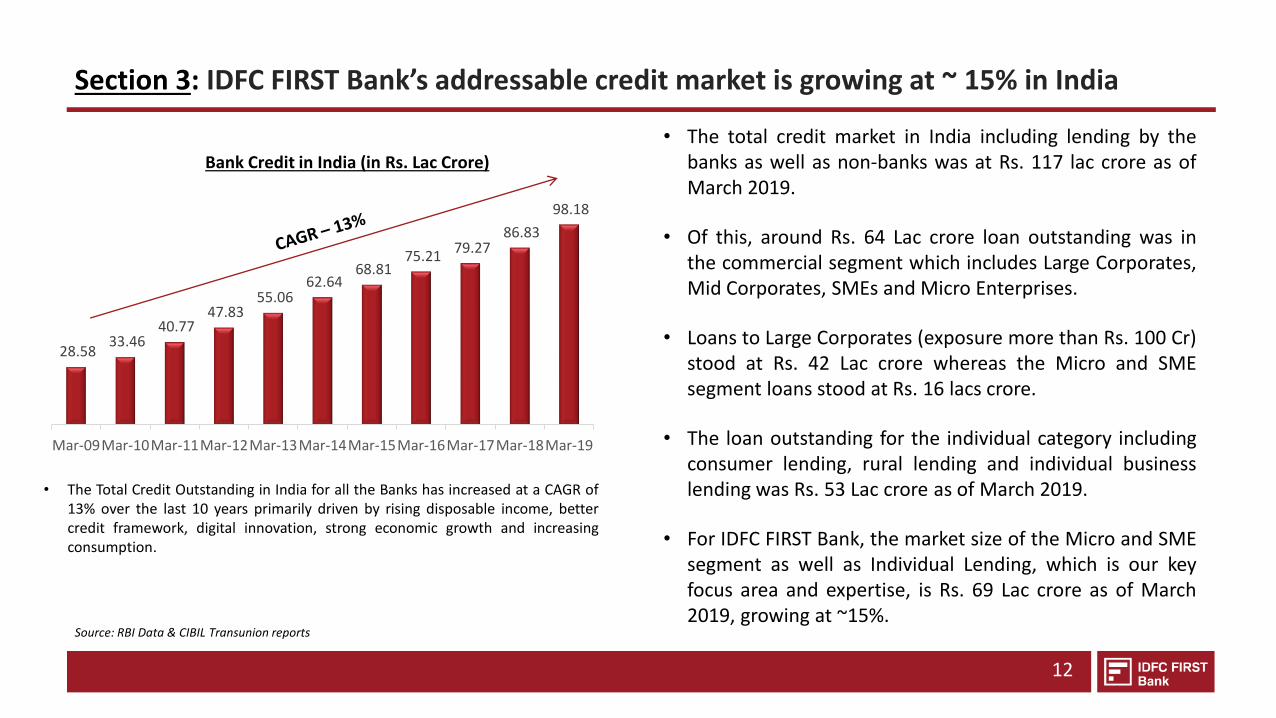
Section 3: IDFC FIRST Bank’s addressable credit market is growing at ~ 15% in India
12
Bank Credit in India (in Rs. Lac Crore)
• The total credit market in India including lending by thebanks as well as non-banks was at Rs. 117 lac crore as ofMarch 2019.
• Of this, around Rs. 64 Lac crore loan outstanding was inthe commercial segment which includes Large Corporates,Mid Corporates, SMEs and Micro Enterprises.
• Loans to Large Corporates (exposure more than Rs. 100 Cr)stood at Rs. 42 Lac crore whereas the Micro and SMEsegment loans stood at Rs. 16 lacs crore.
• The loan outstanding for the individual category includingconsumer lending, rural lending and individual businesslending was Rs. 53 Lac crore as of March 2019.
• For IDFC FIRST Bank, the market size of the Micro and SMEsegment as well as Individual Lending, which is our keyfocus area and expertise, is Rs. 69 Lac crore as of March2019, growing at ~15%.
Source: RBI Data & CIBIL Transunion reports
• The Total Credit Outstanding in India for all the Banks has increased at a CAGR of13% over the last 10 years primarily driven by rising disposable income, bettercredit framework, digital innovation, strong economic growth and increasingconsumption.
39.37 46.02
54.27 61.74
70.51 80.28
88.91 96.60
107.45 114.79
125.59
Mar-09 Mar-10 Mar-11 Mar-12 Mar-13 Mar-14 Mar-15 Mar-16 Mar-17 Mar-18 Mar-19
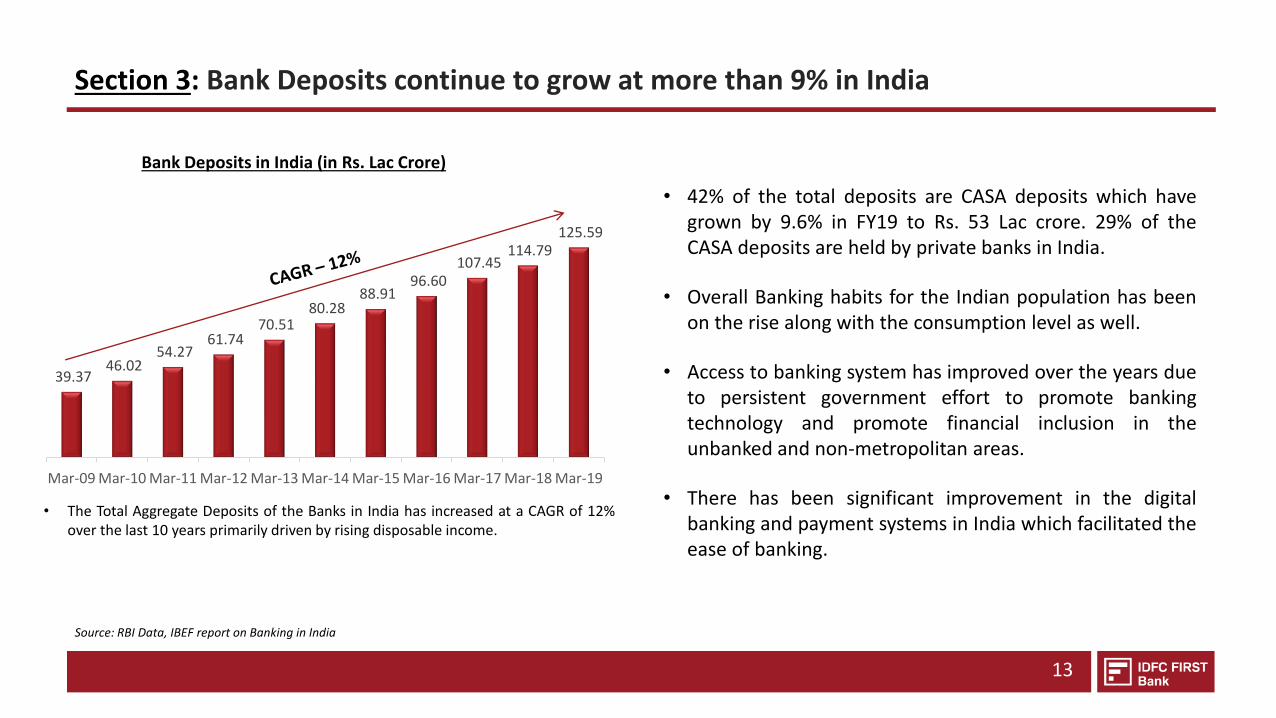
Section 3: Bank Deposits continue to grow at more than 9% in India
13
Bank Deposits in India (in Rs. Lac Crore)
• 42% of the total deposits are CASA deposits which havegrown by 9.6% in FY19 to Rs. 53 Lac crore. 29% of theCASA deposits are held by private banks in India.
• Overall Banking habits for the Indian population has beenon the rise along with the consumption level as well.
• Access to banking system has improved over the years dueto persistent government effort to promote bankingtechnology and promote financial inclusion in theunbanked and non-metropolitan areas.
• There has been significant improvement in the digitalbanking and payment systems in India which facilitated theease of banking.
Source: RBI Data, IBEF report on Banking in India
• The Total Aggregate Deposits of the Banks in India has increased at a CAGR of 12%over the last 10 years primarily driven by rising disposable income.
SECTION 3: MARKET OPPORTUNITY
SECTION 6: DIRECTORS & SHAREHOLDERS
SECTION 5: FINANCIAL PERFORMANCES
SECTION 4: PRODUCT OFFERING
SECTION 1: THE FOUNDING OF IDFC FIRST BANK
SECTION 2: VISION & MISSION OF IDFC FIRST BANK
SECTION 7: STRATEGY GOING FORWARD FOR THE COMBINED ENTITY
SECTION 8: CAPITAL FIRST STRATEGY, LOAN GROWTH AND PROFITABILITY TRENDS FOR 8 YEARS (BEFORE MERGER WITH IDFC BANK)
9
11
17
40
14
3
45
50
15
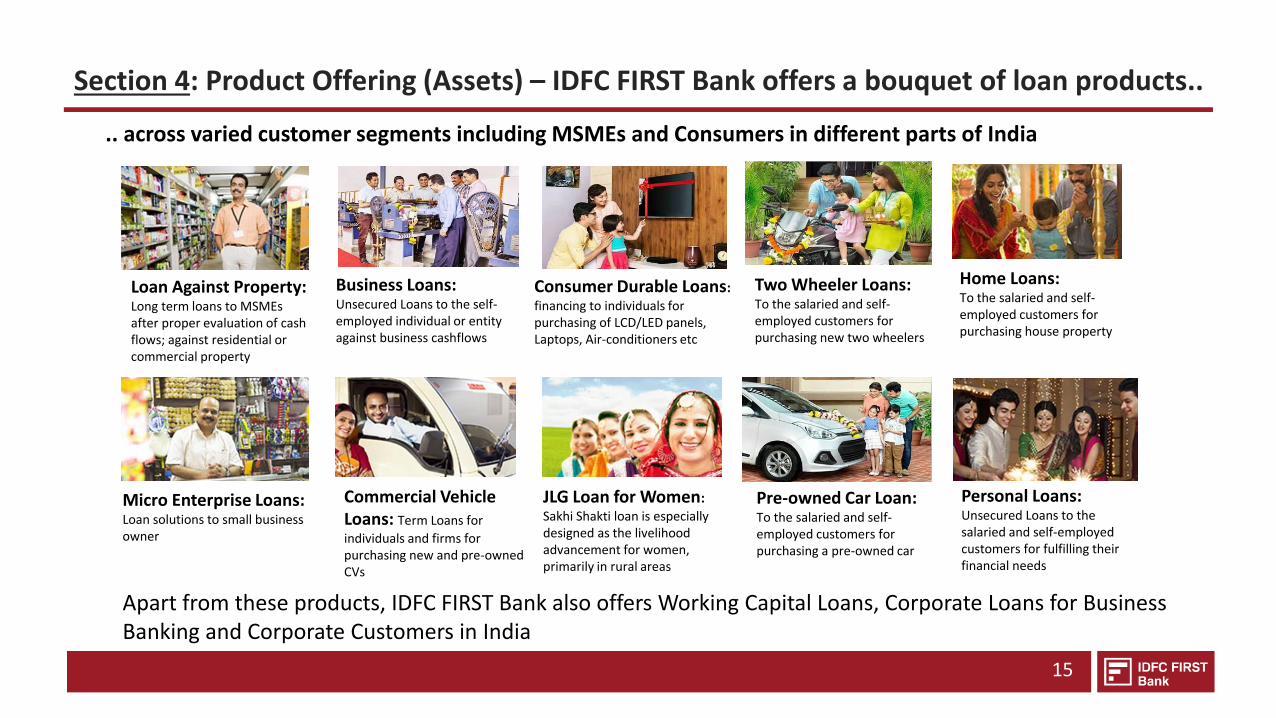
Section 4: Product Offering (Assets) – IDFC FIRST Bank offers a bouquet of loan products..
Loan Against Property: Long term loans to MSMEs after proper evaluation of cash flows; against residential or commercial property
Consumer Durable Loans: financing to individuals for purchasing of LCD/LED panels, Laptops, Air-conditioners etc
Business Loans: Unsecured Loans to the self-employed individual or entity against business cashflows
Two Wheeler Loans: To the salaried and self-employed customers for purchasing new two wheelers
Home Loans: To the salaried and self-employed customers for purchasing house property
Micro Enterprise Loans: Loan solutions to small business owner
JLG Loan for Women: Sakhi Shakti loan is especially designed as the livelihood advancement for women, primarily in rural areas
Commercial Vehicle Loans: Term Loans for
individuals and firms for purchasing new and pre-owned CVs
Pre-owned Car Loan: To the salaried and self-employed customers for purchasing a pre-owned car
Personal Loans: Unsecured Loans to the salaried and self-employed customers for fulfilling their financial needs
.. across varied customer segments including MSMEs and Consumers in different parts of India
Apart from these products, IDFC FIRST Bank also offers Working Capital Loans, Corporate Loans for Business Banking and Corporate Customers in India
16
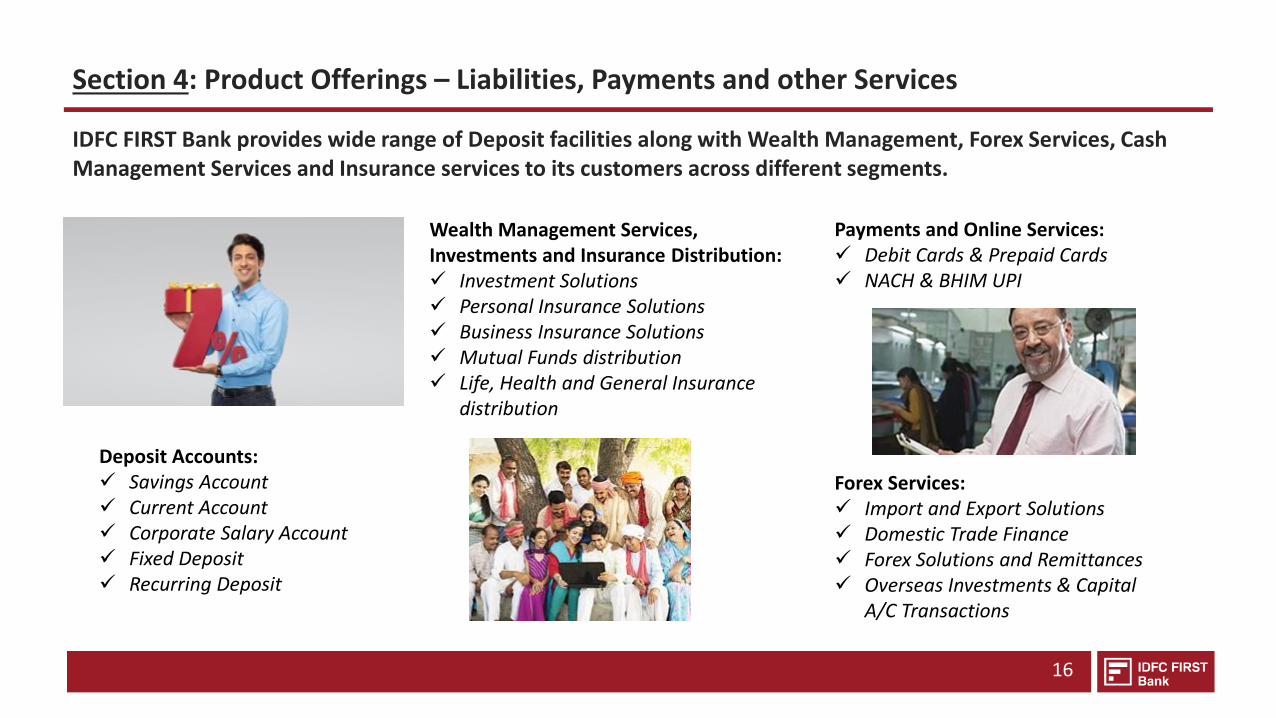
IDFC FIRST Bank provides wide range of Deposit facilities along with Wealth Management, Forex Services, Cash Management Services and Insurance services to its customers across different segments.
Section 4: Product Offerings – Liabilities, Payments and other Services
Deposit Accounts: Savings Account Current Account Corporate Salary Account Fixed Deposit Recurring Deposit
Forex Services: Import and Export Solutions Domestic Trade Finance Forex Solutions and Remittances Overseas Investments & Capital
A/C Transactions
Wealth Management Services, Investments and Insurance Distribution: Investment Solutions Personal Insurance Solutions Business Insurance Solutions Mutual Funds distribution Life, Health and General Insurance
distribution
Payments and Online Services: Debit Cards & Prepaid Cards NACH & BHIM UPI
SECTION 3: MARKET OPPORTUNITY
SECTION 6: DIRECTORS & SHAREHOLDERS
SECTION 5: FINANCIAL PERFORMANCES
SECTION 4: PRODUCT OFFERING
SECTION 1: THE FOUNDING OF IDFC FIRST BANK
SECTION 2: VISION & MISSION OF IDFC FIRST BANK
SECTION 7: STRATEGY GOING FORWARD FOR THE COMBINED ENTITY
SECTION 8: CAPITAL FIRST STRATEGY, LOAN GROWTH AND PROFITABILITY TRENDS FOR 8 YEARS (BEFORE MERGER WITH IDFC BANK)
9
11
17
40
14
3
45
50
SECTION 5: FINANCIAL PERFORMANCEOF THE BANK FOR Q2-FY20
• Snapshot of Key Parameters• Assets Update• Update on Liabilities• Key Business & Financial Parameters
Snapshot for the quarter Income Statement Balance Sheet
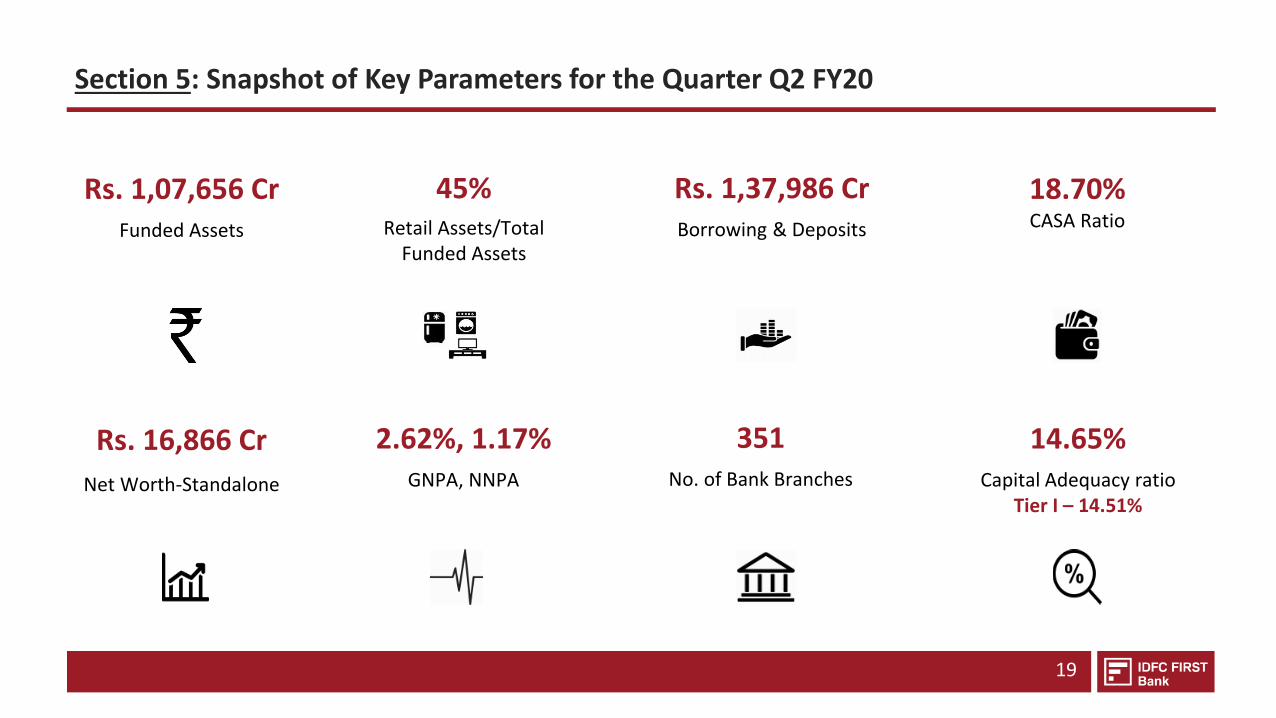
Section 5: Snapshot of Key Parameters for the Quarter Q2 FY20
19
Rs. 1,07,656 CrFunded Assets
45%Retail Assets/Total
Funded Assets
Rs. 1,37,986 CrBorrowing & Deposits
18.70%CASA Ratio
Rs. 16,866 Cr
Net Worth-Standalone
2.62%, 1.17% GNPA, NNPA
351No. of Bank Branches
14.65%Capital Adequacy ratio
Tier I – 14.51%
SECTION 5: FINANCIAL PERFORMANCEOF THE BANK FOR Q2-FY20
• Snapshot of Key Parameters• Assets Update• Update on Liabilities• Key Business & Financial Parameters
Snapshot for the quarter Income Statement Balance Sheet
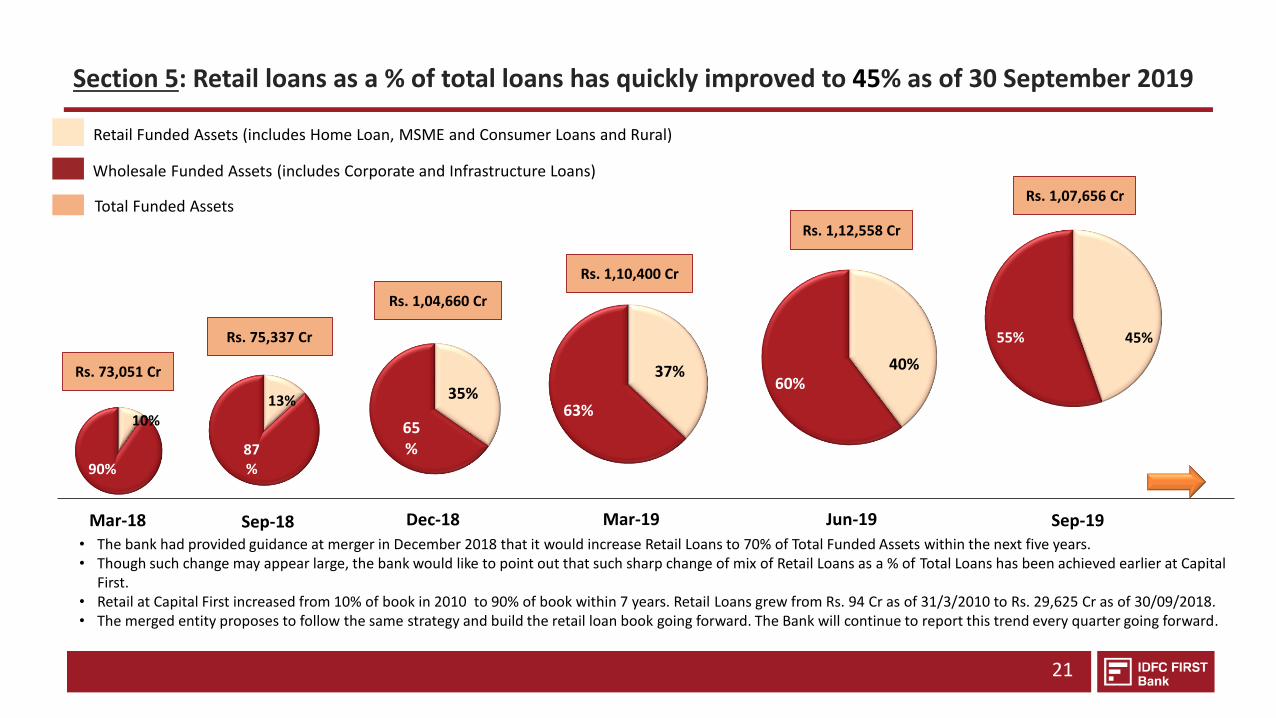
Section 5: Retail loans as a % of total loans has quickly improved to 45% as of 30 September 2019
21
Sep-18
13%
87%
Dec-18
35%
65%
37%
63%
Mar-19
40%60%
Jun-19
Rs. 1,04,660 Cr
Total Funded Assets
Retail Funded Assets (includes Home Loan, MSME and Consumer Loans and Rural)
Wholesale Funded Assets (includes Corporate and Infrastructure Loans)
Rs. 75,337 Cr
Rs. 1,10,400 Cr
Rs. 1,12,558 Cr
• The bank had provided guidance at merger in December 2018 that it would increase Retail Loans to 70% of Total Funded Assets within the next five years.• Though such change may appear large, the bank would like to point out that such sharp change of mix of Retail Loans as a % of Total Loans has been achieved earlier at Capital
First. • Retail at Capital First increased from 10% of book in 2010 to 90% of book within 7 years. Retail Loans grew from Rs. 94 Cr as of 31/3/2010 to Rs. 29,625 Cr as of 30/09/2018.• The merged entity proposes to follow the same strategy and build the retail loan book going forward. The Bank will continue to report this trend every quarter going forward.
10%
90%
Rs. 73,051 Cr
Mar-18 Sep-19
Rs. 1,07,656 Cr
45%55%
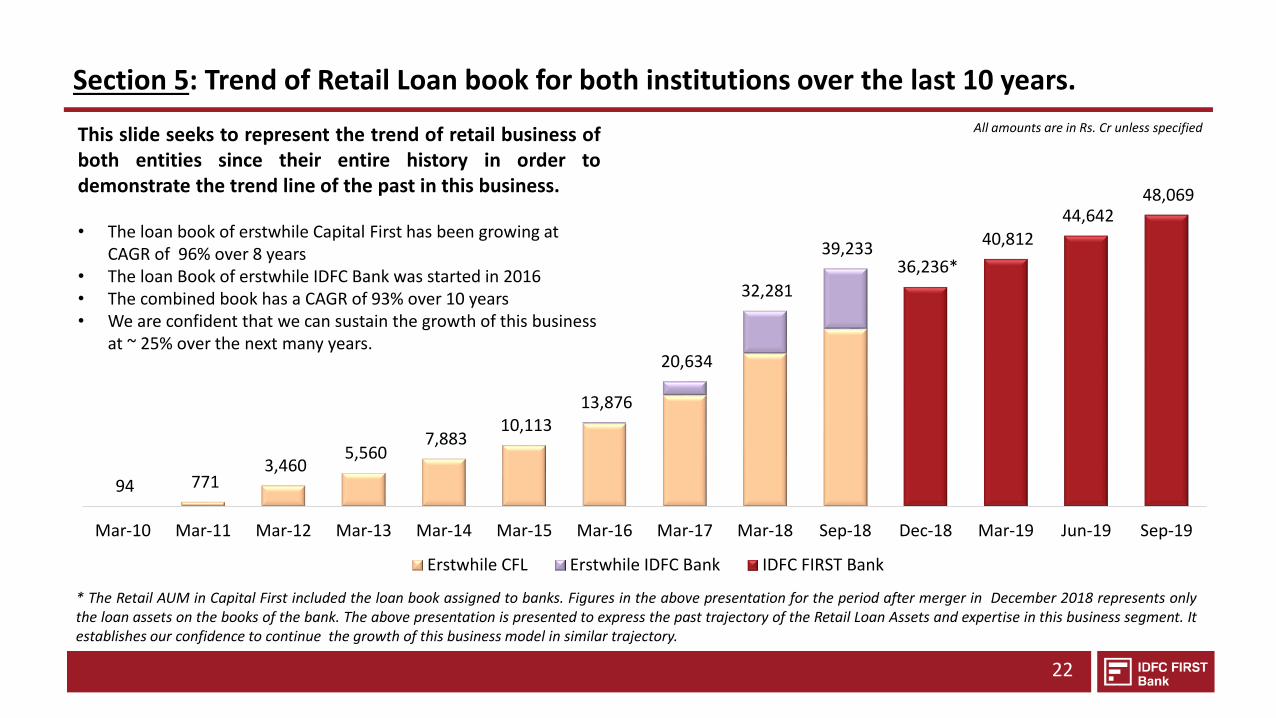
Section 5: Trend of Retail Loan book for both institutions over the last 10 years.
22
94 771 3,460
5,560 7,883
10,113 13,876
20,634
32,281
39,233 36,236*
40,812 44,642
48,069
Mar-10 Mar-11 Mar-12 Mar-13 Mar-14 Mar-15 Mar-16 Mar-17 Mar-18 Sep-18 Dec-18 Mar-19 Jun-19 Sep-19
Erstwhile CFL Erstwhile IDFC Bank IDFC FIRST Bank
This slide seeks to represent the trend of retail business ofboth entities since their entire history in order todemonstrate the trend line of the past in this business.
• The loan book of erstwhile Capital First has been growing at CAGR of 96% over 8 years
• The loan Book of erstwhile IDFC Bank was started in 2016• The combined book has a CAGR of 93% over 10 years• We are confident that we can sustain the growth of this business
at ~ 25% over the next many years.
* The Retail AUM in Capital First included the loan book assigned to banks. Figures in the above presentation for the period after merger in December 2018 represents onlythe loan assets on the books of the bank. The above presentation is presented to express the past trajectory of the Retail Loan Assets and expertise in this business segment. Itestablishes our confidence to continue the growth of this business model in similar trajectory.
All amounts are in Rs. Cr unless specified
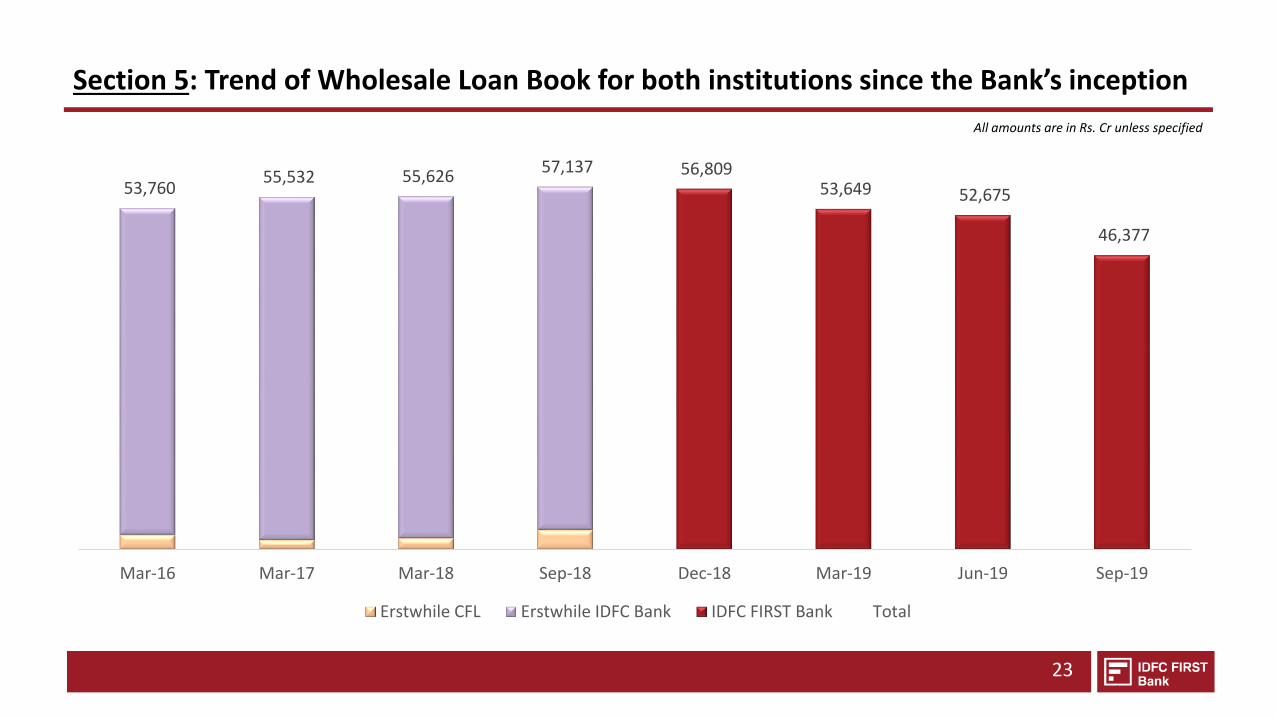
Section 5: Trend of Wholesale Loan Book for both institutions since the Bank’s inception
23
53,760 55,532 55,626
57,137 56,809 53,649 52,675
46,377
Mar-16 Mar-17 Mar-18 Sep-18 Dec-18 Mar-19 Jun-19 Sep-19
Erstwhile CFL Erstwhile IDFC Bank IDFC FIRST Bank Total
All amounts are in Rs. Cr unless specified
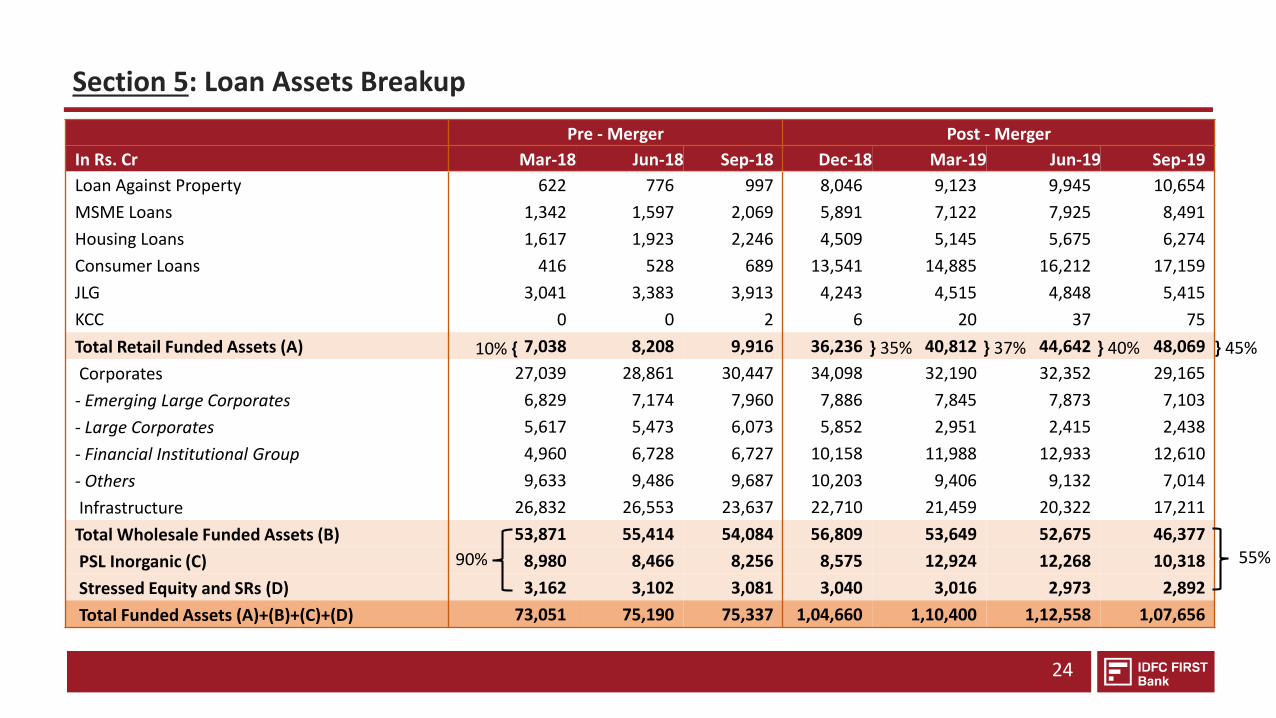
Section 5: Loan Assets Breakup
24
Pre - Merger Post - Merger
In Rs. Cr Mar-18 Jun-18 Sep-18 Dec-18 Mar-19 Jun-19 Sep-19
Loan Against Property 622 776 997 8,046 9,123 9,945 10,654
MSME Loans 1,342 1,597 2,069 5,891 7,122 7,925 8,491
Housing Loans 1,617 1,923 2,246 4,509 5,145 5,675 6,274
Consumer Loans 416 528 689 13,541 14,885 16,212 17,159
JLG 3,041 3,383 3,913 4,243 4,515 4,848 5,415
KCC 0 0 2 6 20 37 75
Total Retail Funded Assets (A) 7,038 8,208 9,916 36,236 40,812 44,642 48,069
Corporates 27,039 28,861 30,447 34,098 32,190 32,352 29,165
- Emerging Large Corporates 6,829 7,174 7,960 7,886 7,845 7,873 7,103
- Large Corporates 5,617 5,473 6,073 5,852 2,951 2,415 2,438
- Financial Institutional Group 4,960 6,728 6,727 10,158 11,988 12,933 12,610
- Others 9,633 9,486 9,687 10,203 9,406 9,132 7,014
Infrastructure 26,832 26,553 23,637 22,710 21,459 20,322 17,211
Total Wholesale Funded Assets (B) 53,871 55,414 54,084 56,809 53,649 52,675 46,377
PSL Inorganic (C) 8,980 8,466 8,256 8,575 12,924 12,268 10,318
Stressed Equity and SRs (D) 3,162 3,102 3,081 3,040 3,016 2,973 2,892
Total Funded Assets (A)+(B)+(C)+(D) 73,051 75,190 75,337 1,04,660 1,10,400 1,12,558 1,07,656
} 45%10% {
55%90%
} 40%} 37%} 35%
1.56%
2.89%3.03% 3.01%
3.43%
30 Sep 18 31 Dec 18 31 Mar 19 30 Jun 19 30-Sep-19
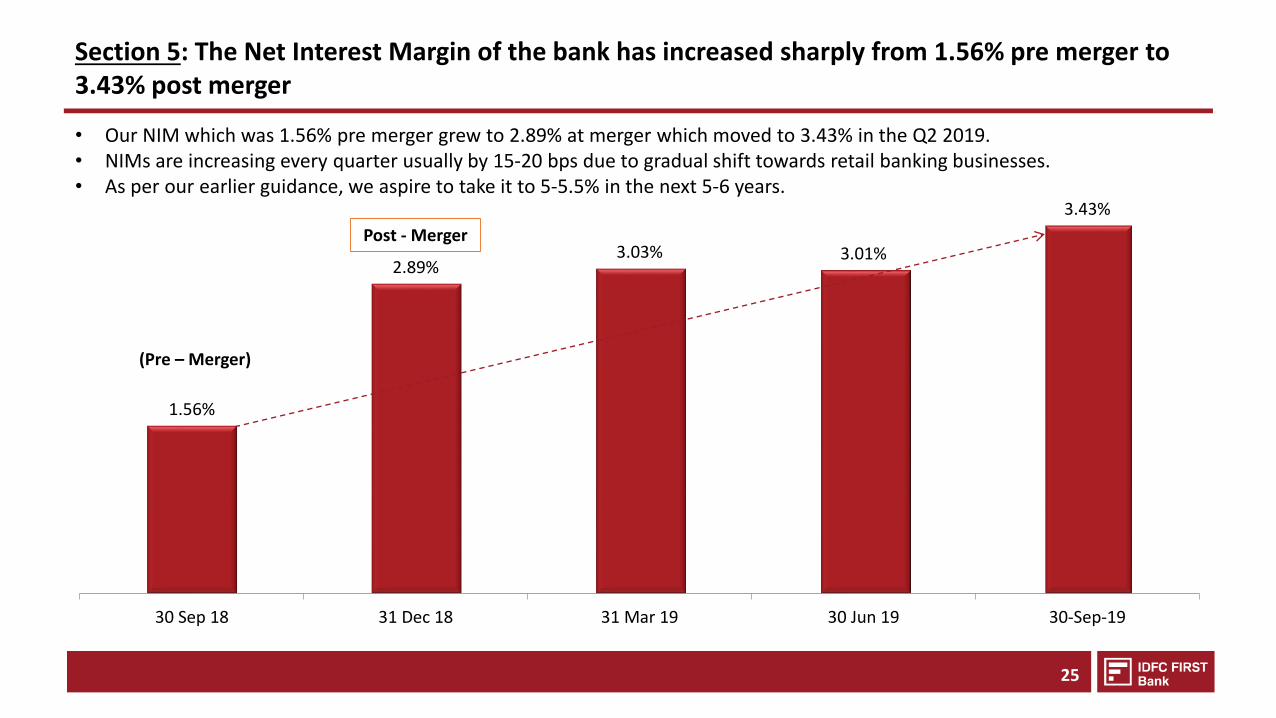
Section 5: The Net Interest Margin of the bank has increased sharply from 1.56% pre merger to 3.43% post merger
(Pre – Merger)
Post - Merger
25
• Our NIM which was 1.56% pre merger grew to 2.89% at merger which moved to 3.43% in the Q2 2019.• NIMs are increasing every quarter usually by 15-20 bps due to gradual shift towards retail banking businesses.• As per our earlier guidance, we aspire to take it to 5-5.5% in the next 5-6 years.
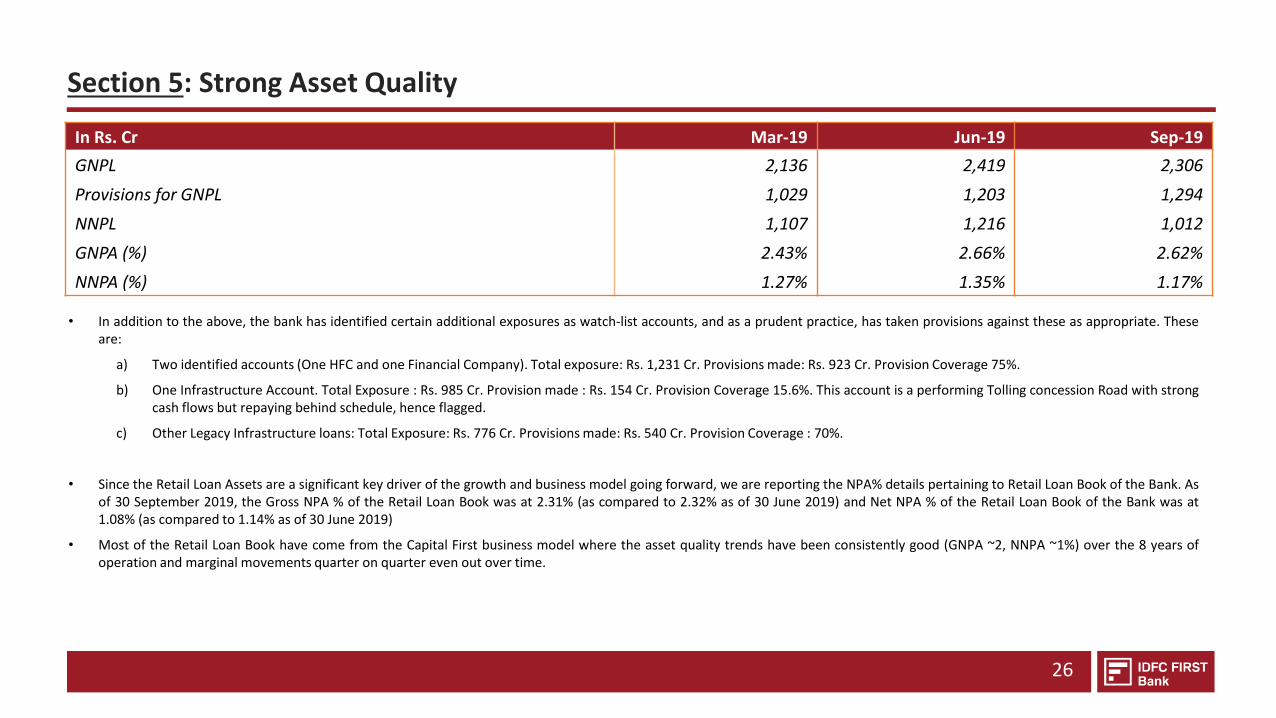
Section 5: Strong Asset Quality
26
In Rs. Cr Mar-19 Jun-19 Sep-19
GNPL 2,136 2,419 2,306
Provisions for GNPL 1,029 1,203 1,294
NNPL 1,107 1,216 1,012
GNPA (%) 2.43% 2.66% 2.62%
NNPA (%) 1.27% 1.35% 1.17%
• In addition to the above, the bank has identified certain additional exposures as watch-list accounts, and as a prudent practice, has taken provisions against these as appropriate. Theseare:
a) Two identified accounts (One HFC and one Financial Company). Total exposure: Rs. 1,231 Cr. Provisions made: Rs. 923 Cr. Provision Coverage 75%.
b) One Infrastructure Account. Total Exposure : Rs. 985 Cr. Provision made : Rs. 154 Cr. Provision Coverage 15.6%. This account is a performing Tolling concession Road with strongcash flows but repaying behind schedule, hence flagged.
c) Other Legacy Infrastructure loans: Total Exposure: Rs. 776 Cr. Provisions made: Rs. 540 Cr. Provision Coverage : 70%.
• Since the Retail Loan Assets are a significant key driver of the growth and business model going forward, we are reporting the NPA% details pertaining to Retail Loan Book of the Bank. Asof 30 September 2019, the Gross NPA % of the Retail Loan Book was at 2.31% (as compared to 2.32% as of 30 June 2019) and Net NPA % of the Retail Loan Book of the Bank was at1.08% (as compared to 1.14% as of 30 June 2019)
• Most of the Retail Loan Book have come from the Capital First business model where the asset quality trends have been consistently good (GNPA ~2, NNPA ~1%) over the 8 years ofoperation and marginal movements quarter on quarter even out over time.
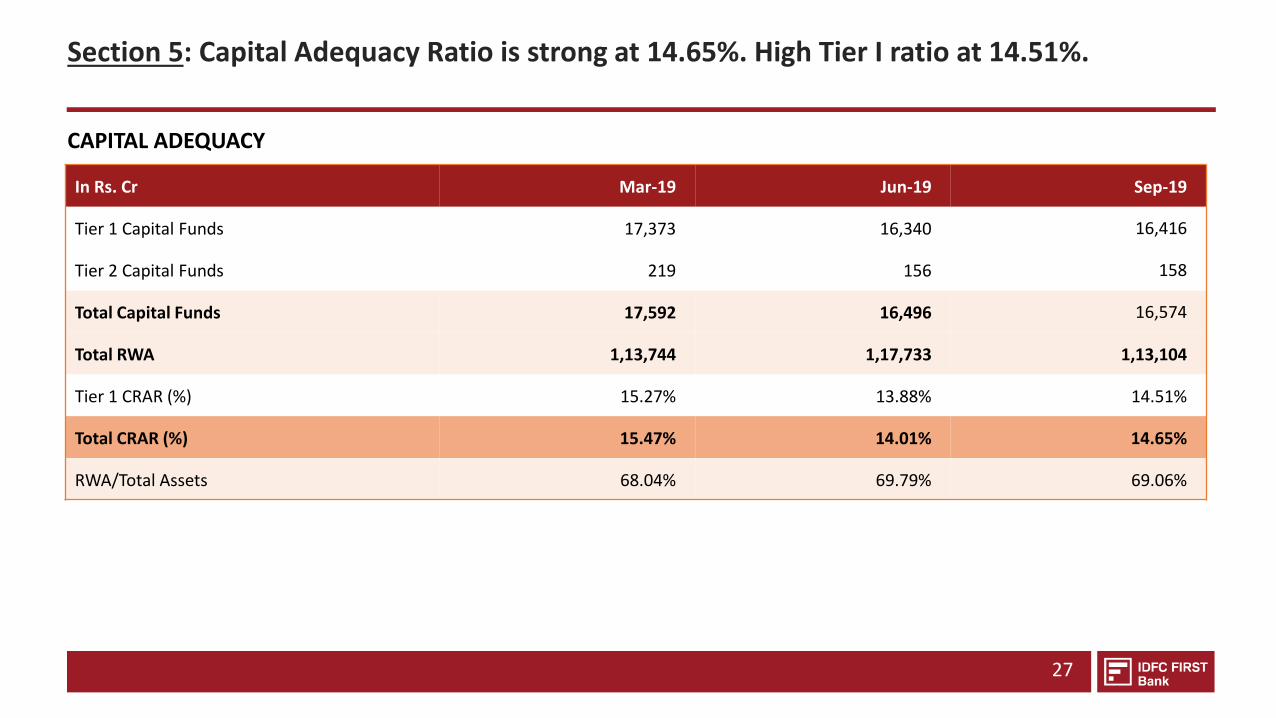
Section 5: Capital Adequacy Ratio is strong at 14.65%. High Tier I ratio at 14.51%.
27
In Rs. Cr Mar-19 Jun-19 Sep-19
Tier 1 Capital Funds 17,373 16,340 16,416
Tier 2 Capital Funds 219 156 158
Total Capital Funds 17,592 16,496 16,574
Total RWA 1,13,744 1,17,733 1,13,104
Tier 1 CRAR (%) 15.27% 13.88% 14.51%
Total CRAR (%) 15.47% 14.01% 14.65%
RWA/Total Assets 68.04% 69.79% 69.06%
CAPITAL ADEQUACY
SECTION 5: FINANCIAL PERFORMANCEOF THE BANK FOR Q2-FY20
• Snapshot of Key Parameters• Assets Update• Update on Liabilities• Key Business & Financial Parameters
Snapshot for the quarter Income Statement Balance Sheet
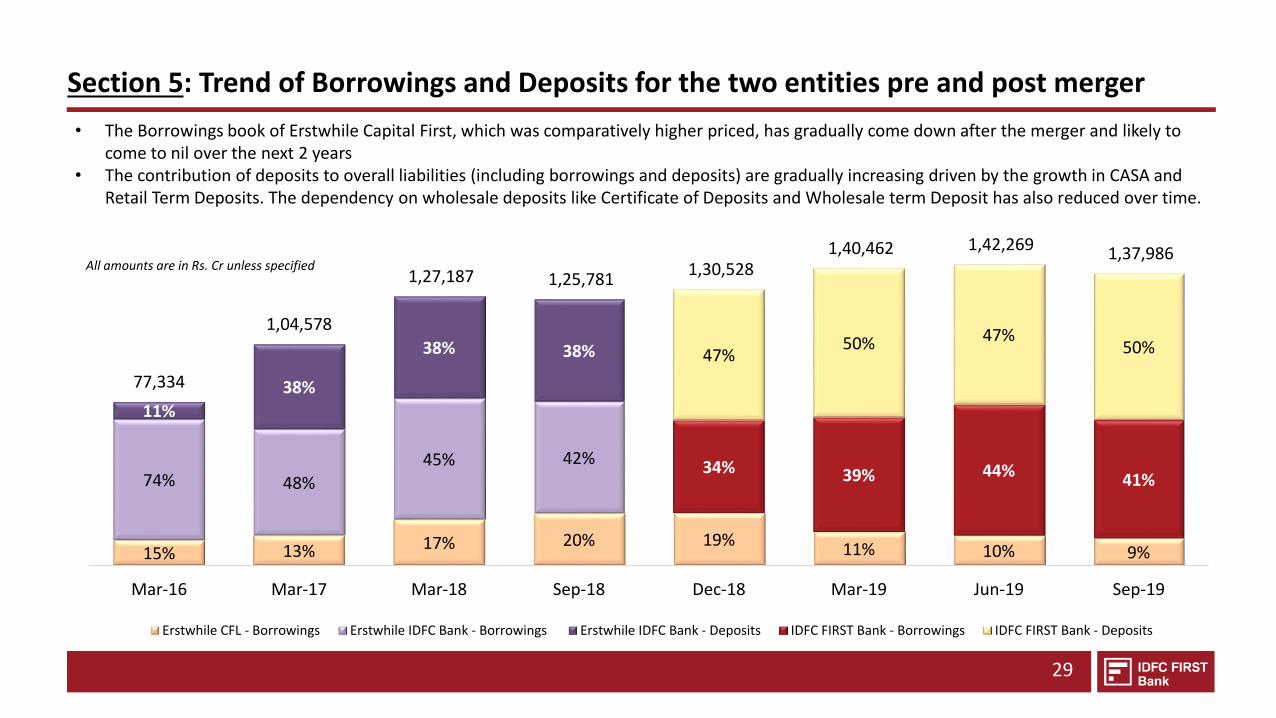
Section 5: Trend of Borrowings and Deposits for the two entities pre and post merger
29
15% 13% 17% 20% 19%11% 10% 9%
74% 48%
45% 42%
11%
38%
38% 38%
34% 39% 44% 41%
47%50% 47%
50%
77,334
1,04,578
1,27,187 1,25,781 1,30,528
1,40,462 1,42,269 1,37,986
Mar-16 Mar-17 Mar-18 Sep-18 Dec-18 Mar-19 Jun-19 Sep-19
Erstwhile CFL - Borrowings Erstwhile IDFC Bank - Borrowings Erstwhile IDFC Bank - Deposits IDFC FIRST Bank - Borrowings IDFC FIRST Bank - Deposits
All amounts are in Rs. Cr unless specified
• The Borrowings book of Erstwhile Capital First, which was comparatively higher priced, has gradually come down after the merger and likely to come to nil over the next 2 years
• The contribution of deposits to overall liabilities (including borrowings and deposits) are gradually increasing driven by the growth in CASA and Retail Term Deposits. The dependency on wholesale deposits like Certificate of Deposits and Wholesale term Deposit has also reduced over time.
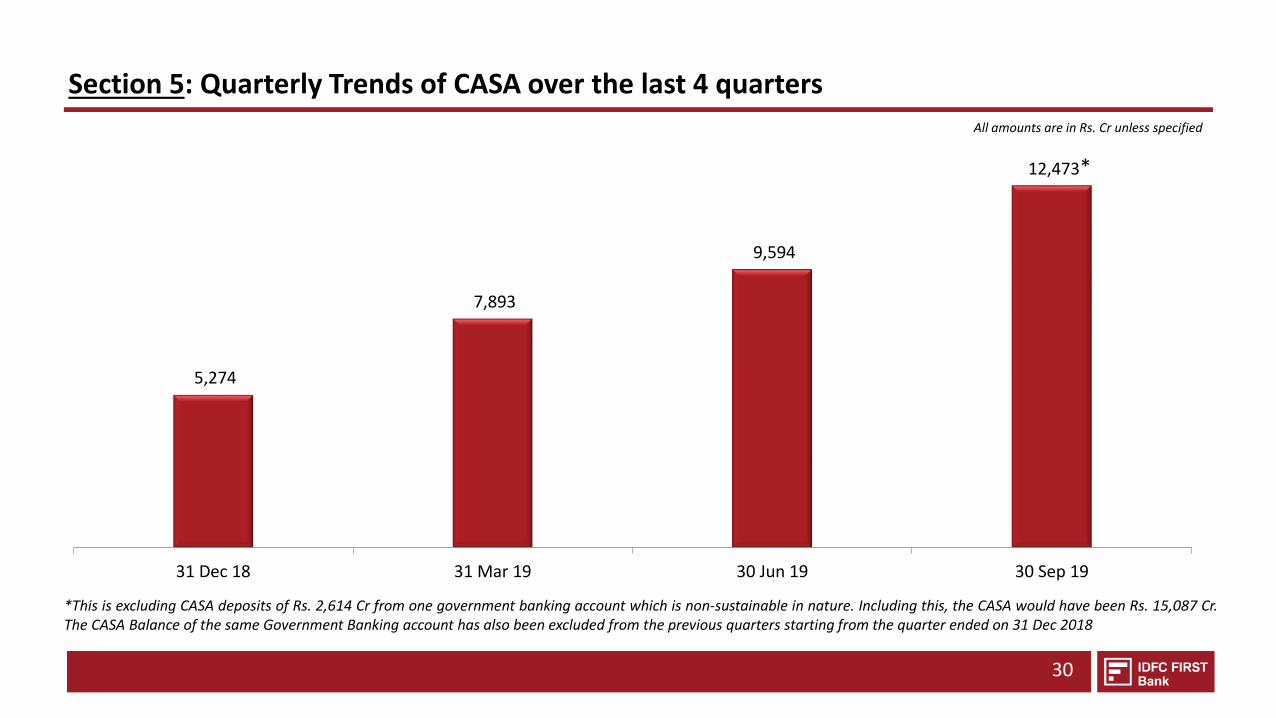
Section 5: Quarterly Trends of CASA over the last 4 quarters
30
*This is excluding CASA deposits of Rs. 2,614 Cr from one government banking account which is non-sustainable in nature. Including this, the CASA would have been Rs. 15,087 Cr.The CASA Balance of the same Government Banking account has also been excluded from the previous quarters starting from the quarter ended on 31 Dec 2018
5,274
7,893
9,594
12,473
31 Dec 18 31 Mar 19 30 Jun 19 30 Sep 19
All amounts are in Rs. Cr unless specified
*
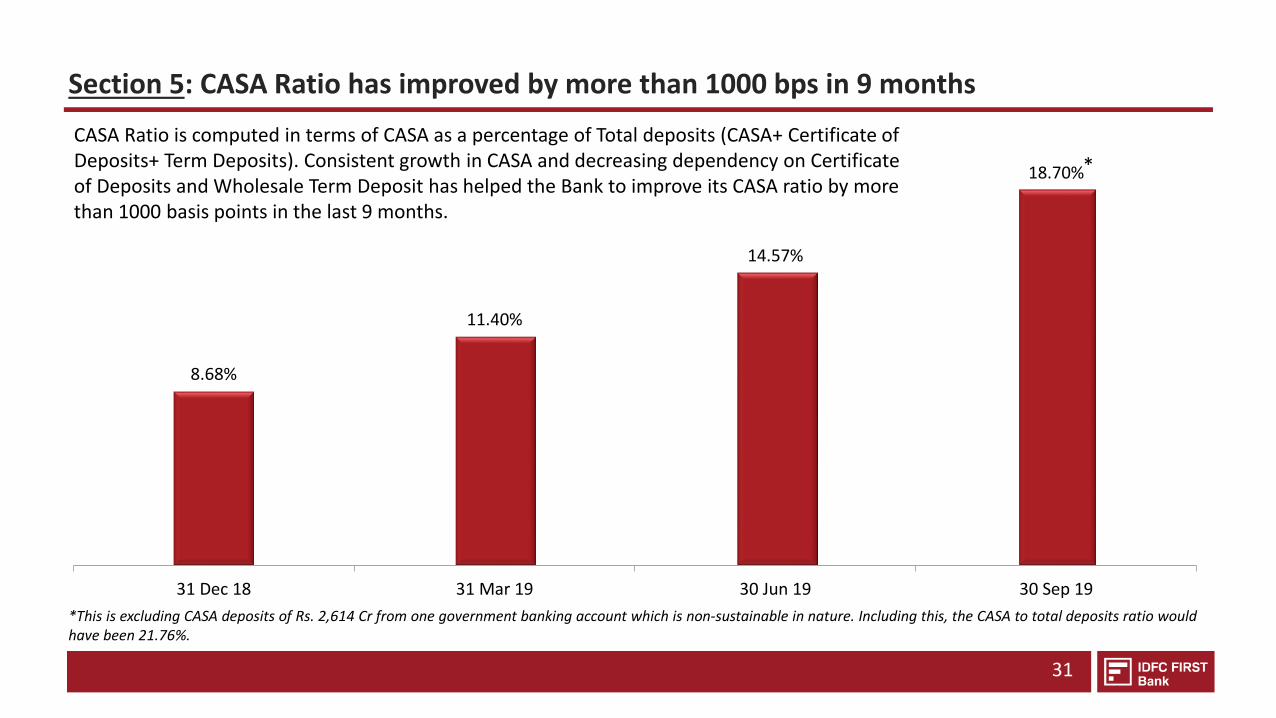
Section 5: CASA Ratio has improved by more than 1000 bps in 9 months
31
*This is excluding CASA deposits of Rs. 2,614 Cr from one government banking account which is non-sustainable in nature. Including this, the CASA to total deposits ratio wouldhave been 21.76%.
CASA Ratio is computed in terms of CASA as a percentage of Total deposits (CASA+ Certificate of Deposits+ Term Deposits). Consistent growth in CASA and decreasing dependency on Certificate of Deposits and Wholesale Term Deposit has helped the Bank to improve its CASA ratio by more than 1000 basis points in the last 9 months.
8.68%
11.40%
14.57%
18.70%
31 Dec 18 31 Mar 19 30 Jun 19 30 Sep 19
*
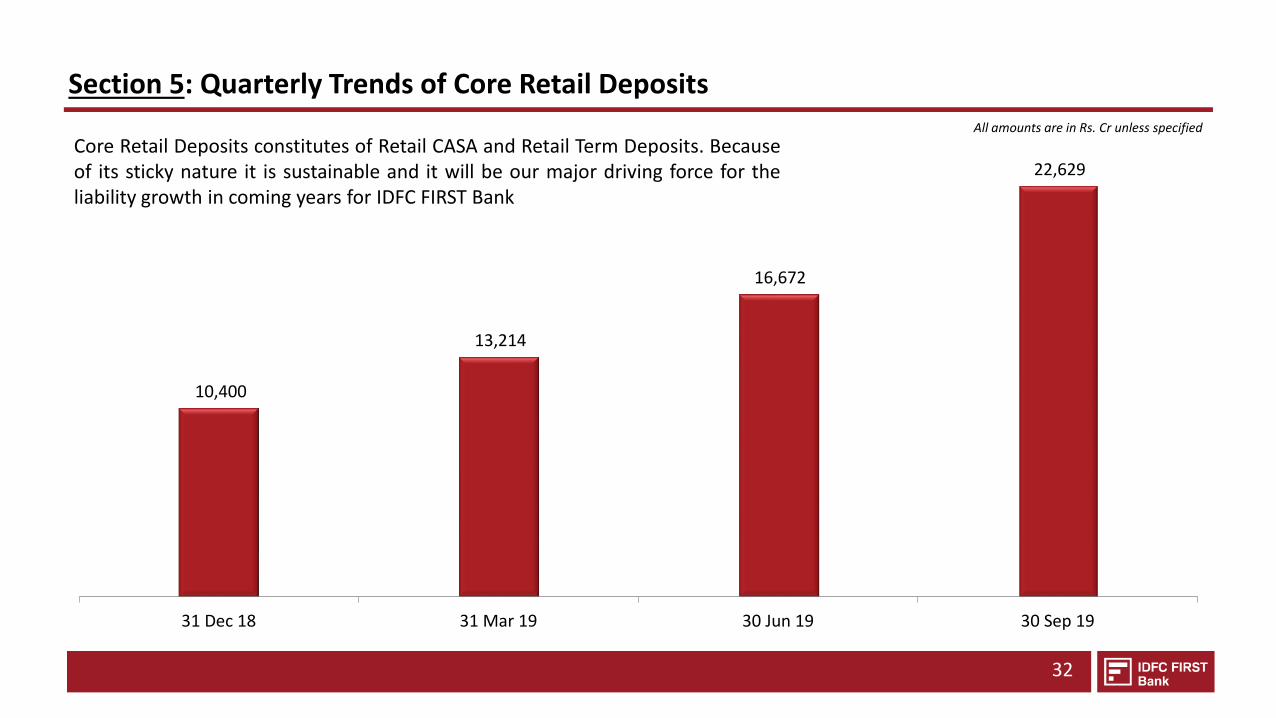
10,400
13,214
16,672
22,629
31 Dec 18 31 Mar 19 30 Jun 19 30 Sep 19
Section 5: Quarterly Trends of Core Retail Deposits
32
Core Retail Deposits constitutes of Retail CASA and Retail Term Deposits. Becauseof its sticky nature it is sustainable and it will be our major driving force for theliability growth in coming years for IDFC FIRST Bank
All amounts are in Rs. Cr unless specified
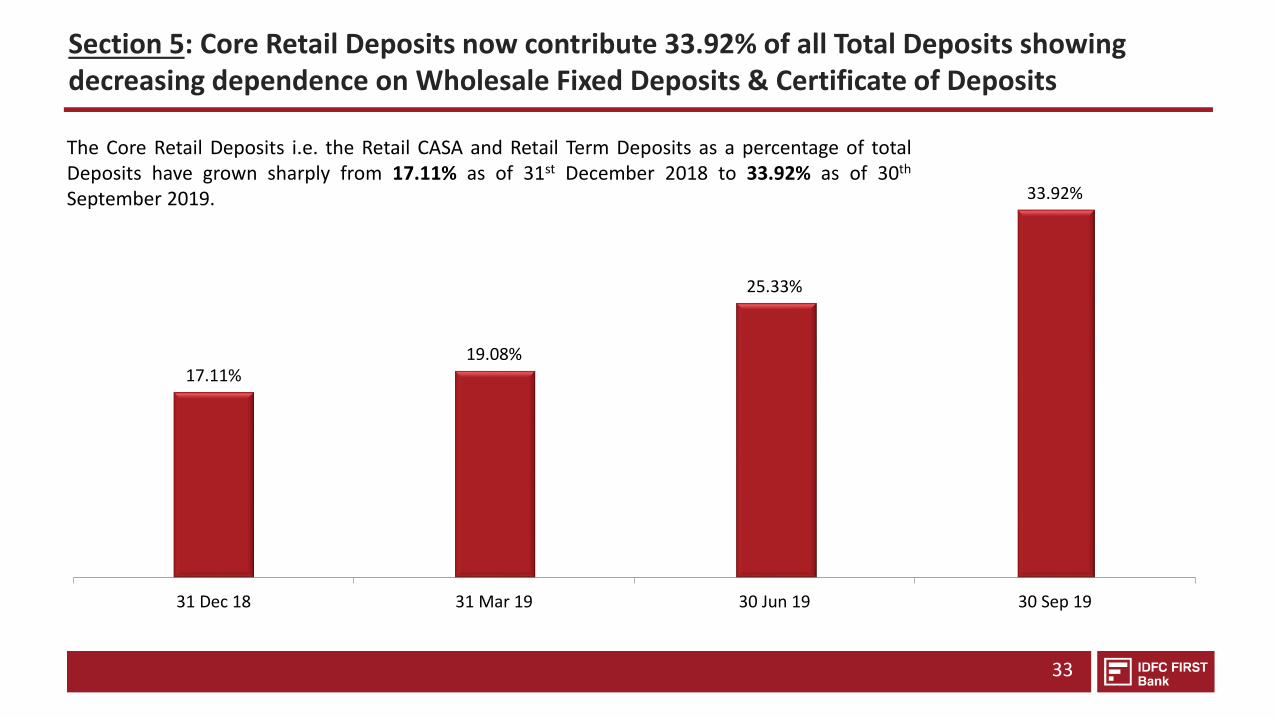
Section 5: Core Retail Deposits now contribute 33.92% of all Total Deposits showing decreasing dependence on Wholesale Fixed Deposits & Certificate of Deposits
33
The Core Retail Deposits i.e. the Retail CASA and Retail Term Deposits as a percentage of totalDeposits have grown sharply from 17.11% as of 31st December 2018 to 33.92% as of 30th
September 2019.
17.11%19.08%
25.33%
33.92%
31 Dec 18 31 Mar 19 30 Jun 19 30 Sep 19
8.04%
9.49%
11.75%
16.72%
31 Dec 18 31 Mar 19 30 Jun 19 30 Sep 19
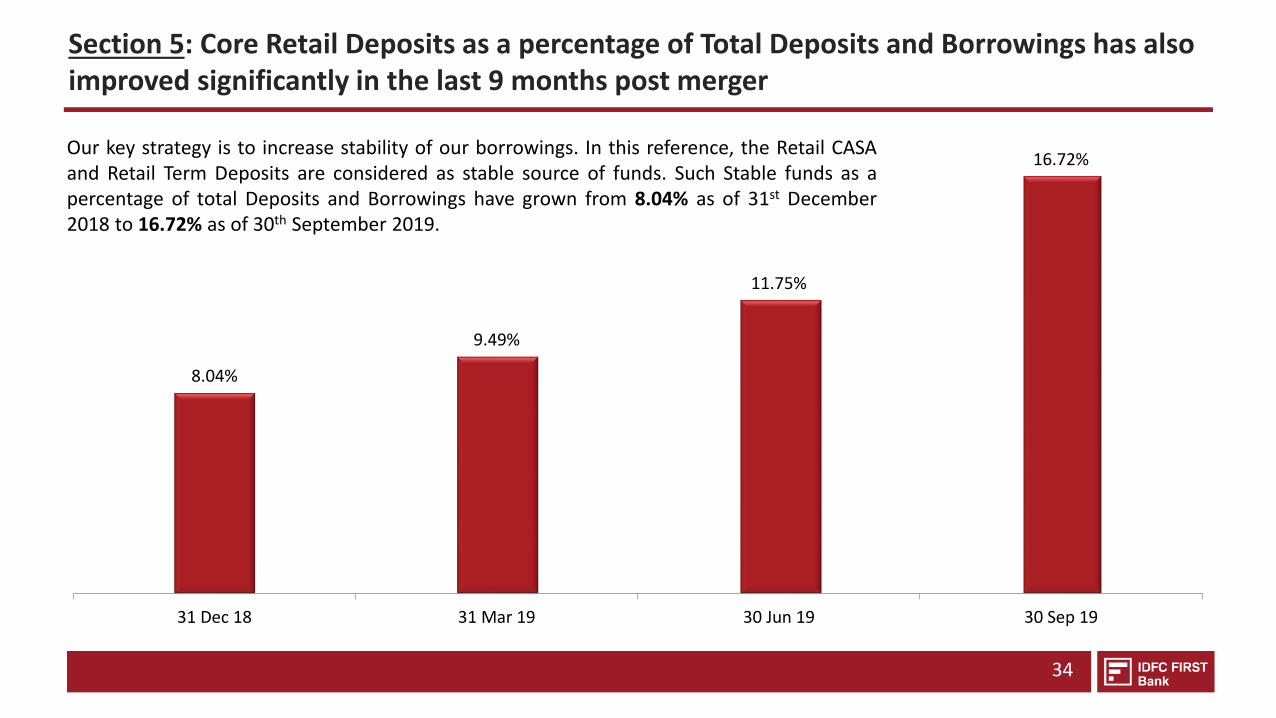
Section 5: Core Retail Deposits as a percentage of Total Deposits and Borrowings has also improved significantly in the last 9 months post merger
34
Our key strategy is to increase stability of our borrowings. In this reference, the Retail CASAand Retail Term Deposits are considered as stable source of funds. Such Stable funds as apercentage of total Deposits and Borrowings have grown from 8.04% as of 31st December2018 to 16.72% as of 30th September 2019.
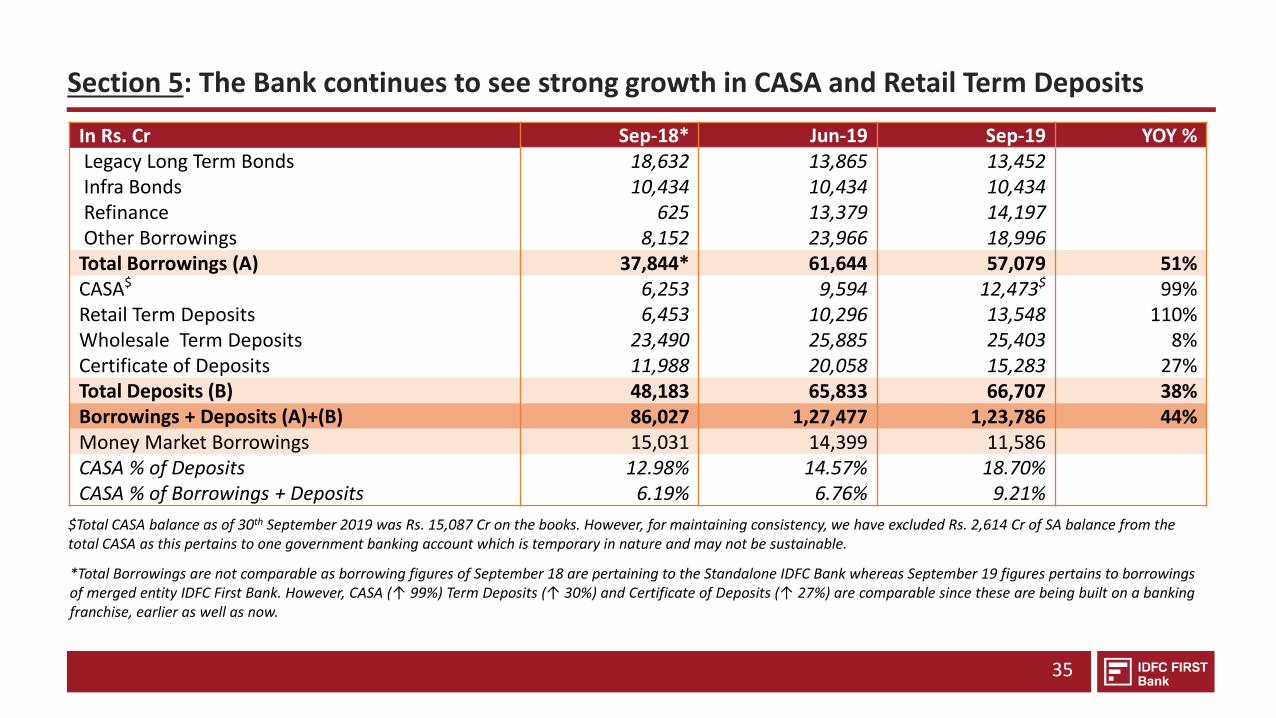
Section 5: The Bank continues to see strong growth in CASA and Retail Term Deposits
35
*Total Borrowings are not comparable as borrowing figures of September 18 are pertaining to the Standalone IDFC Bank whereas September 19 figures pertains to borrowingsof merged entity IDFC First Bank. However, CASA (↑ 99%) Term Deposits (↑ 30%) and Certificate of Deposits (↑ 27%) are comparable since these are being built on a bankingfranchise, earlier as well as now.
In Rs. Cr Sep-18* Jun-19 Sep-19 YOY %Legacy Long Term Bonds 18,632 13,865 13,452Infra Bonds 10,434 10,434 10,434Refinance 625 13,379 14,197Other Borrowings 8,152 23,966 18,996Total Borrowings (A) 37,844* 61,644 57,079 51%CASA$ 6,253 9,594 12,473$ 99%Retail Term Deposits 6,453 10,296 13,548 110%Wholesale Term Deposits 23,490 25,885 25,403 8%Certificate of Deposits 11,988 20,058 15,283 27%Total Deposits (B) 48,183 65,833 66,707 38%Borrowings + Deposits (A)+(B) 86,027 1,27,477 1,23,786 44%Money Market Borrowings 15,031 14,399 11,586CASA % of Deposits 12.98% 14.57% 18.70%CASA % of Borrowings + Deposits 6.19% 6.76% 9.21%
$Total CASA balance as of 30th September 2019 was Rs. 15,087 Cr on the books. However, for maintaining consistency, we have excluded Rs. 2,614 Cr of SA balance from the total CASA as this pertains to one government banking account which is temporary in nature and may not be sustainable.
SECTION 5: FINANCIAL PERFORMANCEOF THE BANK FOR Q2-FY20
• Snapshot of Key Parameters• Assets Update• Update on Liabilities• Key Business & Financial Parameters
Snapshot for the quarter Income Statement Balance Sheet
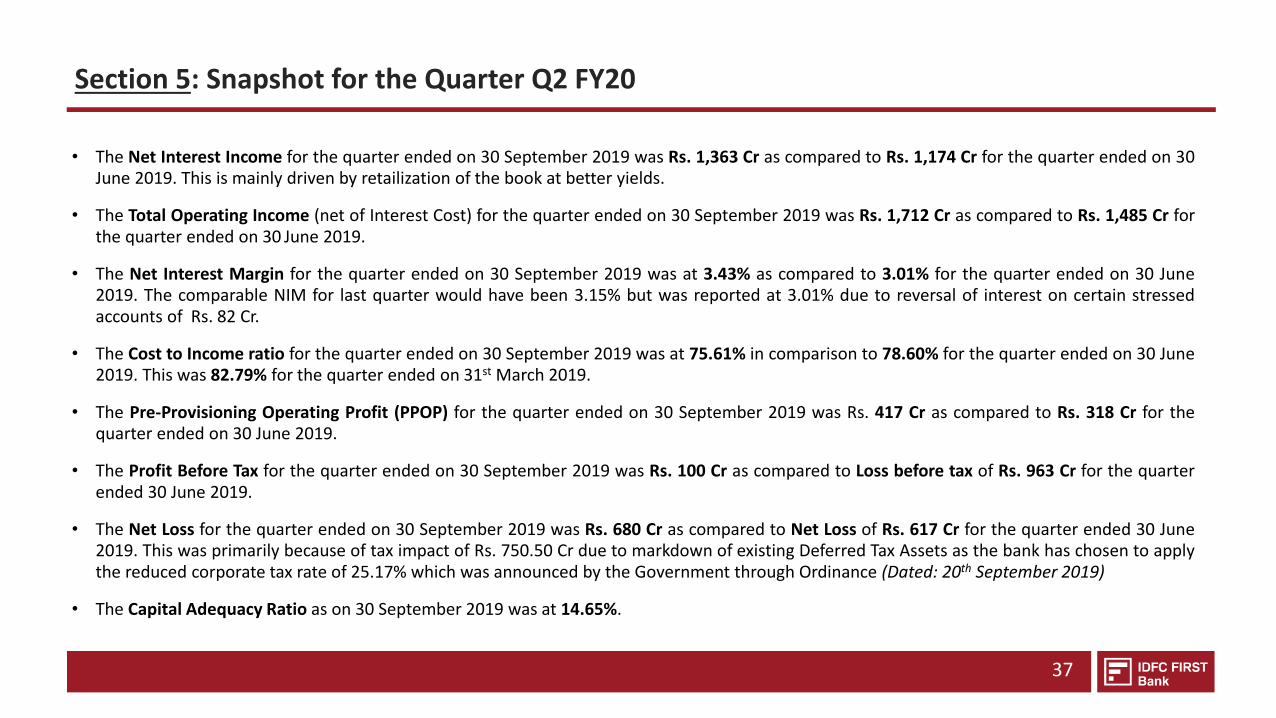
Section 5: Snapshot for the Quarter Q2 FY20
37
• The Net Interest Income for the quarter ended on 30 September 2019 was Rs. 1,363 Cr as compared to Rs. 1,174 Cr for the quarter ended on 30June 2019. This is mainly driven by retailization of the book at better yields.
• The Total Operating Income (net of Interest Cost) for the quarter ended on 30 September 2019 was Rs. 1,712 Cr as compared to Rs. 1,485 Cr forthe quarter ended on 30 June 2019.
• The Net Interest Margin for the quarter ended on 30 September 2019 was at 3.43% as compared to 3.01% for the quarter ended on 30 June2019. The comparable NIM for last quarter would have been 3.15% but was reported at 3.01% due to reversal of interest on certain stressedaccounts of Rs. 82 Cr.
• The Cost to Income ratio for the quarter ended on 30 September 2019 was at 75.61% in comparison to 78.60% for the quarter ended on 30 June2019. This was 82.79% for the quarter ended on 31st March 2019.
• The Pre-Provisioning Operating Profit (PPOP) for the quarter ended on 30 September 2019 was Rs. 417 Cr as compared to Rs. 318 Cr for thequarter ended on 30 June 2019.
• The Profit Before Tax for the quarter ended on 30 September 2019 was Rs. 100 Cr as compared to Loss before tax of Rs. 963 Cr for the quarterended 30 June 2019.
• The Net Loss for the quarter ended on 30 September 2019 was Rs. 680 Cr as compared to Net Loss of Rs. 617 Cr for the quarter ended 30 June2019. This was primarily because of tax impact of Rs. 750.50 Cr due to markdown of existing Deferred Tax Assets as the bank has chosen to applythe reduced corporate tax rate of 25.17% which was announced by the Government through Ordinance (Dated: 20th September 2019)
• The Capital Adequacy Ratio as on 30 September 2019 was at 14.65%.
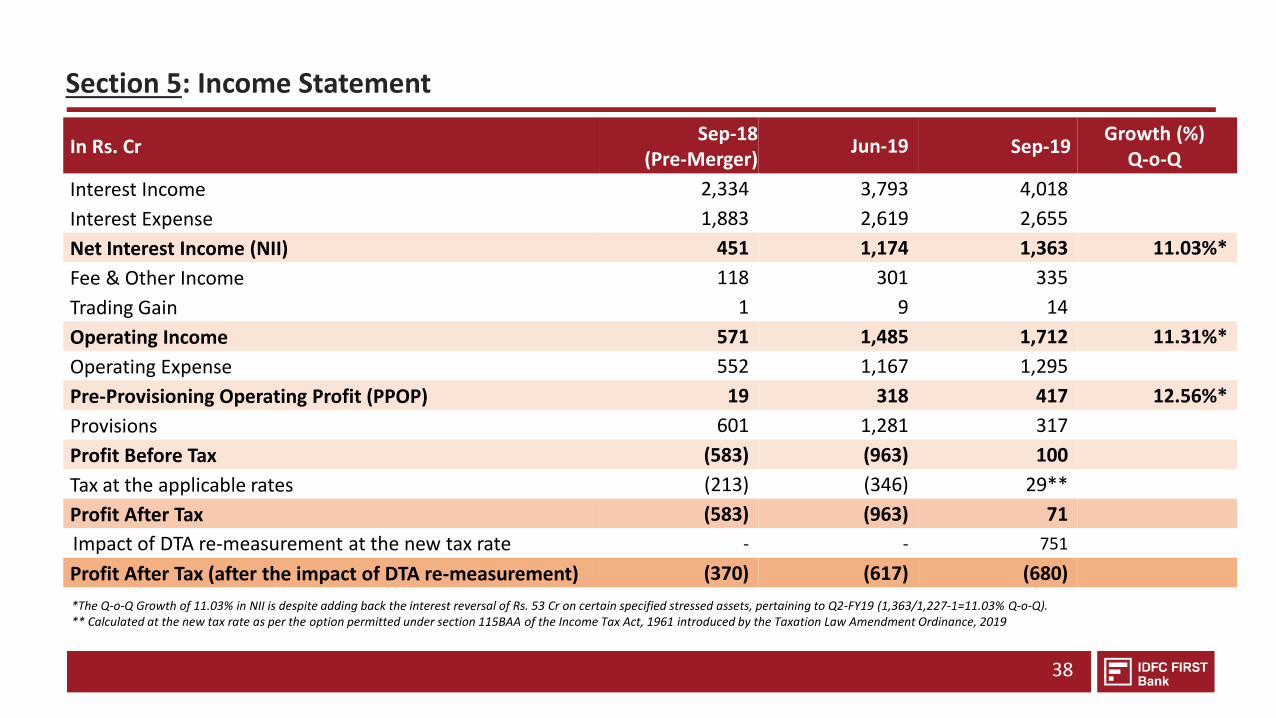
Section 5: Income Statement
38
In Rs. CrSep-18
(Pre-Merger)Jun-19 Sep-19
Growth (%)Q-o-Q
Interest Income 2,334 3,793 4,018
Interest Expense 1,883 2,619 2,655
Net Interest Income (NII) 451 1,174 1,363 11.03%*
Fee & Other Income 118 301 335
Trading Gain 1 9 14
Operating Income 571 1,485 1,712 11.31%*
Operating Expense 552 1,167 1,295
Pre-Provisioning Operating Profit (PPOP) 19 318 417 12.56%*
Provisions 601 1,281 317
Profit Before Tax (583) (963) 100
Tax at the applicable rates (213) (346) 29**
Profit After Tax (583) (963) 71
Impact of DTA re-measurement at the new tax rate - - 751
Profit After Tax (after the impact of DTA re-measurement) (370) (617) (680)
*The Q-o-Q Growth of 11.03% in NII is despite adding back the interest reversal of Rs. 53 Cr on certain specified stressed assets, pertaining to Q2-FY19 (1,363/1,227-1=11.03% Q-o-Q).** Calculated at the new tax rate as per the option permitted under section 115BAA of the Income Tax Act, 1961 introduced by the Taxation Law Amendment Ordinance, 2019
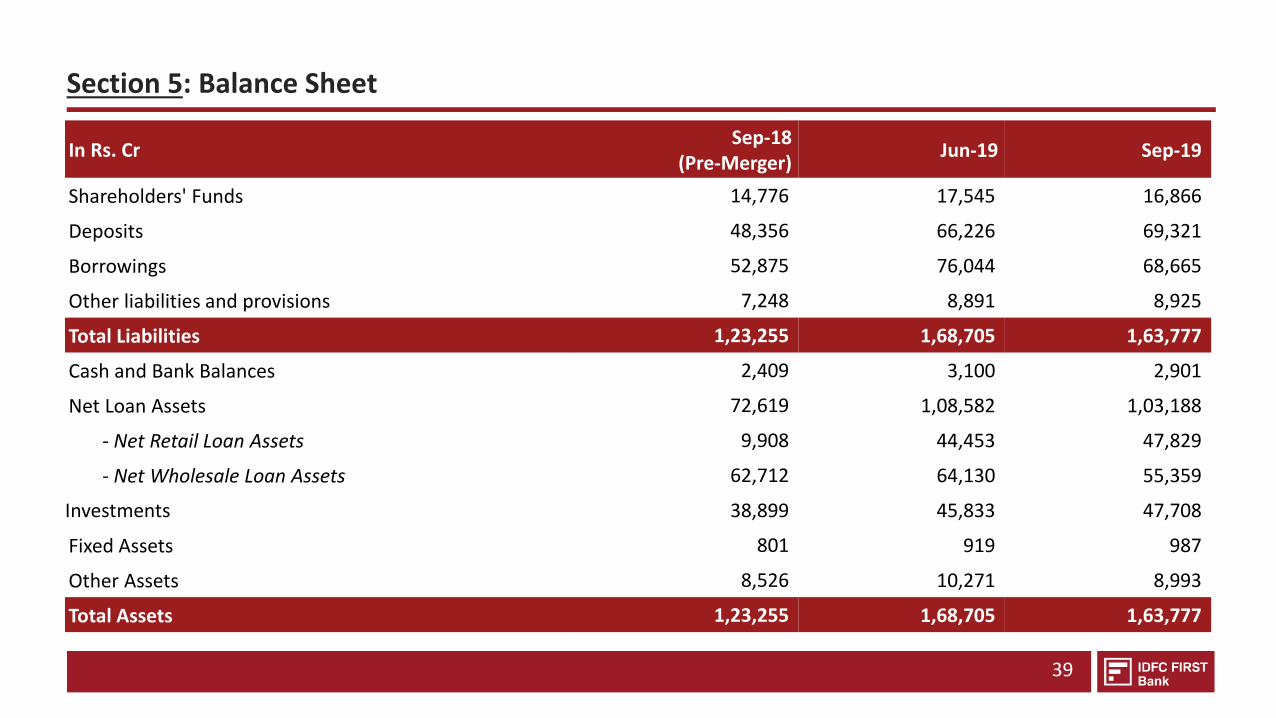
Section 5: Balance Sheet
39
In Rs. CrSep-18
(Pre-Merger) Jun-19 Sep-19
Shareholders' Funds 14,776 17,545 16,866
Deposits 48,356 66,226 69,321
Borrowings 52,875 76,044 68,665
Other liabilities and provisions 7,248 8,891 8,925
Total Liabilities 1,23,255 1,68,705 1,63,777
Cash and Bank Balances 2,409 3,100 2,901
Net Loan Assets 72,619 1,08,582 1,03,188
- Net Retail Loan Assets 9,908 44,453 47,829
- Net Wholesale Loan Assets 62,712 64,130 55,359
Investments 38,899 45,833 47,708
Fixed Assets 801 919 987
Other Assets 8,526 10,271 8,993
Total Assets 1,23,255 1,68,705 1,63,777
SECTION 3: MARKET OPPORTUNITY
SECTION 6: DIRECTORS & SHAREHOLDERS
SECTION 5: FINANCIAL PERFORMANCES
SECTION 4: PRODUCT OFFERING
SECTION 1: THE FOUNDING OF IDFC FIRST BANK
SECTION 2: VISION & MISSION OF IDFC FIRST BANK
SECTION 7: STRATEGY GOING FORWARD FOR THE COMBINED ENTITY
SECTION 8: CAPITAL FIRST STRATEGY, LOAN GROWTH AND PROFITABILITY TRENDS FOR 8 YEARS (BEFORE MERGER WITH IDFC BANK)
9
11
17
40
14
3
45
50
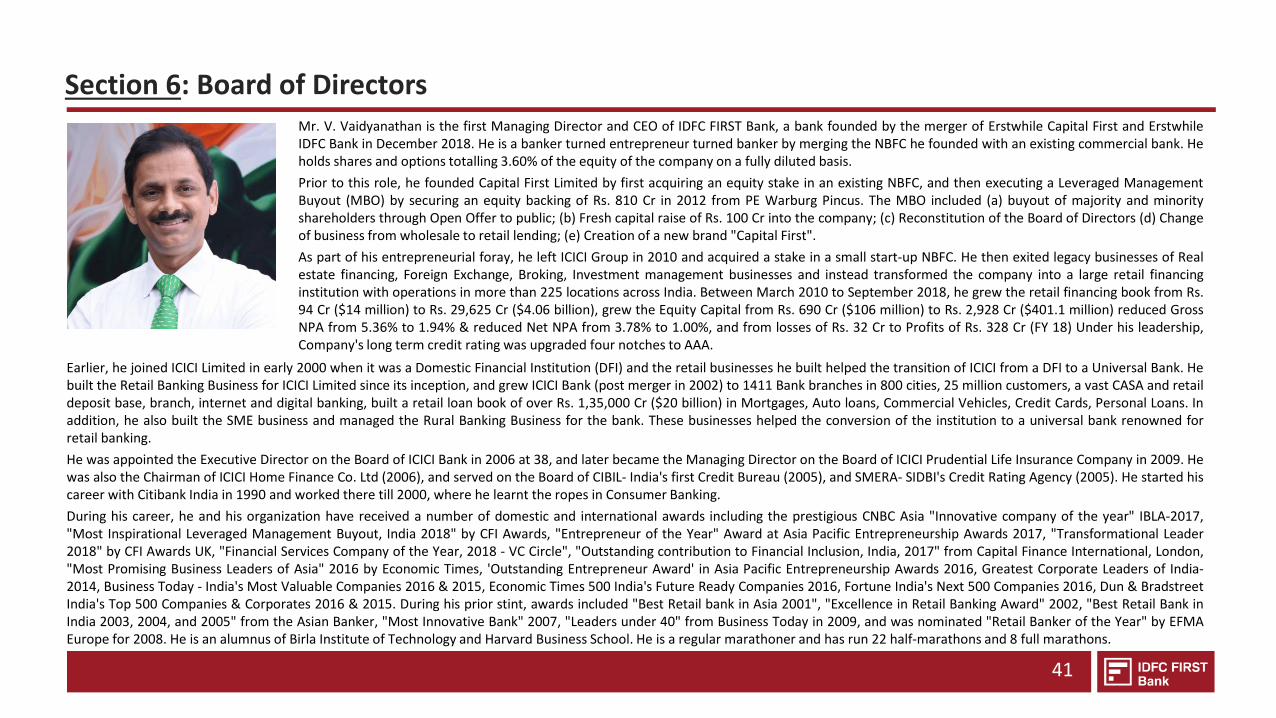
Section 6: Board of Directors
41
Mr. V. Vaidyanathan is the first Managing Director and CEO of IDFC FIRST Bank, a bank founded by the merger of Erstwhile Capital First and ErstwhileIDFC Bank in December 2018. He is a banker turned entrepreneur turned banker by merging the NBFC he founded with an existing commercial bank. Heholds shares and options totalling 3.60% of the equity of the company on a fully diluted basis.
Prior to this role, he founded Capital First Limited by first acquiring an equity stake in an existing NBFC, and then executing a Leveraged ManagementBuyout (MBO) by securing an equity backing of Rs. 810 Cr in 2012 from PE Warburg Pincus. The MBO included (a) buyout of majority and minorityshareholders through Open Offer to public; (b) Fresh capital raise of Rs. 100 Cr into the company; (c) Reconstitution of the Board of Directors (d) Changeof business from wholesale to retail lending; (e) Creation of a new brand "Capital First".
As part of his entrepreneurial foray, he left ICICI Group in 2010 and acquired a stake in a small start-up NBFC. He then exited legacy businesses of Realestate financing, Foreign Exchange, Broking, Investment management businesses and instead transformed the company into a large retail financinginstitution with operations in more than 225 locations across India. Between March 2010 to September 2018, he grew the retail financing book from Rs.94 Cr ($14 million) to Rs. 29,625 Cr ($4.06 billion), grew the Equity Capital from Rs. 690 Cr ($106 million) to Rs. 2,928 Cr ($401.1 million) reduced GrossNPA from 5.36% to 1.94% & reduced Net NPA from 3.78% to 1.00%, and from losses of Rs. 32 Cr to Profits of Rs. 328 Cr (FY 18) Under his leadership,Company's long term credit rating was upgraded four notches to AAA.
Earlier, he joined ICICI Limited in early 2000 when it was a Domestic Financial Institution (DFI) and the retail businesses he built helped the transition of ICICI from a DFI to a Universal Bank. Hebuilt the Retail Banking Business for ICICI Limited since its inception, and grew ICICI Bank (post merger in 2002) to 1411 Bank branches in 800 cities, 25 million customers, a vast CASA and retaildeposit base, branch, internet and digital banking, built a retail loan book of over Rs. 1,35,000 Cr ($20 billion) in Mortgages, Auto loans, Commercial Vehicles, Credit Cards, Personal Loans. Inaddition, he also built the SME business and managed the Rural Banking Business for the bank. These businesses helped the conversion of the institution to a universal bank renowned forretail banking.
He was appointed the Executive Director on the Board of ICICI Bank in 2006 at 38, and later became the Managing Director on the Board of ICICI Prudential Life Insurance Company in 2009. Hewas also the Chairman of ICICI Home Finance Co. Ltd (2006), and served on the Board of CIBIL- India's first Credit Bureau (2005), and SMERA- SIDBI's Credit Rating Agency (2005). He started hiscareer with Citibank India in 1990 and worked there till 2000, where he learnt the ropes in Consumer Banking.
During his career, he and his organization have received a number of domestic and international awards including the prestigious CNBC Asia "Innovative company of the year" IBLA-2017,"Most Inspirational Leveraged Management Buyout, India 2018" by CFI Awards, "Entrepreneur of the Year" Award at Asia Pacific Entrepreneurship Awards 2017, "Transformational Leader2018" by CFI Awards UK, "Financial Services Company of the Year, 2018 - VC Circle", "Outstanding contribution to Financial Inclusion, India, 2017" from Capital Finance International, London,"Most Promising Business Leaders of Asia" 2016 by Economic Times, 'Outstanding Entrepreneur Award' in Asia Pacific Entrepreneurship Awards 2016, Greatest Corporate Leaders of India-2014, Business Today - India's Most Valuable Companies 2016 & 2015, Economic Times 500 India's Future Ready Companies 2016, Fortune India's Next 500 Companies 2016, Dun & BradstreetIndia's Top 500 Companies & Corporates 2016 & 2015. During his prior stint, awards included "Best Retail bank in Asia 2001", "Excellence in Retail Banking Award" 2002, "Best Retail Bank inIndia 2003, 2004, and 2005" from the Asian Banker, "Most Innovative Bank" 2007, "Leaders under 40" from Business Today in 2009, and was nominated "Retail Banker of the Year" by EFMAEurope for 2008. He is an alumnus of Birla Institute of Technology and Harvard Business School. He is a regular marathoner and has run 22 half-marathons and 8 full marathons.
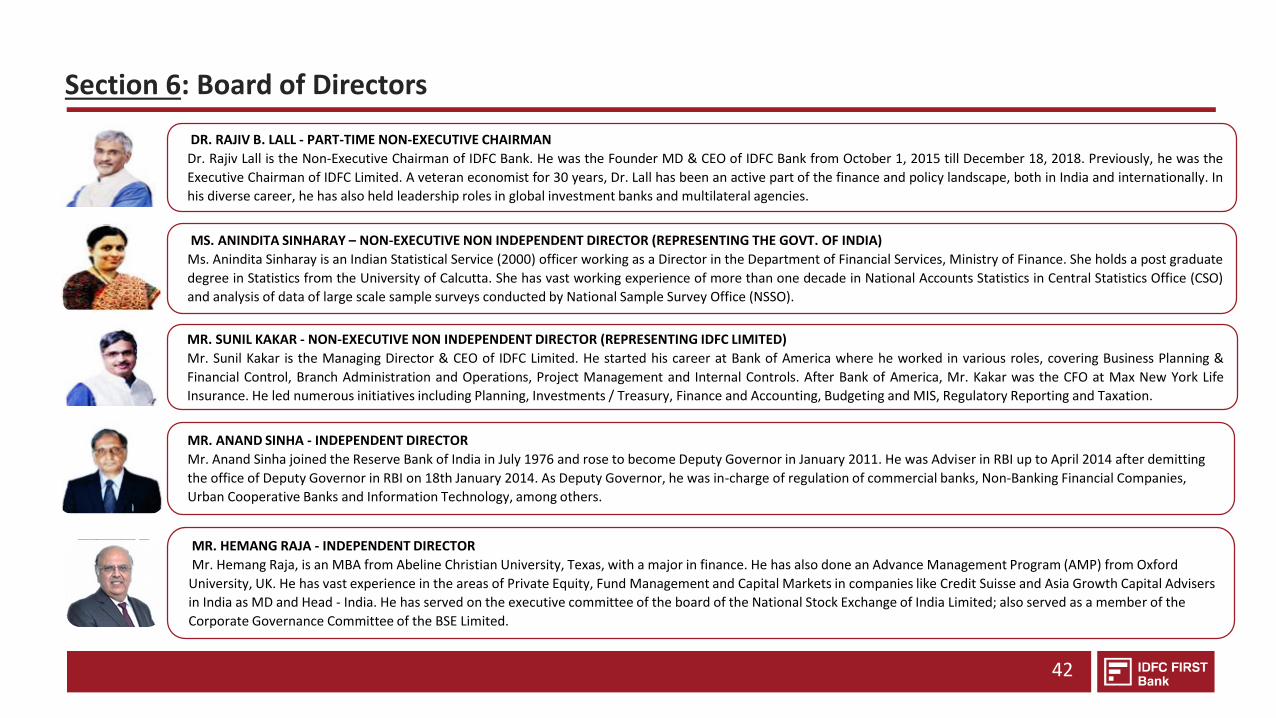
DR. RAJIV B. LALL - PART-TIME NON-EXECUTIVE CHAIRMAN
Dr. Rajiv Lall is the Non-Executive Chairman of IDFC Bank. He was the Founder MD & CEO of IDFC Bank from October 1, 2015 till December 18, 2018. Previously, he was the
Executive Chairman of IDFC Limited. A veteran economist for 30 years, Dr. Lall has been an active part of the finance and policy landscape, both in India and internationally. In
his diverse career, he has also held leadership roles in global investment banks and multilateral agencies.
Section 6: Board of Directors
MR. SUNIL KAKAR - NON-EXECUTIVE NON INDEPENDENT DIRECTOR (REPRESENTING IDFC LIMITED)
Mr. Sunil Kakar is the Managing Director & CEO of IDFC Limited. He started his career at Bank of America where he worked in various roles, covering Business Planning &
Financial Control, Branch Administration and Operations, Project Management and Internal Controls. After Bank of America, Mr. Kakar was the CFO at Max New York Life
Insurance. He led numerous initiatives including Planning, Investments / Treasury, Finance and Accounting, Budgeting and MIS, Regulatory Reporting and Taxation.
MS. ANINDITA SINHARAY – NON-EXECUTIVE NON INDEPENDENT DIRECTOR (REPRESENTING THE GOVT. OF INDIA)
Ms. Anindita Sinharay is an Indian Statistical Service (2000) officer working as a Director in the Department of Financial Services, Ministry of Finance. She holds a post graduate
degree in Statistics from the University of Calcutta. She has vast working experience of more than one decade in National Accounts Statistics in Central Statistics Office (CSO)
and analysis of data of large scale sample surveys conducted by National Sample Survey Office (NSSO).
42
MR. ANAND SINHA - INDEPENDENT DIRECTOR
Mr. Anand Sinha joined the Reserve Bank of India in July 1976 and rose to become Deputy Governor in January 2011. He was Adviser in RBI up to April 2014 after demitting
the office of Deputy Governor in RBI on 18th January 2014. As Deputy Governor, he was in-charge of regulation of commercial banks, Non-Banking Financial Companies,
Urban Cooperative Banks and Information Technology, among others.
MR. HEMANG RAJA - INDEPENDENT DIRECTOR
Mr. Hemang Raja, is an MBA from Abeline Christian University, Texas, with a major in finance. He has also done an Advance Management Program (AMP) from Oxford
University, UK. He has vast experience in the areas of Private Equity, Fund Management and Capital Markets in companies like Credit Suisse and Asia Growth Capital Advisers
in India as MD and Head - India. He has served on the executive committee of the board of the National Stock Exchange of India Limited; also served as a member of the
Corporate Governance Committee of the BSE Limited.
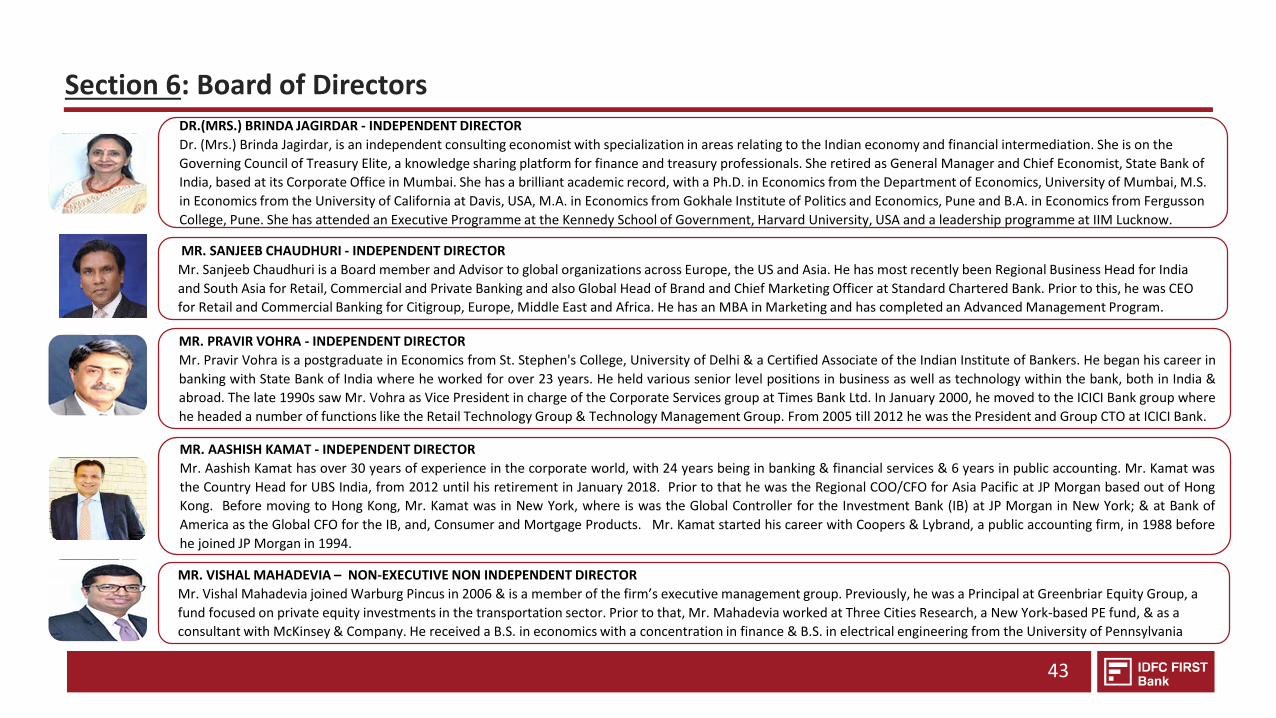
MR. SANJEEB CHAUDHURI - INDEPENDENT DIRECTOR
Mr. Sanjeeb Chaudhuri is a Board member and Advisor to global organizations across Europe, the US and Asia. He has most recently been Regional Business Head for India
and South Asia for Retail, Commercial and Private Banking and also Global Head of Brand and Chief Marketing Officer at Standard Chartered Bank. Prior to this, he was CEO
for Retail and Commercial Banking for Citigroup, Europe, Middle East and Africa. He has an MBA in Marketing and has completed an Advanced Management Program.
Section 6: Board of Directors
43
DR.(MRS.) BRINDA JAGIRDAR - INDEPENDENT DIRECTOR
Dr. (Mrs.) Brinda Jagirdar, is an independent consulting economist with specialization in areas relating to the Indian economy and financial intermediation. She is on the
Governing Council of Treasury Elite, a knowledge sharing platform for finance and treasury professionals. She retired as General Manager and Chief Economist, State Bank of
India, based at its Corporate Office in Mumbai. She has a brilliant academic record, with a Ph.D. in Economics from the Department of Economics, University of Mumbai, M.S.
in Economics from the University of California at Davis, USA, M.A. in Economics from Gokhale Institute of Politics and Economics, Pune and B.A. in Economics from Fergusson
College, Pune. She has attended an Executive Programme at the Kennedy School of Government, Harvard University, USA and a leadership programme at IIM Lucknow.
MR. PRAVIR VOHRA - INDEPENDENT DIRECTOR
Mr. Pravir Vohra is a postgraduate in Economics from St. Stephen's College, University of Delhi & a Certified Associate of the Indian Institute of Bankers. He began his career in
banking with State Bank of India where he worked for over 23 years. He held various senior level positions in business as well as technology within the bank, both in India &
abroad. The late 1990s saw Mr. Vohra as Vice President in charge of the Corporate Services group at Times Bank Ltd. In January 2000, he moved to the ICICI Bank group where
he headed a number of functions like the Retail Technology Group & Technology Management Group. From 2005 till 2012 he was the President and Group CTO at ICICI Bank.
MR. AASHISH KAMAT - INDEPENDENT DIRECTOR
Mr. Aashish Kamat has over 30 years of experience in the corporate world, with 24 years being in banking & financial services & 6 years in public accounting. Mr. Kamat was
the Country Head for UBS India, from 2012 until his retirement in January 2018. Prior to that he was the Regional COO/CFO for Asia Pacific at JP Morgan based out of Hong
Kong. Before moving to Hong Kong, Mr. Kamat was in New York, where is was the Global Controller for the Investment Bank (IB) at JP Morgan in New York; & at Bank of
America as the Global CFO for the IB, and, Consumer and Mortgage Products. Mr. Kamat started his career with Coopers & Lybrand, a public accounting firm, in 1988 before
he joined JP Morgan in 1994.
MR. VISHAL MAHADEVIA – NON-EXECUTIVE NON INDEPENDENT DIRECTOR
Mr. Vishal Mahadevia joined Warburg Pincus in 2006 & is a member of the firm’s executive management group. Previously, he was a Principal at Greenbriar Equity Group, a
fund focused on private equity investments in the transportation sector. Prior to that, Mr. Mahadevia worked at Three Cities Research, a New York-based PE fund, & as a
consultant with McKinsey & Company. He received a B.S. in economics with a concentration in finance & B.S. in electrical engineering from the University of Pennsylvania
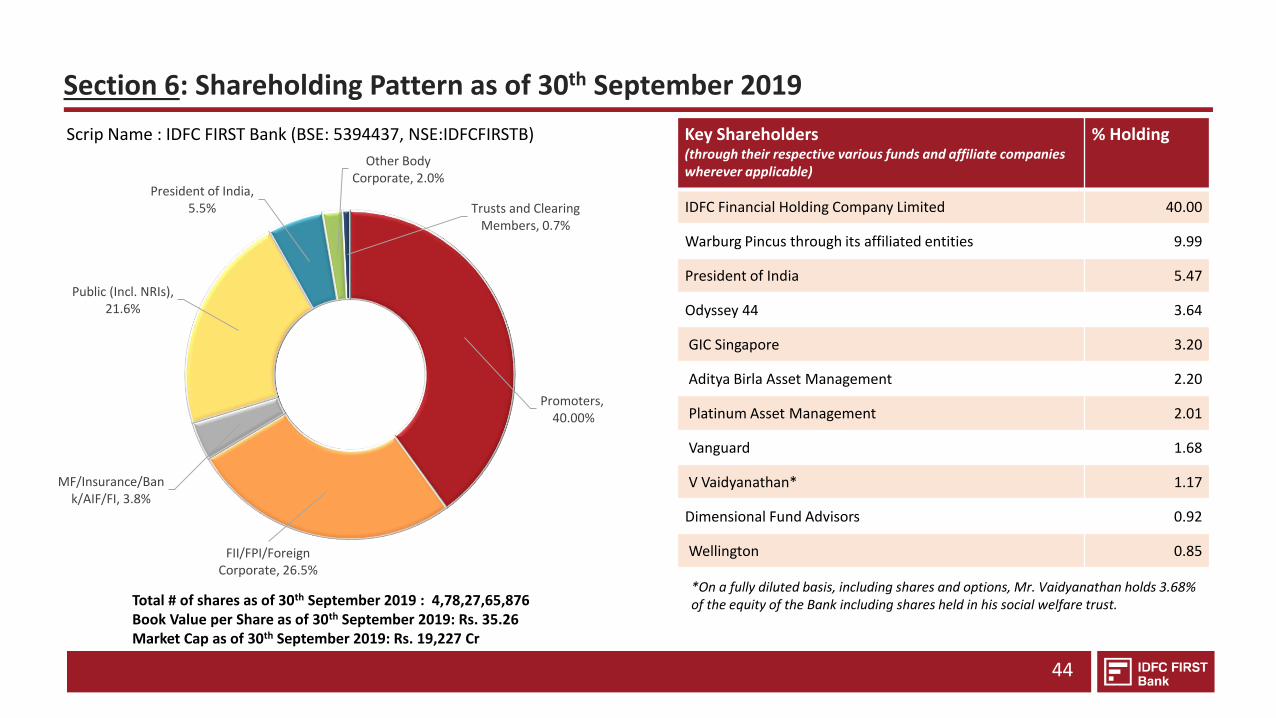
Section 6: Shareholding Pattern as of 30th September 2019
Scrip Name : IDFC FIRST Bank (BSE: 5394437, NSE:IDFCFIRSTB)
44
*On a fully diluted basis, including shares and options, Mr. Vaidyanathan holds 3.68% of the equity of the Bank including shares held in his social welfare trust.
Key Shareholders(through their respective various funds and affiliate companies wherever applicable)
% Holding
IDFC Financial Holding Company Limited 40.00
Warburg Pincus through its affiliated entities 9.99
President of India 5.47
Odyssey 44 3.64
GIC Singapore 3.20
Aditya Birla Asset Management 2.20
Platinum Asset Management 2.01
Vanguard 1.68
V Vaidyanathan* 1.17
Dimensional Fund Advisors 0.92
Wellington 0.85
Promoters,40.00%
FII/FPI/Foreign Corporate, 26.5%
MF/Insurance/Bank/AIF/FI, 3.8%
Public (Incl. NRIs), 21.6%
President of India, 5.5%
Other Body Corporate, 2.0%
Trusts and Clearing Members, 0.7%
Total # of shares as of 30th September 2019 : 4,78,27,65,876 Book Value per Share as of 30th September 2019: Rs. 35.26Market Cap as of 30th September 2019: Rs. 19,227 Cr
SECTION 3: MARKET OPPORTUNITY
SECTION 6: DIRECTORS & SHAREHOLDERS
SECTION 5: FINANCIAL PERFORMANCES
SECTION 4: PRODUCT OFFERING
SECTION 1: THE FOUNDING OF IDFC FIRST BANK
SECTION 2: VISION & MISSION OF IDFC FIRST BANK
SECTION 7: STRATEGY GOING FORWARD FOR THE COMBINED ENTITY
SECTION 8: CAPITAL FIRST STRATEGY, LOAN GROWTH AND PROFITABILITY TRENDS FOR 8 YEARS (BEFORE MERGER WITH IDFC BANK)
9
11
17
40
14
3
45
50
SECTION 7:STRATEGY GOING FORWARD FOR
THE COMBINED ENTITY
• Key Strategies for the combine entity –
Asset Strategy• Growth of Assets• Diversification of Assets• Gross Yield expansion
Liability Strategy• CASA Growth• Diversification of Liability• Branch Expansion
Profitability• Expand Net Interest Margin• Reduce Cost to Income Ratio• Improve RoA and RoE
Section 7: Asset Strategy for IDFC FIRST Bank as guided at the time of merger in December 2018.
• Growth of Assets:
• The Bank plans to grow retail loan assets from Rs. 36,236 Cr (December 31, 2018) to over Rs. 100,000 Cr in the next 5 years
• The Bank plans to wind down loans to infrastructure to NIL within five years ( Rs. 22,710 as of 31 December 2018).
• The Bank plans to reduce the total Wholesale loan assets (including the Infrastructure Loans) from Rs. 56,809 Cr (December 31, 2018) to Rs. 40,000 Cr by March 2020 in order to rebalance and diversify the overall Loan Book. Thereafter, the Bank plans to maintain it at the similar levels for the next 5 years and would grow the business based on opportunities available at the marketplace.
• Diversification of Assets: We recognize that loan book of the bank needs to be well diversified across sectors and a large number of consumers. The Bank plans to increase the retail book composition from 34.62% to 70% within 5 years and set the target to take it to 80% thereon.
• Gross Yield Expansion: As a result of the growth of the retail loan (at a relatively higher yield compared to the wholesale loans), the gross yield of the Bank’s Loan Book was initially guided to increase from 9.4% (as per Q2-FY19, pre-merger) to more than 12% in the next 5 years, however we now upgrade our guidance and project the yield to be at 13.5% in the next 5 years. The bank will expand Housing loan portfolio as one of its important product lines.
47
Section 7: Liability Strategy for IDFC FIRST Bank as guided at the time of merger in December 2018.
• CASA Growth: This is a key focus and growth area for the bank. We plan to increase the CASA Ratio from 10.4% as of December 31, 2018 on a continuous basis year on year and strive to reach 30% CASA ratio within 5 years, and increase it to 40-50% from there on. An array of digital savings & current accounts are planned to be offered to the customer base (more than 7 million customers) of Erstwhile Capital First.
• Diversification of Liabilities: We will focus on Retail CASA and Retail Term Deposits in order to diversify the liabilities of the bank. As a percentage of the total borrowings, the Retail Term Deposits and Retail CASA is proposed to increase from 8.0% as of December 31, 2018, to over 50% in the next 5 years and set up a trajectory to reach 75% thereafter.
• Branch Expansion: In order to grow Retail Deposits and CASA, the bank plans to set up 600-700 more bank branches in the next 5 years from the branch count of 206 (as of 31 Dec 2018). This would be suitably supported by the attractive product propositions and other associated services as well as cross selling opportunities.
`
48
Section 7: Profitability
• Net Interest Margin: The bank plans to expand the NIM to about 5.0% - 5.5% in the next 5 years based on better cost of funds and carefully selecting the product segments where we have strong proven capabilities over the years.
• Asset Quality: Over 90% of the Retail Loan Book of the bank constitutes of loan book brought from erstwhile Capital First. The book is seasoned over 8 years across business and loan cycles and has had stable performance throughout, and has been adequately stress tested across significant events such as high interest rate cycle (2010-2014), high inflation rate cycle (2010-2014), Demonetization (2016, where over 86% of the cash of the country was withdrawn overnight), GST implementation (2017, which changed the business environment and methods for MSMEs) and yet asset quality remained high over the period.
• Cost to Income: The Bank plans to improve Cost to Income ratio to ~50-55% over the next 5 years, down from ~80% (post merger results, Quarter ended December 31, 2018)
• ROA and ROE: With the improvement in the NIM and cost to income ratio, the bank aims to reach the following benchmarks in the next 5-6 years.
• ROA of 1.4%-1.6%
• ROE of 13%-15%
49
SECTION 3: MARKET OPPORTUNITY
SECTION 6: DIRECTORS & SHAREHOLDERS
SECTION 5: FINANCIAL PERFORMANCES
SECTION 4: PRODUCT OFFERING
SECTION 1: THE FOUNDING OF IDFC FIRST BANK
SECTION 2: VISION & MISSION OF IDFC FIRST BANK
SECTION 7: STRATEGY GOING FORWARD FOR THE COMBINED ENTITY
SECTION 8: CAPITAL FIRST STRATEGY, LOAN GROWTH AND PROFITABILITY TRENDS FOR 8 YEARS (BEFORE MERGER WITH IDFC BANK)
9
11
17
40
14
3
45
50
SECTION 8:CAPITAL FIRST STRATEGY, LOAN GROWTH AND PROFITABILITY TRENDS FOR 8 YEARS
(BEFORE MERGER WITH IDFC BANK)
• History of Capital First Limited
• Transformation into Retail Franchise
• Business Areas of Focus
• Past Financial Performances
Section 8: Successful Trajectory of Growth and Profits at Capital First
52
Since the business model of Capital First is an important part of thebusiness to be built in the merged bank, we present to you the businessmodel, business lines, business and profitability trajectory, and financialtrends of Capital First Limited. The following slides are essentially anextract of the last official investor presentation of Capital First just priorto the merger (Period ending September 30 2018) and are meant to givethe reader a picture of what the merged bank could look like in the yearsto come.
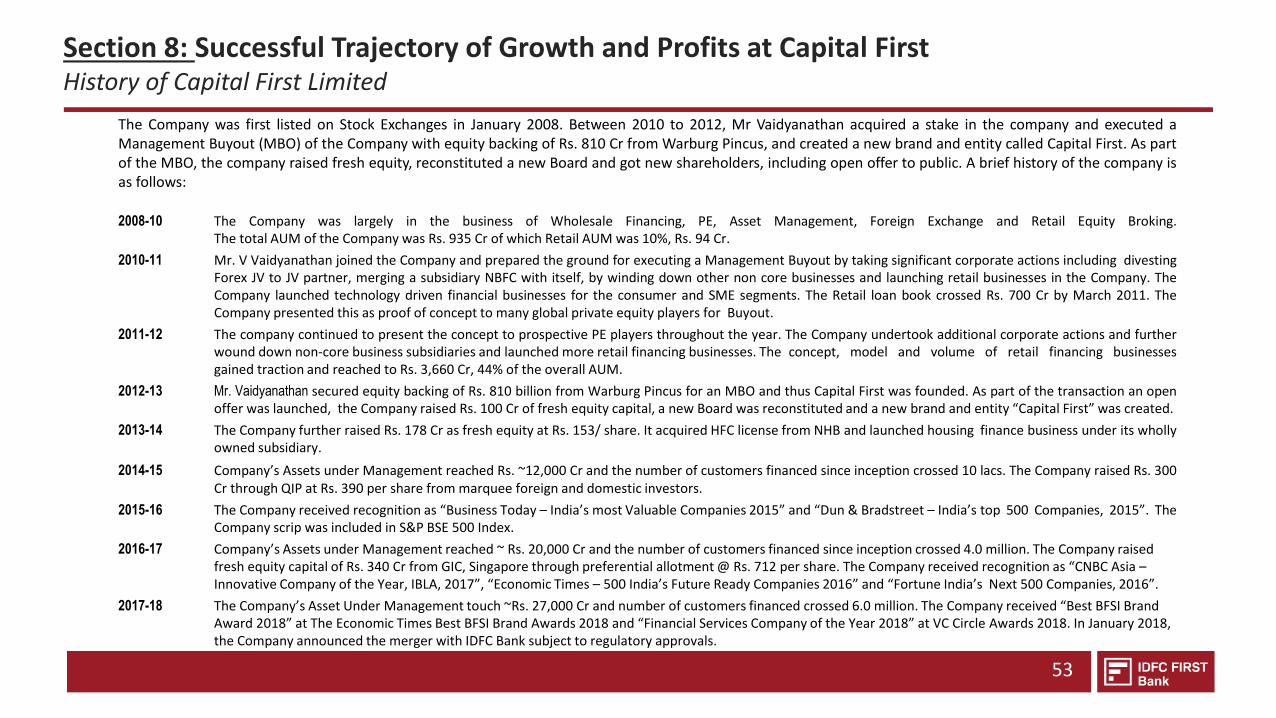
Section 8: Successful Trajectory of Growth and Profits at Capital FirstHistory of Capital First Limited
53
The Company was first listed on Stock Exchanges in January 2008. Between 2010 to 2012, Mr Vaidyanathan acquired a stake in the company and executed aManagement Buyout (MBO) of the Company with equity backing of Rs. 810 Cr from Warburg Pincus, and created a new brand and entity called Capital First. As partof the MBO, the company raised fresh equity, reconstituted a new Board and got new shareholders, including open offer to public. A brief history of the company isas follows:
2008-10 The Company was largely in the business of Wholesale Financing, PE, Asset Management, Foreign Exchange and Retail Equity Broking.The total AUM of the Company was Rs. 935 Cr of which Retail AUM was 10%, Rs. 94 Cr.
2010-11 Mr. V Vaidyanathan joined the Company and prepared the ground for executing a Management Buyout by taking significant corporate actions including divestingForex JV to JV partner, merging a subsidiary NBFC with itself, by winding down other non core businesses and launching retail businesses in the Company. TheCompany launched technology driven financial businesses for the consumer and SME segments. The Retail loan book crossed Rs. 700 Cr by March 2011. TheCompany presented this as proof of concept to many global private equity players for Buyout.
2011-12 The company continued to present the concept to prospective PE players throughout the year. The Company undertook additional corporate actions and furtherwound down non-core business subsidiaries and launched more retail financing businesses. The concept, model and volume of retail financing businessesgained traction and reached to Rs. 3,660 Cr, 44% of the overall AUM.
2012-13 Mr. Vaidyanathan secured equity backing of Rs. 810 billion from Warburg Pincus for an MBO and thus Capital First was founded. As part of the transaction an openoffer was launched, the Company raised Rs. 100 Cr of fresh equity capital, a new Board was reconstituted and a new brand and entity “Capital First” was created.
2013-14 The Company further raised Rs. 178 Cr as fresh equity at Rs. 153/ share. It acquired HFC license from NHB and launched housing finance business under its whollyowned subsidiary.
2014-15 Company’s Assets under Management reached Rs. ~12,000 Cr and the number of customers financed since inception crossed 10 lacs. The Company raised Rs. 300Cr through QIP at Rs. 390 per share from marquee foreign and domestic investors.
2015-16 The Company received recognition as “Business Today – India’s most Valuable Companies 2015” and “Dun & Bradstreet – India’s top 500 Companies, 2015”. TheCompany scrip was included in S&P BSE 500 Index.
2016-17 Company’s Assets under Management reached ~ Rs. 20,000 Cr and the number of customers financed since inception crossed 4.0 million. The Company raised fresh equity capital of Rs. 340 Cr from GIC, Singapore through preferential allotment @ Rs. 712 per share. The Company received recognition as “CNBC Asia –Innovative Company of the Year, IBLA, 2017”, “Economic Times – 500 India’s Future Ready Companies 2016” and “Fortune India’s Next 500 Companies, 2016”.
2017-18 The Company’s Asset Under Management touch ~Rs. 27,000 Cr and number of customers financed crossed 6.0 million. The Company received “Best BFSI Brand Award 2018” at The Economic Times Best BFSI Brand Awards 2018 and “Financial Services Company of the Year 2018” at VC Circle Awards 2018. In January 2018, the Company announced the merger with IDFC Bank subject to regulatory approvals.
54
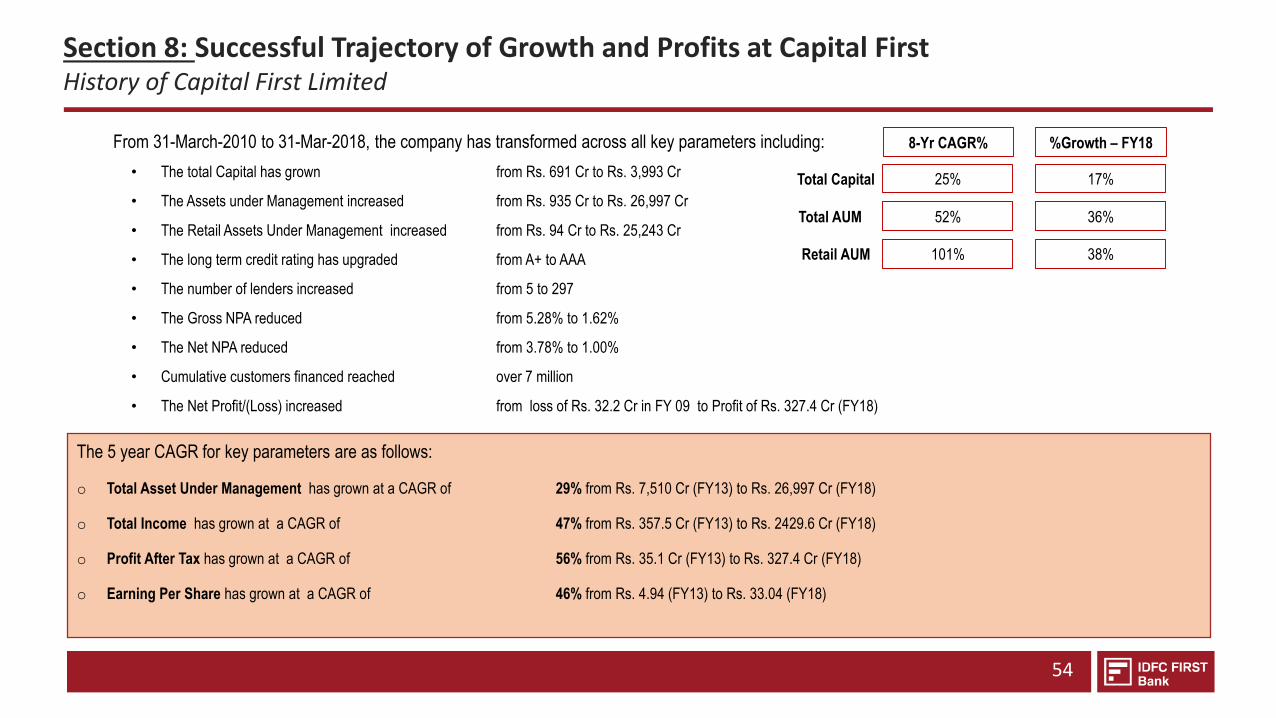
From 31-March-2010 to 31-Mar-2018, the company has transformed across all key parameters including:
• The total Capital has grown from Rs. 691 Cr to Rs. 3,993 Cr
• The Assets under Management increased from Rs. 935 Cr to Rs. 26,997 Cr
• The Retail Assets Under Management increased from Rs. 94 Cr to Rs. 25,243 Cr
• The long term credit rating has upgraded from A+ to AAA
• The number of lenders increased from 5 to 297
• The Gross NPA reduced from 5.28% to 1.62%
• The Net NPA reduced from 3.78% to 1.00%
• Cumulative customers financed reached over 7 million
• The Net Profit/(Loss) increased from loss of Rs. 32.2 Cr in FY 09 to Profit of Rs. 327.4 Cr (FY18)
The 5 year CAGR for key parameters are as follows:
o Total Asset Under Management has grown at a CAGR of 29% from Rs. 7,510 Cr (FY13) to Rs. 26,997 Cr (FY18)
o Total Income has grown at a CAGR of 47% from Rs. 357.5 Cr (FY13) to Rs. 2429.6 Cr (FY18)
o Profit After Tax has grown at a CAGR of 56% from Rs. 35.1 Cr (FY13) to Rs. 327.4 Cr (FY18)
o Earning Per Share has grown at a CAGR of 46% from Rs. 4.94 (FY13) to Rs. 33.04 (FY18)
8-Yr CAGR% %Growth – FY18
25% 17%
52% 36%
101% 38%
Total Capital
Total AUM
Retail AUM
Section 8: Successful Trajectory of Growth and Profits at Capital FirstHistory of Capital First Limited
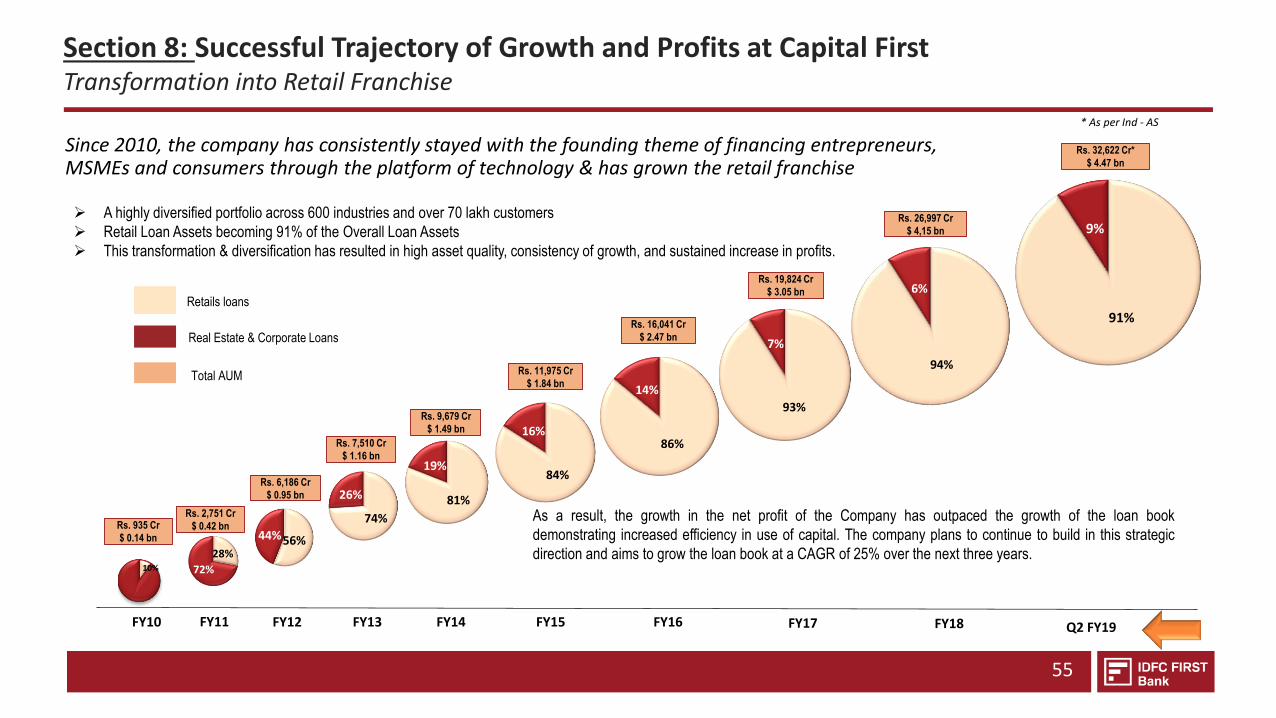
Since 2010, the company has consistently stayed with the founding theme of financing entrepreneurs, MSMEs and consumers through the platform of technology & has grown the retail franchise
55
Rs. 2,751 Cr
$ 0.42 bn
Rs. 6,186 Cr
$ 0.95 bn
Rs. 7,510 Cr
$ 1.16 bn
Rs. 9,679 Cr
$ 1.49 bn
Rs. 11,975 Cr
$ 1.84 bn
Rs. 16,041 Cr
$ 2.47 bn
Rs. 19,824 Cr
$ 3.05 bn
28%
72%
74%
26% 81%
19%84%
16%86%
14%
56%44%
93%
7%
Rs. 26,997 Cr
$ 4,15 bn
Total AUM
A highly diversified portfolio across 600 industries and over 70 lakh customers
Retail Loan Assets becoming 91% of the Overall Loan Assets
This transformation & diversification has resulted in high asset quality, consistency of growth, and sustained increase in profits.
Retails loans
As a result, the growth in the net profit of the Company has outpaced the growth of the loan book
demonstrating increased efficiency in use of capital. The company plans to continue to build in this strategic
direction and aims to grow the loan book at a CAGR of 25% over the next three years.
Real Estate & Corporate Loans
FY10 FY12 FY13 FY14 FY15 FY16 FY17 FY18
94%
6%
Rs. 32,622 Cr*
$ 4.47 bn
Q2 FY19
* As per Ind - AS
10%
Rs. 935 Cr
$ 0.14 bn
FY11
91%
9%
Section 8: Successful Trajectory of Growth and Profits at Capital FirstTransformation into Retail Franchise
56
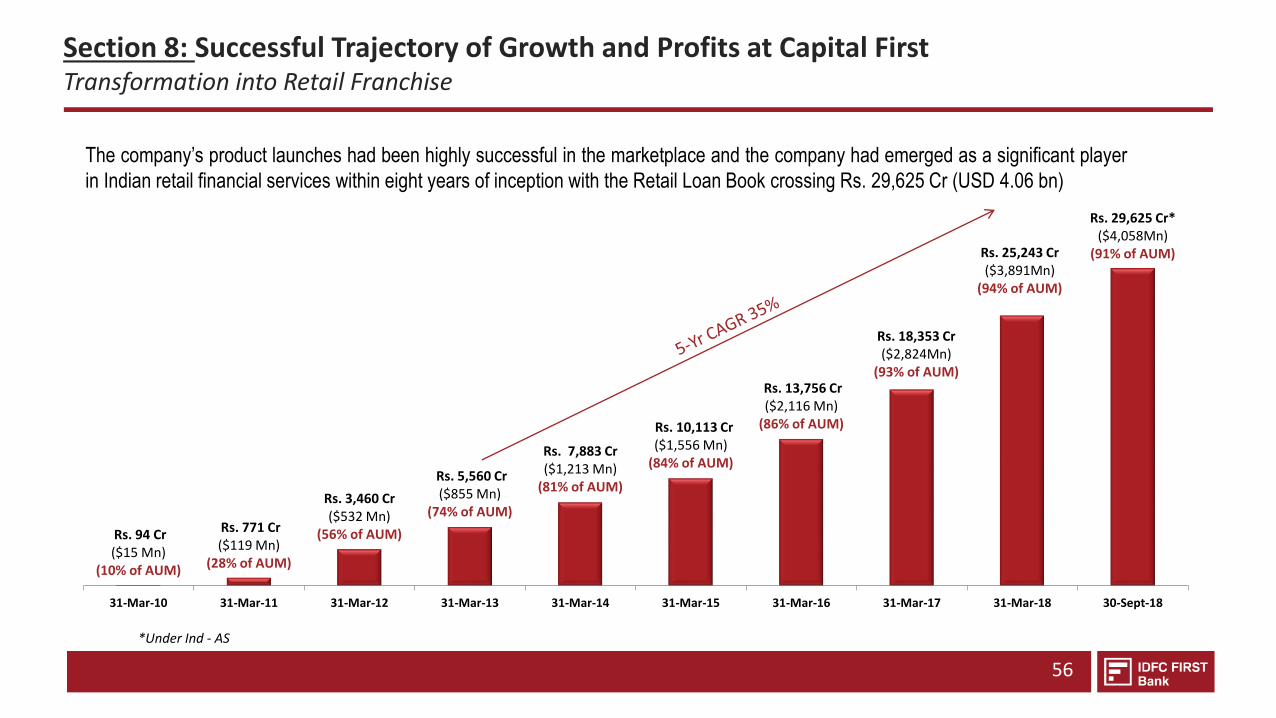
The company’s product launches had been highly successful in the marketplace and the company had emerged as a significant player
in Indian retail financial services within eight years of inception with the Retail Loan Book crossing Rs. 29,625 Cr (USD 4.06 bn)
*Under Ind - AS
Rs. 94 Cr($15 Mn)
(10% of AUM)
Rs. 771 Cr($119 Mn)
(28% of AUM)
Rs. 3,460 Cr($532 Mn)
(56% of AUM)
Rs. 5,560 Cr($855 Mn)
(74% of AUM)
Rs. 7,883 Cr($1,213 Mn)
(81% of AUM)
Rs. 10,113 Cr($1,556 Mn)
(84% of AUM)
Rs. 13,756 Cr($2,116 Mn)
(86% of AUM)
Rs. 18,353 Cr($2,824Mn)
(93% of AUM)
Rs. 25,243 Cr($3,891Mn)
(94% of AUM)
Rs. 29,625 Cr*($4,058Mn)
(91% of AUM)
31-Mar-10 31-Mar-11 31-Mar-12 31-Mar-13 31-Mar-14 31-Mar-15 31-Mar-16 31-Mar-17 31-Mar-18 30-Sept-18
Section 8: Successful Trajectory of Growth and Profits at Capital FirstTransformation into Retail Franchise
57
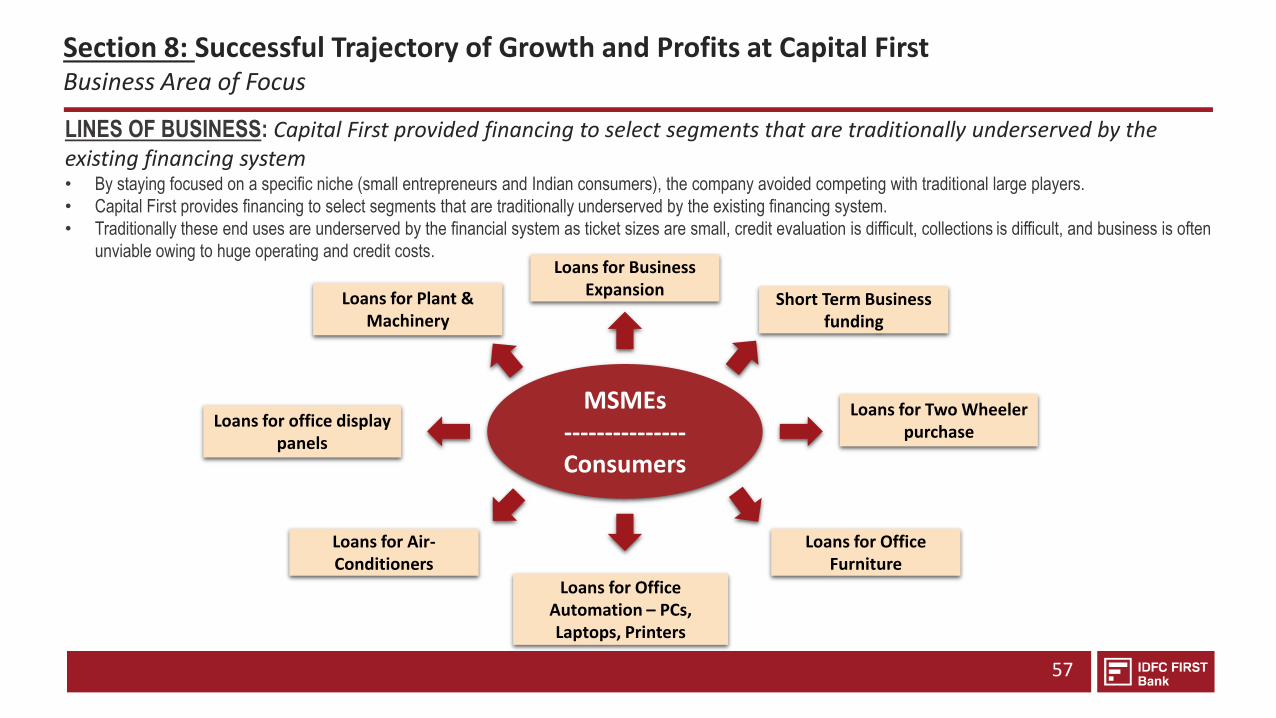
MSMEs---------------Consumers
Loans for Business Expansion
Short Term Business funding
Loans for Two Wheeler purchase
Loans for Office Furniture
Loans for Office Automation – PCs, Laptops, Printers
Loans for Plant & Machinery
Loans for office display panels
Loans for Air-Conditioners
LINES OF BUSINESS: Capital First provided financing to select segments that are traditionally underserved by the existing financing system• By staying focused on a specific niche (small entrepreneurs and Indian consumers), the company avoided competing with traditional large players.
• Capital First provides financing to select segments that are traditionally underserved by the existing financing system.
• Traditionally these end uses are underserved by the financial system as ticket sizes are small, credit evaluation is difficult, collections is difficult, and business is often
unviable owing to huge operating and credit costs.
Section 8: Successful Trajectory of Growth and Profits at Capital FirstBusiness Area of Focus
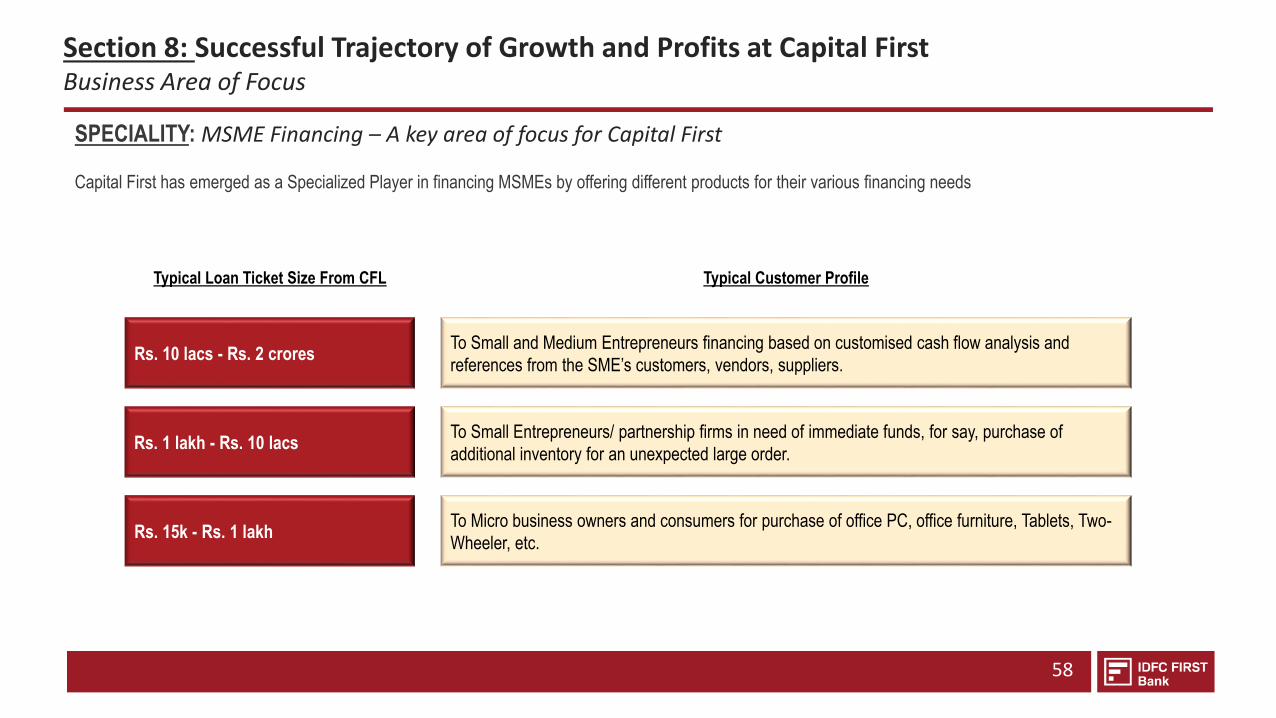
58
Typical Loan Ticket Size From CFL
Rs. 15k - Rs. 1 lakhTo Micro business owners and consumers for purchase of office PC, office furniture, Tablets, Two-
Wheeler, etc.
Rs. 1 lakh - Rs. 10 lacsTo Small Entrepreneurs/ partnership firms in need of immediate funds, for say, purchase of
additional inventory for an unexpected large order.
Rs. 10 lacs - Rs. 2 croresTo Small and Medium Entrepreneurs financing based on customised cash flow analysis and
references from the SME’s customers, vendors, suppliers.
Typical Customer Profile
SPECIALITY: MSME Financing – A key area of focus for Capital First
Capital First has emerged as a Specialized Player in financing MSMEs by offering different products for their various financing needs
Section 8: Successful Trajectory of Growth and Profits at Capital FirstBusiness Area of Focus
59
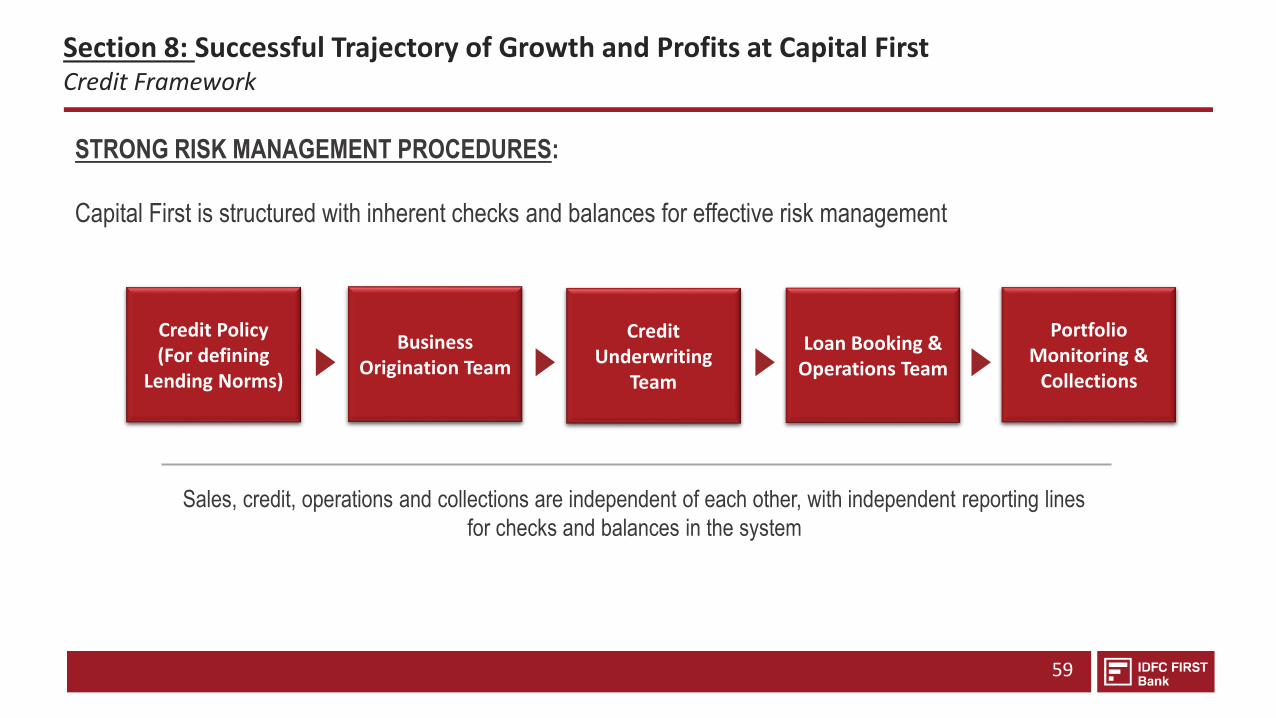
STRONG RISK MANAGEMENT PROCEDURES:
Capital First is structured with inherent checks and balances for effective risk management
Sales, credit, operations and collections are independent of each other, with independent reporting lines
for checks and balances in the system
Credit Policy(For defining
Lending Norms)
Business Origination Team
Credit Underwriting
Team
Loan Booking & Operations Team
Portfolio Monitoring &
Collections
Section 8: Successful Trajectory of Growth and Profits at Capital FirstCredit Framework
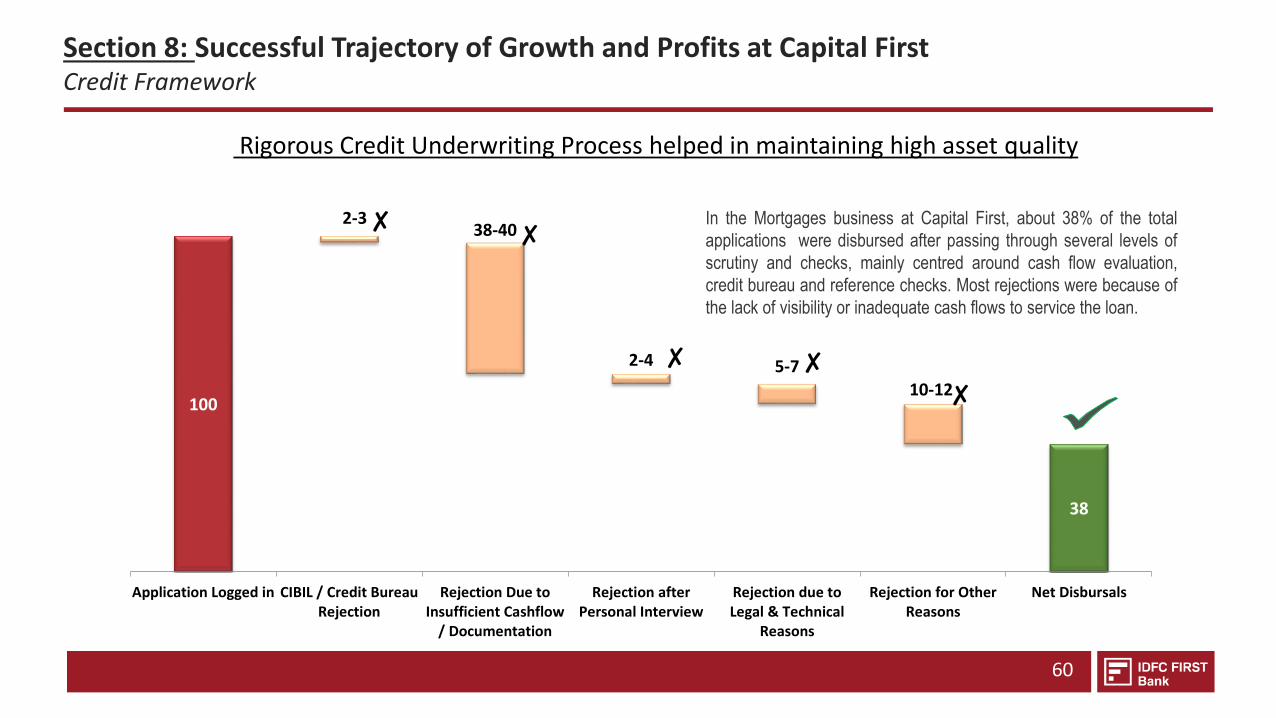
Rigorous Credit Underwriting Process helped in maintaining high asset quality
60
In the Mortgages business at Capital First, about 38% of the total
applications were disbursed after passing through several levels of
scrutiny and checks, mainly centred around cash flow evaluation,
credit bureau and reference checks. Most rejections were because of
the lack of visibility or inadequate cash flows to service the loan.
100
2-338-40
2-4 5-710-12
38
Application Logged in CIBIL / Credit BureauRejection
Rejection Due toInsufficient Cashflow
/ Documentation
Rejection afterPersonal Interview
Rejection due toLegal & Technical
Reasons
Rejection for OtherReasons
Net Disbursals
✘ ✘
✘
✘✘
Section 8: Successful Trajectory of Growth and Profits at Capital FirstCredit Framework
61
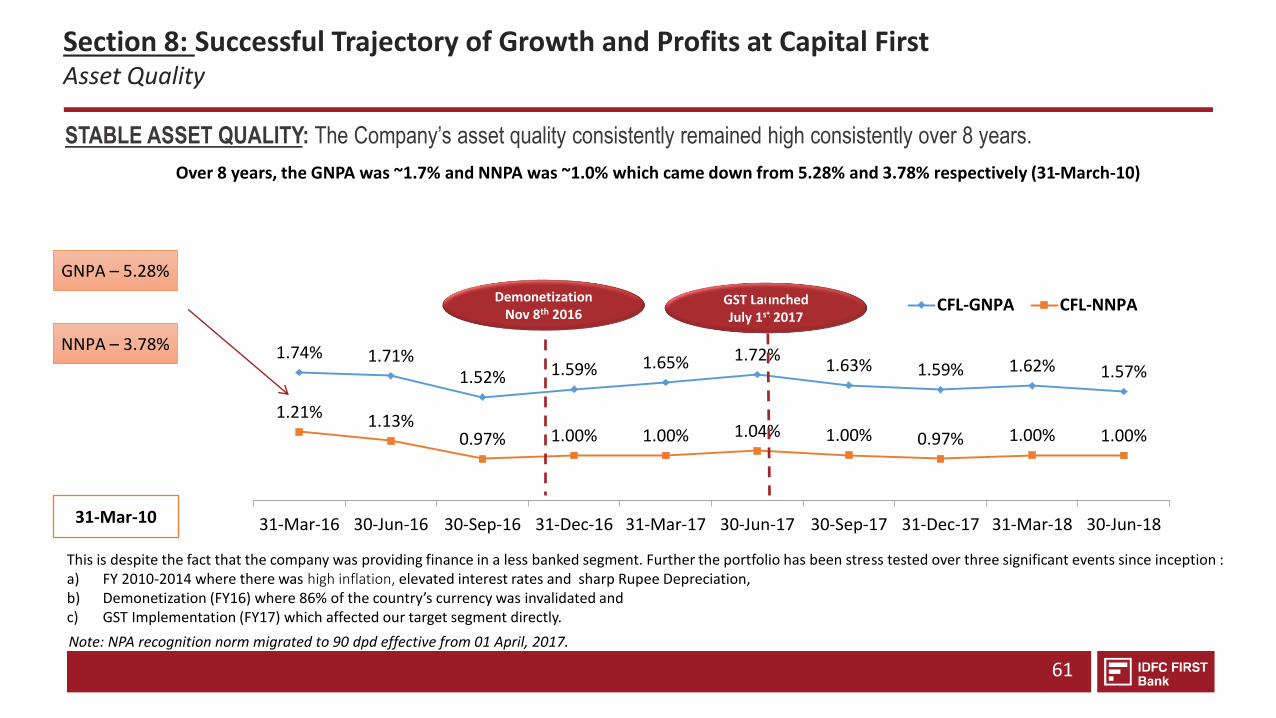
This is despite the fact that the company was providing finance in a less banked segment. Further the portfolio has been stress tested over three significant events since inception : a) FY 2010-2014 where there was high inflation, elevated interest rates and sharp Rupee Depreciation, b) Demonetization (FY16) where 86% of the country’s currency was invalidated and c) GST Implementation (FY17) which affected our target segment directly.
Note: NPA recognition norm migrated to 90 dpd effective from 01 April, 2017.
1.74% 1.71%1.52% 1.59% 1.65% 1.72%
1.63% 1.59% 1.62% 1.57%
1.21% 1.13%0.97% 1.00% 1.00% 1.04% 1.00% 0.97% 1.00% 1.00%
31-Mar-16 30-Jun-16 30-Sep-16 31-Dec-16 31-Mar-17 30-Jun-17 30-Sep-17 31-Dec-17 31-Mar-18 30-Jun-18
CFL-GNPA CFL-NNPA
GNPA – 5.28%
NNPA – 3.78%
31-Mar-10
DemonetizationNov 8th 2016
GST Launched July 1st 2017
Over 8 years, the GNPA was ~1.7% and NNPA was ~1.0% which came down from 5.28% and 3.78% respectively (31-March-10)
STABLE ASSET QUALITY: The Company’s asset quality consistently remained high consistently over 8 years.
Section 8: Successful Trajectory of Growth and Profits at Capital FirstAsset Quality
62
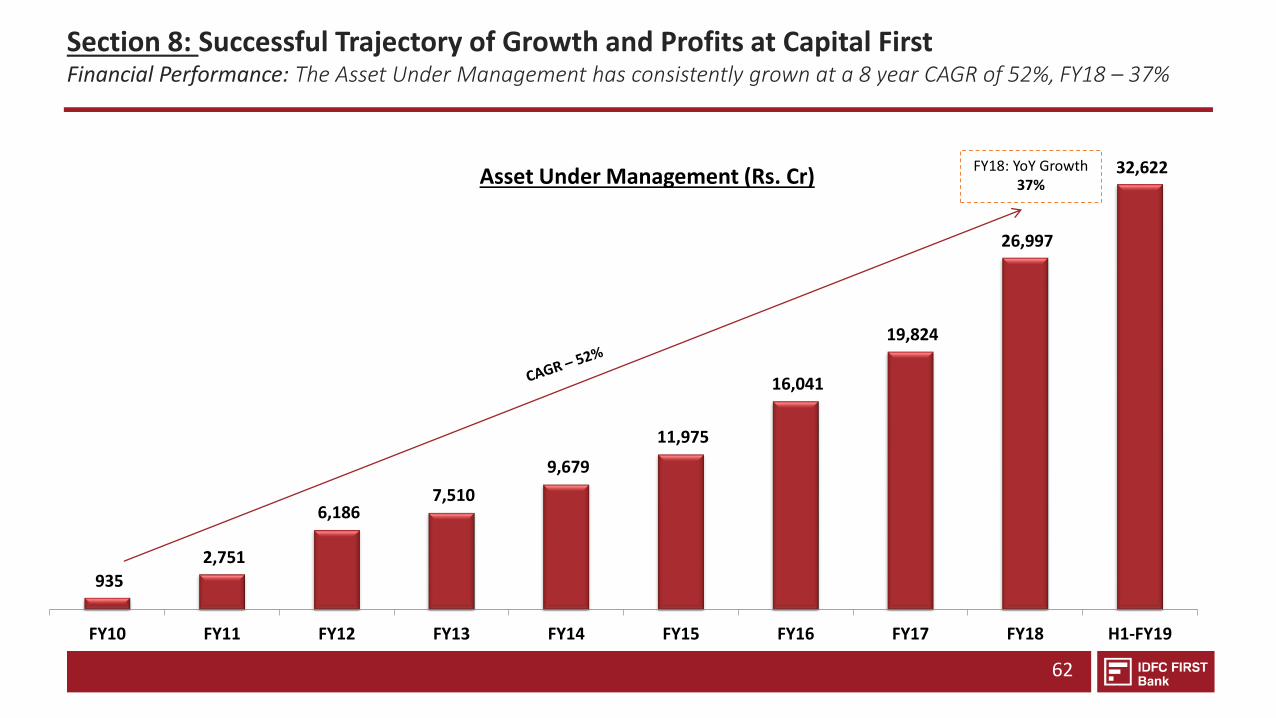
935
2,751
6,186 7,510
9,679
11,975
16,041
19,824
26,997
32,622
FY10 FY11 FY12 FY13 FY14 FY15 FY16 FY17 FY18 H1-FY19
FY18: YoY Growth 37%Asset Under Management (Rs. Cr)
Section 8: Successful Trajectory of Growth and Profits at Capital FirstFinancial Performance: The Asset Under Management has consistently grown at a 8 year CAGR of 52%, FY18 – 37%
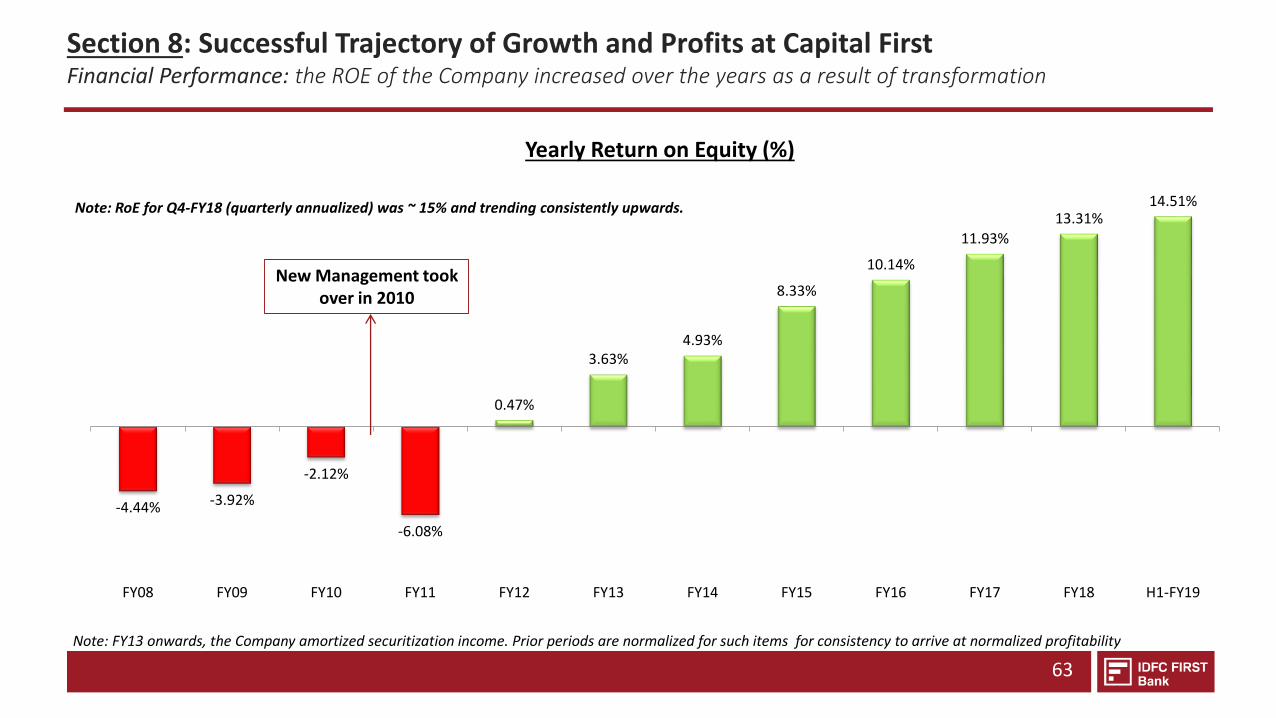
-4.44% -3.92%
-2.12%
-6.08%
0.47%
3.63%4.93%
8.33%
10.14%
11.93%
13.31%14.51%
FY08 FY09 FY10 FY11 FY12 FY13 FY14 FY15 FY16 FY17 FY18 H1-FY19
63
Yearly Return on Equity (%)
Note: FY13 onwards, the Company amortized securitization income. Prior periods are normalized for such items for consistency to arrive at normalized profitability
Note: RoE for Q4-FY18 (quarterly annualized) was ~ 15% and trending consistently upwards.
New Management took over in 2010
Section 8: Successful Trajectory of Growth and Profits at Capital FirstFinancial Performance: the ROE of the Company increased over the years as a result of transformation
64
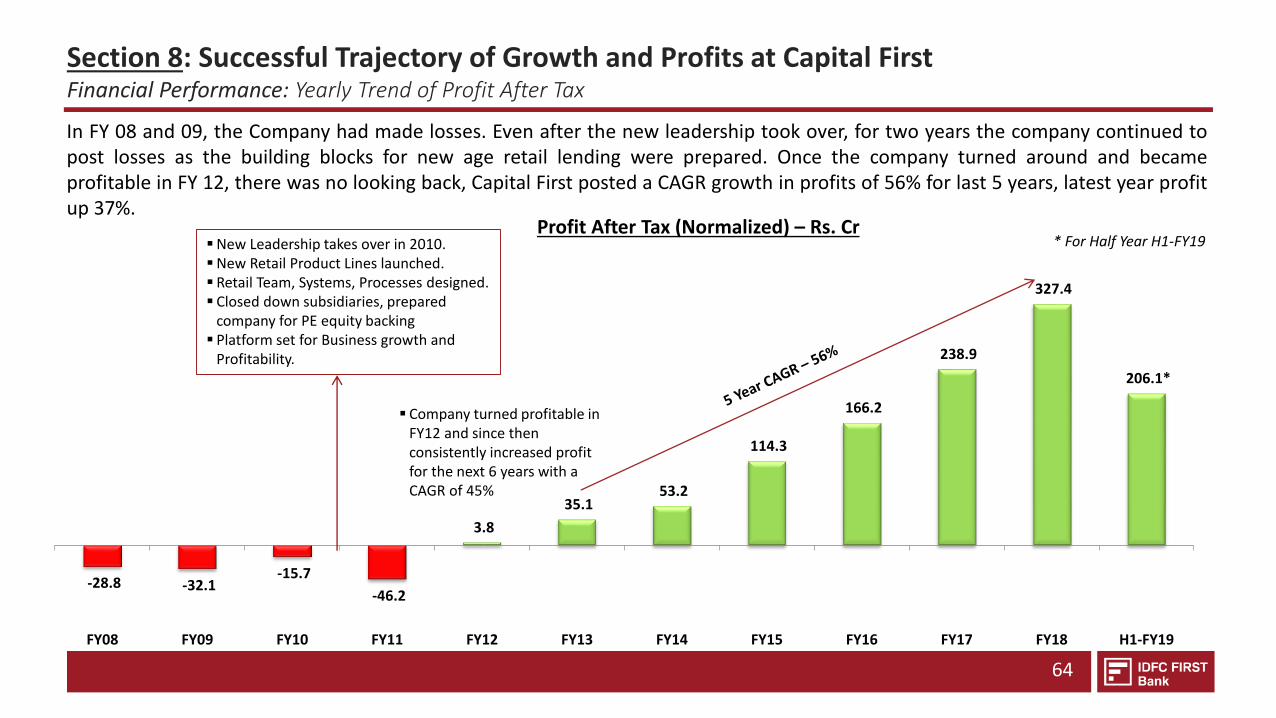
-28.8 -32.1 -15.7
-46.2
3.8
35.1 53.2
114.3
166.2
238.9
327.4
206.1*
FY08 FY09 FY10 FY11 FY12 FY13 FY14 FY15 FY16 FY17 FY18 H1-FY19
In FY 08 and 09, the Company had made losses. Even after the new leadership took over, for two years the company continued topost losses as the building blocks for new age retail lending were prepared. Once the company turned around and becameprofitable in FY 12, there was no looking back, Capital First posted a CAGR growth in profits of 56% for last 5 years, latest year profitup 37%.
Profit After Tax (Normalized) – Rs. Cr* For Half Year H1-FY19New Leadership takes over in 2010.
New Retail Product Lines launched. Retail Team, Systems, Processes designed. Closed down subsidiaries, prepared
company for PE equity backing Platform set for Business growth and
Profitability.
Company turned profitable in FY12 and since then consistently increased profit for the next 6 years with a CAGR of 45%
Section 8: Successful Trajectory of Growth and Profits at Capital FirstFinancial Performance: Yearly Trend of Profit After Tax
65
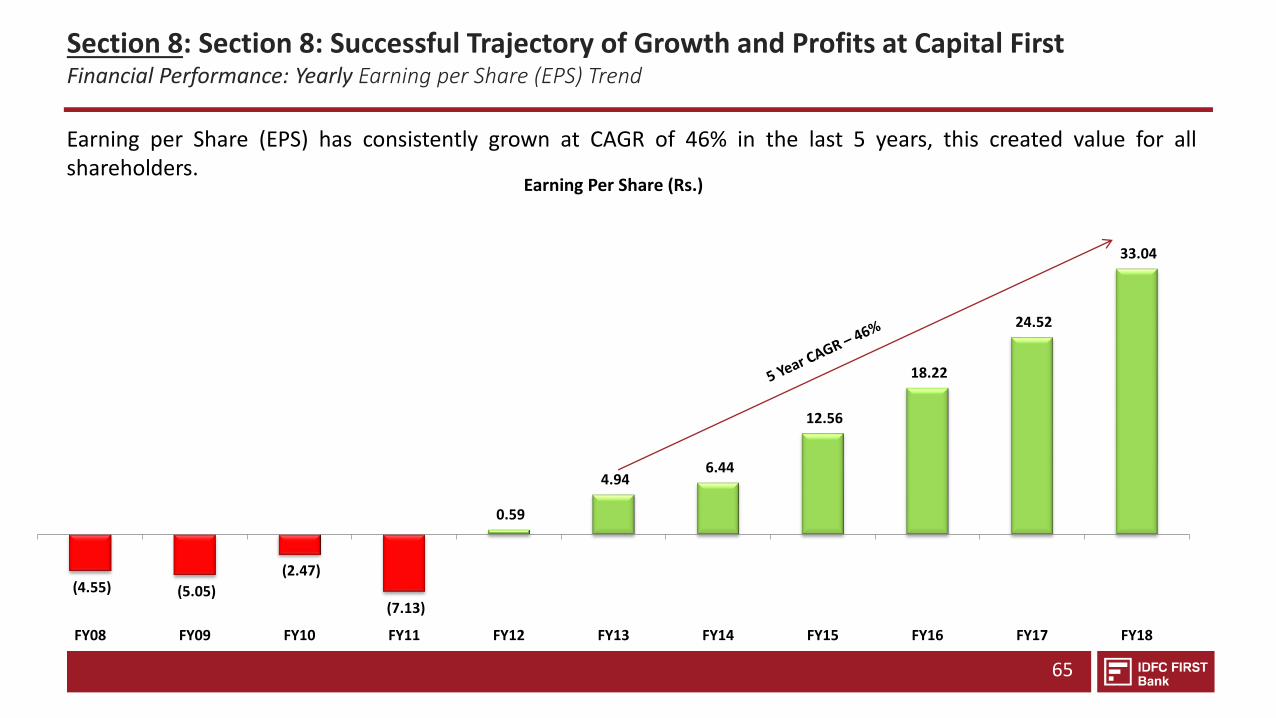
(4.55) (5.05)
(2.47)
(7.13)
0.59
4.94 6.44
12.56
18.22
24.52
33.04
FY08 FY09 FY10 FY11 FY12 FY13 FY14 FY15 FY16 FY17 FY18
Earning Per Share (Rs.)
Earning per Share (EPS) has consistently grown at CAGR of 46% in the last 5 years, this created value for allshareholders.
Section 8: Section 8: Successful Trajectory of Growth and Profits at Capital FirstFinancial Performance: Yearly Earning per Share (EPS) Trend
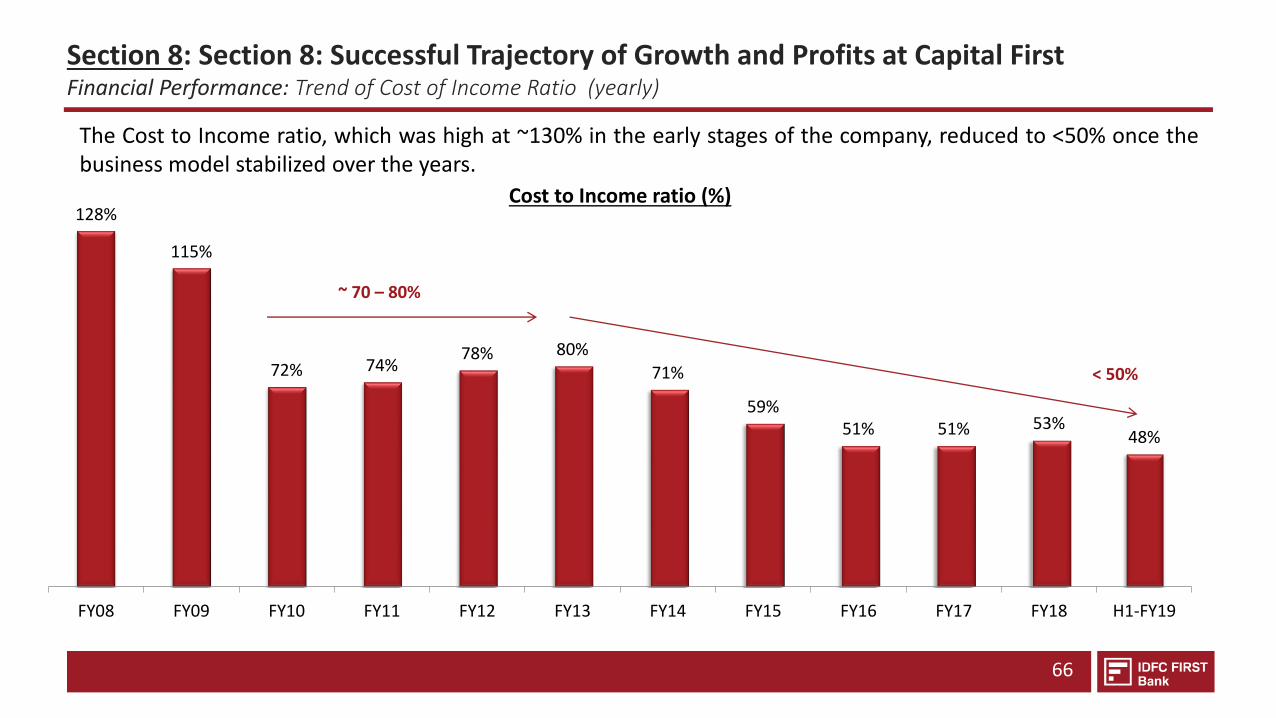
66
128%
115%
72% 74%78% 80%
71%
59%51% 51% 53%
48%
FY08 FY09 FY10 FY11 FY12 FY13 FY14 FY15 FY16 FY17 FY18 H1-FY19
Cost to Income ratio (%)
~ 70 – 80%
< 50%
The Cost to Income ratio, which was high at ~130% in the early stages of the company, reduced to <50% once thebusiness model stabilized over the years.
Section 8: Section 8: Successful Trajectory of Growth and Profits at Capital FirstFinancial Performance: Trend of Cost of Income Ratio (yearly)
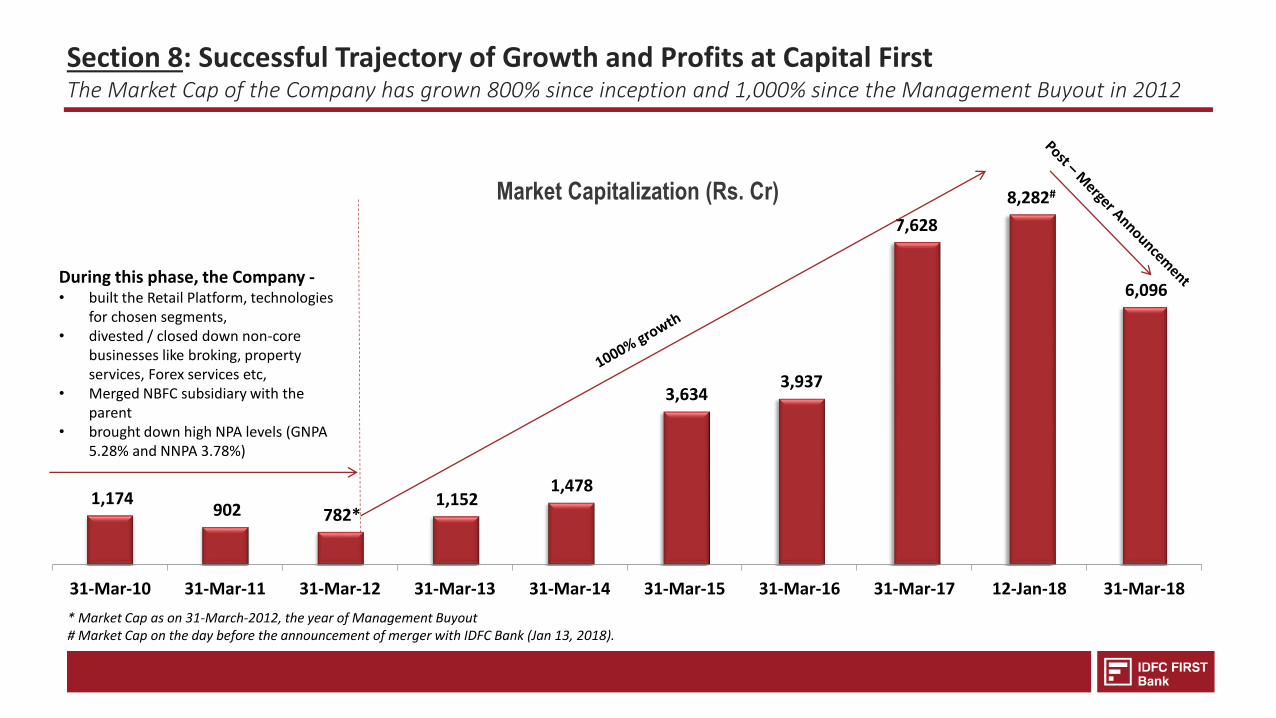
1,174 902 782*
1,152 1,478
3,634 3,937
7,628
8,282#
6,096
31-Mar-10 31-Mar-11 31-Mar-12 31-Mar-13 31-Mar-14 31-Mar-15 31-Mar-16 31-Mar-17 12-Jan-18 31-Mar-18
Market Capitalization (Rs. Cr)
* Market Cap as on 31-March-2012, the year of Management Buyout# Market Cap on the day before the announcement of merger with IDFC Bank (Jan 13, 2018).
During this phase, the Company -• built the Retail Platform, technologies
for chosen segments, • divested / closed down non-core
businesses like broking, property services, Forex services etc,
• Merged NBFC subsidiary with the parent
• brought down high NPA levels (GNPA 5.28% and NNPA 3.78%)
Section 8: Successful Trajectory of Growth and Profits at Capital FirstThe Market Cap of the Company has grown 800% since inception and 1,000% since the Management Buyout in 2012
68
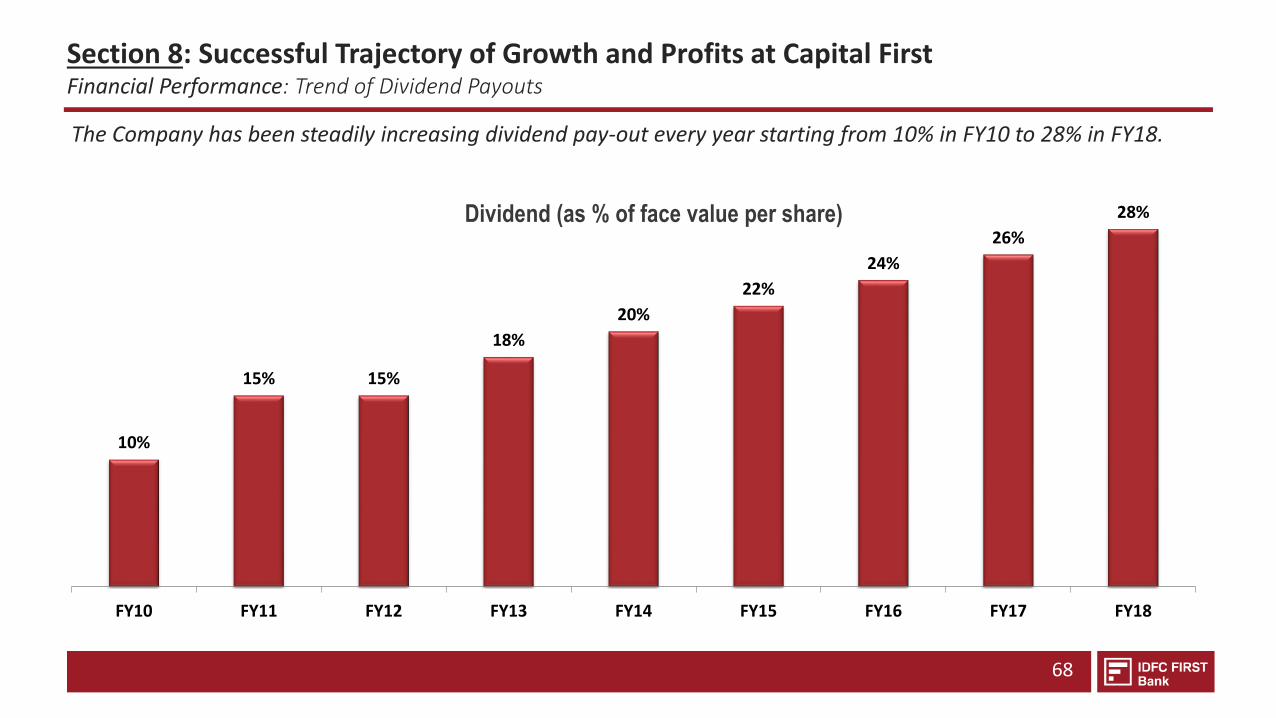
Dividend (as % of face value per share)
10%
15% 15%
18%
20%
22%
24%
26%
28%
FY10 FY11 FY12 FY13 FY14 FY15 FY16 FY17 FY18
The Company has been steadily increasing dividend pay-out every year starting from 10% in FY10 to 28% in FY18.
Section 8: Successful Trajectory of Growth and Profits at Capital FirstFinancial Performance: Trend of Dividend Payouts
Section 8: Summary – Strategy for IDFC FIRST Bank
69
In summary, under our stated strategy for the combined entity, IDFCFIRST Bank, the same successful model of Capital First lendingbusiness is now being built on a Bank platform from IDFC Bank, thusthe business becomes more profitable, robust and sustaining becauseof availability of low cost and more abundant funding.
THANK YOU
Management Commentary on the Q2 FY20 results for IDFC FIRST Bank
Disclaimer: Certain statements contained in this note that are not statements of historical fact
constitute “forward-looking statements.” You can generally identify forward-looking
statements by terminology such as “aim”, “anticipate”, “believe”, “continue”, “could”,
“estimate”, “expect”, “intend”, “may”, “objective”, “goal”, “plan”, “potential”, “project”,
“pursue”, “shall”, “should”, “will”, “would”, or other words or phrases of similar import. These
forward-looking statements involve known and unknown risks, uncertainties, assumptions
and other factors that may cause the Company’s actual results, performance or achievements
to be materially different from any future results, performance or achievements expressed or
implied by such forward-looking statements or other projections. For full text of our disclaimer
on this matter kindly refer to page 2 of the investor presentation uploaded on the website of
the bank.
A. Balance Sheet:
1. The funded loan book of the bank was Rs. 1,07,656 crore as of 30 September 2019 as
compared to Rs. 1,12,558 crores as of 30 June 2019. The approach of the bank has been
to continue to grow the retail loan book and to moderate the growth of the wholesale
book. This strategy will help us to improve our liability profile through incremental
funding raised during the year. Our performance during the last two quarters continues
to reflect this stated strategy.
*including PSL buyouts, SRs and Loan Equity
As can be seen, the proportion of retail loans as a percentage of total loan book has
increased from 13% pre-merger, to 35% immediately on merger, and has swiftly grown
to 45% within the last three quarters. We are confident that we will get to our guidance
of 70% retailisation before the period of 5 years guided at the time of merger.
2. Such rapid transformation from wholesale loans to retail loans has been achieved at
Capital First before, when retail rose from 10% to 90% in seven years. We are confident
that we will continue with sustained focus in growing the retail franchisee at IDFC FIRST
Bank.
3. While our Retail Book increased by Rs. 3,427 Cr during the Q2 2018, the wholesale book
including the PSL buyouts, Loan Equity and SRs decreased sharply by Rs. 8,329 Cr which
resulted an overall Loan Book de-growth of Rs. 4,902 Cr.
Particulars (in Rs Cr) Sep-18 Dec-18 Mar-19 Jun-19 Sep-19
Retail Funded Assets 9,916 36,236 40,812 44,642 48,069
Wholesale Funded Assets* 65,421 68,424 69,589 67,916 59,587
Total Funded Assets 75,337 1,04,660 1,10,400 1,12,558 1,07,656
4. Specifically, as per strategy, the Infrastructure loan book was reduced by Rs. 3,111 Cr
during Q2 FY20, and the Non-Infra Corporate Book reduced by Rs. 3,187 Cr over the
previous quarter.
5. The Bank has met its priority sector target as well as target for the sub-segments
including the Agriculture segment. During the quarter end on 30 September 2019, the
Inorganic PSL buyouts have decreased by Rs. 1,950 Cr but as the retail book grows and
organic PSL additions increase, the Bank has been able to carry surplus PSL assets as
compared to the PSL requirements as per the Banking regulation.
B. Net Interest margin
The net interest margin for the bank pre-merger was 1.56%. Immediately on merger
this touched 2.89%, which has now increased to 3.43% during Q2 FY 20. This is primarily
driven by the increasing proportion of retail loans. We expect this trend to continue.
C. Asset quality:
1. The asset quality of the retail financing book has been stable. The retail Gross NPA
during the quarter was 2.31% as compared to 2.32% as of 30 June 2019 and the retail
Net NPA was at 1.08% as compared to 1.14% as of 30 June 2019.
2. Most of the Retail Loan Book has come from the Capital First where the asset quality
trends have been consistently high over 8 years of operation. We are happy to share
that the asset quality of the retail book has been stress tested many times during the
last nine years through periods of high inflation (2010-2014), demonetization (2016),
GST implementation (2017). Each of these events were significant events and get the
asset quality remained stable, which gives us the confidence in our business model. We
continue to refine and improve our underwriting skills every month.
3. The bank has identified certain additional exposures as watch-list accounts under
stressed, and as a prudent practice, has taken provisions against these as appropriate.
These are:
Two identified Financial Services Accounts (One HFC and one Financial Company).
Total exposure: Rs. 1,231 crores. Provisions made: Rs. 923 crores. Provision
Coverage 75%.
One Tolling concession Infrastructure Account. Total Exposure: Rs. 985 crores.
Provision made: Rs. 154 crores. Provision Coverage 15%. This account is a
performing Tolling concession Road with strong cash flows but repaying behind
schedule, hence this account has been flagged.
Other Legacy Infrastructure loans: Total Exposure: Rs. 776 crores. Provisions
made: Rs. 540 Crores. Provision Coverage: 70%.
D. Liabilities:
1. To grow the retail liabilities, both for retail CASA as well as retail term deposits, is the
cornerstone of our strategy.
2. We are happy to report that the bank continues to have excellent success on growth
of retail liabilities. The CASA of the bank has grown from Rs. 6,253 Cr as of 30
September 2018 to Rs. 12,473 Cr, an increase of 99%. CASA balance increased by 30%
on Q-o-Q basis.
3. The above calculations exclude CASA of Rs. 2,614 Cr which pertains to one government
banking account which we are aware is temporary in nature and hence excluded from
the calculations.
4. CASA % has increased from
- 8.68% as of 31st December 2018 (at merger) to
- 11.40% as of 31st March 2019, to
- 14.57% as of 30th June 2019 and to
- 18.70% as of 30th September 2019.
We have already announced our target to take this to 30% in 5 year but we believe we
can comfortably get there before the target date. The performance in the last three
quarters has strengthened our confidence (all the numbers above exclude the one
government banking account which leaves short-term savings deposits with us only for
a few days usually at month ends).
5. In our case, the bank also has a large proportion of liabilities in the form of other
borrowings because of our unique history i.e. IDFC Limited was an infrastructure
financing Domestic Financial Institution and Capital First was a retail and MSME
financing NBFC. Both entities had institutional borrowings but no retail deposits. Hence
we propose to improve the Core Retail Deposits (Retail CASA+ Retail Term Deposits) as
a proportion of Total Deposits and Borrowings, and track ourselves for this. On this
count too, the bank has sharply improved the liability profile as follows:
This number increased from
- 8.04% at the time of merger to
- 11.75% as of 30th June 2019 and
- 16.72% as of 30th September 2019.
We plan to take this to 50% within the next 5 years. The Bank is well placed to achieve
these targets.
The Retail Term Deposits have grown by Rs. 3,252 Cr over the quarter ended 30 June
2019. This was a Q-o-Q increase 32% and Y-o-Y increase of 110%.
6. As of 30th June 2019, the Bank has distribution set up through 351 Bank branches and
216 ATMs across India.
7. The legacy long-term bonds inherited from IDFC limited has reduced from Rs. 16,385
crore as on 31st December 2018 to Rs. 13,452 crore, a drop of Rs. 2,932 crore within 9
months. We expect this will wind down to NIL over the next 6 years.
8. The cost of funds for the bank reduced from 7.75% (Q1-FY20) to 7.71% (Q2-FY20),
primarily driven by the growth of CASA deposits and Retail term Deposits.
E. Liquidity:
The bank is highly liquid and is getting retail casa and retail deposits at a pace more
than the normal business requirements of the bank. During the quarter ended on 30th
September 2019, the overall loan book shrunk by Rs. 4,902 crore releasing cash of such
amount to the bank. In addition to this, the bank raised Rs. 5,956 crores in retail casa
and retail term deposits during the quarter, which are sticky and sustainable deposits
for the Bank. The bank has used such surplus liquidity to reduce the dependency on
wholesale deposits and borrowings, i.e. certificates of deposits reduced by Rs. 4,775
crore during last quarter.
Since 31 March 2019, the certificates of deposit balance has come down from Rs.
28,754 crore as on 31 March 2019 to Rs. 15,283 crore as of 30 September 2019, a
reduction of Rs. 13,471 crore. Such limits are still available with the bank for drawing
down as per rating. The bank enjoys limits of Rs. 40,000 crores by rating agencies of
Certificate of Deposits (CD) and thus with Rs. 25,000 crore of limits on account of
certificates of deposits continue to be unleashed. The bank enjoys a high long term
credit and highest short term credit rating. The bank continues to enjoy high
confidence in the market for our products and services with regard to savings accounts,
current accounts and wealth management solutions which are a hit in the market and
continue to grow rapidly.
The liquidity coverage ratio of the Bank as of 30 September 2019 is 125% which is much
higher than the regulatory requirement of 100%.
F. Capital Adequacy.
1. As of 30th September 2019, the Bank has capital Adequacy Ratio of 14.65% out of which
the Tier-1 Capital Adequacy Ratio is 14.51%. The Bank has de-grown its overall loan
book due to the reduction in Wholesale Loans which has helped the Bank to conserve
and utilize its Capital better.
G. Profit and Loss
1. The Net Interest Income (NII) during the quarter grew from Rs. 1,174 crores in Q1-FY20
to Rs. 1,363 crores in Q2-FY20, primarily driven by the growth in the retail loan book.
Last quarter, the Bank reversed interest earning of Rs. 82 Cr pertaining to stressed
assets out of which Rs. 53 Cr was for the quarter ended on 30 June 2019. Without the
effect of one-time adjustments, the NII grew by 11% on Q-o-Q basis.
2. The Fee and Other Income from the normal business operations has increased from Rs.
301 Cr in Q1-FY20 to Rs. 335 Cr in Q2-FY20, an increase of 11% on Q-o-Q basis. This
includes loan related fees, Trade and Cash management fees, wealth management and
third party distribution and debit card, digital transaction fees and such fees.
3. The Bank’s pre-provisioning profit has increased from Rs. 318 Cr in Q1-FY20 to Rs. 417
Cr in Q2-FY20 and the cost to income ratio has improved from 78.60% for Q1-FY20 to
75.61% in Q2-FY20, despite the heavy investments in branches as the Bank added 72
branches in Q2-FY20.
4. The Profit before Tax for the Bank has increased from a loss of Rs. 963 Cr in Q1-FY20 to
Rs. 100 Cr in Q2-FY20. There were certain one-time write-backs and certain slippages
on legacy infrastructure account during the quarter. We estimate that the core profit
before tax net of all such movements was about ₹ 60 crore.
5. The Bank decided to exercise option permitted under section 115BAA of the Income
Tax Act, 1961 introduced by the Taxation Law Amendment Ordinance, 2019 and
accordingly measured the Income tax for the quarter and half-year ended on 30
September 2019 as well as re-measured the Deferred Tax Assets. The full impact of this
change has been incorporated in the tax line of the Profit & Loss Statement. Hence, the
Bank reported net loss (after tax) of Rs. 680 Cr for the quarter ended on 30 September
2019.
H. Impact of the change in corporate tax rate on the deferred tax balances and capital
adequacy ratio
The Taxation Laws (Amendment) Ordinance, 2019 was promulgated on September 20,
2019. The Ordinance amends the Income Tax Act, 1961, and the Finance (No. 2) Act,
2019. The Ordinance provides domestic companies with an option to opt for lower tax
rate of 25.17%, provided they do not claim certain deductions/ exemptions. Hitherto,
the maximum marginal rate of tax applicable to the Bank has been 34.944%. The Bank
has chosen to shift to the lower tax rate of 25.17% to its income for financial year 2019-
20.
In accordance with the applicable accounting standards, based on the lower applicable
tax rate, the Bank is required to restate its deferred tax assets (‘DTA’) standing as on
March 31, 2019 and the deferred tax created during Q1 of FY 19-20. Accordingly, the
DTA balance of Rs 2,519 Crore standing as on March 31, 2019 has been restated to Rs
1,839 Crore, thereby resulting in a write down of Rs 679 Crore. Further, the DTA
created during Q1 FY 19-20 of Rs 346 Crore has been written down by around Rs 72
Crore to give effect to the downward revision in tax rate. Overall, the reduction in tax
rate has resulted in a DTA write down of around Rs 751 Crore. The tax for Q2 FY 19-20
has been computed basis the revised tax rate of 25.17%.
Related Documents