July 2010

Welcome message from author
This document is posted to help you gain knowledge. Please leave a comment to let me know what you think about it! Share it to your friends and learn new things together.
Transcript

July 2010
1
Equity Commentary
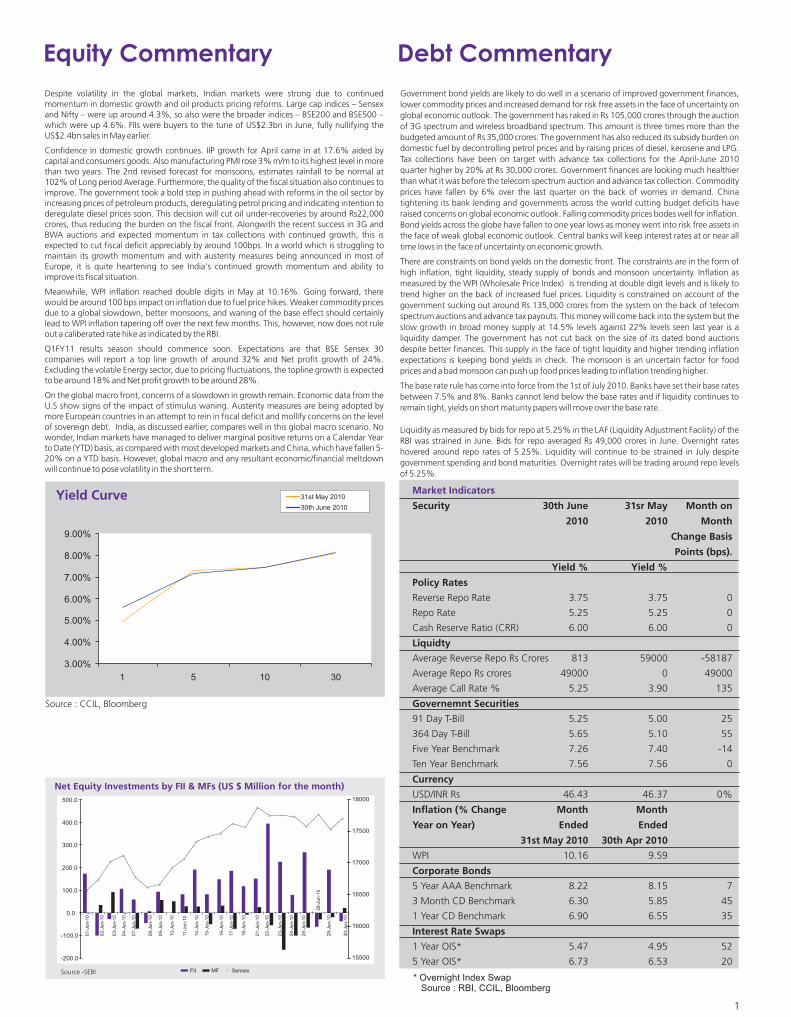
Net Equity Investments by FII & MFs (US $ Million for the month)
Source -SEBI
Debt Commentary
Market Indicators
Security 30th June Month on
2010 2010 Month
Change Basis
Points (bps).
Yield % Yield %
Policy Rates
Reverse Repo Rate 3.75 3.75 0
Repo Rate 5.25 5.25 0
Cash Reserve Ratio (CRR) 6.00 6.00 0
Liquidty
Average Reverse Repo Rs Crores 813 59000 -58187
Average Repo Rs crores 49000 0 49000
Average Call Rate % 5.25 3.90 135
Governemnt Securities
91 Day T-Bill 5.25 5.00 25
364 Day T-Bill 5.65 5.10 55
Five Year Benchmark 7.26 7.40 -14
Ten Year Benchmark 7.56 7.56 0
Currency
USD/INR Rs 46.43 46.37 0%
Inflation (% Change Month Month
Year on Year) Ended Ended
31st May 2010 30th Apr 2010
WPI 10.16 9.59
Corporate Bonds
5 Year AAA Benchmark 8.22 8.15 7
3 Month CD Benchmark 6.30 5.85 45
1 Year CD Benchmark 6.90 6.55 35
Interest Rate Swaps
1 Year OIS* 5.47 4.95 52
5 Year OIS* 6.73 6.53 20
31sr May
* Overnight Index Swap Source : RBI, CCIL, Bloomberg
Yield Curve
Source : CCIL, Bloomberg
30th June 2010
31st May 2010
FII MF Sensex
Government bond yields are likely to do well in a scenario of improved government finances, lower commodity prices and increased demand for risk free assets in the face of uncertainty on global economic outlook. The government has raked in Rs 105,000 crores through the auction of 3G spectrum and wireless broadband spectrum. This amount is three times more than the budgeted amount of Rs 35,000 crores. The government has also reduced its subsidy burden on domestic fuel by decontrolling petrol prices and by raising prices of diesel, kerosene and LPG. Tax collections have been on target with advance tax collections for the April-June 2010 quarter higher by 20% at Rs 30,000 crores. Government finances are looking much healthier than what it was before the telecom spectrum auction and advance tax collection. Commodity prices have fallen by 6% over the last quarter on the back of worries in demand. China tightening its bank lending and governments across the world cutting budget deficits have raised concerns on global economic outlook. Falling commodity prices bodes well for inflation. Bond yields across the globe have fallen to one year lows as money went into risk free assets in the face of weak global economic outlook. Central banks will keep interest rates at or near all time lows in the face of uncertainty on economic growth.
There are constraints on bond yields on the domestic front. The constraints are in the form of high inflation, tight liquidity, steady supply of bonds and monsoon uncertainty. Inflation as measured by the WPI (Wholesale Price Index) is trending at double digit levels and is likely to trend higher on the back of increased fuel prices. Liquidity is constrained on account of the government sucking out around Rs 135,000 crores from the system on the back of telecom spectrum auctions and advance tax payouts. This money will come back into the system but the slow growth in broad money supply at 14.5% levels against 22% levels seen last year is a liquidity damper. The government has not cut back on the size of its dated bond auctions despite better finances. This supply in the face of tight liquidity and higher trending inflation expectations is keeping bond yields in check. The monsoon is an uncertain factor for food prices and a bad monsoon can push up food prices leading to inflation trending higher.
The base rate rule has come into force from the 1st of July 2010. Banks have set their base rates between 7.5% and 8%. Banks cannot lend below the base rates and if liquidity continues to remain tight, yields on short maturity papers will move over the base rate.
Liquidity as measured by bids for repo at 5.25% in the LAF (Liquidity Adjustment Facility) of the RBI was strained in June. Bids for repo averaged Rs 49,000 crores in June. Overnight rates hovered around repo rates of 5.25%. Liquidity will continue to be strained in July despite government spending and bond maturities. Overnight rates will be trading around repo levels of 5.25%.
Despite volatility in the global markets, Indian markets were strong due to continued momentum in domestic growth and oil products pricing reforms. Large cap indices – Sensex and Nifty – were up around 4.3%, so also were the broader indices – BSE200 and BSE500 – which were up 4.6%. FIIs were buyers to the tune of US$2.3bn in June, fully nullifying the US$2.4bn sales in May earlier.
Confidence in domestic growth continues. IIP growth for April came in at 17.6% aided by capital and consumers goods. Also manufacturing PMI rose 3% m/m to its highest level in more than two years. The 2nd revised forecast for monsoons, estimates rainfall to be normal at 102% of Long period Average. Furthermore, the quality of the fiscal situation also continues to improve. The government took a bold step in pushing ahead with reforms in the oil sector by increasing prices of petroleum products, deregulating petrol pricing and indicating intention to deregulate diesel prices soon. This decision will cut oil under-recoveries by around Rs22,000 crores, thus reducing the burden on the fiscal front. Alongwith the recent success in 3G and BWA auctions and expected momentum in tax collections with continued growth, this is expected to cut fiscal deficit appreciably by around 100bps. In a world which is struggling to maintain its growth momentum and with austerity measures being announced in most of Europe, it is quite heartening to see India's continued growth momentum and ability to improve its fiscal situation. Meanwhile, WPI inflation reached double digits in May at 10.16%. Going forward, there would be around 100 bps impact on inflation due to fuel price hikes. Weaker commodity prices due to a global slowdown, better monsoons, and waning of the base effect should certainly lead to WPI inflation tapering off over the next few months. This, however, now does not rule out a caliberated rate hike as indicated by the RBI.
Q1FY11 results season should commence soon. Expectations are that BSE Sensex 30 companies will report a top line growth of around 32% and Net profit growth of 24%. Excluding the volatile Energy sector, due to pricing fluctuations, the topline growth is expected to be around 18% and Net profit growth to be around 28%.
On the global macro front, concerns of a slowdown in growth remain. Economic data from the U.S show signs of the impact of stimulus waning. Austerity measures are being adopted by more European countries in an attempt to rein in fiscal deficit and mollify concerns on the level of sovereign debt. India, as discussed earlier, compares well in this global macro scenario. No wonder, Indian markets have managed to deliver marginal positive returns on a Calendar Year to Date (YTD) basis, as compared with most developed markets and China, which have fallen 5-20% on a YTD basis. However, global macro and any resultant economic/financial meltdown will continue to pose volatility in the short term.
3.00%
4.00%
5.00%
6.00%
7.00%
8.00%
9.00%
1 5 10 30
-200.0
-100.0
0.0
100.0
200.0
300.0
400.0
500.0
01-J
un-1
0
02-J
un-1
0
03-J
un-1
0
04-J
un-1
0
07-J
un-1
0
08-J
un-1
0
09-J
un-1
0
10-J
un-1
0
11-J
un-1
0
14-J
un-1
0
15-J
un-1
0
16-J
un-1
0
17-J
un-1
0
18-J
un-1
0
21-J
un-1
0
22-J
un-1
0
23-J
un-1
0
24-J
un-1
0
25-J
un-1
0
28-J
un-1
0
29-J
un-1
0
30-J
un-1
0
15500
16000
16500
17000
17500
18000

2
IDFC Classic Equity Fund(IDFC - CEF)An open-ended equity fund
Data as of 30 June 2010
Portfolio
Asset Allocation
Marketvalue in % of
Name Lac (Rs.) NAV
Mahindra & Mahindra Ltd. 1187.10 4.41Bajaj Auto Limited 647.40 2.40
ICICI Bank Ltd. 1074.93 3.99HDFC Bank Ltd. 1053.53 3.91Union Bank of India 1050.06 3.90Bank of Baroda 722.07 2.68Axis Bank Limited 649.78 2.41Federal Bank Ltd. 598.02 2.22ING Vysya Bank Ltd. 410.57 1.52
Grasim Industries Ltd. 508.09 1.89
Larsen & Toubro Ltd. 828.50 3.07
Asian Paints Ltd. 713.56 2.65ITC Ltd 427.63 1.59
Jindal Steel & Power Ltd. 826.21 3.07
Indraprastha Gas Limited 554.81 2.06GAIL (India) Ltd. 457.95 1.70
Bharat Heavy Electricals Ltd. 1238.51 4.60BGR Energy Systems Limited 678.67 2.52
Jain Irrigation Systems Ltd. 696.64 2.59Cummins India Ltd. 399.33 1.48
DB Corp Limited 419.74 1.56
Manappuram General Fin & Leasing Lt 370.29 1.37
Oil & Natural Gas Corporation Ltd. 1764.35 6.55
Reliance Industries Ltd. 1209.80 4.49Bharat Petroleum Corporation Ltd. 851.63 3.16Hindustan Petroleum Corporation Ltd. 779.37 2.89
Biocon Limited 771.32 2.86Cipla Ltd. 274.19 1.02
NTPC Ltd. 798.40 2.96
Pantaloon Retail (India) Ltd. 470.36 1.75
Infosys Technologies Ltd. 1180.59 4.38Mphasis Limited 794.54 2.95Educomp Solutions Ltd. 456.67 1.69Tata Consultancy Services Ltd. 330.44 1.23
Grand Total 26943.54 100.00
Auto Total 1834.49 6.81
Banks Total 5558.95 20.63
Cement Total 508.09 1.89
Construction Project Total 828.50 3.07
Consumer Non Durables Total 1141.19 4.24
Ferrous Metals Total 826.21 3.07
Gas Total 1012.76 3.76
Industrial Capital Goods Total 1917.18 7.12
Industrial Products Total 1095.97 4.07
Media & Entertainment Total 419.74 1.56
Miscellaneous Total 370.29 1.37
Oil Total 1764.35 6.55
Petroleum Products Total 2840.80 10.54
Pharmaceuticals Total 1045.50 3.88
Power Total 798.40 2.96
Retailing Total 470.36 1.75
Software Total 2762.23 10.25Others Total 333.85 1.24Call / Reverse Repo/ CBLO Total 780.11 2.90Net Current Asset 634.55 2.36
Fund features
Fund performance
Nature : EquityAverage AUM : Rs. 268.84 CroreFund Manager : Tridib PathakInvestment objective : The investment objective of the scheme is to seek to generate long term capital growth from a diversified portfolio of predominantly equity and equity related instruments.However there is no assurance that the investment objective of the scheme will be realized.Investment style : The Scheme seeks to achieve out performance through sector rotation, theme selection, market cap bias and bottom up stock picking.Ideal investment horizon : 3 years or moreEntry load : (Plan A & Plan B) : NilExit load: (Plan A & Plan B): All Investment including SIP/Micro SIP/STP/FOF if redeemed / switched out within 365 days from the date of allotment - 1%. No Exit Loads / CDSC will be chargeable in case of switches made between different options of the Scheme. (w.e.f. September 01, 2009)In case of Switches, Exit load shall be NIL for all switch transactions between equity schemes of IDFC Mutual Fund . (w.e.f. October 12, 2009.)Options available: Growth, Dividend. Reinvestment facility is available under the Dividend Option.Minimum investment amount ( Plan A & Plan B): Rs. 5,000 & in multiples of Re. 1 Additional investment amount : Re.1SIP (minimum amount) ( Plan A & Plan B): Rs. 1000 Inception Date (Plan A) : 9 August 2005Inception Date (Plan B) : 2 April 2009Statistical Measures : Beta 0.86R Square 0.95Standard deviation 8.42%Last 3 dividends (Rs./ unit) :22 August 2006 1.50 NAV 11.558028 May 2007 1.50 NAV 13.265922 Oct 2007 1.50 NAV 15.2703
NAV (Rs.):Growth (A) 20.1756 (B) 16.0415Dividend (A) 14.5987 (B) 12.9452Face value (Rs. / unit) : 10Asset allocation (equity / debt / cash) : 94.75% /2.90% /2.36%Fund manager’s commentRun as a well-diversified portfolio, the opportunity for the fund is to capture the breadth of the market across sectors, market capitalizations, styles and themes. The fund has reduced exposure to midcaps to around 20% and has maintained higher diversification across sectors.
Past performance may or may not be sustained in future.Benchmark : BSE 200
under the IDFC-CEF-Growth
IDFC-CEF - Growth BSE200
CAGR - Compounded Annualised Growth Rate
3 Month
(Absolute)
6 Month
(Absolute)Last 1 Year
CAGR Last 2 Years
CAGR Last 3 Years
CAGR Since Inception
CAGR
1.26% 2.56%
25.15%
11.11%
5.43%
15.42%
2.21% 3.11%
27.22%
16.93%
7.58%
18.31%
20.63%
10.54%10.25%
7.12%6.81%6.55%
4.61%4.24%4.07%3.76%3.07%3.07%
1.89%1.88%1.75%1.56%
2.96%
Banks
Petr
ole
um
P
roduct
s
Softw
are
Indust
rial
Ca
pita
l Goods
AutoOil
Ph
arm
ace
utic
als
Co
nsu
mer
Non
Dura
ble
s
Indust
rial
Pro
duct
s
Gas
Co
nst
ruct
ion
Pro
ject
Fe
rrous
Meta
ls
Pow
er
Cem
ent
Mis
cella
neous
Reta
iling
Media
&
En
tert
ain
ment
Since Inception 58000 77290 11.59% 14.91%Last 3 years 36000 43007 11.93% 17.12%Last 2 years 24000 31176 27.54% 36.10%Last 1 year 12000 12920 14.64% 18.55%
SIP Returns Period Investment Value Scheme Return Benchmark Return

3
IDFC Imperial Equity Fund(IDFC - IEF)An open-ended equity fund
Data as of 30 June 2010
Marketvalue in % of
Name Lac (Rs.) NAV
Mahindra & Mahindra Ltd. 2471.76 4.46Bajaj Auto Limited 1957.74 3.53
Bank of Baroda 2504.42 4.52ICICI Bank Ltd. 2479.02 4.47Union Bank of India 2382.64 4.30Axis Bank Limited 2136.93 3.85HDFC Bank Ltd. 1746.29 3.15
Grasim Industries Ltd. 1187.97 2.14
Nestle India Ltd. 1835.89 3.31ITC Ltd 1823.54 3.29
Jindal Steel & Power Ltd. 1786.07 3.22
Housing Development Finance Cor Ltd 1663.47 3.00
GAIL (India) Ltd. 1394.89 2.52
Bharat Heavy Electricals Ltd. 3812.54 6.88
Oil & Natural Gas Corporation Ltd. 3890.28 7.02
Reliance Industries Ltd. 3628.43 6.55Indian Oil Corporation Ltd. 1578.14 2.85Bharat Petroleum Corporation Ltd. 1093.54 1.97
Cipla Ltd. 1912.53 3.45Glaxosmithkline Pharmaceuticals Ltd. 1450.80 2.62Dr. Reddys Laboratories Ltd. 1066.67 1.92
NTPC Ltd. 1596.80 2.88
Infosys Technologies Ltd. 2201.12 3.97Tata Consultancy Services Ltd. 1573.35 2.84Mphasis Limited 1383.39 2.50
Grand Total 55435.33 100.00
Auto Total 4429.50 7.99
Banks Total 11249.30 20.29
Cement Total 1187.97 2.14
Consumer Non Durables Total 3659.42 6.60
Ferrous Metals Total 1786.07 3.22
Finance Total 1663.47 3.00
GAS Total 1394.89 2.52
Industrial Capital Goods Total 3812.54 6.88
Oil Total 3890.28 7.02
Petroleum Products Total 6300.10 11.36
Pharmaceuticals Total 4429.99 7.99
Power Total 1596.80 2.88
Software Total 5157.86 9.30Others Total 1303.77 2.35Money Market Instrument Total 993.69 1.79Call / Reverse Repo/ CBLO Total 1000.14 1.80Net Current Asset 1579.52 2.85
Fund features
Fund performance
Nature : EquityAverage AUM : Rs. 560.25 CroreFund Manager : Mr.Tridib Pathak (w.e.f.26 April 2010) Investment objective : The investment objective of the Scheme is to seek to generate capital appreciation and/or provide income distribution from a portfolio of predominantly equity and equity related instruments. There is no assurance or guarantee that the objectives of the scheme will be realized. Investment style : The Scheme seeks to invest predominantly in companies based on the potential value unlocking (subsidiary listing), strong growth in domestic demand and emerging sectors in the Indian economy. Ideal investment horizon : 3 years or moreEntry load : (Plan A & Plan B) : Nil Exit load: (Plan A & Plan B) : All Investment including SIP/Micro SIP/STP/FOF if redeemed / switched out within 365 days from the date of allotment - 1%. No Exit Loads / CDSC will be chargeable in case of switches made between different options of the Scheme. (w.e.f. September 01, 2009). In case of Switches, Exit load shall be NIL for all switch transactions between equity schemes of IDFC Mutual Fund . (w.e.f. October 12, 2009.)Options available: Growth, Dividend. Reinvestment facility is available under the Dividend Option.Minimum investment amount (Plan A & Plan B): Rs. 5,000 Additional investment amount : Re.1SIP (minimum amount) (Plan A & Plan B): Rs. 1,000 Inception Date (Plan A) : 16 March 2006Inception Date (Plan B) : 2 April 2009Statistical measures : Beta 0.89R Square 0.94Standard deviation 8.35%Last dividends (Rs./ unit) :8 June 2009 1.20 NAV 12.4523 Plan A15 June 2009 1.20 NAV 12.0942 Plan B14 May 2008 1.50 NAV 13.9431
NAV (Rs.):Growth (A) 18.5710 (B) 16.0030Dividend (A) 15.3513 (B) 14.7708Face value (Rs. / unit) : 10Asset allocation (equity / debt / cash / Derivative Option) : 93.55% / 3.60% / 2.85% / NilFund manager’s commentImperial fund is a diversified large cap biased fund. The portfolio construction has revolved around selecting well established companies which have high capital efficiency or are moving towards improving their capital efficiency further and are available at reasonable valuations.
Past performance may or may not be sustained in future.Benchmark : S&P CNX Nifty
under the IDFC-IEF-Growth
Portfolio
Asset Allocation
IDFC-IEF - Growth S&P CNX Nifty
CAGR - Compounded Annualised Growth Rate
Rating & Rankings
Value Research Ranking
Past performance is no guarantee of future results.For Methodology of Ranking Please refer Page No. 41.
3 Month (Absolute)
6 Month (Absolute)
Since Inception CAGR
Last 3 Years CAGR
Last 1 Year CAGR
Morningstar Rating
Last 2 Years CAGR
1.78%
4.56%
24.32%
20.13%
13.24%15.51%
1.21% 2.14%
23.80%
14.66%
7.14%
12.32%
21.21%
11.36%10.17%
7.99%7.99%7.02%6.88%6.60%
3.22%3.00%2.88%2.52%
0.57%2.14%
Banks
Petr
ole
um
Pro
duct
s
Softw
are
Pharm
ace
utic
als
AutoOil
Indust
rial C
apita
lG
oods
Consu
mer
Non
Dura
ble
s
Ferr
ous
Meta
ls
Fin
ance
Pow
er
Gas
Cem
ent
Mis
cella
neous
Since Inception 51000 72356 16.29% 12.57%Last 3 years 36000 46696 17.69% 14.41%Last 2 years 24000 32052 30.73% 30.09%Last 1 year 12000 13032 16.47% 15.87%
SIP Returns Period Investment Value Scheme Return Benchmark Return
4
IDFC Nifty Fund(IDFC - NF)An Open-Ended Index Linked Equity Scheme
Data as of 30 June 2010
Portfolio
Asset Allocation
Marketvalue in % of
Name Lac (Rs.) NAV
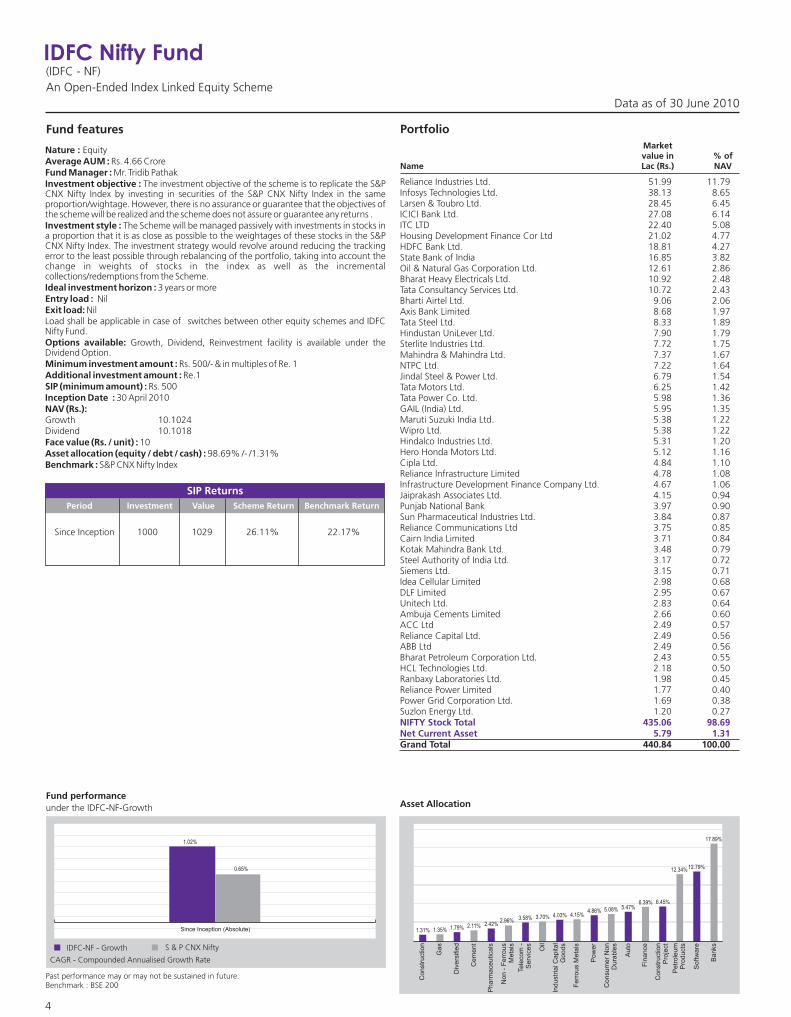
Reliance Industries Ltd. 51.99 11.79Infosys Technologies Ltd. 38.13 8.65Larsen & Toubro Ltd. 28.45 6.45ICICI Bank Ltd. 27.08 6.14ITC LTD 22.40 5.08Housing Development Finance Cor Ltd 21.02 4.77HDFC Bank Ltd. 18.81 4.27State Bank of India 16.85 3.82Oil & Natural Gas Corporation Ltd. 12.61 2.86Bharat Heavy Electricals Ltd. 10.92 2.48Tata Consultancy Services Ltd. 10.72 2.43Bharti Airtel Ltd. 9.06 2.06Axis Bank Limited 8.68 1.97Tata Steel Ltd. 8.33 1.89Hindustan UniLever Ltd. 7.90 1.79Sterlite Industries Ltd. 7.72 1.75Mahindra & Mahindra Ltd. 7.37 1.67NTPC Ltd. 7.22 1.64Jindal Steel & Power Ltd. 6.79 1.54Tata Motors Ltd. 6.25 1.42Tata Power Co. Ltd. 5.98 1.36GAIL (India) Ltd. 5.95 1.35Maruti Suzuki India Ltd. 5.38 1.22Wipro Ltd. 5.38 1.22Hindalco Industries Ltd. 5.31 1.20Hero Honda Motors Ltd. 5.12 1.16Cipla Ltd. 4.84 1.10Reliance Infrastructure Limited 4.78 1.08Infrastructure Development Finance Company Ltd. 4.67 1.06Jaiprakash Associates Ltd. 4.15 0.94Punjab National Bank 3.97 0.90Sun Pharmaceutical Industries Ltd. 3.84 0.87Reliance Communications Ltd 3.75 0.85Cairn India Limited 3.71 0.84Kotak Mahindra Bank Ltd. 3.48 0.79Steel Authority of India Ltd. 3.17 0.72Siemens Ltd. 3.15 0.71Idea Cellular Limited 2.98 0.68DLF Limited 2.95 0.67Unitech Ltd. 2.83 0.64Ambuja Cements Limited 2.66 0.60ACC Ltd 2.49 0.57Reliance Capital Ltd. 2.49 0.56ABB Ltd 2.49 0.56Bharat Petroleum Corporation Ltd. 2.43 0.55HCL Technologies Ltd. 2.18 0.50Ranbaxy Laboratories Ltd. 1.98 0.45Reliance Power Limited 1.77 0.40Power Grid Corporation Ltd. 1.69 0.38Suzlon Energy Ltd. 1.20 0.27
Grand Total 440.84 100.00
NIFTY Stock Total 435.06 98.69Net Current Asset 5.79 1.31
Fund features
Fund performance
Nature : EquityAverage AUM : Rs. 4.66 CroreFund Manager : Mr. Tridib PathakInvestment objective : The investment objective of the scheme is to replicate the S&P CNX Nifty Index by investing in securities of the S&P CNX Nifty Index in the same proportion/wightage. However, there is no assurance or guarantee that the objectives of the scheme will be realized and the scheme does not assure or guarantee any returns .Investment style : The Scheme will be managed passively with investments in stocks in a proportion that it is as close as possible to the weightages of these stocks in the S&P CNX Nifty Index. The investment strategy would revolve around reducing the tracking error to the least possible through rebalancing of the portfolio, taking into account the change in weights of stocks in the index as well as the incremental collections/redemptions from the Scheme.Ideal investment horizon : 3 years or moreEntry load : Nil Exit load: Nil Load shall be applicable in case of switches between other equity schemes and IDFC Nifty Fund.Options available: Growth, Dividend, Reinvestment facility is available under the Dividend Option.Minimum investment amount : Rs. 500/- & in multiples of Re. 1 Additional investment amount : Re.1SIP (minimum amount) : Rs. 500 Inception Date : 30 April 2010NAV (Rs.):Growth 10.1024Dividend 10.1018Face value (Rs. / unit) : 10Asset allocation (equity / debt / cash) : 98.69% /- /1.31%Benchmark : S&P CNX Nifty Index
Past performance may or may not be sustained in future.Benchmark : BSE 200
under the IDFC-NF-Growth
IDFC-NF - Growth S & P CNX Nifty
CAGR - Compounded Annualised Growth Rate
1.02%
0.65%
Since Inception (Absolute)
17.89%
12.79%12.34%
6.45%6.39%5.47%5.08%4.86%
4.15%4.03%3.70%3.58%2.42%2.11%1.79%1.35%1.31%
2.96%
Banks
Softw
are
Petr
ole
um
Pro
duct
s
Const
ruct
ion
Pro
ject
Fin
ance
Auto
Co
nsu
mer
Non
Dura
ble
s
Pow
er
Fe
rrous
Meta
ls
Ind
ust
rial C
apita
lG
oods
Oil
Tele
com
-S
erv
ices
No
n -
Ferr
ous
Meta
ls
Ph
arm
ace
utic
als
Cem
ent
Div
ers
ified
Gas
Const
ruct
ion
Since Inception 1000 1029 26.11% 22.17%
SIP Returns Period Investment Value Scheme Return Benchmark Return
5
IDFC Premier Equity Fund(IDFC - PEF)An open-ended equity fund
Data as of 30 June 2010
Best mid-cap and small - cap fund award
Asset Allocation
Marketvalue in % of
Name Lac (Rs.) NAV
Motherson Sumi Systems Ltd. 4656.00 3.01
Bajaj Electricals Limited 6637.23 4.28
Asian Paints Ltd. 7685.57 4.96GlaxoSmithkline Consumer Healthcare Ltd. 6847.68 4.42United Spirits Ltd. 5104.73 3.29Emami Limited 4537.28 2.93Shree Renuka Sugars Ltd 4342.40 2.80Ruchi Soya Industries Limited 4266.00 2.75Bata India Ltd. 3672.88 2.37Kaveri Seed Company Limited 3298.43 2.13Globus Spirits Ltd 3100.42 2.00Procter & Gamble Hygiene & Health Care Ltd. 3012.30 1.94Lakshmi Energy and Foods Ltd 2691.08 1.74Karuturi Global Limited 1801.70 1.16
Coromandel International Ltd. 7983.64 5.15
Shriram Transport Finance Co Ltd. 8039.91 5.19
Petronet LNG Ltd 3793.20 2.45Deep Industries Limited 1770.64 1.14
Indian Hotels Co. Ltd. 3671.50 2.37
Pipavav Shipyard Limited 2479.99 1.60
Sun TV Network Limited 6338.73 4.09
PTC India Limited 2886.50 1.86Torrent Power Limited 2850.37 1.84Kalpataru Power Transmission Ltd 1959.24 1.26
Pantaloon Retail (India) Ltd. 5013.86 3.24
Eclerx Services Limited 2693.00 1.74
Onmobile Global Limited 1552.10 1.00
Page Industries Limited 4741.75 3.06
IRB Infrastructure Developers Ltd 6417.60 4.14Spicejet Limited 4580.48 2.96Blue Dart Express Ltd. 4060.88 2.62Cox and Kings India Limited 3289.85 2.12
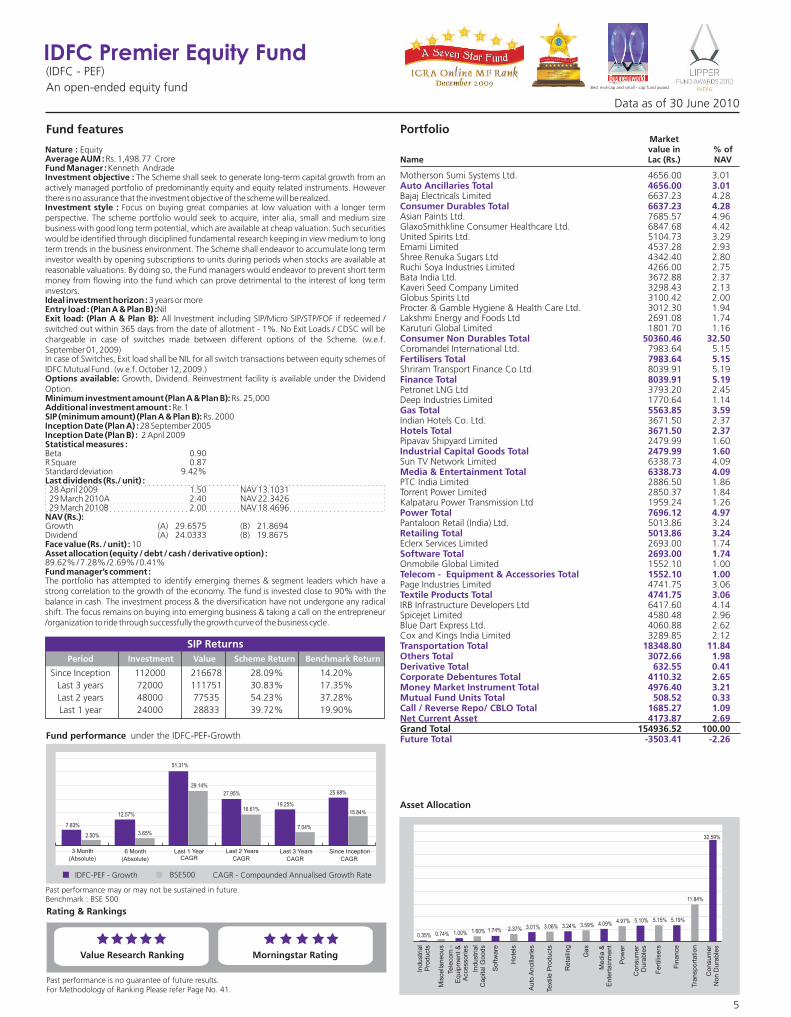
Grand Total 154936.52 100.00
Auto Ancillaries Total 4656.00 3.01
Consumer Durables Total 6637.23 4.28
Consumer Non Durables Total 50360.46 32.50
Fertilisers Total 7983.64 5.15
Finance Total 8039.91 5.19
Gas Total 5563.85 3.59
Hotels Total 3671.50 2.37
Industrial Capital Goods Total 2479.99 1.60
Media & Entertainment Total 6338.73 4.09
Power Total 7696.12 4.97
Retailing Total 5013.86 3.24
Software Total 2693.00 1.74
Telecom - Equipment & Accessories Total 1552.10 1.00
Textile Products Total 4741.75 3.06
Transportation Total 18348.80 11.84Others Total 3072.66 1.98Derivative Total 632.55 0.41Corporate Debentures Total 4110.32 2.65Money Market Instrument Total 4976.40 3.21Mutual Fund Units Total 508.52 0.33Call / Reverse Repo/ CBLO Total 1685.27 1.09Net Current Asset 4173.87 2.69
Future Total -3503.41 -2.26
Fund features
Fund performance
Nature : EquityAverage AUM : Rs. 1,498.77 CroreFund Manager : Kenneth AndradeInvestment objective : The Scheme shall seek to generate long-term capital growth from an actively managed portfolio of predominantly equity and equity related instruments. However there is no assurance that the investment objective of the scheme will be realized.Investment style : Focus on buying great companies at low valuation with a longer term perspective. The scheme portfolio would seek to acquire, inter alia, small and medium size business with good long term potential, which are available at cheap valuation. Such securities would be identified through disciplined fundamental research keeping in view medium to long term trends in the business environment. The Scheme shall endeavor to accumulate long term investor wealth by opening subscriptions to units during periods when stocks are available at reasonable valuations. By doing so, the Fund managers would endeavor to prevent short term money from flowing into the fund which can prove detrimental to the interest of long term investors.Ideal investment horizon : 3 years or moreEntry load : (Plan A & Plan B) :Nil Exit load: (Plan A & Plan B): All Investment including SIP/Micro SIP/STP/FOF if redeemed / switched out within 365 days from the date of allotment - 1%. No Exit Loads / CDSC will be chargeable in case of switches made between different options of the Scheme. (w.e.f. September 01, 2009)In case of Switches, Exit load shall be NIL for all switch transactions between equity schemes of IDFC Mutual Fund . (w.e.f. October 12, 2009.)Options available: Growth, Dividend. Reinvestment facility is available under the Dividend Option.Minimum investment amount (Plan A & Plan B): Rs. 25,000Additional investment amount : Re.1SIP (minimum amount) (Plan A & Plan B): Rs. 2000 Inception Date (Plan A) : 28 September 2005Inception Date (Plan B) : 2 April 2009Statistical measures : Beta 0.90R Square 0.87Standard deviation 9.42%Last dividends (Rs./ unit) : 28 April 2009 1.50 NAV 13.103129 March 2010A 2.40 NAV 22.342629 March 2010B 2.00 NAV 18.4696
NAV (Rs.):Growth (A) 29.6575 (B) 21.8694Dividend (A) 24.0333 (B) 19.8675Face value (Rs. / unit) : 10Asset allocation (equity / debt / cash / derivative option) : 89.62% / 7.28% /2.69% / 0.41%Fund manager’s comment :The portfolio has attempted to identify emerging themes & segment leaders which have a strong correlation to the growth of the economy. The fund is invested close to 90% with the balance in cash. The investment process & the diversification have not undergone any radical shift. The focus remains on buying into emerging business & taking a call on the entrepreneur /organization to ride through successfully the growth curve of the business cycle.
Past performance may or may not be sustained in future.Benchmark : BSE 500
under the IDFC-PEF-Growth
Portfolio
IDFC-PEF - Growth BSE500 CAGR - Compounded Annualised Growth Rate
3 Month
(Absolute)6 Month
(Absolute)
Last 1 Year CAGR
Last 2 Years
CAGR Last 3 Years
CAGR
Since Inception
CAGR
Rating & Rankings
Value Research Ranking
Past performance is no guarantee of future results.For Methodology of Ranking Please refer Page No. 41.
Morningstar Rating
7.83%
12.57%
51.31%
27.95%
19.25%
25.68%
2.50% 3.65%
29.14%
16.61%
7.04%
15.84%
32.59%
11.84%
5.19%5.15%5.10%4.97%4.09%3.59%3.24%3.06%3.01%2.37%1.60%1.00%0.74%0.35%1.74%
Consu
mer
No
n D
ura
ble
s
Tra
nsp
ort
atio
n
Fin
ance
Fert
ilise
rs
Consu
mer
Dura
ble
s
Pow
er
Media
& E
nte
rtain
ment
Gas
Reta
iling
Text
ile P
roduct
s
Au
to A
nci
llaries
Hote
ls
Softw
are
Indust
rial
Ca
pita
l Goods
Tele
com
-
Eq
uip
ment &
A
ccess
ories
Mis
cella
neous
Indust
rial
Pro
duct
s
Since Inception 112000 216678 28.09% 14.20%Last 3 years 72000 111751 30.83% 17.35%Last 2 years 48000 77535 54.23% 37.28%Last 1 year 24000 28833 39.72% 19.90%
SIP Returns Period Investment Value Scheme Return Benchmark Return
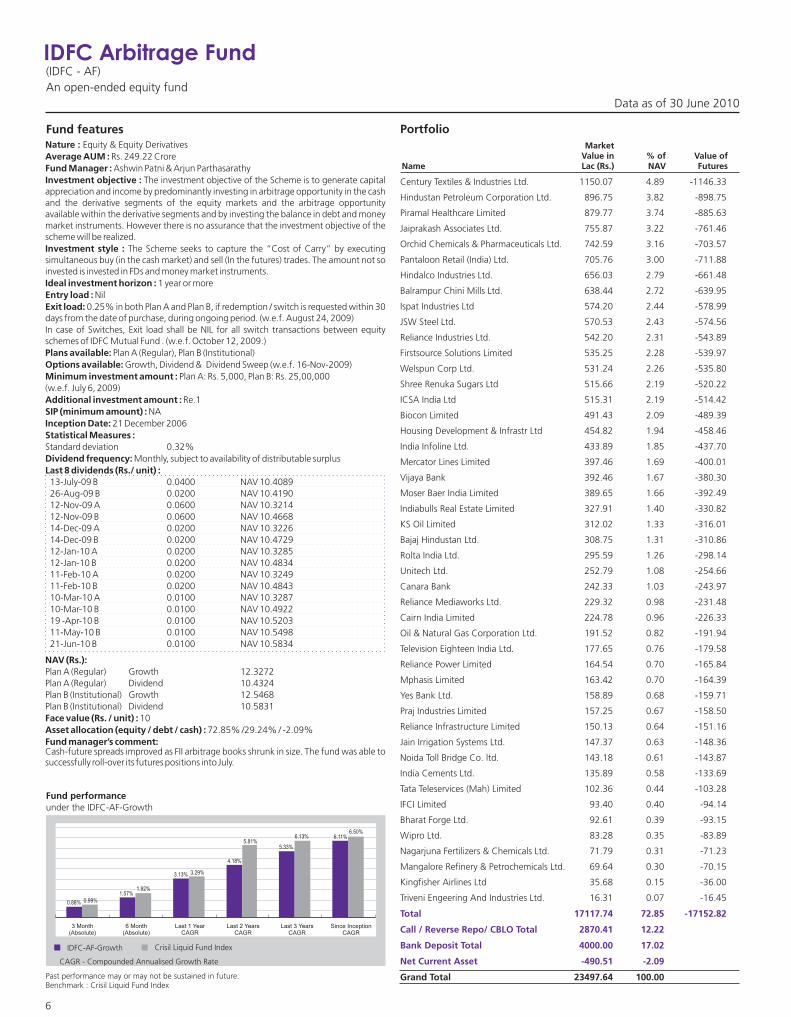
MarketValue in % of Value of
Name Lac (Rs.) NAV Futures
Century Textiles & Industries Ltd. 1150.07 4.89 -1146.33
Hindustan Petroleum Corporation Ltd. 896.75 3.82 -898.75
Piramal Healthcare Limited 879.77 3.74 -885.63
Jaiprakash Associates Ltd. 755.87 3.22 -761.46
Orchid Chemicals & Pharmaceuticals Ltd. 742.59 3.16 -703.57
Pantaloon Retail (India) Ltd. 705.76 3.00 -711.88
Hindalco Industries Ltd. 656.03 2.79 -661.48
Balrampur Chini Mills Ltd. 638.44 2.72 -639.95
Ispat Industries Ltd 574.20 2.44 -578.99
JSW Steel Ltd. 570.53 2.43 -574.56
Reliance Industries Ltd. 542.20 2.31 -543.89
Firstsource Solutions Limited 535.25 2.28 -539.97
Welspun Corp Ltd. 531.24 2.26 -535.80
Shree Renuka Sugars Ltd 515.66 2.19 -520.22
ICSA India Ltd 515.31 2.19 -514.42
Biocon Limited 491.43 2.09 -489.39
Housing Development & Infrastr Ltd 454.82 1.94 -458.46
India Infoline Ltd. 433.89 1.85 -437.70
Mercator Lines Limited 397.46 1.69 -400.01
Vijaya Bank 392.46 1.67 -380.30
Moser Baer India Limited 389.65 1.66 -392.49
Indiabulls Real Estate Limited 327.91 1.40 -330.82
KS Oil Limited 312.02 1.33 -316.01
Bajaj Hindustan Ltd. 308.75 1.31 -310.86
Rolta India Ltd. 295.59 1.26 -298.14
Unitech Ltd. 252.79 1.08 -254.66
Canara Bank 242.33 1.03 -243.97
Reliance Mediaworks Ltd. 229.32 0.98 -231.48
Cairn India Limited 224.78 0.96 -226.33
Oil & Natural Gas Corporation Ltd. 191.52 0.82 -191.94
Television Eighteen India Ltd. 177.65 0.76 -179.58
Reliance Power Limited 164.54 0.70 -165.84
Mphasis Limited 163.42 0.70 -164.39
Yes Bank Ltd. 158.89 0.68 -159.71
Praj Industries Limited 157.25 0.67 -158.50
Reliance Infrastructure Limited 150.13 0.64 -151.16
Jain Irrigation Systems Ltd. 147.37 0.63 -148.36
Noida Toll Bridge Co. ltd. 143.18 0.61 -143.87
India Cements Ltd. 135.89 0.58 -133.69
Tata Teleservices (Mah) Limited 102.36 0.44 -103.28
IFCI Limited 93.40 0.40 -94.14
Bharat Forge Ltd. 92.61 0.39 -93.15
Wipro Ltd. 83.28 0.35 -83.89
Nagarjuna Fertilizers & Chemicals Ltd. 71.79 0.31 -71.23
Mangalore Refinery & Petrochemicals Ltd. 69.64 0.30 -70.15
Kingfisher Airlines Ltd 35.68 0.15 -36.00
Triveni Engeering And Industries Ltd. 16.31 0.07 -16.45
Grand Total 23497.64 100.00
Total 17117.74 72.85 -17152.82
Call / Reverse Repo/ CBLO Total 2870.41 12.22
Bank Deposit Total 4000.00 17.02
Net Current Asset -490.51 -2.09
IDFC Arbitrage Fund(IDFC - AF)An open-ended equity fund
Fund features Portfolio
Data as of 30 June 2010
6
Fund performance
Past performance may or may not be sustained in future.Benchmark : Crisil Liquid Fund Index
under the IDFC-AF-Growth
Nature : Equity & Equity DerivativesAverage AUM : Rs. 249.22 CroreFund Manager : Ashwin Patni & Arjun ParthasarathyInvestment objective : The investment objective of the Scheme is to generate capital appreciation and income by predominantly investing in arbitrage opportunity in the cash and the derivative segments of the equity markets and the arbitrage opportunity available within the derivative segments and by investing the balance in debt and money market instruments. However there is no assurance that the investment objective of the scheme will be realized. Investment style : The Scheme seeks to capture the “Cost of Carry” by executing simultaneous buy (in the cash market) and sell (In the futures) trades. The amount not so invested is invested in FDs and money market instruments.Ideal investment horizon : 1 year or moreEntry load : Nil Exit load: 0.25% in both Plan A and Plan B, if redemption / switch is requested within 30 days from the date of purchase, during ongoing period. (w.e.f. August 24, 2009)In case of Switches, Exit load shall be NIL for all switch transactions between equity schemes of IDFC Mutual Fund . (w.e.f. October 12, 2009.)Plans available: Plan A (Regular), Plan B (Institutional)Options available: Growth, Dividend & Dividend Sweep (w.e.f. 16-Nov-2009)Minimum investment amount : Plan A: Rs. 5,000, Plan B: Rs. 25,00,000 (w.e.f. July 6, 2009)Additional investment amount : Re.1SIP (minimum amount) : NAInception Date: 21 December 2006Statistical Measures : Standard deviation 0.32%Dividend frequency: Monthly, subject to availability of distributable surplusLast 8 dividends (Rs./ unit) :13-July-09 B 0.0400 NAV 10.408926-Aug-09 B 0.0200 NAV 10.419012-Nov-09 A 0.0600 NAV 10.321412-Nov-09 B 0.0600 NAV 10.466814-Dec-09 A 0.0200 NAV 10.322614-Dec-09 B 0.0200 NAV 10.472912-Jan-10 A 0.0200 NAV 10.328512-Jan-10 B 0.0200 NAV 10.483411-Feb-10 A 0.0200 NAV 10.324911-Feb-10 B 0.0200 NAV 10.484310-Mar-10 A 0.0100 NAV 10.328710-Mar-10 B 0.0100 NAV 10.492219 -Apr-10 B 0.0100 NAV 10.520311-May-10 B 0.0100 NAV 10.549821-Jun-10 B 0.0100 NAV 10.5834
NAV (Rs.):Plan A (Regular) Growth 12.3272Plan A (Regular) Dividend 10.4324Plan B (Institutional) Growth 12.5468Plan B (Institutional) Dividend 10.5831Face value (Rs. / unit) : 10Asset allocation (equity / debt / cash) : 72.85% /29.24% / -2.09%Fund manager’s comment:Cash-future spreads improved as FII arbitrage books shrunk in size. The fund was able to successfully roll-over its futures positions into July.
IDFC-AF-Growth Crisil Liquid Fund Index
CAGR - Compounded Annualised Growth Rate
3 Month (Absolute)
6 Month (Absolute)
Last 1 Year CAGR
Last 2 Years CAGR
Since Inception CAGR
Last 3 Years CAGR
0.88%
1.57%
3.13%
4.18%
5.33%
6.11%
0.99%
1.92%
3.29%
5.81%6.13%
6.50%

7
IDFC Enterprise Equity Fund(IDFC - EEF)An Open Ended Equity Scheme.
Data as of 30 June 2010
Asset Allocation
Marketvalue in % of
Name Lac (Rs.) NAV
Reliance Industries Ltd. 6894.97 11.38Infosys Technologies Ltd. 4992.51 8.24Larsen & Toubro Ltd. 3626.66 5.98ICICI Bank Ltd. 3567.13 5.89ITC LTD 2943.76 4.86Housing Development Finance Cor Ltd 2766.22 4.56HDFC Bank Ltd. 2477.51 4.09State Bank of India 2203.96 3.64Oil & Natural Gas Corporation Ltd. 1655.32 2.73Bharat Heavy Electricals Ltd. 1444.14 2.38Tata Consultancy Services Ltd. 1401.53 2.31Bharti Airtel Ltd. 1192.53 1.97Axis Bank Limited 1138.50 1.88Tata Steel Ltd. 1102.13 1.82Hindustan UniLever Ltd. 1040.45 1.72Sterlite Industries Ltd. 1018.25 1.68Mahindra & Mahindra Ltd. 977.99 1.61Jindal Steel & Power Ltd. 894.97 1.48Tata Power Co. Ltd. 795.44 1.31GAIL (India) Ltd. 780.00 1.29Tata Motors Ltd. 775.62 1.28Wipro Ltd. 709.78 1.17Maruti Suzuki India Ltd. 699.82 1.15Hindalco Industries Ltd. 697.79 1.15Hero Honda Motors Ltd. 684.52 1.13Cipla Ltd. 638.22 1.05Reliance Infrastructure Limited 626.33 1.03NTPC Ltd. 621.05 1.02Infrastructure Development Finance Company Ltd. 620.13 1.02Jaiprakash Associates Ltd. 547.28 0.90Punjab National Bank 518.60 0.86Sun Pharmaceutical Industries Ltd. 498.47 0.82Reliance Communications Ltd 494.24 0.82Cairn India Limited 485.50 0.80Kotak Mahindra Bank Ltd. 460.66 0.76Steel Authority of India Ltd. 419.37 0.69Siemens Ltd. 413.66 0.68DLF Limited 388.70 0.64Idea Cellular Limited 384.34 0.63Unitech Ltd. 370.58 0.61Ambuja Cements Limited 348.46 0.57ACC Ltd 329.55 0.54ABB Ltd 325.43 0.54Reliance Capital Ltd. 323.99 0.53Bharat Petroleum Corporation Ltd. 318.18 0.53HCL Technologies Ltd. 286.68 0.47Ranbaxy Laboratories Ltd. 259.52 0.43Reliance Power Limited 232.33 0.38Power Grid Corporation Ltd. 222.00 0.37Suzlon Energy Ltd. 157.15 0.26
Grand Total 60602.59 100.00
Nifty Stock Total 56771.92 93.68Derivative Total 126.51 0.21Corporate Debentures Total 413.88 0.68Money Market Instrument Total 2483.71 4.10Call / Reverse Repo/ CBLO Total 660.09 1.09Net Current Asset 146.47 0.24
Future Total 3846.31 6.35
Fund features
Fund performance
Nature : EquityAverage AUM : Rs. 602.54 CroreFund Manager : Kenneth Andrade.Investment objective : The investment objective of the scheme is to seek to generate capital growth from a portfolio of predominantly equity and equity related instruments(Including Equity derivatives). The scheme may also invest in debt and money market instruments to generate reasonable income. However there is no assurance that the investment objective of the scheme will be realized.Investment Strategy (in brief): The term ‘Enterprise’ connotes activity, venture, project or an endeavour. The Scheme intends to invest in companies which are involved in or are in the process of setting up various business activites, ventures, projects or other commercial endeavours. The Scheme would invest in equities in the IPOs’ subsequent public offers or in the secondary market, other equity related instruments (including derivatives), benefit out of the cash and derivative markets arbitrage, opportunity and invest the residual sums in debt and money market instruments. For details please refer to the Offer document.The scheme will endeavour to generate capital appreciation through investing in equities by interalia adopting the mode of applying IPOs or subsequent public offering made by companies, if well-priced IPOs are not available the funds collected will be invested in other investment avenues such as index, cash futures arbitrage. Nifty spot futures arbitrage etc. as per the investment strategy of the scheme.The Scheme will endeavour to generate capital appreciation through investing in equities and equity related instruments by inter alia adopting the mode of applying for Initial Public Offerings (IPOs) or subsequent public offerings made by companies. The Scheme envisages to generate reasonable returns by investing in such equities. The balance equity allocations by the fund will be closely in line with Nifty. However the fund will seek to take on some deviation from Nifty by making smaller allocations to a range of arbitrage strategies in the equity and derivative markets.Investment style : The Scheme endeavours to generate capital appreciation through investing in equities by inter alia adopting the mode of applying for IPOs or subsequent public offering made by companies. If well priced IPOs are not available the funds collected may be invested in the index, hence generating market return from the index and the alpha from the premium on listing of IPOs.Entry load : (Plan A & Plan B) : Nil Exit load: (Plan A & Plan B) : All Investment including SIP/Micro SIP/STP/FOF if redeemed / switched out within 365 days from the date of allotment - 1%. No Exit Loads / CDSC will be chargeable in case of switches made between different options of the Scheme. (w.e.f. September 01, 2009)In case of Switches, Exit load shall be NIL for all switch transactions between equity schemes of IDFC Mutual Fund . (w.e.f. October 12, 2009.)Options available: Growth, DividendMinimum investment amount (Plan A & Plan B): Rs. 5,000 (w.e.f. July 6, 2009)Additional investment amount : Re.1SIP (minimum amount) (Plan A & Plan B): Rs. 1000 (w.e.f. July 6, 2009)Inception Date (Plan A) : 9 June 2006Inception Date(Plan B) : 6 July 2009Statistical Measures : Beta (BSE 200) 0.85R Square (BSE 200) 0.89Beta (Nifty) 0.90Rsquare (Nifty) 0.92Standard deviation 4.10%Last 3 dividends (Rs./ unit) :
28 July 2009 1.00 NAV 10.753014 May 2008 1.50 NAV 13.0106
NAV (Rs.):Growth (A) 15.0891 (B) 12.4034Dividend (A) 12.3755 (B) 10.4122Face value (Rs. / unit) : 10Asset allocation (equity / debt / cash / derivative option) : 93.68% /5.87% /0.24% / 0.21%Fund manager’s comment : The fund is currently invested in the Nifty stocks. The fund aims to generate alpha by participating in primary market issuances. As a strategy, Enterprise follows a 100% invested philosophy. We have activated our participation in primary issuances which is of recent origin.
Past performance may or my not be sustained in future. Benchmark : S&P CNX Nifty
under the IDFC-EEF-Growth
Portfolio
IDFC-EEF - Growth S&P CNX Nifty CAGR - Compounded Annualised Growth Rate
3 Month (Absolute)
6 Month (Absolute)
Last 1 Year CAGR
Since Inception CAGR
Last 3 Years CAGR
Last 2 Year CAGR
1.47% 2.32%
22.24%
13.36%
6.63%
10.66%
1.21% 2.14%
23.80%
14.66%
7.58%
16.41%
17.11%
12.20%11.90%
6.12%5.98%5.18%4.86%
4.12%3.99%3.86%3.53%3.42%2.30%2.02%1.72%
1.29%1.25%
2.83%
Banks
Softw
are
Petr
ole
um
Pro
duct
s
Fin
ance
Co
nst
ruct
ion
Pro
ject
Auto
Co
nsu
mer
Non
Dura
ble
s
Pow
er
Fe
rrous
Meta
ls
Ind
ust
rial C
apita
lG
oods
Oil
Tele
com
- S
erv
ices
No
n -
Ferr
ous
Meta
ls
Ph
arm
ace
utic
als
Cem
ent
Div
ers
ified
Gas
Co
nst
ruct
ion
Since Inception 48000 60743 11.49% 12.97%Last 3 years 36000 44002 13.56% 14.37%Last 2 years 24000 31523 28.91% 29.91%Last 1 year 12000 12983 15.67% 15.87%
SIP Returns Period Investment Value Scheme Return Benchmark Return

Asset Allocation
Marketvalue in % of
Name Lac (Rs.) NAV
Mahindra & Mahindra Ltd. 250.94 3.98Hero Honda Motors Ltd. 204.86 3.25
Axis Bank Limited 372.72 5.92Union Bank of India 311.05 4.94ICICI Bank Ltd. 215.43 3.42Allahabad Bank 202.81 3.22Vijaya Bank 161.38 2.56
IVRCL Infrastructures & Projects Ltd. 187.85 2.98Phoenix Mills Limited 65.48 1.04
Larsen & Toubro Ltd. 361.79 5.74
Emami Limited 273.70 4.35
Tata Steel Ltd. 242.83 3.86Jindal Steel & Power Ltd. 156.13 2.48
Rural Electrification Corp Ltd 182.73 2.90
Bharat Heavy Electricals Ltd. 307.46 4.88
Sun TV Network Limited 174.80 2.78
Reliance Industries Ltd. 326.96 5.19Bharat Petroleum Corporation Ltd. 132.55 2.10
Dr. Reddys Laboratories Ltd. 232.20 3.69IPCA Laboratories Limited 218.93 3.48Unichem Laboratories Limited 121.20 1.92
NTPC Ltd. 149.70 2.38
Infosys Technologies Ltd. 307.01 4.87Mphasis Limited 225.40 3.58HCL Technologies Ltd. 218.49 3.47
Idea Cellular Limited 148.38 2.36Bharti Airtel Ltd. 105.12 1.67
Grand Total 6298.89 100.00
Auto Total 455.80 7.24
Banks Total 1263.38 20.06
Construction Total 253.33 4.02
Construction Project Total 361.79 5.74
Consumer Non Durables Total 273.70 4.35
Ferrous Metals Total 398.95 6.33
Finance Total 182.73 2.90
Industrial Capital Goods Total 307.46 4.88
Media & Entertainment Total 174.80 2.78
Petroleum Products Total 459.51 7.30
Pharmaceuticals Total 572.33 9.09
Power Total 149.70 2.38
Software Total 750.90 11.92
Telecom Services Total 253.50 4.02Others Total 9.82 0.16Net Current Asset 431.21 6.85
IDFC Tax Saver (ELSS) Fund(IDFC - TS[ELSS])A 10 year closed ended Equity Linked Saving Scheme
Fund features
Fund performance
Nature : EquityAverage AUM : Rs. 63.42 CroreFund Manager : Kenneth Andrade ( w.e.f. 21 July, 2009)Investment objective : The investment objective of the Scheme is to seek to generate long term capital growth from a diversified portfolio of predominantly equity and equity related instruments.There can be no assurance that the investment objective of the scheme will be realised.Investment style : The Scheme will invest in well- managed growth companies that are available at reasonable value. Companies would be identified through a systematic process of forecasting earnings based on a deep understanding of the industry growth potential and interaction with company management .
Exit load : Nil (w.e.f. 4th September, 2009)Options available: Growth, DividendMinimum investment amount : Rs. 500Additional investment amount : Re.500Inception Date: 15 March 2007Statistical Measures : Beta 0.81R Square 0.91Standard deviation 9.09%Dividends frequency : NANAV (Rs.):Growth 13.8491Dividend 13.8488Face value (Rs. / unit) : 10Asset allocation (equity / debt / cash) : 93.15% /- / 6.85%Fund manager’s commentThe focus is to invest in long term growth stocks at reasonable price. The portfolio is an diverse mix of companies across sectors and is agnostic to capitalization bias. Given the plethora of opportunities which is there in domestic economy, the fund seeks to invest in companies with strong track record of execution, high operating leverage and reasonable valuations.
Entry load : Nil
Past performance may or may not be sustained in future.Benchmark : BSE 200
under the IDFC-TS(ELSS)-Growth
Portfolio
IDFC-TS(ELSS) - Growth BSE200
CAGR - Compounded Annualised Growth Rate
3 Month(Absolute)
6 Month (Absolute)
Last 1 Year CAGR
Since Inception CAGR
Last 2 Year CAGR
Last 3 Year CAGR
Data as of 30 June 2010
8
20.06%
11.92%
9.09%
7.30%7.24%6.33%
5.74%4.88%
4.35%4.02%4.02%2.90%
2.38%
0.16%0.00%
2.78%
Banks
Softw
are
Ph
arm
ace
utic
als
Petr
ole
um
P
roduct
s
Auto
Fe
rrous
Meta
ls
Const
ruct
ion
Pro
ject
Ind
ust
rial C
apita
l G
oods
Co
nsu
mer
Non
Dura
ble
s
Tele
com
-
Serv
ices
Co
nst
ruct
ion
Fin
ance
Media
&
En
tert
ain
ment
Pow
er
Fert
ilise
rs
Mis
cella
neous
2.86%6.56%
38.04%
14.98%
8.09%10.38%
2.21% 3.11%
27.22%
16.93%
7.58%
13.14%

MarketValue in % of Value of
Name Lac (Rs.) NAV Futures
Piramal Healthcare Limited 331.72 2.52 -333.93
IFCI Limited 323.48 2.45 -326.03
Century Textiles & Industries Ltd. 311.14 2.36 -310.13
India Infoline Ltd. 292.49 2.22 -295.05
Jindal Steel & Power Ltd. 290.39 2.20 -292.35
Tata Teleservices (Mah) Limited 280.98 2.13 -283.50
Vijaya Bank 263.36 2.00 -255.20
Welspun Corp Ltd. 239.99 1.82 -242.05
IDBI Bank Ltd 238.30 1.81 -234.20
Triveni Engeering and Industries Ltd. 228.37 1.73 -230.27
Pantaloon Retail (India) Ltd. 224.18 1.70 -226.13
Yes Bank Ltd. 223.52 1.70 -224.68
ICSA India Ltd 211.34 1.60 -210.97
Noida Toll Bridge Co. Ltd. 205.98 1.56 -206.97
Hindustan Petroleum Corporation Ltd. 131.46 1.00 -131.75
Mercator Lines Limited 121.29 0.92 -122.07
Moser Baer India Limited 115.25 0.87 -116.09
Housing Development & Infrastr Ltd 99.96 0.76 -100.76
Ranbaxy Laboratories Ltd. 89.78 0.68 -90.38
Kingfisher Airlines Ltd 81.26 0.62 -82.00
Reliance Communications Ltd 63.46 0.48 -63.92
Bharat Petroleum Corporation Ltd. 33.14 0.25 -33.28
Ashok Leyland Ltd. 30.55 0.23 -30.14
Hotel Leela Venture Ltd. 19.40 0.15 -19.56
Mangalore Refinery & Petrochemicals Ltd. 9.08 0.07 -9.15
Balaji Distilleries Limited 1154.96 8.76
Bank of Rajasthan Ltd 515.77 3.91
Hsbc Investdirect (India) Limited 297.27 2.25
ABB Limited FV 2 101.98 0.77
Bharat Petroleum Corporation Ltd. 53.02 0.40
ETC Networks Limited 50.31 0.38
HCL Technologies Ltd Fv 2 July 2010 Future 51.16
Bharti Airtel Limited July 2010 Future 26.41
Bharat Heavy Electricals Limited July 2010 Future 24.64
Balrampur Chini Mills Ltd FV 1 July 2010 Future 23.70
Punjab National Bank July 2010 Future 23.42
Hero Honda Motors Ltd FV 2 July 2010 Future 22.85
Shree Renuka Sugars Ltd July 2010 Future -23.27
Bajaj Auto Limited New July 2010 Future -24.55
Bank of Baroda July 2010 Future -24.65
Larsen & Toubro Limited FV 2 July 2010 Future -24.89
Idea Cellular Limited July 2010 Future -26.05
Indian Oil Corporation Limited July 2010 Future -48.76
Infosys Technologies Limited FV 5 July 2010 Future -48.79
Zee Entertainment Enterprises Ltd July 2010 Future -51.88
ICICI Bank Ltd July 2010 Future -544.98
United Spirits Ltd July 2010 Future -1205.79
5100 Put July 2010 Option 2.44 0.02
5000 Put July 2010 Option 1.61 0.01
5500 Call July 2010 Option -0.72 -0.01
4800 Put July 2010 Option -0.94 -0.01
Bharti Airtel Limited 280 Call July 2010 Option -1.00 -0.01
4900 Put July 2010 Option -1.04 -0.01
Bharti Airtel Limited 260 Put July 2010 Option -1.81 -0.01
Grand Total 13186.19 100.00
Total 7,088.33 53.76 -7,113.90
Pair Trade 2,173.31 16.48 -1,851.44
Nifty Stock / Option -1.45 -0.01
Final Total 9260.18 70.23 -8965.34
Corporate Debentures Total 105.16 0.80
Bank Deposit Total 3700.00 28.06
Call / Reverse Repo/ CBLO Total 450.06 3.41
Net Current Asset -329.21 -2.50
IDFC Arbitrage Plus Fund(IDFC - APF)An open-ended equity fund
Fund featuresNature : Equity DerivativesAverage AUM : Rs. 138.90CroreFund Manager : Ashwin Patni & Arjun ParthasarathyInvestment objective : The investment objective of the scheme is to generate income (absolute to low volatility returns) by taking advantage of opportunities in the cash and the derivative segments of the equity markets including the arbitrage opportunities available within the derivative segment, by using other derivative based strategies and by investing the balance in debt and money market instruments. However there is no assurance that the investment objective of the scheme will be realized.Investment style : The fund aimed to generate absolute returns by investing in trades in the equity and derivative markets. The trades can consist of cash-futures arbitrage as well as relative value (such as pair trades and corporate event- based strategies) and derivatives strategies. Ideal investment horizon : 1 year or moreEntry load : NilExit load: IDFC- APF - Plan A & Plan B : 0.50% of NAV on investors who purchase/switch in and seek to redeem/switch out such units within 365 days such from the date of effecting such purchase/switch in. (w.e.f. August 24, 2009)In case of Switches, Exit load shall be NIL for all switch transactions between equity schemes of IDFC Mutual Fund . (w.e.f. October 12, 2009.)Options available: Growth, Dividend & Dividend Sweep (w.e.f. 16-Nov-2009)Minimum investment amount : Plan A : Rs.5,000, Plan B: Rs. 25,00,000 (w.e.f. July 6, 2009)Additional investment amount : Re.1Inception Date: 9 June 2008Statistical measures : Standard deviation 0.54%Last 3 dividends (Rs. / unit):19 Apr 2010 A 0.02 NAV 10.557419 Apr 2010 B 0.02 NAV 10.614411 May 2010 A 0.02 NAV 10.570811 May 2010 B 0.02 NAV 10.629621 Jun 2010 A 0.01 NAV 10.574121 Jun 2010 B 0.01 NAV 10.6360
Dividend frequency : Monthly, subject to availability of distributable surplusNAV (Rs.):Growth (A) 11.1968 (B) 11.2287Dividend (A) 10.5912 (B) 10.6538Face value (Rs. / unit) : 10Asset allocation (equity / debt / cash/Derivatives Option) : 70.24% / 32.27% / -2.50% /-0.01%Fund manager’s comment:Cash-future spreads improved as FII arbitrage books shrunk in size. The fund was able to successfully roll-over its arbitrage positions into July. The fund also had positions in options, open offers and pair trades.
Portfolio Contd...
Data as of 30 June 2010
9
MarketValue in % of Value of
Name Lac (Rs.) NAV Futures
Portfolio
Bajaj Hindustan Ltd. 898.18 6.81 -904.32
Firstsource Solutions Limited 503.50 3.82 -507.94
Reliance Infrastructure Limited 441.37 3.35 -444.40
Biocon Limited 423.09 3.21 -421.33
Ispat Industries Ltd 362.34 2.75 -365.36
Contd...
Fund performance
Past performance may or may not be sustained in future.Benchmark : Crisil Liquid Fund Index
under the IDFC-APF-Growth
IDFC-APF - Growth Crisil Liquid Fund Index
3 Month (Absolute) 6 Month (Absolute) Since Inception (CAGR)Last 1 Year (CAGR)
1.02%
2.14%
3.38%
5.61% 5.65%
0.99%
1.92%
3.29%
5.81% 5.81%
Last 2 Years (CAGR)

10
IDFC Small & Midcap Equity (SME) Fund(IDFC - SMEF)An Open Ended Equity Scheme.
Data as of 30 June 2010
Asset Allocation
Marketvalue in % of
Name Lac (Rs.) NAV
Bajaj Auto Limited 1865.70 2.50TVS Motor Company Ltd. 1553.50 2.08Ashok Leyland Ltd. 1214.85 1.63
Exide Industries Ltd. 2384.68 3.20
Union Bank of India 1399.73 1.88Allahabad Bank 853.44 1.14
IVRCL Infrastructures & Projects Ltd. 2777.36 3.72Phoenix Mills Limited 1059.52 1.42
Titan Industries Ltd. 1882.38 2.52Dabur India Ltd. 1474.20 1.98Kansai Nerolac Paints Limited 1171.16 1.57Colgate-Palmolive (India) Ltd. 1004.58 1.35Godrej Consumer Products Ltd. 744.44 1.00
Zuari Industries Ltd 1240.71 1.66
Dewan Housing Finance Corpn Ltd 2550.41 3.42Shriram Transport Finance Co Ltd. 1441.00 1.93ICRA Limited 1420.77 1.90Mahindra & Mahindra Fin Ser Ltd. 1293.35 1.73Network 18 Media and Investments Lt 971.63 1.30
Gujarat State Petronet Ltd 1607.10 2.15Indraprastha Gas Limited 1091.53 1.46
Siemens Ltd. 1839.67 2.47
Sun TV Network Limited 1768.77 2.37DQ Entertainment International Ltd 1636.35 2.19Hathway Cable and Datacom Limited 1420.19 1.90
BLISS GVS Pharma Ltd 1328.44 1.78ABG Infralogistics Limited 1085.71 1.46
Strides Arcolab Ltd. 2943.23 3.95Aurobindo Pharma Ltd. 1692.97 2.27
Hexaware Technologies Ltd. 754.00 1.01
Idea Cellular Limited 1564.49 2.10
Bombay Rayon Fashions Ltd. 2856.15 3.83Mandhana Industries Ltd 1307.73 1.75
Shri Lakshmi Cotsyn Ltd 1195.81 1.60
Mundra Port & Special Eco Zone Ltd 2130.57 2.86Spicejet Limited 2100.60 2.82
Grand Total 74603.35 100.00
Auto Total 4634.05 6.21
Auto Ancillaries Total 2384.68 3.20
Bank Total 2253.16 3.02
Construction Total 3836.88 5.14
Consumer Non Durables Total 6276.77 8.41
Fertilisers Total 1240.71 1.66
Finance Total 7677.16 10.29
Gas Total 2698.63 3.62
Industrial Capital Goods Total 1839.67 2.47
Media & Entertainment Total 4825.31 6.47
Miscellaneous Total 2414.15 3.24
Pharmaceuticals Total 4636.20 6.21
Software Total 754.00 1.01
Telecom - Services Total 1564.49 2.10
Textile Products Total 4163.88 5.58
Textiles - Synthetic Total 1195.81 1.60
Transportation Total 4231.17 5.67Others Total 5983.89 8.02Money Market Instrument Total 7463.78 10.00Mutual Fund Units Total 508.52 0.68Call / Reverse Repo/ CBLO Total 480.07 0.64Net Current Asset 3540.36 4.75
Future Total -1606.20 -2.15
Fund features
Fund performance
Nature : EquityAverage AUM : Rs. 709.51 CroreFund Manager : Kenneth AndradeInvestment objective : The investment objective of the Scheme is to seek to generate capital appreciation from a diversified portfolio of equity and equity related instruments.The Scheme will predominantly invest in small and midcap equity and equity related instruments. Small and Midcap equity and equity related instruments will be the stocks included in the CNX Midcap index or equity and equity related instruments of such companies which have a market capitalization lower than the highest components of CNX Midcap Index. The Scheme may also invest in stock other than mid cap stocks (i.e. in stocks, which have a market capitalisation of above the market capitalisation range of the defined small midcap stocks) and derivatives. On defensive consideration, the Scheme may also invest in debt and money market instruments. However there is no assurance that the investment objective of the scheme will be realized.Investment Style: The Scheme will predominantly invest in small and mid-cap equity and equity related instruments. Small and Mid-cap equity and equity related instruments will be the stocks included in the CNX Mid-Cap index or equity and equity related instruments of such companies which have a market capitalization lower than the highest components of CNX Mid-Cap Index. The scheme would predominantly create a portfolio of emerging business and companies that are aspiring leaders in their respective field of operations. Some part of the portfolio would be in stocks/ companies that do not have a significant history of being listed. Ideal Investment Horizon: More than 3 yearsEntry Load: NilExit load: The scheme is converted into open ended scheme w.e.f. September 11, 2009. W.e.f. September 11, 2009 Exit Load - If redeemed within 365 days from the date of purchase(s) applying First in First out basis (including purchase made through the STP/SIP) -1.00%.No exit load /CDSC will be chargeable in case of switches made between different options of the schemes. In case of Switches, Exit load shall be NIL for all switch transactions between equity schemes of IDFC Mutual Fund (w.e.f. October 12, 2009)Options available: Growth, DividendMinimum investment amount : Rs. 5,000 SIP (minimum amount): Rs. 1000Additional investment amount : Re.1Inception Date: 7 March 2008Statistical Measures : Beta 0.69R Square 0.89Standard deviation 3.60%Last 3 dividends (Rs./ unit) :29 September 2009 1.10 NAV 12.397229 April 2010 1.60 NAV 13.9863
Dividends frequency : NANAV (Rs.):Growth 17.5079Dividend 14.4463Face value (Rs. / unit) : 10Asset allocation (equity / debt / cash) : 83.92% /11.33% /4.75%Fund manager’s commentThe fund philosophy is to capture the potential of the small and mid - cap companies in the country. The underlying companies in the portfolio are growth oriented and at a second level the fund seeks to optimize valuations in this space. With markets buoyant the portfolio shifts have been reasonably aggressive in tune with the changing valuations. The strategy is expected to remain invested in smaller companies with low business risk and extreme valuation comfort.
Past performance may or may not be sustained in future. Benchmark : CNX Midcap
under the IDFC-SMEF-Growth
IDFC-SMEF - Growth CNX Midcap
Portfolio
3 Month (Absolute) 6 Month (Absolute) Since Inception (CAGR)Last 1 Year CAGR Last 2 Years CAGR
7.38%
15.10%
55.86%
39.30%
27.37%
5.53%9.39%
49.82%
20.23%
10.14%
10.29%10.19%
7.20%6.47%6.38%6.21%
5.67%5.58%5.14%
3.62%3.24%3.20%
2.10%1.66%1.60%
1.01%0.70%0.64%
3.02%
Fin
ance
Consu
mer
No
n D
ura
ble
s
Auto
Media
&
En
tert
ain
ment
Indust
rial
Ca
pita
l Goods
Ph
arm
ace
utic
als
Tra
nsp
ort
atio
n
Text
ile P
roduct
s
Const
ruct
ion
Gas
Mis
cella
neous
Au
to A
nci
llaries
Banks
Tele
com
-
Serv
ices
Fert
ilise
rs
Text
iles
- S
ynth
etic
Softw
are
Hard
ware
Indust
rial
Pro
duct
s
Since Inception 27000 46811 53.75% 41.50%
Last 2 years 24000 40975 61.96% 52.09%
Last 1 year 12000 14729 45.23% 35.95%
SIP Returns Period Investment Value Scheme Return Benchmark Return

11
IDFC Strategic Sector (50-50) Equity FundIDFC-SS (50-50)-EFA Open Ended Equity Fund
Data as of 30 June 2010
Asset Allocation
Marketvalue in % of
Name Lac (Rs.) NAV
Sector - Banking & Finance Total 1968.93 49.29
Finance Total 1611.94 40.35Punjab National Bank Future Total 93.66 2.34Bank Nifty Future Total 263.33 6.59Diversified Total 1988.48 49.77
Automobile Total 41.57 1.04
Construction Total 192.14 4.81
Consumer Goods Total 124.21 3.11
Metals Total 88.48 2.21
Industrial Manufacturing Total 60.43 1.51
Energy Total 491.11 12.29Reliance Industries Ltd. Future Total 68.33 1.71
Information Technology Total 268.52 6.72
Telecom Total 49.88 1.25Others Total 603.81 15.11Call / Reverse Repo/ CBLO Total 390.06 9.76Net Current Asset 72.80 1.82
Axis Bank Limited 242.27 6.06Bank of Baroda 235.12 5.89Union Bank of India 214.62 5.37ICICI Bank Ltd. 193.88 4.85HDFC Bank Ltd. 153.52 3.84State Bank of India 149.63 3.75Kotak Mahindra Bank Ltd. 119.50 2.99Oriental Bank of Commerce 117.45 2.94Punjab National Bank 68.18 1.71Housing Development Finance Cor Ltd 117.77 2.95
Mahindra & Mahindra Ltd. 41.57 1.04
Larsen & Toubro Ltd. 148.77 3.72Hindustan Unilever Ltd. 43.37 1.09
ITC Ltd 124.21 3.11
Sterlite Industries Ltd. 42.53 1.06Tata Steel Ltd. 45.95 1.15
Bharat Heavy Electricals Ltd. 60.43 1.51
Reliance Industries Ltd. 320.27 8.02Oil & Natural Gas Corporation Ltd. 115.78 2.90Gail (India) Ltd. 55.05 1.38
Infosys Technologies Ltd. 209.35 5.24Tata Consultancy Services Ltd. 59.16 1.48
Bharti Airtel Ltd. 49.88 1.25
Grand Total 3994.95 100.00
Fund features
Fund performance
Nature : EquityAverage AUM: Rs.32.71 CroreFund Manager : Kenneth AndradeInvestment objective : The investment objective of the scheme is to seek to generate long-term capital appreciation by investing in Equity and Equity related instruments.The investment objective of the fund shall be achieved by investing up to fifty percent of the assets of the scheme in a chosen sector (sector specific exposure) while the balance amount may be invested in companies across market capitalizations and across sectors (diversified exposure). The scheme may also invest in debt and money market instruments.There is no assurance or guarantee that the objectives of the scheme will be realized and the scheme does not assure or guarantee any returns.Ideal investment horizon : 3 years or moreEntry Load: (Plan A & Plan B) : Nil Exit Load: (Plan A & Plan B) : All Investment including SIP/Micro SIP/STP/FOF if redeemed / switched out within 365 days from the date of allotment - 1%. No Entry / Exit Loads / CDSC will be chargeable in case of switches made between different options of the Scheme. (w.e.f. September 01, 2009)In case of Switches, Exit load shall be NIL for all switch transactions between equity schemes of IDFC Mutual Fund . (w.e.f. October 12, 2009.)Options available: Growth, Dividend. Reinvestment facility is available under the Dividend Option.Minimum investment amount (Plan A & Plan B): Rs. 5,000 Additional investment amount : Re.1SIP (minimum amount) ( Plan A & Plan B): Rs. 1000 Inception Date (Plan A) : 3 October 2008Inception Date (Plan B) : 2 April 2009Statistical Measures : Beta 0.84R Square 0.95Standard deviation 7.24%Dividend frequency : NANAV (Rs.):Growth (A)13.4792 (B) 14.7651Dividend (A)13.3346 (B) 14.7689Face value (Rs. / unit) : 10Asset allocation (equity / debt / cash) :88.41% /9.76% / 1.82%Fund manager’s comment :The Fund is built around allocating 50% of its invested portfolio in one sector. The current sector concentration is around Banking and Financials. Financials is a direct play on the Indian economy which is on a sure and stable path of recovery. Credit growth is picking up, NPA risk is controlled and valuations are commensurate to growth.
Past performance may or may not be sustained in future.Benchmark : S & P CNX Nifty
under the IDFC Strategic Sector (50-50) Equity Fund-Growth
IDFC Strategic Sector (50-50) Equity Fund Growth S & P CNX Nifty
Portfolio
3 Month (Absolute) Since Inception CAGR6 Month (Absolute) Last 1 Year CAGR
2.97%4.70%
20.94%
18.72%
1.21%2.14%
23.80%
20.90%
40.58%
16.38%
7.78%6.18%
4.32%3.46%3.11%3.01%1.46%1.43%0.71%
Fin
anci
al
Serv
ices
Energ
y
Info
rmatio
nTe
chnolo
gy
Co
nst
ruct
ion
Meta
ls
Auto
mobile
Consu
mer
Goods
Indust
rial
Ma
nufa
cturing
Pharm
a
Tele
com
Cem
ent and
Cem
ent
Pro
duct
s
Since Inception 20000 25634 29.32% 36.57%
Last 1 year 12000 12929 14.79% 15.87%
SIP Returns Period Investment Value Scheme Return Benchmark Return

12
IDFC Tax Advantage (ELSS) FundIDFC TA (ELSS) FundAn open ended Equity Linked Saving Scheme with lock in period of 3 years.
Data as of 30 June 2010
Asset Allocation
Marketvalue in % of
Name Lac (Rs.) NAV
Mahindra & Mahindra Ltd. 188.21 2.16
Axis Bank Limited 496.96 5.71ICICI Bank Ltd. 430.85 4.95Union Bank of India 357.71 4.11Oriental Bank of Commerce 261.00 3.00Allahabad Bank 243.38 2.80Vijaya Bank 161.38 1.85
Unitech Ltd. 185.88 2.14
Larsen & Toubro Ltd. 452.24 5.20
TTK Prestige Ltd 222.30 2.55Emami Limited 215.05 2.47
Tata Steel Ltd. 291.39 3.35Jindal Steel & Power Ltd. 249.80 2.87
Rural Electrification Corp Ltd 213.19 2.45
Bharat Heavy Electricals Ltd. 368.96 4.24
HT Media Limited 224.03 2.57Sun TV Network Limited 196.65 2.26Hathway Cable and Datacom Limited 98.96 1.14
Gujarat NRE Coke Ltd 256.40 2.95
Reliance Industries Ltd. 381.45 4.38Bharat Petroleum Corporation Ltd. 165.69 1.90
IPCA Laboratories Limited 218.93 2.52Piramal Healthcare Limited 192.30 2.21Cadila Healthcare Ltd. 165.06 1.90Torrent Pharmaceuticals Limited 164.73 1.89
Jyoti Structures Ltd. 230.25 2.65NTPC Ltd. 199.60 2.29
Infosys Technologies Ltd. 376.79 4.33Mphasis Limited 253.58 2.91HCL Technologies Ltd. 182.08 2.09
Bharti Airtel Ltd. 197.10 2.27Idea Cellular Limited 89.03 1.02
Cox and Kings India Limited 107.61 1.24
Grand Total 8701.28 100.00
Auto Total 188.21 2.16
Banks Total 1951.27 22.43
Construction Total 185.88 2.14
Construction Project Total 452.24 5.20
Consumer Non Durables Total 437.35 5.03
Ferrous Metals Total 541.19 6.22
Finance Total 213.19 2.45
Industrial Capital Goods Total 368.96 4.24
Media & Entertainment Total 519.63 5.97
Minerals/Mining Total 256.40 2.95
Petroleum Products Total 547.14 6.29
Pharmaceuticals Total 741.02 8.52
Power Total 429.85 4.94
Software Total 812.44 9.34
Telecom Services Total 286.13 3.29
Transportation Total 107.61 1.24Others Total 141.69 1.63Net Current Asset 521.12 5.99
Fund features
Fund performance
Nature : EquityAverage AUM : Rs. 84.51 CroreFund Manager : Kenneth Andrade. w.e.f. 21 July, 2009 Investment objective : The investment objective of the Scheme is to seek to generate long term capital growth from a diversified portfolio of predominantly equity and equity related securities.There can be no assurance that the investment objective of the scheme will be realised.Investment style : The Scheme will invest in well- managed growth companies that are available at reasonable value. Companies would be identified through a systematic process of forecasting earnings based on a deep understanding of the industry growth potential and interaction with company management .Entry load : Nil Exit load : Nil (w.e.f. September 04, 2009)Options available: Growth, Dividend. Reinvestment facility is available under the Dividend Option.Minimum investment amount : Rs. 500Additional investment amount : Rs. 500SIP (minimum amount) : Rs. 500Inception Date: 26 December 2008Statistical Measures : Beta 0.69R Square 0.89Standard deviation 6.93%Last 3 dividends (Rs./ unit) :20 January 2010 2.50 NAV 14.937323 March 2010 1.00 NAV 14.3869
Dividends frequency : NANAV (Rs.):Growth 18.4214Dividend 14.7530Face value (Rs. / unit) : 10Asset allocation (equity / debt / cash) : 94.01% /- /5.99%Fund manager’s comment :The focus is to invest in long term growth stocks at reasonable price. The portfolio is an diverse mix of companies across sectors and is agnostic to capitalization bias. Given the plethora of opportunities which is there in domestic economy, the fund seeks to invest in companies with strong track record of execution, high operating leverage and reasonable valuations.
Past performance may or may not be sustained in future.Benchmark : BSE 200
under the IDFC TA (ELSS) - Growth
Portfolio
IDFC-TA(ELSS) - Growth BSE200
Since Inception CAGR3 Month (Absolute) 6 Month (Absolute) Llast 1 Year CAGR
2.16%7.79%
36.21%
49.89%
2.21% 3.11%
27.22%
59.04%
22.43%
9.34%9.07%
6.29%6.22%5.97%5.84%5.20%4.94%4.24%
3.29%2.95%2.16%2.14%
1.24%0.26%0.00%
2.45%
Banks
Softw
are
Ph
arm
ace
utic
als
Petr
ole
um
P
roduct
s
Fe
rrous
Meta
ls
Media
&
En
tert
ain
ment
Consu
mer
No
n D
ura
ble
s
Co
nst
ruct
ion
Pro
ject
Pow
er
Indust
rial
Ca
pita
l Goods
Tele
com
-
Serv
ices
Min
era
ls/M
inin
g
Fin
ance
Auto
Co
nst
ruct
ion
Tra
nsp
ort
atio
n
Fert
ilise
rs
Mis
cella
neous
Since Inception 9000 12018 41.88% 44.62%
Last 1 year 6000 6808 26.14% 18.54%
SIP Returns Period Investment Value Scheme Return Benchmark Return

13
IDFC India GDP Growth Fund(IDFC - IGGF)An Open Ended Equity Scheme
Data as of 30 June 2010
Asset Allocation
Marketvalue in % of
Name Lac (Rs.) NAV
Bajaj Auto Limited 134.33 3.25Escorts Ltd. 126.59 3.06Swaraj Mazda Ltd. 75.90 1.84
ICICI Bank Ltd. 141.97 3.44Union Bank of India 135.13 3.27ING Vysya Bank Ltd. 132.82 3.21Oriental Bank of Commerce 122.34 2.96Federal Bank Ltd. 115.16 2.79Allahabad Bank 89.24 2.16Axis Bank Limited 79.39 1.92Vijaya Bank 67.78 1.64
Indraprastha Gas Limited 172.89 4.18
Allied Digital Services Limited 93.40 2.26
BGR Energy Systems Limited 132.80 3.21
Jain Irrigation Systems Ltd. 192.92 4.67
Talwalkars Better Value Fitness Ltd 131.82 3.19
Sun TV Network Limited 124.98 3.03DB Corp Limited 98.10 2.37
Manappuram General Fin & Leasing Lt 93.54 2.26
Oil & Natural Gas Corporation Ltd. 294.25 7.12
Bharat Petroleum Corporation Ltd. 192.20 4.65Hindustan Petroleum Corporation Ltd. 159.63 3.86
Strides Arcolab Ltd. 116.52 2.82Dishman Pharmaceuticals & Chemicals Ltd. 99.40 2.41Torrent Pharmaceuticals Limited 82.37 1.99
Pantaloon Retail (India) Ltd. 110.22 2.67
Infosys Technologies Ltd. 178.62 4.32Educomp Solutions Ltd. 138.06 3.34Everonn Education Limited 128.34 3.11Mphasis Limited 122.00 2.95Eclerx Services Limited 88.89 2.15
Grand Total 4131.58 100.00
Auto Total 336.82 8.15
Banks Total 883.82 21.39
Gas Total 172.89 4.18
Hardware Total 93.40 2.26
Industrial Capital Goods Total 132.80 3.21
Industrial Products Total 192.92 4.67
Leisure Facilities Total 131.82 3.19
Media & Entertainment Total 223.08 5.40
Miscellaneous Total 93.54 2.26
Oil Total 294.25 7.12
Petroleum Products Total 351.83 8.52
Pharmaceuticals Total 298.29 7.22
Retailing Total 110.22 2.67
Software Total 655.92 15.88Others Total 31.27 0.76Call / Reverse Repo/ CBLO Total 90.01 2.18Net Current Asset 38.69 0.94
Fund features
Fund performance
Nature : EquityAverage AUM : Rs. 41.02 CroreFund Manager : Tridib PathakInvestment objective : The investment objective of the scheme is to seek to generate long-term capital appreciation by investing in Equity and Equity related instruments. The scheme aims to capture the growth in India's Gross Domestic Product (GDP). The scheme would endeavour to represent the growth in GDP by capturing the growth in the constituents of the GDP. The scheme may also invest in debt and money market instruments.There is no assurance or guarantee that the objectives of the scheme will be realized and the scheme does not assure or guarantee any returns.Investment style : The Scheme will invest in well- managed growth companies that are available at reasonable value. Companies would be identified through a systematic process of forecasting earnings based on a deep understanding of the industry growth potential and interaction with company management.Entry Load : NilExit load: All Investment including SIP/Micro SIP/STP/FOF if redeemed / switched out within 365 days from the date of allotment - 1%. No Exit Loads / CDSC will be chargeable in case of switches made between different options of the Scheme. (w.e.f. September 01, 2009)In case of Switches, Exit load shall be NIL for all switch transactions between equity schemes of IDFC Mutual Fund . (w.e.f. October 12, 2009.)Options available: Growth, Dividend. Reinvestment facility is also available under the dividend option.Minimum investment amount : Rs. 5000Additional investment amount : Re.1SIP (minimum amount) : Rs. 2000 Inception Date: 11 March 2009Statistical Measures : Beta 0.46R Square 0.72Standard deviation 5.31%Last 3 dividends (Rs./ unit) :31 May 2010 2.00 NAV 12.6450
NAV (Rs.):Growth 15.3697Dividend 13.2720Face value (Rs. / unit) : 10Asset allocation (equity / debt / cash) : 96.88% /2.18% /0.94%Fund manager’s commentThe fund is benchmarked to the components of India's GDP in the proportion of the contribution of each component to GDP growth. The fund is invested mainly in the services sector, followed by industrials and then agriculture. Around 55% of the fund's portfolio is currently invested in midcap stocks.
Past performance may or may not be sustained in future.Benchmark : BSE 500
under the IDFC-IGGF- Growth
Portfolio
IDFC-IGGF - Growth BSE500
CAGR - Compounded Annualised Growth Rate
3 Months(Absolute)
6 Months(Absolute)
Last 1 Year CAGR
Since InceptionCAGR
39.04%
27.10%
2.42%3.87%
94.27%
29.14%
3.65%2.50%
21.39%
16.63%
8.52%8.15%7.22%7.12%
5.40%4.67%4.18%
3.21%3.19%2.67%2.26% 2.26%
Banks
Softw
are
Petr
ole
um
Pro
duct
s
Auto
Ph
arm
ace
utic
alsOil
Media
&E
nte
rtain
ment
Indust
rial
Pro
duct
s
Gas
Ind
ust
rial C
apita
lG
oods
Le
isu
re F
aci
litie
s
Reta
iling
Mis
cella
neous
Hard
ware
Since Inception 30000 35301 25.03% 39.65%
Last 1 year 24000 26085 16.64% 19.90%
SIP Returns Period Investment Value Scheme Return Benchmark Return

14
IDFC Super Saver Income Fund - Investment Plan(IDFC - SSIF-IP)An Open - Ended Income Fund
Data as of 30 June 2010
1 CBLO 0.26%
2 Non Convertible Debentures 71.45%
3 Net Current Asset 0.56%
4 Govt Securities (GSE) 27.73%
Portfolio
% of Name Rating NAV
CBLO 0.26
HDFC Bank Ltd. AAA 14.53
Indian Railway Finance Corpn. Ltd. AAA 13.34
Reliance Utilities & Power Pvt.Ltd. CAREAAA 13.17
ONGC Videsh Limited AAA 13.06
Power Finance Corporation Limited AAA 12.96
Power Grid Corporation Ltd. AAA 4.39
7.80% GOI 2020 MD 03-05-2020 SOV 19.79
8.20% GOI 2022 MD 15-02-2022 SOV 7.95
Grand Total 100.00
CBLO Total 0.26
Non Convertible Debentures Total 71.45
Govt Securities (GSE) Total 27.73
Net Current Asset 0.56
Fund features
Nature : DebtAverage AUM : Rs. 118.07 CroreFund manager : Arjun ParthasarthyInvestment objective : Seek to generate stable returns by creating a portfolio that is invested in good quality fixed income and money market securities. However there is no assurance that the investment objective of the scheme will be realized.Investment Style: The Scheme seeks to invest in a mix of government securities and highly rated corporate bonds and aims to generate stable long-term returns through mix of accrual income and capital appreciation.Ideal investment horizon : 1 year or moreEntry load : NilExit load : IDFC-SSIF-IP - Plan A , Plan B, Plan C & Plan F : 1.00% of NAV on investors who purchase/switch in and seek to redeem/switch out such units within 365 days such from the date of effecting such purchase/switch in. Investors opting for PEP / Dividend reinvestment option / SWP or switch between options will not be levied an exit load.Options available : Growth, Dividend & Dividend SweepMinimum investment amount : Rs. 5,000 and in multiples of Re. 1 in Plan A (Regular Plan), Rs. 25 Lakh and in multiples of Re. 1 in Plan B (Institutional Plan), Rs. 5 Crores and in multiples of Re. 1 in Plan C, Rs. 5,000 and in multiples of Re. 1 in Plan F.Additional investment amount : Re.1SIP (minimum amount) : in Plan A Rs. 1,000Inception date : 14 July 2000Statistical Measures : Standard deviation 1.61%Modified Duration 5.20 YearsDividend frequency : Quarterly, Half Yearly, AnnuallyLast 3 dividends (Rs./ unit): Date Nav Freq. Others I & H
IDFC-SSIF-IP-Plan A30-Jun-10 10.7028 Quarterly 0.0470 0.050430-Mar-09 10.4462 Quarterly 0.3669 0.394230-Jun-09 10.4659 Quarterly 0.3669 0.394229-Sep-09 10.6641 Half Yearly 0.3636 0.390730-Mar-09 10.6717 Half Yearly 0.5462 0.586930-Mar-09 10.9413 Annual 0.7663 0.8234IDFC-SSIF-IP-Plan B30-Jun-09 10.2589 Quarterly 0.1223 0.131431-Dec-09 10.2880 Quarterly 0.0296 0.0318IDFC-SSIF-IP-Plan C30-Jun-09 10.1243 Quarterly 0.0408 0.043831-Dec-09 10.1529 Quarterly 0.0227 0.0244
NAV (Rs.):Plan A Dividend Quarterly 10.7028Plan A Growth 22.5999Plan A Dividend Annual 11.7671Plan A Dividend Half Yearly 11.0165Plan B Growth 10.8941Plan B Dividend 10.5737Plan C Growth 10.5158Plan C Dividend 10.4349Face Value (Rs. / unit): 10Fund manager's comment:The fund increased weight to corporate bonds at higher levels of yields. The fund will actively monitor the dynamic interest rate and credit spread environment to optimize performance. Benchmark : Crisil Composite Bond Fund Index (CCBFI)
Asset Allocation
Fund performance IDFC-SSIF-IP Growth
Past performance may or may not be sustained in future.
1
2
CAGR Last 1 Year
CAGR Last 2 Years
CAGR Last 3 Years
CAGR Last 5 Years
CAGR SinceAllotment
14/07/2000IDFC-SSIF-IP - Growth CCBFI
CAGR - Compounded Annualised Growth Rate
3
4
Past performance is no guarantee of future results.For Methodology of Ranking Please refer Page No. 41.
Morningstar Rating
Rating & Rankings
7.47%
8.52%
2.92%
9.80%9.53%
5.63%6.95%
7.90%
4.69%
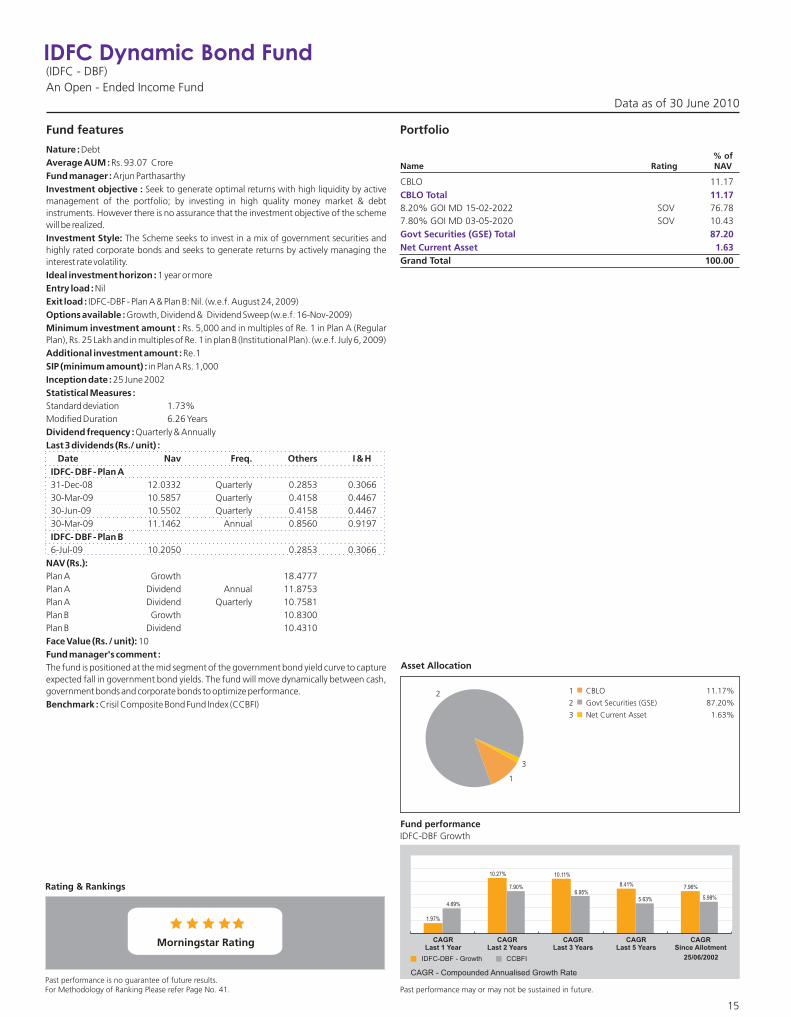
15
Data as of 30 June 2010
IDFC Dynamic Bond Fund(IDFC - DBF)An Open - Ended Income Fund
1 CBLO 11.17%
2 Govt Securities (GSE) 87.20%
3 Net Current Asset 1.63%
Portfolio
% of Name Rating NAV
CBLO 11.17
8.20% GOI MD 15-02-2022 SOV 76.787.80% GOI MD 03-05-2020 SOV 10.43
Grand Total 100.00
CBLO Total 11.17
Govt Securities (GSE) Total 87.20Net Current Asset 1.63
Fund features
Nature : DebtAverage AUM : Rs. 93.07 CroreFund manager : Arjun ParthasarthyInvestment objective : Seek to generate optimal returns with high liquidity by active management of the portfolio; by investing in high quality money market & debt instruments. However there is no assurance that the investment objective of the scheme will be realized.Investment Style: The Scheme seeks to invest in a mix of government securities and highly rated corporate bonds and seeks to generate returns by actively managing the interest rate volatility.Ideal investment horizon : 1 year or moreEntry load : NilExit load : IDFC-DBF - Plan A & Plan B: Nil. (w.e.f. August 24, 2009)Options available : Growth, Dividend & Dividend Sweep (w.e.f. 16-Nov-2009)Minimum investment amount : Rs. 5,000 and in multiples of Re. 1 in Plan A (Regular Plan), Rs. 25 Lakh and in multiples of Re. 1 in plan B (Institutional Plan). (w.e.f. July 6, 2009)Additional investment amount : Re.1SIP (minimum amount) : in Plan A Rs. 1,000Inception date : 25 June 2002Statistical Measures : Standard deviation 1.73%Modified Duration 6.26 YearsDividend frequency : Quarterly & AnnuallyLast 3 dividends (Rs./ unit) : Date Nav Freq. Others I & HIDFC- DBF - Plan A31-Dec-08 12.0332 Quarterly 0.2853 0.306630-Mar-09 10.5857 Quarterly 0.4158 0.446730-Jun-09 10.5502 Quarterly 0.4158 0.446730-Mar-09 11.1462 Annual 0.8560 0.9197IDFC- DBF - Plan B6-Jul-09 10.2050 0.2853 0.3066
NAV (Rs.):Plan A Growth 18.4777Plan A Dividend Annual 11.8753Plan A Dividend Quarterly 10.7581Plan B Growth 10.8300Plan B Dividend 10.4310Face Value (Rs. / unit): 10Fund manager's comment :The fund is positioned at the mid segment of the government bond yield curve to capture expected fall in government bond yields. The fund will move dynamically between cash, government bonds and corporate bonds to optimize performance. Benchmark : Crisil Composite Bond Fund Index (CCBFI)
Asset Allocation
Fund performance IDFC-DBF Growth
Past performance may or may not be sustained in future.
1
2
CAGR Last 1 Year
CAGR Last 2 Years
CAGR Last 3 Years
CAGR Last 5 Years
CAGR Since Allotment
25/06/2002IDFC-DBF - Growth CCBFI
CAGR - Compounded Annualised Growth Rate
Rating & Rankings
Past performance is no guarantee of future results.For Methodology of Ranking Please refer Page No. 41.
Morningstar Rating
3
10.27% 10.11%
8.41%
1.97%
7.96%
4.69%
7.90%6.95%
5.63% 5.98%

16
Data as of 30 June 2010
IDFC Super Saver Income Fund - Medium Term(IDFC-SSIF-MT)An Open - Ended Income Fund
1 Certificate of Deposit 48.19%
2 Non Convertible Debentures 35.28%
3 Govt Securities (GSE) 15.45%
4 Net Current Asset -0.63%
5 CBLO 1.71%
Portfolio
% of Name Rating NAV
CBLO 1.71
Karur Vysya Bank Ltd. A1+ 13.42
Oriental Bank of Commerce P1+ 9.83
UCO Bank P1+ 8.42
Central Bank of India PR1+ 8.36
Karnataka Bank Ltd A1+ 4.87
IDBI Bank Ltd P1+ 1.65
Jammu & Kashmir Bank Limited P1+ 1.63
Reliance Utilities & Power Pvt. Ltd. CAREAAA 10.40
Infrastructure Development Finance Company Ltd. AAA 5.45
L&T Finance Ltd CAREAA+ 5.16
State Bank of India AAA 3.65
Export Import Bank of India AAA 3.63
National Housing Bank AAA 3.57
Power Finance Corporation Limited AAA 3.41
8.20% GOI 2022 MD 15-02-2022 SOV 6.97
7.17% GOI 2015 MD 14-06-2015 SOV 5.10
7.80% GOI 2020 MD 03-05-2020 SOV 1.74
6.49% GOI 2015 MD 08-06-2015 SOV 1.65
Grand Total 100.00
CBLO Total 1.71
Certificate of Deposit Total 48.19
Non Convertible Debentures Total 35.28
Govt Securities (GSE) Total 15.45
Net Current Asset -0.63
Fund features
Nature : DebtAverage AUM : Rs. 229.90 CroreFund manager : Anupam JoshiInvestment objective : Seek to generate stable returns with a low risk strategy by investing in good quality fixed income securities and money market securities. However there is no assurance that the investment objective of the scheme will be realized.Investment Style: The Scheme seeks to invest in a mix of government securities and highly rated corporate bonds and aims to generate stable long-term returns through mix of accrual income and capital appreciation.Ideal investment horizon : 6 months or moreEntry load : NilExit load : IDFC-SSIF-MT - Plan A , Plan B & Plan F : 0.50% of NAV shall be the exit load payable by investors who purchase / switch in and seek to redeem / switch out such units within 182 days from the date of effecting such purchase / switch in. Investors opting for PEP / Dividend reinvestment option / SWP or switch between options will not be levied an exit load. Options available : Growth, Dividend & Dividend Sweep Minimum investment amount : Rs. 5,000 and in multiples of Re. 1 in Plan A (Regular Plan), Rs. 25 Lakh and in multiples of Re. 1 in Plan B (Institutional Plan), Rs. 5,000 and in multiples of Re. 1 in Plan FAdditional investment amount : Re.1SIP (minimum amount) : in Plan A Rs. 1,000Inception date : 8 July 2003Statistical Measures : Standard deviation 1.18%Modified Duration 2.33 YearsDividend frequency : Bi-monthly, Monthly, Fortnightly & DailyLast 3 dividends (Rs./ unit): Date Nav Freq. Others I & HIDFC- SSIF-MT Plan A15-Mar-10 10.0000 Daily - 0.0056815512-Mar-10 10.0000 Daily - 0.0014025811-Mar-10 10.0000 Daily - 0.0017261528-May-10 10.4913 Bimonthly 0.1802 0.193618-Jun-10 10.0617 Fortnightly 0.0089 0.009604-Jun-10 10.0617 Fortnightly 0.0158 0.017021-May-10 10.0617 Fortnightly 0.0359 0.038530-Jun-10 10.1544 Monthly 0.0424 0.0455
NAV (Rs.):Plan A Growth 16.0863Plan A Dividend Bi-Monthly 10.5493Plan A Dividend Fortnightly 10.0926Plan A Dividend Monthly 10.1544Plan A Dividend Daily 10.3290Plan B Growth 10.2076Plan B Dividend 11.4139Plan F Growth 10.3948Face Value (Rs. / unit): 10Fund manager's commentThe fund is invested in a mix of medium tenor corporate bonds and government bonds with weights allocated to certificate of deposits to temper duration. The fund will aim to maintain an average maturity between three to four years. Benchmark : CRISIL Short-Term Bond Fund Index (CSTBFI)
Asset Allocation
Fund performance IDFC-SSIF-MT - Growth
Past performance may or may not be sustained in future.
1
3
24
5
CAGR Last 1 Year
CAGR Last 2 Years
CAGR Last 3 Years
CAGR Last 5 Years
CAGR Since Allotment
08/07/2003IDFC-SSIF-MT - Growth CSTBFI
CAGR - Compounded Annualised Growth Rate
Rating & Rankings
Value Research Ranking
Past performance is no guarantee of future results.For Methodology of Ranking Please refer Page No. 41.
Morningstar Rating
11.42%9.84%
8.39%9.44%
7.04%
4.85%
8.01% 7.69%6.80%
6.06%
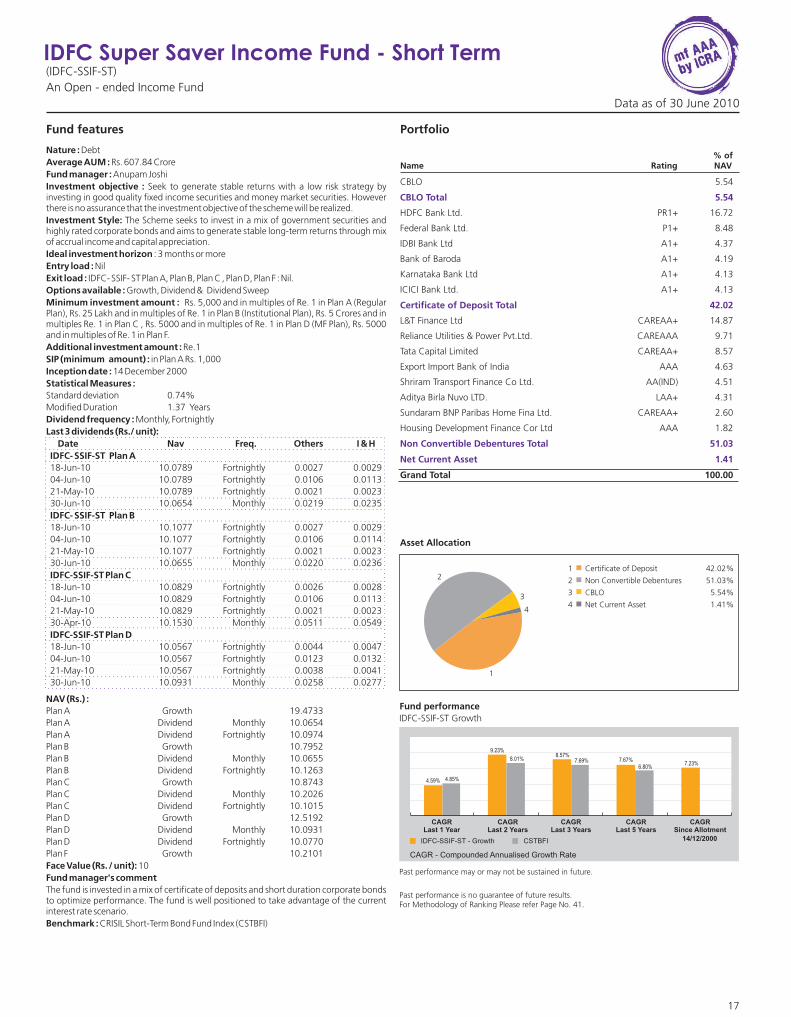
17
Data as of 30 June 2010
IDFC Super Saver Income Fund - Short Term(IDFC-SSIF-ST)An Open - ended Income Fund
1 Certificate of Deposit 42.02%
2 Non Convertible Debentures 51.03%
3 CBLO 5.54%
4 Net Current Asset 1.41%
Portfolio
% of Name Rating NAV
CBLO 5.54
HDFC Bank Ltd. PR1+ 16.72
Federal Bank Ltd. P1+ 8.48
IDBI Bank Ltd A1+ 4.37
Bank of Baroda A1+ 4.19
Karnataka Bank Ltd A1+ 4.13
ICICI Bank Ltd. A1+ 4.13
L&T Finance Ltd CAREAA+ 14.87
Reliance Utilities & Power Pvt.Ltd. CAREAAA 9.71
Tata Capital Limited CAREAA+ 8.57
Export Import Bank of India AAA 4.63
Shriram Transport Finance Co Ltd. AA(IND) 4.51
Aditya Birla Nuvo LTD. LAA+ 4.31
Sundaram BNP Paribas Home Fina Ltd. CAREAA+ 2.60
Housing Development Finance Cor Ltd AAA 1.82
Grand Total 100.00
CBLO Total 5.54
Certificate of Deposit Total 42.02
Non Convertible Debentures Total 51.03
Net Current Asset 1.41
Fund features
Asset Allocation
Fund performance IDFC-SSIF-ST Growth
Past performance may or may not be sustained in future.
1
2
3
4
Nature : DebtAverage AUM : Rs. 607.84 CroreFund manager : Anupam JoshiInvestment objective : Seek to generate stable returns with a low risk strategy by investing in good quality fixed income securities and money market securities. However there is no assurance that the investment objective of the scheme will be realized.Investment Style: The Scheme seeks to invest in a mix of government securities and highly rated corporate bonds and aims to generate stable long-term returns through mix of accrual income and capital appreciation.Ideal investment horizon : 3 months or moreEntry load : NilExit load : IDFC- SSIF- ST Plan A, Plan B, Plan C , Plan D, Plan F : Nil. Options available : Growth, Dividend & Dividend Sweep Minimum investment amount : Rs. 5,000 and in multiples of Re. 1 in Plan A (Regular Plan), Rs. 25 Lakh and in multiples of Re. 1 in Plan B (Institutional Plan), Rs. 5 Crores and in multiples Re. 1 in Plan C , Rs. 5000 and in multiples of Re. 1 in Plan D (MF Plan), Rs. 5000 and in multiples of Re. 1 in Plan F.Additional investment amount : Re.1SIP (minimum amount) : in Plan A Rs. 1,000Inception date : 14 December 2000Statistical Measures : Standard deviation 0.74%Modified Duration 1.37 YearsDividend frequency : Monthly, Fortnightly Last 3 dividends (Rs./ unit): Date Nav Freq. Others I & HIDFC- SSIF-ST Plan A18-Jun-10 10.0789 Fortnightly 0.0027 0.002904-Jun-10 10.0789 Fortnightly 0.0106 0.011321-May-10 10.0789 Fortnightly 0.0021 0.002330-Jun-10 10.0654 Monthly 0.0219 0.0235IDFC- SSIF-ST Plan B18-Jun-10 10.1077 Fortnightly 0.0027 0.002904-Jun-10 10.1077 Fortnightly 0.0106 0.011421-May-10 10.1077 Fortnightly 0.0021 0.002330-Jun-10 10.0655 Monthly 0.0220 0.0236IDFC-SSIF-ST Plan C18-Jun-10 10.0829 Fortnightly 0.0026 0.002804-Jun-10 10.0829 Fortnightly 0.0106 0.011321-May-10 10.0829 Fortnightly 0.0021 0.002330-Apr-10 10.1530 Monthly 0.0511 0.0549IDFC-SSIF-ST Plan D18-Jun-10 10.0567 Fortnightly 0.0044 0.004704-Jun-10 10.0567 Fortnightly 0.0123 0.013221-May-10 10.0567 Fortnightly 0.0038 0.004130-Jun-10 10.0931 Monthly 0.0258 0.0277
NAV (Rs.) :Plan A Growth 19.4733Plan A Dividend Monthly 10.0654Plan A Dividend Fortnightly 10.0974Plan B Growth 10.7952Plan B Dividend Monthly 10.0655Plan B Dividend Fortnightly 10.1263Plan C Growth 10.8743Plan C Dividend Monthly 10.2026Plan C Dividend Fortnightly 10.1015Plan D Growth 12.5192Plan D Dividend Monthly 10.0931Plan D Dividend Fortnightly 10.0770Plan F Growth 10.2101Face Value (Rs. / unit): 10Fund manager's commentThe fund is invested in a mix of certificate of deposits and short duration corporate bonds to optimize performance. The fund is well positioned to take advantage of the current interest rate scenario. Benchmark : CRISIL Short-Term Bond Fund Index (CSTBFI)
CAGR Last 1 Year
CAGR Last 2 Years
CAGR Last 3 Years
CAGR Last 5 Years
CAGR Since Allotment
14/12/2000IDFC-SSIF-ST - Growth CSTBFI
CAGR - Compounded Annualised Growth Rate
Past performance is no guarantee of future results.For Methodology of Ranking Please refer Page No. 41.
9.23%8.57%
7.67%
4.59%
7.23%
4.85%
8.01% 7.69%6.80%

18
IDFC Cash Fund(IDFC-CF)An Open - Ended Liquid Fund
Data as of 30 June 2010
1 CBLO 3.10%
2 Certificate of Deposit 85.46%
3 Commercial Paper 5.74%
4 Fixed Deposits 5.80%
5 Net Current Asset -0.09%
Portfolio
% of Name Rating NAV
CBLO 3.10
State Bank of Hyderabad A1+ 10.08
Central Bank of India PR1+ 7.76
State Bank of Patiala A1+ 7.46
Punjab National Bank PR1+ 7.21
State Bank of Patiala P1+ 5.75
ING Vysya Bank Ltd. P1+ 5.74
Karur Vysya Bank Ltd. A1+ 5.73
UCO Bank P1+ 5.73
Canara Bank PR1+ 4.31
Andhra Bank Ltd F1+(IND) 3.55
State Bank of Travancore P1+ 3.45
Federal Bank Ltd. P1+ 2.88
ICICI Bank Ltd. A1+ 2.87
State Bank of Mysore A1+ 2.87
Indusind Bank Limited P1+ 2.87
Jammu & Kashmir Bank Limited P1+ 2.86
Yes Bank Ltd. A1+ 1.45
United Bank of India Ltd. A1+ 1.44
Export Import Bank of India AAA 1.43
ONGC Videsh Limited P1+ 5.74
Grand Total 100.00
CBLO Total 3.10
Certificate of Deposit Total 85.46
Commercial Paper Total 5.74
Fixed Deposits - Total 5.80
Net Current Asset -0.09
Fund features
Nature : Liquid FundAverage AUM : Rs. 1,333.08 CroreFund manager : Anupam JoshiInvestment objective : IDFC-CF is an open-ended liquid fund with an objective to generate optimal returns with high liquidity by investing in high quality money market and debt instruments. However there is no assurance that the investment objective of the scheme will be realized.Investment Style: The Scheme aims to invest in a highly quality money market instruments with high liquidity and seeks to generate accrual income with low volatility.Ideal investment horizon : 1 day or moreEntry load : NilExit load : NilOptions available : Growth, Dividend & Dividend Sweep (w.e.f. 16-Nov-2009)Minimum investment amount : Rs. 5,000 and in multiples of Re. 1 in Plan A (Regular Plan), Rs. 1 Crore and in multiples of Re. 1 in Plan B (Institutional Plan), Rs. 5 Crores and in multiples Re. 1 in Plan C (Super Institutional Plan).Additional investment amount : Re.1SIP (minimum amount) : NAInception date : 2 July 2001Statistical Measures : Standard deviation 0.12%Modified Duration 61.38 daysDividend frequency : Daily, Weekly with compulsory re-investment, Periodic (in Plan B only) and Monthly (in Plan C only)Last 3 dividends (Rs./ unit) : Date Nav Freq. Others I & HIDFC- CF Plan A30-Jun-10 10.5819 Daily 0.00108547 0.0010854729-Jun-10 10.5819 Daily 0.00112628 0.0011262828-Jun-10 10.5819 Daily 0.00111997 0.0011199725-Jun-10 10.0101 Weekly 0.0073 0.007318-Jun-10 10.0101 Weekly 0.0073 0.007311-Jun-10 10.0101 Weekly 0.0069 0.0069IDFC-CF Plan B30-Jun-10 10.5873 Daily 0.00108279 0.0010827929-Jun-10 10.5873 Daily 0.00112184 0.0011218428-Jun-10 10.5873 Daily 0.00111536 0.0011153618-Jun-10 10.0000 Weekly 0.0053 0.005328-May-10 10.0000 Weekly 0.0045 0.004514-May-10 10.0000 Weekly 0.0026 0.0026IDFC-CF Plan C30-Jun-10 10.0025 Daily 0.00113854 0.0011385429-Jun-10 10.0025 Daily 0.00116991 0.0011699128-Jun-10 10.0025 Daily 0.00114633 0.0011463304-Jun-10 10.0000 Weekly 0.0011 0.001121-Aug-09 10.0102 Weekly 0.0063 0.006314-Aug-09 10.0102 Weekly 0.0065 0.006531-Dec-09 10.0000 Monthly 0.0270 0.0270
NAV (Rs.) :Plan A Growth 16.5963Plan A Dividend Daily 10.5819Plan A Dividend Weekly 10.0169Plan B Growth (IP ) 16.7218Plan B Dividend (IP ) Daily 10.5873Plan B Dividend (IP ) Weekly -Plan C Growth (SIP ) 11.3270Plan C Dividend (SIP ) Daily 10.0025Plan C Dividend (SIP) Monthly -Face Value (Rs. / unit): 10Fund manager's commentThe scheme is well positioned for a period of anticipated liquidity easing enabling it to deliver returns while managing the flows. Benchmark : Crisil Liquid Fund Index (CLFI)
Asset Allocation
Fund performance IDFC-CF - Growth
Past performance may or may not be sustained in future.
1
2
3
45
IDFC-CF - Growth CLFI
CAGR - Compounded Annualised Growth Rate
CAGR Last 1 Year
CAGR Last 2 Years
CAGR Since
Allotment
02/07/2001
CAGR Last 3 Years
( )30 Days
Annualised( )15 Days
Annualised( )7 Days
Annualised CAGR Last 5 Years
Past performance is no guarantee of future results.For Methodology of Ranking Please refer Page No. 41.
4.87% 4.89% 4.77%3.94%
5.69% 5.78% 5.87% 5.79%
5.20% 5.18%4.88%
3.29%
5.81%6.13% 6.20%
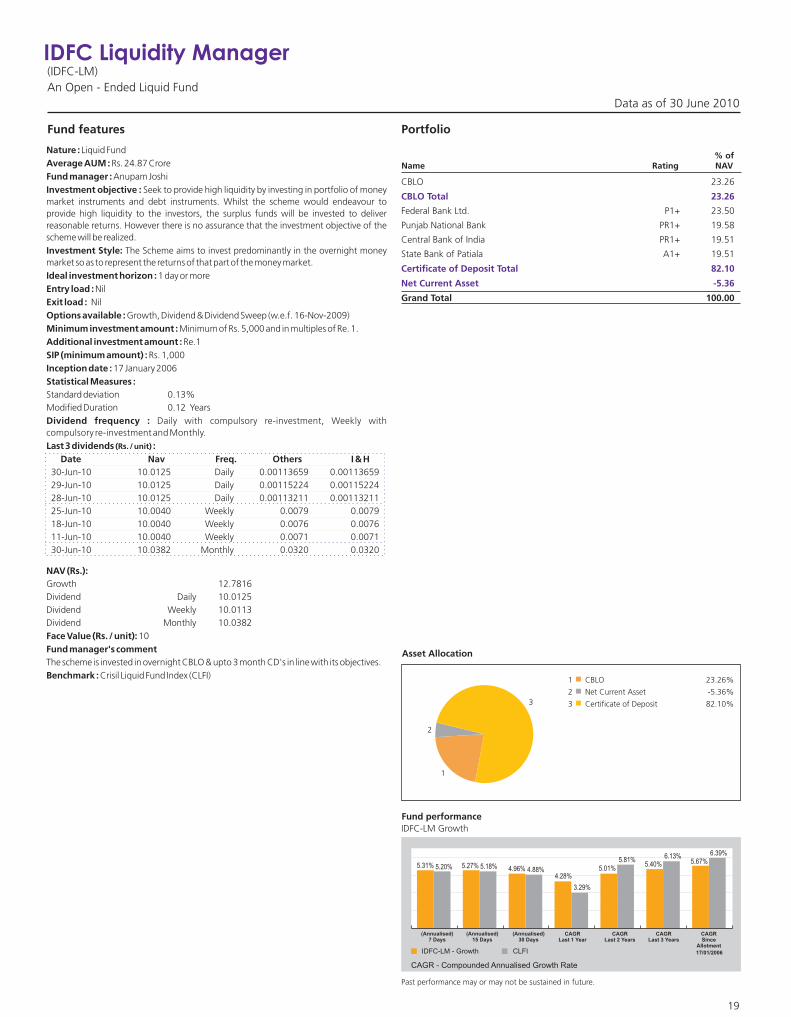
1 CBLO 23.26%
2 Net Current Asset -5.36%
3 Certificate of Deposit 82.10%
Portfolio
% of Name Rating NAV
CBLO 23.26
Federal Bank Ltd. P1+ 23.50
Punjab National Bank PR1+ 19.58
Central Bank of India PR1+ 19.51
State Bank of Patiala A1+ 19.51
Grand Total 100.00
CBLO Total 23.26
Certificate of Deposit Total 82.10
Net Current Asset -5.36
IDFC Liquidity Manager(IDFC-LM)An Open - Ended Liquid Fund
Fund features
Nature : Average AUM : Rs. 24.87 CroreFund manager : Anupam JoshiInvestment objective :
Investment Style: The Scheme aims to invest predominantly in the overnight money market so as to represent the returns of that part of the money market.Ideal investment horizon : 1 day or moreEntry load : NilExit load : NilOptions available : Growth, Dividend & Dividend Sweep (w.e.f. 16-Nov-2009)Minimum investment amount : Minimum of Rs. 5,000 and in multiples of Re. 1.Additional investment amount : Re.1SIP (minimum amount) : Rs. 1,000Inception date : 17 January 2006Statistical Measures : Standard deviation 0.13%Modified Duration 0.12 YearsDividend frequency : Daily with compulsory re-investment, Weekly with compulsory re-investment and Monthly.Last 3 dividends (Rs. / unit) : Date Nav Freq. Others I & H30-Jun-10 10.0125 Daily 0.00113659 0.0011365929-Jun-10 10.0125 Daily 0.00115224 0.0011522428-Jun-10 10.0125 Daily 0.00113211 0.0011321125-Jun-10 10.0040 Weekly 0.0079 0.007918-Jun-10 10.0040 Weekly 0.0076 0.0076 11-Jun-10 10.0040 Weekly 0.0071 0.007130-Jun-10 10.0382 Monthly 0.0320 0.0320
NAV (Rs.):Growth 12.7816Dividend Daily 10.0125Dividend Weekly 10.0113Dividend Monthly 10.0382Face Value (Rs. / unit): 10Fund manager's commentThe scheme is invested in overnight CBLO & upto 3 month CD's in line with its objectives.Benchmark : Crisil Liquid Fund Index (CLFI)
Liquid Fund
Seek to provide high liquidity by investing in portfolio of money market instruments and debt instruments. Whilst the scheme would endeavour to provide high liquidity to the investors, the surplus funds will be invested to deliver reasonable returns. However there is no assurance that the investment objective of the scheme will be realized.
Data as of 30 June 2010
Asset Allocation
Fund performance IDFC-LM Growth
Past performance may or may not be sustained in future.
IDFC-LM - Growth CLFI
CAGR - Compounded Annualised Growth Rate
CAGR Last 1 Year
CAGR Last 2 Years
CAGR Since
Allotment
17/01/2006
CAGR Last 3 Years
(Annualised)30 Days
(Annualised)15 Days
(Annualised)7 Days
19
1
2
3
4.96%
6.13% 6.39%
5.31% 5.27%
4.28%5.01%
5.40% 5.67%5.20% 5.18% 4.88%
3.29%
5.81%
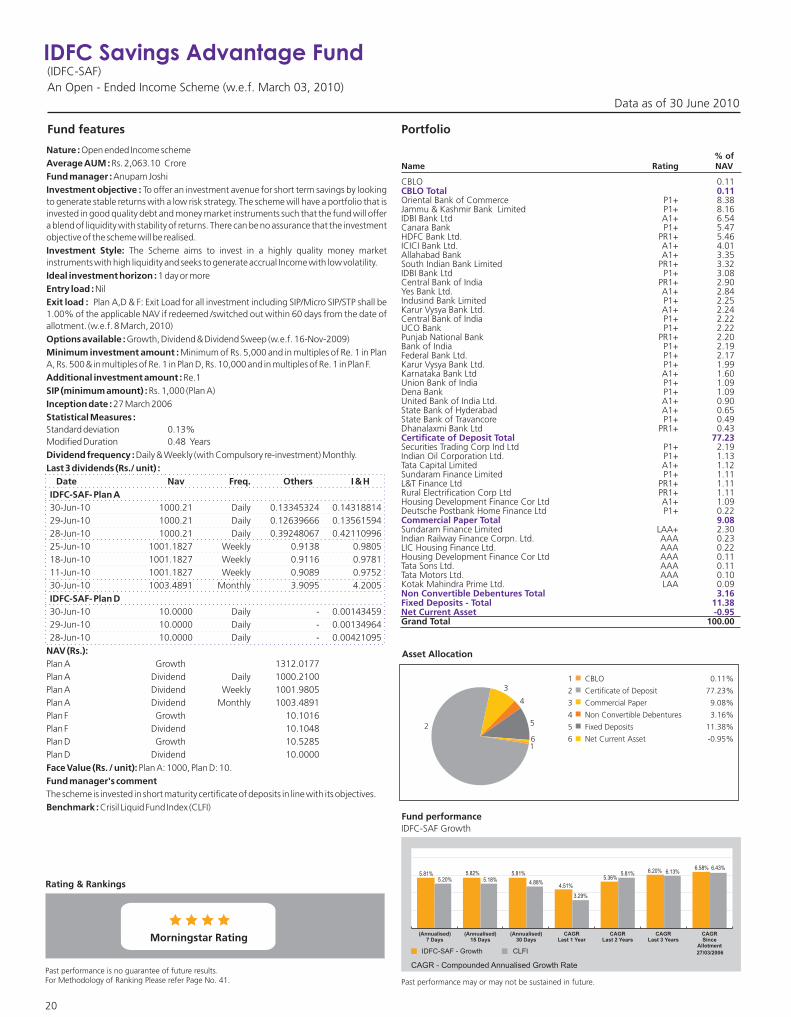
20
IDFC Savings Advantage Fund(IDFC-SAF)An Open - Ended Income Scheme (w.e.f. March 03, 2010)
Data as of 30 June 2010
1 CBLO 0.11%
2 Certificate of Deposit 77.23%
3 Commercial Paper 9.08%
4 Non Convertible Debentures 3.16%
5 Fixed Deposits 11.38%
6 Net Current Asset -0.95%
Portfolio
% of Name Rating NAV
CBLO 0.11
Oriental Bank of Commerce P1+ 8.38Jammu & Kashmir Bank Limited P1+ 8.16IDBI Bank Ltd A1+ 6.54Canara Bank P1+ 5.47HDFC Bank Ltd. PR1+ 5.46ICICI Bank Ltd. A1+ 4.01Allahabad Bank A1+ 3.35South Indian Bank Limited PR1+ 3.32IDBI Bank Ltd P1+ 3.08Central Bank of India PR1+ 2.90Yes Bank Ltd. A1+ 2.84Indusind Bank Limited P1+ 2.25Karur Vysya Bank Ltd. A1+ 2.24Central Bank of India P1+ 2.22UCO Bank P1+ 2.22Punjab National Bank PR1+ 2.20Bank of India P1+ 2.19Federal Bank Ltd. P1+ 2.17Karur Vysya Bank Ltd. P1+ 1.99Karnataka Bank Ltd A1+ 1.60Union Bank of India P1+ 1.09Dena Bank P1+ 1.09United Bank of India Ltd. A1+ 0.90State Bank of Hyderabad A1+ 0.65State Bank of Travancore P1+ 0.49Dhanalaxmi Bank Ltd PR1+ 0.43
Securities Trading Corp Ind Ltd P1+ 2.19Indian Oil Corporation Ltd. P1+ 1.13Tata Capital Limited A1+ 1.12Sundaram Finance Limited P1+ 1.11L&T Finance Ltd PR1+ 1.11Rural Electrification Corp Ltd PR1+ 1.11Housing Development Finance Cor Ltd A1+ 1.09Deutsche Postbank Home Finance Ltd P1+ 0.22
Sundaram Finance Limited LAA+ 2.30Indian Railway Finance Corpn. Ltd. AAA 0.23LIC Housing Finance Ltd. AAA 0.22Housing Development Finance Cor Ltd AAA 0.11Tata Sons Ltd. AAA 0.11Tata Motors Ltd. AAA 0.10Kotak Mahindra Prime Ltd. LAA 0.09
Grand Total 100.00
CBLO Total 0.11
Certificate of Deposit Total 77.23
Commercial Paper Total 9.08
Non Convertible Debentures Total 3.16Fixed Deposits - Total 11.38Net Current Asset -0.95
Fund features
Nature : Open ended Income schemeAverage AUM : Rs. 2,063.10 CroreFund manager : Anupam JoshiInvestment objective : To offer an investment avenue for short term savings by looking to generate stable returns with a low risk strategy. The scheme will have a portfolio that is invested in good quality debt and money market instruments such that the fund will offer a blend of liquidity with stability of returns. There can be no assurance that the investment objective of the scheme will be realised.Investment Style: The Scheme aims to invest in a highly quality money market instruments with high liquidity and seeks to generate accrual Income with low volatility.Ideal investment horizon : 1 day or moreEntry load : NilExit load : Plan A,D & F: Exit Load for all investment including SIP/Micro SIP/STP shall be 1.00% of the applicable NAV if redeemed /switched out within 60 days from the date of allotment. (w.e.f. 8 March, 2010)Options available : Minimum investment amount : Minimum of Rs. 5,000 and in multiples of Re. 1 in Plan A, Rs. 500 & in multiples of Re. 1 in Plan D, .Additional investment amount : Re.1SIP (minimum amount) : Rs. 1,000 (Plan A)Inception date : 27 March 2006Statistical Measures : Standard deviation 0.13%Modified Duration 0.48 YearsDividend frequency : Daily & Weekly (with Compulsory re-investment) Monthly.Last 3 dividends :
Date Nav Freq. Others I & H
29-Jun-10 1000.21 Daily 0.12639666 0.1356159428-Jun-10 1000.21 Daily 0.39248067 0.4211099625-Jun-10 1001.1827 Weekly 0.9138 0.980518-Jun-10 1001.1827 Weekly 0.9116 0.978111-Jun-10 1001.1827 Weekly 0.9089 0.975230-Jun-10 1003.4891 Monthly 3.9095 4.2005
NAV (Rs.):Plan A Growth 1312.0177Plan A Dividend Daily 1000.2100Plan A Dividend Weekly 1001.9805Plan A Dividend Monthly 1003.4891Plan F Growth 10.1016
Face Value (Rs. / unit): Plan A: 1000, Plan D: 10.Fund manager's commentThe scheme is invested in short maturity certificate of deposits in line with its objectives.Benchmark : Crisil Liquid Fund Index (CLFI)
Growth, Dividend & Dividend Sweep (w.e.f. 16-Nov-2009)
Rs. 10,000 and in multiples of Re. 1 in Plan F
(Rs./ unit)
IDFC-SAF- Plan A30-Jun-10 1000.21 Daily 0.13345324 0.14318814
IDFC-SAF- Plan D30-Jun-10 10.0000 Daily - 0.0014345929-Jun-10 10.0000 Daily - 0.0013496428-Jun-10 10.0000 Daily - 0.00421095
Plan F Dividend 10.1048Plan D Growth 10.5285Plan D Dividend 10.0000
Asset Allocation
Fund performance IDFC-SAF Growth
Past performance may or may not be sustained in future.
2
3
IDFC-SAF - Growth CLFI
CAGR - Compounded Annualised Growth Rate
CAGR Last 1 Year
CAGR Last 2 Years
CAGR Since
Allotment
27/03/2006
CAGR Last 3 Years
(Annualised)30 Days
(Annualised)15 Days
(Annualised)7 Days
Past performance is no guarantee of future results.For Methodology of Ranking Please refer Page No. 41.
Morningstar Rating
Rating & Rankings
4
5
16
5.81% 5.82% 5.81%
4.51%
5.36%6.20%
6.58%
5.20% 5.18% 4.88%
3.29%
5.81% 6.13%6.43%

21
IDFC Money Manager Fund - Treasury Plan(IDFC-MMF-TP)An Open - Ended Income Fund
Data as of 30 June 2010
1 CBLO 5.32%2 Certificate of Deposit 74.22%3 Commercial Paper 4.82%4 Floating Rate Note 12.18%5 Non Convertible Debentures 3.86%6 Zero Coupon Bonds 2.47%7 Pass Through Certificates 0.09%8 Treasury Bills 0.48%9 Net Current Asset -3.45%
Portfolio
% of Name Rating NAV
CBLO 5.32
Union Bank of India P1+ 6.55State Bank of Patiala A1+ 6.21Canara Bank P1+ 6.12Punjab and Sind Bank A1+ 5.51Andhra Bank Ltd F1+(IND) 5.43ICICI Bank Ltd. A1+ 5.40Allahabad Bank P1+ 5.30Indusind Bank Limited P1+ 4.84Vijaya Bank PR1+ 4.80Punjab National Bank PR1+ 4.42Federal Bank Ltd. P1+ 3.36Central Bank of India PR1+ 3.05Yes Bank Ltd. A1+ 2.75Central Bank of India P1+ 2.75State Bank of Hyderabad A1+ 1.80Oriental Bank of Commerce P1+ 1.37State Bank of Mysore A1+ 0.69IDBI Bank Ltd P1+ 0.69Export Import Bank of India AAA 0.69Corporation Bank P1+ 0.69Union Bank of India A1+ 0.69Dena Bank P1+ 0.69State Bank of Travancore P1+ 0.42
Export Import Bank of India P1+ 2.75Aditya Birla Finance Ltd A1+ 0.69Steel Authority of India Ltd. PR1+ 0.69IDBI Home Finance Ltd. A1+ 0.69
Housing Development Finance Cor Ltd AAA 2.82Indian Railway Finance Corpn. Ltd. AAA 2.79LIC Housing Finance Ltd. AAA 1.95Export Import Bank of India AAA 1.40Union Bank of India AAA 1.12Axis Bank Limited LAAA 1.12Power Finance Corporation Limited AAA 0.56ICICI Bank Ltd. LAAA 0.42
Power Finance Corporation Limited AAA 1.26Housing Development Finance Cor Ltd AAA 0.77Deutsche Postbank Home Finance Ltd AA+ 0.71ICICI Bank Ltd. LAAA 0.56Export Import Bank of India AAA 0.28Sundaram Finance Limited LAA+ 0.14Indian Railway Finance Corpn. Ltd. AAA 0.14
Loan Sec Trust ICICI Bank Ser XVI AAA(SO) 0.09
Housing Development Finance Cor Ltd AAA 2.33Infrastructure Development Finance Company Ltd. LAAA 0.14
91 Days Tbill MD 17-09-2010 SOV 0.48
Grand Total 100.00
CBLO Total 5.32
Certificate of Deposit Total 74.22
Commercial Paper Total 4.82
Floating Rate Note Total 12.18
Non Convertible Debentures Total 3.86
Pass Through Certificates Total 0.09
Zero Coupon Bonds Total 2.47
Treasury Bills Total 0.48Net Current Asset -3.45
Fund features
Nature : Debt FundAverage AUM : Rs. 5,274.30 CroreFund manager : Anupam JoshiInvestment objective : Seek to generate stable returns with a low risk strategy by creating a portfolio that is substantially invested in good quality floating rate debt or money market instruments, fixed rate debt or money market instruments swapped for floating returns and fixed rate debt and money market instruments. However there is no assurance that the investment objective of the scheme will be realized.Investment Style: The Scheme aims to invest only in highly rated money market instruments including floating rate instruments with short term benchmarks. The Scheme seeks to generate returns predominantly through accrual income.Ideal investment horizon : 1 day or moreEntry load : NilExit load : IDFC-MMF - TP : Plan A, Plan B, Plan C, Plan D & Plan F : Nil. Options available : Growth, Dividend & Dividend Sweep Minimum investment amount : Rs. 5,000 and in multiples of Re. 1 in Plan A (Regular Plan), Rs. 1 Crore and in multiples of Re. 1 in Plan B (Institutional Plan), Rs. 5 Crores and in multiples Re. 1 in Plan C (Super Institutional Plan), Rs. 25,000 and in multiples Re. 1 in Plan D, Rs. 5,000 and in multiples of Re. 1 in Plan F.Additional investment amount : Re.1SIP (minimum amount) : Rs. 1,000 (Plan A)Inception date : 18 Feb 2003Statistical Measures : Standard deviation 0.11%Modified Duration 87.27 DaysDividend frequency : Monthly & Daily / Weekly with compulsory reinvestmentLast 3 dividends (Rs./ unit): Date Nav Freq. Others I & HIDFC- MMF -TP Plan A30-Jun-10 10.0699 Daily 0.00107909 0.0011578029-Jun-10 10.0699 Daily 0.00089080 0.0009557828-Jun-10 10.0699 Daily 0.00334093 0.0035846425-Jun-10 10.0128 Weekly 0.0081 0.008718-Jun-10 10.0128 Weekly 0.0074 0.007911-Jun-10 10.0128 Weekly 0.0069 0.007430-Jun-10 10.0816 Monthly 0.0261 0.0280IDFC-MMF -TP Plan B30-Jun-10 10.0703 Daily 0.00111293 0.0011941229-Jun-10 10.0703 Daily 0.00108312 0.0011621328-Jun-10 10.0703 Daily 0.00339085 0.0036382025-Jun-10 10.0234 Weekly 0.0083 0.008918-Jun-10 10.0234 Weekly 0.0079 0.008411-Jun-10 10.0234 Weekly 0.0075 0.008130-Jun-10 10.0685 Monthly 0.0340 0.0365IDFC-MMF -TP Plan C30-Jun-10 10.0015 Daily 0.00118517 0.0012716229-Jun-10 10.0015 Daily 0.00108712 0.0011664128-Jun-10 10.0015 Daily 0.00340861 0.0036572525-Jun-10 10.0120 Weekly 0.0082 0.008818-Jun-10 10.0120 Weekly 0.0075 0.008011-Jun-10 10.0115 Weekly 0.0040 0.004330-Jun-10 10.0000 Monthly 0.0341 0.0366IDFC-MMF -TP Plan D30-Jun-10 10.0007 Daily 0.00093727 0.0010055929-Jun-10 10.0007 Daily 0.00074762 0.0008020828-Jun-10 10.0007 Daily 0.00291472 0.00312736
NAV (Rs.) :Plan A Growth 14.9944Plan A Dividend Monthly 10.0816Plan A Dividend Daily 10.0699Plan A Dividend Weekly 10.0192Plan B Growth 14.9099Plan B Dividend Daily 10.0703Plan B Dividend Weekly 10.0302Plan B Dividend Monthly 10.0685Plan C Dividend Daily 10.0015Plan C Growth 11.0548Plan C Dividend Weekly 10.0189Plan C Dividend Monthly 10.0000Plan D Growth 10.4129Plan D Dividend Daily 10.0007Plan F Growth 10.1647Face Value (Rs. / unit): 10Fund manager's commentThe scheme is invested in short maturity liquid instruments in line with its objectives to deliver marginally higher returns over cash fund.Benchmark : NSE MIBOR INDEX
Asset Allocation
Fund performance IDFC-MMF-TP Growth
Past performance may or may not be sustained in future.
1
2
3
4
5678
For Methodology of Ranking Please refer Page No. 41.
9
18/02/2003IDFC-MMF-TP - Growth NSE MIBOR
CAGR - Compounded Annualised Growth Rate
CAGR Last 1 Year
CAGR Last 2 Years
CAGR Since
Allotment
CAGR Last 3 Years
( )30 Days
Annualised( )15 Days
Annualised( )7 Days
Annualised CAGR Last 5 Years
4.87% 4.93% 4.73%4.37%
6.00% 6.00% 5.98%5.65%5.50% 5.44% 5.40%
3.68%
5.08%5.57%
6.00%5.66%

22
(IDFC-MMF-IP)An Open - Ended Income Fund
Data as of 30 June 2010
IDFC Money Manager Fund - Investment Plan
1 CBLO 0.04%2 Net Current Asset -9.31%3 Certificate of Deposit 109.28%
Portfolio
% of Name Rating NAV
CBLO 0.04
Oriental Bank of Commerce P1+ 13.39Andhra Bank Ltd F1+(IND) 13.03Punjab National Bank PR1+ 11.46Bank of Maharashtra. A1+ 8.03ICICI Bank Ltd. A1+ 6.44State Bank of Travancore P1+ 6.39Corporation Bank P1+ 6.01Central Bank of India PR1+ 4.80IDBI Bank Ltd A1+ 4.59Federal Bank Ltd. P1+ 3.71Punjab and Sind Bank A1+ 3.31Dhanalaxmi Bank Ltd PR1+ 2.67ING Vysya Bank Ltd. P1+ 2.65Yes Bank Ltd. A1+ 2.26State Bank of Bikaner & Jaipur P1+ 2.01State Bank of Patiala A1+ 2.00HDFC Bank Ltd. PR1+ 1.98Karur Vysya Bank Ltd. A1+ 1.60Vijaya Bank PR1+ 1.55United Bank of India Ltd. PR1+ 1.34Bank of Baroda A1+ 1.33Dena Bank F1+(IND) 1.32Union Bank of India A1+ 1.32Allahabad Bank A1+ 0.93State Bank of Patiala P1+ 0.67Indusind Bank Limited P1+ 0.67State Bank of Mysore A1+ 0.67UCO Bank P1+ 0.66Central Bank of India P1+ 0.66Indian Bank F1+(IND) 0.66Canara Bank P1+ 0.52IDBI Bank Ltd P1+ 0.41Jammu & Kashmir Bank Limited P1+ 0.23
Grand Total 100.00
CBLO Total 0.04
Certificate of Deposit Total 109.28Net Current Asset -9.31
Fund featuresNature : DebtAverage AUM : Rs. 5,394.97 CroreFund Manager : Anupam Joshi Investment objective : Seek to generate stable returns with a low risk strategy by creating a portfolio that is substantially invested in good quality floating rate debt or money market instruments, fixed rate debt or money market instruments swapped for floating returns and fixed rate debt and money market instruments. However there is no assurance that the investment objective of the scheme will be realized.Investment Style : The Scheme aims to invest in highly rated money market instruments including floating rate instruments with short term benchmarks. The Scheme seeks to generate returns predominantly through accrual income.Ideal investment horizon : 1 day or moreEntry Load : NilExit Load : Plan A, Plan B & Plan F: Exit Load for all investment including SIP/Micro SIP/STP shall be 1.00% of the applicable NAV if redeemed / switched out within 30 days from the date of allotment. (w.e.f. 8 March, 2010)Options available : Growth, Dividend & Dividend Sweep Minimum investment amount : Rs. 5000 and in multiples of Re.1 in plan A (Regular Plan), Rs. 1 Crore and in multiplies of Re.1 in plan B (institutional Plan), Rs. 5000 and in multiples of Re.1 in plan F.Additional investment amount : Re.1SIP (minimum amount) : Rs. 1000 (Plan A)Inception Date : 9 August 2004Statistical Measures : Standard deviation 0.12%Modified Duration 123.51 DaysDividend frequency : Daily, weekly (with reinvest facility in both plan A & plan B), Monthly, Quarterly & Annual. Last 3 Dividends (Rs./ unit) : Date Nav freq. Others I & HIDFC-MMF-IP Plan A30-Jun-10 10.0150 Daily 0.00115821 0.0012426929-Jun-10 10.0150 Daily 0.00099313 0.0010655928-Jun-10 10.0150 Daily 0.00343263 0.0036830325-Jun-10 10.0130 Weekly 0.0075 0.008118-Jun-10 10.0130 Weekly 0.0073 0.007811-Jun-10 10.0130 Weekly 0.0077 0.008330-Jun-10 10.0434 Monthly 0.0323 0.034730-Jun-10 10.2212 Quarterly 0.0860 0.092231-Mar-10 10.2022 Quarterly 0.0916 0.098530-Mar-09 10.5505 Annual 0.4158 0.4467IDFC-MMF-IP Plan B30-Jun-10 10.0150 Daily 0.00128297 0.0013765629-Jun-10 10.0150 Daily 0.00113522 0.0012180228-Jun-10 10.0150 Daily 0.00373450 0.0040069325-Jun-10 10.0177 Weekly 0.0084 0.009018-Jun-10 10.0177 Weekly 0.0081 0.008711-Jun-10 10.0177 Weekly 0.0081 0.008730-Jun-10 10.0007 Monthly 0.0354 0.0379
NAV (Rs.) :Plan A Growth 14.2430Plan A Dividend Quarterly 10.2212Plan A Dividend Annual 11.2092Plan A Dividend Monthly 10.0434Plan A Dividend Daily 10.0150Plan A Dividend Weekly 10.0198Plan B Growth 14.5198Plan B Dividend Weekly 10.0252Plan B Dividend Daily 10.0150Plan B Dividend Monthly 10.0007Plan F Growth 10.1713Plan F Dividend -Face Value (Rs. / unit) : 10Fund Manager's comment The scheme is invested in certificate of deposits in line with its objectives.Benchmark : NSE MIBOR INDEX
Asset Allocation
Fund performance IDFC-MMF-IP Growth
Past performance may or may not be sustained in future.
2
3
CAGR Last 1 Year
CAGR Last 2 Years
CAGR Since
Allotment
CAGR Last 3 Years
( )30 Days
Annualised( )15 Days
Annualised( )7 Days
Annualised CAGR Last 5 Years
18/02/2003IDFC-MMF-IP - Growth NSE MIBOR
CAGR - Compounded Annualised Growth Rate
1
Past performance is no guarantee of future results.For Methodology of Ranking Please refer Page No. 41.
Morningstar Rating
Rating & Rankings
4.95% 4.83% 4.79% 4.93%
6.00%6.61% 6.33% 6.19%
5.50% 5.44% 5.40%
3.68%
5.08%5.57%
6.00% 5.86%

23
1 Govt Securities (GSE) 96.38%
2 Net Current Asset 1.40%
3 CBLO 2.23%
IDFC Government Securities Fund - Investment Plan(IDFC-GSF-IP)An Open Ended - Dedicated Gilt Fund
Data as of 30 June 2010
Portfolio
% of Name Rating NAV
CBLO 2.23
8.20% GOI MD 15/02/2022 SOV 56.79
7.80% GOI MD 03/05/2020 SOV 39.59
Grand Total 100.00
CBLO TOTAL 2.23
Govt Securities (GSE) Total 96.38
Net Current Asset 1.40
Fund features
Nature : DebtAverage AUM : Rs. 9.29 CroreFund Manager : Arjun Parthasarthy Investment objective : IDFC – GSF -IP is an open-ended dedicated gilt scheme with an objective to generate optimal returns with high liquidity by investing Government Securities. However there is no assurance that the investment objective of the scheme will be realized.Investment Style : The Scheme proposes to invest only in government securities with the aim of generating stable medium-term returns.Ideal investment horizon : 1 year or more Entry Load : NilExit Load : IDFC-GSF - IP : Plan A & Plan B : 1.00% of NAV on investors who purchase/switch in and seek to redeem/switch out such units within 365 days from the date of effecting such purchase/switch in. Investors opting for PEP / Dividend reinvestment option / SWP or switch between options will not be levied an exit load. (w.e.f. August 24, 2009)Options available : Growth, Dividend & Dividend Sweep (w.e.f. 16-Nov-2009)Minimum investment amount : Rs. 5000 and in multiples of Re. 1 in Plan A (Regular Plan), Rs. 25 Lakh and in multiples of Re. 1 in Plan B (Institutional Plan). (w.e.f. July 6, 2009)Additional investment amount : Re. 1SIP (minimum amount) : Rs. 1000 (Plan A)Inception Date : 9 March 2002Statistical Measures : Standard deviation 2.13%Modified Duration 6.78 YearsDividend frequency : Quarterly / Half yearly / Yearly. Last 3 Dividends (Rs. / unit) : Date NAV Freq. Others I & H
IDFC-GSF-IP Plan A29-Sep-09 10.7372 Half Yearly 0.3769 0.404930-Jun-09 10.5064 Quarterly 0.3098 0.332930-Mar-09 10.4055 Quarterly 0.3098 0.332908-Dec-08 11.1693 Quarterly 0.6522 0.700830-Mar-09 10.7886 Half Yearly 0.6196 0.665730-Mar-09 11.0733 Annual 0.8479 0.911030-Sep-08 10.4494 Half Yearly 0.3261 0.350424-Mar-08 10.7722 Annual 0.4076 0.4380IDFC-GSF-IP Plan B30-Jun-09 10.1637 0.0815 0.0876
NAV (Rs.) :Plan A Growth 17.7638Plan A Dividend Quarterly 10.6535Plan A Dividend Half Yearly 10.9728Plan A Dividend Annual 11.7471Plan B Growth 10.3614Plan B Dividend 10.3575Face Value (Rs. / unit) : 10Benchmark : ISEC Composite INDEXFund manager's commentThe funds are positioned in the segment of the yield curve where returns will be optimum.
Asset Allocation
Fund performance IDFC-GSF-IP Growth
Past performance may or may not be sustained in future.
1
2
CAGR Last 1 Year
CAGR Last 2 Years
CAGR Last 3 Years
CAGR Last 5 Years
CAGR Since Allotment
09/03/2002IDFC-GSF-IP - Growth ISCI
CAGR - Compounded Annualised Growth Rate
9.24%8.48%
1.40%
7.23% 7.15%
4.49%
11.15%
8.84%
7.29%
3

1 Net Current Asset -168.38%
2 Treasury Bills 268.38%
Portfolio
% of Name Rating NAV
91 Days Tbill MD 17-09-2010 SOV 268.38
Grand Total 100.00
Treasury Bills Total 268.38
Net Current Asset -168.38
IDFC Government Securities Fund - Short Term Plan(IDFC-GSF-ST)An Open Ended - Dedicated Gilt Fund
Fund features
Nature : DebtAverage AUM : Rs. 1.47 CroreFund Manager : Arjun Parthasarthy Investment objective : IDFC – GSF-ST is an open-ended dedicated gilt scheme with an objective to generate optimal returns with high liquidity by investing Government Securities.
Investment Style : The Scheme proposes to invest only in government securities with the aim of generating stable medium-term returns.Ideal investment horizon : 1 day or more Entry Load : NilExit Load : IDFC-GSF - ST Plan A & Plan B: 0.25% of NAV on investors who purchase / switch in and seek to redeem / switch out such units within 30 days from the date of effecting such purchase / switch in. Investors opting for PEP/Dividend reinvestment option / SWP or switch between options will not be levied an exit load. (w.e.f. August 24, 2009)Options available : Minimum investment amount : Rs. 5000 and in multiples of Re. 1 in Plan A (Regular Plan), Rs. 25 Lakh and in multiples of Re. 1 in Plan B (Institutional Plan) (w.e.f. July 6, 2009)Additional investment amount : Re. 1SIP (minimum amount) : Rs. 1000 (Plan A)Inception Date : 9 March 2002Statistical Measures : Standard deviation 0.87%Modified Duration 0.56 YearsDividend frequency : Quarterly /Monthly Last 3 Dividends : Date NAV Freq. Others I & HIDFC-GSF-ST Plan A
30-Jun-10 10.0164 Monthly 0.0503 0.0540
IDFC-GSF-ST Plan B
31-Jul-09 10.0086 Weekly 0.0025 0.0027
NAV (Rs.) :Plan A Growth 13.9086Plan A Dividend Monthly 10.0164Plan A Dividend Quarterly 10.0939
Face Value (Rs. / unit) : 10Fund manager’s comment : The fund has a good mix of short dated treasury bills and overnight money markets to reduce volatility. Benchmark : ISEC Composite INDEX
However there is no assurance that the investment objective of the scheme will be realized.
Growth, Dividend & Dividend Sweep (w.e.f. 16-Nov-2009)
(Rs. / unit)
07-Aug-09 10.0084 Weekly 0.0022 0.002431-Jul-09 10.0084 Weekly 0.0025 0.002724-Jul-09 10.0084 Weekly 0.0014 0.0015
30-Jun-10 10.0939 Quarterly 0.0398 0.042731-Mar-10 10.0474 Quarterly 0.0381 0.0409
21-Aug-09 10.0086 Weekly 0.0023 0.002514-Aug-09 10.0086 Weekly 0.0017 0.0018
31-Mar-10 10.0637 Quarterly 0.0381 0.040931-Dec-09 10.0619 Quarterly 0.0174 0.0187
Plan A Dividend Weekly -Plan B Growth -Plan B Dividend Weekly -Plan B Dividend Quarterly -
Data as of 30 June 2010
Asset Allocation
Fund performance IDFC-GSF-ST Growth
Past performance may or may not be sustained in future.
CAGR Last 1 Year
CAGR Last 2 Years
CAGR Last 3 Years
CAGR Last 5 Years
CAGR Since Allotment
09/03/2002IDFC-GSF-ST - Growth ISCI
CAGR - Compounded Annualised Growth Rate
24
1
2
2.15%2.96% 2.96%
3.37%4.05%4.49%
11.15%
8.84%
7.29%

1 Treasury Bills 20.18%
2 Govt Securities (GSE) 74.35%
3 Net Current Asset 5.47%
Portfolio % of
Name Rating NAV
8.20% GOI MD 15/02/2022 SOV 55.827.80% GOI MD 03/05/2020 SOV 18.53
91 Days Tbill MD 17-09-2010 SOV 20.18
Grand Total 100.00
Govt Securities (GSE) Total 74.35
Treasury Bills Total 20.18Net Current Asset 5.47
IDFC Government Securities Fund - Provident Fund Plan(IDFC-GSF-PF)An Open Ended - Dedicated Gilt Fund
Fund features
Nature : DebtAverage AUM : Rs. 24.77 CroreFund Manager : Arjun Parthasarthy Investment objective : Seek to generate optimal returns with high liquidity by investing in Government Securities.
Investment Style : The Scheme propose to invest only in government securities with the aim of generating stable medium-term returns.Ideal investment horizon : 1 year or moreEntry Load : NilExit Load : IDFC- GSF- PF Plan A & Plan B : Exit load of 1.00% of NAV shall be applicable in case of investors who redeem / switch out such investments within 365 days such from the date of effecting such purchase / switch. Investors opting for PEP / Dividend reinvestment option / SWP or switch between options within the plan will not be levied an exit load.Options available : Minimum investment amount : Rs. 5000 and in multiples of Re. 1 in plan A (Regular Plan), Rs. 25,00,000 and in multiplies of Re.1 in plan B (institutional Plan).(w.e.f. July 6, 2009)Additional investment amount : Re. 1SIP (minimum amount) : Rs. 1000(Plan A)Inception Date : 29 March 2004Statistical Measures : Standard deviation 2.31%Modified Duration 5.33 yearsDividend frequency : Quarterly / Yearly Last 3 Dividends : Date NAV Freq. Others I & HIDFC-GSF-PF Plan A
30-Jun-09 10.6523 Quarterly 0.3995 0.4292
IDFC-GSF-PF Plan B
31-Dec-09 10.677429-Sep-09 10.6726 Quarterly 0.0004 0.0004
NAV (Rs.) :Plan A Growth 15.0109Plan A Dividend Quarterly 10.8219Plan A Dividend Annual 11.1807Plan B Growth 15.1492Plan B Dividend Quarterly 10.7103Face Value (Rs. / unit) : 10Fund Manager's comment :The funds are positioned in the segment of the yield curve where returns will be optimum. Benchmark : ISEC Composite Index
However there is no assurance that the investment objective of the scheme will be realized.
Growth, Dividend & Dividend Sweep (w.e.f. 16-Nov-2009)
(Rs. / unit)
30-Jun-10 10.8219 Quarterly 0.0711 0.0762
31-Mar-10 10.8981 Annual 0.5196 0.5582
30-Jun-10 10.7103 Quarterly 0.2217 0.2379Quarterly 0.0049 0.0053
Data as of 30 June 2010
Asset Allocation
Fund performance IDFC-GSF-PF Growth
Past performance may or may not be sustained in future.
CAGR Last 1 Year
CAGR Last 2 Years
CAGR Last 3 Years
CAGR Since Allotment
29/03/2004IDFC-GSF-PF - Growth ISCI
CAGR - Compounded Annualised Growth Rate
CAGR Last 5 Years
25
1
Morningstar Rating
Rating & Rankings
Past performance is no guarantee of future results.For Methodology of Ranking Please refer Page No. 41.
2
2.41%
10.72%10.04%
8.27%
6.71%
4.49%
11.15%
8.84%
7.29%
6.05%
3

26
IDFC All Seasons Bond Fund(IDFC-ASBF)An Open - Ended Fund of Funds Scheme
Data as of 30 June 2010
1 Mutual Fund Units 97.18%
2 Net Current Asset 2.82%
Portfolio
% of Name Rating NAV
IDFC - SSIF - Medium Term - Growth Option 32.94
IDFC - SSIF - Investment Plan - Growth Option 32.49
IDFC - SSIF - Short Term - Growth 19.06
IDFC-Money Manager Fund-Investment Plan-Inst Plan B-Growth 12.69
Grand Total 100.00
Mutual Fund Units Total 97.18
Net Current Asset 2.82
Fund features
Nature : DebtAverage AUM : Rs. 8.16 CroreFund Manager : Arjun Parthasarthy Investment objective : Seek to generate optimal returns with high liquidity by active management of the portfolio, by investing predominantly in debt oriented mutual fund schemes and money market instruments. However there is no assurance that the investment objective of the scheme will be realized.Investment Style : The Scheme aims to actively manage the interest rate environment by allocating funds to various fixed income schemes based on the interest rate outlook.Ideal investment horizon : 1 year or moreEntry Load : NilExit Load : IDFC-ASBF - Plan A : 0.75% of NAV on investors who purchase/switch in and seek to redeem/switch out such units within 365 days from the date of effecting such purchase/switch in Plan A. Investors opting for PEP / Dividend reinvestment option / SWP or switch between options will not be levied an exit load. (w.e.f. August 24, 2009)Options available : Growth, Dividend & Dividend Sweep (w.e.f. 16-Nov-2009)Minimum investment amount : Rs. 5,000 and in multiples of Re. 1 in plan A (Regular Plan).Additional investment amount : Re. 1SIP (minimum amount) : Rs. 1000Inception Date : 13 September 2004Statistical Measures : Standard deviation 1.83%Dividend frequency : Quarterly, Half Yearly & AnnualLast 3 Dividends (Rs./ unit) : Date Nav Freq. Others I & HIDFC-ASBF Plan A29-Sep-09 10.8681 Half Yearly 0.3930 0.422330-Jun-10 11.2512 Quarterly 0.0002 0.000330-Jun-09 10.9623 Quarterly 0.2446 0.262830-Mar-09 10.7592 Quarterly 0.2446 0.262830-Mar-09 10.8909 Half Yearly 0.3424 0.367931-Mar-10 10.8858 Half Yearly 0.1126 0.121030-Mar-09 10.9681 Annual 0.4076 0.4380
Nav (Rs.) :Plan A Growth 14.9296Plan A Dividend Quarterly 11.2512Plan A Dividend Half Yearly 11.0635Plan A Dividend Annual 11.7839Face Value (Rs. / unit) : 10Fund Manager's comment The fund is invested in across duration products to maximize accrual and minimize impact of interest rate movements. Benchmark : Crisil Composite Bond Fund Index (CCBFI)
Asset Allocation
Fund performance under the IDFC-ASBF-Growth
Past performance may or may not be sustained in future.
1
2
CAGR Last 1 Year
CAGR Last 2 Years
CAGR Last 3 Years
CAGR Since Allotment
13/09/2004IDFC-ASBF - Growth CCBFI
CAGR - Compounded Annualised Growth Rate
CAGR Last 5 Years
2.64%
8.84% 8.57%7.56% 7.16%
4.69%
7.90%6.95%
5.63% 5.53%
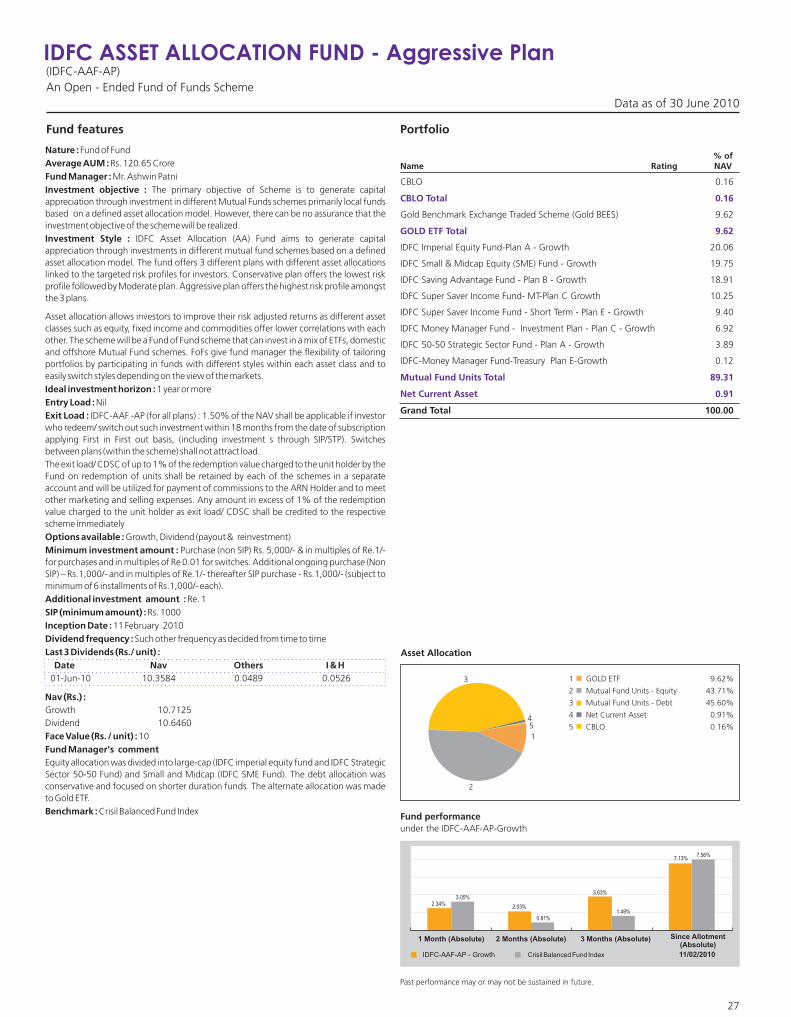
27
IDFC ASSET ALLOCATION FUND - Aggressive Plan(IDFC-AAF-AP)An Open - Ended Fund of Funds Scheme
Data as of 30 June 2010
1 GOLD ETF 9.62%
2 Mutual Fund Units - Equity 43.71%
3 Mutual Fund Units - Debt 45.60%
4 Net Current Asset 0.91%
5 CBLO 0.16%
Portfolio
% of Name Rating NAV
CBLO 0.16
Gold Benchmark Exchange Traded Scheme (Gold BEES) 9.62
IDFC Imperial Equity Fund-Plan A - Growth 20.06
IDFC Small & Midcap Equity (SME) Fund - Growth 19.75
IDFC Saving Advantage Fund - Plan B - Growth 18.91
IDFC Super Saver Income Fund- MT-Plan C Growth 10.25
IDFC Super Saver Income Fund - Short Term - Plan E - Growth 9.40
IDFC Money Manager Fund - Investment Plan - Plan C - Growth 6.92
IDFC 50-50 Strategic Sector Fund - Plan A - Growth 3.89
IDFC-Money Manager Fund-Treasury Plan E-Growth 0.12
Grand Total 100.00
CBLO Total 0.16
GOLD ETF Total 9.62
Mutual Fund Units Total 89.31
Net Current Asset 0.91
Fund features
Nature : Fund of FundAverage AUM : Rs. 120.65 CroreFund Manager : Mr. Ashwin PatniInvestment objective : The primary objective of Scheme is to generate capital appreciation through investment in different Mutual Funds schemes primarily local funds based on a defined asset allocation model. However, there can be no assurance that the investment objective of the scheme will be realized. Investment Style : IDFC Asset Allocation (AA) Fund aims to generate capital appreciation through investments in different mutual fund schemes based on a defined asset allocation model. The fund offers 3 different plans with different asset allocations linked to the targeted risk profiles for investors. Conservative plan offers the lowest risk profile followed by Moderate plan. Aggressive plan offers the highest risk profile amongst the 3 plans.
Asset allocation allows investors to improve their risk adjusted returns as different asset classes such as equity, fixed income and commodities offer lower correlations with each other. The scheme will be a Fund of Fund scheme that can invest in a mix of ETFs, domestic and offshore Mutual Fund schemes. FoFs give fund manager the flexibility of tailoring portfolios by participating in funds with different styles within each asset class and to easily switch styles depending on the view of the markets.Ideal investment horizon : 1 year or moreEntry Load : NilExit Load : IDFC-AAF -AP (for all plans) : 1.50% of the NAV shall be applicable if investor who redeem/ switch out such investment within 18 months from the date of subscription applying First in First out basis, (including investment s through SIP/STP). Switches between plans (within the scheme) shall not attract load. The exit load/ CDSC of up to 1% of the redemption value charged to the unit holder by the Fund on redemption of units shall be retained by each of the schemes in a separate account and will be utilized for payment of commissions to the ARN Holder and to meet other marketing and selling expenses. Any amount in excess of 1% of the redemption value charged to the unit holder as exit load/ CDSC shall be credited to the respective scheme immediately Options available : Growth, Dividend (payout & reinvestment) Minimum investment amount : Purchase (non SIP) Rs. 5,000/- & in multiples of Re.1/- for purchases and in multiples of Re 0.01 for switches. Additional ongoing purchase (Non SIP) – Rs.1,000/- and in multiples of Re.1/- thereafter SIP purchase - Rs.1,000/- (subject to minimum of 6 installments of Rs.1,000/- each).Additional investment amount : Re. 1SIP (minimum amount) : Rs. 1000Inception Date : 11 February 2010Dividend frequency : Such other frequency as decided from time to timeLast 3 Dividends (Rs./ unit) : Date Nav Others I & H
01-Jun-10 10.3584 0.0489 0.0526
Nav (Rs.) :Growth 10.7125Dividend 10.6460Face Value (Rs. / unit) : 10Fund Manager's comment Equity allocation was divided into large-cap (IDFC imperial equity fund and IDFC Strategic Sector 50-50 Fund) and Small and Midcap (IDFC SME Fund). The debt allocation was conservative and focused on shorter duration funds. The alternate allocation was made to Gold ETF.Benchmark : Crisil Balanced Fund Index
Asset Allocation
Fund performance under the IDFC-AAF-AP-Growth
Past performance may or may not be sustained in future.
1
2
IDFC-AAF-AP - Growth Crisil Balanced Fund Index
3
4
1 Month (Absolute) Since Allotment (Absolute)
11/02/2010
2 Months (Absolute)
5
2.34% 2.03%
3.63%
7.13%
3.05%
0.81%1.49%
7.56%
3 Months (Absolute)
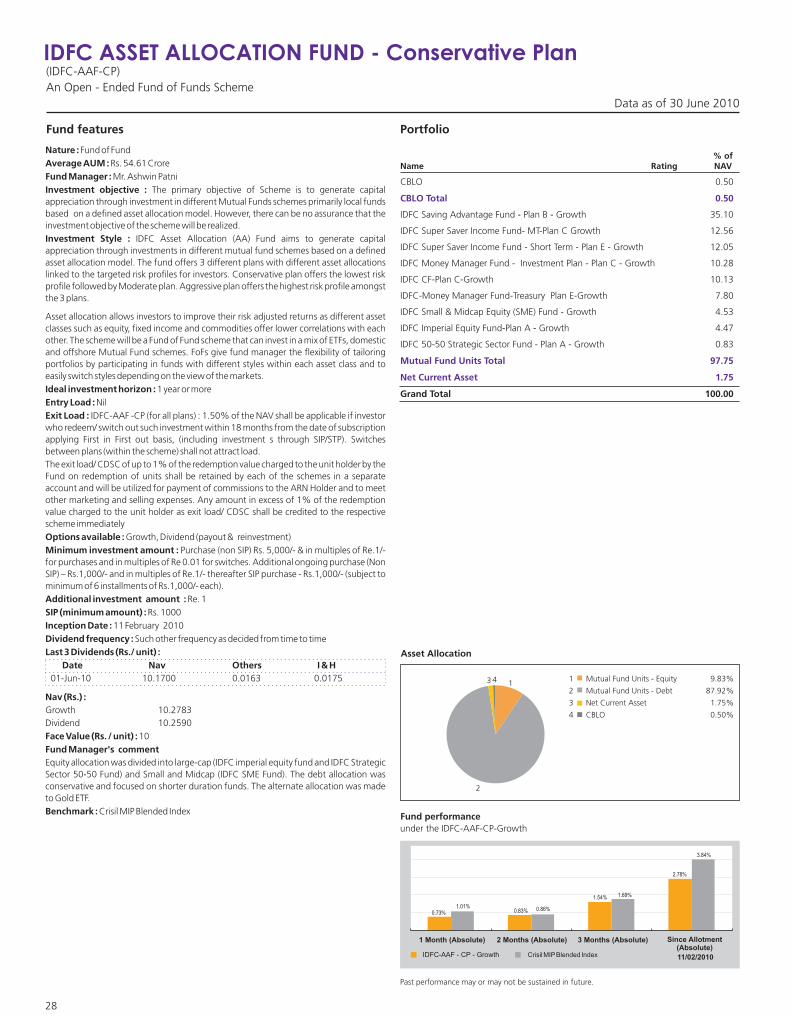
28
IDFC ASSET ALLOCATION FUND - Conservative Plan(IDFC-AAF-CP)An Open - Ended Fund of Funds Scheme
Data as of 30 June 2010
1 Mutual Fund Units - Equity 9.83%
2 Mutual Fund Units - Debt 87.92%
3 Net Current Asset 1.75%
4 CBLO 0.50%
Portfolio
% of Name Rating NAV
CBLO 0.50
IDFC Saving Advantage Fund - Plan B - Growth 35.10
IDFC Super Saver Income Fund- MT-Plan C Growth 12.56
IDFC Super Saver Income Fund - Short Term - Plan E - Growth 12.05
IDFC Money Manager Fund - Investment Plan - Plan C - Growth 10.28
IDFC CF-Plan C-Growth 10.13
IDFC-Money Manager Fund-Treasury Plan E-Growth 7.80
IDFC Small & Midcap Equity (SME) Fund - Growth 4.53
IDFC Imperial Equity Fund-Plan A - Growth 4.47
IDFC 50-50 Strategic Sector Fund - Plan A - Growth 0.83
Grand Total 100.00
CBLO Total 0.50
Mutual Fund Units Total 97.75
Net Current Asset 1.75
Fund features
Nature : Fund of FundAverage AUM : Rs. 54.61 CroreFund Manager : Mr. Ashwin PatniInvestment objective : The primary objective of Scheme is to generate capital appreciation through investment in different Mutual Funds schemes primarily local funds based on a defined asset allocation model. However, there can be no assurance that the investment objective of the scheme will be realized. Investment Style : IDFC Asset Allocation (AA) Fund aims to generate capital appreciation through investments in different mutual fund schemes based on a defined asset allocation model. The fund offers 3 different plans with different asset allocations linked to the targeted risk profiles for investors. Conservative plan offers the lowest risk profile followed by Moderate plan. Aggressive plan offers the highest risk profile amongst the 3 plans.
Asset allocation allows investors to improve their risk adjusted returns as different asset classes such as equity, fixed income and commodities offer lower correlations with each other. The scheme will be a Fund of Fund scheme that can invest in a mix of ETFs, domestic and offshore Mutual Fund schemes. FoFs give fund manager the flexibility of tailoring portfolios by participating in funds with different styles within each asset class and to easily switch styles depending on the view of the markets.Ideal investment horizon : 1 year or moreEntry Load : NilExit Load : IDFC-AAF -CP (for all plans) : 1.50% of the NAV shall be applicable if investor who redeem/ switch out such investment within 18 months from the date of subscription applying First in First out basis, (including investment s through SIP/STP). Switches between plans (within the scheme) shall not attract load. The exit load/ CDSC of up to 1% of the redemption value charged to the unit holder by the Fund on redemption of units shall be retained by each of the schemes in a separate account and will be utilized for payment of commissions to the ARN Holder and to meet other marketing and selling expenses. Any amount in excess of 1% of the redemption value charged to the unit holder as exit load/ CDSC shall be credited to the respective scheme immediately Options available : Growth, Dividend (payout & reinvestment) Minimum investment amount : Purchase (non SIP) Rs. 5,000/- & in multiples of Re.1/- for purchases and in multiples of Re 0.01 for switches. Additional ongoing purchase (Non SIP) – Rs.1,000/- and in multiples of Re.1/- thereafter SIP purchase - Rs.1,000/- (subject to minimum of 6 installments of Rs.1,000/- each).Additional investment amount : Re. 1SIP (minimum amount) : Rs. 1000Inception Date : 11 February 2010Dividend frequency : Such other frequency as decided from time to timeLast 3 Dividends (Rs./ unit) : Date Nav Others I & H
01-Jun-10 10.1700 0.0163 0.0175
Nav (Rs.) :Growth 10.2783Dividend 10.2590Face Value (Rs. / unit) : 10Fund Manager's comment Equity allocation was divided into large-cap (IDFC imperial equity fund and IDFC Strategic Sector 50-50 Fund) and Small and Midcap (IDFC SME Fund). The debt allocation was conservative and focused on shorter duration funds. The alternate allocation was made to Gold ETF.Benchmark : Crisil MIP Blended Index
Asset Allocation
Fund performance under the IDFC-AAF-CP-Growth
Past performance may or may not be sustained in future.
1
2
IDFC-AAF - CP - Growth Crisil MIP Blended Index
3
1 Month (Absolute) Since Allotment (Absolute)
11/02/2010
2 Months (Absolute)
4
2.78%
1.54%
0.83%0.73%
3.84%
1.69%
0.86%1.01%
3 Months (Absolute)

29
IDFC ASSET ALLOCATION FUND - Moderate Plan(IDFC-AAF-MP)An Open - Ended Fund of Funds Scheme
Data as of 30 June 2010
1 GOLD ETF 4.94%
2 Mutual Fund Units - Equity 24.16%
3 Mutual Fund Units - Debt 69.71%
4 Net Current Asset 1.19%
Portfolio
% of Name Rating NAV
Gold Benchmark Exchange Traded Scheme (Gold BEES) 4.94
IDFC Saving Advantage Fund - Plan B - Growth 27.45
IDFC Money Manager Fund - Investment Plan - Plan C - Growth 13.04
IDFC Super Saver Income Fund- MT-Plan C Growth 12.09
IDFC Super Saver Income Fund - Short Term - Plan E - Growth 11.94
IDFC Imperial Equity Fund-Plan A - Growth 11.31
IDFC Small & Midcap Equity (SME) Fund - Growth 10.54
IDFC-Money Manager Fund-Treasury Plan E-Growth 5.19
IDFC 50-50 Strategic Sector Fund - Plan A - Growth 2.31
Grand Total 100.00
GOLD ETF Total 4.94
Mutual Fund Units Total 93.87
Net Current Asset 1.19
Fund features
Nature : Fund of FundAverage AUM : Rs. 69.10 CroreFund Manager : Mr. Ashwin PatniInvestment objective : The primary objective of Scheme is to generate capital appreciation through investment in different Mutual Funds schemes primarily local funds based on a defined asset allocation model. However, there can be no assurance that the investment objective of the scheme will be realized. Investment Style : IDFC Asset Allocation (AA) Fund aims to generate capital appreciation through investments in different mutual fund schemes based on a defined asset allocation model. The fund offers 3 different plans with different asset allocations linked to the targeted risk profiles for investors. Conservative plan offers the lowest risk profile followed by Moderate plan. Aggressive plan offers the highest risk profile amongst the 3 plans.
Asset allocation allows investors to improve their risk adjusted returns as different asset classes such as equity, fixed income and commodities offer lower correlations with each other. The scheme will be a Fund of Fund scheme that can invest in a mix of ETFs, domestic and offshore Mutual Fund schemes. FoFs give fund manager the flexibility of tailoring portfolios by participating in funds with different styles within each asset class and to easily switch styles depending on the view of the markets.Ideal investment horizon : 1 year or moreEntry Load : NilExit Load : IDFC-AAF -MP (for all plans) : 1.50% of the NAV shall be applicable if investor who redeem/ switch out such investment within 18 months from the date of subscription applying First in First out basis, (including investment s through SIP/STP). Switches between plans (within the scheme) shall not attract load. The exit load/ CDSC of up to 1% of the redemption value charged to the unit holder by the Fund on redemption of units shall be retained by each of the schemes in a separate account and will be utilized for payment of commissions to the ARN Holder and to meet other marketing and selling expenses. Any amount in excess of 1% of the redemption value charged to the unit holder as exit load/ CDSC shall be credited to the respective scheme immediately Options available : Growth, Dividend (payout & reinvestment) Minimum investment amount : Purchase (non SIP) Rs. 5,000/- & in multiples of Re.1/- for purchases and in multiples of Re 0.01 for switches. Additional ongoing purchase (Non SIP) – Rs.1,000/- and in multiples of Re.1/- thereafter SIP purchase - Rs.1,000/- (subject to minimum of 6 installments of Rs.1,000/- each).Additional investment amount : Re. 1SIP (minimum amount) : Rs. 1000Inception Date : 11 February 2010Dividend frequency : Such other frequency as decided from time to timeLast 3 Dividends (Rs./ unit) : Date Nav Others I & H
01-Jun-10 10.2669 0.0326 0.0350
Nav (Rs.) :Growth 10.4818Dividend 10.4405Face Value (Rs. / unit) : 10Fund Manager's comment Equity allocation was divided into large-cap (IDFC imperial equity fund and IDFC Strategic Sector 50-50 Fund) and Small and Midcap (IDFC SME Fund). The debt allocation was conservative and focused on shorter duration funds. The alternate allocation was made to Gold ETF.Benchmark : Crisil MIP Blended Index
Asset Allocation
Fund performance under the IDFC-AAF-MP-Growth
Past performance may or may not be sustained in future.
1
2
3
IDFC-AAF - MP - Growth Crisil MIP Blended Index
1 Month (Absolute) Since Allotment (Absolute)
11/02/2010
4
2 Months (Absolute)
1.43% 1.42%
2.56%
4.82%
1.01%0.86%
1.69%
3.84%
3 Months (Absolute)
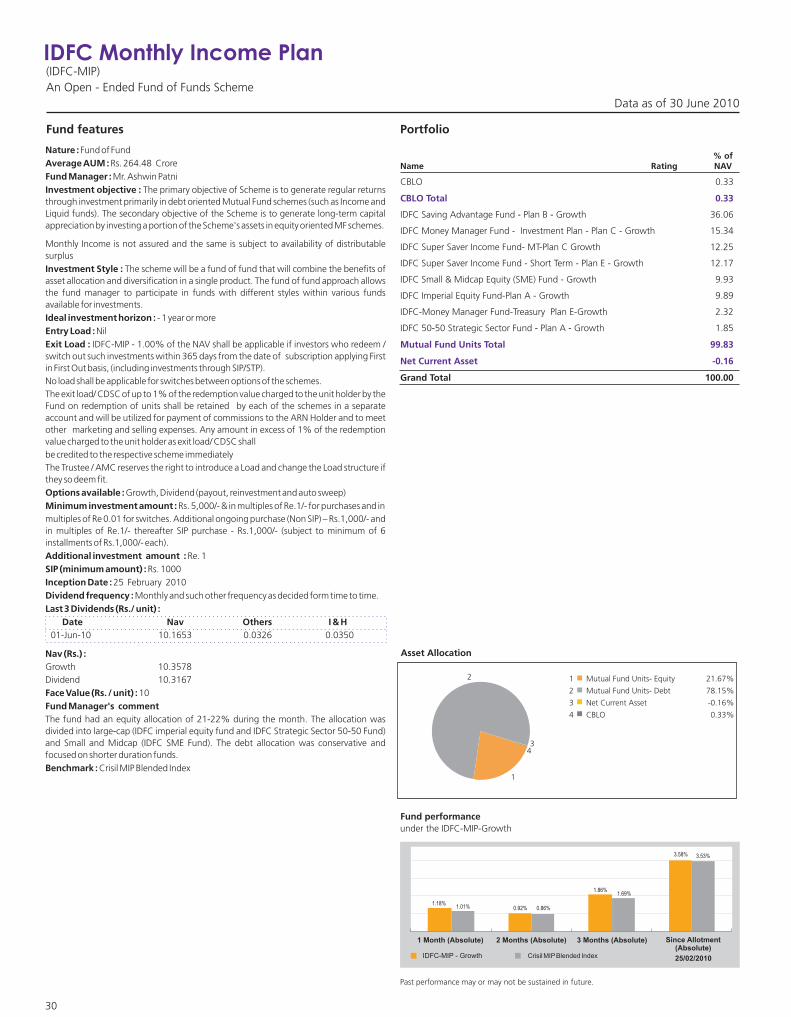
30
IDFC Monthly Income Plan(IDFC-MIP)An Open - Ended Fund of Funds Scheme
Data as of 30 June 2010
1 Mutual Fund Units- Equity 21.67%
2 Mutual Fund Units- Debt 78.15%
3 Net Current Asset -0.16%
4 CBLO 0.33%
Portfolio
% of Name Rating NAV
CBLO 0.33
IDFC Saving Advantage Fund - Plan B - Growth 36.06
IDFC Money Manager Fund - Investment Plan - Plan C - Growth 15.34
IDFC Super Saver Income Fund- MT-Plan C Growth 12.25
IDFC Super Saver Income Fund - Short Term - Plan E - Growth 12.17
IDFC Small & Midcap Equity (SME) Fund - Growth 9.93
IDFC Imperial Equity Fund-Plan A - Growth 9.89
IDFC-Money Manager Fund-Treasury Plan E-Growth 2.32
IDFC 50-50 Strategic Sector Fund - Plan A - Growth 1.85
Grand Total 100.00
CBLO Total 0.33
Mutual Fund Units Total 99.83
Net Current Asset -0.16
Fund features
Nature : Fund of FundAverage AUM : Rs. 264.48 CroreFund Manager : Mr. Ashwin PatniInvestment objective : The primary objective of Scheme is to generate regular returns through investment primarily in debt oriented Mutual Fund schemes (such as Income and Liquid funds). The secondary objective of the Scheme is to generate long-term capital appreciation by investing a portion of the Scheme's assets in equity oriented MF schemes.
Monthly Income is not assured and the same is subject to availability of distributable surplus Investment Style : The scheme will be a fund of fund that will combine the benefits of asset allocation and diversification in a single product. The fund of fund approach allows the fund manager to participate in funds with different styles within various funds available for investments.Ideal investment horizon : - 1 year or moreEntry Load : NilExit Load : IDFC-MIP - 1.00% of the NAV shall be applicable if investors who redeem / switch out such investments within 365 days from the date of subscription applying First in First Out basis, (including investments through SIP/STP). No load shall be applicable for switches between options of the schemes.The exit load/ CDSC of up to 1% of the redemption value charged to the unit holder by the Fund on redemption of units shall be retained by each of the schemes in a separate account and will be utilized for payment of commissions to the ARN Holder and to meet other marketing and selling expenses. Any amount in excess of 1% of the redemption value charged to the unit holder as exit load/ CDSC shall be credited to the respective scheme immediately The Trustee / AMC reserves the right to introduce a Load and change the Load structure if they so deem fit.Options available : Growth, Dividend (payout, reinvestment and auto sweep) Minimum investment amount : Rs. 5,000/- & in multiples of Re.1/- for purchases and inmultiples of Re 0.01 for switches. Additional ongoing purchase (Non SIP) – Rs.1,000/- and in multiples of Re.1/- thereafter SIP purchase - Rs.1,000/- (subject to minimum of 6 installments of Rs.1,000/- each).Additional investment amount : Re. 1SIP (minimum amount) : Rs. 1000Inception Date : 25 February 2010Dividend frequency : Monthly and such other frequency as decided form time to time.Last 3 Dividends (Rs./ unit) : Date Nav Others I & H
01-Jun-10 10.1653 0.0326 0.0350
Nav (Rs.) :Growth 10.3578Dividend 10.3167Face Value (Rs. / unit) : 10Fund Manager's comment The fund had an equity allocation of 21-22% during the month. The allocation was divided into large-cap (IDFC imperial equity fund and IDFC Strategic Sector 50-50 Fund) and Small and Midcap (IDFC SME Fund). The debt allocation was conservative and focused on shorter duration funds.Benchmark : Crisil MIP Blended Index
Asset Allocation
Fund performance under the IDFC-MIP-Growth
Past performance may or may not be sustained in future.
1
2
IDFC-MIP - Growth Crisil MIP Blended Index
1 Month (Absolute) Since Allotment (Absolute)
25/02/2010
3
2 Months (Absolute)
4
3.58%
1.86%
0.92%1.18%
3.53%
1.69%
0.86%1.01%
3 Months (Absolute)
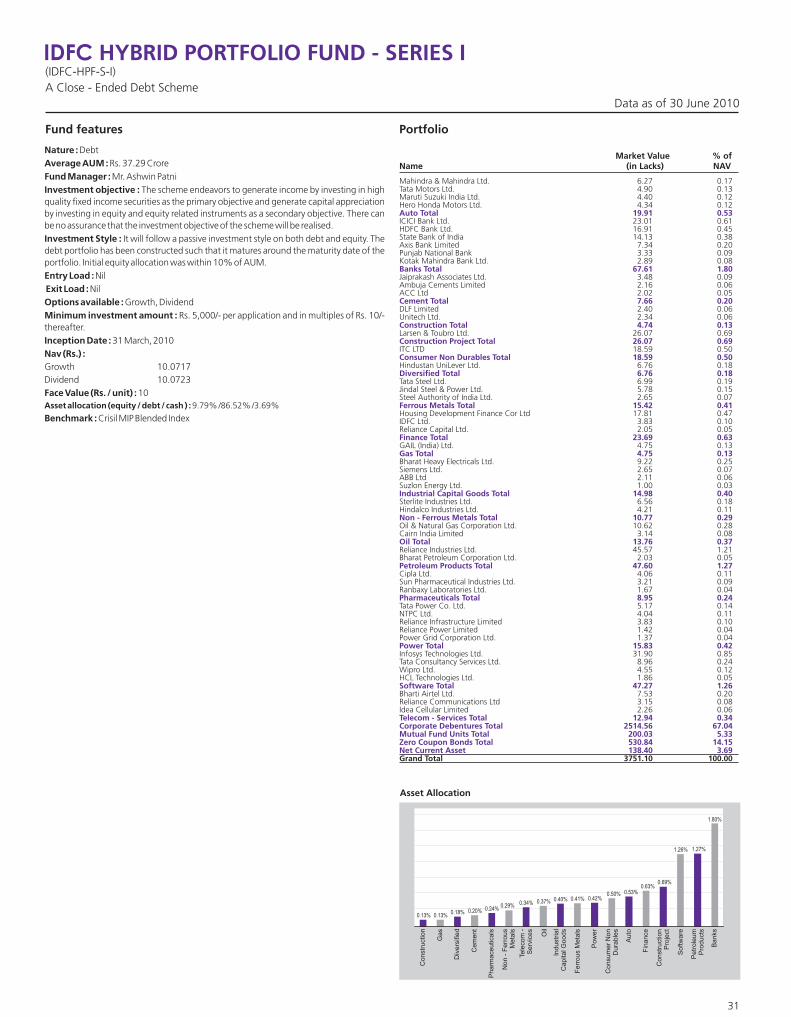
31
Data as of 30 June 2010
Portfolio
Market Value % of Name (in Lacks) NAV
Mahindra & Mahindra Ltd. 6.27 0.17Tata Motors Ltd. 4.90 0.13Maruti Suzuki India Ltd. 4.40 0.12Hero Honda Motors Ltd. 4.34 0.12
ICICI Bank Ltd. 23.01 0.61HDFC Bank Ltd. 16.91 0.45State Bank of India 14.13 0.38Axis Bank Limited 7.34 0.20Punjab National Bank 3.33 0.09Kotak Mahindra Bank Ltd. 2.89 0.08
Jaiprakash Associates Ltd. 3.48 0.09Ambuja Cements Limited 2.16 0.06ACC Ltd 2.02 0.05
DLF Limited 2.40 0.06Unitech Ltd. 2.34 0.06
Larsen & Toubro Ltd. 26.07 0.69
ITC LTD 18.59 0.50
Hindustan UniLever Ltd. 6.76 0.18
Tata Steel Ltd. 6.99 0.19Jindal Steel & Power Ltd. 5.78 0.15Steel Authority of India Ltd. 2.65 0.07
Housing Development Finance Cor Ltd 17.81 0.47IDFC Ltd. 3.83 0.10Reliance Capital Ltd. 2.05 0.05
GAIL (India) Ltd. 4.75 0.13
Bharat Heavy Electricals Ltd. 9.22 0.25Siemens Ltd. 2.65 0.07ABB Ltd 2.11 0.06Suzlon Energy Ltd. 1.00 0.03
Sterlite Industries Ltd. 6.56 0.18Hindalco Industries Ltd. 4.21 0.11
Oil & Natural Gas Corporation Ltd. 10.62 0.28Cairn India Limited 3.14 0.08
Reliance Industries Ltd. 45.57 1.21Bharat Petroleum Corporation Ltd. 2.03 0.05
Cipla Ltd. 4.06 0.11Sun Pharmaceutical Industries Ltd. 3.21 0.09Ranbaxy Laboratories Ltd. 1.67 0.04
Tata Power Co. Ltd. 5.17 0.14NTPC Ltd. 4.04 0.11Reliance Infrastructure Limited 3.83 0.10Reliance Power Limited 1.42 0.04Power Grid Corporation Ltd. 1.37 0.04
Infosys Technologies Ltd. 31.90 0.85Tata Consultancy Services Ltd. 8.96 0.24Wipro Ltd. 4.55 0.12HCL Technologies Ltd. 1.86 0.05
Bharti Airtel Ltd. 7.53 0.20Reliance Communications Ltd 3.15 0.08Idea Cellular Limited 2.26 0.06
Grand Total 3751.10 100.00
Auto Total 19.91 0.53
Banks Total 67.61 1.80
Cement Total 7.66 0.20
Construction Total 4.74 0.13
Construction Project Total 26.07 0.69
Consumer Non Durables Total 18.59 0.50
Diversified Total 6.76 0.18
Ferrous Metals Total 15.42 0.41
Finance Total 23.69 0.63
Gas Total 4.75 0.13
Industrial Capital Goods Total 14.98 0.40
Non - Ferrous Metals Total 10.77 0.29
Oil Total 13.76 0.37
Petroleum Products Total 47.60 1.27
Pharmaceuticals Total 8.95 0.24
Power Total 15.83 0.42
Software Total 47.27 1.26
Telecom - Services Total 12.94 0.34Corporate Debentures Total 2514.56 67.04Mutual Fund Units Total 200.03 5.33Zero Coupon Bonds Total 530.84 14.15Net Current Asset 138.40 3.69
Fund features
Nature : DebtAverage AUM : Rs. 37.29 CroreFund Manager : Mr. Ashwin PatniInvestment objective : The scheme endeavors to generate income by investing in high quality fixed income securities as the primary objective and generate capital appreciation by investing in equity and equity related instruments as a secondary objective. There can be no assurance that the investment objective of the scheme will be realised.Investment Style : It will follow a passive investment style on both debt and equity. The debt portfolio has been constructed such that it matures around the maturity date of the portfolio. Initial equity allocation was within 10% of AUM.Entry Load : Nil Exit Load : NilOptions available : Growth, Dividend Minimum investment amount : Rs. 5,000/- per application and in multiples of Rs. 10/- thereafter.Inception Date : 31 March, 2010Nav (Rs.) :Growth 10.0717Dividend 10.0723Face Value (Rs. / unit) : 10Asset allocation (equity / debt / cash ) : 9.79% /86.52% /3.69%
Benchmark : Crisil MIP Blended Index
Asset Allocation
IDFC HYBRID PORTFOLIO FUND - SERIES I(IDFC-HPF-S-I) A Close - Ended Debt Scheme
1.80%
1.27%1.26%
0.69%0.63%
0.53%0.50%0.42%0.41%0.40%0.37%0.34%
0.24%0.20%0.18%0.13%0.13%
0.29%
Banks
Petr
ole
um
P
roduct
s
Softw
are
Const
ruct
ion
P
roje
ct
Fin
ance
Auto
Consu
mer
Non
D
ura
ble
s
Pow
er
Ferr
ous
Meta
ls
Indust
ria
l C
apita
l Goods
Oil
Tele
com
-
Serv
ices
Non -
Ferr
ous
Meta
ls
Pharm
ace
utic
als
Cem
ent
Div
ers
ified
Gas
Const
ruct
ion

32
Data as of 30 June 2010
Portfolio
Market Value % of Name (in Lacks) NAV
Mahindra & Mahindra Ltd. 34.73 0.24Tata Motors Ltd. 27.13 0.19Maruti Suzuki India Ltd. 25.31 0.18Hero Honda Motors Ltd. 24.07 0.17
ICICI Bank Ltd. 127.48 0.89HDFC Bank Ltd. 89.02 0.62State Bank of India 78.36 0.55Axis Bank Limited 40.66 0.28Punjab National Bank 18.44 0.13Kotak Mahindra Bank Ltd. 16.04 0.11
Jaiprakash Associates Ltd. 19.29 0.13Ambuja Cements Limited 11.98 0.08ACC Ltd 11.20 0.08
DLF Limited 13.28 0.09Unitech Ltd. 12.95 0.09
Larsen & Toubro Ltd. 144.39 1.01
ITC LTD 105.30 0.73
Hindustan UniLever Ltd. 37.45 0.26
Tata Steel Ltd. 38.75 0.27Jindal Steel & Power Ltd. 32.02 0.22Steel Authority of India Ltd. 14.65 0.10
Housing Development Finance Cor Ltd 98.63 0.69IDFC Ltd. 22.34 0.16Reliance Capital Ltd. 11.38 0.08
GAIL (India) Ltd. 27.22 0.19
Bharat Heavy Electricals Ltd. 51.09 0.36Siemens Ltd. 14.69 0.10ABB Ltd 11.65 0.08Suzlon Energy Ltd. 5.53 0.04
Sterlite Industries Ltd. 36.37 0.25Hindalco Industries Ltd. 25.11 0.17
Oil & Natural Gas Corporation Ltd. 58.87 0.41Cairn India Limited 17.40 0.12
Reliance Industries Ltd. 245.77 1.71Bharat Petroleum Corporation Ltd. 11.29 0.08
Cipla Ltd. 22.50 0.16Sun Pharmaceutical Industries Ltd. 17.78 0.12Ranbaxy Laboratories Ltd. 9.25 0.06
Tata Power Co. Ltd. 28.63 0.20NTPC Ltd. 22.37 0.16Reliance Infrastructure Limited 22.19 0.15Reliance Power Limited 7.89 0.05Power Grid Corporation Ltd. 7.57 0.05
Infosys Technologies Ltd. 177.70 1.24Tata Consultancy Services Ltd. 49.66 0.35Wipro Ltd. 25.20 0.18HCL Technologies Ltd. 10.30 0.07
Bharti Airtel Ltd. 42.88 0.30Reliance Communications Ltd 17.45 0.12Idea Cellular Limited 13.29 0.09
Grand Total 14354.44 100.00
Auto Total 111.25 0.77
Banks Total 370.00 2.58
Cement Total 42.47 0.30
Construction Total 26.23 0.18
Construction Project Total 144.39 1.01
Consumer Non Durables Total 105.30 0.73
Diversified Total 37.45 0.26
Ferrous Metals Total 85.43 0.60
Finance Total 132.35 0.92
Gas Total 27.22 0.19
Industrial Capital Goods Total 82.95 0.58
Non - Ferrous Metals Total 61.48 0.43
Oil Total 76.26 0.53
Petroleum Products Total 257.06 1.79
Pharmaceuticals Total 49.53 0.35
Power Total 88.64 0.62
Software Total 262.86 1.83
Telecom - Services Total 73.62 0.51Corporate Debentures Total 11814.22 82.30Mutual Fund Units Total 100.01 0.70Call / Reverse Repo/ CBLO Total 20.00 0.14Net Current Asset 385.72 2.69
Fund features
Nature : DebtAverage AUMFund Manager : Mr. Ashwin PatniInvestment objective : The scheme endeavours to protect the capital by investing in high quality fixed income securities as the primary objective and generate capital appreciation by investing in equity and equity related instruments as a secondary objective. However, there can be no assurance that the investment objective of the scheme will be realized.Investment Style : It will follow a passive investment style on both debt and equity. The debt portfolio has been constructed such that it matures around the maturity date of the portfolio and is of the highest credit quality (AAA rated). Initial equity allocation was within 15% of AUM.Entry Load : NilExit Load : NilOptions available : Growth, Dividend Minimum investment amount : Rs. 5000/- per application and in multiples of Rs. 10/- thereafter.Inception Date : 31 March, 2010Nav (Rs.) :Growth 10.1465Dividend 10.1465Face Value (Rs. / unit) : 10Asset allocation (equity / debt / cash ) : 14.17% /83.14% /2.69%
Benchmark : Crisil MIP Blended Index
: Rs. 142.71 Crore
IDFC CAPITAL PROTECTION ORIENTED FUND - SERIES 1(IDFC- CPOF - Series I) A three year close - ended scheme
Asset Allocation
2.58%
1.79%
1.01%0.92%
0.77%0.73%0.62%0.60%0.58%0.53%0.51%
0.35%0.30%0.26%0.19%0.18%
1.83%
0.43%
Banks
Softw
are
Petr
ole
um
P
roduct
s
Const
ruct
ion
Pro
ject
Fin
ance
Auto
Consu
mer
Non
Dura
ble
s
Pow
er
Ferr
ous
Meta
ls
Indust
ria
l C
apita
l Goods
Oil
Tele
com
-
Serv
ices
Non -
Ferr
ous
Meta
ls
Pharm
ace
utic
als
Cem
ent
Div
ers
ified
Gas
Const
ruct
ion
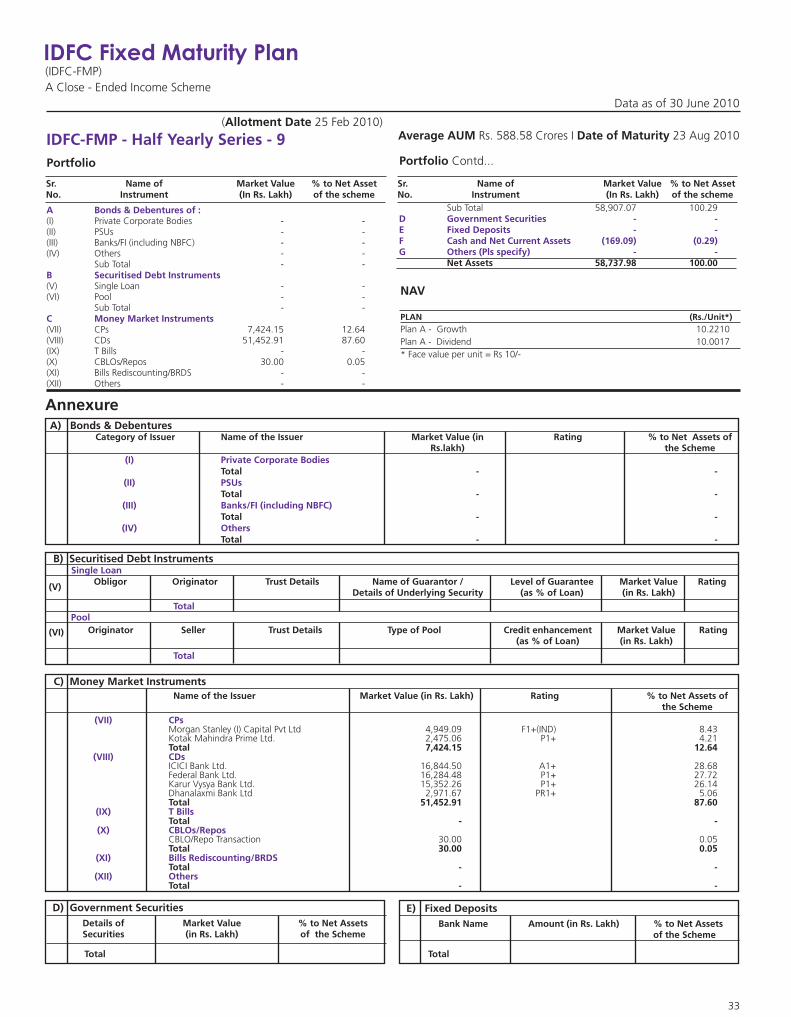
IDFC Fixed Maturity Plan(IDFC-FMP)A Close - Ended Income Scheme
IDFC-FMP - Half Yearly Series - 9(Allotment Date 25 Feb 2010)
Average AUM Rs. 588.58 Crores I Date of Maturity 23 Aug 2010
Data as of 30 June 2010
Portfolio Portfolio Contd...
NAV
PLAN (Rs./Unit*)Plan A - 10.2210Plan A - Dividend 10.0017* Face value per unit = Rs 10/-
Growth
Sr. Name of Market Value % to Net AssetNo. Instrument (In Rs. Lakh) of the scheme
A Bonds & Debentures of :
B Securitised Debt Instruments
C Money Market Instruments
(I) Private Corporate Bodies - - (II) PSUs - - (III) Banks/FI (including NBFC) - - (IV) Others - -
Sub Total - -
(V) Single Loan - - (VI) Pool - -
Sub Total - -
(VII) CPs 7,424.15 12.64 (VIII) CDs 51,452.91 87.60 (IX) T Bills - - (X) CBLOs/Repos 30.00 0.05(XI) Bills Rediscounting/BRDS - - (XII) Others - -
Sub Total 58,907.07 100.29
Net Assets 58,737.98 100.00
D Government Securities - - E Fixed Deposits - - F Cash and Net Current Assets (169.09) (0.29)G Others (Pls specify) - -
Sr. Name of Market Value % to Net AssetNo. Instrument (In Rs. Lakh) of the scheme
AnnexureA) Bonds & Debentures
Category of Issuer Name of the Issuer Market Value (in Rating % to Net Assets of Rs.lakh) the Scheme
Total - -
Total - -
Total - -
Total - -
(I) Private Corporate Bodies
(II) PSUs
(III) Banks/FI (including NBFC)
(IV) Others
B) Securitised Debt InstrumentsSingle Loan
Obligor Originator Trust Details Name of Guarantor / Level of Guarantee Market Value RatingDetails of Underlying Security (as % of Loan) (in Rs. Lakh)
Total Pool
Originator Seller Trust Details Type of Pool Credit enhancement Market Value Rating(as % of Loan) (in Rs. Lakh)
Total
C) Money Market InstrumentsName of Market Value Rating % to
the Schemethe Issuer (in Rs. Lakh) Net Assets of
Total 7,424.15 12.64
ICICI Bank Ltd. 16,844.50 A1+ 28.68Federal Bank Ltd. 16,284.48 P1+ 27.72
Dhanalaxmi Bank Ltd 2,971.67 PR1+ 5.06Total 51,452.91 87.60
Total - -
CBLO/Repo Transaction 30.00 0.05Total 30.00 0.05
Total - -
Total - -
(VII) CPs
(VIII) CDs
(IX) T Bills
(X) CBLOs/Repos
(XI) Bills Rediscounting/BRDS
(XII) Others
Morgan Stanley (I) Capital Pvt Ltd 4,949.09 F1+(IND) 8.43Kotak Mahindra Prime Ltd. 2,475.06 P1+ 4.21
Karur Vysya Bank Ltd. 15,352.26 P1+ 26.14
D) Government SecuritiesDetails of Market Value % to Securities (in Rs. Lakh) of the Scheme
Net Assets
Total Total
E) Fixed DepositsBank Name Amount % to
of the Scheme(in Rs. Lakh) Net Assets
(V)
(VI)
33

IDFC Fixed Maturity Plan(IDFC-FMP)A Close - Ended Income Scheme
IDFC-FMP - Quarterly Series - 58(Allotment Date 24 June 2010)
Average AUM Rs. 26.27 Crores I Date of Maturity 21 Sep 2010
Data as of 30 June 2010
Portfolio Portfolio Contd...
NAV
PLAN (Rs./Unit*)Plan A - 10.0135Plan A - Dividend 10.0135* Face value per unit = Rs 10/-
Growth
Sr. Name of Market Value % to Net AssetNo. Instrument (In Rs. Lakh) of the scheme
A Bonds & Debentures of :
B Securitised Debt Instruments
C Money Market Instruments
(I) Private Corporate Bodies - - (II) PSUs - - (III) Banks/FI (including NBFC) - - (IV) Others - -
Sub Total - -
(V) Single Loan - - (VI) Pool - -
Sub Total - -
(VII) CPs 2,462.70 21.86 (VIII) CDs 6,709.55 59.57 (IX) T Bills - - (X) CBLOs/Repos 80.01 0.71(XI) Bills Rediscounting/BRDS - - (XII) Others - -
Sub Total 9,252.26 82.15
Net Assets 11,263.30 100.00
D Government Securities - - E Fixed Deposits 2,000.00 17.76 F Cash and Net Current Assets 11.04 0.10G Others (Pls specify) - -
Sr. Name of Market Value % to Net AssetNo. Instrument (In Rs. Lakh) of the scheme
AnnexureA) Bonds & Debentures
Category of Issuer Name of the Issuer Market Value (in Rating % to Net Assets of Rs.lakh) the Scheme
Total - -
Total - -
Total - -
Total - -
(I) Private Corporate Bodies
(II) PSUs
(III) Banks/FI (including NBFC)
(IV) Others
B) Securitised Debt InstrumentsSingle Loan
Obligor Originator Trust Details Name of Guarantor / Level of Guarantee Market Value RatingDetails of Underlying Security (as % of Loan) (in Rs. Lakh)
Total Pool
Originator Seller Trust Details Type of Pool Credit enhancement Market Value Rating(as % of Loan) (in Rs. Lakh)
Total
C) Money Market InstrumentsName of Market Value Rating % to
the Schemethe Issuer (in Rs. Lakh) Net Assets of
Total 2,462.70 21.86
United Bank of India Ltd. 2,975.35 A1+ 26.26Export Import Bank of India 2,469.73 AAA 21.93Andhra Bank Ltd 1,282.47 11.39Total 6,709.55 59.57
Total - -
CBLO/Repo Transaction 80.01 0.71Total 80.01 0.71
Total - -
Total - -
(VII) CPs
(VIII) CDs
(IX) T Bills
(X) CBLOs/Repos
(XI) Bills Rediscounting/BRDS
(XII) Others
Apollo Tyres Ltd 2,462.70 P1+ 21.86
F1+(IND)
D) Government SecuritiesDetails of Market Value % to Securities (in Rs. Lakh) of the Scheme
Net Assets
TotalCanara Bank 1,000.00 8.88Indusind Bank Ltd. 1,000.00 8.88Total 2,000.00 17.76
E) Fixed DepositsBank Name Amount % to
of the Scheme(in Rs. Lakh) Net Assets
(V)
(VI)
34

IDFC Fixed Maturity Plan(IDFC-FMP)A Close - Ended Income Fund
IDFC-FMP - Fourteen Month Series - 1(Allotment Date 17 Mar 2010)
Average AUM Rs.217.54 Crores I Date of Maturity 16 May 2011
Data as of 30 June 2010
35
Portfolio Portfolio Contd...
NAV
PLAN (Rs./Unit*)Plan A - Growth 10.2326Plan A - Dividend 10.2326* Face value per unit = Rs 10/-
Sr. Name of Market Value % to Net AssetNo. Instrument (In Rs. Lakh) of the scheme
A Bonds & Debentures of :
B Securitised Debt Instruments
C Money Market Instruments
(I) Private Corporate Bodies 1,020.03 4.68 (II) PSUs 1,709.66 7.84 (III) Banks/FI (including NBFC) 3,333.37 15.29 (IV) Others - -
Sub Total 6,063.06 27.81
(V) Single Loan 2,563.95 11.76 (VI) Pool - -
Sub Total 2,563.95 11.76
(VII) CPs 4,765.03 21.85 (VIII) CDs 8,312.86 38.13 (IX) T Bills - - (X) CBLOs/Repos 20.00 0.09 (XI) Bills Rediscounting/BRDS - -
Sub Total 13,097.89 60.07
Net Assets 21,803.56 100.00
D Government Securities - - E Fixed Deposits - - F Cash and Net Current Assets 78.66 0.36 G Others - -
Sr. Name of Market Value % to Net AssetNo. Instrument (In Rs. Lakh) of the scheme
AnnexureA) Bonds & Debentures
Category of Issuer Name of the Issuer Market Value (in Rs.lakh) Rating % to Net Assets of the Scheme
Total 1,020.03 4.68
Total 1,709.66 7.84
Housing Development Finance Cor Ltd. 1,711.65 AAA 7.85
Total 3,333.37 15.29
Total - -
(I) Private Corporate Bodies
(II) PSUs
(III) Banks/FI (including NBFC)
(IV) Others
Kesoram Industries LTD. 999.03 CAREAA 4.58Tata Motors Ltd. 21.00 AAA 0.10
LIC Housing Finance Ltd. 1,709.66 AAA 7.84
IDFC Ltd. 1,115.23 AAA 5.11Bajaj Auto Finance Ltd. 506.49 LAA+ 2.32
B) Securitised Debt InstrumentsSingle Loan
Obligor Originator Trust Details Name of Guarantor / Level of Guarantee Market Value RatingDetails of Underlying Security (as % of Loan) (in Rs. Lakh)
PoolOriginator Seller Trust Details Type of Pool Credit enhancement Market Value Rating
(as % of Loan) (in Rs. Lakh)
Total
C) Money Market InstrumentsName of Market Value Rating % to
the Schemethe Issuer (in Rs. Lakh) Net Assets of
Total 4,765.03 21.85
IDBI Bank Ltd 5,081.75 A1+ 23.31Karnataka Bank Ltd A1+ 14.82Total 8,312.86 38.13
Total - -
CBLO/Repo Transaction 20.00 0.09
Total - -
Total - -
(VII) CPs
(VIII) CDs
(IX) T Bills
(X) CBLOs/Repos
(XI) Bills Rediscounting/BRDS
(XII) Others
L&T Finance Ltd 4,765.03 PR1+ 21.85
3,231.11
Total 20.00 0.09
D) Government SecuritiesDetails of Market Value % to Securities (in Rs. Lakh) of the Scheme
Net Assets
Total Total
E) Fixed DepositsBank Name Amount % to
of the Scheme(in Rs. Lakh) Net Assets
(V)
(VI)
Ministry Of Railways, GOI IRFC Ltd Nova IV Trust - LOCOMOTIVE Lease Agreement for Rolling Stock-Like Locomotive 0.00% 2,563.95 AAA(IND)(SO)
Total 2,563.95
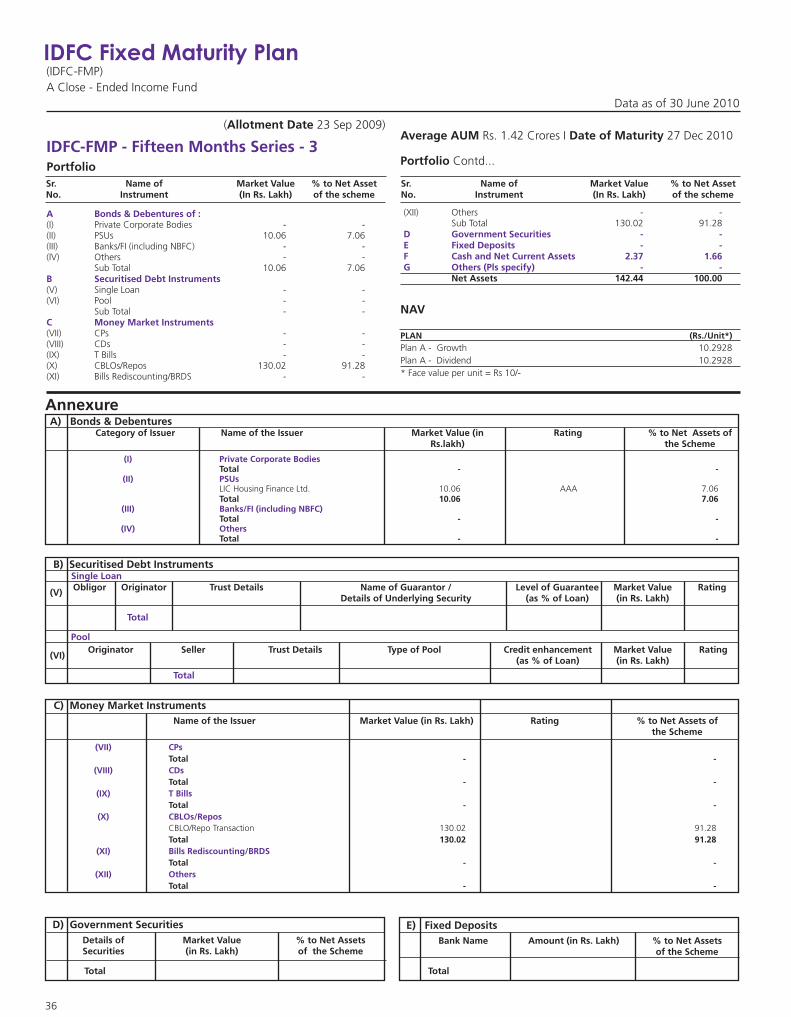
IDFC Fixed Maturity Plan(IDFC-FMP)A Close - Ended Income Fund
IDFC-FMP - Fifteen Months Series - 3(Allotment Date 23 Sep 2009)
Average AUM Rs. 1.42 Crores I Date of Maturity 27 Dec 2010
Data as of 30 June 2010
36
Portfolio Portfolio Contd...
NAV
PLAN (Rs./Unit*)Plan A - Growth 10.2928Plan A - Dividend 10.2928* Face value per unit = Rs 10/-
Sr. Name of Market Value % to Net AssetNo. Instrument (In Rs. Lakh) of the scheme
A Bonds & Debentures of :
B Securitised Debt Instruments
C Money Market Instruments
(I) Private Corporate Bodies - - (II) PSUs 10.06 7.06 (III) Banks/FI (including NBFC) - - (IV) Others - -
Sub Total 10.06 7.06
(V) Single Loan - - (VI) Pool - -
Sub Total - -
(VII) CPs - - (VIII) CDs - - (IX) T Bills - - (X) CBLOs/Repos 130.02 91.28(XI) Bills Rediscounting/BRDS - -
(XII) Others - - Sub Total 130.02 91.28
Net Assets 142.44 100.00
D Government Securities - - E Fixed Deposits - - F Cash and Net Current Assets 2.37 1.66 G Others (Pls specify) - -
Sr. Name of Market Value % to Net AssetNo. Instrument (In Rs. Lakh) of the scheme
AnnexureA) Bonds & Debentures
Category of Issuer Name of the Issuer Market Value (in Rating % to Net Assets of Rs.lakh) the Scheme
Total - -
Total 10.06 7.06
Total - -
Total - -
(I) Private Corporate Bodies
(II) PSUs
(III) Banks/FI (including NBFC)
(IV) Others
LIC Housing Finance Ltd. 10.06 AAA 7.06
B) Securitised Debt InstrumentsSingle LoanObligor Originator Trust Details Name of Guarantor / Level of Guarantee Market Value Rating
Details of Underlying Security (as % of Loan) (in Rs. Lakh)
PoolOriginator Seller Trust Details Type of Pool Credit enhancement Market Value Rating
(as % of Loan) (in Rs. Lakh)
Total
C) Money Market InstrumentsName of Market Value Rating % to
the Schemethe Issuer (in Rs. Lakh) Net Assets of
Total - -
Total - -
Total - -
CBLO/Repo Transaction 130.02 91.28
Total - -
Total - -
(VII) CPs
(VIII) CDs
(IX) T Bills
(X) CBLOs/Repos
(XI) Bills Rediscounting/BRDS
(XII) Others
Total 130.02 91.28
D) Government SecuritiesDetails of Market Value % to Securities (in Rs. Lakh) of the Scheme
Net Assets
Total Total
E) Fixed DepositsBank Name Amount % to
of the Scheme(in Rs. Lakh) Net Assets
(V)
(VI)
Total

IDFC Fixed Maturity Plan(IDFC-FMP)A Close - Ended Income Fund
IDFC-FMP - Thirteen Month Series - 5(Allotment Date 30 Mar 2010)
Average AUM Rs. 127.60 Crores I Date of Maturity 28 Apr 2011
Data as of 30 June 2010
37
Portfolio Portfolio Contd...
NAV
PLAN (Rs./Unit*)Plan A - Dividend 10.1704Plan A - Growth 10.1704Plan B - Dividend -Plan B - Growth -* Face value per unit = Rs 10/-
Sr. Name of Market Value % to Net AssetNo. Instrument (In Rs. Lakh) of the scheme
A Bonds & Debentures of :
B Securitised Debt Instruments
C Money Market Instruments
(I) Private Corporate Bodies - - (II) PSUs - - (III) Banks/FI (including NBFC) - - (IV) Others - -
Sub Total - -
(V) Single Loan - - (VI) Pool - -
Sub Total - -
(VII) CPs - - (VIII) CDs 12,730.36 99.51(IX) T Bills - - (X) CBLOs/Repos 60.01 0.47(XI) Bills Rediscounting/BRDS - - (XII) Others - -
Sub Total 12,790.37 99.98
Net Assets 12,792.56 100.00
D Government Securities - - E Fixed Deposits - - F Cash and Net Current Assets 2.19 0.02G Others (Pls specify) - -
Sr. Name of Market Value % to Net AssetNo. Instrument (In Rs. Lakh) of the scheme
AnnexureA) Bonds & Debentures
Category of Issuer Name of the Issuer Market Value (in Rating % to Net Assets of Rs.lakh) the Scheme
Total - -
Total - -
Total - -
Total - -
(I) Private Corporate Bodies
(II) PSUs
(III) Banks/FI (including NBFC)
(IV) Others
B) Securitised Debt InstrumentsSingle Loan
Obligor Originator Trust Details Name of Guarantor / Level of Guarantee Market Value RatingDetails of Underlying Security (as % of Loan) (in Rs. Lakh)
Total Pool
Originator Seller Trust Details Type of Pool Credit enhancement Market Value Rating(as % of Loan) (in Rs. Lakh)
Total
C) Money Market InstrumentsName of Market Value Rating % to
the Schemethe Issuer (in Rs. Lakh) Net Assets of
Total - -
Karnataka Bank Ltd 3,231.18 A1+ 25.26Federal Bank Ltd. 2,375.88 P1+ 18.57
ICICI Bank Ltd. 2,374.88 A1+ 18.56
Total 12,730.36 99.51
Total - -
CBLO/Repo Transaction 60.01 0.47Total 60.01 0.47
Total - -
Total - -
(VII) CPs
(VIII) CDs
(IX) T Bills
(X) CBLOs/Repos
(XI) Bills Rediscounting/BRDS
(XII) Others
IDBI Bank Ltd 2,375.23 A1+ 18.57
Kotak Mahindra Bank Ltd. 2,373.18 P1+ 18.55
D) Government SecuritiesDetails of Market Value % to Securities (in Rs. Lakh) of the Scheme
Net Assets
Total Total
E) Fixed DepositsBank Name Amount % to
of the Scheme(in Rs. Lakh) Net Assets
(V)
(VI)

IDFC Fixed Maturity Plan(IDFC-FMP)A Close - Ended Income Fund
IDFC-FMP - Seventeen Months Series - 1(Allotment Date 23 Dec 2009)
Average AUM Rs. 20.95 Crores I Date of Maturity 22 May 2011
Data as of 30 June 2010
38
Portfolio Portfolio Contd...
NAV
PLAN (Rs./Unit*)Plan A - Dividend 10.2958Plan A - Growth 10.2958Plan B - Dividend -Plan B - Growth 10.3135* Face value per unit = Rs 10/-
Sr. Name of Market Value % to Net AssetNo. Instrument (In Rs. Lakh) of the scheme
A Bonds & Debentures of :
B Securitised Debt Instruments
C Money Market Instruments
(I) Private Corporate Bodies 559.35 26.65 (II) PSUs 278.32 13.26 (III) Banks/FI (including NBFC) 880.89 41.97 (IV) Others - -
Sub Total 1,718.55 81.88
(V) Single Loan 284.88 13.57 (VI) Pool - -
Sub Total 284.88 13.57
(VII) CPs - - (VIII) CDs - - (IX) T Bills - - (X) CBLOs/Repos 70.01 3.34(XI) Bills Rediscounting/BRDS - - (XII) Others - -
Sub Total 70.01 3.34
Net Assets 2,098.94 100.00
D Government Securities - - E Fixed Deposits - - F Cash and Net Current Assets 25.49 1.21G Others (Pls specify) - -
Sr. Name of Market Value % to Net AssetNo. Instrument (In Rs. Lakh) of the scheme
AnnexureA) Bonds & Debentures
Category of Issuer Name of the Issuer Market Value (in Rating % to Net Assets of Rs.lakh) the Scheme
Tata Motors Ltd. 294.02 AAA 14.01 Tata Sons Ltd. 265.33 AAA 12.64Total 559.35 26.65
Total 278.32 13.26
Total 880.89 41.97
Total - -
(I) Private Corporate Bodies
(II) PSUs
(III) Banks/FI (including NBFC)
(IV) Others
LIC Housing Finance Ltd. 278.32 AAA 13.26
IDFC Ltd. 302.44 AAA 14.41Kotak Mahindra Prime Ltd. 299.82 LAA 14.28 Housing Development Finance Cor Ltd 278.64 AAA 13.28
B) Securitised Debt InstrumentsSingle Loan
Obligor Originator Trust Details Name of Guarantor / Level of Guarantee Market Value RatingDetails of Underlying Security (as % of Loan) (in Rs. Lakh)
Ministry Of Railways, GOI IRFC Ltd Nova IV Trust - LOCOMOTIVE Lease Agreement for Rolling Stock-Like Locomotive 0.00% 284.88 AAA(IND)(SO)
Total 284.88Pool
Originator Seller Trust Details Type of Pool Credit enhancement Market Value Rating(as % of Loan) (in Rs. Lakh)
Total
C) Money Market InstrumentsName of Market Value Rating % to
the Schemethe Issuer (in Rs. Lakh) Net Assets of
Total - -
Total - -
Total - -
CBLO/Repo Transaction 70.01 3.34 Total 70.01 3.34
Total - -
Total - -
(VII) CPs
(VIII) CDs
(IX) T Bills
(X) CBLOs/Repos
(XI) Bills Rediscounting/BRDS
(XII) Others
D) Government SecuritiesDetails of Market Value % to Securities (in Rs. Lakh) of the Scheme
Net Assets
Total Total
E) Fixed DepositsBank Name Amount % to
of the Scheme(in Rs. Lakh) Net Assets
(V)
(VI)
Risk Factors
39
Risk Factors: Mutual Funds and securities investments are subject to market risks, reinvestment risk, changes in political, economic environment and government policy and there is no assurance or guarantee that the objectives of the Scheme/s will be achieved. The NAV of the Scheme/s can go up or down depending on factors and forces affecting the Securities Market including fluctuation in interest rates, trading volumes and reinvestment risk. Past performance of the Sponsor/AMC/Mutual Fund is not necessarily indicative of the future performance of the Scheme/s and may not necessarily provide a basis for comparison with other investments. IDFC Classic Equity Fund (IDFC - CEF), IDFC Imperial Equity Fund (IDFC - IEF), IDFC Premier Equity Fund (IDFC - PEF), IDFC Arbitrage Fund (IDFC - AF), IDFC Enterprise Equity Fund (IDFC - EEF),IDFC Tax Saver (ELSS) Fund(IDFC –TS[ELSS]), IDFC Arbitrage Plus Fund (IDFC - APF), IDFC Small & Midcap Equity (SME) Fund (IDFC - SMEF), IDFC Strategic Sector (50-50) Equity Fund IDFC-SS (50-50)-EF, IDFC Tax Advantage (ELSS) Fund (IDFC TA-ELSS), IDFC India GDP Growth Fund (IDFC-IGGF), IDFC Super Saver Income Fund - Investment Plan (IDFC - SSIF-IP), IDFC Dynamic Bond Fund (IDFC - DBF), IDFC Super Saver Income Fund - Medium Term (IDFC-SSIF-MT), IDFC Super Saver Income Fund - Short Term (IDFC-SSIF-ST), IDFC Cash Fund (IDFC-CF), IDFC Liquidity Manager (IDFC-LM), IDFC Savings Advantage Fund (IDFC-SAF), IDFC Money Manager Fund - Treasury Plan (IDFC-MMF-TP), IDFC Money Manager Fund - Investment Plan(IDFC – MMF-IP), IDFC Government Securities Fund - Investment Plan (IDFC-GSF-IP), IDFC Government Securities Fund – Short Term Plan (IDFC-GSF-ST), IDFC Government Securities Fund – Provident Fund Plan (IDFC-GSF-PF), IDFC All Seasons Bond Fund (IDFC-ASBF), IDFC Asset Allocation Fund – Aggressive Plan (IDFC-AAF-AP) IDFC Asset Allocation Fund – Conservative Plan (IDFC-AAF-CP), IDFC Asset Allocation Fund – Moderate Plan (IDFC-AAF-MP), IDFC Monthly Income Plan( IDFC MIP), IDFC Nifty Fund (IDFC NF), IDFC Fixed Maturity Plan-Half Yearly Series-9 (IDFC-FMP-HYS-9), IDFC Fixed Maturity Plan Quarterly Series 55 (IDFC-FMP-QS-55), IDFC Fixed Maturity Plan – Fifteen Months Series 3 (IDFC-FMP - FMS-3), IDFC Fixed Maturity Plan – Fourteen Months Series 1 (IDFC-FMP - FMS-1), IDFC Fixed Maturity Plan – Thirteen Months Series 5 (IDFC-FMP - TMS-5), IDFC Fixed Maturity Plan –Seventeen Months Series 1 (IDFC-FMP-SMS-1),IDFC Fixed Maturity Plan- Hybrid Portfolio Fund Series 1 and IDFC Fixed Maturity Plan- Capital Protection Fund Series 1 and are names of the Schemes and do not in any manner indicate either the quality of the Schemes, their future prospects or returns. The Sponsor or any of its associates is not responsible or liable for any loss resulting from the operation of the Schemes beyond the corpus of the Trust of Rs. 30,000/-. Terms of Issue & Load Structure: IDFC-CEF, IDFC-IEF IDFC-PEF, IDFC-AF, IDFC - EEF, IDFC –TS[ELSS], IDFC-APF, IDFC-SMEF, IDFC-SS(50-50)-EF, IDFC TA( ELSS ), IDFC-IGGF, IDFC-SSIF (IP), IDFC-DBF, IDFC-SSIF (MT), IDFC-SSIF (ST), IDFC-CF, IDFC-LM, IDFC-SAF, IDFC-MMF-TP,IDFC-MMF-IP, IDFC-GSF-IP, IDFC-GSF-ST, IDFC-GSF-PF, IDFC-ASBF, IDFC-AAF-AP IDFC-AAF-CP, IDFC-AAF-MP, IDFC-MIP,IDFC-FMP-HYS-9, IDFC-FMP-QS55, IDFC-FMP - FMS-1, IDFC-FMP - FMS-3 , IDFC-FMP - TMS-5, IDFC-FMP-SMS-1,IDFC-FMP HPS1 and IDFC CPOF1: During the continuous offer the AMC calculates and publishes NAVs and offers for sale and redemption of units of the Scheme on all Business days . Entry Loads – Nil for all the schemes. Exit Load - For all the equity schemes (other than IDFC Arbitrage Fund,IDFC Arbitrage Plus Fund and ELSS Schemes of IDFC) : All investment including SIP/STP/Micro SIP/STP/FOF if redeemed / switched out within 365 days from the date of allotment-1%. No Entry Load/ Exit Loads/CDSC shall be chargeable in case of switches made between different options of the scheme. IDFC-AF - (Plan A & Plan B): is an Open Ended Equity scheme. 0.25% if redemption / switch is requested within 30 days from the date purchase during on going period. IDFC Tax Saver (ELSS) Fund : Nil. IDFC-APF - (Plan A& Plan B): 0.50% of NAV on investors who purchase / switch and seek to redeem / switch out such investments within 365 days from the date of effecting such purchase / switch in. IDFC-SMEF : The scheme is converted into open ended scheme w.e.f. September 11, 2009. After then during the Ongoing Offer Period load will be charged as follows: If redeemed within 1 year from the date of purchase(s) applying First in First out basis (including purchase made through the STP/SIP) -1.00%.No exit load /CDSC will be chargeable in case of switches made between different options of the schemes IDFC Tax Advantage (ELSS) Fund: Nil. India IDFC-SSIF Investment Plan (IP) – Plan A Plan B, plan C & Plan F - 1% of NAV on investors who purchase / switch and seek to redeem / switch out such investments within 365 days from the date of effecting such purchase / switch in. Investors opting for PEP / Dividend reinvestment option / SWP or switch between options within the plan will not be levied an exit load. IDFC –DBF (Plan A & Plan B):-Nil, IDFC-SSIF Medium Term Plan (MT) Plan A , Plan B& Plan F: 0.50% of NAV on investors who purchase / switch and seek to redeem / switch out such investments within 182 days from the date of effecting such purchase / switch in. Investors opting for PEP / Dividend reinvestment option / SWP or switch between options within the plan will not be levied an exit load. IDFC-SSIF Short Term Plan (ST) – Plan A, Plan B, Plan C, Plan D & Plan F: Nil. IDFC –CF – Plan A & Plan B; Nil. IDFC Liquidity Manager: Nil. IDFC Savings Advantage Fund (IDFC-SAF) (Plan A & Plan F) ; Exit Load for all investment including SIP/Micro SIP/STP shall be 1.00% of the applicable NAV if redeemed /switched out within 60 days from the date of allotment. IDFC MMF TP (Plan A, Plan B, Plan C, Plan D & Plan F) –Nil, IDFC-MMF-IP-(Plan A, Plan B & Plan F): Exit Load for all investment including SIP/Micro SIP/STP shall be 1.00% of the applicable NAV if redeemed /switched out within 30 days from the date of allotment, IDFC-GSF Investment Plan (IP) – Plan A & Plan B - 1% of NAV on investors who purchase / switch and seek to redeem / switch out such investments within 365 days from the date of effecting such purchase / switch in. Investors opting for PEP / Dividend reinvestment option / SWP or switch between options within the plan will not be levied an exit load IDFC-GSF Short Term Plan (ST)– Plan A & Plan B – 0.25% of NAV on investors who purchase / switch and seek to redeem / switch out such investments within 30 days from the date of effecting such purchase / switch in. Investors opting for PEP / Dividend reinvestment option / SWP or switch between options within the plan will not be levied an exit load. IDFC-GSF Provident Fund (PF) – Plan A & Plan B - 1% of NAV on investors who purchase / switch and seek to redeem / switch out such investments within 365 days from the date of effecting such purchase / switch in. Investors opting for PEP / Dividend reinvestment option / SWP or switch between options within the plan will not be levied an exit load. IDFC NF- Exit load: Nil.Switches from existing equity scheme into IDFC Nifty Fund shall attract applicable exit load. The Trustee / AMC reserves the right to change the Load structure if they so deem fit.The exit load/ CDSC of up to 1% of the redemption value charged to the unit holder by the Fund on redemption of units shall be retained by each of the schemes in a separate account and will be utilized for payment of commissions to the ARN Holder and to meet other marketing and selling expenses. Any amount in excess of 1% of the redemption value charged to the unit holder as exit load/ CDSC shall be credited to the respective scheme immediately. IDFC-ASBF - 0.75% of NAV on investors who purchase / switch and seek to redeem / switch out such investments within 365 days from the date of effecting such purchase / switch in. Investors opting for PEP / Dividend reinvestment option / SWP or switch between options within the plan will not be levied an exit load. IDFC-AAF-AP, IDFC-AAF-CP, and IDFC-AAF-MP: 1.50% of the NAV shall be applicable if investors who redeem / switch out such investments within months from the date of subscription applying First in First Out basis, (including investments through SIP/STP). Switches between Plans (within the scheme) shall not attract load. IDFC MIP: 1.00% of the NAV shall be applicable if investors who redeem / switch out such investments within 365 days from the date of subscription applying First in First Out basis, (including investments through SIP/STP). No load shall be applicable for switches between between options of the schemes.IDFC-FMP-9: 2%if redeem before 13 Nov.2006. IDFC-FMP-HYS9: Nil. IDFC-FMP-QS55: Nil. IDFC-FMP - FMS-1: Nil. IDFC-FMP - FMS-3: Nil , IDFC-FMP - TMS-5: Nil. IDFC-FMP-SMS-1: Nil. IDFC-FMP HPS1: Nil. IDFC CPOF1: Nil Investment Objective: IDFC – CEF: The investment objective of the scheme is to seek to generate long term capital growth from a diversified portfolio of predominantly equity and equity related instruments. However there is no assurance that the investment objective of the scheme will be realized. IDFC-IEF: The investment objective of the Scheme is to seek to generate capital appreciation and/or provide income distribution from a portfolio of predominantly equity and equity related instruments. There is no assurance or guarantee that the objectives of the scheme will be realized. IDFC-IEF: The investment objective of the Scheme is to seek to generate capital appreciation and/or provide income distribution from a portfolio of predominantly equity and equity related instruments. There is no assurance or guarantee that the objectives of the scheme will be realized. IDFC-PEF: The Scheme shall seek to generate long-term capital growth from an actively managed portfolio of predominantly equity and equity related instruments. However there is no assurance that the investment objective of the scheme will be realized. IDFC-AF & IDFC APF: The investment objective of the Scheme is to generate capital appreciation and income by predominantly investing in arbitrage opportunity in the cash and the derivative segments of the equity markets and the arbitrage opportunity available within the derivative segments and by investing the balance in debt and money market instruments. However there is no assurance that the investment objective of the scheme will be realized. IDFC-EEF: The investment objective of the scheme is to seek to generate capital growth from a portfolio of predominantly equity and equity related instruments (Including Equity derivatives). The scheme may also invest in debt and money market instruments to generate reasonable income. However there is no assurance that the investment objective of the scheme will be realized. IDFC - TS [ELSS]: The investment objective of the Scheme is to seek to generate long-term capital growth from a diversified portfolio of predominantly equity and equity-related securities. There can be no assurance that the investment objective of the scheme will be realized IDFC-APF: The investment objective of the scheme is to generate income (absolute to low

Risk Factors
40
volatility returns) by taking advantage of opportunities in the cash and the derivative segments of the equity markets including the arbitrage opportunities available within the derivative segment, by using other derivative based strategies and by investing the balance in debt and money market instruments. However there is no assurance that the investment objective of the scheme will be realized. IDFC-SMEF: The investment objective of the Scheme is to seek to generate capital appreciation from a diversified portfolio of equity and equity related instruments. The Scheme will predominantly invest in small and midcap equity and equity related instruments. Small and Midcap equity and equity related instruments will be the stocks included in the CNX Midcap index or equity and equity related instruments of such companies which have a market capitalization lower than the highest components of CNX Midcap Index. The Scheme may also invest in stock other than mid cap stocks (i.e. in stocks, which have a market capitalization of above the market capitalization range of the defined small midcap stocks) and derivatives. On defensive consideration, the Scheme may also invest in debt and money market instruments. However there is no assurance that the investment objective of the scheme will be realized. IDFC-SS (50-50)-EF: The investment objective of the scheme is to seek to generate long-term capital appreciation by investing in Equity and Equity related instruments. The investment objective of the fund shall be achieved by investing up to fifty percent of the assets of the scheme in a chosen sector (sector specific exposure) while the balance amount may be invested in companies across market capitalizations and across sectors (diversified exposure). The scheme may also invest in debt and money market instruments. There is no assurance or guarantee that the objectives of the scheme will be realized and the scheme does not assure or guarantee any returns. IDFC TA (ELSS): The investment objective of the Scheme is to seek to generate long term capital growth from a diversified portfolio of predominantly equity and equity related securities. There can be no assurance that the investment objective of the scheme will be realized. IDFC –IGGF: The investment objective of the scheme is seek to generate long term capital appreciation by investing in Equity and Equity related instruments. The scheme aims to capture the growth in India's Gross Domestic Product (GDP). The scheme would endevour to represent the growth in GDP by capturing the growth in the constituents of the GDP. The scheme may also invest in Debt and money market instruments. There is no assurance or guarantee that the objectives of the scheme will be realized and the scheme does not assure or guarantee any returns. IDFC - SSIF-IP: Seek to generate stable returns by creating a portfolio that is invested in good quality fixed income and money market securities.However there is no assurance that the investment objective of the scheme will be realized. IDFC – NF: The investment objective of the scheme is to replicate the S&P CNX Nifty Index by investing in securities of the CNX Nifty Index in the same proportion/weigtage. However, there is no assurance or guarantee that the objectives of the scheme will be realized and the scheme does not assure or guarantee any returns. IDFC – DBF: Seek to generate optimal returns with high liquidity by active management of the portfolio; by investing in high quality money market & debt instruments. However there is no assurance that the investment objective of the scheme will be realized. IDFC-SSIF-MT: Seek to generate stable returns with a low risk strategy by investing in good quality fixed income securities and money market securities. However there is no assurance that the investment objective of the scheme will be realized. IDFC-SSIF-ST: Seek to generate stable returns with a low risk strategy by investing in good quality fixed income securities and money market securities. However there is no assurance that the investment objective of the scheme will be realized. IDFC-CF: IDFC-CF is an open-ended liquid fund with an objective to generate optimal returns with high liquidity by investing in high quality money market and debt instruments. However there is no assurance that the investment objective of the scheme will be realized. IDFC-LM: The investment objective of the Scheme is to seek to provide high liquidity by investing in a portfolio of money market instruments and debt instruments. Whilst the scheme would endeavour to provide high liquidity to the investors, the surplus funds will be invested to deliver reasonable returns. There can be no assurance that the investment objective of the scheme will be realized. IDFC-SAF: To offer an investment avenue for short term savings by looking to generate stable returns with a low risk strategy. The scheme will have a portfolio that is invested in good quality debt and money market instruments such that the fund will offer a blend of liquidity with stability of returns. There can be no assurance that the investment objective of the scheme will be realized. IDFC-MMF-TP& IDFC-MMF-IP: Seek to generate stable returns with a low risk strategy by creating a portfolio that is substantially invested in good quality floating rate debt or money market instruments, fixed rate debt or money market instruments swapped for floating returns and fixed rate debt and money market instruments. However there is no assurance that the investment objective of the scheme will be realized. IDFC-GSF-IP: IDFC – GSF -IP is an open-ended dedicated gilt scheme with an objective to generate optimal returns with high liquidity by investing Government Securities. However there is no assurance that the investment objective of the scheme will be realized. IDFC-GSF-ST: IDFC-GSF-ST is an open-ended dedicated gilt scheme with an objective to generate optimal returns with high liquidity by investing Government Securities. However there is no assurance that the investment objective of the scheme will be realized. IDFC-GSF-PF: Seek to generate optimal returns with high liquidity by investing in government securities. However there is no assurance that the investment objective of the scheme will be realized. IDFC-ASBF: Seek to generate optimal returns with high liquidity by active management of the portfolio, by investing predominantly in debt oriented mutual fund schemes and money market instruments. However there is no assurance that the investment objective of the scheme will be realized. IDFC-AAF-AP, IDFC-AAF-CP, and IDFC-AAF-MP: The primary objective of Scheme is to generate capital appreciation through investment in different mutual fund schemes primarily local funds based on a defined asset allocation model. However, there can be no assurance that the investment objective of the scheme will be realized. IDFC MIP: The primary objective of Scheme is to generate regular returns through investment primarily in debt oriented Mutual Fund schemes (such as Income and Liquid funds). The secondary objective of the Scheme is to generate long-term capital appreciation by investing a portion of the Scheme's assets in equity oriented MF schemes. Monthly Income is not assumed and the same is subject to availability of distributable surplus. IDFC FMP HYS9: The investment objective of the Scheme is to seek to generate income by investing in a portfolio of debt and money market instruments maturing before the maturity of the scheme. There is no assurance or guarantee that the objectives of the scheme will be realized. IDFC-FMP-QS55: The investment objective of the Scheme is to seek to generate income by investing in a portfolio of debt and money market instruments maturing on or before the maturity of the scheme. There is no assurance or guarantee that the objective of the scheme will be realised. IDFC-FMP - FMS-1: The investment objective of the Scheme is to seek to generate income by investing in a portfolio of debt and money market instruments maturing on or before the maturity of the scheme. There is no assurance or guarantee that the objective of the scheme will be realised.IDFC-FMP - FMS-3: The investment objective of the Scheme is to seek to generate income by investing in a portfolio of debt and money market instruments maturing before the duration of the scheme. There is no assurance or guarantee that the objectives of the scheme will be realized. IDFC-FMP - TMS-5: The investment objective of the Scheme is to seek to generate income by investing in a portfolio of debt and money market instruments maturing before the maturity of the scheme. There is no assurance or guarantee that the objectives of the scheme will be realized. IDFC-FMP-SMS-1: The investment objective of the Scheme is to seek to generate income by investing in a portfolio of debt and money market instruments maturing before the duration of the scheme. There is no assurance or guarantee that the objectives of the scheme will be realized IDFC-FMP HPS1: The scheme endeavors to generate income by investing in high quality fixed income securities as the primary objective and generate capital appreciation by investing in equity and equity related instruments as a secondary objective. There can be no assurance that the investment objective of the scheme will be realized. IDFC CPOF1: The scheme endeavours to protect the capital by investing in high quality fixed income securities as the primary objective and generate capital appreciation by investing in equity and equity related instruments as a secondary objective. There can be no assurance that the investment objective of the scheme will be realized IISL Disclaimer: “S&P®” and “Standard and Poor's®” are trademarks of the McGraw-hill Companies, Inc. (“S&P”), and have been licensed for use by India Index Services & Products Limited in connection with the S&P CNX Nifty Index. “The Product is not sponsored, endorsed, sold or promoted by India Index Services & Products Limited ("IISL") or Standard & Poor's, a division of The McGraw-Hill Companies, Inc. ("S&P"). Neither IISL nor S&P makes any representation or warranty, express or implied, to the owners of the Product or any member of the public regarding the advisability of investing in securities generally or in the Product. Please read the full Disclaimers in relation to the S&P CNX Nifty Index in the Offer Document / Prospectus / Information Statement." Statutory Details: IDFC Mutual Fund has been set up as a trust by Infrastructure Development Finance Company Limited (IDFC) (liability restricted to corpus of Trust of Rs. 30,000) with IDFC AMC Trustee Company Ltd as the trustee and IDFC Asset Management Company Ltd as the investment manager. Investors in the scheme(s) are not being offered any guaranteed or assured rate of return. Copy of Scheme Information Document and Key Information Memorandum along with application form for all the schemes may be obtained from the office of IDFC Mutual Fund, One India Bulls Centre, 841, Jupiter Mills Compound, Senapati Bapat Marg,, Elphinstone Road, (West), Mumbai 400 013. Contact 1-800-226622 for details.For details please read the respective Scheme Information Document (SID) (including those of FMPs)/ Offer Document (OD) / Statement of Additional Information (SAI) carefully before investing.
Methodology of Ranking
41
Value Research Rating
ICRA Mutual Fund Awards Disclaimer
ICRA Credit Risk Rating
CRISIL Credit Quality Rating
CRISIL Credit Quality Rating Methodology
Morningstar Rating
Lipper Fund Awards, India, 2010
Value Research Fund Ratings are a composite measure of historical risk-adjusted returns. In the case of equity and hybrid funds this rating is based on the weighted average monthly returns for the last 3 and 5-year periods. In the case of debt funds this rating is based on the weighted average weekly returns for the last 18 months and 3-year periods and in case of short-term debt funds - weekly returns for the last 18 months. These ratings do not take into consideration any entry or exit load. Each category must have a minimum of 10 funds for it to be rated. Effective, July 2008, we have put an additional qualifying criteria, whereby a fund with less than Rs 5 crore of average AUM in the past six months will not be eligible for rating.
Five-stars indicate that a fund is in the top 10% of its category in terms of historical risk-adjusted returns. Four stars indicate that a fund is in the next 22.5%, middle 35% receive three stars, the next 22.5% are assigned two stars while the bottom 10% receive one star. The number of schemes in each category is mentioned along side the categories name. Equity Diversified (179), Equity : Index (18), Equity Tax Planning (28), Hybrid Equity Oriented (30), Hybrid: Monthly Income (34), Debt: Medium-term (40), Gilt: Medium and Long-term (32), Gilt: Short-term (10), Debt: Ultra Short-term (42), Debt: Ultra Short-term Institutional (49), Debt: Short-term (19), Debt: Short-term Institutional (10) Debt: Floating Rate Short-term (13), Hybrid: Debt-oriented (17), Debt: Liquid Plus: (32), Debt: Liquid Plus Institutional:(34), Hybrid: Arbitrage (11). These Fund Ratings are as on May 31, 2010.
The Value Research Ratings are published in Monthly Mutual Fund Performance Report and Mutual Fund Insight. The Ratings are subject to change every month. The Rating is based on primary data provided by respective funds, Value Research does not guarantee the accuracy.
IDFC Premier Equity Fund – Plan A has been ranked as a Seven Star Fund in the category of 'Open Ended Equity Diversified - Defensive' schemes for its 3 years performance till December 31, 2009.
The rank is an outcome of an objective and comparative analysis against various parameters, including: risk adjusted return, fund size, company concentration and liquidity. The ranking methodology did not take into account entry and exit loads imposed by the Fund. There were 81 schemes considered in 'Open Ended Equity Diversified - Defensive' category for the ranking exercise. The rank is neither a certificate of statutory compliance nor any guarantee on the future performance of IDFC Premier Equity Fund – Plan A.
IDFC Government Securities Fund – ST – Plan A has been ranked as a Five Star Fund in the category of 'Open Ended Gilt' schemes for its 1 year performance till December 31, 2009.
The rank is an outcome of an objective and comparative analysis against various parameters, including: risk adjusted return, fund size and average maturity. The ranking methodology did not take into account entry and exit loads imposed by the Fund. There were 30 schemes considered in 'Open Ended Gilt' category for the ranking exercise. The rank is neither a certificate of statutory compliance nor any guarantee on the future performance of IDFC GovernmentSecurities Fund – ST – Plan A.Ranking Source & Publisher: ICRA Online Limited
IDFC Money Manager Fund - Treasury Plan: “Credit Risk Rating mfAAA” - The Fund carries the lowest credit risk, similar to that associated with long-term debt obligations rated in the highest-credit-quality category.IDFC Money Manager Fund – Investment Plan: “Credit Risk Rating mfAAA” - The Fund carries the lowest credit risk, similar to that associated with long-term debt obligations rated in the highest-credit-quality category.IDFC Cash Fund: “Credit Risk Rating mfA1+” - The highest-credit-quality short-term rating assigned by ICRA to debt funds. Debt funds rated in this category carry the lowest credit risk in the short term and are similar to that of fixed income obligations of highest-credit-quality category with maturity of upto one year.This rating should however, not be construed as an indication of the performance of the Mutual Fund scheme or of volatility in its returns.IDFC Super Saver Income Fund - Short Term Plan: “Credit Risk Rating mfAAA” - The Fund carries the lowest credit risk, similar to that associated with long-term debt obligations rated in the highest-credit-quality category.Source: ICRA Ltd.
IDFC Super Saver Income Fund - Investment Plan: “Credit Quality Rating AAAf” - The assigned rating AAAf is valid only for “IDFC Super Saver Income Fund - Investment Plan”. The rating of CRISIL is not an opinion on the Asset Management Company’s willingness or ability to make timely payments to the investor. The rating is also not an opinion on the stability of the NAV of the Fund, which could vary with market developments.
CRISIL's credit quality ratings are based on the analysis of the credit risk of securities held by the fund. CRISIL has developed a Credit Quality Matrix to evaluate fund’s overall level of protection against losses associated with credit default. The matrix is a set of credit factors and credit scores derived scientifically from CRISIL’s rating default and transition rates.
This Morningstar-sourced information is provided to you by IDFC AMC and is at your own risk. Morningstar is not responsible for any damages or losses arising from any use of this information. Also, this information must not be relied upon without appropriate verification. IDFC AMC informs you as follows: (i) no investment decision should be made in relation to any of the information provided other than on the advice of a professional financial advisor; (ii) past performance is no guarantee of future results; and (iii) the value and income derived from investments can go down as well as up.
The Morningstar fund rating methodology is based on a fund's risk-adjusted return within a given Morningstar category. Morningstar ratings are calculated every month for the 3 year, 5 year and 10 year period. Within each rating period, the top 10% funds receive a five star rating, the next 22.5% earn a four star rating, the next 35% get three stars, the next 22.5% receive two stars, and the bottom 10% get one star. Loads are not considered for the rating purpose. The rating is based on NAV provided by respective funds. The current fund rating is for the 3 year period as of December 31, 2009. IDFC Imperial Equity Fund Growth has been rated 5-Star fund in the category of Large Cap schemes (342 Schemes), IDFC Premier Equity Fund Growth has been rated 5-Star fund in the category of Small/Mid Cap schemes, IDFC Dynamic Bond Fund Growth has been rated 5-Star fund in the category of Intermediate Bond schemes (174 Schemes), IDFC Savings Advantage Fund Growth has been rated 4-Star fund in the category of Liquid schemes (366 Schemes), IDFC Gov Sec PF Fund Growth has been rated 4-Star fund in the category of Intermediate Government schemes (77 Schemes), IDFC SS Inc M/T Fund Growth has been rated 4-Star fund in the category of Short-term Bond schemes.IDFC MMF IP Fund Growth has been rated 4-Star fundin the category of Ultra Short Term Bond schemes (391 Schemes), IDFC SS Inc IP Fund Growth has been rated 4-Star fund in the category of Intermediate Bond schemes (171 Schemes).
IDFC Premier Equity Fund – Plan AMethodologyClassification averages are calculated with all eligible share classes for each eligible classification. The calculation periods extend over 36, 60, and 120 months. The highest Lipper Leader for Consistent Return (Effective Return) value within each eligible classification determines the fund classification winner over three, five, or ten years. There were 189 funds under the category - Global classification.
The lowest average decile1 rank of the three years’ Consistent Return measure of the eligible funds per asset class and group will determine the asset class group award winner over the three-year period. In cases of identical results the lower average percentile rank will determine the winner. The decile ranking is obtained by the percentile ranking according to the formula: INT(((( Percentile Rank – 1 ) * ( 1 – 0.01 )) / 10 ) +1 ).
DisclaimerAlthough Lipper makes reasonable efforts to ensure the accuracy and reliability of the data contained herein, the accuracy is not guaranteed by Lipper. Users acknowledge that they have not relied upon any warranty, condition, guarantee, or representation made by Lipper. Any use of the data for analyzing, managing, or trading financial instruments is at the user’s own risk. This is not an offer to buy or sell securities.

IDFC AMC Offices / Contact Number
Agra : 9997972223
Ahmedabad : Ground Floor, Zodiac Avenue, Opp. Mayor’s Bunglow, Near Law Garden, Ahmedabad - 380 006. Tel.: 079-64505881/5857.
Amritsar : IDFC Asset Management Co Ltd. 6-FUF, 4th Floor, Central Mall, 32 Mall Road, Amritsar 143001, Mobile: +919356126222,
Landline: 0183-5030393.
Bangalore : 6th floor, East wing, Raheja Towers, #26 & 27, M.G.road, Bangalore - 560001 Tel.: 080-64501951/52,66111504/05/06.
Bhubaneswar : Shop No 208, 2nd Floor, Janpath Tower, Ashok Nagar, Bhubaneswar 751002
Chandigarh : Sco-2475-76, 1st Floor, Sector-22, Chandigarh - 160022. Tel. :0172-5071918/19/21/22. Fax : 01725071918..
Chennai : KRM Tower, 8th floor, No.1 Harrington Road, Chetpet, Chennai - 600 031, Phone: 044 – 45644201/202
Cochin : 39/3993 B2, Ground floor, Vantage Point, VRM Road, Ravipuram, Cochin-682 016, Kerala. Tel: 0484-3012639/4029291, Fax: 0484-2358639
Coimbatore : Red Rose Plaza, 509 H, II Floor, D.B. Road, R.S. Puram, Coimbatore - 641 002. Tel.: 0422-2542645, 2542678.
Dehradun : C/o EBD BUSINESS CENTRE, cubicle no 3, 49, Rajpur Road, Dehradun- 248001, Tel.: 9997598877
Goa : Advani Bussiness Centre, Neelkamal Arcade, A B Road, Panjim, Goa - 403001. TEl: 0832-6650403, Fax: 0832-6650310.
Mobile : 9823289903.
Guwahati : 4E, 4th Floor, Ganapati Enclave, G.S. Road, Ulubari, Opp Bora Service Station, Guwahati 781007, Mobile: 9957568099
Hyderabad : 4th Floor, Central Plaza, #6-3-902/A, Raj Bhavan Road, Somajiguda, Hyderabad - 500082 Tel.: 040-42014646/47, Fax-040-40037521.
Indore : 405, 4th Floor, 21 / 1, D.M. Tower, Race Course Road, Indore – 452 001.Phone: 0731-4206927/ 0731-4208048. Fax 0731-4206923
Jaipur : G-7, G-8, Anukampa Towers, Church Road, Jaipur - 302 001. Tel.: 0141-5105797, 5105798.
Jallandhar : 301 B, 3rd Floor, Grand Mall Building, Adjoining Hotel Radison, BMC Chowk, G.T. Road, Jalandhar-144001, Punjab- India Tel. 0181-5018264. Mobile: +919814777705
Kanpur : Office No. 214, 215, IInd Floor, KAN Chambers, 14/113, Civil Lines, Kanpur - 208 001. Tel: 0512-2331071, 2331119.
Kolkata : Oswal Chambers, 1st Floor, 2 Church Lane, Kolkata - 700 001. Tel.: 033-4017 1000-1005.
Lucknow : Flat No. 2, 1st Floor, SAS House, 6B, Tej Bhadur Sapru Marg, Lucknow -226001. Tel : 0522 – 3056900/01/02/03/04/05. Fax – 0522 - 3056900
Ludhiana : SCO 16-17, Basement, Feroze Gandhi Market, Ludhiana - 141 001. Tel.: 0161-5022155, 5022156.
Madurai : Shop No 9, 2nd Floor, Ram Niwas, Door No. 279, Goodshed Street, Madurai – 625001, Tel.: +91 98943 69124
Manglore : Raj Business Centre, 3rd Floor, Raj Towers, Balmatta Road, Manglore - 575001. Tel. : +91 99010 33822 (Not an official point of accepting transaction.)
Moradabad : 9837572638
Mumbai : 17/18, 3rd Floor, Vasvani Mansion, 120, Dinshaw Vachha Road, Opp K.C. College, Churchgate, Mumbai 400 020. Maharashtra.
Phone 022-22876419
Nagpur : Fortune Business Centre, First Floor, 6 Vasant Vihar, W.H.C.Rd., Shankar Nagar, Nagpur-440010. Tel.: 0712-6451428 / 2525657
Nashik : Kavita Complex 2nd Floor, Madan Services, Near Big Bazar, College Road, Nasik 422005. Mob. 09970625856.
New Delhi : 4th Floor, Narain Manzil, 23 Barakhamba Road, New Delhi - 110 001. Tel.: 011-47311301/ 02/03/04/05.
Patna : 406 Ashiana Hariniwas, New Dak banglow Road, Patna 800 001. Tel:(0612) 6510353
Pune : 1st Floor, Dr. Herekar Park Building, Next to Kamala Nehru Park, Off. Bhandarkar Road, Pune - 411 004. Tel: 020-66020965/ 4.
Raipur : 227-228, 2nd Floor, Lalganga Shopping Mall, G.E. Road, Raipur 492001,Mobile : 9926908790
Rajkot : “Star Plaza”, 2nd Floor, Office No. 201, Phulchab Chowk, Rajkot - 360 001. Tel. 0281-6626012.
Surat : U-15/16, Jolly Plaza, Athvagate, Surat: 395001. Phone: 2475060, 2475070
Vadodara : Ground Floor, Akash Ganga Complex, Adjacent to Vanijya Bhavan, Race Course Circle, Vadodara - 390 007. Tel.: 0265 - 6620919/ 939.
Varanasi : 9984250888
Visakhapatnam : Visakha Executive Centre, 47-11-1/5, Eswar Arcade, Dwarakanagar,1st Lane, Visakhapatnam-530016, Tel.:+91 9701163444
Phone TransactREDEEM SWITCH CHECK BALANCE
Call Free: 1-800-226622** Available from 8.00 am to 7.00 pm on all business days.www.idfcmf.com
IDFC Asset Management Company Ltd. Registered Office: One IndiaBulls Centre, Jupiter Mills Compound, 841, Senapati Bapat Marg, Elphinstone (W), Mumbai - 400013. Tel No. 24399999; 66289999; Fax: 24215051-52.
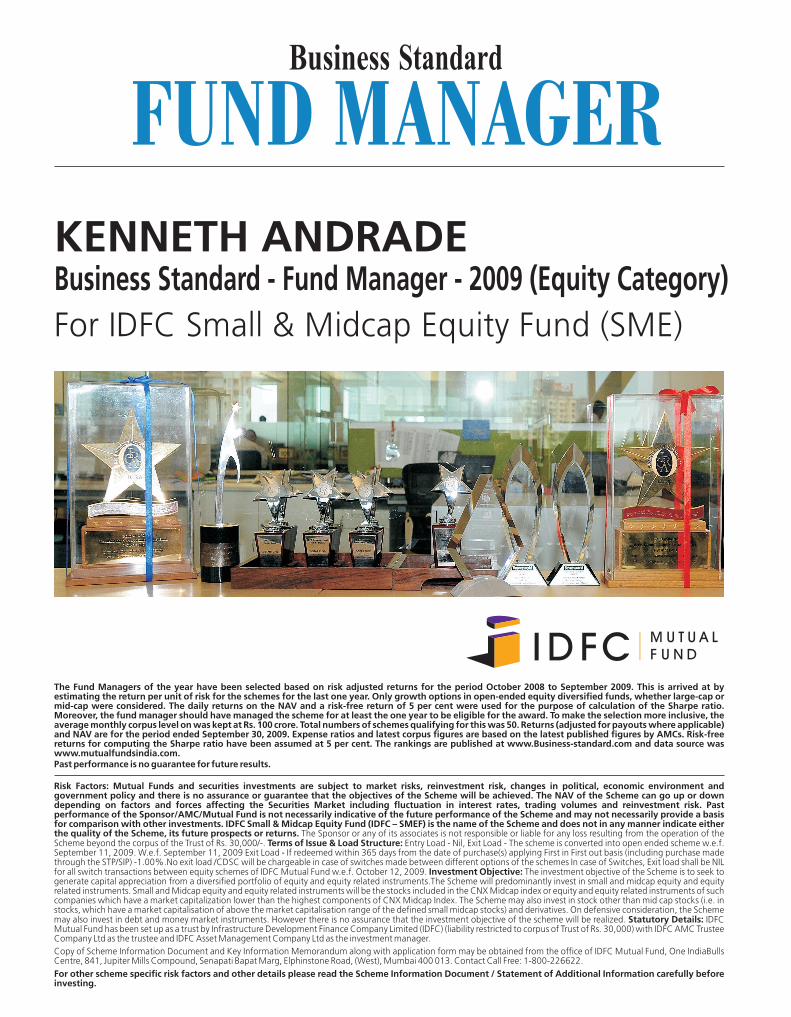
Related Documents