1 Identifying 6,000 communes that are the most vulnerable to natural hazards for the Government CBDRM Programme Author: Le Dang Trung - Indochina Research and Consulting Email: [email protected] 1 Introduction Recently, the World Bank has reconfirmed that Vietnam stands at the top in the list of most vulnerable to climate change countries in the world (Dasgupta, Laplante, Murray, & Wheeler, 2009). According to this research, Vietnam is ranked number 2 by the percentage increase in storm surge zones when compared to current surge zones; by absolute impacts of sea level rise and intensified storm surges, Vietnam is number 3 on the list after Indonesia and China. At the city level, Vietnam is also dominant in list of cities at risk from storm surges. While the risk of climate change is potentially dangerous, natural disasters have always been disastrous and deadly. Vietnam is located in one of the five storm centers on the planet. It is estimated that Vietnam is hit by 6.5 storms per year. Vietnam is also prone to floods and other disasters. CCFSC’s data show that between 1990 and 2010, Vietnam had to bear 74 flood events. Storms and floods almost always come with severe aftermaths. For instance, Typhoon Damrey, 2005, caused 68 humans dead, devastated 118 thousand houses and destroyed 244 thousand hectares of rice. The Government of Vietnam has been very engaging in the fight against natural disasters and climate change. It has set climate change and natural disasters at the top of its priorities. The National Target Program to Respond to Climate Change (NTP-RCC) has been approved by the Prime Minister in December 2008. In March 2012, the Government launched the National Strategy on Climate Change (NSCC). With enormous supports from the international donor community, in particular UNDP, DANIDA and the World Bank, the Government of Vietnam has been highly active in raising community awareness of climate change and natural disasters and supporting vulnerable communities. The Ministry of Agriculture and Rural Development has been conducting various projects to strengthen institutional capacity for disaster risk management. One of which is the Community-Based Disaster Risk Management (CBDRM) Program. This work is the initial stage of a long process in the government’s attempt to assist the most vulnerable communes cope with natural disaster in the future.

Welcome message from author
This document is posted to help you gain knowledge. Please leave a comment to let me know what you think about it! Share it to your friends and learn new things together.
Transcript

1
Identifying 6,000 communes that are the most vulnerable to natural hazards for the Government CBDRM Programme
Author:
Le Dang Trung - Indochina Research and Consulting
Email: [email protected]
1 Introduction Recently, the World Bank has reconfirmed that Vietnam stands at the top in the list of most
vulnerable to climate change countries in the world (Dasgupta, Laplante, Murray, & Wheeler,
2009). According to this research, Vietnam is ranked number 2 by the percentage increase in storm
surge zones when compared to current surge zones; by absolute impacts of sea level rise and
intensified storm surges, Vietnam is number 3 on the list after Indonesia and China. At the city
level, Vietnam is also dominant in list of cities at risk from storm surges.
While the risk of climate change is potentially dangerous, natural disasters have always been
disastrous and deadly. Vietnam is located in one of the five storm centers on the planet. It is
estimated that Vietnam is hit by 6.5 storms per year. Vietnam is also prone to floods and other
disasters. CCFSC’s data show that between 1990 and 2010, Vietnam had to bear 74 flood events.
Storms and floods almost always come with severe aftermaths. For instance, Typhoon Damrey,
2005, caused 68 humans dead, devastated 118 thousand houses and destroyed 244 thousand
hectares of rice.
The Government of Vietnam has been very engaging in the fight against natural disasters and
climate change. It has set climate change and natural disasters at the top of its priorities. The
National Target Program to Respond to Climate Change (NTP-RCC) has been approved by the
Prime Minister in December 2008. In March 2012, the Government launched the National Strategy
on Climate Change (NSCC).
With enormous supports from the international donor community, in particular UNDP, DANIDA and
the World Bank, the Government of Vietnam has been highly active in raising community awareness
of climate change and natural disasters and supporting vulnerable communities. The Ministry of
Agriculture and Rural Development has been conducting various projects to strengthen institutional
capacity for disaster risk management. One of which is the Community-Based Disaster Risk
Management (CBDRM) Program. This work is the initial stage of a long process in the government’s
attempt to assist the most vulnerable communes cope with natural disaster in the future.

2
This study acts as an instrumental asset to the Program’s implementation through identification of
vulnerable communes using objective scientific methods. The research is applied in three pilot
provinces: Cao Bang, Binh Thuan, and Can Tho. This paper presents the methodology used to rank
communes according their risk level to natural disasters, data sources used for risk index estimation
and implementation process of deriving a list of vulnerable communes. The ultimate output of the
project is the list of the most vulnerable communes to natural disasters in the three pilot provinces.
2 Methodology According to the Third Assessment Report (TAR), “vulnerability is defined as the extent to which a
natural or social system is susceptible to sustaining damage from climate change. Vulnerability is a
function of the sensitivity (susceptibility) of a system to changes in climate (the degree to which a
system will respond to a given change in climate, including beneficial and harmful effects),
adaptive capacity (the degree to which adjustments in practices, processes, or structures can
moderate or offset the potential for damage or take advantage of opportunities created by a given
change in climate), and the degree of exposure of the system to climatic hazards” (IPCC 2001, p.89)
(see Figure 1). This definition suggests that a comprehensive vulnerability index should be able to
capture three dimensions of vulnerability, namely economic vulnerability, environmental
vulnerability and social vulnerability.
Figure 1: Places of adaptation in the climate change issue (Smit et al., 1999)

3
Greiving (2006) proposes a new multi-hazard risk assessment approach, which is capable of
aggregating all spatially relevant risks and integrating measures that capture the vulnerability level
that local communities face with. This methodology is comprehensive and relevant for the risk-
ranking purposes because it allows risk comparisons on local spatial levels. Figure 21 below
depicts the framework used to compute the Integrated Risk Index based on the methodology.
Hazard Potential in the Greiving’s (2006) methodology is equivalent to Sensitivity in the IPCC’s
methodology. Similarly, Adaptive Capacity in the Greiving’s (2006) methodology is equivalent to
Coping Capability in the IPCC’s methodology; and Hazard Exposure in the Greiving’s (2006)
methodology is equivalent to Exposure in the IPCC’s methodology. Therefore, we will adopt
Greiving’s (2006) methodology to estimate vulnerability indices for 10,500 communes in Vietnam.
Figure 2: Natural Disaster Risk Index suggested by Greiving (2006)
1 Source: Based on Greiving (2006)
Hazard Measured by intensity and probability
Hazard Potential
Vulnerability
Hazard Exposure
Coping Capability
Risk In
dex

4
The practical process to construct the Risk Index accordingly to Greiving (2006) can be
summarized in Figure 3 below:
Figure 3: Framework of Integrated Risk Index
3 Data sources This work requires us to compile various sources of data on the following aspects: cyclones, rainfall
shocks, droughts, population density, living standards,…
3.1 Cyclones We employ storm archives, which track all the tropical storms and cyclones that hit Vietnam’s areas
from 1951 until present. The data have been continuously collected and maintained by leading
cyclone agencies in the world, including the U.S Navy’s Joint Typhoon Warning Center2 and the
Typhoon Warning Center of Japan Meteorological Agency3 with the most important parameters of
cyclones during their lives. They allow us to objectively and precisely identify regions of affected
areas in which winds are above a given threshold. 2 http://www.usno.navy.mil/NOOC/nmfc-‐ph/RSS/jtwc/best_tracks/ 3 http://www.jma.go.jp/jma/jma-‐eng/jma-‐center/rsmc-‐hp-‐pub-‐eg/trackarchives.html
Cyclones
Cyclones Rainfall shocks
River floods
Flash floods
Droughts
Others
Integrated hazard map
Diff
eren
t haz
ard
indi
cato
rs
Vulnerability map
Hazard exposure
Coping capacity
Population density
Local GDP/capita
Agricultural areas
Dependent ratio,..
GDP/capita, income, infrastructure, houses..
Inte
grat
ed R
isk
Inde
x
Indicator Weight Sub component Weight
Risk component Weight Overall
risk

5
We will apply Holland (1986) model which is also used by Global Resource Information Database
– Geneva (UNEP) in their Cyclone Database Manager product4 to identify the affected areas of
each of the storms. Appendix 1 shows the affected areas of Damrey 2005 cyclone identified by this
method.
3.2 Rainfall Rainfall shocks (rainfall flood and rainfall drought) form another important aspect of natural
disasters. We rely on daily observations from active weather stations to estimate total daily rainfall
for all the communes. We have access to the daily rainfall data from 1975-2006 from 172 weather
stations. The data have been maintained by HydroMeteorology Data Center5, an institution under
the Ministry of Natural Resources and Environment of Vietnam. The locations of these weather
stations are shown in the Appendix 2.
3.3 Other disasters Other disasters in Vietnam mainly include flash flood, whirlwind, saltwater intrusion and land
collapse. Since 1989, the Central Committee For Flood and Storm Control (CCFSC) of the Ministry
of Agriculture and Rural Development (MARD) of Vietnam has been maintaining a database on
disasters in Vietnam.6 The database includes records of 7 types of natural disasters, namely cold
wave; flash flood; flood; land collapse; typhoon; water rising and whirlwind. The records include a
number of important indicators such as the time of disaster events, locations of affected areas,
number of human deaths, people injured and other losses. However, the data is only representative
at the provincial level.
3.4 Terrain characteristics Natural disasters are mostly determined by location and terrain characteristics. Therefore, it is
crucial to incorporate variables, which capture those characteristics into the estimation of the risk of
natural hazards, either directly or indirectly via spatial interpolation of rainfall data. We rely on the
30mx30m Aster Global Digital Model (GDEM)7 data to obtain these variables at the commune
level. A number of terrain characteristics can be derived from this source of data, such as elevation,
slope and aspect.
3.5 Population censuses The Population Census 2009 provides valuable opportunities to introduce vulnerability, hazard
exposure and coping ability into the estimation of natural disasters risk. It is the latest population 4 Technical guide: http://www.grid.unep.ch/product/publication/download/article_PREVIEW_TropCyclones.pdf 5 The Center’s website: http://www.hymetdata.gov.vn/ 6 Unfortunately, the maintainance was suspended in early 2010. 7 Data source: http://www.gdem.aster.ersdac.or.jp/

6
census in Vietnam. It was conducted by the General Statistics Office (GSO) in April 2009. It
provides us with data on ownership of key assets, demographical indicators such as population size,
age structure, and gender structure. The data is available at the household level, which can be
aggregated to the commune level.
3.6 Poverty rate We will employ results of the World Bank’s poverty mapping works, which provide us with
poverty headcounts at the district level. A team of the World Bank has been working on a project,
which employs the Poverty Mapping Method to predict poverty rates at the district level by
combining the Population Census 2009 data and the Vietnam Household Living Standard Survey
2010 data.
4 Implementation process In this section, we will briefly describe processes we employ to implement necessary calculations to
derive the risk index’s components and the construction of the integrated risk index at the final step
as well. We provide the description for each of the risk components.
4.1 Storm shocks The core task for constructing storm shocks is to identify the geo-referenced affected areas in which
the wind speed is at least 35 knot. This threshold of wind speed is used to classify storms. We
follow the method used by (Mouton and Nordbeck 2005) to construct the trail of affected areas for
each of all the storms happened to hit the communes between 1955 and 2010. This process is
applied to the data on cyclones we has described earlier. As an illustration, Appendix 1 shows the
trail of affected areas with wind speed large than 35 for Typhoon Damrey 2005.
4.2 Rainfall Flood and Drought We estimate the probability of rainfall flood and drought using rainfall data from all the weather
stations in Vietnam. The calculation process involves steps described below:
i. Step 1: Interpolate daily rainfall for all the communes:
ii. Step 2: Calculate weekly total rainfall for rainfall flood shocks
iii. Step 3: Compute the probability of rainfall flood shocks
iv. Step 4: Calculate monthly total rainfall for rainfall drought shocks
v. Step 5: Compute the probability of rainfall drought shocks

7
4.3 Other disasters Measures of the risk of other disasters are constructed from the CCFSC’s disaster database. Other
disasters include cold wave, flash flood, land collapse, water rising and whirlwind. The probability
of being hit by other hazards at the provincial level is calculated via the following process:
i. Step 1: Count number of disasters in each province on a yearly basis
ii. Construct the probability of being hit by any one of these other disasters
4.4 Demographic Indicators Demographic indicators that enter the Integrated Risk Index include the dependency ratio, the
illiteracy ratio, the female ratio and the size population normalized to take values between zero and
unity. All of these measures are representative at the commune level.
The demographic indicators are constructed based on the Population Census 2009 data, which is
available at the household level. Our goal is to calculate the measures and aggregate them to the
commune level. Thus, the computation process is summarized as follows:
i. Step 1: Construct measures of the demographic indicators using the data at the household
level (the original data)
ii. Step 2: Compute commune averages by collapsing the household level data. Note that the
averages are corrected by the sampling weights.
4.5 Assets and Living standards Indicators The set of assets and living standards indicators consists of i) poverty headcount index, ii) basic
asset possession index and iii) the proportiono of temporary houses in the community. The poverty
headcount index, as we described earlier in the data section, is estimated based on the Poverty
Mapping Method by a team at the World Bank. For the asset index and the temporary houses index,
we construct them using the Population Census 2009 data. The computation procedure is similar to
the process described above.
4.6 Weight calculations Weights are needed when we aggregate an index from several components. Specifically, we need to
apply weights in the following cases:
i. Hazard Potential
ii. Hazard Exposure
iii. Coping Capacity
iv. Integrated Risk Index
8
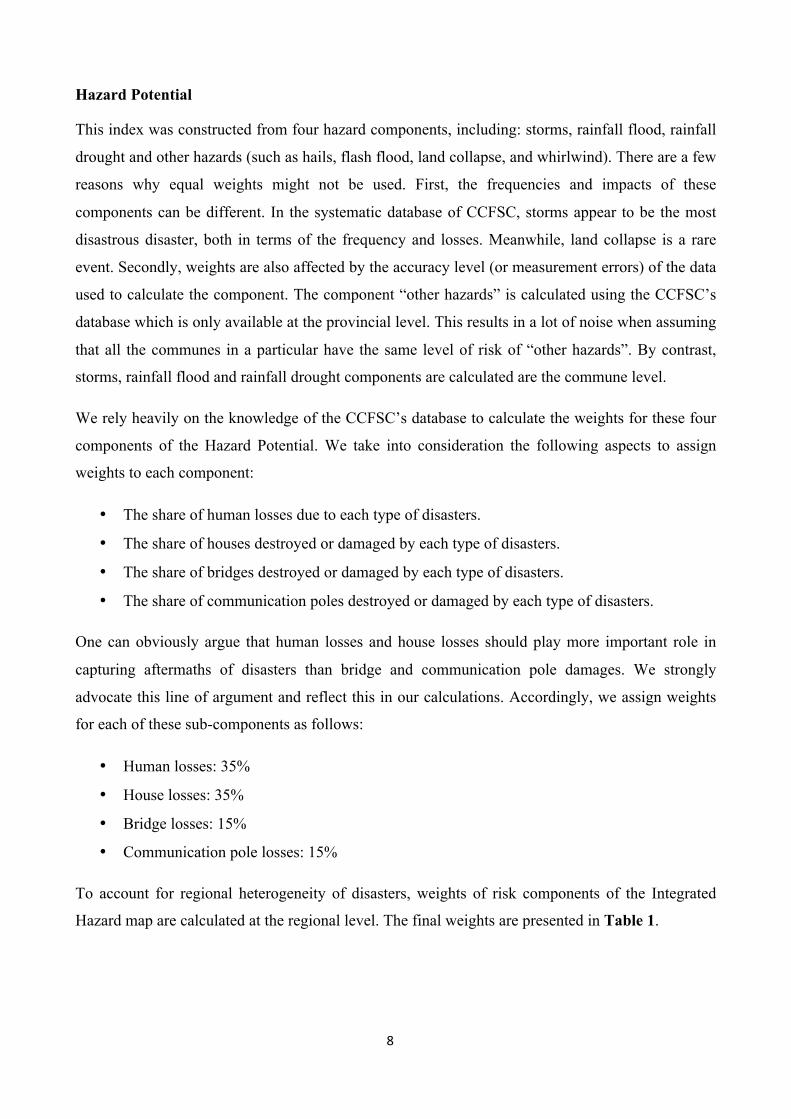
Hazard Potential
This index was constructed from four hazard components, including: storms, rainfall flood, rainfall
drought and other hazards (such as hails, flash flood, land collapse, and whirlwind). There are a few
reasons why equal weights might not be used. First, the frequencies and impacts of these
components can be different. In the systematic database of CCFSC, storms appear to be the most
disastrous disaster, both in terms of the frequency and losses. Meanwhile, land collapse is a rare
event. Secondly, weights are also affected by the accuracy level (or measurement errors) of the data
used to calculate the component. The component “other hazards” is calculated using the CCFSC’s
database which is only available at the provincial level. This results in a lot of noise when assuming
that all the communes in a particular have the same level of risk of “other hazards”. By contrast,
storms, rainfall flood and rainfall drought components are calculated are the commune level.
We rely heavily on the knowledge of the CCFSC’s database to calculate the weights for these four
components of the Hazard Potential. We take into consideration the following aspects to assign
weights to each component:
• The share of human losses due to each type of disasters.
• The share of houses destroyed or damaged by each type of disasters.
• The share of bridges destroyed or damaged by each type of disasters.
• The share of communication poles destroyed or damaged by each type of disasters.
One can obviously argue that human losses and house losses should play more important role in
capturing aftermaths of disasters than bridge and communication pole damages. We strongly
advocate this line of argument and reflect this in our calculations. Accordingly, we assign weights
for each of these sub-components as follows:
• Human losses: 35%
• House losses: 35%
• Bridge losses: 15%
• Communication pole losses: 15%
To account for regional heterogeneity of disasters, weights of risk components of the Integrated
Hazard map are calculated at the regional level. The final weights are presented in Table 1.

9
Table 1: Weights of components of the Integrated Hazard Map Region Typhoon Flood Other hazards Red River Delta 0.527 0.428 0.045 East Northern Mountain 0.226 0.568 0.205 West Northern Mountain 0.215 0.148 0.637 North Central Coast 0.588 0.348 0.063 South Central Coast 0.349 0.646 0.005 Central Highlands 0.320 0.206 0.474 South East 0.320 0.484 0.196 Mekong Delta 0.264 0.727 0.009 Source: Authors' calculations using CCFSC's Disaster Database
Hazard Exposure
There are four sub-components in this component of the integrated risk index. These include i) the
proportion of dependent population, ii) the proportion of illiterate population; ii) the proportion of
female population and iv) the size of population normalized to ensure its value ranges between zero
and unity. Since there is no prior theory about their relative importance, we decide to assign equal
weights to the four components.
Coping Capacity
The coping capacity index is constructed from three indicators, including: i) poverty headcount at
the district level; ii) the asset index and iii) the proportion of temporary houses. We also assign
equal weights to these three components.
The Integrated Risk Index
Given the importance of the Hazard Potential component compared to the other two components
(hazard exposure and coping capacity), we think that a reasonable set of weights is as follows:
• Hazard Potential: weight = 0.65
• Hazard Exposure: weight = 0.15
• Coping Capacity: weight = 0.20
Sensitivity test
One might wonder how the set of weights applied to the calculation of the risk index affects the
final results. It is worrisome if the ranking results are sensitive the weights. To shed some light on
this concern, we calculate the risk index using two different sets of weights. The first alternative is
calculated with the “equal-weight” set in which each of the three components takes a weight of 1/3.
The second alternative has the weights as follows:

10
• Hazard Potential: weight = 0.50
• Hazard Exposure: weight = 0.15
• Coping Capacity: weight = 0.35
The correlation of the three alternatives of the risk index shows that the risk index is fairly
insensitive to weights. The correlation coefficients between two alternatives are as follows:
• Between the base alternative and the first alternative: 0.8757
• Between the base alternative and the second alternative: 0.9610
• Between the first and the second alternatives: 0.9491
4.7 The Integrated Risk Index Once the three risk components have been calculated and the weights have been identified, the
computation of the integrated risk index is straightforward. The risk index is calculated using the
following formula:
Risk = 0.65*(Hazard Potential) + 0.15*(Hazard Exposure) + 0.20*(Coping Capacity)

11
5 Results The long process described above has been implemented for the population of all the communes in
Vietnam. The final product of this process is a series of values of the integrated risk index. It
captures all the possible aspects of the risk of natural disasters including i) hazard potential, ii)
hazard exposure and iii) coping capacity. The risk index is what we need to rank the communes by
the natural disasters vulnerability level. Figure 4 provides a distributional summary of the
integrated risk index of all the 11,112 communes in Vietnam.
Figure 4: Histogram of the Integrated Risk Index
Source: Author's calculations
12
References
Adger, WN 1999, 'Social vulnerability to climate change and extremes in coastal Vietnam', World Development, vol. 27, no. 2, pp. 249-269.
Füssel, H-M 2009, Review and Quantitative analysis of indices of climate change exposure, adaptive capacity, sensitivity, and impacts Potsdam Institute for Climate Impact Research, Potsdam, Germany.
Greiving, S. 2006. Integrated risk assessment of multi-hazards: a new methodology. Pp. 75–81 of: Schmidt-Thomé, Philipp (ed), Natural and Technological Hazards and Risks Affecting the Spatial Development of European Regions, vol. 42. Geological Survey of Finland. Available at: http://arkisto.gtk.fi/sp/SP42/1_alkus.pdf.
Holland, G.J. 1980. An Analytic Model of the Wind and Pressure Profiles in Hurricanes. Monthly Weather Review, 108:1212,1980.
IPCC 2007, The Fourth Assessment Report (Chapter 2), Intergovernmental Panel on Climate Change, Arendal, Norway.
IPCC 1995, The Second Assessment Report, Intergovernmental Panel on Climate Change, Arendal, Norway.
IPCC 2001, The Third Assessment Report (Chapter 1), Intergovernmental Panel on Climate Change, Arendal, Norway.
Mouton, F. and O. Nordbeck (2005). Cyclone Database Manager, United Nations Environment Programme (UNEP).
Smit, B., I. Burton, R.J.T. Klein, and R. Street, 1999: The science of adaptation: a framework for assessment. Mitigation and Adaptation Strategies for Global Change, 4, 199–213
Wheeler, D 2011, Quantifying vulnerability to climate change: implications for adaptation assistance, Center for Global Development, Washington DC.

13
Appendix 1: Affected areas of Damrey cyclone (2005) for which winds are no smaller than 17.5 m/s (threshold for tropical storms)

14
Appendix 2: Maps of locations of 172 weather stations in Vietnam

15
Appendix 3: Map of The Base Risk Index

16
Appendix 4: Map of The first alternative of the Risk Index

17
Appendix 5: Map of The second alternative of the Risk Index

18
Appendix 6: Map of the Hazard Potential component

19
Appendix 7: Map of the Hazard Exposure component

20
Appendix 8: Map of the Coping Capacity component
Related Documents


