IDENTIFYING THE VULNERABLE CAROTID PLAQUE BY MEANS OF DYNAMIC ULTRASOUND IMAGE ANALYSIS Thesis submitted for the degree of Doctor of Philosophy at the University of Leicester by Baris Kanber BSc (Leicester), MSc (Leeds) Department of Cardiovascular Sciences University of Leicester 2014

Welcome message from author
This document is posted to help you gain knowledge. Please leave a comment to let me know what you think about it! Share it to your friends and learn new things together.
Transcript

IDENTIFYING THE VULNERABLE CAROTID
PLAQUE BY MEANS OF DYNAMIC ULTRASOUND
IMAGE ANALYSIS
Thesis submitted for the degree of
Doctor of Philosophy
at the University of Leicester
by
Baris Kanber BSc (Leicester), MSc (Leeds)
Department of Cardiovascular Sciences
University of Leicester
2014

2
IDENTIFYING THE VULNERABLE CAROTID PLAQUE BY MEANS OF DYNAMIC ULTRASOUND IMAGE ANALYSIS BARIS KANBER Abstract
Stroke is a global healthcare problem with very high rates of morbidity and mortality; therefore, early diagnosis and prevention are of paramount importance. Many strokes are caused by atherosclerotic plaques in the carotid arteries, and these are often assessed using ultrasound examinations that include the measurement of the degree of stenosis. However, despite the degree of stenosis being an important clinical marker of disease severity, there is an urgent need for additional parameters that can identify high-risk, vulnerable plaques, which may be more likely to cause stroke regardless of the degree of stenosis. This thesis describes the development of techniques for measuring plaque characteristics from ultrasound image sequences, testing the hypothesis that parameters obtained from these measurements can help identify vulnerable carotid plaques. Novel methods to track plaque boundaries in ultrasound image sequences were developed (Chapters 2 and 3). This allowed the dynamic assessment of plaque echogenicity (Chapter 3), a novel method of quantifying plaque surface irregularities (Chapter 4), and the investigation of arterial wall (Chapter 5) and plaque (Chapter 6) mechanics. In the penultimate chapter (Chapter 7), these parameters were integrated in the form of a carotid plaque risk index (CPRI) and its efficacy in predicting the presence of patient symptoms was assessed. The dynamic measures of plaque echogenicity and the novel plaque surface irregularity index correlated significantly with the presence of patient symptoms. The CPRI, which combines these parameters with the degree of stenosis, improved diagnostic accuracy compared to the degree of stenosis on its own, and led to a better separation of the symptomatic and asymptomatic patient groups. The methods for characterising plaque characteristics developed in this thesis could be valuable for identifying vulnerable carotid plaques. The risk index, if its efficacy is confirmed in subsequent clinical trials, may help reduce the incidence and burden of stroke.

3
Acknowledgements
I would like to thank my supervisors Dr. Kumar Ramnarine and Dr. Mark Horsfield, and
my mentor Professor Thompson Robinson for their invaluable guidance and support
over the years. I would also like to thank Mr. Tim Hartshorne, the Transient Ischaemic
Attack (TIA) clinic and the Vascular Studies Unit (VSU) staff, Professor Ross Naylor,
Miss Sarah Nduwayo, Mr. James Garrard, and Miss Preeya Ummur without whom this
research project would never have been completed. Special thanks also to Miss Bharti
Patel, fellow PhD students Mr. Nikil Patel and Mr. David Marshall, and my colleague Dr.
Emma Chung for their support and friendship. Many thanks also to all the patients
who have agreed to take part in this study. I am also grateful to my wife who has
been loving and understanding, and our two toddlers who have been my sources of
inspiration. Lastly, and importantly, I would like to express my gratitude to the
National Institute for Health Research (NIHR) for funding this research project.
Disclaimer
This research was funded by and took place at the National Institute for Health
Research (NIHR) Collaboration for Leadership in Applied Health Research and Care
based at the University Hospitals of Leicester NHS Trust. The views expressed are those
of the author and not necessarily those of the NHS, the NIHR or the Department of
Health.
Declaration
The ultrasound scans used in this thesis were performed by the staff of the Transient
Ischaemic Attack Clinic at the University Hospitals of Leicester. Patient recruitment was
carried out by medical students Miss Sarah Nduwayo, Mr. James Garrard, and Miss
Preeya Ummur. I confirm that all the other work described in this thesis is my own
except where it may have been stated otherwise in the text.

4
Table of Contents
Abstract ........................................................................................................................ 2
Acknowledgements ....................................................................................................... 3
Disclaimer ..................................................................................................................... 3
Declaration.................................................................................................................... 3
Table of Contents.......................................................................................................... 4
List of Tables................................................................................................................. 8
List of Figures ............................................................................................................. 11
List of Abbreviations ................................................................................................... 17
Chapter 1 Introduction ................................................................................................ 20
1.1 Stroke................................................................................................................ 21
1.2 Classification of Strokes..................................................................................... 22
1.3 Transient Ischaemic Attack ................................................................................ 23
1.4 Stroke Risk Factors ............................................................................................ 24
1.5 Grading of Carotid Artery Stenosis ..................................................................... 26
1.6 Composition of Carotid Artery Plaques and Histology ........................................ 28
1.7 Causes of Plaque Instability............................................................................... 29
1.8 Evaluation of the Carotid Plaque........................................................................ 30
1.9 Ultrasound Evaluation ....................................................................................... 35
1.9.1 Plaque Morphology and Texture.................................................................. 37
1.9.1.1 Plaque Echogenicity and Heterogeneity ................................................ 38
1.9.1.1.1 The Greyscale Median (GSM).......................................................... 40
1.9.1.2 Plaque Surface Irregularities and Ulceration ......................................... 53
1.9.1.3 Other Texture and Morphological Parameters ....................................... 55
1.9.2 Evaluation of Plaque Motion ....................................................................... 56
1.9.3 Plaque Risk Scores ...................................................................................... 59
1.9.4 Limitations of the Ultrasound Assessment of Plaque Characteristics ........... 60
1.10 Physics of Medical Ultrasound Imaging ............................................................ 61
1.10.1 Ultrasound Wave Propagation.................................................................... 61
1.10.1.1 Transmission/Refraction and Specular Reflection ................................ 64
1.10.1.2 Scattering and Diffraction ................................................................... 66
1.10.1.3 Attenuation......................................................................................... 67

5
1.10.1.4 The Doppler Effect .............................................................................. 69
1.10.2 Generation and Reception of Ultrasound Waves ........................................ 71
1.10.2.1 Ultrasound Signal Processing .............................................................. 72
1.10.3 Biological Effects and Safety...................................................................... 74
1.10.3.1 Thermal and Mechanical Indices ......................................................... 76
1.11 Guide to the Thesis.......................................................................................... 77
Chapter 2 A Probabilistic Approach to Tracking of Arterial Walls in Ultrasound Image
Sequences .................................................................................................................. 79
2.1 Overview ........................................................................................................... 79
2.2 Introduction....................................................................................................... 79
2.3 Methods ............................................................................................................ 84
2.3.1 Pre-processing ............................................................................................ 85
2.3.2 Methods of Evaluation ................................................................................ 86
2.3.3 Software and Hardware............................................................................... 87
2.4 Results .............................................................................................................. 87
2.5 Discussion ........................................................................................................103
2.6 Conclusion........................................................................................................104
Chapter 3 Dynamic Variations in the Ultrasound Greyscale Median of Carotid Artery
Plaques......................................................................................................................105
3.1 Overview ..........................................................................................................105
3.2 Introduction......................................................................................................105
3.3 Methods ...........................................................................................................106
3.3.1 Data Acquisition.........................................................................................107
3.3.2 Data Analysis .............................................................................................107
3.3.3 Statistical Methods.....................................................................................110
3.3.4 Reproducibility...........................................................................................111
3.3.5 Comparison Against Manual Measurements...............................................111
3.4 Results .............................................................................................................112
3.5 Discussion ........................................................................................................124
3.6 Conclusions ......................................................................................................129
Chapter 4 Quantitative Assessment of Carotid Plaque Surface Irregularities and
Correlation to Cerebrovascular Symptoms ..................................................................130

6
4.1 Overview ..........................................................................................................130
4.2 Introduction......................................................................................................130
4.3 Methods ...........................................................................................................132
4.3.1 Data Acquisition.........................................................................................132
4.3.2 Data Analysis .............................................................................................132
4.3.3 Statistical Methods.....................................................................................134
4.4 Results .............................................................................................................134
4.5 Discussion ........................................................................................................141
4.6 Conclusions ......................................................................................................143
Chapter 5 Wall Motion in the Stenotic Carotid Artery: Association with Greyscale Plaque
Characteristics, the Degree of Stenosis and Cerebrovascular Symptoms.....................144
5.1 Overview ..........................................................................................................144
5.2 Introduction......................................................................................................144
5.3 Methods ...........................................................................................................147
5.3.1 Data Acquisition.........................................................................................147
5.3.2 Data Analysis .............................................................................................148
5.3.3 Statistical Analysis .....................................................................................149
5.3.4 Reproducibility...........................................................................................150
5.3.5 Comparison against manual measurements...............................................151
5.4 Results .............................................................................................................151
5.5 Discussion ........................................................................................................160
5.6 Conclusions ......................................................................................................162
Chapter 6 Quantitative Assessment of Plaque Motion in the Carotid Arteries using B-
Mode Ultrasound .......................................................................................................163
6.1 Overview ..........................................................................................................163
6.2 Introduction......................................................................................................163
6.3 Methods ...........................................................................................................164
6.3.1 In Vitro Study.............................................................................................164
6.3.2 Quantitative Analysis .................................................................................165
6.3.3 Motion Tracking .........................................................................................166
6.3.4 Statistical Methods.....................................................................................167
6.4 Results .............................................................................................................168

7
6.5 Discussion ........................................................................................................177
6.6 Conclusions ......................................................................................................179
Chapter 7 A Novel Ultrasound-Based Carotid Plaque Risk Index Associated with the
Presence of Cerebrovascular Symptoms .....................................................................180
7.1 Overview ..........................................................................................................180
7.2 Background ......................................................................................................180
7.3 Introduction......................................................................................................182
7.4 Methods ...........................................................................................................182
7.4.1 Analysis .....................................................................................................183
7.5 Results .............................................................................................................184
7.6 Discussion ........................................................................................................192
7.7 Conclusions ......................................................................................................195
Chapter 8 Summary, Discussion and Future Directions...............................................196
8.1 Overview ..........................................................................................................196
8.2 Thesis Summary and Discussion.......................................................................196
8.3 Limitations .......................................................................................................207
8.4 Future Directions ..............................................................................................208
8.5 Conclusions ......................................................................................................209
Chapter 9 Appendix....................................................................................................210
9.1 Publications......................................................................................................210
9.2 Conference Abstracts ........................................................................................211
9.3 Presentations ...................................................................................................211
References .................................................................................................................213

8
List of Tables
Table 1.1 - The four plaque categories described by Gray-Weale et al. ______________ 37
Table 1.2 - A summary survey of the literature related to ultrasonographic plaque
echogenicity/GSM assessment. Normalisation indicates whether image normalisation
was performed. 'Type of analysis: Qualitative' denotes that a qualitative assessment
was carried out, while 'Type of Analysis: Static' denotes that a quantitative analysis
was performed on a single frames of ultrasonographic images. 'Post P/C: Nsp' denotes
that the post-processing/greyscale transfer curve used on the ultrasound equipment
was not specified, while 'Post P/C: Lin' indicates that the post-processing curve used
on the ultrasound equipment was linear. ______________________________________ 47
Table 1.3 - Acoustic properties of various biological and non-biological media [211-212].
___________________________________________________________________________ 69
Table 1.4 - Attenuation coefficients of various human tissues [211].________________ 70
Table 2.1 - A survey of solutions related to the problem of tracking arterial walls in B-
mode ultrasound image sequences. ___________________________________________ 81
Table 2.2 – Comparison between Vernier caliper (dcal) and algorithm (dal) made
diameter measurements for hypo- and hyper-echoic test objects. ________________ 103
Table 3.1- Variations observed in the plaque GSM and area. The last column indicates
whether periodical variations of the order of 60/min were observed on the inter-frame
GSM and area waveforms. Normalized GSM refers to NORM1. The table has been sorted
in terms of the un-normalized, mean plaque GSM. _____________________________ 115
Table 3.2 - Results of multi-variable linear regression, testing for the influences of (a)
mean frame-by-frame GSM values, (b) mean frame-by-frame plaque areas, and (c) the
standard deviations of the frame-by-frame plaque areas on the standard deviations of
the frame-by-frame GSM values. Significant associations are marked with an asterisk
(*). _______________________________________________________________________ 120
Table 3.3 - Intra-observer coefficients of variation (standard errors) for the
measurement of the inter-frame mean GSM (un-normalized and NORM1 normalized)
and mean area, for eight plaque samples._____________________________________ 122
Table 3.4 - Comparison with manual delineation for eight selected plaque samples.
COV is the coefficient of variation. ____________________________________________ 123
9
Table 5.1 - Non-parametric Wilcoxon-Mann-Whitney associations between the absolute
and percentage systolic diameter changes before the proximal shoulder of the
atherosclerotic plaque and patient characteristics. Age was dichotomized using the
median of the dataset as a cut-off value.______________________________________ 158
Table 5.2 - Logistic regression testing for any association between the presence of
ipsilateral hemispheric symptoms and the degree of stenosis, greyscale plaque
characteristics and the absolute and percentage dilation of the arteries. Significant
associations are marked with an asterisk (*). __________________________________ 160
Table 6.1 - Mean values, across plaques, of the motion parameters relative to the
ultrasound probe. __________________________________________________________ 169
Table 6.2 - Mean values, across plaques, of the motion parameters relative to the
underlying tissues. _________________________________________________________ 170
Table 6.3 - Significance of association (p-values) between motion parameters relative
to the ultrasound probe, the degree of stenosis (DOS), plaque greyscale median (GSM)
and the surface irregularity index (SII).________________________________________ 170
Table 6.4 - Significance of association (p-values) between motion parameters relative
to the underlying tissues, the degree of stenosis (DOS), plaque greyscale median
(GSM) and the surface irregularity index (SII).__________________________________ 170
Table 6.5 - Reproducibility of the motion parameters (intra-observer coefficients of
variation). _________________________________________________________________ 171
Table 6.6 - In vitro assessment comparing the measured motion of the tissue
mimicking material (TMM) with the set displacement of the actuator and the motion of
the TMM-lumen interface measured using wall motion techniques [266]. __________ 171
Table 7.1 - Patient characteristics and the significance of association with
cerebrovascular symptoms. The statistical methods used to test the associations were
the non-parametric Wilcoxon-Mann-Whitney test for the patient age the χ2
test for the
rest of the patient characteristics. Significant associations are marked with an asterisk
(*). _______________________________________________________________________ 184
Table 7.2 - Comparison of diagnostic performance between degree of stenosis (DOS),
the logistic regression based, optimised risk index (CPRIlogistic) and our risk index
(CPRI). ____________________________________________________________________ 185

10
Table 8.1 - A summary of the thesis on a chapter by chapter basis including key
findings, strengths and limitations. ___________________________________________ 201

11
List of Figures
Figure 1.1 - Plaque in a carotid artery prior to endarterectomy. Used with permission
from and courtesy of Professor Brad Johnson of the University of South Florida. ____ 20
Figure 1.2 - A Stroke - Act F.A.S.T. campaign poster (National Health Service,
Department of Health)._______________________________________________________ 24
Figure 1.3 - B-Mode ultrasound image of a carotid artery with plaque (arrow) in
transverse cross-section. _____________________________________________________ 36
Figure 1.4 - illustration of an instantaneous pressure profile with distance (dist) along
the direction of propagation for an acoustic wave of wavelength 100µm. Bright bands
are compressions and dark bands are rarefactions. The vertical axis in the plot shown
on the top is the acoustic pressure in arbitrary units, and ranges from -ξ to +ξ, where
ξ is the pressure amplitude.__________________________________________________ 63
Figure 1.5 - Illustration of an incident sound wave being partly reflected and partly
transmitted (in the form of a refracted wave) at a plane interface between two media.
θi is the angle of incidence, θr is the angle of reflection, and θt is the angle of
transmission/refraction. ______________________________________________________ 65
Figure 1.6 - A simplified block diagram of the received signal processing chain for B-
Mode ultrasound where dashed lines show alternative routes for data acquisition.__ 73
Figure 1.7 - Illustration of a signal envelope. Blue lines show an amplitude modulated
5 MHz sinusoidal radiofrequency signal while the red curve shows the signal envelope.
___________________________________________________________________________ 74
Figure 2.1 - First pass segmentation result (left) for a carotid artery with plaque on the
posterior wall, and the corresponding probability map (right). Probability values range
from 0 (black) to 1.0 (white). _________________________________________________ 89
Figure 2.2 - The effect of adding another seed point. Segmentation result (left) and
combined probability map (right). _____________________________________________ 90
Figure 2.3 - Final segmentation result (left) and combined probability map (right) with
three additional seed points. _________________________________________________ 91
Figure 2.4 - A close-up view of the segmentation result over the plaque surface.____ 92
Figure 2.5 - Tracking of the arterial lumen for a carotid artery image sequence (single
frame shown). The whole image sequence is available to download from
https://dl.dropbox.com/u/13857734/pp/tt.avi. ___________________________________ 92

12
Figure 2.6 - Arterial lumen segmentation in a variety of vessel configurations and
image-noise conditions. ______________________________________________________ 93
Figure 2.7 - Tracking of the residual arterial lumen and plaque surface in the
transverse plane (single frame shown). The whole image sequence is available for
download from http://dl.dropbox.com/u/13857734/pp/t1.avi. _____________________ 93
Figure 2.8 - Segmentation result (left) and probability map (right) in the presence of
computationally added Gaussian noise with an approximate standard deviation of 36.1
grey levels, evaluated at an algorithm threshold setting of 2%. ___________________ 94
Figure 2.9 - Segmentation result (left) and probability map (right) in the presence of
computationally added Gaussian noise with an approximate standard deviation of 51.0
grey levels, evaluated at an algorithm threshold setting of 4%. ___________________ 95
Figure 2.10 - Segmentation result (left) and probability map (right) in the presence of
computationally added Gaussian noise with an approximate standard deviation of 72.1
grey levels, evaluated at an algorithm threshold setting of 4%. ___________________ 96
Figure 2.11 - Segmentation result (left) and probability map (right) in the presence of
computationally added Gaussian noise with an approximate standard deviation of 102
grey levels, evaluated at an algorithm threshold setting of 5%. ___________________ 97
Figure 2.12 - Tracking of the arterial lumen in the abdominal aorta in the presence of
substantial amounts of noise (single frame shown). The whole image sequence is
available for download from http://dl.dropbox.com/u/13857734/pp/aa_1.avi. _______ 98
Figure 2.13 - Tracking of the lumen surface in a walled flow phantom (single frame
shown). The whole image sequence available for download from
http://dl.dropbox.com/u/13857734/pp/wfp_1.avi. ________________________________ 98
Figure 2.14 - A selection of segmentation results for the detection of the boundaries of
hypo- and hyper-echoic test objects. __________________________________________ 99
Figure 2.15 - Variation, over several cardiac cycles, of the lumen diameter of the
common carotid artery (averaged over an approximately 1 cm long segment) from a
healthy volunteer, determined using the probabilistic algorithm. _________________ 100
Figure 2.16 - Comparison between the probabilistic algorithm (first and third columns)
and a conventional region growing technique based on intensity thresholding (second
and fourth columns). Results are given in pairs and labels indicate file reference and
threshold settings used. The two left-most figures on the bottom-most row are from

13
the walled-flow phantom, and the two right-most figures on the same row are from
the wall-less flow phantom. _________________________________________________ 102
Figure 3.1 - The plaque region shown by the green dashed lines is defined by two
boundaries: the top boundary (blue arrow) defines the plaque-arterial lumen interface
and the bottom boundary (orange arrow) defines the plaque-arterial wall interface. The
purple lines are the output of the surface tracking algorithm that was introduced in
Chapter 2. _________________________________________________________________ 109
Figure 3.2 - Close-up views of four plaque samples with varying echogenicities (single
frames shown). Plaques (a) px1, (b) px3, (c) px19, (d) px22. The region of acoustic
shadowing has been excluded from analysis for px19. __________________________ 113
Figure 3.3 - Variations in the un-normalized plaque GSM (top row), and plaque area
(bottom row) for plaques px1 (a,b), px3 (c,d), px19 (e,f), px22 (g,h). _____________ 114
Figure 3.4 - Variations in GSM for plaque sample px1: (a) un-normalized, (b)
normalized (NORM1). _______________________________________________________ 117
Figure 3.5 - (a) NORM1 normalized mean GSM versus un-normalized. (b) NORM1
normalized coefficients of variation versus un-normalized. Red dashed lines are the
lines of identity and indicate no change upon normalization. ____________________ 118
Figure 3.6 - Scatter plot of inter-frame coefficients of variation for un-normalized GSM
versus those for plaque area. The correlation between the two coefficients of variation
is weak (Spearman's rho 0.36, p=0.07). The dashed line is a linear fit to the data.__ 119
Figure 3.7 - Distribution of the mean, normalized GSM [a], and the extent of the frame-
by-frame variations in GSM (measured as the standard deviations of the inter-frame
GSM values [b] and the coefficients of variation [c]), for the symptomatic and
asymptomatic plaque groups. The horizontal lines indicate mean values for the
individual groups. __________________________________________________________ 121
Figure 3.8 - Bland-Altman plot showing the differences in GSM measurements, on
matching image frames, between our method and manual delineation. ___________ 124
Figure 4.1 - Two plaques of markedly different surface irregularity indices: (a) a
symptomatic plaque with an SII of 2.25 radians/mm; and (b) an asymptomatic plaque
with an SII of 1.57 radians/mm. The plaque surface is the boundary between the
plaque and the arterial lumen (where the purple and green dashed lines overlap). (a)

14
is also a plaque qualitatively classified as having an irregular surface, while (b) is a
plaque qualitatively classified as having a smooth surface. ______________________ 135
Figure 4.2 - Full-size ultrasound images corresponding to the close-up plaque views
shown in Figure 4.1. The symptomatic plaque (top), and the asymptomatic plaque
(bottom).__________________________________________________________________ 136
Figure 4.3 - Distribution of plaque surface irregularity index (SII, left), degrees of
stenosis (DOS, middle) and the product of the two (right) among the symptomatic and
asymptomatic plaque groups. Degrees of stenosis are given as degree of
stenosis(%)/100% (i.e. 0.5 corresponds to 50%, etc.). ___________________________ 137
Figure 4.4 - Scatter plot of the plaque surface irregularity index versus the degree of
stenosis of the corresponding artery (left) and the plaque area (right), illustrating a
lack of association between these parameters._________________________________ 138
Figure 4.5 - Distribution of plaque surface irregularity index (SII) among the plaque
groups qualitatively classified as having an irregular or smooth surface. __________ 139
Figure 4.6 - Comparison between Receiver Operating Characteristic curves for the
plaque surface irregularity index (SII), the degree of stenosis (DOS) and their product
(DOS×SII). _________________________________________________________________ 140
Figure 5.1 - Example of an arterial dilation waveform showing lumen diameter
variations of a carotid artery throughout several cardiac cycles.__________________ 148
Figure 5.2 - A carotid bifurcation plaque and illustration of the location of the diameter
measurements. In this case, the plaque appears at the carotid bulb, and diameter
measurements are taken in the distal common carotid artery immediately before the
proximal shoulder of the plaque. _____________________________________________ 150
Figure 5.3 - Box and whisker plots showing the distribution, versus the presence of
ipsilateral hemispheric symptoms, of the absolute and percentage arterial diameter
changes, degree of stenosis, normalized and un-normalized plaque GSM, and the
surface irregularity index (SII). _______________________________________________ 153
Figure 5.4 - Box and whisker plots showing the distribution of the percentage systolic
diameter changes versus patient characteristics. _______________________________ 154
Figure 5.5 - Box and whiskers plots showing the distribution of the absolute systolic
diameter changes versus patient characteristics. _______________________________ 156

15
Figure 5.6 - Scatter plots of the absolute and percentage systolic diameter changes
versus patient age, degree of stenosis, un-normalized and normalized plaque GSM,
and the plaque surface irregularity index (SII), illustrating a lack of association
between the absolute and percentage systolic dilation of arteries and any of these
parameters.________________________________________________________________ 157
Figure 5.7 - Bland-Altman plot showing the differences in arterial diameters, on
matching image frames, measured manually (Dmanual) and using our method (Dauto). 158
Figure 5.8 - Scatter plot showing a strong linear relationship between arterial diameters
measured manually (Dmanual) and using our method (Dauto).______________________ 159
Figure 6.1 - A still frame from an image sequence of the tissue mimicking material
(TMM) with the actuator set to produce a maximum of 500 µm displacement from the
initial position. Red arrows show the local TMM displacement at time t relative to the
position at frame 1, magnified by a factor of 10. White arrow shows the TMM interface
used for wall motion tracking (section 6.3.3). __________________________________ 166
Figure 6.2 - An example of a plaque and underlying tissues on the opposite sides of
the posterior arterial wall at the carotid bulb, with motion tracking. Arrows show the
local displacement at time t with respect to the position at frame 1, magnified by a
factor of 10. _______________________________________________________________ 173
Figure 6.3 - Calculated motion parameters, relative to the ultrasound probe, for the
plaque sample shown in Figure 6.2. The horizontal and vertical components of plaque
position are shown in the top-left and top-right plots, respectively. Velocity and
acceleration magnitudes are shown in the plots at the bottom. __________________ 174
Figure 6.4 - Box-whisker plots showing the distribution of the motion parameters
(relative to the probe: top row, relative to the underlying tissues: bottom row) within
the asymptomatic (marked -) and symptomatic (marked +) groups. ______________ 175
Figure 6.5 - Calculated motion parameters for the in vitro study with the actuator set
to produce a maximum displacement of 500 µm. The horizontal and vertical
components of position are shown in the top-left and top-right plots, respectively.
Velocity and acceleration magnitudes are shown in the plots at the bottom. ______ 176
Figure 6.6 - Calculated motion parameters for the in vitro study with the actuator set
to produce a maximum displacement of 200 µm. The horizontal and vertical

16
components of position are shown in the top-left and top-right plots, respectively.
Velocity and acceleration magnitudes are shown in the plots at the bottom. ______ 177
Figure 7.1 - Example of a symptomatic plaque (left) and an asymptomatic plaque
(right) with respective risk indices (CPRI) of 27.5 and 3.25. The degree of stenosis
(DOS) caused by the symptomatic plaque was 70%, while it was 20% for the
asymptomatic plaque. The difference between the symptomatic and the asymptomatic
case was more profound with CPRI than with DOS; the ratio between the two degrees
of stenosis was 70/20 (3.5x), while the ratio between the two risk indices was
27.5/3.25 (8.5x). ____________________________________________________________ 187
Figure 7.2 - Box and whisker plots showing the distribution of CPRIlogistic (top-left) and
CPRI (bottom-left) in carotid artery stenoses with and without cerebrovascular
symptoms. The corresponding plots in the middle and on the right further show the
distribution of CPRIlogistic and CPRI within the two groups in the form of cumulative
distribution and scatter plots.________________________________________________ 188
Figure 7.3 - ROC curves showing the classification performance of the degree of
stenosis (DOS), plaque surface irregularity index (SII), the normalized plaque greyscale
median (GSM), CPRIlogistic and CPRI. 'Reference line' is the line of identity or no
discrimination. _____________________________________________________________ 189
Figure 7.4 - ROC curves showing the classification performance of the degree of
stenosis (DOS), compared with the reduced version of the carotid plaque risk index
DOS/(GSM+1). Areas under ROC curve are 0.771 for DOS vs. 0.844 for the reduced index.
'Reference line' is the line of identity or no discrimination. ______________________ 190
Figure 7.5 - Scattergrams of SII versus DOS (left), normalized GSM versus DOS (middle),
and SII versus normalized GSM (right). Plaques causing symptoms are shown as + in
purple, while plaques that have not been associated with symptoms are shown as o in
blue.______________________________________________________________________ 191

17
List of Abbreviations
Abbreviation Meaning
3D Three dimensional
ACAS Asymptomatic Carotid Atherosclerosis Study
ACS Acute Coronary Syndromes
ACST Asymptomatic Carotid Surgery Trial
AIUM American Institute of Ultrasound in Medicine
ARFI Acoustic Radiation Force Impulse
BMUS British Medical Ultrasound Society
CAS Carotid artery stenting
CC Common carotid method
CCA Common carotid artery
COV Coefficient of variation
CPRI Carotid plaque risk index
CPRIlogistic Carotid plaque risk index (logistic regression based)
CSI Carotid Stenosis Index
CT Computed tomography
DOS Degree of stenosis
ECA External carotid artery
ECST European Carotid Surgery Trial
FDA Food and Drug Administration
FDG Fluorodeoxyglucose
FFT Fast Fourier Transform
FMD Flow mediated dilation
GSM Greyscale median
HT Hough Transform
ICA Internal carotid artery
IMT Intima-media thickness
ISPTA Spatial-peak, temporal-average intensity
IVPA Intravascular Photoacoustic Imaging
IVUS Intravascular ultrasound
LACI Lacunar infarct

18
MDSV Maximal discrepant surface velocity
MI Mechanical Index
MRC Medical Research Council
MRI Magnetic Resonance Imaging
NASCET North American Symptomatic Carotid Endarterectomy Trial
NCC Normalized correlation coefficient
NEMA National Electrical Manufacturers Association
NHS National Health Service
NIH National Institutes of Health
NIHR National Institute for Health Research
NIRS Near-infrared spectroscopy
NRES National Research Ethics Service
OCSP Oxfordshire Community Stroke Project
OCT Optical Coherence Tomography
PACI Partial anterior circulation infarct
PEP Percentage echolucent pixels
PET Positron emission tomography
POCI Posterior circulation infarct
PVDF Polyvinylidine difluoride
PZT Lead zirconate titanate
RF Radiofrequency
ROC Receiver Operating Characteristic
ROI Region of interest
s.d. Standard deviation
SAPPHIRE Stenting and Angioplasty with Protection in Patients at High Risk for
Endarterectomy
SII Surface irregularity index
SOM Self organising map
SUV Standardized uptake value
TACI Total anterior circulation infarct
TCD Transcranial Doppler
TDI Tissue Doppler Imaging

19
TGC Time gain compensation
TI Thermal index
TIA Transient Ischaemic Attack
TMM Tissue mimicking material
TOAST Trial of Org 10172 in Acute Stroke Treatment
VCR Volume compression ratio
WFUMB World Federation for Ultrasound in Medicine

20
Chapter 1
Introduction
Carotid plaques are atherosclerotic lesions of the carotid artery wall (Figure 1.1).
Although the exact mechanisms are not fully understood, the initiation, progression,
and rupture of atherosclerotic plaques are thought to be promoted by inflammatory
processes that may be the result of endothelial damage or, less frequently, other
factors such as infection [1-2]. The presence of the carotid plaque can cause arterial
stenosis, a narrowing of the lumen of the carotid artery, and disturb blood flow to the
head. Carotid plaques can also act as sources of atheroembolic material or thrombus
which may detach, or otherwise emanate, from the plaque, travel in the bloodstream,
and block blood flow further down the arterial tree. This process, called embolisation,
can result in strokes, cerebral infarctions, and ocular ischaemia. Most strokes in
patients with carotid stenosis are believed to be embolic in nature [3].
Figure 1.1 - Plaque in a carotid artery prior to endarterectomy. Used with permission
from and courtesy of Professor Brad Johnson of the University of South Florida.

21
The majority of carotid plaques occur at the bifurcation of the common carotid artery
(CCA) into the internal (ICA) and external (ECA) carotid arteries [4]. Having plaques in
the carotid arteries increases the risk of stroke and cerebral infarction [3,5]. Hollander
et al. found this increase in risk to be approximately 1.5-fold, rising to more than 10-
fold when many plaques are present [5]. Although measures such as stenosis severity,
maximum plaque thickness, total plaque area are useful and have been associated
with increased risk of stroke and other vascular outcomes [6-8], it is recognized that
some plaques may be particularly vulnerable or high-risk. Plaque instability, in this
respect, is reported to play a major part in the onset of ischaemic events, regardless
of the degree of lumen narrowing [9]. Such vulnerable plaques include those which are
ulcerated, and those comprising a large lipid pool or necrotic core separated from the
bloodstream by a thin fibrous cap. Some of these plaques may already be generating
emboli which can be detected using methods such as transcranial Doppler ultrasound
(TCD), while others can remain silent and become unstable and rupture suddenly
[3,10]. The significance of this thesis is that, if vulnerable plaques can be identified,
treatment can be more appropriately tailored, potentially reducing the incidence and
burden of stroke.
1.1 Stroke
Stroke is a leading cause of death and disability worldwide. It is estimated that 15
million people suffer a stroke each year, with as many as 5 million resultant deaths
and 5 million cases of permanent disability [11]. In England, approximately 110,000
strokes occur per year and, according to a report in 2010, there were around 300,000
people living with moderate to severe disabilities as a result of stroke [12]. The cost to
the economy has been estimated to be as large as £8 billion1 per year [12]. In
developed countries, stroke accounts for between 2 and 4% of total healthcare
expenditure [13].
Stroke occurs when blood flow to or in the head is disturbed, causing cerebral or
ocular ischaemia. Depending on the extent of the damage, this can result in transient
1 Direct care costs (cost to NHS), over £3 billion per year.
22
or permanent symptoms, disability or death. The range of disabilities that may be
caused by stroke include paralysis, aphasia, loss of cognitive abilities, partial or
complete loss of the visual field, and incontinence [12]. In England, around one in four
people who have a stroke die as a result; it is the third leading cause of death,
accounting for 10% of all deaths [12]. Globally, 60% of people who suffer a stroke die
or become dependent on others [11].
Plaques of the carotid arteries can cause stroke by restricting blood flow to the brain
or the eyes, or by being sources of thromboembolic materials which can embolise in
the intracranial vascular tree. Some carotid plaques can remain seemingly
asymptomatic even when they cause a total obstruction of the artery, yet others cause
stroke even when the stenosis severity is low. Therefore, despite a general increase in
the risk of stroke with increasing severity of stenosis, some plaques may be more
likely to cause cerebrovascular events, and improved identification of such vulnerable
plaques could help to prevent stroke.
1.2 Classification of Strokes
Strokes are broadly classified into the two types: ischaemic and haemorrhagic.
Ischaemic strokes account for approximately 80% to 85% of all strokes [13-15], while
haemorrhagic strokes account for the remaining 15% to 20% [13-15]. It is very relevant
to the subject matter of this thesis that up to 80% of all ischaemic strokes occur in the
areas of the brain supplied by the carotid arteries [4]. In fact, carotid plaques are the
underlying cause of the majority of ischaemic strokes [16-17], and the most common
source of emboli in stroke originates from the atherosclerotic disease of the carotid
bifurcation [18].
There are several classification schemes for further classifying strokes based on the
areas of the brain affected, and based on the underlying causes. The Oxfordshire
Community Stroke Project (OCSP) classification, for example, categorises strokes as
being total anterior circulation infarcts (TACI), partial anterior circulation infarcts
(PACI), lacunar infarcts (LACI), or posterior circulation infarcts (POCI). The ending letter
I is replaced by the letter H to indicate a haemorrhagic stroke as opposed to an

23
ischaemic stroke, or the letter S to indicate a stroke of an indeterminate pathogenesis
(which may be replaced by the letter I or the letter H following appropriate diagnosis)
[19]. The Trial of Org 10172 in Acute Stroke Treatment (TOAST) classification, on the
other hand, categorises strokes as being due to either large artery atherosclerosis,
cardio-embolism, small-vessel occlusion, other known aetiology, or an undetermined
aetiology [20].
1.3 Transient Ischaemic Attack
Partial or transient interruption of blood flow to the head, as opposed to a sustained
interruption which will typically cause a stroke, can lead to a transient ischaemic
attack (TIA) whereby the symptoms normally resolve within 24 hours [11-12]. TIA can
manifest itself as a temporary loss of strength or feeling on one side of the body, a
transient loss of vision, and other neurological symptoms such as aphasia. It is known
that patients who have had a transient ischaemic attack are at an increased risk of
having a stroke [21-22]. The early risk of stroke following a TIA is sometimes evaluated
using the ABCD2 algorithm [23] where the risk is determined based on clinical features
such as age, blood pressure, presence of diabetes and, type and duration of
symptoms. The risk of stroke at 2 days can be as large as 8% for ABCD2 scores in the
range 6 to 7. However, ABCD2 score cannot identify patients who have significant
carotid artery disease or vulnerable plaques [24]. The National Institutes of Health (NIH)
Stroke Scale is another scoring technique for risk assessment in patients who present
with neurological symptoms, but it is more a measure of stroke severity. Since the risk
of stroke is particularly elevated following a TIA, recognition of the symptoms of TIA
and stroke are of paramount importance. In the United Kingdom, the Stroke - Act
F.A.S.T. campaign (Figure 1.2) aims to raise awareness of stroke/TIA symptoms, which
include facial drooping, arm weakness, and speech disturbance; highlighting the
significance of seeking urgent medical help.

24
Figure 1.2 - A Stroke - Act F.A.S.T. campaign poster (National Health Service,
Department of Health).
1.4 Stroke Risk Factors
Risk factors for stroke are numerous and include:
• Hypertension;
• Hyperlipidaemia;
• Atrial fibrillation and septal defect (e.g. patent foramen ovale);
• Other heart disease (e.g. coronary heart disease, heart failure, heart attack);
• Impaired glucose tolerance (pre-diabetic hyperglycaemia);
• Diabetes;
• Smoking;
• Previous episodes of TIA/stroke;

25
• Genetic factors/family history of stroke;
• Alcohol abuse;
• Unhealthy lifestyle (e.g. physical inactivity, obesity) or diet (e.g. high salt
intake).
In fact, age is also a risk factor and most strokes affect the elderly. The incidence of
stroke doubles with each successive decade over the age of 55, with an overall rate of
0.2 per thousand in those aged 45-54 and 10 per thousand in those aged over 85 [25].
In comparison, the overall incidence rate of stroke is around 2-2.5 per thousand
population [25]. However, stroke sometimes occurs in younger patients as well, and is
often found to be related to carotid artery stenosis or occlusion [26]. As many as a
quarter of strokes that occur in England occur in people under the age of 65, including
children [12]. Stroke occurs in about 8% of children with sickle cell disease [11]. Acute
ischaemic stroke affects 3.3 of 100,000 children per year [27].
People of African or Caribbean origin and South Asian man are more likely to have a
stroke than people from other ethnic groups [12]. African-Caribbean and African men
and women have approximately double the risk of stroke compared to the Caucasian
population [25]. Hispanics have also been reported to have greater incidence of stroke
compared to Caucasians [28].
Stroke is also more common in men than women, but women who have a stroke are
more likely to die as a result [12,25]. The latter is largely attributable to the higher
mean age of stroke onset in women, but men have an overall 25-30% increased risk of
having a stroke [25]. A recent study found that females had significantly more intra-
plaque neovascularisation than males [29]. Neovascularisation, the formation of micro-
vasculature within plaques, is considered to be a possible cause of plaque instability
and a characteristic feature of a more vulnerable plaque type (section 1.7).
The incidence of stroke also appears to be influenced by socio-economic class, with
people in the lowest social class having a 60% increased risk of having a stroke
compared to those in the highest social class [25].

26
Other factors that may increase the risk of stroke include antiphospholipid antibodies,
hyperhomocysteinemia, inflammation, infection and periodontal disease [28,30-35].
Recently, plaque inflammation (macrophage infiltration) was found to be an
independent predictor of recurrent events in stroke patients [36].
Finally, having a carotid plaque is a risk factor for stroke. This is highly relevant to the
subject matter of this thesis. In fact, it has recently been reported that patients with
carotid plaques may exhibit cognitive decline even when they are seemingly
asymptomatic [37]. Therefore, the diagnosis of carotid plaques, particularly those
which are vulnerable or unstable, is crucial.
1.5 Grading of Carotid Artery Stenosis
Several methods, based on the measurement of arterial lumen diameters in normal
and stenosed regions of arteries, are used to quantify the degree of carotid artery
stenosis. The North American Symptomatic Carotid Endarterectomy Trial (NASCET)
calculated the degree of stenosis as the percentage reduction in the lumen diameter
at the stenosed region of the artery, taking the lumen diameter distal to the stenosis
as the baseline diameter [38]. The European Carotid Surgery Trial (ECST) employed a
similar method but used the estimated normal diameter of the artery, instead of the
lumen diameter distal to the stenosis, as the baseline diameter [39]. The common
carotid (CC) method is also similar; it uses the diameter of the common carotid artery
in the proximity of the carotid bulb as the baseline figure [40]. Another measure that
has been developed is the Carotid Stenosis Index (CSI), and is based on the estimation
of the proximal internal carotid artery diameter as 1.2 times the diameter of the
common carotid artery [41]. It is similar to the other techniques otherwise.
Despite the use of various different methods, the rationale in each case is the same:
the degree of stenosis is estimated using a percentage lumen diameter reduction
technique whereby the percentage reduction is estimated as the reduction in the
lumen diameter of the artery due to stenosis divided by a baseline diameter that
would be considered normal. Following the measurement of the degree of stenosis,
27
arteries are often categorized as normal, mildly stenosed (1-29%), moderately
stenosed (30-69%), severely stenosed (70-99%), or occluded [42]. Despite the
similarities, there are important discrepancies in stenosis severity measurements
made using the individual techniques. These discrepancies are also apparent in the
case of the NASCET and ECST methods, which are most widely used in clinical and
research practice [43].
In addition to the measurement of the degree of stenosis based on lumen diameter
changes, Doppler ultrasound evaluations based on blood velocity criteria and flow
characteristics, such as the presence of turbulence and spectral broadening, are also
used [44]. In essence, these velocity measures are based on estimating the degree of
stenosis by means of stratifying blood flow velocities or velocity-based ratios such as
the internal carotid artery peak-systolic flow velocity divided by the common carotid
artery end-diastolic flow velocity (St Mary's ratio) or the internal carotid artery peak-
systolic flow velocity divided by the common carotid artery peak-systolic flow velocity
(PSV ratio) [44-46]. Stenosis severity measures based on blood flow velocity
measurements are particularly useful when it is difficult to measure the residual and
normal arterial lumen diameters; this is often the case when the percentage diameter
reduction is large (e.g. greater than 70%) and there is severe plaque build-up. In fact,
Doppler ultrasound based velocity criteria are used more commonly in clinical practice,
compared to percentage lumen diameter reduction, to determine the degree of carotid
artery stenosis [47]. The use of percentage reduction in the transverse, cross-sectional
lumen area, obtained from CT angiography, has also been considered for estimating
the degree of stenosis, but this is suggested as an alternative for diameter-based
estimations when additional imaging beyond ultrasonography is deemed necessary;
for example, if the ultrasonographic assessment does not result in a diagnosis, or if
carotid arteries not readily accessible by ultrasound require evaluation [48]. The degree
of stenosis is an important parameter that is strongly associated with the risk of
stroke in symptomatic patients, and it is often used for clinical decision making [16].

28
1.6 Composition of Carotid Artery Plaques and Histology
The composition of carotid artery plaques can vary greatly; the following are some of
the important components that can be found:
• Lipids;
• calcium;
• vascular smooth muscle cells;
• macrophages;
• foam cells;
• other leukocytes (e.g. lymphocytes, neutrophils);
• extra-cellular matrix;
• collagen;
• elastin;
• necrotic cell debris;
• neovascularisation;
• intra-plaque haemorrhage.
Histology is useful for studying plaque specimens that have been collected during
carotid endarterectomy and allows an assessment of the composition and morphology
of the plaque to be made ex vivo. The American Heart Association classification of
atherosclerotic plaques is based on the histological assessment of plaque structure
and composition [49-50]. Using histological assessment, Salem et al. found that among
the TIA clinic patients with severe carotid artery stenoses, who were scheduled to have
carotid endarterectomy, those who had recurrent ischaemic events before the
scheduled surgery took place, had evidence of large lipid cores in their plaques [51].
Although there is evidence that symptomatic and asymptomatic plaques could have
the same histological components [52], their configuration is likely to affect the risk
posed by the plaque. Plaques which are fibrotic or calcified, for example, can become
vulnerable if they are complex plaques with surface defects or haemorrhage which
have so far remained silent [52]. The composition of plaques also evolves over time. A
multi-centre study found that symptomatic patients with recent symptoms had more
soft tissue content in their plaques than those with distant symptoms, suggesting not
29
only that plaque composition may change over time after the onset of symptoms, but
also that symptomatic patients with more distant symptoms might be regarded as
asymptomatic and treated conservatively [53].
Although histology is regarded as the gold standard for studying plaque composition,
it does have some important limitations. First is the removal of calcium and lipids
during histological preparation which can also affect the structural integrity of
atherosclerotic plaques [54]. Secondly, and importantly, histological assessment of
plaque composition can only be carried out ex vivo; thus is only useful for
investigating plaque vulnerability retrospectively.
1.7 Causes of Plaque Instability
The exact mechanisms by which plaques become unstable are not fully understood
[55]. Ulcerations, intra-plaque haemorrhage, inflammatory processes and the rupture of
plaque are amongst the several possible causes of carotid plaque instability [36,56-58].
In the context of inflammatory response, baseline neutrophil count was recently found
to be an independent predictor of mortality in neurologically asymptomatic patients
with carotid artery stenosis [1]. Plaques which have a large lipid core separated from
the bloodstream by a thin fibrous cap may rupture by means of an inflammatory
process involving foam-cell infiltration of the fibrous cap [59].
Plaques can also become unstable due to the physical forces present upon them, and
it has been suggested that mechanical stresses due to the motion of the plaque and
the arterial wall may lead to minor cracks and fissures [60], and any relative motion
between the two could cause plaque disruption due to the rupture of the vasa
vasorum [60-62]. Shear stress due to blood flow can also influence the stability of
plaques [63]. Studies have found that plaque neovascularisation and haemorrhage
relate to adverse cardiovascular outcome during follow-up and it has been suggested
that plaque vascularisation and haemorrhage are important causes of plaque
progression, as well as important mechanisms of plaque disruption leading to
atherothrombotic events [64-66]. Dunmore et al. studied carotid plaques collected after
endarterectomy and found that symptomatic plaques contained abnormal, immature

30
microvessels similar to those found in tumours and healing wounds and concluded
that such vessels could contribute to plaque instability by acting as sites of vascular
leakage and by the recruitment of inflammatory cells [66]. These vessels were dilated,
highly irregular and dysmorphic; they lacked vascular smooth muscle cells, and
vascular endothelial growth factor colocalized with macrophages were found adjacent
to them [66]. Loss of the extracellular matrix in the fibrous cap due to matrix degrading
enzymes and the death of matrix synthesizing smooth muscle cells is also thought to
play a role in plaque rupture [67].
Apoptosis (programmed cell death) of vascular smooth muscle cells in atherosclerotic
plaques in mice has been found to induce features of plaque vulnerability including
marked thinning of the fibrous cap, loss of collagen and matrix, accumulation of cell
debris (enlargement of the necrotic core), elastin breaks, and intense intimal
inflammation [68-70]. Strikingly, low-level vascular smooth muscle cell apoptosis has
been found to promote calcification within established plaques in mice, a feature
generally considered to be suggestive of plaque stabilisation [69]. Leukocyte
mitochondrial DNA damage has also been found to associate with plaque vulnerability
in humans [71]. Systemic factors such as infection, autoimmunity, or genes may also
be important determinants of plaque instability [63].
1.8 Evaluation of the Carotid Plaque
There exists a wealth of techniques for evaluating the carotid plaque. Catheter or
conventional angiography is an invasive technique that involves the introduction of an
iodine based contrast material into the bloodstream and the subsequent acquisition of
x-ray images. Because of the use of contrast materials, it is in contra-indicated in
many situations including in patients with impaired kidney function. The procedure of
catheter angiography itself is associated with a risk of stroke as large as 1% and a
form of neurological complication occurs in as many as 4% of the patients [72].
Although angiography has traditionally been considered the gold standard for
diagnosis, it also has several limitations for studying plaque morphology [73]. The
degree of stenosis can be adequately assessed using this technique [73-75] but the
evaluation of plaque surface ulceration is subject to a high degree of inter-observer

31
variability [73,76]. The images obtained using this modality reflect the absorption of x-
rays by the contrast material in the bloodstream; they show the normal and residual
arterial lumens, but do not provide information on the composition of the plaque.
Angiography has low discriminatory power to identify the vulnerable plaque, but does
provide abundant information on the local arterial tree and can serve as guide for
therapy [77]. Computed tomography (CT) angiography uses computed tomography
techniques also in combination with x-rays to obtain images of the carotid arteries.
Contrast material is injected into a vein and a three dimensional picture is assembled
using projection x-ray data provided by a rotating x-ray source/detector gantry. CT
angiography shares most of the disadvantages of conventional angiography.
Magnetic resonance imaging (MRI) with or without contrast agents can also be used to
evaluate the carotid arteries and plaque [17,78]. MRI can provide image contrast
corresponding to plaque composition (e.g. identify and evaluate a fibrous cap, a
necrotic core or lipid pool) and does not involve the use of ionizing radiation. MRI can
also be used to study intra-plaque haemorrhage [17,56,78-79] and evaluate wall stress
which has been shown to be higher in symptomatic patients compared with the
asymptomatic [80]. Hatsukami et al. collected MRI data, using a 3-dimensional
multiple, overlapping, thin-slab angiography protocol, from 22 patients who were
scheduled for carotid endarterectomy, and compared the MRI appearance of the
fibrous cap with histological findings [81]. Their results indicated that this MRI
angiography protocol was capable of distinguishing intact, thick fibrous caps from the
intact and thin, and from disrupted fibrous caps, in vivo. Watanabe et al. investigated
whether MRI of the carotid arteries can differentiate high-risk soft plaques from solid
fibrous plaques more accurately than using ultrasound and found that the sensitivity,
specificity, and accuracy for diagnosing high-risk soft plaques were 96, 93 and 94%,
respectively for MRI and 75, 63, and 69% for ultrasound [18]. However, the ultrasound
assessment in that study was based on a subjective, visual classification system [82].
The disadvantages of MRI based techniques include the high-cost of magnetic
resonance imaging and susceptibility to image artefacts. Three dimensional (3D) MRI
imaging can improve the characterisation/visualisation of small structures, but
sensitivity to motion artifacts is higher with 3D MRI [83].

32
Angioscopy is also a relevant imaging technology, and involves the direct imaging of
the arterial lumen using a miniaturized high resolution camera introduced invasively
into the lumen of the blood vessel. The technique is, however, difficult to perform and
is limited in terms of applicability [77]. Tissues are significantly opaque to light and
angioscopy can only be used to image the internal surfaces of the arterial lumen. Also,
since the arterial lumen is blood-filled, other difficulties with the imaging technique
arise. Angioscopy can be used to image plaque surfaces and intra-luminal structures
like thrombi and tears [77]. Thermography is another catheter based technique
involving the formation of images based on local tissue temperatures. It can be used
to investigate temperature variations associated with inflammatory processes.
Temperature heterogeneity is assessed as an indicator of the metabolic state of the
plaque; a coincidence of temperature rises and localisation of vulnerable plaque
features is suggested [77]. Optical coherence tomography (OCT) can produce images of
very high resolution (10-30 um) but is an intravascular/ex vivo imaging technique and
the penetration depth is very low (typically 1 to 2 mm) corresponding to the use of
near-infrared light sources [84-86]. Several studies have found that OCT images can be
highly sensitive for characterizing atherosclerotic plaques [85-86]. Near-infrared
spectroscopy (NIRS) is another optical technique which may help identify the lipid
content of plaques [77]. Raman spectroscopy can be used to quantify the molecular
composition of the plaque, but acquisition times are long with a low penetration depth
due to the absorption of light by blood.
Atherosclerotic plaque inflammation can also be studied by the use of radioisotopes,
for example, plaque inflammation estimated as the maximum standardized uptake
values (SUV) of fluorine-18 radioisotope labelled fluorodeoxyglucose (FDG) using
positron emission tomography (PET) [87]. Tawakol et al. found that intensive statin
therapy produces significant and rapid, dose-dependent reductions in FDG uptake that
may represent changes in atherosclerotic plaque inflammation, concluding that FDG-
PET imaging may be useful for detecting early treatment response [88].
Duplex ultrasonography is also extensively used to assess the carotid arteries and the
carotid plaque. Like MRI, ultrasonography does not involve the use of ionizing
radiation, but, unlike MRI, it is significantly more convenient, costs significantly less

33
and is more widely available. A wealth of information can be obtained on the carotid
arteries and the carotid plaque using duplex ultrasonography (section 1.9) and this
thesis is concerned with the identification of vulnerable plaque features using this
technique. Other ultrasound-based methods are also available and include
intravascular ultrasound (IVUS), an invasive technique involving the introduction of a
catheter incorporating an ultrasound transducer into the artery. IVUS allows images of
higher resolution to be obtained providing insight into the composition of plaques, and
with the use of contrast agents, it can identify surface defects such as ulcerations, the
vasa vasorum and neovascularisation. IVUS can also be used to study the mechanical
properties of the arterial wall and the plaque by means of an elastography technique
termed IVUS elastography. This involves estimating the plaque and vessel wall strain
using the depth-gated cross-correlation of radiofrequency IVUS data obtained at
varying intraluminal pressures [89-91].
Intravascular palpography is a very similar technique but limits the strain assessment
to the surface of the plaque (the first 450 µm layer). This has been reported to be
faster, more robust, and easier to interpret than IVUS elastography [90-92]. It can
differentiate between deformable and non-deformable tissues, which may enable the
detection of vulnerable plaques [77]. Non-invasive assessment of intra-plaque strains
in the longitudinal cross-section using radiofrequency ultrasound data and block
matching/cross-correlation methods are also active areas of research [93-94]. Acoustic
Radiation Force Impulse (ARFI) imaging is another non-invasive ultrasound technique
that can characterize the mechanical properties of tissues in terms of tissue strain,
potentially differentiating soft and hard plaques [95]. Shearwave elastography, on the
other hand, allows the stiffness of tissues in terms of the elastic modulus to be
measured. Colour maps indicating local tissue stiffness can be overlaid on top of
greyscale ultrasound images, allowing the visualization and measurement of the
stiffness distribution in tissue. This technique has already been found to be useful in
breast and liver sonography; applicability to vascular ultrasound is under investigation
[96]. Earlier forms of elastography were based on the application of a force by the
operator (e.g. pushing down on the probe) and measuring of the resulting
deformation. In sonoelastography, an externally applied low-frequency vibration was
used to generate tissue stress. Tissue Doppler Imaging (TDI) is another, non-invasive

34
ultrasound technique that may be used to study the carotid arteries and the plaque.
TDI has been used to investigate the motion of the arterial wall in healthy individuals
and patients with atherosclerotic plaques [97].
Intravascular photoacoustic imaging (IVPA) is a new technique that complements IVUS,
and has been shown to provide image contrast corresponding to lipid, calcium,
macrophage1, and matrix metalloproteinase
2 composition of plaques [98-100]. The
method is based on the detection3 of acoustic waves generated within tissue due to
thermal expansion as a result of irradiation with a pulsed laser [101-103]. Studies have
employed IVUS/IVPA imaging catheters consisting of a single-element ultrasound
transducers and a light delivery systems based on a single optical fibres in animal
models and ex vivo samples of atherosclerotic human aortas and coronary arteries,
finding good agreement with histology [99-100,102,104-110]. Another study introduced
thermal IVPA, and found that this technique was capable of differentiating between
lipid component of plaques and lipid in periadventitial tissues in an ex vivo
investigation of the atherosclerotic rabbit aorta [111]. The method exploited the
temperature dependency of the photoacoustic signal amplitude and differentiated
between the two lipid components by comparing photoacoustic signals measured at
different temperatures.
Transcranial Doppler (TCD) can be used to monitor emboli entering cerebral circulation;
it is widely used during surgery. Barbut et al. found embolic particle diameters ranging
from 0.3 to 2.9 mm (mean 0.8 mm) in the aorta during coronary artery bypass grafting
[112]. Twenty-eight percent of particles measured 1 mm or more, 44% measured 0.6 to
1.0 mm, 27% measured 0.6 mm or less in diameter [112]. A variable fraction of these
emboli (3.9 to 18.1%) was found to subsequently enter cerebral circulation via the
middle cerebral artery [112]. Topakian et al. found a significant association between
embolic signals in the middle cerebral artery and an increased risk of ipsilateral stroke
during their 2 year follow-up study of 435 patients with asymptomatic carotid artery
1 Using contrast agents.
2 Using contrast agents.
3 Spectral analysis is performed in the case of spectroscopic intravascular photoacoustic imaging.
35
stenosis greater than or equal to 70% [113]. In order to characterise plaque
composition using ultrasound, some studies have used radiofrequency ultrasound data
to calculate parameters such as the integrated backscatter, attenuation
coefficient/slope and scatterer size [114-119]. Three-dimensional ultrasound systems
are also becoming more widely available with some new display technologies, such as
fly-through ultrasound, displaying intraluminal structure in a manner similar to
endoscopy [120].
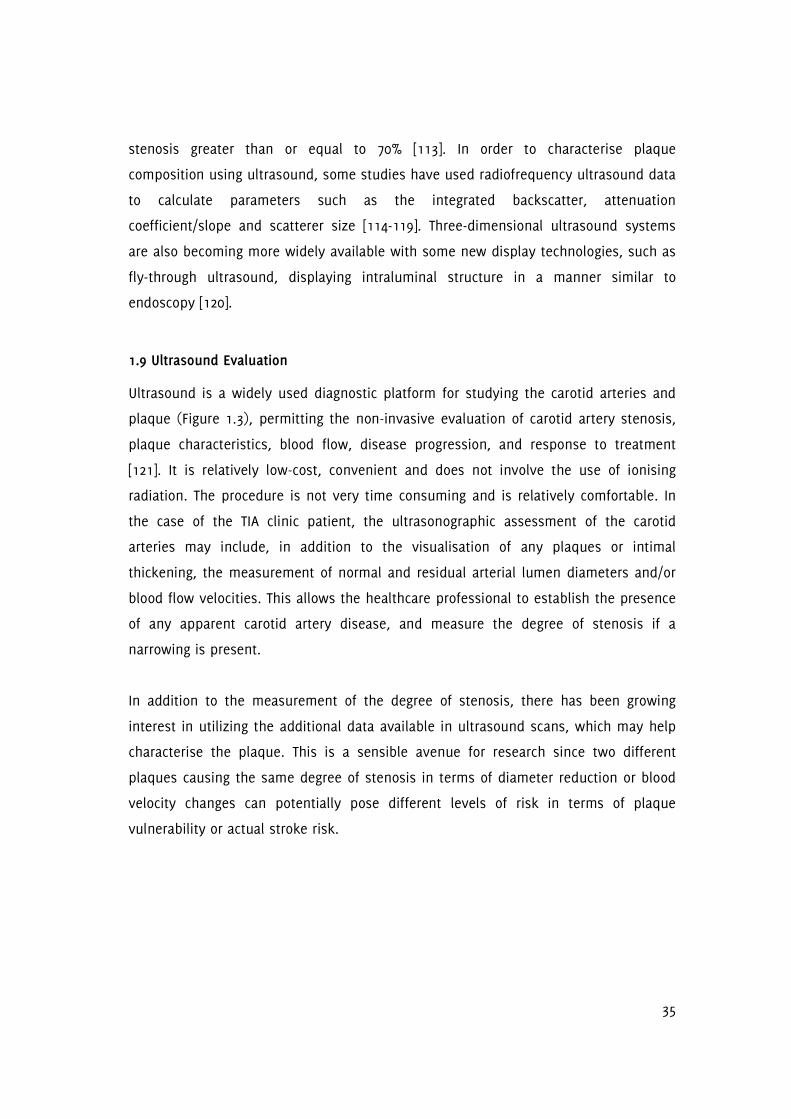
1.9 Ultrasound Evaluation
Ultrasound is a widely used diagnostic platform for studying the carotid arteries and
plaque (Figure 1.3), permitting the non-invasive evaluation of carotid artery stenosis,
plaque characteristics, blood flow, disease progression, and response to treatment
[121]. It is relatively low-cost, convenient and does not involve the use of ionising
radiation. The procedure is not very time consuming and is relatively comfortable. In
the case of the TIA clinic patient, the ultrasonographic assessment of the carotid
arteries may include, in addition to the visualisation of any plaques or intimal
thickening, the measurement of normal and residual arterial lumen diameters and/or
blood flow velocities. This allows the healthcare professional to establish the presence
of any apparent carotid artery disease, and measure the degree of stenosis if a
narrowing is present.
In addition to the measurement of the degree of stenosis, there has been growing
interest in utilizing the additional data available in ultrasound scans, which may help
characterise the plaque. This is a sensible avenue for research since two different
plaques causing the same degree of stenosis in terms of diameter reduction or blood
velocity changes can potentially pose different levels of risk in terms of plaque
vulnerability or actual stroke risk.

36
Figure 1.3 - B-Mode ultrasound image of a carotid artery with plaque (arrow) in
transverse cross-section.
Several properties of carotid plaques related to plaque appearance and dynamic
behaviour have been studied; there is considerable evidence that ultrasound may be
able to detect specific carotid plaque characteristics that relate to vulnerability [122].
Gomez [73], for example, reported that individuals who appear to be at a higher risk of
stroke are those with heterogeneous plaques, particularly if the plaque narrows the
arterial lumen diameter by more than 70% to 75%. Geroulakos et al. [123], on the other
hand, provided a review of the evidence supporting the hypothesis that carotid plaque
surface characteristics and internal structure as seen on ultrasound may be
independent predictors of the risk of stroke, and concluded that ultrasonographic
plaque morphology should be used together with other local risk factors in prospective
studies which aim to identify the subgroup of patients at high risk of stroke.
In early studies, plaques were simply and subjectively classified as having a
heterogeneous or homogeneous ultrasonographic appearance and as being
echolucent/hypo-echoic or echogenic/hyper-echoic. One study, for example,
categorised plaques into four groups (Table 1.1) based on the qualitative assessment
of sonographic appearance [124]. In fact, many qualitative and quantitative parameters
characterising the carotid plaque may be obtained using ultrasonography; these are
discussed in the sections that follow.

37
Table 1.1 - The four plaque categories described by Gray-Weale et al.
Type Description
1 Predominantly echolucent plaques with a thin echogenic cap.
2 Substantially echolucent lesions with small areas of echogenicity.
3 Dominantly echogenic lesions with small areas of echolucency.
4 Uniformly echogenic lesions, equivalent to homogeneous.
1.9.1 Plaque Morphology and Texture
Texture and morphology refer to the sonographic appearance of carotid plaques. This
appearance depends on the shape and size, and composition of plaques, and their
interaction with the ultrasound beam. Lipids, for example, are relatively weakly
scattering and tend to have a darker texture, while calcium rich structures are strongly
attenuating with a large acoustic impedance compared to most other structures, giving
rise to a bright texture pattern, typically with ultrasonic shadowing. It is, therefore,
plausible that parameters obtained from the ultrasonographic appearance of plaques
may be useful surrogate markers of the actual plaque morphology and composition
and are widely investigated.
Lal et al., for example, performed pixel distribution analysis of the B-Mode ultrasound
carotid plaque image by means of determining the echogenicity of specific tissues
(e.g. blood, lipids, calcium, and fibro-muscular tissues) in control subjects and using
these to quantify tissue types in the ultrasound images of carotid plaques [125-126]. In
the control subjects, the following anatomical areas were examined: subcutaneous fat
(abdomen), muscle (biceps), fibrous tissue (iliotibial tract), and calcium rich structures
(tibia and skull). The plaques were further characterised using histology following
carotid endarterectomy. The results of the pixel distribution analysis for blood, lipids,
fibro-muscular tissues and calcium correlated significantly with the histological
findings [125]. Furthermore, a significantly higher amount of blood (intra-plaque
haemorrhage) and lipids were found in symptomatic plaques compared with the

38
asymptomatic [125-126]. In contrast, larger amounts of calcification were found within
asymptomatic plaques. In symptomatic plaques, lipid cores were found to be larger
and closer to the boundary between the plaque and the arterial lumen [126]. Plaque
morphology can affect blood flow patterns, which may also have a bearing on the risk
of stroke and other cerebrovascular events [127]. Thrombus formation, for example,
may be accelerated in regions of slow or recirculating flow, high shear and increased
turbulence [127].
Some investigators used more abstract methods to characterize the ultrasound
appearance of carotid artery plaques. Tsiparas et al., for example, used three multi-
scale transforms with directional character to characterise atherosclerotic plaques from
their B-Mode ultrasonographic appearance (20 plaques of which 11 were
symptomatic); they attempted to discriminate between the plaques that caused
symptoms and those that did not [128]. The transforms used were the dual-tree
complex wavelet transform, the finite ridgelet transform and the fast discrete curvelet
transform. They took the standard deviation and entropy of the transform sub-images
as texture features, and used a support vector machine trained using the bootstrap
technique to classify the samples. The authors found that the curvelet transform
achieved the best classification performance, which was 84.9% for images
corresponding to peak systole and 73.6% for images corresponding to end diastole.
The different classification performances obtained for the different phases of the
cardiac cycle were attributed to the possibility of variations in the allocation of
materials within the plaque throughout the cardiac cycle, thus reflecting in the texture
analysis. However, it is more likely, as will be shown in Chapter 3, that this may be
due to out-of-plane plaque, patient or probe motion, which change the actual two-
dimensional plaque cross-section being imaged. The main drawbacks of this study
were the limited sample size and its abstract nature.
1.9.1.1 Plaque Echogenicity and Heterogeneity
Several studies have found that echolucent plaques, irrespective of the degree of
stenosis, may be associated with the presence of cerebrovascular symptoms [61,129-
131], an increased risk of stroke [113,132-136], and the presence of ipsilateral

39
hemispheric brain infarcts [137]. Similar increases in the risk of stroke and
perioperative embolic complications in carotid artery stenting have also been reported
[138-139]. Græbe et al. found a negative correlation between plaque echogenicity and 18
F-FDG uptake, indicating that echolucent plaques may be more likely to have
inflammation; the latter is thought to relate to plaque vulnerability and cap rupture
[87]. A study by Biasi et al. found that computerised analysis of plaque echogenicity
was better than the degree of stenosis in indentifying plaques associated with brain
infarcts [140]. Recently, Salem et al. reported that plaque echolucency had a
relationship to recurrent cerebrovascular events in patients scheduled to have carotid
endarterectomy, before surgery took place [51]. The echolucent carotid plaque has also
been found to be an independent predictor of acute coronary syndromes (ACS),
suggesting that ultrasound examination of carotid arteries may be helpful for
screening populations at high risk of ACS [141].
Holdsworth et al. studied the relationship between carotid plaque heterogeneity and
the degree of stenosis and found that at less than 20% stenosis only 4.4% of plaques
were heterogeneous while at 80-90% stenosis 84.5% of the plaques were
heterogeneous [142]. AbuRahma et al. also compared carotid plaque heterogeneity
with the severity of stenosis and found that the higher the degree of stenosis, the
more likely it was to be associated with heterogeneous plaques and symptoms [143].
They also found that plaque heterogeneity was more positively correlated with
symptoms than with the degree of stenosis, and pointed out that it may be necessary
to consider the plaque heterogeneity during the selection of patients for carotid
endarterectomy [143]. In contrast, El-Barghouty et al. reported that symptomatic
carotid plaques and plaques associated with cerebral infarctions were less
heterogeneous than asymptomatic plaques and plaques not associated with cerebral
infarctions [133]. Tegos et al. also found that homogeneous echo-patterns were more
prevalent among plaques that were associated with symptoms, compared to
asymptomatic plaques [131]. Topakian et al. found a significant association between
echolucent plaques and an increased risk of ipsilateral stroke during a 2 year follow-
up of patients with asymptomatic carotid artery stenosis.

40
There appears to be a general consensus that plaque echolucency increases the risk of
stroke and other cerebrovascular events, which is broadly in agreement with the
expectation that soft plaques (e.g. lipid rich, necrotic or haemorrhagic) may be more
vulnerable than hard plaques (calcified or fibrous) [131,133]. It has been reported that
fibrous (hard) plaques can sometimes have an echolucent presentation [18], although
pathology studies have found fibrous content, in general, to be significantly greater for
echogenic plaques compared with the echolucent ones [144-145].
In contrast with plaque echolucency, some studies found the presence of
cerebrovascular symptoms to be associated with heterogeneous plaques, while other
studies found associations with homogeneous plaques [131,133,143]. These discrepant
results may be partly due to the different methods of homogeneity assessment used.
AbuRahma et al., for example, used a qualitative assessment scheme in which plaques
displaying a mixture of hypoechoic, isoechoic, and hyperechoic regions were
categorised as being heterogeneous, while plaques having only one of these qualities
were defined to be homogeneous [143]. El-Barghouty et al., on the other hand,
evaluated plaque heterogeneity as the difference between the greyscale medians
(section 1.9.1.1.1) of the most echogenic and most echolucent regions of plaques,
expressed as a heterogeneity index [133].
1.9.1.1.1 The Greyscale Median (GSM)
One of the simplest parameters that can be used to quantify the ultrasonographic
appearance of carotid plaques is the first-order statistic greyscale median (GSM), the
median greyscale intensity of the pixels making up the plaque ultrasound image1. The
greyscale median has been found to be a potential indicator of carotid plaque
vulnerability with several studies finding associations between plaque GSM and plaque
inflammation [87], the presence of ipsilateral brain infarcts [129,132-133,137], the
presence of cerebrovascular symptoms [146], and an increased risk of stroke during
and after carotid artery stenting (CAS) [138]. A brief review of the literature that has
been published up to date on plaque GSM/echogenicity is presented in this section.
1 At 8-bit resolution, greyscale intensity has 2
8 or 256 levels ranging between 0 (the least echogenic) and
255 (the most echogenic).

41
In one of the earlier studies looking at the echogenicity of carotid plaques, Geroulakos
et al. classified 105 carotid artery plaques causing greater than 70% stenosis in the
internal carotid artery into four types: echolucent plaques, predominantly echolucent
plaques, predominantly echogenic plaques and echogenic plaques and carried out a
comparison against brain CT findings [130]. Their results showed an increased
incidence of ipsilateral brain infarcts in echolucent plaques (37%) compared with 18%
in the other 3 plaque types combined (p less than 0.02). Subsequent to this, Iannuzzi
et al. carried out a retrospective analysis of ultrasonographic plaque data from 242
stroke and 336 transient ischaemic attack (TIA) patients and found an association
between hypo-echoic carotid plaques (odds ratio=3.0, p=0.005) and ipsilateral brain
involvement in TIA patients [61]. El-Barghouty et al. also found a similar relationship:
they found that in 87 patients with 148 plaques producing more than 50% internal
carotid artery stenosis, who had CT brain scans to establish the presence of any
ipsilateral cerebral infarction, plaques with a GSM more than 32 were associated with
an incidence of 11% (7/64) CT infarction, while GSM below or equal to 32 were
associated with 55% (46/84) incidence of CT infarction (p less than 0.001, relative risk =
22) [132-133]. These results suggested that the assessment of plaque GSM may help
identify high-risk lesions, namely lesions associated with ipsilateral brain infarcts. A
follow-up study confirming the association between plaque GSM and cerebral
infarctions was published a year later; this study involved 190 patients with 329
carotid plaques, in which 161 plaques were from asymptomatic sides and 168 were
symptomatic [133].
The earlier studies highlighted an important problem with the measurement of GSM.
This was the variability of individual GSM measurements when compared between
studies. It was suggested that this was likely to be due to the non-standardized
acquisition settings used in different studies. It was possible to change the gain
settings on ultrasound equipment, resulting in brighter or darker ultrasound images.
Other scanner settings such as the greyscale transfer curve and dynamic range were
also likely to have marked effects. In order to reduce this variability, Elatrozy et al.
attempted to standardise the ultrasonic images of carotid plaques by means of

42
specifying certain acquisition settings to be used for carotid artery scanning and
normalizing the resultant images [129,147-148]. These settings were:
(1) Maximum dynamic range;
(2) 7-MHz/10-MHz linear array probes;
(3) Gain setting not to be set too high so that the structural details of the media-
adventitia interface are concealed by introducing noise in the vessel lumen and not to
be set too low so that the intima-media interface could not be easily identified. This
also ensured the availability of two reference structures for image normalization: a
noiseless vessel lumen and an echo-dense area of adventitia in the vicinity of the
plaque;
(4) Time gain compensation curve gently sloping, but vertical through the lumen of the
vessel. This ensured similar average greyscale levels of the tissues lying superficial
and deep in relation to the carotid artery, and areas of anterior and posterior wall
adventitia with nearly identical gray scale levels. The latter is essential for
normalization of carotid plaque images with anterior and posterior components.
(5) A linear post-processing or greyscale transfer curve1.
Normalization was performed by linearly scaling the resultant images so that the GSM
of an operator selected blood region fell in the range 0 to 5 and that of the brightest
part of the adventitia on the same side as the plaque fell in the range 185 to 195 [148].
A consensus report had suggested the use the mastoid muscle and cervical vertebrae,
in addition to blood, as reference structures but the use of blood and adventitia as
reference structures has the benefit that these can normally be selected close to the
plaque and are easier to include in the same ultrasound cross-section as the plaque
[137,149]. Other studies assessed the echogenicity of plaques using qualitative
classification schemes taking blood in the vessel lumen and the far wall of the artery
1 This controls the assignment of greyscale values for image formation.
The text in this section has been removed from the electronic version of this thesis
due to copyright restrictions. Please refer to the appropriate reference(s) or the full
thesis available at the University of Leicester Library.

43
as reference structures [136,150-151], sometimes using the intima-media complex of
the far wall of the artery as a single reference [152].
The results of the study by Elatrozy et al. showed that, upon standardisation, the
coefficient of variation among 4 different observers was 4.7% for the plaque GSM [129].
The GSM of symptomatic plaques was lower (21±14.8) than asymptomatic plaques
(38±26). They found that the GSM and the percentage echolucent pixels (PEP) were the
most significant variables (p=0.001) that were related to the presence or absence of
ipsilateral hemispheric symptoms [129].
The study by Polak et al. was not quantitative but investigated the association
between incident first stroke and echogenicity of plaques by following a cohort of over
4,000 individuals, who were 65 years of age or older and without symptoms, for an
average of 3.3 years [135]. Their results showed that in asymptomatic patients aged 65
years or older, the risk of incident stroke was associated with two ultrasound findings:
hypo-echoic carotid artery plaques and a degree of carotid artery stenosis greater than
or equal to 50%. In a cohort of 96 patients with carotid stenosis in the range 50-99%
(41 symptomatic, 55 asymptomatic), Biasi et al. quantitatively evaluated plaque
echogenicity using the GSM [140]. They found that the GSM was better than the degree
of stenosis in identifying plaques associated with an increased incidence of CT scan
determined brain infarction. The incidence of ipsilateral brain infarctions was 20%
when the degree of stenosis was less than 70%, and 25% when the degree of stenosis
was greater than 70%. On the other hand, the incidence of ipsilateral brain infarctions
was 40% for GSM less than 50 compared with 9% for GSM greater than 50 (p less than
0.001).
Using image normalisation, Sabetai et al. assessed the reproducibility of GSM
measurements in 232 asymptomatic carotid plaques (stenosis range 60% to 99%) and
correlated their results with the presence of ipsilateral CT-demonstrated brain infarcts.
The normalized GSM of plaques associated with ipsilateral, silent, CT-demonstrated
brain infarcts was 14, while that of plaques that were not so associated was 30 (p =
0.003). The authors found that the normalization technique used increased the
reproducibility of the GSM measurements across different recoding media (e.g. VHS

44
tape or hard-copy) and (linear) scanner probes used (p<0.001). When Grønholdt et al.
tested the hypothesis that stroke development can be predicted by the echolucency of
carotid plaques, they found that echolucent plaques causing a degree of stenosis 50%
or more, determined using Doppler ultrasound, were associated with risk of future
strokes in symptomatic but not asymptomatic patients [134]. In symptomatic patients,
the relative risk of ipsilateral ischaemic stroke for echolucent plaques compared to
echogenic plaques was 3.1 (95% confidence interval, 1.3 to 7.3). On the other hand, for
80-99% stenosis compared to 50-79% stenosis, the relative risk was only 1.4 (95%
confidence interval, 0.7 to 3.0).
In a cross-sectional study involving 127 symptomatic and asymptomatic plaques, Tegos
et al. found that the symptomatic status was associated with plaques of low GSM
(10.5) and predominant homogeneous echo-pattern, while asymptomatic plaques had
high GSM (28) and a less predominant homogeneous echo-pattern (p=0.001 for GSM
and 0.003 for homogeneity) [131]. Ruiz-Ares et al. also found that symptomatic plaques
had lower GSM than asymptomatic plaques, although they found different mean
values for the two groups (20.0 versus 29.0, p=0.002) [146]. Christodoulou et al.
collected a total of 230 plaque images which were classified into two types:
symptomatic because of ipsilateral hemispheric symptoms, and asymptomatic in the
absence of ipsilateral hemispheric events [153]. They extracted ten different texture
feature sets and shape parameters (a total of 61 features including the GSM) from
manually segmented plaque images and found a high degree of overlap between the
symptomatic and asymptomatic groups, making the separation of the two groups
difficult. The authors used the extracted feature sets as input for a modular neural
network composed of self organising map (SOM) classifiers, achieving an average
diagnostic yield of 73.1%. In a study of 418 cases of carotid artery stenting (CAS) from
11 international centres, Biasi et al. found that carotid plaque echolucency (defined in
the study as a GSM of 25 or less) increased the risk of stroke during and after CAS
[138]. They recommended that, in addition to measures such as the degree of stenosis,
plaque GSM should also be taken into account in the planning of endovascular
treatments.

45
Golemati et al. measured GSM at peak systole and at end diastole in 10 symptomatic
and 9 asymptomatic plaques and reported that the GSM did not vary significantly
between these two phases of the cardiac cycle [154]. They concluded that an image
corresponding to any phase of the cardiac cycle may be used to estimate plaque
echogenicity. The authors did, however, point out the need for further experiments to
support this finding: they suggested that very compliant plaques may change shape
during the cardiac cycle and a change in their echogenicity may be observed. However,
a limitation of this study was that it had a very small number of plaque samples.
Golemati et al. also did not find a statistically significant difference in the various
echogenicity descriptors they studied, including the GSM, between symptomatic and
asymptomatic plaques, in the small group (19 symptomatic and asymptomatic
plaques) they investigated [154]. Lind et al. related the GSM of the intima-media
complex of the common carotid artery to the echogenicity of the carotid plaque in 582
subjects and found that GSM of intima-media complex had a correlation to the plaque
GSM (r=0.60, p<0.0001) independent of plaque size and the intima-media thickness
[155]. GSM of the intima-media complex was also found to correlate significantly with
the visually estimated echogenicity of the plaque [155].
In a study looking at plaque inflammation, Græbe et al. compared plaque GSM in 33
patients with plaque inflammation estimated as the maximum standardized uptake
values (SUV) of fluorine-18 radioisotope labelled fluorodeoxyglucose (FDG) using PET
[87]. A negative correlation between the plaque GSM and the FDG SUV (r=-0.56, p<0.01)
was found. Echo-rich plaques had little inflammation, while echolucent plaques
exhibited a wide range of inflammatory activity from low to high [87]. It was also
reported that while the FDG SUV differentiated asymptomatic plaques from the
symptomatic, the GSM values did not. The authors suggested that 18
FDG PET may be
useful as a tool for stratifying echolucent plaques, in terms of inflammatory activity,
into an active category and an inactive category with the former indicating a
potentially more vulnerable group of plaques.
Finally, and more recently, Salem et al. carried out an investigation to determine
whether the computerised analysis of ultrasound plaque data could identify features
predictive of an increased risk of early recurrent events in symptomatic patients

46
scheduled to undergo carotid endarterectomy [51]. The plaques harvested during
surgery were independently scored for markers of histological plaque instability. It was
found that a low plaque GSM (odds ratio 6.21, p=0.003) was independently associated
with recurrent cerebrovascular events before surgery. Patients with recurrent
cerebrovascular events were the patients (n=20) who suffered a further ischaemic
event following admission to hospital and before actually undergoing carotid
endarterectomy.
A summary survey of the literature on plaque echogenicity/GSM is provided in Table
1.2. It can be seen that, with the exception of Golemati et al. [154], who measured GSM
at systole and diastole, previous studies primarily looked at plaque echogenicity on
single frames of ultrasonographic images, which were typically selected at random
points during the cardiac cycle. In fact, it appears that most studies simply used the
best looking image, determined in a subjective manner, for plaque echogenicity/GSM
assessment. In Chapter 2, the foundations for computationally delineating arterial wall
boundaries in ultrasound image sequences is laid, which is subsequently extended to
a method of tracking plaque boundaries in Chapter 3. In the latter chapter, the
variations in plaque GSM that may be observed on a frame-by-frame basis throughout
ultrasound image sequences are investigated and highlighted.

47
Table 1.2 - A summary survey of the literature related to ultrasonographic plaque echogenicity/GSM assessment. Normalisation
indicates whether image normalisation was performed. 'Type of analysis: Qualitative' denotes that a qualitative assessment was
carried out, while 'Type of Analysis: Static' denotes that a quantitative analysis was performed on a single frames of ultrasonographic
images. 'Post P/C: Nsp' denotes that the post-processing/greyscale transfer curve used on the ultrasound equipment was not
specified, while 'Post P/C: Lin' indicates that the post-processing curve used on the ultrasound equipment was linear.
Investigators Year Post P/C Type of
analysis
Normalisation Findings
Geroulakos et al. [130] 1994 Nsp
Qualitative None • An association between echolucent plaques
and ipsilateral hemispheric brain infarcts.
European Carotid Plaque
Study Group [53]
1995 Nsp Qualitative None • Plaque echogenicity inversely related to soft
tissue content.
El-Barghouty et al. [132] 1995 Nsp Static None • Low GSM associated with a higher incidence of
ipsilateral brain infarction.
Iannuzzi et al. [61] 1995 Nsp Qualitative None • An association between hypo-echoic plaques
and ipsilateral brain involvement in TIA
patients.
El-Barghouty et al. [133] 1996 Nsp Static None • Cerebral infarction more common in
echolucent than echogenic plaques.
Droste et al. [156] 1997 Nsp Qualitative None • Correlation between the plaque echogenicity

48
Investigators Year Post P/C Type of
analysis
Normalisation Findings
and the histological assessment of plaque
composition not significant.
Grønholdt et al. [157] 1998 Nsp Qualitative None • An association between the histological
composition of carotid artery plaques and
plaque echogenicity.
Polak et al. [135] 1998 Nsp Qualitative None • Hypo-echoic plaques associated with an
increased risk of incident stroke.
Elatrozy et al. [148] 1998 Lin Static Linear • GSM of plaques with ipsilateral hemispheric
symptoms lower than for asymptomatic
plaques.
Elatrozy et al. [129] 1998 Lin Static Linear • GSM found to be a significant variable that
relates to the presence of ipsilateral
hemispheric symptoms.
Golledge et al. [158] 1998 Nsp Qualitative None • Echolucent plaques found to be more common
in symptomatic patients, compared with the
asymptomatic.
Biasi et al. [140] 1999 Nsp Static None • GSM found to be better than the degree of
stenosis in indentifying plaques associated

49
Investigators Year Post P/C Type of
analysis
Normalisation Findings
with ipsilateral brain infarctions.
Sabetai et al. [137] 2000 Lin Static Linear • GSM of plaques associated with ipsilateral,
asymptomatic brain infarcts lower than that of
plaques that were not so associated.
Mathiesen et al. [136] 2001 Nsp Qualitative
Subjective • Echolucent plaques found to be associated
with an increased risk of ischaemic events.
Grønholdt et al. [134] 2001 Nsp Static Linear • Echolucent plaques found to be associated
with risk of future strokes in symptomatic
patients.
Tegos et al. [131] 2001 Lin Static Linear • Symptomatic plaques found to be associated
with a lower GSM than asymptomatic plaques.
Liapis et al. [159] 2001 Nsp Qualitative None • Presence of echolucent plaques found to be
associated with a higher risk of stroke.
Lal et al. [125] 2002 Nsp Static Linear • Significant correlations between tissue
composition predicted by pixel distribution
analysis and determined by histological
assessment.
Christodoulou et al. 2003 Lin Static Linear • It may be possible to identify a subgroup of

50
Investigators Year Post P/C Type of
analysis
Normalisation Findings
[153] patients at a high risk of stroke based on
texture features.
Biasi et al. [138]
2004 Lin Static Linear • Plaque echolucency found to increase the risk
of stroke during and after carotid artery
stenting.
Golemati et al. [154] 2004 Lin Static at
systole and
diastole.
Histogram
equalization
• GSM may be used to characterise
atheromatous plaques of the carotid artery.
Grogan et al. [160] 2005 Lin Static Linear • Symptomatic plaques found to be more
echolucent and less calcified than
asymptomatic plaques.
Kalogeropoulos et al.
[161]
2006 Nsp Qualitative None • Echolucent plaques found to be more
prevalent among patients with TIA compared
with control subjects.
Lind et al. [155] 2007 Nsp Static Linear • GSM of the intima-media complex in the
common carotid artery had a significant
correlation to the plaque GSM.
Ding et al. [162] 2008 Nsp Qualitative None • Carotid plaques in acute stroke patients found

51
Investigators Year Post P/C Type of
analysis
Normalisation Findings
to be echolucent or predominantly echolucent.
Rosenkranz et al. [163] 2009 Nsp Static None • Patients who had TCD detected solid cerebral
microemboli intra-operatively had lower GSM
compared to patients who did not have
embolic events.
Graebe et al. [87] 2010 Lin Static Linear • A negative correlation found between plaque
GSM and 18
F-FDG uptake on positron emission
tomography.
Dósa et al. [164] 2010 Nsp Qualitative None • Presence of echolucent femoral artery plaques
found to be an independent predictor of
recurrent carotid artery stenosis after carotid
endarterectomy.
Staub et al. [165] 2011 Nsp Qualitative None • Plaque echogenicity found to be inversely
related to the degree of intra-plaque
neovascularisation.
Topakian et al. [113] 2011 Nsp Qualitative None • Plaque echolucency found to be associated
with an increased risk of ipsilateral stroke.
Salem et al. [51] 2012 Lin Static Linear • Low GSM found to be associated with recurrent
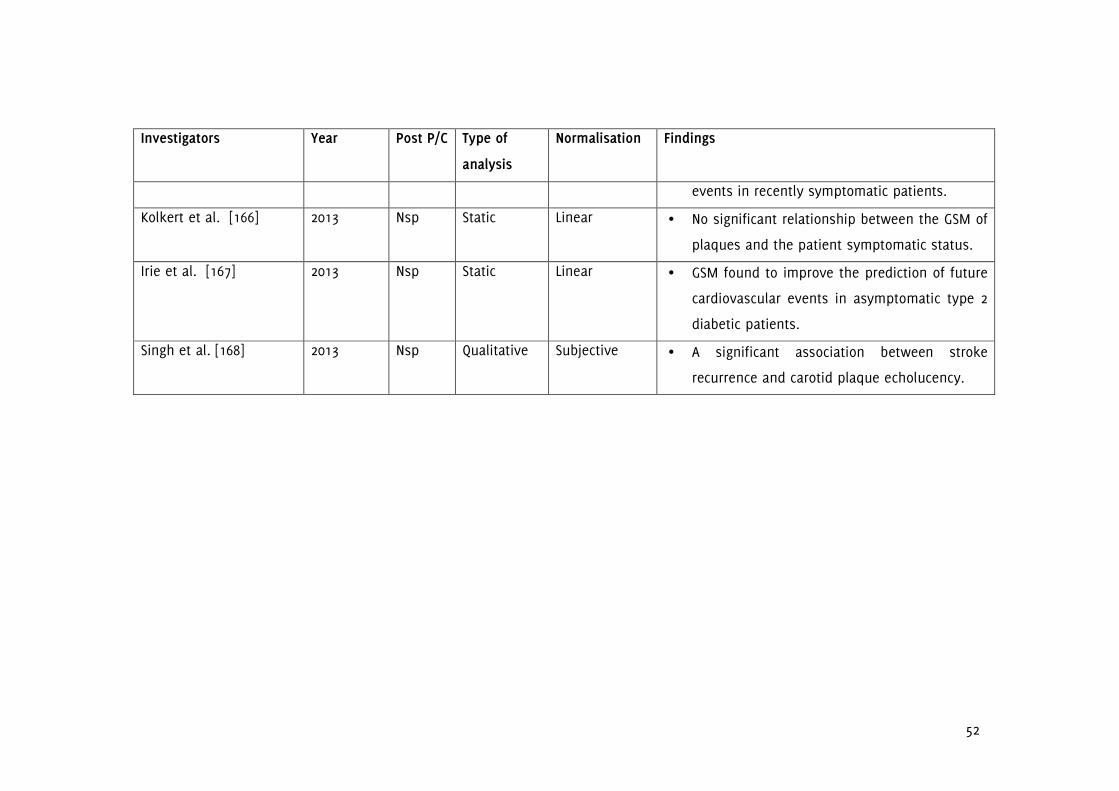
52
Investigators Year Post P/C Type of
analysis
Normalisation Findings
events in recently symptomatic patients.
Kolkert et al. [166] 2013 Nsp Static Linear • No significant relationship between the GSM of
plaques and the patient symptomatic status.
Irie et al. [167] 2013 Nsp Static Linear • GSM found to improve the prediction of future
cardiovascular events in asymptomatic type 2
diabetic patients.
Singh et al. [168] 2013 Nsp Qualitative Subjective • A significant association between stroke
recurrence and carotid plaque echolucency.

53
1.9.1.2 Plaque Surface Irregularities and Ulceration
Plaque surface irregularities observed on ultrasonographic assessment may be
indicative of plaque ulceration, since the latter can appear as excavations, cavities, or
caverns of the plaque surface [169]. This has potential applicability to the problem of
identifying vulnerable carotid plaques, since ulcerations increase the risk of stroke and
are associated with an increased risk of thrombus formation, intra-plaque
haemorrhage and downstream embolisation [73,170-173].
Previous studies have found significant relationships between plaque ulceration and
plaque surface irregularities, the presence of cerebrovascular symptoms, plaque
vulnerability, and the risk of stroke and other cerebrovascular events
[55,63,170,172,174-177]. Rothwell et al. found that patients with irregular plaques in the
symptomatic carotid artery were more likely to have irregular plaques also in the
contralateral carotid artery, suggesting that some individuals may have a systemic
predisposition to atherosclerotic plaque surface irregularities that is independent of
traditional risk factors [63]. AbuRahma et al. compared ultrasonic plaque morphology
in 135 patients who had carotid endarterectomy with pathological assessment of
surgical specimens and found that irregular plaques were more often associated with
intra-plaque haemorrhage and neurologic events [172]. Handa et al. carried out a
follow-up study of 214 patients from nine hospitals and found that patients with
ulcerated plaques had a sevenfold higher risk of stroke compared to patients with
non-ulcerated plaques [175]. They identified plaque ulceration according to a subjective
classification scheme depending on the presence of large, obvious excavations or
multiple cavities and/or cavernous appearances [169,175].
Fisher et al. characterized surgically removed carotid artery plaques from 241 patients
for ulceration and thrombus, and found that carotid plaque ulceration and thrombosis
were more prevalent in the symptomatic patients [170]. Prabhakaran et al. studied the
association between carotid plaque surface irregularity and the risk of ischaemic
stroke in a multiethnic population of 1,939 patients and found that the unadjusted
cumulative 5-year risks of ischaemic stroke were 1.3%, 3.0%, and 8.5% for no plaque,
regular plaques, and irregular plaques, respectively. Rosenkranz et al. found the

54
numbers of solid microembolic signals, detected by means of dual-frequency
transcranial Doppler ultrasound, per carotid artery stenting (CAS) procedure and per
hour of CAS procedure, were higher in patients with irregular plaques than those with
smooth plaques [178]. Molloy and Markus recorded embolic signals for 1 hour in the
middle cerebral arteries of 111 patients with greater than 60% carotid artery stenosis
and found more embolic signals in patients with plaque ulceration [3]. Their study also
found the presence of asymptomatic embolisation to be predictive of future ischaemic
events [3]. Sitzer et al. found strong associations between microemboli in the middle
cerebral artery monitored preoperatively and plaque ulceration characterised by
histology following carotid endarterectomy [171]. Pedro et al. found that plaque surface
disruption assessed qualitatively using ultrasound correlated with the presence of
symptoms [179]. Carra et al. followed 230 asymptomatic patients for a median duration
of 32 months and found that the presence of an irregular plaque surface correlated
with plaque progression and the development of neurological events [180]. Recently,
Kuk et al. found that carotid plaque ulcer volume assessed by three dimensional
ultrasound imaging was predictive of cardiovascular events and subjects with total
ulcer volume greater than or equal to 5 mm3 had a higher risk of developing stroke
and other vascular events during a five year follow-up period [173]. Ulcers were
defined as distinct discontinuities in the surfaces of atherosclerotic plaques with a
volume greater than or equal to 1 mm3 in that study [173].
Contrast-enhanced ultrasound can improve the visualisation of plaque surfaces,
particularly for hypo-echoic plaques, and may have better diagnostic accuracy for the
identification of plaque ulceration and intra-plaque haemorrhage [181]; however, it
requires the intravenous administration of a contrast agent.
It is interesting to point out that, although ulcerations can make the ultrasound image
of a given plaque irregular, not all of the irregularities of a plaque surface may be due
to ulcerations [182]. In other words, some plaques may have inherently irregular
surfaces, despite not being ulcerated. In the existing studies, measures of plaque
surface irregularities have been mostly qualitative; for example, subjectively classifying
plaques as smooth, irregular, ulcerated or not possible to evaluate [53]. Such
qualitative assessments lack objectivity, and can fail to differentiate small differences
55
in surface characteristics of plaques. It can be difficult to classify plaques as being
smooth or irregular, beyond the obvious cases. Bluth et al., for example,
retrospectively evaluated plaques from 50 patients, but did not find a significant
relationship between the qualitative sonographic assessment and the presence or
absence of pathologically determined intimal ulcerations [183]. Surface defects having
a depth and a length of greater than or equal to 1 or 2 mm with a well defined base,
and colour Doppler injection into the recess have also been used for classifying plaque
surface irregularities and ulceration [184]. A quantitative method for the dynamic
assessment of plaque surface irregularities will be developed in Chapter 4, which will
be shown to have a significant relationship to the presence of cerebrovascular
symptoms, and increase diagnostic performance when combined with the degree of
carotid artery stenosis.
1.9.1.3 Other Texture and Morphological Parameters
Other parameters based on plaque morphology and texture that have been
investigated include the percentage echolucent pixels, contrast, variance, entropy,
texture energy, juxta-luminal black areas, discrete white areas, and fractal dimension.
Studies have found evidence that these parameters may help differentiate the
symptomatic plaque from the asymptomatic and relate to the future risk of stroke
[179,185-187]. Other first- and second-order statistics and texture analysis methods
have also been used [54,153,188-190]. In relation to plaque morphology, Thornhill et al.
recently carried out a study to determine whether quantitative shape analysis can
differentiate free-floating intraluminal thrombus (filling defects resolving with
anticoagulant therapy) from atherosclerotic plaques; identifying five potential shape
descriptors for this purpose [191]. Stratified GSM analysis and the subsequent colour
mapping of the carotid plaque have also been carried out [192]. Plaques which have
large lipid or necrotic cores separated from the bloodstream by thin fibrous caps are
generally considered to be high-risk; these plaques typically appear predominantly
hypo-echoic or echolucent with thin, hyper-echoic surface boundary under ultrasound.
In order to identify such plaques, Lal et al. quantified plaque echogenicity on a per-
pixel basis taking into account the distance from each pixel to the plaque surface
[126]. They found that lipid cores were larger and closer to the arterial lumen in
56
plaques that had associated cerebrovascular symptoms (p<0.01). It would be
reasonable to expect that, for non-homogenous plaques, the configuration of the
various, individually homogenous sub-regions making up the plaque, may be
important in determining its behaviour and stability. This is certainly the case for the
classical model of the vulnerable plaque where a large soft core is contained within a
thin fibrous cap. In such a plaque, the rupture of the thin fibrous cap could result in
the release of the intra-plaque contents into the bloodstream [193]. This argument is
also applicable to any lipid-rich or necrotic region of the plaque, particularly if that
region is close to the surface of the plaque (i.e. juxta-luminal). Texture analysis is also
used in other areas of ultrasound imaging. Moon et al., for example, analyzed the
texture of 137 breast masses by means of log-decompressing the greyscale images and
using this to estimate the density of scatterers. They found that a computer-aided
diagnosis system based on the first- and second-order statistics could differentiate
between malignant and benign masses [194].
Other morphological parameters investigated in relation to plaque vulnerability include
the volume compression ratio (VCR), calculated as the percentage reduction in plaque
volume from diastole to systole measured using three dimensional ultrasonography
[195]. The VCR has been evaluated as a surrogate marker of the elasticity of carotid
artery plaques and was found to be related to the echogenicity of plaques, and
associated with the presence of ischaemic cerebrovascular events [195].
1.9.2 Evaluation of Plaque Motion
Motion of the arterial wall and the atherosclerotic plaque may contribute to plaque
destabilisation and relate to the risk of stroke and other cerebrovascular events [196-
198]. Several studies have investigated arterial wall and plaque motion from
ultrasound image sequences. In the 1990s, Chan described two approaches to track
the motion of carotid plaques, namely a 'discrete approach' and a 'continuous
approach' [199]. The discrete (modified feature-based) approach involved applying
(and using the average of) four 5x5 pixel2 texture masks, optimized for extracting spot
and edge features, to a number of points-of-interest selected by the operator and
finding the pixels in successive frames which had feature values most similar to those

57
of the selected points-of-interest. Each template was updated as the tracking of the
points proceeded in the image sequence. The continuous (optical flow-based)
approach involved tracking the plaque boundary in each frame of the image sequence.
A region of interest (ROI) was selected on the first image (the ROI needed to be big
enough to enclose the plaque in each image frame) and the boundary of the plaque
was detected from this using grey-level histogram thresholding. In order to verify that
the movement of plaque was not due to the movement of the transducer or patient
respiration, global movement estimation was also carried out. Analysis of two clinical
image sequences which had 25 frames each, separated by 1 second intervals,
demonstrated differential motion of plaques and the surrounding tissues [199].
However, the study did not establish the presence of any discrepant motion between
the plaque and the arterial wall. On the other hand, Iannuzzi et al. found an
association between the presence of longitudinal lesion motion (p=0.02,odds ratio=3.0)
qualitatively defined as an apparent distal shift of the plaque axis with ipsilateral brain
involvement in transient ischaemic attack patients [61].
Meairs and Hennerici carried out four-dimensional ultrasound assessment of plaque
surface deformation in 23 asymptomatic and 22 symptomatic patients with 50-90%
degree of stenosis [200]. They used an edge detection algorithm based on the
greyscale gradient to detect the plaque surface and a hierarchical motion estimation
algorithm to calculate the apparent velocity field. Plaque surface motion estimates
were obtained for 18 asymptomatic and 13 symptomatic patients out of the 45
patients examined. Results of motion estimation showed that asymptomatic plaques
had surface motion vectors of equal orientation and magnitude to those of the internal
carotid artery, whereas symptomatic plaques demonstrated evidence of motion
relative to that of the ICA [200]. There were no significant differences in maximum
surface velocities between symptomatic and asymptomatic plaques (maximum value
9.4 mm/s). However, maximum discrepant surface velocities (MDSV) in symptomatic
plaques was significantly higher than that in asymptomatic plaques (mean and s.d.
3.85±1.26 versus 0.58±0.42 mm/s). MDSV was defined as the maximum of the
differences between maximum and minimum plaque surface velocities calculated in
successive image volumes [200].
58
In a radiofrequency study, Bang et al. carried out an analysis of plaque motion in 11
patients by means of two-dimensional cross-correlation of radiofrequency data over a
grid spacing of 3 pixels horizontally and vertically [197]. Velocities were calculated
relative to the probe (upper image edge) and a reference region directly beneath the
plaque. Their study found peak velocities of the order of 5–12 mm/s, which agreed well
with the maximum plaque surface velocity of 9.4 mm/s reported by Meairs and
Hennerici [200]. Furthermore, spatial analysis demonstrated that different plaque
regions may exhibit different motion patterns which may cause internal stress, leading
to fissures and plaque disruption [197]. In a B-Mode study looking at arterial wall
motion, Golemati et al. showed the expected cyclical motion of the arterial wall in the
radial direction, including some axial movement [196]. The technique used was that of
region/speckle tracking/matching and the maximum displacement that could be
detected was 10 pixels from the initially estimated position in the radial or axial
direction. This was a preliminary study and any relationships to cerebrovascular
symptoms were not studied [196]. Seven image sequences were investigated, five of
which were from healthy subjects and two from patients with atheromatous plaque on
the posterior wall. In the latter case, measurements were made at the normal part of
the arterial wall [196].
Dahl et al. investigated 29 plaque motion parameters for intra-operator reproducibility,
by statistical analysis of data from 12 patients (six patients with a symptomatic carotid
stenosis and six asymptomatic patients) [201]. Their results showed that 7 parameters
reproduced well while the other parameters did not fit within the assumptions of their
statistical model. The parameters that reproduced well described tensional and
torsional motion, in addition to the velocity amplitude [201]. Stoitsis et al., on the
other hand, carried out motion analysis of plaque surfaces, similar to Meairs and
Hennerici but in two dimensions, using block matching/region tracking, with
parameters expressed as maximal surface velocity and maximal relative surface
velocity [185]. Their study showed that these two parameters were significantly lower
in asymptomatic plaques [185]. A total of 10 symptomatic and 9 asymptomatic
plaques were assessed. Akkus and Ramnarine used speckle tracking methods, with
the normalized correlation coefficient as the similarity measure, to quantify carotid
plaque surface movements, vessel wall motion and intra-plaque deformation in one

59
normal subject and four patients with atherosclerotic disease [202]. However, any
relationships to patient symptoms were not studied. Recently, Kashiwazaki et al.
found that the motion of intra-plaque contents, a motion they described as one that is
not synchronized with the heartbeat, increased the risk of recurrent ischaemic events
in a cohort of 115 symptomatic patients with carotid artery stenosis greater than 50%
[198].
The existing studies have two main limitations: either qualitative assessments were
used, or a small number of samples and/or a limited range of stenoses were
investigated. In Chapter 5 a quantitative assessment of arterial wall motion in the
stenotic carotid artery is carried out, while in Chapter 6, plaque motion is investigated.
In both chapters, the existing literature is extended to a broader range of stenoses and
any relationships with the greyscale plaque characteristics are assessed.
1.9.3 Plaque Risk Scores
Several studies have previously considered deriving a risk score for atherosclerotic
carotid artery disease by means of combining measures of stenosis severity with other
parameters characterising the plaque. Prati et al., for example, combined the degree of
stenosis with qualitative measures of surface irregularity, plaque echogenicity and
texture in the form of a Total Plaque Risk Score [174]. They found that, in 171 subjects
with at least one plaque at baseline, the risk score significantly increased the area
under the Receiver Operating Characteristic curve for the prediction of cerebrovascular
events versus the Framingham risk score alone (0.90 vs. 0.88, p=0.04). Pedro et al.
described an Activity Index comprising ultrasound measures of plaque surface
disruption (qualitative classification), echogenicity, heterogeneity and the presence of
juxta-luminal echolucent areas, in combination with stenosis severity, and found this
to be a parameter that positively correlated with patient symptoms [179]. Momjian-
Mayor et al., on the other hand, combined the degree of stenosis with a measure of
the plaque surface echogenicity, and found that this risk index was significantly higher
in the presence of symptoms [203].
60
Previous studies have developed risk indices either by incorporating qualitative plaque
measures, or measurements made on single frames of ultrasound images. In the case
of the latter, the final risk indices were constructed using weighting parameters
optimised for the particular dataset studied which may limit applicability (Chapter 7).
In Chapter 7, a novel risk index will be developed, based solely on parameters
dynamically measured from ultrasound image sequences, without incorporating of any
dataset-optimised weighting factors.
1.9.4 Limitations of the Ultrasound Assessment of Plaque Characteristics
The assessment of carotid artery stenosis and plaque using ultrasonography has
certain limitations characteristic of this imaging modality. Due to the presence of bone,
only extra-cranial segments of carotid arteries can normally be imaged. Furthermore,
imaging of the carotid bifurcation and the distal branches can be difficult in patients
whose bifurcations are too high above the level of the mandibular angle and in
patients who have short necks [18,204]. Calcium-rich structures such as bone are both
highly reflecting (at boundaries with most soft tissues) and absorbing of ultrasound,
and acoustic shadowing, if present, can limit ultrasonographic assessment of the
carotid plaque further. However, the presence of acoustic shadowing can also be
diagnostically useful as shadowing is often an indication of plaque calcification [205].
Abrupt changes in acoustic impedance can cause other problems as well, and it has
been reported that the strong reflection of ultrasound waves at interfaces between
soft and hard regions of complex plaques can lead to underestimation of plaque
vulnerability [18]. It has also been demonstrated that plaques uniformly composed of
fibrous tissues could show low echogenicity on ultrasonography, and thus be mistaken
for lipid-rich soft plaques [18,204].
Spatial resolution of the ultrasound imaging system is also an important consideration
as it can limit the assessment of small structures such as small fissures of the plaque
surface. A further limitation arises in relation to totally echolucent plaques, plaques
which do not have any echogenicity and cannot be observed without the use of
another mode such as Colour Flow Imaging/Colour Doppler. Contrast-enhanced
ultrasound can also be used to identify such plaques, and study the surface

61
characteristics and/or the presence of intra-plaque haemorrhage. However, as
discussed in section 1.9.1.2, this requires the intravenous administration of a contrast
agent, and thus is an invasive procedure. Despite these limitations, ultrasonography
currently remains the most accessible imaging modality that may help identify the
vulnerable plaque [206].
1.10 Physics of Medical Ultrasound Imaging
Medical ultrasound employs acoustic/mechanical waves with frequencies typically
between 1 to 20 MHz which are beyond the range audible to the human ear
(approximately 20 Hz to 20 KHz for adults). This frequency range gives an optimal
combination of tissue penetration and imaging resolution. Physically, they are
longitudinal pressure waves that cause local pressure and particle oscillations without
any net displacement of the medium. However, energy is transferred (and dissipated)
along the direction of travel. Transverse/shear and other types of wave (such as
torsional), including mode conversion, can also occur in solids, but these are not
typically used in medical ultrasound, except for the former which, for example, are
utilized in Shearwave Elastography. Ultrasound waves are similar to other mechanical
waves in nature, such as those produced by earthquakes, except for the differences in
wave frequencies. The basic principle of ultrasound imaging is similar to echo-ranging
in which the time-of-flight of a received ultrasound wave gives information on the
distance to the target, while its amplitude depends on the mechanical properties of
the medium it travels in as well as the medium from which it is reflected.
Furthermore, any change in wave frequency may be used to gain information on target
motion as in Doppler ultrasound (section 1.10.1.4).
1.10.1 Ultrasound Wave Propagation
The propagation of ultrasonic waves and their interaction with the medium depend on
the mechanical properties of the medium as well as the characteristics of the
ultrasonic wave itself1. The speed of sound of acoustic longitudinal waves for isotropic
media is given by Equation 1.1. This equation implies that the speed of sound is
1 For example, the type of wave, and the wavelength or wave frequency.

62
greater in media which are less compressible (or more stiff) for a given density. The
speed of sound, particularly for gases, and because of changes in the mechanical
properties, has a dependence on temperature1, and in the case of solids/non-
homogeneous media, it can vary depending on other factors such as the direction of
travel. In tissues, the speed of sound increases with temperature for non-fatty tissues,
while it decreases for fatty tissues [207]. The speed of sound can also have a
dependence on the wavelength or wave frequency, and wave amplitude, but this
dependence is typically small in medical applications. Variations in the speed of sound
is less than 1% over the range of frequencies used in medical ultrasound with the
exception of bone which may have a larger dependency of the speed of sound on
frequency [207].
c = √(1/(ρκ)) = √(B/ρ)
Equation 1.1 - Speed of sound (c) for isotropic media. ρ is the density of the medium,
κ is its compressibility and B is the bulk/elastic modulus.
The speed of sound for various biological and non-biological media are listed in Table
1.3. Normally, an average speed of sound of 1540 m/s is assumed for soft tissues at a
temperature of 36oC, but as can be seen from Table 1.3, the speed of sound for
different tissues (e.g. bone and lungs) can vary significantly from this value. The
product of wave frequency and wavelength equate to the speed of sound; thus, a
speed of sound of 1540 m/s and a wave frequency of 7 MHz correspond to a
wavelength of 0.22mm.
Longitudinal acoustic waves exhibit as alternating regions of increased pressure
(compressions) and decreased pressure (rarefactions) as shown in Figure 1.4. Local
1 The speed of sound in dry air at sea level can be approximated by the formula c=20.1√(T+273) where T
is the temperature in degrees Celcius, and c is the speed of sound in m/s.

63
particle velocity1 is given by Equation 1.2 and is typically of the order of several tens
of mm/s.
v=p/Z where Z=ρc
Equation 1.2 - Local particle velocity (v). p is the local pressure, Z is the characteristic
acoustic impedance of the medium, ρ is the density of the medium, and c is the
speed of sound.
Figure 1.4 - illustration of an instantaneous pressure profile with distance (dist) along
the direction of propagation for an acoustic wave of wavelength 100µm. Bright bands
are compressions and dark bands are rarefactions. The vertical axis in the plot shown
on the top is the acoustic pressure in arbitrary units, and ranges from -ξ to +ξ, where
ξ is the pressure amplitude.
1 This is not to be confused with the acoustic wave (sound) velocity c.

64
Equation 1.1 indicates that any increase/decrease in the density of the medium will
cause a change in the wave propagation speed, unless it is accompanied by a
proportional decrease/increase in the bulk modulus. If this is not the case, the
propagation is non-linear, and the speed of sound will be different in regions of
compression (higher density), compared with regions of rarefactions (lower density).
Non-linear propagation results in the generation of the harmonics of the original
ultrasound frequency [208], and the second harmonic produced in this way is used in
tissue harmonic imaging. The latter gives better image quality due to the higher
frequency of the second harmonic at the expense of penetration depth.
1.10.1.1 Transmission/Refraction and Specular Reflection
If a sound wave propagating in a medium of acoustic impedance Z1 and speed of
sound of c1 is incident on a plane interface with another medium of acoustic
impedance Z2 and speed of sound of c2, part of the wave may be reflected and part
may be transmitted/refracted depending on the mismatch between the acoustic
impedances and the speeds of sound (Figure 1.5)1.
The acoustic pressure amplitude of the transmitted/refracted (At) wave is related to
the pressure amplitude of the incident wave (Ai) by Equation 1.3. Under the
assumptions that no energy is dissipated and no mode conversion occurs, the
reflected wave amplitude Ar will be such that the reflected wave pressure and the
incident wave pressure will sum to the wave pressure of the transmitted/refracted
wave at the interface.
At/Ai = (2Z2cosθi) / (Z2cosθi + Z1cosθt)
Equation 1.3 - The relationship between the transmitted acoustic wave pressure
amplitude (At) and the incident wave pressure amplitude (Ai). Z1 is the acoustic
1 Upon transmission from one medium to another, frequency remains constant, while c and λ may
change.

65
impedance of the first medium, θi is the angle of incidence, Z2 is the acoustic
impedance of the second medium, and θt is the angle of transmission/refraction.
Figure 1.5 - Illustration of an incident sound wave being partly reflected and partly
transmitted (in the form of a refracted wave) at a plane interface between two media.
θi is the angle of incidence, θr is the angle of reflection, and θt is the angle of
transmission/refraction.
In the case of perpendicular incidence, Equation 1.3 implies that if Z1 and Z2 are equal
then Ar is zero and At is equal to Ai. In other words, there is no reflected wave and the
wave is simply transmitted, if the beam is incident perpendicularly on the interface
and the acoustic impedances of the two mediums match. If Z2 is greater than Z1 then
the reflected wave is in phase with the incident wave, while if Z2 is less than Z1 the
reflected wave is 180o out-of-phase with the incident wave [209].

66
In relation to the direction of propagation of the incident, reflected and transmitted
waves, if the incident wave makes an angle θi with the perpendicular to the interface
then the reflected wave also makes the same angle with the perpendicular (i.e. θi and
θr are equal), while the refracted wave makes angle θt with the perpendicular where
θt is given by Snell's law (Equation 1.4).
sinθt/c2=sinθi/c1
Equation 1.4 - The law of refraction (Snell's law). c1 is the speed of sound in the first
medium, θi is the angle of incidence, c2 is the speed of sound in the second medium,
and θt is the angle of transmission/refraction (Figure 1.5).
If c2 and c1 are equal then the transmitted wave makes the same angle with the
perpendicular to the interface as the incident wave (i.e. θt is equal to θi). If c2 is less
than c1 then the wave is refracted towards the perpendicular (i.e. θt is less than θi).
On the other hand, if c2 is greater than c1 then the wave is refracted away from the
perpendicular (i.e. θt is greater than θi). A special situation occurs if θt is equal to 90o,
in which case the transmitted wave propagates along the interface and the θi is said
to be equal to the critical angle (θc). If θi is greater than θc then total internal
reflection occurs; there is no transmitted wave or a wave along the interface.
1.10.1.2 Scattering and Diffraction
In comparison to the specular reflection and transmission/refraction of ultrasound
waves at plane interfaces between media, also called geometric scattering and
described in the previous section, non-geometric scattering becomes predominant
when the interface between the media exhibits irregularities the dimensions of which
are comparable to or smaller than the acoustic wavelength. This type of scattering also
occurs when targets smaller than or comparable to the wavelength of the acoustic

67
wave are present in the path of the ultrasound beam (e.g. cells1) and is responsible
for the characteristic speckle patterns of tissues observed in ultrasound imaging.
Scattering is characterised by a fairly omnidirectional (Rayleigh2) or a less
omnidirectional (stochastic3) reflection/transmission of the acoustic waves. In
ultrasonography, interference of the waves produced by the various scatterers cause
the characteristic speckle patterns. Diffraction is another process acoustic waves are
be subjected to, when sound travels through a medium of non-uniform mechanical
properties (e.g. variations in acoustic impedance, density, or speed of sound) or an
opening that is comparable to or smaller than the wavelength of the acoustic wave;
the process is similar to the diffraction of electromagnetic waves. In fact, the arrays of
transducers used in multi-element ultrasound probes (section 1.10.2) can act as a
diffraction grating and produce side lobes in addition to the primary beam intended to
be produced.
1.10.1.3 Attenuation
Attenuation refers to the loss of signal intensity as an acoustic wave propagates
through a medium. In biological tissues, the main mechanism is absorption or
conversion to thermal energy, with additional contributions from scattering, and mode
conversion. Attenuation in terms of the signal amplitude can be written as in Equation
1.5 [210].
A(x) = A0exp(-αx)
Equation 1.5 - Attenuation in terms of the signal amplitude A(x) where A0 is the initial
signal intensity, x is the distance travelled by the acoustic wave and α is the
amplitude attenuation coefficient of the medium.
1 The diameters of red blood cells, for example, are usually in the region 6 to 8 µm.
2 Rayleigh scattering refers to the type of scattering that occurs when irregularities are smaller than the
acoustic wavelength. 3 Stochastic scattering refers to the type of scattering that occurs when irregularities are comparable to
the acoustic wavelength.

68
Attenuation has a bearing on the penetration depth attainable with ultrasound
equipment and takes place both during the outward propagation of the signal away
from the transducer and the inward propagation back towards the transducer. Aside
from depending on the material properties, attenuation coefficients also have a
dependency on wave frequency and are typically modelled as α = afb where the
exponent, for soft tissues, is often assumed to be equal to 1 [207]. Values of the
attenuation coefficient, therefore, are usually quoted in decibels per unit length, per
unit frequency (e.g. dB cm-1
MHz-1) and the loss of signal intensity and amplitude in
decibels are given by Equation 1.6 and Equation 1.7, respectively.
loss of signal intensity (dB) = 10log10(I/I0) = 10log10(A/A0)*2
Equation 1.6 - Loss of signal intensity in decibels, where I is the signal intensity and A
is the signal amplitude.
loss of signal amplitude (dB) = 10log10(A/A0) = 10log10(I/I0)/2
Equation 1.7 - Loss of signal amplitude in decibels, where A is the signal amplitude
and I is the signal intensity.
Soft tissues are often approximated to have an attenuation coefficient of 0.5 dB cm-1
MHz-1, but there is considerable variation among different tissue types and
propagation trajectories (Table 1.4). In medical ultrasound imaging, time gain
compensation (TGC) is applied to compensate for the loss in signal intensity with
increasing depth; nevertheless, signal to noise ratio is reduced at greater depths.

69
1.10.1.4 The Doppler Effect
Ultrasound waves reflected from stationary targets do not typically experience a
change in frequency. However, as mentioned in section 1.10.1.1, a phase shift may
occur. In contrast, when ultrasound waves are reflected by moving targets, a
frequency shift does typically occur depending on the angle between the ultrasound
beam and the direction of travel of the moving target (Equation 1.8). This is utilized in
medical ultrasound to study motion, for example, the measurement of blood flow
velocity.
Equation 1.8 implies that no shift in frequency occurs if the angle between the
ultrasound beam and the direction of travel of the moving target is 90o, while the
frequency shift is maximum when the two are parallel (i.e. θ=0o). Frequency shift is
positive if the target is moving towards the probe, and is negative if it is moving away
from the probe.
f-f0 = ± (2uf0cosθ)/c
Equation 1.8 - The shift in frequency (f-f0) as a function of the angle (θ) between the
ultrasound beam and the direction of propagation of the target moving with velocity of
magnitude u. This equation assumes that u is much smaller than the speed of sound
(c) in the medium.
Table 1.3 - Acoustic properties of various biological and non-biological media [211-212].
Medium Density (kg m-3) Speed of sound (m
s-1)
Acoustic
impedance (kg m-2
s-1) [x10
6] (rayls)
Fat 950 1480 1.40
Kidney 1040 1560 1.63
Breast 1020 1510 1.54
Blood 1060 1584 1.68
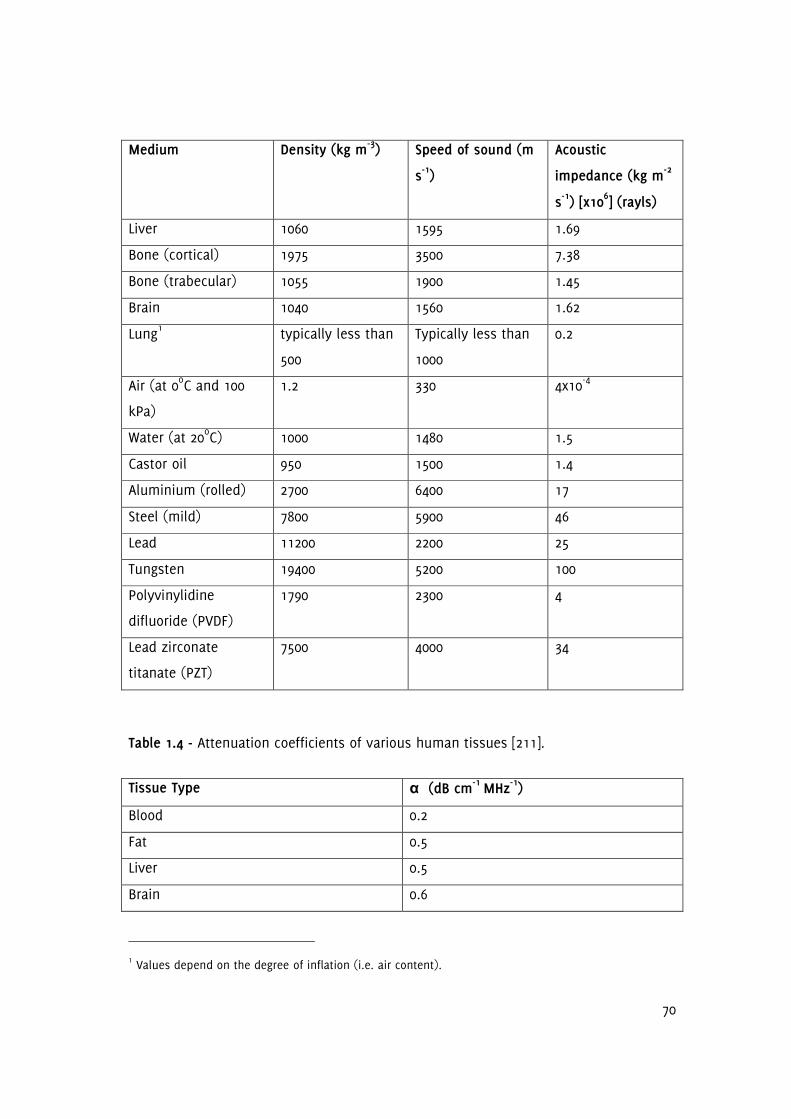
70
Medium Density (kg m-3) Speed of sound (m
s-1)
Acoustic
impedance (kg m-2
s-1) [x10
6] (rayls)
Liver 1060 1595 1.69
Bone (cortical) 1975 3500 7.38
Bone (trabecular) 1055 1900 1.45
Brain 1040 1560 1.62
Lung1 typically less than
500
Typically less than
1000
0.2
Air (at 0oC and 100
kPa)
1.2 330 4x10⁻⁴
Water (at 20oC) 1000 1480 1.5
Castor oil 950 1500 1.4
Aluminium (rolled) 2700 6400 17
Steel (mild) 7800 5900 46
Lead 11200 2200 25
Tungsten 19400 5200 100
Polyvinylidine
difluoride (PVDF)
1790 2300 4
Lead zirconate
titanate (PZT)
7500 4000 34
Table 1.4 - Attenuation coefficients of various human tissues [211].
Tissue Type α (dB cm-1 MHz
-1)
Blood 0.2
Fat 0.5
Liver 0.5
Brain 0.6
1 Values depend on the degree of inflation (i.e. air content).

71
Tissue Type α (dB cm-1 MHz
-1)
Breast 0.8
Kidney 1.0
Skeletal muscle (along fibres) 1.3
Cardiac muscle 1.8
Skeletal muscle (across fibres) 3.3
Bone (cortical) 7
Bone (trabecular) 10
Lung 41
1.10.2 Generation and Reception of Ultrasound Waves
Ultrasound waves are typically generated and received using the inverse and forward
piezoelectric effect, respectively, exhibited by polarised lead zirconate titanate (PZT), a
ceramic material1. PZT, like other materials (e.g. quartz) that exhibit the piezoelectric
effect, produce an electric potential when they are deformed (the forward piezoelectric
effect), and they deform when an electric potential is applied to them (inverse
piezoelectric effect). Application of a periodically varying electric potential, therefore,
results in a periodical deformation and relaxation of the material, producing a
mechanical wave. Conversely, ultrasound waves produce an alternating electric
potential when they are incident on a piezoelectric transducer. Ultrasound waves can
be produced using a single element, but transducers used in medical ultrasound
imaging typically employ an array of elements. Modern ultrasound probes can have
anywhere between 64 to 300 elements, while newer matrix probes used in three-
dimensional ultrasound can have as many as 2500. Focusing can be achieved by using
a transducer of an appropriate shape, using an acoustic lens, or by means of
electronic focusing.
In continuous wave modes, at least two transducer elements are required so that one
can be used for generating ultrasound waves, and the other for simultaneous
1 Polyvinylidine difluoride (PVDF), a plastic, is also sometimes used in transducer design but PZT is more
commonly used because it has a higher conversion efficiency.

72
reception. The use of multiple transducer elements is useful for beam steering,
dynamic focusing, and parallel processing. In phased array systems, this is achieved
by exciting different groups of transducer elements as appropriate with variable delays
between them to achieve these goals.
Depending on the acoustic impedance of the piezoelectric elements, a matching layer
is often present in ultrasound probes to reduce the impedance mismatch between the
elements and tissue, while a backing layer provides mechanical support and absorbs
any mechanical energy transmitted into the probe. The latter reduces excessive
vibration (ringing) and allows for the generation of shorter pulses, thus improving
axial resolution.
1.10.2.1 Ultrasound Signal Processing
Figure 1.6 is a simplified block diagram showing the signal processing chain of the
received signal for B-Mode ultrasound. The analogue signal produced by each
transducer element is amplified, digitized and summed by the beamformer which also
delays and weights the output of each transducer element to accomplish receive
focusing and apodisation. Signal processing then carries out in-phase/quadrature (I/Q)
demodulation. This is followed by envelope detection (Figure 1.7). Finally, log
compression, filtering and scan conversion take place. B-Mode greyscale data, as used
in this thesis, is obtained after the display and storage process. Data may also be
obtained in radiofrequency format or as analogue signals, but it is typically more
difficult to obtain these from clinical scanners.
The returned ultrasound signal, summed over all elements, can be written as in
Equation 1.9, in other words an amplitude modulated version of the transmit signal
with a time dependent phase shift θ. The transmit signal is of no interest and the
extraction of the amplitude and phase information can be achieved by demodulating
the returned signal. This can be done by multiplying the received signal with a
complex signal and low-pass filtering the result (Equation 1.10). An alternative is to
use an analytic signal analysis employing the Hilbert transform (Equation 1.11).

73
Figure 1.6 - A simplified block diagram of the received signal processing chain for B-
Mode ultrasound where dashed lines show alternative routes for data acquisition.
y(t) = A(t)*cos(2πft+θ)
Equation 1.9 - The returned ultrasound signal y(t) as an amplitude modulated version
of the transmit signal with a time dependent phase shift θ.
Let f(t) = y(t)*e
i2πft
then, f(t) = A(t)*cos(2πft+θ)*[cos(2πft)+i*sin(2πft)]
thus, f(t) = A(t)*cos(2πft+θ)*cos(2πft)+A(t)*cos(2πft+θ)*i*sin(2πft)
thus, f(t) = A(t)/2*[cosθ+cos(4πft+θ)]+i*A(t)/2*[sin(4πft+θ)-sinθ]
After low-pass filtering, f(t) = A(t)/2*cosθ-i*A(t)/2*sinθ
thus, f(t) = A(t)/2e-iθ
Hence, A(t) = 2*abs(f(t)) and phase θ = arg(f(t))
Equation 1.10 - Demodulation of the returned ultrasound signal y(t) to obtain the
signal envelope A(t) and phase θ.

74
Let f(t) = y(t) + i*z(t) where z(t) is the Hilbert transform of y(t)
thus, z(t) = 1/π * ∫y(t')/(t'-t)dt'
or, z(t) = convolution of -1/(πt) with y(t)
Then, A(t)=(y(t)2+z(t)
2)1/2
and phase θ=tan-1(z(t)/y(t))
Equation 1.11 - Determination of the returned ultrasound signal envelope A(t) and
phase θ using the Hilbert Transform/analytic signal method.
Figure 1.7 - Illustration of a signal envelope. Blue lines show an amplitude modulated
5 MHz sinusoidal radiofrequency signal while the red curve shows the signal envelope.
1.10.3 Biological Effects and Safety
Ultrasound is generally considered to be a safe imaging modality [207-208,213].
However, ultrasound does interact with tissues, and biological effects can become
important (and in fact are used in ultrasound therapy) at higher intensities and with
certain tissue types such as the eyes, air containing organs (e.g. lungs, intestines),
foetuses, embryos, and bone.

75
Biological effects of ultrasound are generally classified under two headings: thermal
and non-thermal effects. Thermal effects refer to the local tissue heating that is
caused by ultrasound exposure. However, it is generally believed that at diagnostic
levels these are too low to constitute a hazard [207]. On the other hand, higher
temperature increases can occur, for example, adjacent to bone surfaces. The most
rapid heating takes place in the centre of the beam at the focus, where the beam
intensity is highest. Heating is also more likely to be greater with stationary beams
(e.g. spectral Doppler), compared with ultrasound modes in which the beam is
translated across a region (e.g. B-Mode). Heat produced in this manner is conducted
away to nearby cooler tissues and some may be carried away by blood flow. However,
there will typically be a steady state increase in local tissue temperature which can be
damaging to cells. Human bone marrow cells, for example, will tolerate a raised local
tissue temperature of 41oC for long periods of time (greater than 200 minutes), but
survival is very short (less than 20 minutes) at higher temperatures (45.5oC) [214]. The
World Federation for Ultrasound in Medicine (WFUMB) recommends that a diagnostic
exposure which does not produce a temperature rise greater than 1.5oC above the
normal physiological level (e.g. 37oC) may be used clinically without reservation on
thermal grounds [215]. On the other hand, it is also recommended that a diagnostic
exposure which increases embryonic or fetal tissues 4oC above normal temperature
(e.g. 41oC) for 5 minutes or more should be considered potentially hazardous [215].
Non-thermal effects include stable and transient (inertial) cavitation and
microstreaming. At low amplitudes, ultrasound can cause breathing oscillation
(periodical expansion and compression) of gas bubbles, which may grow by rectified
diffusion with long pulses or continuous wave exposures. In the later case, more gas
diffuses into the bubble during rarefaction than diffuses out during compression due
to differences in surface areas between these two phases. Bubbles with radii of the
order of 1µm may resonate at diagnostic frequencies, and at high pressure amplitudes
the inertia of the bubble surface can become important. In transient or inertial
cavitation, large changes in bubble diameter may occur, resulting in the collapse of
the bubble, leading to large increases in local temperatures and pressures. This can
cause the sonoporation or lysis of adjacent cells, and can lead to local tissue damage.

76
Inertial cavitation only occurs in the presence of suitable gas bubbles, and is more
likely to occur at higher acoustic pressures and lower frequencies. Inertial cavitation is
also more likely to occur in the lungs and intestines (due to the presence of gas in
these organs) and in the presence of contrast agents. Tissue damage may occur at
diagnostic pressure levels in these situations.
Micro-streaming currents, on the other hand, occur around gas bubbles undergoing
breathing oscillations. Large velocity gradients may be present in these micro-
streaming currents and can cause shear stresses in cell walls giving rise to membrane
rupture or sonoporation.
1.10.3.1 Thermal and Mechanical Indices
The American Institute of Ultrasound in Medicine (AIUM)/National Electrical
Manufacturers Association (NEMA) Output Display Standard defines two indices related
to the biological effects of ultrasound that should be displayed by ultrasound
equipment. The Thermal Index (TI) is a measure of the estimated maximum
temperature rise that may be expected in tissue and is calculated as the total acoustic
power output divided by the power required to raise tissue temperature by 1oc.
However, it does not take into account any additional heating that may be caused by
probe heating. Three thermal indices are defined: TIS is the appropriate value for soft
tissues, TIB is for bone and TIC is for bone at the surface. British Medical Ultrasound
Society (BMUS) advises that below a TI of 0.7 there need not be any restrictions on
scanning unless there is noticeable probe heating or if the maternal temperature is
elevated [216]. Above a TI of 0.7, it is advised that the exposure of an embryo or foetus
should be restricted. Above a TI of 1.0, eye scanning is not recommended, except as
part of a foetal scan. At and above a TI of 3.0, scanning of an embryo or foetus,
however briefly, is not advised. Maximum exposure time for an adult is advised to be
30 minutes at a TI of 1.0, reducing to 15 minutes at a TI of 1.5, and 1 minute at a TI of
2.5.

77
The Mechanical Index (MI), given by Equation 1.12, is a measure used to evaluate the
likelihood of tissue damage occurring due to non-thermal effects (e.g. cavitation or
micro-streaming). Modern diagnostic ultrasound equipment display the TI and the MI,
although there is no requirement to display these if they are less than 0.4 and no
requirement to display them at all if the equipment can not exceed a TI or MI of 1.
BMUS advises that at an MI of less than 0.3 there need not be any restrictions on
scanning from a mechanical effects perspective, but at an MI between 0.3 and 0.7
there is a risk of damage to neonatal lung or intestine, and such exposures, if
necessary, should be limited as much as possible. At an MI of 0.7 and above, there is
an increasing risk of cavitation particularly if contrast agents are used. Food and Drug
Administration (FDA) limits for MI in the United States are 1.9 for non-ophthalmic
applications and 0.23 for ophthalmic applications. FDA limits for thermal effects are
given in terms of the spatial peak temporal average intensity (ISPTA) and are 720
mW/cm2 for non-ophthalmic applications and 50 mW/cm
2 for ophthalmic applications.
MI = pr.3(zsptp)/fc
1/2
Equation 1.12 - The Mechanical Index (MI) is calculated as the spatial and temporal
peak de-rated negative pressure (pr.3(zsptp)) divided by the square root of the centre
frequency of the pulse spectrum (fc). The pressure amplitude must be entered into
this equation in MPa and frequency in MHz. As an example, if pr.3(zsptp) is 1 MPa and
fc=5 MHz, then MI=1/51/2
=0.45.
1.11 Guide to the Thesis
The rest of the thesis is structured as follows: Chapter 2 introduces a probabilistic
algorithm for tracking arterial lumen surfaces in ultrasound image sequences, which is
subsequently developed in Chapter 3 into a method for tracking plaque boundaries
throughout the cardiac cycle. Chapter 3 also investigates the frame-by-frame variations
in the observed plaque GSM and points out that these previously unexplored
variations may be partly responsible for the variations in plaque GSM previously found

78
across centres and studies. Chapter 4 extends the literature by providing a novel
method for measuring plaque surface irregularities and shows that by taking into
account the surface structure of plaques, measured by objective quantitative means,
symptoms can be predicted more accurately compared to the degree of stenosis on its
own. Chapters 5 then studies arterial wall motion in the stenotic carotid artery; while
Chapter 6 looks at plaque motion throughout the cardiac cycle. Chapter 7 represents
the culmination of the thesis, and develops novel risk indices for carotid artery
stenosis, incorporating the degree of stenosis, plaque GSM and surface irregularities. It
is shown that, unlike the previously developed indices, these risk indices improve
diagnostic performance without relying on parameters optimized for the dataset; the
latter limit applicability due to variations in measurements across centres. Finally,
Chapter 8 summarises and discusses the whole thesis and identifies limitations and
future directions for research.
79
Chapter 2
A Probabilistic Approach to Tracking of Arterial Walls in
Ultrasound Image Sequences
2.1 Overview
This chapter introduces a probabilistic method for tracking arterial walls in ultrasound
image sequences, which can be used to study the dynamic behaviour of arteries. This
is developed into a method for tracking plaque boundaries in Chapter 3 and is used
for the dynamic assessment of greyscale plaque characteristics throughout the rest of
the thesis. The novel method of tracking arterial walls introduced in this chapter is
also used to study wall motion in the stenotic carotid artery in Chapter 5. In
collaboration with the Leicester Diabetes Centre, it is also used for studying the
endothelium-dependent, flow-mediated dilation of the brachial artery. A research
article based on the contents of this chapter was published in International Scholarly
Research Network (ISRN) Signal Processing [217].
2.2 Introduction
Greyscale ultrasound imaging (B-Mode) is an established tool for the non-invasive
imaging of the human body. Such imaging procedures are often accompanied by
measurements that are conveniently performed using the ultrasonic calipers. However,
if performed manually, it rapidly becomes a time consuming, difficult task for the
operator if the measurements need to be repeated a large number of times, for
example over a time series. In B-Mode vascular ultrasound, such a situation arises,
when one needs to track the position of the arterial walls over many frames in order
to study to distension of the arteries throughout the cardiac cycle. Although specific
solutions for tracking the position of the arterial walls using B-Mode ultrasound have
been previously described (Table 2.1), for example by region tracking/block matching
[196] or computerized edge detection [218], many of these techniques are limited in
terms of applicability, while some techniques have a particular vulnerability to image
noise. Also, a general purpose segmentation algorithm should be able to track the

80
position of the arterial walls over a sizeable length of the artery, for any vessel
orientation and morphology.
One solution to the problem of arterial wall tracking was by Wendelhag et al. who
described a method for measuring the intimate-media thickness and the lumen
diameter for the carotid and femoral arteries by means of an analysis system based on
dynamic programming [219,229]. However, it was reported that manual corrections
were required in a significant portion of the images. Beux et al. presented an
automatic procedure to study endothelium-dependent dilation of the brachial artery
which involved imposing a threshold on the normalized greyscale intensity to locate
the arterial lumen and an intensity gradient criterion to subsequently locate the
arterial lumen boundaries [220]. However, this technique worked only in longitudinal
cross sectional views of arteries with specific assumptions being made regarding the
orientation, curvature, and appearance of the artery. Cheng et al. described a method
for detecting the intima-media complex of the far wall of the common carotid artery
using active contour models. However, the processing of a single frame of ultrasound
image was reported to have taken between 30 seconds and 1 minute which was a
major drawback [221].
Newey and Nassiri employed artificial neural networks to detect the anterior and
posterior vessel walls of arteries in the longitudinal plane, but it was clear that this
technique was directly applicable only to relatively straight, and horizontal sections of
arteries [222]. Chen et al. [223], on the other hand, described a cell-competition
algorithm for the simultaneous segmentation of multiple objects in a sonogram. The
cell-competition algorithm was validated on 13 synthetic images and 71 breast
sonograms but applicability to vascular ultrasound image sequences was not
investigated.

81
Table 2.1 - A survey of solutions related to the problem of tracking arterial walls in B-mode ultrasound image sequences.
Reference Year Basis of Technique Applications Limitations
Wendelhag et al.
[219]
1997 Cost function
minimisation.
Measurement of intima-media
thickness and arterial lumen
diameter.
Extensive manual corrections
required.
Selzer et al. [218] 2001 Edge detection. Measurement of artery diameter
and intima-media thickness.
Operator intervention frequently
needed.
Beux et al. [220] 2002 Greyscale intensity and
gradient thresholding.
Endothelium-dependent dilation
of the brachial artery.
Dependence on vessel orientation,
curvature, and appearance.
Cheng et al. [221] 2002 Active contours. Detection of the intima-media
complex of the far wall of the
common carotid artery.
Long processing times.
Newey and Nassiri
[222]
2002 Artificial neural
networks.
Detection of the near and far
walls of the artery in the
longitudinal plane.
Relatively horizontal and straight
vessel assumed.
Golemati et al.
[196]
2003 Region tracking/block
matching.
Estimation of carotid artery wall
motion.
Limited number of points could be
tracked due to computational cost.
Chen et al. [223] 2005 Cell competition. Lesion boundary delineation in
breast sonograms.
Applicability to vascular ultrasound
image sequences not known.

82
Reference Year Basis of Technique Applications Limitations
Hii et al. [224] 2006 Normalized correlation
coefficient.
Speckle tracking in breast
sonograms.
Applicability to vascular ultrasound
image sequences not investigated.
Cardinal et al.
[225]
2006 Fast marching
algorithm.
Segmentation of intravascular
ultrasound images.
Required manual delineation of
initial contours.
Golemati et al.
[226]
2007 Hough transform. Extraction of carotid artery
lumen surface.
Arterial cross-sections approximated
as straight lines and circles.
Mendizabal-Ruiz et
al. [227]
2008 Polar representation. Delineation of lumen boundaries
in intravascular ultrasound
images.
Limitations on the types of contours
that could be traced.
Yang et al. [228] 2011 Edge detection and
mathematical
morphology.
Delineate vessel lumen
boundaries.
Works for transverse cross-sections
of arteries.

83
The method described by Hii et al. [224] allowed for the normalized correlation
coefficient (NCC) to be determined significantly faster then Fast Fourier Transform (FFT)
based methods, which is useful for motion tracking as the NCC can be used as a
similarity measure in block matching methods. However, speckle decorrelation limits
the applicability of region tracking/block matching methods and the absence of unique
features along straight segments of arterial walls can cause tracking failure.
The technique described by Cardinal et al. for the segmentation of intravascular
ultrasound (IVUS) images worked by detecting a mixture of Rayleigh distributions in
the IVUS data followed by a fast marching algorithm which converged on the
boundaries of interest [225]. However, the method required the manual delineation of
initial contours near the contours of interest to operate. Golemati et al. [226] used the
Hough transform to extract the carotid artery lumen surface from longitudinal and
transverse sections of arteries, but arterial lumens were modelled as straight lines and
circles, respectively, limiting applicability in real-life situations. Mendizabal-Ruiz et al.
described a probabilistic segmentation method for IVUS, modelling the lumen contour
as a periodic mixture of Gaussians [227], once again placing constraints on the type of
contour that can be tracked. Yang et al., on the other hand, employed edge detection
and mathematical morphology techniques to delineate vessel lumen boundaries in
transverse cross-sections of the common carotid artery but it was not investigated
whether the method would also work for longitudinal cross sections of arteries [228].
A recent survey of ultrasound image segmentation methods [230] presented a selection
of methods for various clinical applications, including intravascular ultrasound;
however, the segmentation of longitudinal cross-sections of arteries was not covered.
Thus, although specific methods for B-Mode ultrasound image segmentation have been
developed, there appears to be currently no simple solution that can be applied to the
diverse range of arterial configurations and imaging conditions encountered, and yet
be easily implementable by different centres. Also, some techniques, such as those
based on edge detection, are particularly vulnerable to speckle noise as the latter can
produce false edge signals. The efficiency of the method is also important as long
processing times hinder the practical analysis of long ultrasound image sequences and
any possible implementation in real-time. This chapter describes a probabilistic

84
approach to the segmentation of carotid artery ultrasound image sequences and
demonstrates good arterial wall tracking performance, comparable to a more
established Tissue Doppler Imaging (TDI) technique [231-232]. This algorithm effectively
segments arterial lumens in both longitudinal and transverse cross-sections with little
effort on the operator's part.
2.3 Methods
First I describe the thought process I used to derive the probabilistic algorithm for
arterial lumen segmentation. The process essentially involves simulating the behaviour
of the human operator in silico. It is the relatively echo-free (dark) region that draws
the attention of the human operator in the first instance when he/she looks at an
ultrasound image of the carotid artery. Focusing on any given point in this region,
he/she then scans around that point, considering any neighbouring points to be
belonging to the same lumen unless there is an abrupt change in the image
brightness, in which case he/she may assume that the boundary of the lumen is
reached. The brain is, of course, equipped with higher-level decision making
processes, but at the low-level, this behaviour may be modelled in three steps:
focusing on a lumen of interest, associating neighbouring points in terms of the
greyscale similarity between them, and scanning around the point focussed on until
the boundaries are found. The rest of this section describes the implementation of this
behaviour in silico.
In the probabilistic approach, the probabilities of individual points being within an
arterial lumen are associated using a Gaussian relationship. Given a greyscale
ultrasound image, a corresponding probability matrix is evaluated where each matrix
element represents the probability of that element's respective image pixel being
within the artery of interest. The probabilities are computed as follows: given a point B
which had a probability Pb of belonging to a certain arterial lumen, the probability Pa
that a neighbouring point A also belongs to the same lumen is evaluated as being
directly proportional to Pb with a Gaussian dependence on the greyscale contrast
between to two points, and an average is taken over the 8 immediate neighbours
(Equation 2.1). Here, Gb and Ga are the greyscale intensities of points B and A, and the

85
constant ζ is determined by considering the amount of greyscale contrast (Gth)
required to reduce Pa to 1/2 that of Pb.
Pa = (1/8) x ∑Pb exp(-(Gb-Ga)
2/ζ)
Equation 2.1 - The probabilistic algorithm. ζ = Gth2/log 2 and the sum is taken over the
8 immediate neighbours.
The value of Gth is set at 1% of the full range by default but can be altered by the
operator if necessary. The operator provides one or more seed points (i.e. points
inside the arterial lumen) which are assigned corresponding probabilities of being
within the arterial lumen of interest of 1.0, and the probabilities of the remaining
points are determined using Equation 2.1. In the case of multiple seed points, the
maximum of the probabilities evaluated using each of the seed points is used. The
calculation of the probability values starts with the immediate neighbours of each
given seed point, and iteratively propagates to more distant neighbours, starting with
the nearest, and culminating in the most distant, along a rectangular wavefront.
Finally, the segmentation is performed by passing the probability matrix obtained
through the contour function in MATLAB version 7.14 (MathWorks, Natick,
Massachusetts, USA) which determines the isolines separating probability values
greater than or equal to a user-adjustable probability value Pth (set to 0.10 by default)
from those that are lower. These isolines represent the segmentation result. An
alternative means of using the probability matrix is to construct a binary map,
representing the points within the arterial lumen of interest, determined as those
which have a probability value greater than or equal to Pth.
2.3.1 Pre-processing
In order to reduce the effects of speckle noise, images are pre-processed, before the
above processing takes place, by applying a circular averaging filter of radius 0.425

86
mm (5 pixels at a reference resolution of 11.77 pixels/mm). The actual filter size in
pixels is given by Equation 2.2.
filter size = 0.425√(X*Y)
Equation 2.2 - Calculation of the filter size. X and Y are the image resolution in the
horizontal and vertical directions, respectively, in pixels/mm.
2.3.2 Methods of Evaluation
The efficacy of the algorithm was evaluated by testing it on clinical images of the
carotid arteries and the abdominal aorta, and various laboratory, ultrasound test
objects. Clinical data included B-Mode carotid artery image sequences from patients
acquired using a Philips HDI5000 scanner with an L12-5 probe and a Philips iU22
scanner with an L9-3 probe (Philips Healthcare, Eindhoven, The Netherlands). Image
sequences were also obtained from a healthy volunteer using an Aixplorer scanner
(Supersonic Imagine, Aix-en-Provence, France) with the L15-4 probe. The use of the
data for this purpose was approved by the Leicestershire and Rutland Medical Ethics
Committee, and patients and the volunteer gave their informed consent before
participating in the study.
Laboratory data included ultrasound image sequences from walled and wall-less flow
phantoms and various laboratory test objects acquired using the Philips HDI5000
scanner with the L12-5 probe. The tissue mimicking material used in the construction
of the hypo- and hyper-echoic test objects, and the wall-less flow phantom was an
agar based formulation [233]. A blood mimicking fluid was circulated [234-235] in the
flow circuit of the walled (C-flex™, Cole-Palmer, IL, USA) and wall-less flow phantoms.
A computer controlled fluid pump was used to circulate the blood mimicking fluid
using a carefully selected input waveform to induce wall dilations in the phantom
similar to the dilation characteristics of the carotid artery [236].

87
Performance was also compared against a conventional region growing technique
based on intensity thresholding with a running average region intensity [237]. Images
were pre-processed using the same filter, and same seed points and threshold values
were used in both the case of the probabilistic algorithm and the conventional region
growing technique. The efficiency of the probabilistic algorithm was also evaluated
under high image-noise conditions by means of adding Gaussian noise of varying
strengths to carotid artery ultrasound images and by testing the method on image
sequences with substantial amounts of speckle noise within the vessel lumen from
the abdominal aorta, and walled and wall-less flow phantoms.
2.3.3 Software and Hardware
Implementation was carried out using MATLAB version 7.14 (MathWorks, Natick,
Massachusetts, USA) with portions of the probabilistic algorithm written in the C
language for efficiency. The analyses were performed on a self-built personal computer
with an Intel Core i5-2500K CPU (Intel Corporation, California, USA) running at 3.30 GHz.
The computer was running the 64-bit version of Windows 7 Ultimate (Microsoft
Corporation, Seattle, USA).
2.4 Results
Setting the algorithm threshold to 2% and choosing a point inside the arterial lumen in
a carotid artery with plaque on the posterior wall, the probabilistic algorithm produced
the first pass estimate boundary outline and the corresponding probability map seen
in Figure 2.1. Adding another seed point produced the overall probability map and
segmentation result seen in Figure 2.2. The final arterial boundary outline including
that of the plaque surface obtained by adding three more seed points was as shown
in Figure 2.3. A close-up view of the segmentation result over the plaque surface can
be seen in Figure 2.4.
The result of tracking the arterial lumen for a longitudinal image sequence with one
seed point was as shown in Figure 2.5. Investigations made on the processing of this
90 frame image sequence of dimensions 263 (height) x 256 (width) pixels indicated a
processing time of approximately 33 milliseconds/frame on the analysis computer

88
used. However, since the implementation was not designed to take full advantage of
the multi-core CPU architecture and was not optimised, it was also observed that the
processor as a whole was only running at approximately 30% of full capacity during
the analysis. Whole image sequences showing tracking results for this sample under
extreme noise conditions can be downloaded from:
https://dl.dropboxusercontent.com/u/13857734/pp/FIG2.5.n1.avi
https://dl.dropboxusercontent.com/u/13857734/pp/FIG2.5.n2.avi
https://dl.dropboxusercontent.com/u/13857734/pp/FIG2.5.n3.avi
Arterial lumens could be effectively segmented with a few seed points in a variety of
arterial configurations and image-noise conditions (Figure 2.6). The result of
segmentation and tracking of the residual arterial lumen and plaque surface in the
transverse plane was as in Figure 2.7. Investigation of segmentation performance in
the presence of computationally added Gaussian image-noise produced the results
seen in Figures 2.8 to 2.11. In an image sequence from the abdominal aorta, wall
tracking in the presence of substantial amounts of image-noise was as in Figure 2.12.
The results of lumen surface tracking for a walled flow phantom with blood mimicking
fluid in the flow circuit produced the results Figure 2.13. Tracking results for the
laboratory test objects and the comparison between Vernier caliper measured physical
dimensions and algorithm-determined dimensions were as in Figure 2.14 and Table
2.2, respectively.
Tracking of the arterial wall diameter for the common carotid artery from the healthy
volunteer using an image sequence obtained on the Aixplorer scanner produced the
arterial dilation waveform seen in Figure 2.15.
Comparison of algorithm efficacy against the conventional region growing technique
showed that the performance of the probabilistic algorithm surpassed that of the
conventional region growing algorithm with differences more apparent under high-
image noise conditions (Figure 2.16).

89
Figure 2.1 - First pass segmentation result (left) for a carotid artery with plaque on the posterior wall, and the corresponding
probability map (right). Probability values range from 0 (black) to 1.0 (white).

90
Figure 2.2 - The effect of adding another seed point. Segmentation result (left) and combined probability map (right).

91
Figure 2.3 - Final segmentation result (left) and combined probability map (right) with three additional seed points.

92
Figure 2.4 - A close-up view of the segmentation result over the plaque surface.
Figure 2.5 - Tracking of the arterial lumen for a carotid artery image sequence (single
frame shown). The whole image sequence is available to download from
https://dl.dropbox.com/u/13857734/pp/tt.avi.

93
Figure 2.6 - Arterial lumen segmentation in a variety of vessel configurations and
image-noise conditions.
Figure 2.7 - Tracking of the residual arterial lumen and plaque surface in the
transverse plane (single frame shown). The whole image sequence is available for
download from http://dl.dropbox.com/u/13857734/pp/t1.avi.

94
Figure 2.8 - Segmentation result (left) and probability map (right) in the presence of computationally added Gaussian noise with an
approximate standard deviation of 36.1 grey levels, evaluated at an algorithm threshold setting of 2%.

95
Figure 2.9 - Segmentation result (left) and probability map (right) in the presence of computationally added Gaussian noise with an
approximate standard deviation of 51.0 grey levels, evaluated at an algorithm threshold setting of 4%.

96
Figure 2.10 - Segmentation result (left) and probability map (right) in the presence of computationally added Gaussian noise with an
approximate standard deviation of 72.1 grey levels, evaluated at an algorithm threshold setting of 4%.

97
Figure 2.11 - Segmentation result (left) and probability map (right) in the presence of computationally added Gaussian noise with an
approximate standard deviation of 102 grey levels, evaluated at an algorithm threshold setting of 5%.

98
Figure 2.12 - Tracking of the arterial lumen in the abdominal aorta in the presence of
substantial amounts of noise (single frame shown). The whole image sequence is
available for download from http://dl.dropbox.com/u/13857734/pp/aa_1.avi.
Figure 2.13 - Tracking of the lumen surface in a walled flow phantom (single frame
shown). The whole image sequence available for download from
http://dl.dropbox.com/u/13857734/pp/wfp_1.avi.

99
Figure 2.14 - A selection of segmentation results for the detection of the boundaries of
hypo- and hyper-echoic test objects.
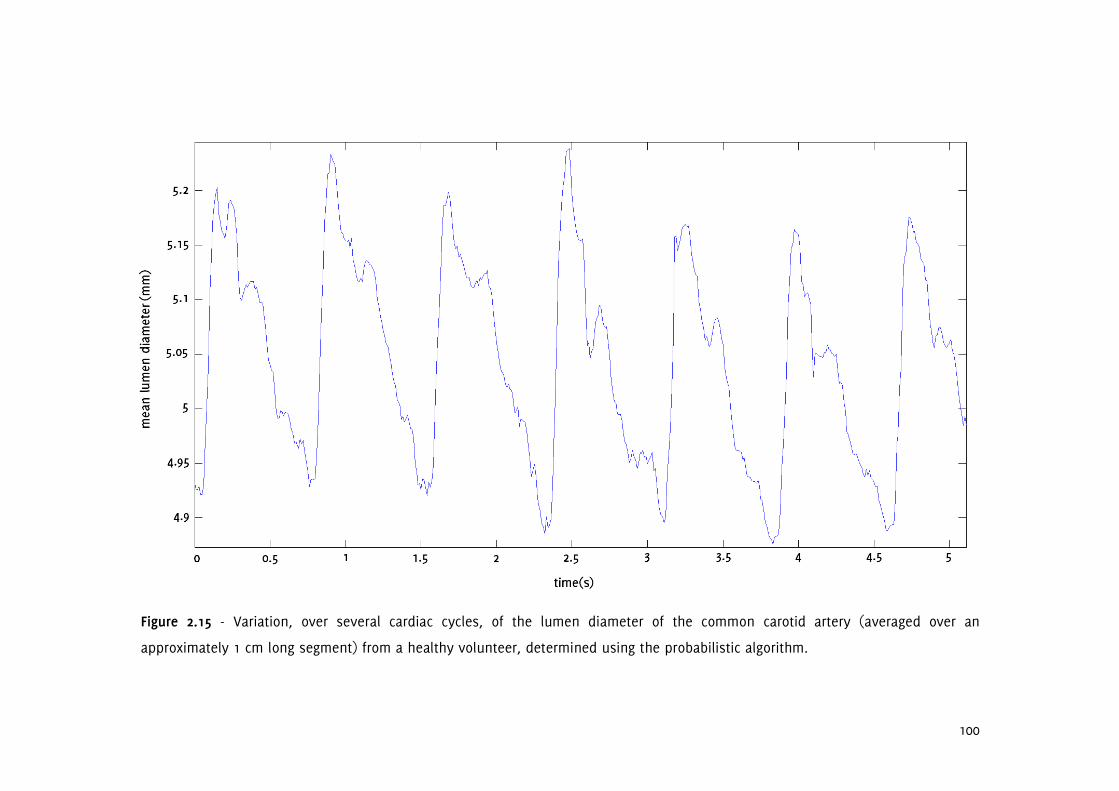
100
Figure 2.15 - Variation, over several cardiac cycles, of the lumen diameter of the common carotid artery (averaged over an
approximately 1 cm long segment) from a healthy volunteer, determined using the probabilistic algorithm.

101
3% 02082006_163734
3% 02082006_163734
3% 01282003_135524
3% 01282003_135524
4% 02082006_164257
4% 02082006_164257
4% 02082006_165951
4% 02082006_165951
3% 07152005_141346
3% 07152005_141346
2% 20111205.A_IM41
2% 20111205.A_IM41
3% 07152003_132307
3% 07152003_132307
4% 10102003_105656
4% 10102003_105656

102
4% 09012004_143848
4% 09012004_143848
4% 06172005_145127
4% 06172005_145127
2% 09012004_143034
2% 09012004_143034
4% 08122005_152103
4% 08122005_152103
4% 06092005_161522
4% 06092005_161522
4% 06142005_152327
4% 06142005_152327
4% 03102004_180555
4% 03102004_180555
3% 07312003_132933
3% 07312003_132933
Figure 2.16 - Comparison between the probabilistic algorithm (first and third columns)
and a conventional region growing technique based on intensity thresholding (second
and fourth columns). Results are given in pairs and labels indicate file reference and

103
threshold settings used. The two left-most figures on the bottom-most row are from
the walled-flow phantom, and the two right-most figures on the same row are from
the wall-less flow phantom.
Table 2.2 – Comparison between Vernier caliper (dcal) and algorithm (dal) made
diameter measurements for hypo- and hyper-echoic test objects.
Object Type dcal [mm] (±0.5mm) dal [mm]
1 Hypo-echoic 4.0 3.9 ± 0.2
8 Hyper-echoic 9.0 8.8 ± 0.2
2 Hypo-echoic 12.0 12.4 ± 0.2
7 Hyper-echoic 14.2 14.0 ± 0.3
3 Hypo-echoic 24.0 24.3 ± 0.6
6 Hyper-echoic 23.2 23.4 ± 0.2
4 Hypo-echoic 37.5 37.4 ± 0.2
5 Hyper-echoic 39.0 38.9 ± 0.2
2.5 Discussion
This chapter presented a method based on a probabilistic approach that can be used
to efficiently segment out and track blood vessel boundaries in B-Mode ultrasound
images and image sequences. The results showed that the technique can be used to
track arterial lumens simply and efficiently in both the longitudinal and transverse
imaging planes, including in the presence of substantial amounts of speckle noise.
Boundary segmentation was robust in the presence of strong, artificially added image-
noise and in an ultrasound image sequence from the abdominal aorta with ultrasound
artifacts. In the case of the walled and wall-less laboratory flow phantom, good
boundary tracking was obtained in the presence of high-intensity reflections within the
vessel lumen. Tracking the lumen diameter of the common carotid artery in a healthy
volunteer produced a detailed waveform showing the variation of the lumen diameter
over several cardiac cycles.

104
In a separate validation of the method, dimensions of various hyper- and hypo-echoic
laboratory, ultrasound test objects measured using the probabilistic method were
compared with Vernier caliper measured physical dimensions and similar values were
obtained within the error ranges of the measurements. Comparison with a
conventional region growing algorithm showed that the probabilistic approach had
better immunity to noise and less susceptibility to region overflowing at boundary
imperfections.
The method described in this chapter addresses the limitations of the existing arterial
lumen detection techniques based on B-Mode ultrasound image analysis. The
limitations of the existing techniques included dependence on vessel orientation,
curvature and scan plane, and long processing times. The probabilistic method was
found to be sufficiently efficient to allow practical analysis of long image sequences,
making real-time implementation feasible. The measured average processing time of
33 ms/frame per seed point for an image sequence of dimensions similar to a typical
carotid artery scan indicated that frame rates as high as 30 Hz may be achieved in
real-time even with the highly un-optimized implementation used in the study.
The advantages of the probabilistic method include its simplicity, and wide area of
applicability. This technique was previously found to have good arterial wall tracking
performance, comparable to that of Tissue Doppler Imaging [231] which needs access
to radiofrequency data. The algorithm can be easily adopted in 3 dimensions and it
would be interesting to see what results this would produce in further studies. It is
possible that the implementation can be enhanced further, for example by extending
the consideration to texture measures (e.g. local greyscale characteristics) or
incorporating machine learning into the segmentation process.
2.6 Conclusion
The method presented in this chapter, based on a probabilistic approach to the
segmentation of B-Mode ultrasound carotid artery images, produces robust
segmentation results, including in the presence of substantial amounts of image-noise,
and with little effort on the user's part.

105
Chapter 3
Dynamic Variations in the Ultrasound Greyscale Median of
Carotid Artery Plaques
3.1 Overview
The image contrast provided by B-Mode ultrasound depends on the way ultrasound
interacts with tissues and thus is a representation of the ultrasonic properties and
structure of tissues. Strongly reflecting structures such as fibrous materials and
calcium rich regions generally appear brighter than weakly reflecting tissue
components such as lipids, regions of necrosis and haemorrhages. The greyscale
median (GSM) of carotid artery plaques succinctly quantifies the B-Mode appearance
of plaques and has been widely researched as a surrogate marker of plaque
composition and vulnerability. However, existing studies have assessed GSM of
plaques on still ultrasound images and ignored any variations that may be present on
a frame-by-frame basis. This chapter introduces a novel method of tracking of plaque
boundaries in ultrasound image sequences and investigates the nature and extent of
the frame-by-frame variations in the plaque GSM. A research article based on the
contents of this chapter was published in Cardiovascular Ultrasound [238].
3.2 Introduction
The North American Symptomatic Carotid Endarterectomy Trial (NASCET) and the
European Carotid Surgery Trial (ECST) have shown that surgery in symptomatic patients
with severe internal carotid artery stenosis results in a six-fold reduction of stroke risk
[38-39]. However, patients who do not have severe stenoses and patients who are
asymptomatic can also go on to develop stroke. It is, therefore, important to be able
to determine whether any of these patients have carotid plaques which are high-risk
or unstable. Ultrasound greyscale median (GSM) is commonly used to quantify the
ultrasound appearance of carotid plaques, and several studies have found that it may
be valuable for predicting the risk of cerebrovascular events. In particular, statistically
significant associations have been reported between plaque GSM and the presence of

106
cerebrovascular symptoms [129,131], cerebral infarction in symptomatic and
asymptomatic patients [132,137,140], recurrent cerebrovascular events before
undergoing carotid endarterectomy [51], and the overall risk of stroke in symptomatic
patients [134], asymptomatic patients [135], and during and after carotid artery
stenting [138].
GSM measurements have had poor reproducibility across studies. This can be partly
attributed to the differences in the acquisition settings used in separate studies. In
order to reduce this variability, investigators have attempted to standardise ultrasonic
images of carotid plaques by specifying certain acquisition settings to be used for
carotid artery scanning and normalizing the resultant ultrasound images [148].
However, existing studies typically measured GSM on still ultrasound images, and thus
ignored any variations that may have been observed on a frame-by-frame basis. This
chapter establishes the existence of and investigates the nature and extent of any
frame-by-frame variations in the plaque GSM using a novel technique for tracking
plaque boundaries in ultrasound image sequences.
We hypothesized that variations in the GSM of carotid artery plaques may occur due to
deformation of the plaque during the cardiac cycle, and other confounding factors
such as out-of-plane plaque, patient or probe motion. Changes in echogenicity
between systole and diastole as a result of cardiac contraction, for example, have
been shown to occur in sonographic imaging of the myocardium [239]. Furthermore, it
was hypothesized that plaques of different composition and morphology may exhibit
different inter-frame variations in GSM in otherwise equivalent hemodynamic
circumstances and hence the measurement of these variations may give useful insight
into the dynamic behaviour of plaques and help identify vulnerable plaques.
3.3 Methods

107
3.3.1 Data Acquisition
Frame-by-frame variations in the plaque GSM and area of 27 carotid artery plaques (19
consecutive patients, 11 males, mean age 76, stenosis range 10%-80%) were studied
by measuring the GSM and area of plaques on each image frame separately and
computing the mean, the standard deviation (s.d.) and the coefficient of variation
(s.d./mean) across the frames. The image sequences used were of up to 10 seconds in
length (average 4.4 seconds) and were acquired with a mean frame rate of 32 frames
per second. The degrees of stenosis of the corresponding arteries were measured
using criteria consistent with the NASCET methodology utilizing blood flow velocities in
conjunction with the B-Mode and colour flow imaging [38,47,240]. Eleven of the
plaques studied were found to be asymptomatic and the remaining sixteen
symptomatic after assessment at the University Hospitals of Leicester NHS Trust's
Rapid Access Transient Ischaemic Attack (TIA) Clinic. The use of the clinical data for our
research had been approved by the National Research Ethics Service (NRES) Committee
East Midlands - Northampton (reference 11/EM/0249), and each patient gave informed
consent before participating in the study. The ultrasound data were obtained as
longitudinal cross-sections using a Philips iU22 ultrasound scanner (Philips Healthcare,
Eindhoven, The Netherlands) with an L9-3 probe and included B-Mode (i.e. greyscale)
and Colour Doppler image sequences. The vascular carotid preset on the scanner was
used (Vasc Car preset, persistence low, XRES and SONOCT on) and the gain was
optimized by the operator, an experienced vascular sonographer. In the case of B-
Mode acquisitions, the greyscale transfer curve was kept set to Gray Map 2, as this
was reported to be the most linear transfer curve on this scanner [241]. Colour Doppler
cine-loops were used as a qualitative aid to identifying the location and extent of the
plaques, while the B-Mode data were used for the quantitative analyses of the plaque
GSM and cross-sectional area.
3.3.2 Data Analysis
Quantitative analyses were carried out using MATLAB version 7.14, release 2012a
(MathWorks, Natick, Massachusetts, USA) and employed a combination of standard
speckle tracking/block-matching techniques and the novel surface tracking algorithm
that was introduced in Chapter 2. The latter was used to delineate and track plaque-

108
arterial lumen boundaries (the plaque surface). Speckle tracking, which was used to
track the boundary between the plaque and the underlying tissue, is a standard image
analysis technique that involves measuring the similarity between a template and a
search image [242]. Given a point to speckle track, a region is defined around the point
and used as a template. The process is then essentially to find the position in the
search image that has the largest similarity to this template. There are many different
measures of similarity between a template and a search image; in this study the
normalized correlation coefficient was used since it is invariant to changes in image
amplitude [242]. Square regions of approximate area 1.4 x 1.4 cm2 were employed. This
template size was found to produce optimum speckle tracking quality in our study as
was verified by observing plaque tracking results:
http://www.cardiovascularultrasound.com/content/download/supplementary/1476-
7120-11-21-s1.avi
Speckle tracking requires stable speckle patterns to be useful. Speckle patterns at
plaque-arterial wall boundaries usually fulfil this requirement but speckle patterns at
plaque-arterial lumen boundaries tend to de-correlate rapidly. For this reason, the
arterial lumen segmented out using the surface tracking algorithm defining the plaque-
arterial lumen boundary, was automatically cut and joined with a polygon comprising
the speckle tracked points defining the plaque-arterial wall interface (Figure 3.1). The
joining process was carried out by finding the closest points on the arterial lumen
surface to the proximal and distal ends of the speckle-tracked plaque-arterial wall
boundary and joining these respective points. Regions of plaques that could not be
distinguished from the arterial lumen (e.g. echo-free regions) and regions of plaques
in areas of acoustic shadowing were excluded from analysis. Plaques for which
anechoic regions and regions of shadowing exceeded more than 70% of the total
plaque cross-sectional area as observed on Colour Doppler sequences were not
included in the study.

109
Figure 3.1 - The plaque region shown by the green dashed lines is defined by two
boundaries: the top boundary (blue arrow) defines the plaque-arterial lumen interface
and the bottom boundary (orange arrow) defines the plaque-arterial wall interface. The
purple lines are the output of the surface tracking algorithm that was introduced in
Chapter 2.
Image normalisation was carried out using two different methods in order to observe
their effects on the frame-by-frame variations observed. The first normalisation
(NORM1) was performed by linearly scaling the ultrasound image intensities so that
the GSM of a user-selected blood region inside the vessel lumen was mapped to 0 and
the brightest region of the adventitia was mapped to 190. Both of these regions were 5
x 5 pixels2 in size, corresponding to an approximate physical area of 0.4 x 0.4 mm
2.
The reference regions were selected on the first image of the sequence and the
reference GSM values calculated on the first frame were applied to that and all

110
subsequent images. The second normalisation (NORM2) method involved selecting an
adventitia region on each image separately, thus applying separate adventitial
reference values to individual images.
From the user's perspective, the procedure for plaque segmentation and tracking was
as follows: On the first image of the sequence, the user selected a number of seed
points within the arterial lumen for the surface tracking algorithm to track the plaque-
arterial lumen boundary. The user, then, manually delineated the plaque-
periadventitial tissue boundary using the mouse. The latter were used for speckle
tracking and were used to track the plaque-periadventitial tissue boundary in the
subsequent images of the sequence. Following the selection of the brightest region of
the adventitia, the rest of the process was automated as the plaque-arterial lumen
and the plaque-periadventitial tissue boundaries were automatically tracked in the
subsequent frames of the image sequence using the surface tracking and speckle
tracking algorithms, respectively. An exception to this was the NORM2 normalisation,
in which case the user additionally selected the brightest region of the adventitia in
each image frame separately.
A semi-qualitative assessment of whether physiologically reasonable (e.g. of the order
of 60/min) periodical variations were visually apparent on the GSM and plaque area
waveforms was also carried out. This involved measuring the frequency of any
periodical variations seen on the GSM and cross-sectional area waveforms and
considering frequencies in the range 50/min - 160/min to be potentially attributable to
cardiac variations. Conversely, variations with frequencies lower than 50/min or higher
than 160/min were not considered to be due to physiological sources and such
plaques were placed in the same category as those not showing any apparent,
physiologically reasonable, periodical variations in the GSM and cross-sectional area.
3.3.3 Statistical Methods
Statistical analyses were carried out using MATLAB version 7.14, release 2012a
(MathWorks, Natick, Massachusetts, USA) and SPSS version 20 (IBM Corporation,
Armonk, New York, USA). Spearman's test was used to study the correlation between

111
the inter-frame variations in GSM and area, since neither of these parameters was
expected to follow a Gaussian distribution and any correlation between the two was
likely to be non-linear. Multi-variable linear regression was used to study the
contribution of other plaque GSM and area parameters to the differences observed in
the magnitude of the GSM variations for each plaque. The unpaired, non-parametric
Mann-Whitney U-test was used to investigate whether the GSM values averaged across
all frames, as well as their standard deviations and the coefficients of variation,
differed significantly between the asymptomatic and symptomatic plaque groups. Two-
tailed values of significance were used in each case.
3.3.4 Reproducibility
Intra-observer coefficients of variation for eight selected plaque samples of varying
echogenicities were studied by measuring the frame-by-frame variations in the plaque
GSM and cross-sectional area five times for each plaque. The measurements were
made by the same operator and in sequential order. The same ultrasound acquisition
sequences were used for each plaque respectively. The eight plaques were selected
from the available dataset to give a wide spectrum of plaque echogenicities for
reproducibility analysis.
3.3.5 Comparison Against Manual Measurements
In order to compare the plaque GSM and cross-sectional area obtained using our
method with those obtained using manual delineation, plaque GSM and cross-sectional
area were measured by the same operator using manual delineation for every 5th
frame, for each of the same eight plaque samples used for our study of
reproducibility. This enabled the magnitude of and variation in the plaque GSM and
cross-sectional areas to be compared between the two techniques. A Bland-Altman
analysis was also carried out to assess the agreement between the GSM
measurements made using our method and manual delineation on matching image
frames.

112
3.4 Results
Plaque outlines could be tracked successfully in a variety of different configurations
(Figure 3.2). Across all plaque samples, the un-normalized plaque GSM, averaged
across all frames, ranged between 26 and 112 (mean 47, Table 3.1). Plaque areas
ranged between 7 mm2 and 92 mm
2 (mean 30 mm
2). The mean inter-frame coefficient
of variation (s.d./mean) of GSM was 5.2% (s.d. 2.5%) while that of plaque area was
4.2% (s.d. 2.9%). In relation to the normalized GSM obtained using the NORM1 method,
the corresponding mean GSM figures ranged between 24 and 96 (mean 46). The mean
inter-frame coefficient of variation was the same as without normalization (5.2%) but
the standard deviation was slightly larger (2.6%). Normalization using the second
normalisation technique (NORM2) for plaques px1, px2, px3, px19 (excluding the region
of acoustic shadowing for px19) and px22 resulted in a larger coefficients of variation
(values in % were 4.8, 9.7, 6.7, 3.8 and 4.9 for each plaque, respectively) compared to
the un-normalized and NORM1 normalized coefficients of variation (Table 3.1).
Periodic variations with frequencies of the order of 60/min in either or both of the
plaque GSM or area waveforms were observed for 12 plaques (50%) but not observed
for 12 other plaques (Table 3.1). Three plaques were excluded from this analysis
because they had short acquisition sequences.
Overall, 13 of the 27 plaques (48%) exhibited inter-frame variations in GSM of greater
than 5% measured as the inter-frame coefficient of variation of GSM in both the un-
normalized and NORM1 normalized cases. In contrast, only 6 of the 27 plaques (22%)
had inter-frame coefficients of variation in plaque area of greater than 5% (Table 3.1,
Figure 3.3).

113
Figure 3.2 - Close-up views of four plaque samples with varying echogenicities (single
frames shown). Plaques (a) px1, (b) px3, (c) px19, (d) px22. The region of acoustic
shadowing has been excluded from analysis for px19.

114
Figure 3.3 - Variations in the un-normalized plaque GSM (top row), and plaque area (bottom row) for plaques px1 (a,b), px3 (c,d),
px19 (e,f), px22 (g,h).

115
Table 3.1- Variations observed in the plaque GSM and area. The last column indicates whether periodical variations of the order of
60/min were observed on the inter-frame GSM and area waveforms. Normalized GSM refers to NORM1. The table has been sorted in
terms of the un-normalized, mean plaque GSM.
GSM (un-normalized) GSM (normalized) Area Plaque
sample mean s.d. COV
(s.d./mean)
mean s.d. COV
(s.d./mean)
mean
(mm2)
s.d.
(mm2)
COV
(s.d./mean)
Periodical variations
observed?
px3 25.6 1.52 5.9% 24.4 1.45 5.9% 16.9 0.69 4.1% Both
px10 27.6 0.74 2.7% 26.3 0.70 2.7% 13.1 0.80 6.1%
px8 28.3 2.02 7.1% 32.9 2.53 7.7% 7.2 0.44 6.0% Both
px9 29.6 1.19 4.0% 27.8 1.12 4.0% 21.9 0.59 2.7%
px23 30.1 0.64 2.1% 25.6 0.54 2.1% 49.4 1.22 2.5% Excluded
px28 31.2 1.90 6.1% 42.4 2.58 6.1% 13.6 0.45 3.3% Area
px16 31.9 1.68 5.3% 34.8 1.83 5.3% 14.6 0.93 6.4% Area
px2 32.3 2.80 8.7% 27.5 2.38 8.7% 27.9 1.12 4.0%
px7 33.6 0.84 2.5% 35.8 0.90 2.5% 52.5 1.14 2.2% Both
px6 33.8 2.87 8.5% 36.1 3.06 8.5% 28.9 3.56 12.3% Both
px29 33.9 2.20 6.5% 27.2 1.77 6.5% 91.9 1.93 2.1%
px24 35.5 2.52 7.1% 36.9 2.62 7.1% 14.4 0.37 2.6% Excluded

116
GSM (un-normalized) GSM (normalized) Area Plaque
sample mean s.d. COV
(s.d./mean)
mean s.d. COV
(s.d./mean)
mean
(mm2)
s.d.
(mm2)
COV
(s.d./mean)
Periodical variations
observed?
px5 36.9 4.31 11.7% 30.9 3.60 11.7% 22.0 0.96 4.4% Both
px13 39.3 3.12 7.9% 33.5 3.05 9.1% 14.6 1.65 11.3% GSM
px1 40.3 1.69 4.2% 40.5 1.69 4.2% 22.3 0.25 1.1% GSM
px14 40.9 1.66 4.1% 38.1 1.55 4.1% 30.2 1.29 4.3%
px26 43.4 1.49 3.4% 55.3 1.90 3.4% 39.5 0.94 2.4%
px27 50.1 1.17 2.3% 56.3 1.31 2.3% 66.1 1.68 2.5%
px21 52.4 2.35 4.5% 51.1 2.34 4.6% 22.7 1.09 4.8% GSM
px15 53.7 1.97 3.7% 53.1 1.95 3.7% 15.9 0.71 4.4%
px12 54.0 3.72 6.9% 61.0 4.28 7.0% 14.9 0.39 2.6%
px22 67.4 2.15 3.2% 56.7 1.80 3.2% 21.5 0.80 3.7% Both
px11 70.2 1.27 1.8% 71.7 1.30 1.8% 38.0 0.23 0.61% Area
px18 73.3 5.30 7.2% 58.3 4.21 7.2% 25.8 0.82 3.2%
px4 76.9 2.22 2.9% 71.0 2.08 2.9% 11.3 1.05 9.3%
px25 82.9 6.02 7.3% 82.3 5.98 7.3% 37.2 0.61 1.6% Excluded
px19 112.3 1.98 1.8% 95.7 1.72 1.8% 67.0 1.14 1.7%

117
Normalisation using NORM1 did not appear to change the shape of the GSM variation
waveform but caused a translation along the y-axis (Figure 3.4). After normalization,
the mean GSM was lower for some plaques, and higher for others (Figure 3.5a). The
coefficients of variation were predominantly the same, yet for some plaques, NORM1
also changed the coefficient of variation (Figure 3.5b).
Figure 3.4 - Variations in GSM for plaque sample px1: (a) un-normalized, (b)
normalized (NORM1).
The correlation between the inter-frame coefficients of variation in un-normalized
plaque GSM and cross-sectional area (Figure 3.6) was not statistically significant
(Spearman's rho 0.36, p=0.07). Testing the influences on the extent of the inter-frame
variations seen in the un-normalized GSM, of (a) the mean inter-frame, un-normalized
GSM, (b) the mean inter-frame plaque area, and (c) the extent of inter-frame
variations seen in plaque area, with the extents taken as the standard deviation of
inter-frame values, identified the mean inter-frame GSM as the only statistically
significant factor at the 5% significance level (Table 3.2).

118
Figure 3.5 - (a) NORM1 normalized mean GSM versus un-normalized. (b) NORM1 normalized coefficients of variation versus un-
normalized. Red dashed lines are the lines of identity and indicate no change upon normalization.

119
Figure 3.6 - Scatter plot of inter-frame coefficients of variation for un-normalized GSM versus those for plaque area. The correlation
between the two coefficients of variation is weak (Spearman's rho 0.36, p=0.07). The dashed line is a linear fit to the data.
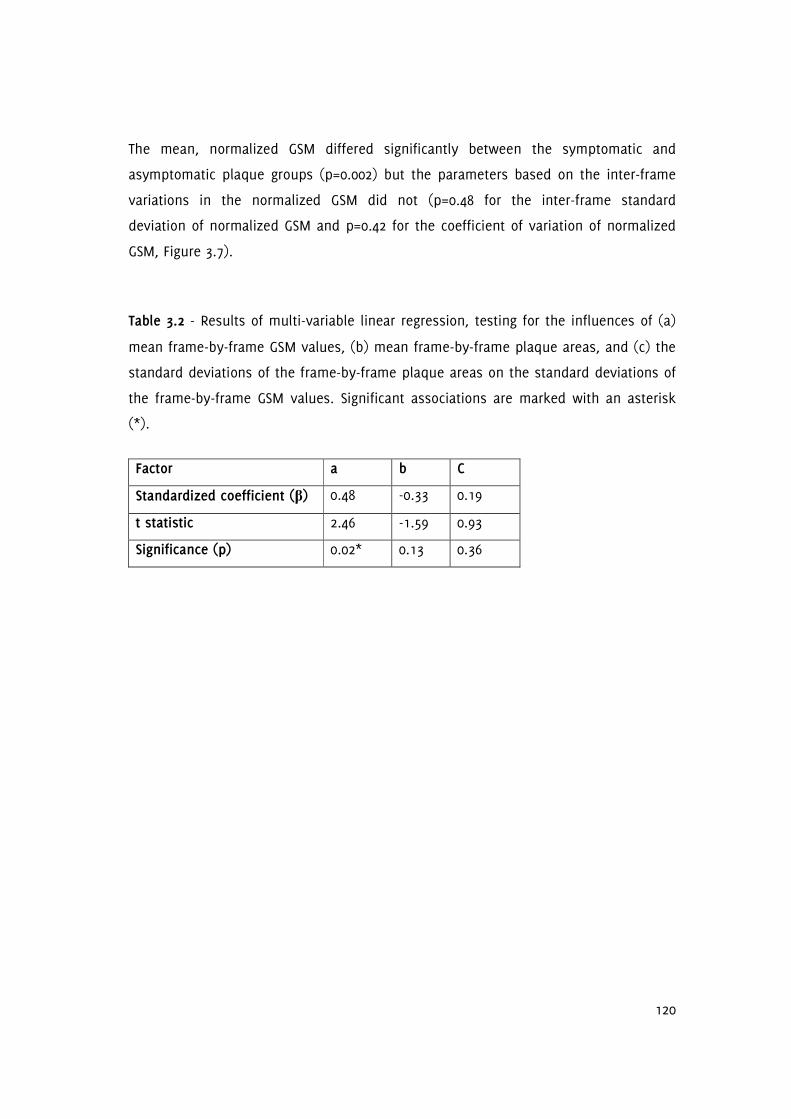
120
The mean, normalized GSM differed significantly between the symptomatic and
asymptomatic plaque groups (p=0.002) but the parameters based on the inter-frame
variations in the normalized GSM did not (p=0.48 for the inter-frame standard
deviation of normalized GSM and p=0.42 for the coefficient of variation of normalized
GSM, Figure 3.7).
Table 3.2 - Results of multi-variable linear regression, testing for the influences of (a)
mean frame-by-frame GSM values, (b) mean frame-by-frame plaque areas, and (c) the
standard deviations of the frame-by-frame plaque areas on the standard deviations of
the frame-by-frame GSM values. Significant associations are marked with an asterisk
(*).
Factor a b C
Standardized coefficient (β) 0.48 -0.33 0.19
t statistic 2.46 -1.59 0.93
Significance (p) 0.02* 0.13 0.36

121
Figure 3.7 - Distribution of the mean, normalized GSM [a], and the extent of the frame-by-frame variations in GSM (measured as the
standard deviations of the inter-frame GSM values [b] and the coefficients of variation [c]), for the symptomatic and asymptomatic
plaque groups. The horizontal lines indicate mean values for the individual groups.

122
Our plaque GSM and area measurements showed good reproducibility (Table 3.3) and
were broadly comparable to those obtained using manual delineation (Table 3.4). The
mean intra-observer coefficients of variation for the eight selected plaque samples
were 1.4% for the measurement of the un-normalized GSM, 2.4% for the plaque area,
and 2.8% for the NORM1 normalized GSM (Table 3.3). Manual delineation results
showed a greater amount of variation (mean coefficients of variation were 7.7% for the
un-normalized GSM and 8.0% for the plaque area compared with 5.4% and 4.0%,
respectively, for our method), due to the greater subjectivity of the manual delineation
process (Table 3.4). However, the mean difference in GSM measurements between the
two techniques was 0.1 grey levels (Figure 3.8) and did not differ significantly from
zero (p=0.77, t-test). The 95% limits of agreement were -7.9 grey levels to +8.1 grey
levels.
Table 3.3 - Intra-observer coefficients of variation (standard errors) for the
measurement of the inter-frame mean GSM (un-normalized and NORM1 normalized)
and mean area, for eight plaque samples.
Plaque GSM Plaque sample
Un-normalized NORM1 normalized
Cross-sectional area
px2 1.7% (0.24) 2.3% (0.29) 2.9% (0.37)
px4 0.5% (0.18) 4.4% (1.39) 2.3% (0.11)
px11 1.6% (0.48) 4.7% (1.53) 1.4% (0.24)
px26 1.1% (0.22) 1.2% (0.30) 1.5% (0.26)
px21 1.4% (0.32) 2.4% (0.56) 2.5% (0.25)
px22 1.5% (0.45) 1.7% (0.43) 2.9% (0.29)
px12 1.8% (0.44) 2.4% (0.66) 3.3% (0.22)
px5 1.4% (0.23) 3.3% (0.46) 2.3% (0.23)
Column means 1.4% (0.32) 2.8% (0.70) 2.4% (0.24)

123
Table 3.4 - Comparison with manual delineation for eight selected plaque samples. COV is the coefficient of variation.
Our method Manual delineation
GSM (un-normalized) Plaque Area GSM (un-normalized) Plaque Area
Plaque
sample
mean s.d. COV
(s.d./mean)
mean
(mm2)
s.d.
(mm2)
COV
(s.d./mean)
mean s.d. COV
(s.d./mean)
mean
(mm2)
s.d.
(mm2)
COV
(s.d./mean)
px2 32.3 2.80 8.7% 27.9 1.12 4.0% 28.7 3.88 13.5% 27.5 2.10 7.6%
px4 76.9 2.22 2.9% 11.3 1.05 9.3% 78.1 4.57 5.9% 11.0 2.03 18.4%
px11 70.2 1.27 1.8% 38.0 0.23 0.61% 73.0 3.36 4.6% 37.4 0.40 1.1%
px26 43.4 1.49 3.4% 39.5 0.94 2.4% 45.9 2.27 4.9% 36.9 1.61 4.4%
px21 52.4 2.35 4.5% 22.7 1.09 4.8% 51.3 2.86 5.6% 22.1 1.80 8.1%
px22 67.4 2.15 3.2% 21.5 0.80 3.7% 67.6 3.54 5.2% 21.3 1.75 8.2%
px12 54.0 3.72 6.9% 14.9 0.39 2.6% 52.9 4.47 8.5% 15.0 1.23 8.2%
px5 36.9 4.31 11.7% 22.0 0.96 4.4% 36.0 4.66 13.0% 22.4 1.71 7.7%
Column
means
54.2 2.54 5.4% 24.7 0.82 4.0% 54.2 3.70 7.7% 24.2 1.58 8.0%
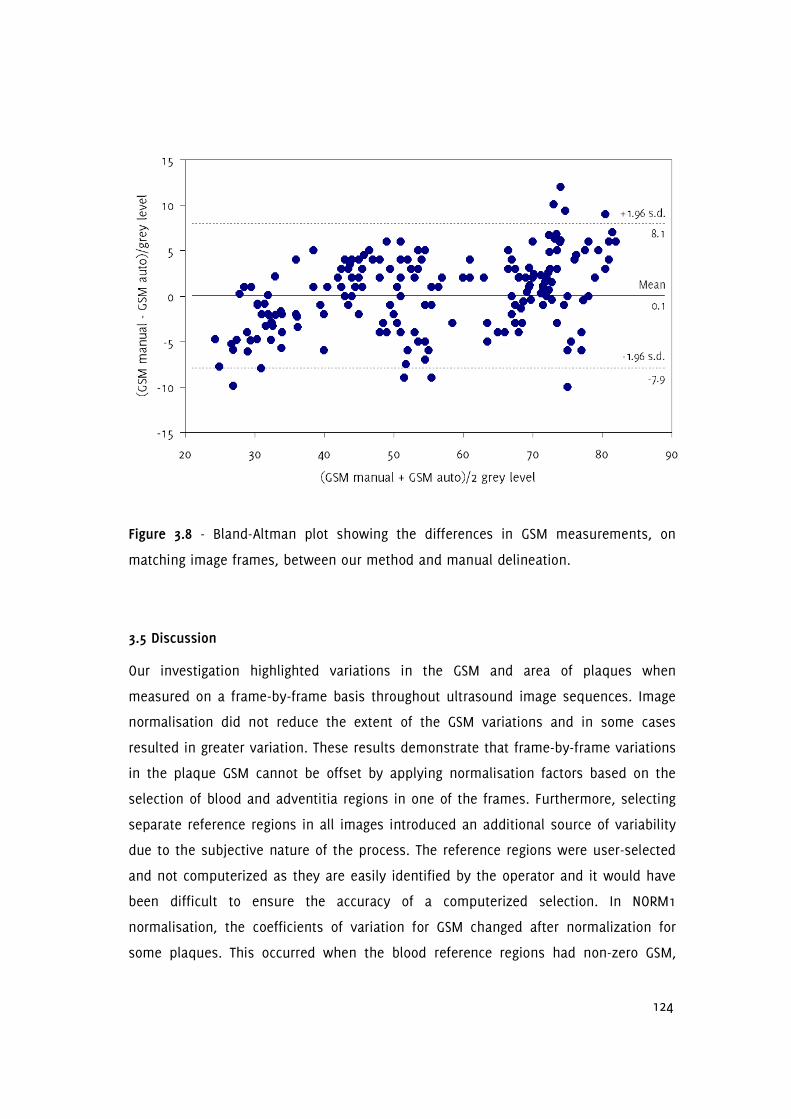
124
Figure 3.8 - Bland-Altman plot showing the differences in GSM measurements, on
matching image frames, between our method and manual delineation.
3.5 Discussion
Our investigation highlighted variations in the GSM and area of plaques when
measured on a frame-by-frame basis throughout ultrasound image sequences. Image
normalisation did not reduce the extent of the GSM variations and in some cases
resulted in greater variation. These results demonstrate that frame-by-frame variations
in the plaque GSM cannot be offset by applying normalisation factors based on the
selection of blood and adventitia regions in one of the frames. Furthermore, selecting
separate reference regions in all images introduced an additional source of variability
due to the subjective nature of the process. The reference regions were user-selected
and not computerized as they are easily identified by the operator and it would have
been difficult to ensure the accuracy of a computerized selection. In NORM1
normalisation, the coefficients of variation for GSM changed after normalization for
some plaques. This occurred when the blood reference regions had non-zero GSM,

125
causing an intercept to be introduced into the linear relationship between the
normalized and un-normalized greyscale values. Also, as GSM values are limited to the
range 0 to 255, normalization could result in the clipping of the GSM values outside
this range, thus affecting the coefficients of variation. The increased coefficient of
variation for GSM, in the case of the NORM2 normalisation, provided evidence that the
frame-by-frame variations seen in GSM were unlikely to be, at least significantly, due
to a general temporal variability in the overall image brightness.
The extent of the GSM variations seen in the study were similar in magnitude to those
reported by Elatrozy et al. [148] who found that, after normalisation, the coefficient of
variation among 4 different observers was 4.7% for the GSM of plaques. However, the
variations captured by that study did not include variations that may have been due
to the selection of different still images as each of the four observers appeared to
have used the same image to assess the GSM. Therefore, the true inter-observer
variabilities may have been greater than that suggested by the results of that study.
The findings of our study have two implications. First, in the case of studies which
have considered intra/inter-observer variabilities, the variabilities quoted may have
been under-estimated unless the inter-frame variations in the plaque GSM were taken
into account. Secondly and conversely, in the case of inter-session or across-study
variabilities of GSM measurements, some of these variabilities may have been due to
the selection of different image frames corresponding to the differences in the exact
cross-sections being imaged.
The variations seen in the plaque GSM and area may be due to a number of different
factors. While changes to the acquisition settings during a single acquisition would not
be expected, changes in the plaque GSM could occur, for example, if the distance
between the plaque and the transducer face changed during an acquisition. Patient or
probe motion may also change the location and orientation of the scan plane with
respect to the plaque being imaged, affecting both the measured GSM and the
observed cross-sectional area. These are likely to be significant contributors to the
variations seen in the GSM and area of plaques in this study. Deformation or
compression of the plaque under the pulse pressures may also cause changes in the

126
measured plaque GSM and cross-sectional area and the observation of periodical
variations with physiologically reasonable frequencies in the plaque GSM and area for
several of the plaques provided evidence to support this hypothesis. However, it
should be noted that such cyclic variations could also have been caused by periodic
variations in the scan plane location and orientation and due to out-of-plane plaque,
patient, or probe motion. The poor correlation between the inter-frame coefficients of
variation of GSM and plaque area suggested that at least some of the variations seen
in the plaque GSM were likely to have occurred due to factors other than changes in
the observed plaque area. This was also supported by the results of the regression
analysis, which did not highlight the parameters based on the plaque area as being
statistically significant contributors to the variabilities seen, across plaque samples, in
the extent of the inter-frame GSM variations.
Other factors that may have caused apparent changes in the plaque GSM and cross-
sectional area included unclear plaque boundaries (e.g. poor image quality or
substantial image noise), which may have caused fluctuations in the detected plaque
boundaries. However, the image sequences used in this study were of sufficiently
good quality that any variations due to such fluctuations were not thought to be major
contributors to the GSM variations observed.
The statistically significant difference found in the mean GSM of plaques in the
symptomatic and asymptomatic groups is in accord with previous findings that have
shown symptomatic plaques, in general, as having lower GSM values [129,131]. The
differences between the two groups in the case of the parameters describing the inter-
frame variations in the GSM were not statistically significant which was plausible as
out-of-plane plaque, patient, and probe motion appeared to be a significant sources of
variation for GSM measurements.
Manual delineation of the plaque boundaries separately for each image frame was
found to increase the extent of the frame-by-frame variations observed in the plaque
GSM and area (7.7% and 8.0%, respectively, compared with 5.4% and 4.0% for our
method) due to the greater subjectivity of the manual delineation process.

127
The main limitations of our study were the use of two dimensional ultrasound and the
absence of any attempts to fix the scan plane location and orientation with respect to
the plaque being imaged, other than those measures normally taken in the clinic (e.g.
holding the probe fixed and asking the patient to breath-hold and remain still). It
should be remembered that the method of ultrasound acquisition commonly used in
carotid plaque GSM studies, namely two dimensional ultrasound, provides only a cross
section of the whole plaque volume. Since the plaque GSM measured using two
dimensional techniques reflects only a cross-section, these measurements are
susceptible to variations due to out-of-plane plaque, probe and patient motion.
Studies incorporating three dimensional techniques may overcome this limitation and
enable further investigation of the nature of any intrinsic frame-by-frame variations in
the plaque GSM or volume. Such follow-up studies may also identify whether any
inter-frame variations seen in the GSM and volume of plaques can provide additional
insight into the ultrasound characterisation of carotid plaques, thus improving clinical
utility.
Another limitation of our assessment of the plaque GSM and cross-sectional area was
with regard to anechoic regions of plaques and regions of plaques in areas of acoustic
shadowing. These regions were excluded from analysis. The cross-sectional areas of
plaques that had such regions were, thus, under-estimated and neither the plaque
area nor the GSM reflected the true values. The excluded regions also had an effect on
the magnitude of the frame-by-frame variations that were measured for the affected
plaques. In the case of anechoic regions of plaques, the inclusion of the anechoic
regions would have increased the observed cross-sectional area, while reducing the
GSM and the magnitude of the GSM and area variations observed. However, the
reduction in the magnitude of the inter-frame GSM variations would have been only
because of the absence of echogenicity in these regions. In the case of the regions of
acoustic shadowing, these regions need to be excluded from analysis due to the
absence of plaque texture information resulting from acoustic shadowing. Although
colour Doppler is useful for subjectively defining the plaque-arterial lumen boundary,
it is not suitable for quantifying the plaque area throughout the cardiac cycle, since
colour filling of the lumen is dependent on blood flow velocity [231]. Nevertheless, our
results demonstrated that variations in the plaque GSM and cross-sectional area do

128
occur, in the visible parts of the plaques that were not in regions of acoustic
shadowing. Such variations are important as they could lead to an error in a potential
diagnostic test that uses the GSM as the selection criterion, particularly for plaques of
intermediate echogenicity where a coefficient of variation of 5% may provide enough
bias to move the plaque between high- and low-risk groups. Since the plaque GSM is
not generally used to inform clinical decision making, these variations do not currently
have a clinical impact. Nevertheless, they should be appreciated for research studies
which increasingly utilize the plaque GSM.
Our results did not find the plaque cross-sectional area to significantly affect the
extent of the frame-by-frame variations observed in the plaque GSM. A major source of
variation in the inter-frame plaque GSM may in fact be the movement of the plaque
cross-section with respect to the scan plane and this may be a bigger problem for
smaller plaques. However, our results showed that the observed GSM could vary on a
frame-by-frame basis substantially for large plaques as well the minor stenoses.
Since previous studies typically quantified GSM on single frames of ultrasound images,
the variations found in this study have been previously neglected. Improved attempts
to standardise GSM measurements and reduce variability between centres should
account for these findings, for example, by performing GSM measurements at peak
systolic/diastolic frames or by carrying out an assessment of the average GSM
throughout the cardiac cycle. Techniques such as GSM assessment using multiple
cross-sectional views of plaques can also be used to improve diagnostic accuracy
compared to a single view cross-sectional assessment. The best option would be to
carry out the assessment in three dimensions. However, three dimensional ultrasound
techniques are still under development and are not widely available. It should be
noted that we do not propose the technique we have used in our study as a
replacement for the existing methods but we highlight the variations in the plaque
GSM and cross-sectional area that may be observed on a frame-by-frame basis using
single-view, two dimensional ultrasound.

129
3.6 Conclusions
In conclusion, this investigation found that the GSM of carotid artery plaques can vary
when measured on a frame-by-frame basis throughout ultrasound image sequences.
These variations affect the reproducibility of studies and have implications for the use
of GSM as a predictor of cerebrovascular events. Future studies looking at the GSM of
carotid artery plaques may need to take these variations into consideration.

130
Chapter 4
Quantitative Assessment of Carotid Plaque Surface
Irregularities and Correlation to Cerebrovascular
Symptoms
4.1 Overview
Surface irregularities of plaques have long been thought to be potentially useful for
identifying vulnerability as it is expected that potentially vulnerable types of plaques
such as those with ulcerations or cap ruptures may present with irregular surfaces
when imaged using ultrasound (as well as angiography and other imaging modalities).
However, three drawbacks exist. First, surface irregularity assessments have been
performed on still images, ignoring any variations that may have been present on a
frame-by-frame basis. Secondly, the assessments have mainly been qualitative and
thus subjective. Thirdly, the scarce quantitative assessments have been based on
plaque surfaces manually outlined by the operator, thus introducing subjectivity into
the process, and potentially not capturing the full surface structure of the plaque,
particularly small fissures or surface disruptions. This chapter contributes to
knowledge by providing a novel quantitative method for studying plaque surface
irregularities, which is shown to have a significant correlation to symptoms, and
presenting the results of the first-ever quantitative study of surface irregularities
measured from image sequences in comparison to still image frames. A research
article based on the contents of this chapter has been published in Cardiovascular
Ultrasound [243].
4.2 Introduction
There is growing interest in using ultrasound images of the carotid artery to assess
plaque surface irregularities and use this as a surrogate marker of carotid plaque
ulceration and vulnerability. Previous studies have investigated plaque surface
irregularities using qualitative classification schemes such as smooth vs. irregular or
by using specific criteria for classifying ulceration [149,244-247]. Surface structure

131
determined from ultrasound images has been found to correlate, to some extent, with
surface structure found on angiography [248-249], intra-plaque haemorrhage [172],
CT/MRI-determined cerebral infarctions [250-253] and the incidence and presence of
cerebrovascular events and symptoms [158,172,180,200,248,250,253-254]. Ultrasound-
determined surface structure agreed with that found on surgical/autopsy specimens
with varying degrees of success [145,182-183,244-245,247,255-261]. A large, prospective
study found that the unadjusted, cumulative, 5-year risk of ischaemic stroke was 8.5%
when irregular plaques were seen on ultrasound, compared to 1.3% and 3.0% for no
plaque and smooth plaques, respectively [262].
Quantitative assessments of plaque surface irregularities may have benefits over
qualitative assessments, since they should be more operator-independent. Yet, even
with quantitative analyses, manual delineation of the plaque-arterial lumen boundary
on ultrasound images introduces some subjectivity into the process and is less likely
to capture small defects on the plaque surface. There have been only a few attempts
to quantify the surface irregularities of carotid artery plaques. Tegos et al. (263)
quantified surface irregularities by calculating the bending energy of the plaque
surface. However, plaque surfaces were manually outlined by the operator, and the
authors obtained similar bending energies for symptomatic and asymptomatic
plaques. More recent studies quantified plaque surface irregularities by measuring the
principal curvatures of plaque surfaces in 3 dimensions [264-265]; however, the
underlying 3-dimensional ultrasound techniques are still under development, and
more difficult to implement in the vascular clinic compared to 2-dimensional
techniques.
We hypothesized that an objective, quantitative measurement of carotid plaque
surface irregularities using 2-dimensional, cross-sectional ultrasound imaging would
correlate with the presence of ipsilateral hemispheric symptoms. This study defined a
novel surface irregularity index (SII) and investigated whether it enhances diagnostic
performance compared to the degree of stenosis of the carotid artery alone.

132
4.3 Methods
Thirty-two consecutive patients (20 males and 12 females) who attended the University
Hospitals of Leicester NHS Trust's Rapid Access Transient Ischaemic Attack (TIA) clinic
were recruited. The study was approved by the National Research Ethics Service (NRES)
Committee East Midlands - Northampton (reference 11/EM/0249), followed institutional
guidelines, and each patient gave informed consent before participating in the study.
Patients who did not have carotid stenoses were excluded from the study. In total,
surface irregularity indices of 47 carotid artery plaques (stenosis range 10%-95%) were
measured. Plaques were classified as either having caused ipsilateral hemispheric
cerebrovascular symptoms (i.e. symptomatic) or asymptomatic following specialist
medical review. Symptoms included aphasia, transient monocular blindness and
hemimotor/sensory symptoms consistent with transient ischaemic attack or stroke.
4.3.1 Data Acquisition
Longitudinal cross-sections of the carotid plaque were acquired by experienced
sonographers using a Philips iU22 ultrasound scanner (Philips Healthcare, Eindhoven,
The Netherlands) with an L9-3 probe. B-Mode (greyscale) and Colour Doppler image
sequences were recorded as DICOM files over an average of 5 cardiac cycles (mean
frame rate was 32 frames per second) using the vascular carotid preset on the scanner
(Vasc Car preset, persistence low, XRES and SONOCT on). Colour Doppler image
sequences were used as a qualitative aid to identifying the location and extent of the
plaques, and for qualitative assessments, while the greyscale data were used for the
quantitative analyses of plaque surface irregularities.
4.3.2 Data Analysis
Quantitative analyses were carried out using MATLAB version 7.14, release 2012a
(MathWorks, Natick, Massachusetts, USA) and employed a novel technique to track
plaques throughout ultrasound image sequences [238]. We measured plaque surface
irregularities using a novel surface irregularity index (SII) which was calculated by
computationally summing the angular deviations from a straight line, of the luminal
plaque surface, and dividing this by the length of the plaque surface. This measures

133
the degree of irregularity of the plaque surface as opposed to the previous methods
which calculated either the bending energy or the curvature of the plaque surface.
Although the latter two would be expected to relate to the degree of irregularity of the
plaque surface, they are not direct measures of surface irregularities. For example, in
the case of the curvature of the plaque surface, positive and negative curvatures can
have a cancelling effect, resulting in a zero curvature measurement for an irregular
plaque surface. Our surface irregularity index, on the other hand, directly measures
the irregularities, which are essentially deviations from a straight line, of the plaque
surface, and all irregularities add to the degree of irregularity measured.
The surface irregularity index was also combined with the degree of stenosis of the
corresponding artery by taking their product, resulting in a combined risk indicator.
The measurements were made without a priori knowledge of the patient symptomatic
status. Degrees of stenosis were measured using criteria consistent with the NASCET
method utilizing blood flow velocities in conjunction with the B-Mode and colour flow
imaging [38,47,240] and plaque SII measurements were averaged across all image
frames. As Doppler velocity measurements are not able to reliably discriminate
degrees of stenosis below 50%, we used B-Mode diameter measurements and colour
flow imaging to grade the degree of stenosis into deciles for minor stenoses. We
assessed the reproducibility of our surface irregularity measurements by calculating
the intra-observer and inter-frame variabilities. Intra-observer variabilities were
determined by measuring the surface irregularity indices of nine selected plaques five
times using the same carotid file-video for each plaque, respectively. The nine plaques
were selected from the available dataset to give a wide range of stenosis severity and
plaque echogenicity for reproducibility analysis. Inter-frame variabilities, on the other
hand, were assessed for all the plaques included in the study, to give a measure of
the magnitude of variations seen in the surface irregularity indices across image
frames. A qualitative assessment of plaque surface irregularities was also performed
by an experienced vascular scientist, off-line and blinded to patient clinical history,
classifying plaque surfaces as either smooth or irregular using the greyscale and
Colour Doppler images as a guide.

134
4.3.3 Statistical Methods
Statistical analyses were carried out using SPSS version 20 (IBM Corporation, Armonk,
New York, USA). The non-parametric Mann-Whitney U-test was used to determine
whether the surface irregularity indices differed significantly between the symptomatic
and asymptomatic plaque groups and those plaques qualitatively classified as having
an irregular or smooth surface. Kendall's tau was used to establish whether the SII, the
degree of stenosis, and the plaque area could be regarded as statistically independent
and Receiver Operating Characteristic (ROC) curves were used to investigate the
diagnostic performance of the plaque SII on its own and in combination with the
degree of stenosis. The correlation between the symptomatic and asymptomatic
plaque groups and the qualitative plaque surface assessment was performed using
Pearson's χ2.
4.4 Results
Twenty-four of the 47 plaques investigated were found to be not associated
symptoms, while the remaining 23 were found to have caused symptoms following
expert, specialist stroke physician assessment. The mean age of the symptomatic
patients was 75.3 years compared with 77.8 years for the asymptomatic (p>0.05, Mann-
Whitney test). None of the patient characteristics sex (20 males), current or past
tobacco smoking (63%), hypertension (63%), hypercholesterolaemia (53%), diabetes
mellitus (53%), ischaemic heart disease (38%), family history of stroke (34%), previous
TIA/stroke (44%), alcohol consumption (28%) and peripheral vascular disease (13%)
had a statistically significant relationship to the presence of symptoms (p>0.05 for all,
Pearson's χ2).
Examples of a symptomatic and an asymptomatic plaque, with their corresponding
surface irregularity measurements, are shown in Figure 4.1 and Figure 4.2. Across the
full data-set, the mean SII of symptomatic plaques was 1.89 radians/mm compared
with 1.67 radians/mm for the asymptomatic plaques. Plaque SII (p=0.03), the degree of
stenosis (p<0.01), and the product of the two (p<0.01) were all significantly higher in
symptomatic plaques compared with the asymptomatic (Figure 4.3). There was no

135
statistically significant relationship between the plaque surface irregularity index and
the degree of stenosis or the plaque area (p=0.30 for both, Figure 4.4).
Figure 4.1 - Two plaques of markedly different surface irregularity indices: (a) a
symptomatic plaque with an SII of 2.25 radians/mm; and (b) an asymptomatic plaque
with an SII of 1.57 radians/mm. The plaque surface is the boundary between the
plaque and the arterial lumen (where the purple and green dashed lines overlap). (a)
is also a plaque qualitatively classified as having an irregular surface, while (b) is a
plaque qualitatively classified as having a smooth surface.

136
Figure 4.2 - Full-size ultrasound images corresponding to the close-up plaque views
shown in Figure 4.1. The symptomatic plaque (top), and the asymptomatic plaque
(bottom).

137
Figure 4.3 - Distribution of plaque surface irregularity index (SII, left), degrees of stenosis (DOS, middle) and the product of the two
(right) among the symptomatic and asymptomatic plaque groups. Degrees of stenosis are given as degree of stenosis(%)/100% (i.e.
0.5 corresponds to 50%, etc.).

138
Figure 4.4 - Scatter plot of the plaque surface irregularity index versus the degree of stenosis of the corresponding artery (left) and
the plaque area (right), illustrating a lack of association between these parameters.

139
Figure 4.5 - Distribution of plaque surface irregularity index (SII) among the plaque
groups qualitatively classified as having an irregular or smooth surface.
Qualitatively, 27 of the 47 plaques were classified as having an irregular surface, and
20 were classified as being smooth. Figure 4.1 illustrates examples of plaques
qualitatively classified as having irregular and smooth surfaces. There were 11 smooth
and 13 irregular plaques in the asymptomatic group, and 9 smooth and 14 irregular
plaques in the symptomatic group. There was no statistically significant association
between the qualitative assessment of surface irregularities and the symptomatic
status (p=0.64). However, the SII of the plaques qualitatively classified as having an
irregular surface was significantly higher than those classified as having a smooth
surface (p=0.01, Figure 4.5).
Receiver operating characteristic (ROC) curve analysis showed that the SII could predict
the presence of ipsilateral hemispheric cerebrovascular symptoms with an accuracy of

140
66% (sensitivity 65%, specificity 67%) on its own and with an accuracy of 83%
(sensitivity 96%, specificity 71%) in combination with the degree of stenosis (Figure
4.6). The area under the ROC curve was largest for the product of the degree of
stenosis and the SII (0.866) compared to either the degree of stenosis (0.832) or the SII
on its own (0.687).
Our study of plaque SII measurement reproducibility showed a mean intra-observer
coefficient of variation of 4.4%. The mean intra-observer, inter-frame coefficient of
variation was 10.6%.
Figure 4.6 - Comparison between Receiver Operating Characteristic curves for the
plaque surface irregularity index (SII), the degree of stenosis (DOS) and their product
(DOS×SII).

141
4.5 Discussion
This chapter defined a novel ultrasound plaque surface irregularity index which was
found to have potential clinical value for improving the identification of the vulnerable
carotid plaque. Ultrasound imaging provides a convenient and non-invasive means of
assessing the carotid plaque. Of the characteristics of plaques that can be assessed
using ultrasound, plaque surface structure is an interesting potential candidate for
inclusion in a stroke risk model. However, there are two major practical problems with
the ultrasound assessment of plaque surface structure. First, an irregular surface
observed on ultrasound does not necessarily indicate an ulcerated or compromised
plaque surface. Barry et al. [182], for example, found that false ultrasound diagnoses
of ulceration could be due to culs-de-sac or pits in fibrotic tissue that look like ulcers.
Secondly, ulcerations or surface defects may not always be detected, particularly in
cross-sectional, 2-dimensional ultrasound imaging. This is due to the limited coverage
of 2-dimensional ultrasound. Furthermore, small ulcerations or surface defects may
not be revealed if these are smaller than the resolution of the ultrasound imaging
system. Despite these difficulties, it is reasonable to expect potentially vulnerable
types of plaque, such as plaques with ulcerations or plaques for which the surface
integrity has been compromised, to exhibit greater irregularity in general. Irregular
plaques could also potentially lead to more disturbed blood flow patterns with local
high- and low-velocity flow regions and subsequent increases in plaque stress and
increased risks of thrombosis, respectively. We should therefore expect an assessment
of the surface irregularities of plaques to bring useful information that relates to
plaque vulnerability. However, in a small cohort of patients, a strong correlation to
symptoms should not be expected for the surface irregularities on their own, since it
is an assessment only of the surfaces of plaques and surface irregularities may or may
not be indicative of ulcerations and other surface defects.
In our study, we measured the surface irregularities of plaques in an objective manner
and found that these quantitative measurements correlated with a qualitative
assessment of surface irregularities. A correlation between surface irregularities and
ipsilateral hemispheric symptoms was found for the novel quantitative method but not

142
for the qualitative measure. The absence of a correlation in the case of the qualitative
assessment can be attributed to the increased subjectivity of qualitative measures
which may render a weak correlation to symptoms undetectable. The subjectivity of
the qualitative assessment is most apparent with plaques that cannot be classified as
smooth or irregular with any certainty. In such cases, the assessor may make a highly
subjective decision to place the plaque in one or the other group. The alternative is to
mark such plaques as having an indeterminate surface characteristic and therefore
unclassified.
We found that the combination of the plaque surface irregularity index with the degree
of stenosis of the corresponding artery resulted in a more effective diagnostic test
compared to the degree of stenosis on its own. This indicates that the objective study
of plaque surface irregularities may provide useful additional information for predicting
the presence of cerebrovascular symptoms. There was no significant correlation
between the plaque SII and the degree of stenosis in our assessment, indicating that
the former may provide information that is complementary to the latter.
Our surface irregularity index was combined with the degree of stenosis of the
corresponding artery as the latter is an established parameter widely used in clinical
practice and associated with an increased risk of cerebrovascular events. We took the
product of the two parameters since the presence of ipsilateral hemispheric symptoms
was directly related to both the degree of stenosis and the surface irregularity index.
Our study found that combining the surface irregularity index with the degree of
stenosis results in a more effective risk indicator than the degree of stenosis on its
own.
The measurement technique we used had good reproducibility. The intra-observer
variations were due to the human operator involvement required for the initial setup
of the boundary detection procedure that resulted in the semi-automatic delineation of
the plaque-arterial lumen boundaries, while the inter-frame variations were probably
chiefly due to out-of-plane plaque, patient, and probe motion.

143
Further work can be directed towards studying the surface irregularities of plaques
taking into account the echogenicity characteristics local to the surface. This would be
useful as it may be more likely for surface irregularities to correspond to surface
defects such as ulcerations or haemorrhages if the plaque has a less echogenic
pattern (e.g. a ruptured fibrous cap or a haemorrhage) compared to being highly
echogenic (e.g. fibrous or calcified). The variation of surface irregularities across
plaque surfaces should also be explored in a follow-up study since plaque surfaces
may contain both smooth and rough segments and their distribution may provide
useful additional information that relates to plaque vulnerability.
4.6
Conclusions
This chapter has shown that an objective assessment of plaque surface irregularities
using a novel surface irregularity index may correlate with the presence of ipsilateral
hemispheric cerebrovascular symptoms. We found an increase in diagnostic
performance with the use of the plaque SII versus that provided by the degree of
stenosis alone. Plaque SII may therefore be a valuable tool for improving risk
assessment, by helping to identify the vulnerable plaques in patients with carotid
artery disease. The potential clinical value of this parameter should be explored in
follow-up studies.

144
Chapter 5
Wall Motion in the Stenotic Carotid Artery: Association
with Greyscale Plaque Characteristics, the Degree of
Stenosis and Cerebrovascular Symptoms
5.1 Overview
Wall motion characteristics of the stenotic carotid artery may be potentially useful for
identifying carotid plaques at risk of rupture since large motions could increase the
mechanical stress on the plaque while smaller motions could be indicative of
progressive atherosclerotic disease of the arterial wall, which is known to cause the
arterial wall to stiffen. Our contributions to knowledge in this chapter include the
study of correlation between the wall motion characteristics of the stenotic carotid
artery and greyscale plaque characteristics such as the plaque greyscale median and
the surface irregularity index. A research article based on the contents of this chapter
has been published in Cardiovascular Ultrasound [266].
5.2 Introduction
Patients attending transient ischaemic attack (TIA) clinics often undergo ultrasound
imaging of their carotid arteries, during which the presence of any atherosclerotic
plaques are noted and the corresponding degrees of stenosis are measured. The
degree of stenosis is used routinely in clinical practice. However, there is growing
demand for additional parameters which can further differentiate high-risk or
vulnerable plaques, particularly in those with low to moderate degrees of stenosis.
Studies have found that plaque composition in patients undergoing carotid
endarterectomy is an independent predictor of future cardiovascular events with
plaque neovascularisation and haemorrhage relating to adverse cardiovascular
outcome during follow-up [65]. Greyscale plaque characteristics, such as the plaque
greyscale median (GSM) and surface irregularities also have the potential to be
additional indicators of vulnerable plaques [51,129,131,134-135,140,238,243,262].
Ultrasound assessment of the mechanical properties of the carotid plaque using

145
shearwave elastography is an emerging technique that may also provide additional
benefit [267]. Another potentially useful parameter which can be easily measured from
ultrasound scans performed in the TIA clinic is the systolic dilation or distension of the
artery with the atherosclerotic plaque. The dilation of the carotid artery from diastole
to systole depends on several factors including arterial stiffness, and previous studies
have shown that stiffer arteries are associated with atherosclerosis and are risk factors
for stroke and other cardiovascular diseases [268-271]. The amount of arterial dilation
is a physical parameter that may also affect the stability of the plaque, since greater
arterial motion may increase the mechanical stress on the plaque and promote
instability [197,200,272-274].
The presence of the atherosclerotic plaque can have a significant effect on arterial wall
motion [275-276]. One study found that arterial distensibility was not only significantly
lower in the internal carotid artery where there was a plaque, but it was also lower in
the common carotid artery of the affected side in comparison with the contralateral
common carotid artery, providing evidence that the effect of a plaque on arterial
mechanical properties is not limited to the actual plaque site but rather extends to a
considerable degree in a proximal direction [275]. Computational models, on the other
hand, showed that the non-uniform thickness of the diseased arterial wall can restrict
wall motion and re-distribute stress, giving rise to increased stress concentrations at
the plaque shoulders [276]. Therefore, an assessment of the wall motion characteristics
of the stenosed carotid artery may provide useful indicators that correlate with the
risk of plaque rupture and the prevalence of symptoms.
A previous study found that patients with acute symptomatic carotid stenosis had
impaired brachial artery flow mediated dilation (FMD) compared to patients with
asymptomatic carotid stenosis in a patient population with greater than 50% reduction
in the diameter of the carotid artery [277]. That study showed that impaired brachial
FMD was an independent predictor of cerebral ischaemic symptoms. However, not
many studies have considered whether the physiological dilation of the stenosed
carotid artery itself might have any correlation to cerebrovascular symptoms,
addressing the question of whether patients presenting with ipsilateral hemispheric
symptoms have distinctly different carotid artery dilations compared to patients that

146
do not. A study by Ramnarine et al. (97) looked at the physiological dilation of
atherosclerotic carotid arteries and correlated results with the degree of stenosis, but
any relationships to the presence of patient symptoms were not investigated. Another
study examined the dilation characteristics of the carotid artery at the level of the
plaque and compared this with the adjacent common carotid artery leading to a
longitudinal strain gradient estimation, but again, any relationships to the presence of
patient symptoms were not studied [278]. More recently, Beaussier et al. (279) studied
the longitudinal distension gradient between the plaque and the adjacent common
carotid artery with respect to the presence of ipsilateral hemispheric symptoms and
found no statistically significant differences. However, their results do not appear to
indicate whether there were any significant differences in the degree of arterial
dilation at the adjacent carotid segment between the symptomatic and asymptomatic
groups. That particular study also involved only a small number of carotid arteries with
ipsilateral symptoms (n=9).
It is plausible that wall motion in the stenotic carotid artery may affect the stability of
the carotid plaque and consequently, relate to the presence of ipsilateral hemispheric
symptoms. Wall motion data along with the degree of stenosis and greyscale plaque
characteristics may therefore help identify the vulnerable plaque. The purpose of this
study was to test the hypothesis that the systolic dilation of the stenosed carotid
artery is related to the presence of ipsilateral hemispheric symptoms and can be used
to differentiate between symptomatic and asymptomatic patients. Arterial wall motion
was measured before the proximal shoulder of the plaque as this is an ideal,
upstream location close to the plaque where a well defined segment of the artery can
often be found. The latter is important because arterial wall motion measurements
across the plaque can suffer from high variability [97]. Our investigation measured the
absolute and percentage dilation of stenotic carotid arteries, from end diastole to peak
systole, and explored whether these parameters had any statistically significant
associations to the degree of stenosis, greyscale plaque characteristics, and the
presence of ipsilateral hemispheric symptoms.

147
5.3 Methods
Forty seven patients who attended the University Hospitals of Leicester NHS Trust's
Rapid Access Transient Ischaemic Attack clinic were recruited. Variations in the lumen
diameters of 61 stenotic carotid arteries (stenosis range 10%-95%) were measured. The
study was approved by the National Research Ethics Service (NRES) Committee East
Midlands - Northampton (reference 11/EM/0249) and followed institutional guidelines.
Each patient gave informed consent before participating in the study. Patients who did
not have carotid artery stenosis were excluded from the study. Carotid arteries for
which the ultrasound image quality was poor were excluded from the wall motion
analysis. Image sequences which were considered to be of poor quality included those
with substantial image noise in the vessel lumen and those with poorly defined vessel
wall segments. In the case of patients with stenosed left/right carotid arteries, each
side was included and analyzed separately. In total, lumen diameter variations of 45
stenosed carotid arteries were included in the final wall motion analysis. Carotid
arteries with atherosclerotic plaque were classified as either having ipsilateral
hemispheric cerebrovascular symptoms (i.e. symptomatic) or asymptomatic following
specialist medical review. Symptoms included aphasia, transient monocular blindness
and hemimotor/sensory symptoms consistent with transient ischaemic attack or
stroke.
5.3.1 Data Acquisition
Longitudinal cross-sections of the carotid artery and plaque were imaged by
experienced sonographers using a Philips iU22 ultrasound scanner (Philips Healthcare,
Eindhoven, The Netherlands) and an L9-3 probe. Acquisitions included B-Mode (i.e.
greyscale) and Colour Doppler image sequences. B-Mode image sequences were
acquired using the vascular carotid preset on the scanner (Vasc Car preset, persistence
low, XRES and SONOCT on) and were recorded in DICOM format over an average of 6
cardiac cycles (mean frame rate was 32 frames per second). Gain was optimized by
the experienced sonographers. In the case of B-Mode acquisitions, the greyscale
transfer curve was set to Gray Map 2, as this was reported to be the most linear
transfer curve on this scanner [241]. Colour Doppler cine-loops were used as a
qualitative aid to identifying the location and extent of carotid plaques, while the B-
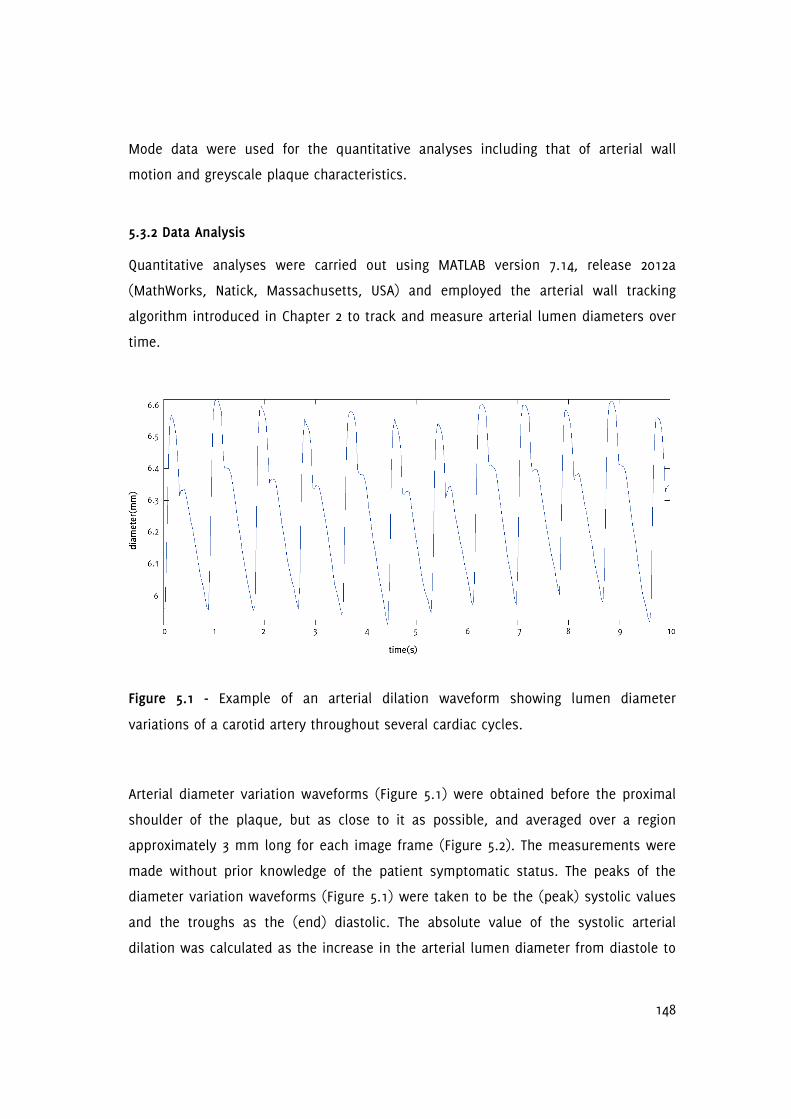
148
Mode data were used for the quantitative analyses including that of arterial wall
motion and greyscale plaque characteristics.
5.3.2 Data Analysis
Quantitative analyses were carried out using MATLAB version 7.14, release 2012a
(MathWorks, Natick, Massachusetts, USA) and employed the arterial wall tracking
algorithm introduced in Chapter 2 to track and measure arterial lumen diameters over
time.
Figure 5.1 - Example of an arterial dilation waveform showing lumen diameter
variations of a carotid artery throughout several cardiac cycles.
Arterial diameter variation waveforms (Figure 5.1) were obtained before the proximal
shoulder of the plaque, but as close to it as possible, and averaged over a region
approximately 3 mm long for each image frame (Figure 5.2). The measurements were
made without prior knowledge of the patient symptomatic status. The peaks of the
diameter variation waveforms (Figure 5.1) were taken to be the (peak) systolic values
and the troughs as the (end) diastolic. The absolute value of the systolic arterial
dilation was calculated as the increase in the arterial lumen diameter from diastole to

149
systole and percentage systolic dilation as the same figure divided by the diastolic
diameter. The same calculations were carried out for all the cardiac cycles observed on
the arterial diameter variation waveforms and averages were calculated. Normalized
and un-normalized plaque GSM and surface irregularity indices (SII) were obtained
using previously described methods [238,243] while the degree of stenosis of the
corresponding arteries were measured using criteria consistent with the NASCET
method utilizing blood flow velocities in conjunction with the B-Mode and colour flow
imaging [38,47,240].
5.3.3 Statistical Analysis
Statistical analyses were carried out using SPSS version 20 (IBM Corporation, Armonk,
New York, USA). The non-parametric Wilcoxon-Mann-Whitney test was used to
determine whether quantitative measurements such as the absolute and percentage
diameter changes, degree of stenosis, and greyscale plaque characteristics differed
significantly between patient groups (e.g. symptomatic/asymptomatic,
hypertensive/normotensive, etc.). A further ANCOVA test was carried out between the
percentage systolic dilation of the artery and symptomatic status, controlling for the
effects of the diastolic arterial diameter. Pearson's correlation was used to determine
whether the absolute and percentage diameter changes had any statistical relationship
to the age of the patient, the degree of stenosis, and the greyscale plaque
characteristics. Partial correlations, controlling for the effects of the baseline diastolic
diameters, were also carried out for the percentage diameter changes. Finally, logistic
regression was carried out to investigate which parameters significantly correlated
with the presence of ipsilateral hemispheric symptoms. Two-tailed values of
significance were used and p-values less than 0.05 were considered to be statistically
significant.

150
Figure 5.2 - A carotid bifurcation plaque and illustration of the location of the diameter
measurements. In this case, the plaque appears at the carotid bulb, and diameter
measurements are taken in the distal common carotid artery immediately before the
proximal shoulder of the plaque.
5.3.4 Reproducibility
In order to assess the reproducibility of the arterial wall motion detection technique
used, we investigated the intra-observer coefficients of variation for the measurement
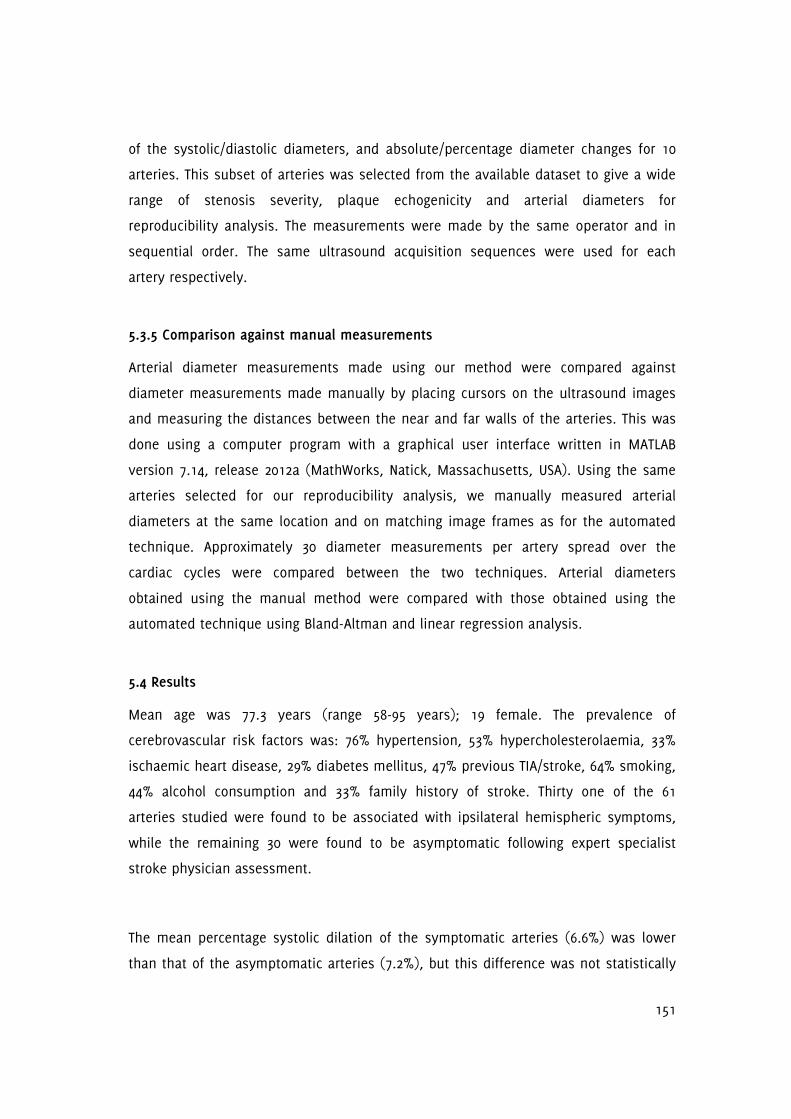
151
of the systolic/diastolic diameters, and absolute/percentage diameter changes for 10
arteries. This subset of arteries was selected from the available dataset to give a wide
range of stenosis severity, plaque echogenicity and arterial diameters for
reproducibility analysis. The measurements were made by the same operator and in
sequential order. The same ultrasound acquisition sequences were used for each
artery respectively.
5.3.5 Comparison against manual measurements
Arterial diameter measurements made using our method were compared against
diameter measurements made manually by placing cursors on the ultrasound images
and measuring the distances between the near and far walls of the arteries. This was
done using a computer program with a graphical user interface written in MATLAB
version 7.14, release 2012a (MathWorks, Natick, Massachusetts, USA). Using the same
arteries selected for our reproducibility analysis, we manually measured arterial
diameters at the same location and on matching image frames as for the automated
technique. Approximately 30 diameter measurements per artery spread over the
cardiac cycles were compared between the two techniques. Arterial diameters
obtained using the manual method were compared with those obtained using the
automated technique using Bland-Altman and linear regression analysis.
5.4 Results
Mean age was 77.3 years (range 58-95 years); 19 female. The prevalence of
cerebrovascular risk factors was: 76% hypertension, 53% hypercholesterolaemia, 33%
ischaemic heart disease, 29% diabetes mellitus, 47% previous TIA/stroke, 64% smoking,
44% alcohol consumption and 33% family history of stroke. Thirty one of the 61
arteries studied were found to be associated with ipsilateral hemispheric symptoms,
while the remaining 30 were found to be asymptomatic following expert specialist
stroke physician assessment.
The mean percentage systolic dilation of the symptomatic arteries (6.6%) was lower
than that of the asymptomatic arteries (7.2%), but this difference was not statistically

152
significant (p=0.16, Figure 5.3). ANCOVA, controlling for the effects of the diastolic
diameters, also found the same difference to be not statistically significant (p=0.14).
Arteries with ipsilateral hemispheric symptoms also had lower absolute diameter
changes on average (0.42 mm) than asymptomatic arteries (0.47 mm) but this
difference was also not significant (p=0.17, Figure 5.3). The degree of stenosis (p<0.01),
normalized plaque GSM (p=0.021) and the plaque surface irregularity index (p=0.016)
differed significantly between the symptomatic and asymptomatic groups while the
un-normalized plaque GSM (p=0.14) did not.

153
Figure 5.3 - Box and whisker plots showing the distribution, versus the presence of ipsilateral hemispheric symptoms, of the absolute
and percentage arterial diameter changes, degree of stenosis, normalized and un-normalized plaque GSM, and the surface
irregularity index (SII).

154
Figure 5.4 - Box and whisker plots showing the distribution of the percentage systolic diameter changes versus patient
characteristics.

155
The patient characteristics age, sex, hypertension, high cholesterol, ischaemic heart
disease, diabetes mellitus, previous TIA/stroke, smoking, alcohol consumption, and
family history of stroke did not show significant differences in the percentage and
absolute systolic dilation of the arteries (Table 5.1, Figure 5.4, Figure 5.5). There were
no statistically significant correlations between the percentage systolic dilation of
arteries and the degree of stenosis (p=0.82), patient age (p=0.14), un-normalized
plaque GSM (p=0.29), normalized plaque GSM (p=0.34) or the plaque surface
irregularity index (p=0.54, Figure 5.6). Partial correlations, adjusting for the effects of
the baseline diastolic diameters, also found no statistically significant relationship
between the percentage systolic dilation of the arteries and the degree of stenosis,
patient age, or the greyscale plaque characteristics (p>0.05 for all). Absolute diameter
changes were also not significantly correlated with the degrees of stenosis (p=0.70),
patient age (p=0.68), un-normalized plaque GSM (p=0.78), normalized plaque GSM
(p=0.69) or the plaque surface irregularity index (p=0.90, Figure 5.6).
Logistic regression testing found only the degree of stenosis, normalized plaque GSM
and the surface irregularity index to be significant predictors of the presence of
ipsilateral hemispheric symptoms (Table 5.2). The un-normalized plaque GSM was not
found to have a significant correlation to symptoms.
Our assessment of reproducibility showed mean intra-observer coefficients of variation
of 1.0%, 1.2%, 11.7%, and 12.4% for the measurement of the systolic diameters,
diastolic diameters, absolute systolic diameter changes, and percentage diameter
changes, respectively. Comparison against manual measurements showed a mean
difference in diameter measurements between the two techniques of -0.016 mm
(Figure 5.7) which did not differ significantly from zero (p=0.06, t-test). The 95% limits
of agreement were -0.29 mm to 0.26 mm. Linear regression analysis showed a strong
correlation between the measurements made using the two methods (R2=0.97, Figure
5.8).

156
Figure 5.5 - Box and whiskers plots showing the distribution of the absolute systolic diameter changes versus patient characteristics.

157
Figure 5.6 - Scatter plots of the absolute and percentage systolic diameter changes versus patient age, degree of stenosis, un-
normalized and normalized plaque GSM, and the plaque surface irregularity index (SII), illustrating a lack of association between the
absolute and percentage systolic dilation of arteries and any of these parameters.
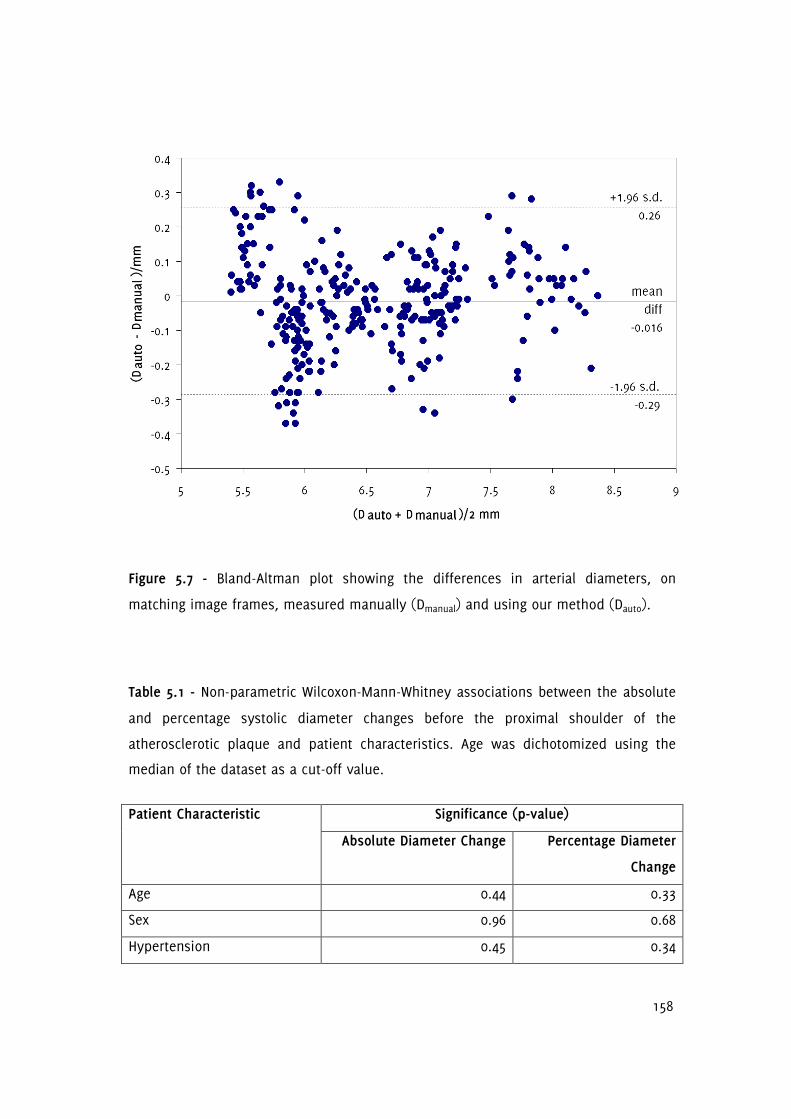
158
Figure 5.7 - Bland-Altman plot showing the differences in arterial diameters, on
matching image frames, measured manually (Dmanual) and using our method (Dauto).
Table 5.1 - Non-parametric Wilcoxon-Mann-Whitney associations between the absolute
and percentage systolic diameter changes before the proximal shoulder of the
atherosclerotic plaque and patient characteristics. Age was dichotomized using the
median of the dataset as a cut-off value.
Significance (p-value) Patient Characteristic
Absolute Diameter Change Percentage Diameter
Change
Age 0.44 0.33
Sex 0.96 0.68
Hypertension 0.45 0.34

159
Significance (p-value) Patient Characteristic
Absolute Diameter Change Percentage Diameter
Change
Hypercholesterolaemia 0.54 0.41
Ischaemic Heart Disease 0.94 0.90
Diabetes Mellitus 0.31 0.28
Previous TIA/stroke 0.16 0.32
Smoking 0.34 0.49
Alcohol 0.29 0.47
Family history of stroke 0.35 0.41
Figure 5.8 - Scatter plot showing a strong linear relationship between arterial diameters
measured manually (Dmanual) and using our method (Dauto).

160
Table 5.2 - Logistic regression testing for any association between the presence of
ipsilateral hemispheric symptoms and the degree of stenosis, greyscale plaque
characteristics and the absolute and percentage dilation of the arteries. Significant
associations are marked with an asterisk (*).
Parameter Significance (p-value)
Degree of stenosis 0.01*
Percentage systolic diameter change 0.20
Absolute systolic diameter change 0.10
GSM 0.09
GSM (normalized) 0.02*
SII 0.02*
5.5 Discussion
This chapter provides new data on wall motion in atherosclerotic carotid arteries and
the association with cerebrovascular symptoms, the degree of stenosis, and greyscale
plaque characteristics. These data may also be useful for informing computational
models of carotid stenosis [280] and experimental phantom replicas [281-282],
especially considering the scarcity of distension measurements immediately before the
proximal shoulder of the carotid plaque.
One motivation for our study was the plausibility of a relationship between the
diastolic to systolic dilation of the carotid artery and the presence of cerebrovascular
symptoms, since changes in arterial wall motion behaviour may be indicative of
vascular disease and aging, both of which are risk factors for stroke [268-269,283].
However, our study found no significant relationship between the absolute and
percentage dilation of the carotid artery before the proximal shoulder of the
atherosclerotic plaque and the presence of cerebrovascular symptoms. Diameter
changes were also not significantly correlated with the degree of stenosis, in
accordance with our previous findings [97].

161
Arteries which have greater amounts of wall motion may increase plaque vulnerability
due to mechanical factors [272-274]. Therefore, with progressive atherosclerotic
disease, while the risk of stroke may be raised on a systemic level, a reduction in the
amount of arterial wall motion may result in a lower risk of plaque rupture from a
mechanical perspective. These considerations complicate the relationship between the
dilation characteristics of the carotid artery before the proximal shoulder of the
atherosclerotic plaque and the presence of cerebrovascular symptoms, and are likely
to be factors that contribute to the absence of a difference in the carotid artery
dilations of the symptomatic and asymptomatic patients found in this study.
Arterial lumen diameters measured using our technique were found to be comparable
to those measured using a manual method. Our study found good reproducibility for
the measurement of the diastolic and systolic diameters but lower reproducibility for
the measurement of the absolute and percentage diameter changes. These results are
in accordance with previous studies which found derived parameters combining the
systolic and diastolic arterial diameters to be considerably less reproducible than the
diameter readings on their own [284-285]. It has been reported that even a small
variance in arterial diameter measurements may cause a considerable variance in the
derived metrics of carotid distension, therefore limiting its potential usability in the
clinical setting [285]. Godia et al. attributed the different and sometimes conflicting
results reported on the association between carotid distension and cardiovascular
outcomes to this variability [285]. In the present study, the greater variabilities
associated with absolute and percentage diameter changes may be additional factors
contributing to the absence of a difference found in the carotid artery dilations of
symptomatic and asymptomatic patients. Studies incorporating larger datasets or more
precise methods may be able to find such a difference.
The statistically significant relationship between the presence of ipsilateral
hemispheric symptoms and both the normalized plaque GSM and the surface
irregularity index confirm our previous findings [238,243]. Interestingly, the un-
normalized plaque GSM was not found to be a significant predictor of symptoms. This
may be indicative of variations in overall image brightness, due to differences in

162
ultrasound gain settings or tissue attenuation, and highlights the importance of the
normalization procedure for GSM measurements.
A limitation of this study is that we did not have pulse pressure measurements which
would have allowed us to quantify arterial distensibility. However, this study focussed
on motion aspects rather than stiffness and is part of our broader research aim to
develop and define a plaque risk index based on ultrasound measurements.
Previously, we have quantified greyscale plaque characteristics such as the plaque
GSM and surface irregularities [238,243] as possible indicators of vulnerable plaques
and the present study was conducted to investigate the potential of dilation
characteristics before the proximal plaque shoulder as an additional parameter to
include in a prospective vulnerable plaque-stroke risk model. In this study we did not
perform measurements across the plaque to assess any differential wall motion
between the plaque and the proximal carotid segment. Our previous study using
Tissue Doppler Imaging (TDI) demonstrated a variety of pertinent wall motion features
across the plaque site that may be related to the biophysics of arterial disease.
However, high variability demonstrated the limitations of arterial wall motion
measurements across the plaque, in contrast to more robust measurements that can
be performed on well defined segments of vessels [97].
5.6 Conclusions
In this chapter we investigated the systolic dilation of stenosed carotid arteries
measured before the proximal shoulder of the atherosclerotic plaque. Absolute and
percentage diameter changes were lower for the arteries of patients with ipsilateral
hemispheric symptoms, but these differences were not statistically significant.
Normalized plaque GSM and our novel surface irregularity index were found to be
significant predictors of symptoms.

163
Chapter 6
Quantitative Assessment of Plaque Motion in the Carotid
Arteries using B-Mode Ultrasound
6.1 Overview
This chapter describes a quantitative assessment of carotid artery plaque motion using
B-Mode ultrasound. It contributes to knowledge by extending the study of plaque
motion to a wider range of stenosis severity (10-95%), compared with the existing
literature, and investigating the physical accelerations of plaques. Motion of 81 carotid
artery plaques from 51 patients were investigated, relative to the ultrasound probe
and relative to the tissues directly underlying the plaque. An in vitro study was also
carried out, assessing the motion of a test object, comprising tissue mimicking
materials, controlled by a programmable actuator device. The latter study validated the
motion assessment and demonstrated a lack of motion detection below a
displacement of 50 µm, and greater measurement error in the range 50 to 100 µm,
compared with the range 200 to 500 µm.
6.2 Introduction
Ultrasound imaging is routinely used to assess atherosclerotic plaques in the carotid
arteries. Although the processes increasing plaque vulnerability are not fully
understood, it is thought that physical motion due to blood flow may play a part,
contributing to plaque rupture and subsequent thromboembolisation [60-61,286-287].
Plaque motion [61,197-198,200] and plaque strain [37,93-94] due to blood flow have
been previously studied, though the literature is relatively scarce [272]. Previous
studies of plaque motion using ultrasound have employed both qualitative and
quantitative methods, and some studies reported motion analysis to be potentially
useful for identifying the vulnerable carotid plaque [61,185,197-198,200,273-274,288-
290]. Although there have been attempts to improve tracking accuracy by using refined
methods such as adaptive block matching, sub-pixel interpolation, optical flow and the
use of radiofrequency ultrasound data, the limitations arising from the restricted

164
spatial resolution of the imaging system have been largely overlooked [197,289]. Poor
reproducibility has been reported before [201], but the extent to which this may be
due to the motion magnitudes being lower than those that can be resolved by
ultrasound imaging equipment needs further investigation. This chapter explores
carotid plaque motion relative to the ultrasound probe (bulk motion) and relative to
the tissues directly underlying the plaque (discrepant motion), investigating any
relationships between the motion parameters and the degree of stenosis, greyscale
plaque characteristics, and the presence of cerebrovascular symptoms.
6.3 Methods
Fifty one patients (61% male, age range 58-95 years) who attended the University
Hospitals of Leicester NHS Trust's Rapid Access Transient Ischaemic Attack (TIA) clinic
were recruited for this study. The study was approved by the National Research Ethics
Service (NRES) Committee East Midlands - Northampton (reference 11/EM/0249) and
followed institutional guidelines. Patients gave written, informed consent before
participating in the study. Ultrasound image sequences of the carotid plaque in
longitudinal cross-section were acquired by experienced sonographers using a Philips
iU22 ultrasound scanner (Philips Healthcare, Eindhoven, The Netherlands) and an L9-3
probe. B-Mode (greyscale) image sequences were recorded as DICOM files over an
average duration of 5.6 seconds (mean frame rate was 32 frames per second) using
the vascular carotid preset on the scanner (Vasc Car preset, persistence low, XRES and
SONOCT on). Motion analysis was carried out for 81 plaques (stenosis range 10-95%).
Each plaque was classified as either having caused cerebrovascular symptoms relating
to the ipsilateral brain hemisphere within the past six-month period (i.e. symptomatic)
or as asymptomatic following specialist medical review.
6.3.1 In Vitro Study
Laboratory experiments were carried out using an actuator device that generated
programmable and repeatable periodic displacements of a tissue mimicking material
(TMM). The specifications of this precision lead-screw-based linear actuator (T-LA-28S,
Zaber Technologies Inc, Richmond, British Columbia, Canada) indicated a typical linear
displacement accuracy of 8 µm and a precision of 0.3 µm. The actuator movement was

165
controlled by a desktop computer through the RS-232 interface and was programmed
to produce a more rapid displacement of the posterior wall away from the probe
(downward) compared to the displacement towards to probe (upward) in order to
mimic the rapid dilation of the carotid artery during systole compared to the less rapid
relaxation during diastole [266]. The actuator moved a 4 cm diameter Perspex plate
cut-out that formed part of the bottom of a water tank. The bottom was covered with
a watertight latex membrane sealed with silicone, which allowed vertical movement of
the Perspex plate by the actuator. A test object made of a rectangular block of TMM
was placed on the Perspex plate and used for motion analysis. The TMM used was an
agar-based formulation, which had good acoustic properties and met the requirements
of the IEC 1685 draft report [291-292]. The composition (by weight) was 82.97% water,
11.21% glycerol, 0.46% benzalkoniumchloride, 0.53% SiC powder (400 grain, Logitec
Ltd., Glasgow, UK), 0.94% Al2O3 powder (3 µm, Logitec), 0.88% Al2O3 powder (0.3 µm,
Logitec), and 3.00% agar (Merck Eurolab). The TMM was prepared by heating the
ingredients to 96oC (±3
oC) for 1 hour using a double boiler whilst stirring continuously
with a motorised stirrer. The mixture was then allowed to cool down to 42oC and cast
into shape. DICOM image sequences were recorded with the actuator set to produce
maximum displacements of 5, 10, 20, 50, 100, 200 and 500 µm (Figure 6.1).
6.3.2 Quantitative Analysis
Quantitative analyses were carried out using MATLAB version 7.14 (MathWorks, Natick,
Massachusetts, USA) and SPSS version 20 (IBM Corporation, Armonk, New York, USA).
The degree of carotid artery stenosis (DOS) was measured using criteria consistent
with the NASCET method utilizing blood flow velocities in conjunction with the B-Mode
and colour flow imaging [38,47,240]. Normalized plaque greyscale median (GSM) and
surface irregularity index (SII) were measured using previously described methods
[238,243] and were averaged over all the ultrasound image frames acquired for each
artery.

166
Figure 6.1 - A still frame from an image sequence of the tissue mimicking material
(TMM) with the actuator set to produce a maximum of 500 µm displacement from the
initial position. Red arrows show the local TMM displacement at time t relative to the
position at frame 1, magnified by a factor of 10. White arrow shows the TMM interface
used for wall motion tracking (section 6.3.3).
6.3.3 Motion Tracking
Motion tracking was performed using a standard block matching technique with the
normalized correlation coefficient as the similarity measure [238]. Several points were
manually selected in the first frame of the image sequence at an approximate, uniform
grid spacing of 1/2 mm to cover the whole plaque body (or a 1 mm thickness of the
tissue in the case of the region of interest directly underlying the plaque) and tracked
in the successive image frames by maximizing the values of the normalized correlation

167
coefficients (Figure 6.2). Template sizes from 20x20 mm2 down to 6x6 mm
2 were
iteratively searched in decrements of 1x1 mm2 to further maximize the correlation
coefficients. Templates sizes smaller than 6x6 mm2 often caused erroneous tracking
and were therefore not used. An adaptive block matching technique whereby the
individual templates were updated with new ones at every frame was also
investigated, but this caused a drift in motion tracking and was not utilized further.
The individual points describing the motion of the plaque and the underlying tissues
were separately averaged, resulting in two motion trajectories: one for the plaque
(rplaque) and one for the underlying tissues (rtissue). Motion of the plaque relative to the
underlying tissues (rrel) was calculated by transforming rplaque to a reference frame the
origin of which moved according to rtissue. Maximum displacement was calculated as
the furthest distance between any two points assessed over all possible pairs of
points on a given trajectory. Velocity and acceleration were determined as the first and
second numerical derivatives, respectively, of the motion trajectories using the central
difference method (gradient function in MATLAB). Reproducibility was assessed by
measuring each motion parameter five times for ten plaques, and determining the
intra-observer coefficients of variation. In the case of the in vitro analysis, motion
parameters obtained using the present technique were compared against those
obtained using a previously described arterial wall motion assessment method, which
tracked the tissue mimicking material interface (Figure 6.1) [217,231].
6.3.4 Statistical Methods
The non-parametric Wilcoxon-Mann-Whitney test was used to determine whether
motion parameters differed significantly between plaques that were or were not
associated with symptoms. Multivariate logistic regressions, one for the motion
parameters relative to the ultrasound probe, and one for the motion parameters
relative to the tissues directly underlying the plaque, were further employed to assess
whether any of the motion parameters were significant predictors of symptoms.
Bivariate correlations between the motion parameters and the degree of stenosis,
plaque greyscale median and the surface irregularity index were determined using

168
Spearman's rank correlation coefficient. In all cases, two-tailed p-values less than 0.05
were considered statistically significant.
6.4 Results
Motion analysis was successful for 66 plaques (81%) but unsuccessful for 15 (19%).
The causes of motion tracking failure were speckle decorrelation (13 plaques), and
ultrasonic shadowing (2 plaques). The mean normalized correlation coefficient was
0.95 for the plaques for which motion tracking was successful. Figure 6.2 shows an
example of a plaque with successful motion tracking, while Figure 6.3 shows the
calculated motion parameters for the same plaque, relative to the ultrasound probe.
Cardiac cycles are clearly visible in the plots showing the horizontal and vertical
components of plaque position; they are also visible, albeit less clearly, in the plots
showing the velocity and acceleration of the plaque. The peaks in the plot showing the
plaque acceleration are seen to broadly correspond to the peaks and troughs of the
plots showing the horizontal and vertical components of plaque position.
The mean values across all plaques of the motion parameters relative to the probe and
the underlying tissues were as shown in Table 6.1 and Table 6.2. For the motion
relative to the underlying tissues, average displacement magnitude was low (less than
0.4 mm) and the differences between the symptomatic and asymptomatic groups were
not statistically significant (Table 6.2 and Figure 6.4). In the case of the motion of the
plaque relative to the probe, the average displacement magnitude was much larger (>1
mm) but the differences between the symptomatic and asymptomatic groups were
also not statistically significant (Table 6.1 and Figure 6.4). Logistic regression testing
further confirmed that none of the motion parameters, either relative to the
ultrasound probe or relative to the tissues directly underlying the plaque, were
significant predictors of the presence of cerebrovascular symptoms (p>0.05). There was
no statistically significant association between any of the motion parameters and the
degree of stenosis, or the greyscale plaque characteristics (Table 6.3 and Table 6.4).
Measurement reproducibility was good for parameters representing the motion of the
plaque relative to the probe (COV < 10%); it was better for mean plaque velocity and

169
mean plaque acceleration (COV < 5%), than for maximum plaque displacement,
maximum plaque velocity, and maximum plaque acceleration (COV >= 5%, Table 6.5).
In the case of the motion of the plaque relative to the tissues directly underlying the
plaque, reproducibility was poorer for all motion parameters (COV > 15%). In vitro
assessment showed that motion was not detected below a set displacement of 50 µm,
while accuracy was low in the range 50 to 100 µm (Table 6.6). Figure 6.5 and Figure 6.6
show the calculated motion parameters for the case where the actuator was set to
produce maximum displacements of 500 and 200 µm, respectively. Periodic, downward
displacements of 476 and 188 µm are seen in Figure 6.5 and Figure 6.6, respectively,
with a small horizontal motion component in the case of Figure 6.5. In agreement with
the programming of the actuator, velocity and acceleration were found to be greater
when the motion was away from the ultrasound probe (increasing y values) compared
to towards to probe (decreasing y values, Figure 6.5).
Table 6.1 - Mean values, across plaques, of the motion parameters relative to the
ultrasound probe.
Max
displacement
(mm)
Max
velocity
(mm/s)
Mean
velocity
(mm/s)
Max
acceleration
(mm/s2)
Mean
acceleration
(mm/s2)
All plaques 1.24 4.71 1.34 69.1 21.8
Symptomatic 1.19 4.03 1.27 57.7 20.4
Asymptomatic 1.30 5.50 1.42 82.3 23.3
Significance
(p-value)
0.92 0.30 0.76 0.05 0.51

170
Table 6.2 - Mean values, across plaques, of the motion parameters relative to the
underlying tissues.
Max
displacement
(mm)
Max
velocity
(mm/s)
Mean
velocity
(mm/s)
Max
acceleration
(mm/s2)
Mean
acceleration
(mm/s2)
All plaques 0.35 2.38 0.70 56.6 17.6
Symptomatic 0.35 2.29 0.67 54.7 16.8
Asymptomatic 0.35 2.49 0.72 58.9 18.5
Significance
(p-value)
0.67 0.82 0.67 0.65 0.26
Table 6.3 - Significance of association (p-values) between motion parameters relative
to the ultrasound probe, the degree of stenosis (DOS), plaque greyscale median (GSM)
and the surface irregularity index (SII).
Max
displacement
Max
velocity
Mean
velocity
Max
acceleration
Mean
acceleration
DOS 0.62 0.65 0.54 0.29 0.71
GSM 0.57 0.52 0.92 0.55 0.95
SII 0.18 0.13 0.07 0.33 0.13
Table 6.4 - Significance of association (p-values) between motion parameters relative
to the underlying tissues, the degree of stenosis (DOS), plaque greyscale median
(GSM) and the surface irregularity index (SII).
Max
displacement
Max
velocity
Mean
velocity
Max
acceleration
Mean
acceleration
DOS 0.09 0.13 0.19 0.58 0.92
GSM 0.27 0.47 0.89 0.18 0.58
SII 0.17 0.16 0.24 0.75 0.45

171
Table 6.5 - Reproducibility of the motion parameters (intra-observer coefficients of
variation).
Max displacement 0.08
Max velocity 0.07
Mean velocity 0.02
Max acceleration 0.05
Relative to the ultrasound
probe
Mean acceleration 0.01
Max displacement 0.20
Max velocity 0.16
Mean velocity 0.19
Max acceleration 0.16
Relative to the underlying
tissues
Mean acceleration 0.21
Table 6.6 - In vitro assessment comparing the measured motion of the tissue
mimicking material (TMM) with the set displacement of the actuator and the motion of
the TMM-lumen interface measured using wall motion techniques [266].
Set
displacement
(µm)
5 10 20 50 100 200 500
Max
displacement
(µm)
7 15 26 53 105 201 503
Max velocity
(mm/s)
0.16 0.14 0.27 0.55 0.60 1.17 3.99
Mean velocity
(mm/s)
0.02 0.03 0.06 0.12 0.22 0.37 0.95
Measured
motion of
the TMM
wall
Max
acceleration
(mm/s2)
3.3 2.4 4.2 8.0 8.1 14.7 47.4

172
Mean
acceleration
(mm/s2)
0.50 0.76 1.25 2.0 2.3 3.5 11.0
Max
displacement
(µm) [error]
0
[100%]
0
[100%]
0
[100%]
74
[48%]
74
[26%]
188
[6.0%]
476
[4.8%]
Max velocity
(mm/s)
0 0 0 1.3 1.2 1.26 4.9
Mean velocity
(mm/s)
0 0 0 0.16 0.16 0.34 0.91
Max
acceleration
(mm/s2)
0 0 0 22.5 20.5 22.2 75.7
Measured
motion of
TMM
Mean
acceleration
(mm/s2)
0 0 0 5.2 5.0 6.1 13.0

173
Figure 6.2 - An example of a plaque and underlying tissues on the opposite sides of
the posterior arterial wall at the carotid bulb, with motion tracking. Arrows show the
local displacement at time t with respect to the position at frame 1, magnified by a
factor of 10.
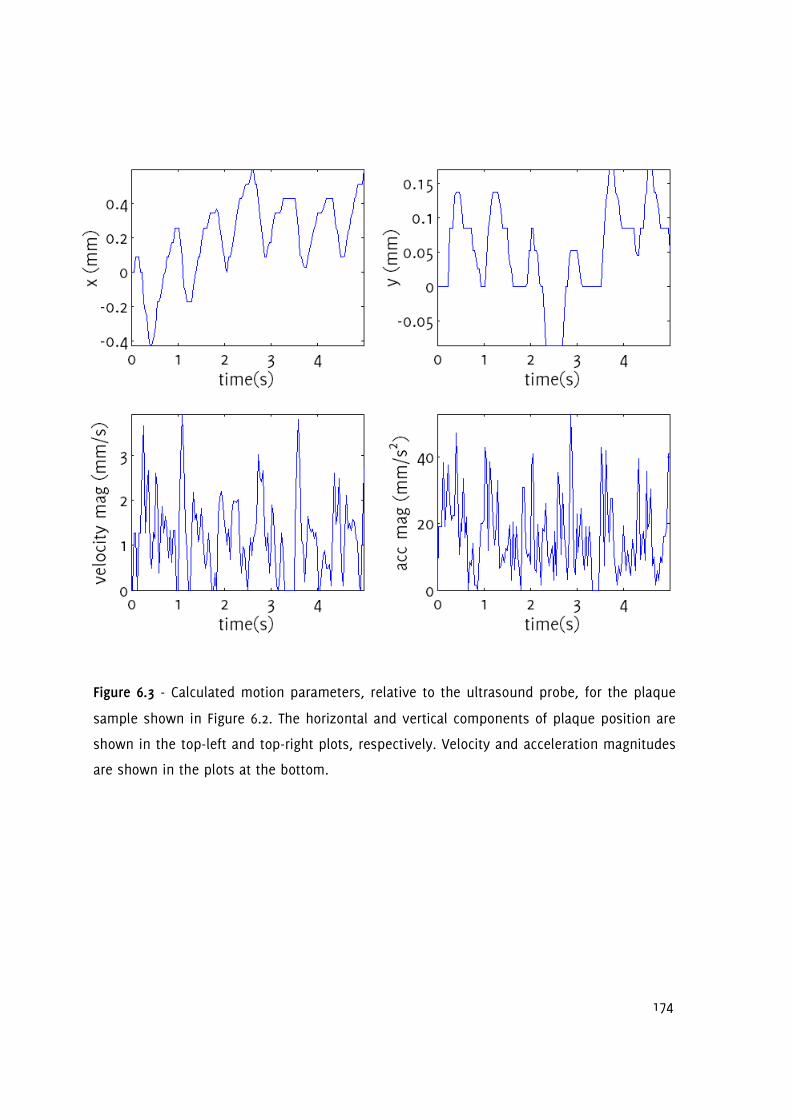
174
Figure 6.3 - Calculated motion parameters, relative to the ultrasound probe, for the plaque
sample shown in Figure 6.2. The horizontal and vertical components of plaque position are
shown in the top-left and top-right plots, respectively. Velocity and acceleration magnitudes
are shown in the plots at the bottom.

175
Figure 6.4 - Box-whisker plots showing the distribution of the motion parameters (relative to the probe: top row, relative to the
underlying tissues: bottom row) within the asymptomatic (marked -) and symptomatic (marked +) groups.

176
Figure 6.5 - Calculated motion parameters for the in vitro study with the actuator set
to produce a maximum displacement of 500 µm. The horizontal and vertical
components of position are shown in the top-left and top-right plots, respectively.
Velocity and acceleration magnitudes are shown in the plots at the bottom.

177
Figure 6.6 - Calculated motion parameters for the in vitro study with the actuator set
to produce a maximum displacement of 200 µm. The horizontal and vertical
components of position are shown in the top-left and top-right plots, respectively.
Velocity and acceleration magnitudes are shown in the plots at the bottom.
6.5 Discussion
This chapter investigated plaque motion using B-Mode ultrasound image sequences
and contributes new data to the literature on typical plaque displacements, velocities
and accelerations that may be encountered when the motion is measured relative to
the ultrasound probe and relative to the tissues directly underlying the plaque. Plaque
velocities relative to the ultrasound probe have been investigated before, and the
results are in accordance with previous findings [197,200]. In relation to the
178
displacement of the plaque relative to the underlying tissues, the results showed
motions generally smaller than the resolution of a typical modern ultrasound scanner
(≲1mm). From a clinical perspective, the rationale for carrying out this study was that
those plaques experiencing larger amounts of motion might be more prone to rupture,
and thus more likely to be symptomatic, due to tissue stresses that may be caused by
motion. However, the results did not support this hypothesis. There were no
significant differences in the motion parameters in relation to the presence of
cerebrovascular symptoms, and no significant associations were found between
plaque motion and the degree of carotid artery stenosis, or the greyscale plaque
characteristics.
Several studies have previously investigated the motion of the atherosclerotic plaque.
Chan's early work confirmed the existence of carotid plaque motion when patient or
probe motion is taken into account [199]. However, this was a preliminary study
looking at only two clinical image sequences at low frame rates, and did not establish
the presence of any discrepant motion between the plaque and the underlying tissues.
Iannuzzi et al. used a qualitative assessment scheme based on an apparent distal
shift of the plaque axis, and found that longitudinal plaque motion was associated
with ipsilateral brain involvement in transient ischaemic attack patients [61]. However,
only a small percentage of the plaques (37%) were found to have longitudinal lesion
motion in that study and the analysis was based on 18 plaques having longitudinal
plaque motion in the artery ipsilateral to hemispheric damage, compared to 6 plaques
which had longitudinal plaque motion in the artery contralateral to hemispheric
damage. Other studies, on the other hand, reported that plaques from symptomatic
patients had higher maximum discrepant surface velocities compared with plaques
from asymptomatic patients [185,200]. Although the results of this chapter are not
directly comparable with the results of these studies, since discrepant surface
velocities were not studied in this chapter, this study affirms Dahl et al.'s finding that
maximum velocity may be a parameter that has low reproducibility [201].
The spatial resolution of our imaging equipment was measured to be approximately 1
mm in the axial and lateral directions using a Cardiff Composite Test Object (Diagnostic

179
Sonar, Edinburgh, United Kingdom). Motion magnitudes as low as 50 µm could be
detected using the method described in this chapter, due to the averaging of several
block-matched points selected over the plaque body, thus providing sub-pixel
resolution. Studies using radiofrequency ultrasound data, such as the one by Bang et
al. benefit from the additional information provided by the phase of the
radiofrequency signal [197], and improved methods of motion tracking, such as
adaptive block matching [289], may increase motion tracking accuracy. However, in
both radiofrequency studies and studies using improved methods of motion tracking,
the intrinsic spatial resolution of the imaging system will still limit precision and
accuracy. Therefore, spatial resolution of the imaging equipment needs to be
considered in the analysis of plaque motion (i.e. motion magnitudes in comparison to
the resolving power of the imaging system) and will determine the clinical applicability
of motion assessment using B-Mode ultrasound. Increasing the frame rate of the
ultrasound acquisition can help by reducing the amount of speckle decorrelation on a
frame-by-frame basis. However, increased frame rates do not help overcome the
limitations arising from the restricted, intrinsic spatial resolution of the imaging
system.
No significant relationship was found between motion parameters and the presence of
cerebrovascular symptoms in this investigation. Intra-plaque strain analysis [37,93-94]
and methods assessing the mechanical properties of plaque such as Shearwave
Elastography [293-294] may be suggested as future directions for research to help
identify the vulnerable plaque.
6.6 Conclusions
The study of atherosclerotic plaque motion due to blood flow measured using B-Mode
ultrasound found no significant differences in the motion parameters investigated, in
relation to the presence of ipsilateral hemispheric cerebrovascular symptoms.
Furthermore, no significant associations were found between the motion parameters
and the degree of carotid artery stenosis or greyscale plaque characteristics.

180
Chapter 7
A Novel Ultrasound-Based Carotid Plaque Risk Index
Associated with the Presence of Cerebrovascular
Symptoms
7.1 Overview
This thesis has described several ultrasound-based plaque parameters that may help
identify the vulnerable plaque. First and foremost, the degree of stenosis is an
important measure used in clinical practice, and must be taken into account when
other ultrasound parameters are used. However, it is uncertain how such additional
parameters should be used in conjunction with the degree of carotid artery stenosis.
Previous attempts to combine ultrasound plaque characteristics with the degree of
stenosis either involved the introduction of risk indices based on a risk model with
parameters optimised to the dataset under study, or the use of machine
learning/classification algorithms to classify plaques. However, this has reduced
applicability and hindered clinical adoption, since most ultrasound measures of
plaques, including the degree of stenosis, are subject to variations across centres and
methods of evaluation. This chapter introduces a novel ultrasound-based carotid
plaque risk index (CPRI) incorporating the degree of stenosis, the normalized greyscale
median, and the surface irregularity index, and shows that CPRI increases diagnostic
accuracy compared to the degree of carotid artery stenosis alone, without the use of
such optimised parameters.
7.2 Background
Clinical trials such as the North American Symptomatic Carotid Endarterectomy Trial
(NASCET) and European Carotid Surgery Trial (ECST) have shown endarterectomy to be
beneficial for symptomatic patients with severe carotid artery stenosis (i.e. 70-99%)
[38-39,295]. However, the selection of patients for surgery is not optimal, and it is

181
suggested that approximately 70-75% of patients will not have a stroke if treated
medically [296]. Some studies reported surgery to be of potential benefit also for
patients with lower degrees of symptomatic stenosis [9,297]. In patients with carotid
artery occlusion or near-occlusion, the benefit of carotid endarterectomy is marginal in
the short-term and uncertain in the long-term [297]. Occlusions or near-occlusions,
paradoxically, appear to be associated with a low risk of stroke when treated medically
in both symptomatic and asymptomatic patients [298]. In the case of asymptomatic
patients, while some studies such as the Asymptomatic Carotid Atherosclerosis Study
(ACAS) and the Medical Research Council (MRC) Asymptomatic Carotid Surgery Trial
(ACST) have shown that surgery may reduce the risk of stroke in patients with severe
carotid artery stenosis, there is about a 3% perioperative stroke or death rate
associated with carotid endarterectomy (which may be higher in routine clinical
practice outside clinical trials), and the benefit of surgery, particularly in patients with
concomitant illnesses, is largely debated [299-306]. In the ACST trial the number
needed to treat to prevent 1 disabling or fatal stroke after 5 years was approximately
40 [298]. Carotid stenting is less invasive than endarterectomy, however, it may be
associated with a higher (9.6% compared with 3.9% for endarterectomy) 30-day
incidence of stroke or death [307]. On the other hand, Stenting and Angioplasty with
Protection in Patients at High Risk for Endarterectomy (SAPPHIRE), a randomized trial
of endarterectomy versus angioplasty with the use of an emboli-protection device in
patients with coexisting conditions that potentially increased the risk posed by
endarterectomy, reported a lower 30-day incidence of stroke after stenting (3.6%) and
concluded that angioplasty was not inferior to surgery [306,308]. In either case, it has
been recently pointed out that even if it was possible to identify and treat every
individual with a severe asymptomatic stenosis, 95% or more of all strokes would still
occur, and hence the important goal should be to identify the small cohort of patients
with vulnerable plaques who would benefit from intervention [301,309-310]. Identifying
patients with high-risk or vulnerable plaques is, therefore, paramount so that
treatment can be tailored more appropriately.

182
7.3 Introduction
The degree of stenosis (DOS) of the carotid artery is an established parameter that is
routinely used in clinical practice [38-39]. However, it is recognized that some plaques
may be more vulnerable than others, and their identification would aid clinical
decision-making [301]. Previous investigations have shown that ultrasound plaque
characteristics such as the greyscale median (GSM) and surface irregularities may be
useful for identifying such vulnerable plaques [51,129,131,134-
135,140,146,158,172,180,238,243,248,250-251,253-254,262]. Several studies have
attempted to combine these and other ultrasound measures with the degree of
stenosis to derive a plaque risk index but either qualitative measures have been
employed and/or the relevant risk index was based on cut-off values or weighting
factors optimised to a particular dataset [174,179,203,311-313]. The incorporation of
dataset-optimised factors limits applicability and validity, since the assessment of
ultrasound plaque characteristics, including that of the degree of stenosis, can vary
depending on the method of assessment used, and can be subject to variation
between centres [238,314].
This chapter develops an ultrasound-based carotid plaque risk index (CPRI) that is
based on quantitative measurements of plaque echogenicity and surface irregularities,
combining these with the degree of stenosis without incorporating any parameters
optimised for our dataset. Our study compares the performance of this risk index with
DOS and a conventional logistic regression based model with dataset-optimised
weighting factors.
7.4 Methods
This was a cross-sectional study in which 56 patients (35 male, 21 female) who
attended the University Hospitals of Leicester NHS Trust's Rapid Access Transient
Ischaemic Attack (TIA) clinic were recruited. Ultrasound image sequences of the carotid
plaque in the longitudinal cross-section were acquired by experienced sonographers
using a Philips iU22 ultrasound scanner (Philips Healthcare, Eindhoven, The
Netherlands) and an L9-3 probe. B-Mode (greyscale) and Colour Doppler image
sequences were recorded as DICOM files over an average duration of 5.6 seconds

183
(mean frame rate was 32 frames per second) using the vascular carotid preset on the
scanner (Vasc Car preset, persistence low, XRES and SONOCT on). Colour Doppler image
sequences were used as a qualitative aid to identifying the location and extent of the
plaques, while the greyscale data were used for the quantitative analyses. The study
was approved by the National Research Ethics Service (NRES) Committee East
Midlands-Northampton (reference 11/EM/0249) and followed institutional guidelines.
Each patient gave informed consent before participating in the study. Eighty-two
stenosed carotid arteries (stenosis range 10-95%) were investigated. Plaques were
classified as either having caused cerebrovascular symptoms relating to the ipsilateral
brain hemisphere within the past six-month period (i.e. symptomatic) or as
asymptomatic following the review of patient symptoms and clinical/radiological
(CT/MRI) findings.
7.4.1 Analysis
Quantitative analyses were carried out using MATLAB version 7.14 (MathWorks, Natick,
Massachusetts, USA) and SPSS version 20 (IBM Corporation, Armonk, New York, USA).
Degree of stenosis was measured using criteria consistent with the NASCET method
utilizing blood flow velocities in conjunction with the B-Mode and colour flow imaging
[38,47,240]. As Doppler velocity measurements are not able to reliably discriminate
degrees of stenosis below 50%, we used B-Mode diameter measurements and colour
flow imaging to grade the degree of stenosis into deciles for minor stenoses.
Previously-described methods were employed to evaluate the normalized plaque GSM
and the surface irregularity index (SII) [238,243]. GSM and SII were averaged over all
the ultrasound image frames acquired for each artery. On average, 180 consecutive
frames were analyzed for each artery. The non-parametric Wilcoxon-Mann-Whitney test
was used to assess whether quantitative measures differed significantly between
symptomatic and asymptomatic groups, and ROC curves were used to assess
classification performance. Two-tailed tests of significance were used and p-values less
than 0.05 were considered statistically significant. A carotid plaque risk index based on
logistic regression methods (CPRIlogistic) was constructed, similar to Momjian-Mayor et
al. [203] in the form of 1/(1+exp(-x)) where x is equal to β0+β1*DOS+β2*GSM+β3*SII
and β0, β1, β2, β3 are factors that are optimised for the data. This was done using the

184
binary logistic regression tool in SPSS, using the symptomatic status as the dependent
variable and DOS, GSM, and SII as covariates. Our CPRI, on the other hand, was defined
as (DOS*SII)/(GSM+1) with no dataset-optimised parameters. DOS values in this
equation were between 0.0 and 1.0 (e.g. 0.5 for 50% stenosis), while the SII were input
in radians per metre. The value 1 was added to the GSM to avoid having a
mathematical singularity for plaques with a GSM of 0. Box and whisker plots were
used to study the distribution of CPRI and CPRIlogistic among the plaque groups with
and without associated cerebrovascular symptoms.
7.5 Results
The mean age of the patients was 76.6 (range 58 to 95) years. Patient age was not
significantly different between the asymptomatic (76.9 years) and symptomatic groups
(76.4 years, p > 0.05). Patients who had previous TIA/stroke episodes (44.6%) were
more likely to be symptomatic (p=0.01), while other patient characteristics did not
have a significant association to the presence of symptoms (Table 7.1).
Table 7.1 - Patient characteristics and the significance of association with
cerebrovascular symptoms. The statistical methods used to test the associations were
the non-parametric Wilcoxon-Mann-Whitney test for the patient age the χ2 test for the
rest of the patient characteristics. Significant associations are marked with an asterisk
(*).
Patient Characteristic All patients Asymptomatic
group
Symptomatic
group
Significance
(p-value)
Mean age (years) 76.6 76.9 76.4 0.80
Sex (males) 62.5% 54.5% 67.6% 0.33
Hypertension 64.3% 63.6% 64.7% 0.94
Hypercholesterolaemia 53.6% 54.5% 52.9% 0.91
Ischaemic Heart Disease 23.2% 13.6% 29.4% 0.18
Diabetes 35.7% 22.7% 44.1% 0.11
Previous TIA/stroke 44.6% 22.7% 58.8% 0.01*

185
Patient Characteristic All patients Asymptomatic
group
Symptomatic
group
Significance
(p-value)
Peripheral vascular
disease
14.3% 9.1% 17.6% 0.38
Smoking 67.9% 68.2% 67.6% 0.97
Alcohol consumption 37.5% 27.3% 44.1% 0.21
Family history of stroke 33.9% 22.7% 41.2% 0.16
Atrial Fibrillation 12.5% 13.6% 11.8 0.84
Stroke (n=8) 14.3% Not applicable 23.5% Not
applicable
TIA (n=16) 28.6% Not applicable 47.1% Not
applicable
Transient Monocular
Vision Loss (n=10)
17.9% Not applicable 29.4% Not
applicable
Table 7.2 - Comparison of diagnostic performance between degree of stenosis (DOS),
the logistic regression based, optimised risk index (CPRIlogistic) and our risk index
(CPRI).
Parameter DOS CPRIlogistic CPRI
Area under ROC curve (AUC) 0.771 0.845 0.849
95% confidence interval for AUC 0.670 - 0.873 0.757 - 0.932 0.765 - 0.934
Sensitivity (%) 73.8 85.7 90.5
Specificity (%) 65.0 77.5 75.0
Accuracy (%) 69.5 81.7 82.9
Positive Predictive Value (%) 68.9 80.0 79.2
Negative Predictive Value (%) 70.3 83.8 88.2

186
There were 82 carotid arteries with stenoses ranging from 10% to 95%. Forty-two of
these arteries were associated with symptoms relating to the ipsilateral brain
hemisphere, while 40 were asymptomatic. The degree of stenosis and the SII were
significantly higher in the arteries with symptoms, while the normalized plaque GSM
was lower (p < 0.01 for all). The mean SII of symptomatic plaques was 1970 radians/m
compared to 1780 radians/m for the asymptomatic. The corresponding normalized GSM
values were 45.1 and 59.5, respectively.
Seven patients had atrial fibrillation present on pre-scan ECG. Three of these patients
were asymptomatic since they were not diagnosed to have suffered a cerebrovascular
event. The remaining 4 patients had no brain infarcts observed on CT/MRI, but their
body symptoms were contralateral to their stenosed carotid arteries.
Examples of a plaque with ipsilateral hemispheric symptoms and a plaque without
symptoms are shown in Figure 7.1. The risk index based on optimised logistic
regression (CPRIlogistic) and our CPRI were significantly higher for stenoses that were
associated with symptoms (p < 0.01 for both), but CPRI showed a better separation of
the two groups (Figure 7.2). ROC curve analysis showed that CPRIlogistic and CPRI had
similar classification performance, better than that of DOS, with CPRI providing a better
overall accuracy (Figure 7.3 and Table 7.2). The area under the ROC curve (AUC) was
0.849 for CPRI, 0.845 for CPRIlogistic and 0.771 for DOS (Table 7.2). The median CPRI of the
symptomatic and asymptomatic groups were 23.2 and 9.2 units compared with 0.71
and 0.30 for CPRIlogistic. GSM and SII appeared to have similar ROC curves, which were
below that of DOS (Figure 7.3). A reduced risk index, not utilizing the plaque surface
irregularities, of the form DOS/(GSM+1) also outperformed DOS on its own (Figure 7.4).
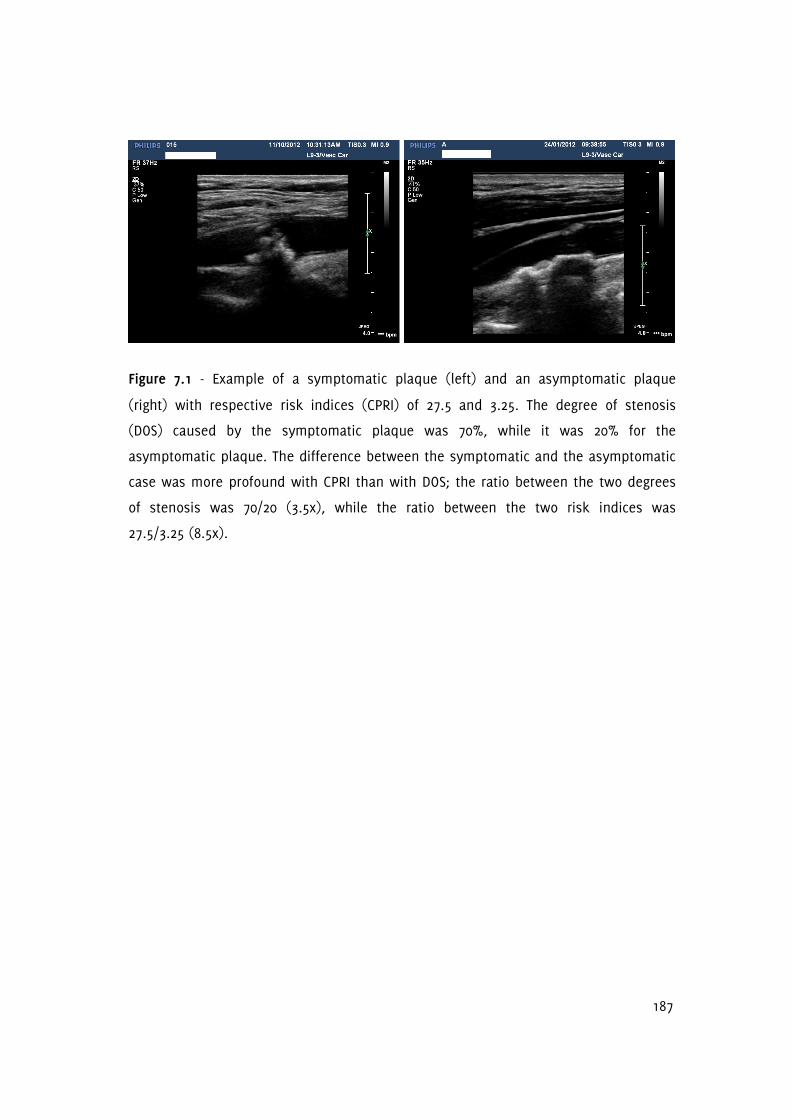
187
Figure 7.1 - Example of a symptomatic plaque (left) and an asymptomatic plaque
(right) with respective risk indices (CPRI) of 27.5 and 3.25. The degree of stenosis
(DOS) caused by the symptomatic plaque was 70%, while it was 20% for the
asymptomatic plaque. The difference between the symptomatic and the asymptomatic
case was more profound with CPRI than with DOS; the ratio between the two degrees
of stenosis was 70/20 (3.5x), while the ratio between the two risk indices was
27.5/3.25 (8.5x).

188
Figure 7.2 - Box and whisker plots showing the distribution of CPRIlogistic (top-left) and CPRI (bottom-left) in carotid artery stenoses
with and without cerebrovascular symptoms. The corresponding plots in the middle and on the right further show the distribution of
CPRIlogistic and CPRI within the two groups in the form of cumulative distribution and scatter plots.

189
Figure 7.3 - ROC curves showing the classification performance of the degree of
stenosis (DOS), plaque surface irregularity index (SII), the normalized plaque greyscale
median (GSM), CPRIlogistic and CPRI. 'Reference line' is the line of identity or no
discrimination.

190
Figure 7.4 - ROC curves showing the classification performance of the degree of
stenosis (DOS), compared with the reduced version of the carotid plaque risk index
DOS/(GSM+1). Areas under ROC curve are 0.771 for DOS vs. 0.844 for the reduced index.
'Reference line' is the line of identity or no discrimination.

191
Figure 7.5 - Scattergrams of SII versus DOS (left), normalized GSM versus DOS (middle), and SII versus normalized GSM (right).
Plaques causing symptoms are shown as + in purple, while plaques that have not been associated with symptoms are shown as o in
blue.

192
A general tendency of plaques causing symptoms to cluster around higher degrees of
stenosis (DOS) and surface irregularity indices (SII) but lower normalized greyscale
medians (GSM) can be observed from the scattergrams of SII versus DOS, normalized
GSM versus DOS, and SII versus normalized GSM (Figure 7.5).
7.6 Discussion
This chapter described a novel risk index which intuitively combines quantitative
measures of plaque echogenicity and surface irregularities with the degree of carotid
artery stenosis. This risk index, despite not having any parameters optimizing it for
our dataset, was found to have increased diagnostic performance compared to DOS,
and a risk index based on logistic regression with such optimised parameters.
Several studies have previously derived risk indices that combine ultrasound plaque
characteristics with DOS in order to help identity the vulnerable carotid plaque
[174,179,203,311-313]. Prati et al. defined a risk index incorporating DOS, and
qualitative measures of surface irregularity, plaque echogenicity and texture [174].
They found that the addition of plaque characteristics significantly increased the area
under the ROC curve compared to the Framingham score alone. Momjian-Mayor et al.
defined a risk index combining DOS with a quantitative measure of the plaque surface
echogenicity and used a logistic regression based statistical model with weighting
factors optimised for their dataset [203]. This risk index was found to be significantly
higher for plaques with associated symptoms than for plaques without symptoms.
Pedro et al. similarly developed an activity index, comprising several measures
including that of plaque surface disruption1, GSM, percentage of plaque area with grey
levels less than 40, plaque heterogeneity2, the presence of juxta-luminal echolucent
areas3 and the degree of stenosis. Weighting scores for various criteria based on these
parameters were evaluated and used to assign an activity index to each plaque
[179,311]. The activity index correlated positively with the presence of symptoms. This
was later extended by Seabra et al. to an enhanced activity index which incorporated
1 Plaque surface disruption assessed qualitatively.
2 Plaque heterogeneity assessed qualitatively.
3 Presence of juxta-luminal echolucent areas assessed qualitatively.

193
additional parameters, including those based on the radiofrequency (RF) ultrasound
signal [315]. They used an algorithm based on summing conditional probabilities for
individual parameters belonging to the asymptomatic and symptomatic groups [315].
The enhanced activity index was reported to have provided correct identification of all
plaques that developed symptoms, while giving a small number of false positives
[315]. Nicolaides et al. constructed three risk models based on DOS, clinical and plaque
features including GSM, plaque area, plaque type1, and the presence of discrete white
areas [312]. Multivariable, fractional polynomials were used, which were optimised for
the dataset, to derive the risk indices. The addition of plaque features increased the
area under the ROC curve compared to degree of stenosis alone, and the degree of
stenosis and clinical features combined. Kyriacou et al. followed a similar procedure
but incorporated several plaque texture features to build a stroke risk model, with
weighting factors optimised using their own dataset, and also reported good
classification accuracy [313].
A common limitation of the existing methods has been the incorporation of weighting
factors and other parameters that were optimised using the particular datasets
studied. Ultrasound plaque characteristics such as the GSM, and even DOS, can be
subject to variations when measured by different centres and methods [238].
Therefore, regardless of how large the sample size used might be2, these variations
compromise the general validity and applicability of these risk indices. Obtaining good
classification accuracy need not mean the model is generally valid, if the model
includes parameters that have been optimized for the dataset/assessment method.
The incorporation of qualitative measures into some risk models can also be
considered a separate limitation since intra- and inter-observer agreement can be low
for such subjective assessments [203,314]. Another group of studies have attempted to
classify plaques using methods such as pattern recognition, neural networks, support
vector machines, and other machine learning algorithms but these do not provide risk
indices and suffer from the same limitations [153,185,188-190,316-319].
1 Plaque type assessed qualitatively.
2 Unless the samples are from multiple representative centres.

194
Our study has found that a new, intuitive model that does not have any parameters
which are optimized for our data has better diagnostic performance than DOS and a
dataset-optimised risk index. The area under the ROC curve (0.849 for CPRI vs. 0.771
for DOS and 0.845 for CPRIlogistic) compared favourably with that of the more
complicated risk index defined by Momjian-Mayor et al. [203]. This model, if confirmed
in subsequent studies, has the additional benefit that it may be employed by different
centres without re-optimisation of the weighting factors. Our intuitive method of risk
index construction was based on the observation that the presence of symptoms
appears to be directly related to DOS and SII, while being inversely related to GSM
[238,243]. In our study, the carotid plaque risk index was defined as (DOS*SII)/(GSM+1),
but our investigation also suggested that a reduced risk index of the form of
DOS/(GSM+1) also performs better than DOS (AUC 0.771 for DOS vs. 0.844 for the
reduced index). The reduced index could be particularly useful at centres where
quantitative assessment of surface irregularities is not available. Normalized plaque
GSM can be easily measured using widely available software packages such as
Photoshop (Adobe Systems, San Jose, California, USA) [129] and the reduced index can
be used to obtain an enhanced predictor of symptoms compared to DOS at a busy
clinical service with relative ease. The reduced index has the added convenience that
for a stenosis severity of 50% and a moderate plaque GSM of 50, an index of
approximately 1.0 is obtained, which increases with increasing stenosis severity and
decreasing plaque GSM, and vice versa. Our study also has confirmed that the degree
of stenosis was the strongest predictor of symptoms among the parameters studied,
with the GSM and the SII providing approximately equivalent discriminatory power.
Further work is required to demonstrate the clinical benefit of these novel risk indices.
This could be in the form of longitudinal studies looking prospectively at the
development of cerebrovascular symptoms, in a cross-sectional comparison against
plaque histology or other measures of plaque vulnerability, or studies utilising data
from multiple centres.

195
7.7 Conclusions
This chapter defined a novel carotid plaque risk index, an intuitive method of
combining quantitative measurements of plaque echogenicity, surface irregularities
and DOS without the use of weighting factors optimised for the dataset. It was found
that this risk index performs better than both DOS and a risk index which does include
such optimized parameters. The clinical value of this risk index should be investigated
in further studies.

196
Chapter 8
Summary, Discussion and Future Directions
8.1 Overview
This chapter summarises and discusses the contents of the previous chapters,
highlighting key findings, identifying limitations, and future directions for research. A
corresponding chapter by chapter summary is provided in Table 8.1.
8.2 Thesis Summary and Discussion
Stroke is a major healthcare problem. As well as causing premature death, it often leads
to disability, leaving patients unable to carry out their daily activities and care for
themselves. In Chapter 1, the carotid plaque was highlighted as a major cause of stroke,
pointing out the need for further developments in relation to the characterisation of
plaques. If plaques can be characterised better, treatment and preventative measures
could be more appropriately tailored, leading to a reduction in the incidence and burden
of stroke. It was also stated in Chapter 1 that the degree of carotid artery stenosis is
routinely used to make treatment decisions, but carotid plaques associated with low or
moderate degrees of stenosis can also cause stroke, and some severe stenoses can
remain asymptomatic over many years. It has been long recognized that other
parameters that describe the plaque, such as plaque morphology or dynamic behaviour,
may enable further differentiation of the risk of stroke, helping to identify the vulnerable
plaques. This is a reasonable expectation since the degree of stenosis quantifies the
degree of arterial narrowing, and to some extent the amount of blood flow disturbances,
but does not encapsulate any other information on the characteristics of plaques.
Chapters 1 and 3 reported that the plaque greyscale median (GSM) may be potentially
useful for identifying the vulnerable plaques. However, plaque GSM has remained mainly
a research tool and has not been adopted in clinical practice, except, perhaps, in a
qualitative sense. One of the reasons for this may have been the low reproducibility of
GSM measurements across different studies. While most studies confirmed the negative
correlation between plaque GSM and vulnerability, quantitative studies found different
GSM figures for symptomatic and asymptomatic cases depending on the dataset and the

197
method of analysis used. In Chapter 3, it was suggested that one of the reasons for this
may have been the fact that GSM measurements traditionally have been made on static
or single frames of ultrasound images, typically obtained at arbitrary phases of the
cardiac cycles. The first contribution to knowledge made in this thesis was the
development of an effective means of tracking plaque boundaries over many ultrasound
image frames (Chapters 2 and 3). This is a prerequisite for measuring the plaque GSM
over many cardiac cycles as manual delineation of plaque boundaries over many image
frames is prohibitively labour extensive, and is difficult to carry out without subjectivity.
Chapter 3 showed that plaque outlines can be successfully tracked over image
sequences of five seconds long or more, having as many as 300 frames per acquisition,
with ease. This functionality also resulted in the second contribution made to knowledge
in this thesis which was the measurement, for the first time, of the frame-by-frame
variations in the plaque GSM over several cardiac cycles. Chapter 3 reported a mean
inter-frame coefficient of variation of 5.2% (s.d. 2.5%) for the plaque GSM. These
variations have been largely overlooked before, and the dynamic assessment of plaque
GSM introduced in Chapter 3 could be a step forward towards reducing variations in GSM
measurements across centres, thus helping make GSM a clinically relevant diagnostic
tool.
Chapter 3 confirmed that the plaque GSM has a significant negative correlation to the
presence of cerebrovascular symptoms, with symptomatic plaques having a significantly
lower GSM on average than asymptomatic plaques. The arterial wall and surface tracking
algorithm described in Chapter 2 formed an integral part of the novel method used to
track plaque boundaries in Chapter 3, which made this possible.
In Chapter 4, a quantitative method for the measurement of carotid plaque surface
irregularities was developed and a plaque surface irregularity index (SII) was described.
SII demonstrated a significant association to the presence of cerebrovascular symptoms
relating to the ipsilateral brain hemisphere. Previously, assessment of surface
irregularities has been mainly qualitative, for example, categorising plaques subjectively
as having a smooth surface or an irregular surface, while some studies used additional
categories such as ulcerated and/or indeterminate [149,244-247]. The main limitations of
these qualitative assessments have been their subjectivity, and the difficulty associated

198
with classifying plaques which have a moderate amounts of irregularities that cannot be
classified as smooth or irregular with any certainty. Very few studies have carried out
quantitative assessments; these included an assessment of the bending energy of the
plaque surface [263], and the measurement of the principal curvatures of plaque
surfaces in three dimensions [264-265]. The former did not find a difference in the
bending energies of symptomatic and asymptomatic plaques, but plaque surfaces were
manually delineated, which introduced an element of subjectivity into the process.
Furthermore, the physical relevance of the bending energy of the plaque surface to the
presence of cerebrovascular symptoms appear rather questionable. The studies which
assessed the principal curvatures of plaque surfaces in three dimensions had more
promising results; however, three dimensional ultrasound systems are not widely
available and a two-dimensional assessment method would be more readily usable.
Furthermore, curvature may not be the best method of measuring the roughness of the
plaque surface, as it is, of course, a measure of curvature and not roughness. Although
a rough plaque surface will exhibit spatial variations in curvature and, thus, the
assessment of curvature has validity, curvatures in one direction can cancel curvatures
in the opposite direction, resulting in a null overall curvature measurement for that
surface. Chapter 4 contributed to knowledge by addressing the limitations of the existing
studies, and providing a quantitative method for the assessment of carotid plaque
surface irregularities in two dimensions that is directly related to the roughness of the
plaque surface. Chapter 4 reported that the combination of the developed plaque
surface irregularity index with the degree of carotid artery stenosis resulted in a more
effective predictor of cerebrovascular symptoms compared to the degree of stenosis on
its own.
Chapter 5 described an assessment of wall motion in the stenotic carotid artery,
investigating whether stenosed carotid arteries with associated symptoms have different
dilation characteristics compared to arteries without associated symptoms. Previously,
the relationship between arterial dilation characteristics and the degree of stenosis [97],
longitudinal distension gradient and the presence of symptoms had been studied [279],
but there were no studies investigating whether the absolute and percentage dilation of
arteries differ between arteries with and without symptoms. Chapter 5 found a mean
absolute diameter change from diastole to systole of 0.45 mm (s.d. 0.17), and a mean

199
percentage diameter change of 6.9% (s.d. 3.1%), averaged across 45 stenosed carotid
arteries. Absolute and percentage diameter changes did not have a statistically
significant relationship to the degree of stenosis, greyscale plaque characteristics, or the
presence of ipsilateral hemispheric symptoms. This was attributed to the opposing
effects of (1) progressive atherosclerotic disease which tends to stiffen the arteries and
reduce wall motion, and conversely (2) plaque rupture that may be caused by
mechanical means which should increase in likelihood with increased amounts of wall
motion. Contributions made to knowledge in this chapter included the first-ever
correlation assessment between the dilation characteristics of the stenotic carotid artery
and greyscale plaque characteristics, and the adding of new data to the literature on the
absolute and percentage dilations of stenotic carotid arteries.
Chapter 6 described a quantitative investigation of carotid plaque motion. Displacement,
velocity, and acceleration of plaques were studied relative to the ultrasound probe and
relative to the tissues directly underlying the carotid plaque. Studies had previously
investigated plaque motion using qualitative and quantitative methods, but the
literature was relatively scarce [272]. Plaque motion is of prospective clinical interest, as
motion may increase plaque vulnerability and be associated with a higher prevalence of
symptoms [61,197-198,200,273-274,288]. However, the results of Chapter 6 did not
support this hypothesis. Although motion parameters relative to the ultrasound probe
could be reliably measured (average displacement magnitude was greater than 1 mm),
motion relative to the underlying tissues suffered from low reproducibility (average
displacement magnitude was less than 0.4 mm). The typical plaque displacements and
velocities reported in Chapter 6 were in accordance with previous findings, but plaque
acceleration had not previously been reported. The in vitro study further had further
contribution by showing that motion magnitudes below 50 µm were not detected, while
motion magnitudes in the range 50 to 100 µm had lower accuracy compared with motion
magnitudes in the range 200 to 500 µm.
Chapter 7 was the culmination of the research project and described a novel ultrasound-
based carotid plaque risk index. Two risk indices were introduced: a risk index
incorporating the degree of stenosis with the plaque greyscale median and the
quantitative measure of plaque surface irregularities, and a reduced index comprising

200
only the degree of stenosis and the GSM. These risk indices were shown to improve
diagnostic performance compared to the degree of stenosis on its own, and an
equivalent risk index constructed using logistic regression based methods with model
parameters optimised for the data. The unique difference these risk indices have from
those already described in the literature is the absence of any parameters that were
optimised for the dataset, and their intuitive construction. The previous studies had
described risk indices and other methods of assessing plaque vulnerability,
incorporating weighting factors or other parameters optimized for the particular datasets
studied. However, ultrasound plaque characteristics such as the GSM, and even the
degree of stenosis, are subject to variations when measured by different centres and by
using different methods [4]. Therefore, these variations may compromise the general
validity and applicability of the previously described risk indices. The contributions made
to knowledge in Chapter 7 were the development of risk indices that are not dataset
dependent and thus, if confirmed in subsequent studies, may be employed by different
centres without the re-optimisation of any weighting factors, and the first-ever
description of a risk index that incorporates a quantitative measure of plaque surface
irregularities.
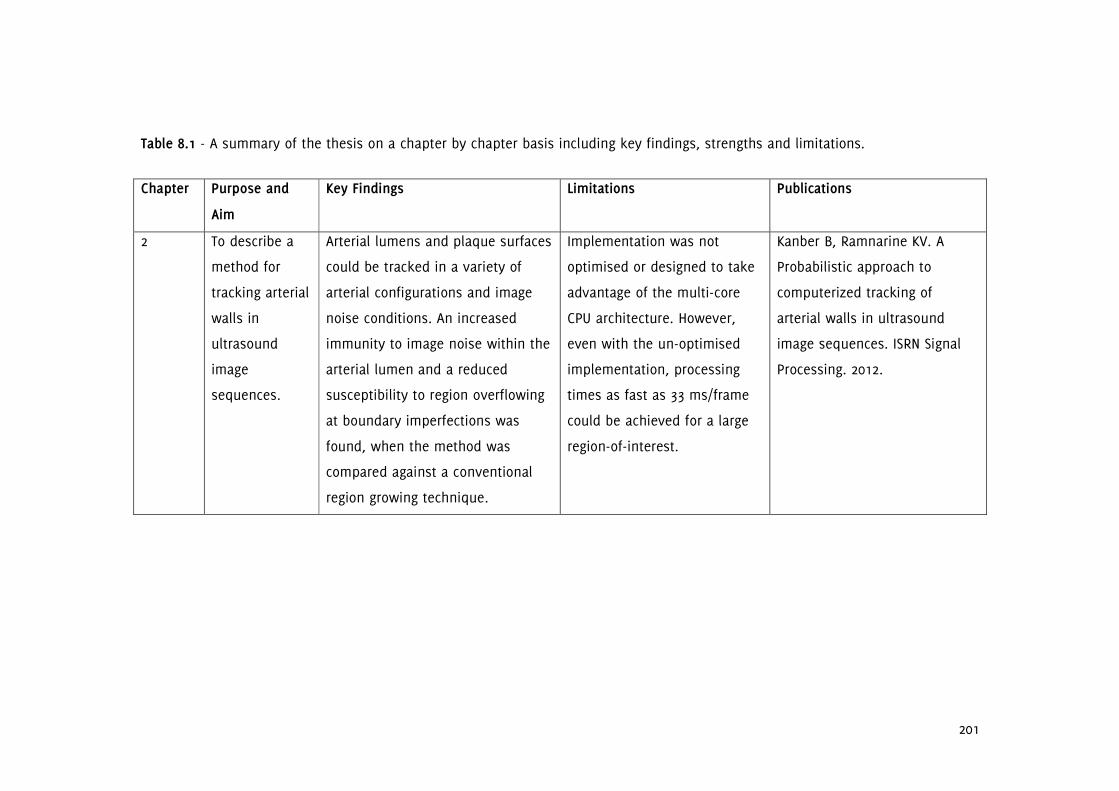
201
Table 8.1 - A summary of the thesis on a chapter by chapter basis including key findings, strengths and limitations.
Chapter Purpose and
Aim
Key Findings Limitations Publications
2 To describe a
method for
tracking arterial
walls in
ultrasound
image
sequences.
Arterial lumens and plaque surfaces
could be tracked in a variety of
arterial configurations and image
noise conditions. An increased
immunity to image noise within the
arterial lumen and a reduced
susceptibility to region overflowing
at boundary imperfections was
found, when the method was
compared against a conventional
region growing technique.
Implementation was not
optimised or designed to take
advantage of the multi-core
CPU architecture. However,
even with the un-optimised
implementation, processing
times as fast as 33 ms/frame
could be achieved for a large
region-of-interest.
Kanber B, Ramnarine KV. A
Probabilistic approach to
computerized tracking of
arterial walls in ultrasound
image sequences. ISRN Signal
Processing. 2012.

202
Chapter Purpose and
Aim
Key Findings Limitations Publications
3 To establish the
presence and
evaluate the
extent of
frame-by-frame
variations in
the plaque
GSM.
A mean inter-frame coefficient of
variation (COV) of 5.2% (s.d. 2.5%)
was found for the plaque GSM and
4.2% (s.d. 2.9%) for the plaque
area. Thirteen of the 27 plaques
(48%) studied exhibited COV in GSM
of greater than 5% whereas only 6
plaques (22%) had COV in plaque
area of greater than 5%. There was
no significant correlation between
the COV of GSM and plaque area.
The use of two dimensional
ultrasound and the absence of
any attempts to fix the scan
plane with respect to the
plaque being imaged, other
than those measures normally
taken in the clinic (e.g. holding
the probe fixed and asking the
patient to remain still and
breath-hold).
Kanber B, Hartshorne TC,
Horsfield MA, Naylor AR,
Robinson TG, Ramnarine KV.
Dynamic variations in the
ultrasound greyscale median of
carotid artery plaques.
Cardiovascular Ultrasound.
2013;11:21.

203
Chapter Purpose and
Aim
Key Findings Limitations Publications
4 To develop a
quantitative
method for the
measurement
of carotid
plaque surface
irregularities.
The mean surface irregularity index
(SII) measured for plaques with
associate ipsilateral hemispheric
symptoms was significantly greater
than for plaques without symptoms
(1.89 radians/mm versus 1.67
radians/mm). There was no
statistically significant association
between the SII and the degree of
stenosis (p = 0.30). SII predicted the
presence of cerebrovascular
symptoms with an accuracy of 66%
(sensitivity 65%, specificity 67%) on
its own and with an accuracy of
83% (sensitivity 96%, specificity
71%) in combination with the
degree of stenosis.
The use of two dimensional
ultrasound, and the cross-
sectional study design using
the presence of ipsilateral
hemispheric symptoms to infer
plaque vulnerability.
Kanber B, Hartshorne TC,
Horsfield MA, Naylor AR,
Robinson TG, Ramnarine KV.
Quantitative assessment of
carotid plaque surface
irregularities and correlation to
cerebrovascular symptoms.
Cardiovascular Ultrasound.
2013;11:38.

204
Chapter Purpose and
Aim
Key Findings Limitations Publications
5 To quantify wall
motion in
stenotic carotid
arteries and
investigate any
associations
with the
greyscale
plaque
characteristics,
the degree of
stenosis, and
the presence of
cerebrovascular
symptoms.
The mean absolute diameter change
from diastole to systole was 0.45
mm (s.d. 0.17), and the mean
percentage diameter change was
6.9% (s.d. 3.1%). Absolute and
percentage diameter changes did
not have a statistically significant
relationship to the degree of
stenosis, greyscale plaque
characteristics, or the presence of
ipsilateral hemispheric symptoms
(p > 0.05).
Diameter changes were
measured before the proximal
shoulder of the atherosclerotic
plaque, but pulse pressures
were not considered. However,
this chapter focussed on
motion aspects rather than
stiffness and was part of our
broader research aim to
develop and define a plaque
risk index based on ultrasound
measurements.
Kanber B, Hartshorne TC,
Horsfield MA, Naylor AR,
Robinson TG, Ramnarine KV.
Wall motion in the stenotic
carotid artery: association with
greyscale plaque characteristics,
the degree of stenosis and
cerebrovascular symptoms.
Cardiovascular Ultrasound.
2013;11:37.

205
Chapter Purpose and
Aim
Key Findings Limitations Publications
6 To quantify
plaque motion
and investigate
any
relationships to
the degree of
stenosis,
greyscale
plaque
characteristics,
and the
presence
cerebrovascular
symptoms.
Average motion magnitude was 1.2
mm, 0.35 mm relative to the
periadventitial tissues. Maximum
and mean plaque velocities were
4.7 and 1.3 mm/s relative to the
ultrasound probe and 2.4 and 0.70
mm/s relative to the periadventitial
tissues. Maximum and mean plaque
accelerations were 69 and 22 mm/s2
relative to the probe and 57 and 18
mm/s2 relative to the periadventitial
tissues. There were no significant
differences, in relation to the
presence of cerebrovascular
symptoms, in any of the motion
parameters. None of the motion
parameters showed any significant
relationship to the degree of
stenosis, or the greyscale plaque
characteristics.
A similar assessment using
three dimensional ultrasound
and radiofrequency data could
provide additional benefit.
Pulse pressures, which may
affect the amount of plaque
motion, were not considered.
However, this chapter aimed
to determine whether the
motion of the plaque had a
significant relationship to the
presence of patient symptoms,
rather than quantifying plaque
mobility (i.e. motion per unit
of pulse pressure).
Submitted.

206
Chapter Purpose and
Aim
Key Findings Limitations Publications
7 To determine
the efficacy of a
novel,
ultrasound-
based carotid
plaque risk
index (CPRI) in
predicting the
presence of
cerebrovascular
symptoms in
patients with
carotid artery
stenosis.
The median CPRI of the
symptomatic group was 23.2, while
that of the asymptomatic group
was 9.2. Diagnostic performance of
CPRI exceeded that of the degree of
stenosis, and an equivalent logistic
regression based risk index with
model parameters optimised to the
dataset. CPRI demonstrated a better
separation of the symptomatic and
asymptomatic groups.
Further work is required to
demonstrate the potential
clinical benefit of this risk
index. This could be in the
form of longitudinal studies
looking prospectively at the
development of symptoms, or
in a cross-sectional
comparison against plaque
histology or other measures of
plaque vulnerability.
Submitted.
207
8.3 Limitations
The main benefits of ultrasound over other imaging modalities is that it is widely
available, low-cost, and convenient. Ultrasound examinations are quick to perform and
do not involve the use of any ionizing radiation such as x-rays as is the case with x-ray
angiography. Ultrasound, except for intra-vascular and contrast-enhanced ultrasound,
which are not covered in this thesis, is non-invasive and the procedure has high patient
acceptability. However, the complementary information that can be provided by other
imaging modalities such as MRI, CT, PET, and others must not be overlooked.
The first limitation of the work described in this thesis is the use of cross-sectional, two
dimensional ultrasound. One must remember that such examinations only provide a
cross-sectional view of the three dimensional object that is the carotid plaque. The use
of longitudinal cross-sectional imaging may result in carotid lesions to be missed, but
this can be avoided by carrying out complementary transverse cross-sectional imaging,
which is routine in the TIA clinic. An alternative would be to use three dimensional
ultrasound. The techniques developed in this thesis would still be applicable if three
dimensional techniques were to be used. The latter is becoming increasingly available
and would undoubtedly provide additional benefit.
Plaque characterisation using the B-Mode greyscale images is also limited compared to a
similar assessment using radiofrequency (RF) data, as the former goes through post-
processing and discards phase information. This can limit the assessment of small
motions such as intra-plaque motions or strains. However, B-Mode data is readily
available from most clinical scanners while radiofrequency data typically requires the
use of scanners specially equipped to output RF data. Thus, techniques that work with
B-Mode ultrasound would be more easily adopted for clinical practice.
A further limitation arises from the study design: our clinical studies were cross-
sectional with no follow-up. We have used the presence of patient symptoms to infer
plaque vulnerability. Although this is a widely used method (since stroke risk is elevated
following a symptomatic event) it is not ideal, since plaques which have not yet caused
symptoms may also be vulnerable. An ideal clinical investigation would be that of a

208
longitudinal study, evaluating the parameters characterising the carotid plaque, and the
associated risk indices, against the development of symptoms during a follow-up period.
Such a clinical investigation will be suggested as a future direction for this research in
the next section.
Another limitation of this project was that the my sample size was relatively small. The
TIA clinic at the University Hospitals of Leicester sees many patients every week.
However, several factors limited my sample size. First of these factors was that patient
recruitment and data collection could only be done on occasional days when the clinic
was not busy and without compromising the goodwill of the clinic staff. The second
factor limiting my sample size was the absence of carotid artery plaques in many of the
patients recruited. As this thesis is concerned with the development of methods to help
identify the vulnerable plaque, patients without plaques had to be excluded from the
study.
8.4 Future Directions
The future directions for this research will include the assessment of the developed risk
indices, and parameters characterising the carotid plaque in prospective clinical trials.
This would involve the measurement of plaque characteristics and the associated risk
indices at baseline and (a) for patients not undergoing surgery, to follow-up patients for
a set period and correlate results with the development of any cerebrovascular
symptoms due to the carotid plaque and (b) for patients having surgery, to correlate
results with the histological assessment of vulnerability of the surgically removed plaque
specimens. It should also be explored whether other ultrasound-based methods such as
a stratified GSM analysis (i.e. the analysis of plaque echogenicity with respect to the
distance to the plaque surface) and the assessment of the mechanical properties of
plaque and vessel wall using Shearwave Elastography can provide additional benefit. The
methods developed in this thesis are also being used to study the endothelium-
dependent, flow-mediated dilation of the brachial artery and in a study looking at aortic
plaque characteristics in mice. There are also plans to further utilize these techniques to
investigate arterial wall dynamics in a study of human spontaneous coronary artery
dissection.

209
8.5 Conclusions
Stroke is a global health concern, and the carotid plaque is a major cause. The research
described in this thesis has made unique contributions to knowledge by developing and
describing efficient methods that enable tracking of plaque boundaries throughout
ultrasound image sequences which underpin dynamic analyses of greyscale plaque
characteristics. These analyses have lead to the identification of previously unexplored
sources of variation in quantitative assessments of plaque echogenicity, and the first
dynamically quantified analysis of plaque surface irregularities. Contributions were also
made to arterial wall motion behaviour analysis in the stenotic carotid artery and the
analysis of plaque motion throughout the cardiac cycle. The research also led to the
development of two novel risk indices, which efficiently integrate quantified measures of
plaque morphology with the degree of stenosis of the carotid artery. These risk indices,
unlike the few existing risk indices described in the literature, do not require pre-
determined weighting factors which have been optimised for the dataset. It is hoped
that further research and clinical trials may lead to a reduction in the incidence and
burden of stroke in patients with carotid artery stenoses with the use of these
techniques.

210
Chapter 9
Appendix
9.1 Publications
1. B. Kanber, K.V. Ramnarine. A Probabilistic Approach to Computerized Tracking of
Arterial Walls in Ultrasound Image Sequences. ISRN Signal Processing 2012.
2. B. Kanber, T.C. Hartshorne, M.A. Horsfield, A.R. Naylor, T.G. Robinson, K.V.
Ramnarine. Dynamic Variations in the Ultrasound Greyscale Median of Carotid Artery
Plaques. Cardiovascular Ultrasound 2013;11:21.
3. B. Kanber, T.C. Hartshorne, M.A. Horsfield, A.R. Naylor, T.G. Robinson, K.V.
Ramnarine. Wall motion in the stenotic carotid artery: association with greyscale plaque
characteristics, the degree of stenosis and cerebrovascular symptoms. Cardiovascular
Ultrasound 2013;11:37.
4. B. Kanber, T.C. Hartshorne, M.A. Horsfield, A.R. Naylor, T.G. Robinson, K.V.
Ramnarine. Quantitative assessment of carotid plaque surface irregularities and
correlation to cerebrovascular symptoms. Cardiovascular Ultrasound 2013;11:38.
5. B. Kanber, T.C. Hartshorne, M.A. Horsfield, A.R. Naylor, T.G. Robinson, K.V.
Ramnarine. Quantitative Assessment of Plaque Motion in the Carotid Arteries using B-
Mode Ultrasound. Submitted.
6. B. Kanber, T.C. Hartshorne, M.A. Horsfield, A.R. Naylor, T.G. Robinson, K.V.
Ramnarine. A Novel Ultrasound-Based Carotid Plaque Risk Index Associated with the
Presence of Cerebrovascular Symptoms. Submitted.
7. J.W. Garrard, P. Ummur, S. Nduwayo, B. Kanber, T.C. Hartshorne, K.P. West, D.
Moore, A.R. Naylor, T.G. Robinson, K.V. Ramnarine. Shear-Wave Elastography vs.

211
Grayscale median in the assessment of carotid artery disease: A comparison with
histology. Submitted.
8. K.V. Ramnarine, J.W. Garrard, B. Kanber, S. Nduwayo, T.C. Hartshorne, R.B.
Panerai, A.R. Naylor, T.G. Robinson. Shear Wave Elastography Imaging of Carotid Plaques:
Clinical Potential. In preparation.
9.2 Conference Abstracts
1. B. Kanber, T.C. Hartshorne, M.A. Horsfield, A.R. Naylor, T.G. Robinson, K.V.
Ramnarine. Ultrasound greyscale median of carotid artery plaques: frame-by-frame
variations. Proceedings of the British Medical Ultrasound Society's 44th Annual Scientific
Meeting 2012.
2. B. Kanber, T.C. Hartshorne, M.A. Horsfield, A.R. Naylor, T.G. Robinson, K.V.
Ramnarine. Dynamic variations in the ultrasound greyscale median of carotid artery
plaques. Cerebrovascular Diseases 2013;35(2):21.
3. B. Kanber, T.C. Hartshorne, M.A. Horsfield, A.R. Naylor, T.G. Robinson, K.V.
Ramnarine. Quantitative assessment of carotid plaque surface irregularities using
ultrasound. Cerebrovascular Diseases 2013;35(2):22.
4. J.W. Garrard, B. Kanber, S. Nduwayo, K. West, D. Moore, A.R. Naylor, T.G.
Robinson, K.V. Ramnarine. Shear-wave Elastography vs. Greyscale Median in the
assessment of carotid artery disease: A comparison with histology. Cerebrovascular
Diseases 2013:35(2):40.
9.3 Presentations
1. Novel Ultrasound Techniques to Identify The Vulnerable Carotid Plaque – Case
Studies. Poster presentation at the CLAHRC for LNR Stakeholder Event, Leicester, UK, on
26 January 2012.

212
2. Ultrasound greyscale median of carotid artery plaques: frame-by-frame
variations. Oral presentation at the Annual General Meeting of the British Medical
Ultrasound Society, Telford, UK, on 12 December 2012.
3. Dynamic analysis of ultrasound image sequences to identify the vulnerable
carotid plaque. Poster presentation at the Postgraduate Seminar Day, Leicester, UK, on
16 May 2013.
4. Ultrasound quantification of a carotid plaque surface curvature index associated
with cerebrovascular symptoms. Oral presentation at the Journal Club, Leicester, UK, on
17 May 2013.
5. Dynamic variations in the ultrasound greyscale median of carotid artery plaques.
Oral presentation at the 18th
Meeting of the European Society of Neurosonology and
Cerebral Haemodynamics, Porto, Portugal, on 25 May 2013.
6. Quantitative assessment of carotid plaque surface irregularities using ultrasound.
Oral presentation at the 18th
Meeting of the European Society of Neurosonology and
Cerebral Haemodynamics, Porto, Portugal, on 25 May 2013.
7. A Novel Ultrasound-Based Carotid Plaque Risk Index Associated with the Presence
of Cerebrovascular Symptoms. Poster presentation at Cardiovascular Theme Research
Day: Immunity and Inflammation, Leicester, UK, on 9 May 2014.

213
References
1. Mayer FJ, Gruenberger D, Schillinger M, Mannhalter C, Minar E, Koppensteiner
R, et al. Prognostic value of neutrophils in patients with asymptomatic carotid artery
disease. Atherosclerosis. 2013;231:274-280.
2. Libby P. Inflammation in atherosclerosis. Arteriosclerosis Thrombosis and
Vascular Biology. 2012;32:2045-2051.
3. Molloy J, Markus HS. Asymptomatic embolization predicts stroke and TIA risk in
patients with carotid artery stenosis. Stroke. 1999;30:1440-1443.
4. Thrush A, Hartshorne T. Peripheral vascular ultrasound : how, why, and when.
2nd ed. Edinburgh: Churchill Livingstone; 2005.
5. Hollander M, Bots ML, Sol D, Iglesias A, Koudstaal PJ, Witteman JCM, et al.
Carotid plaques increase the risk of stroke and subtypes of cerebral infarction in
asymptomatic elderly: the Rotterdam study. Circulation. 2002;105:2872-2877.
6. Rundek T, Arif H, Boden-albala B, Elkind MS, Paik MC, Sacco RL. Carotid plaque,
a subclinical precursor of vascular events: the Northern Manhattan Study. Neurology.
2008;70:1200-1207.
7. Autret A, Pourcelot L, Saudeau D, Marchal C, Bertrand P, De Boisvilliers S. Stroke
risk in patients with carotid stenosis. Lancet. 1987;1:888-890.
8. Spence JD, Eliasziw M, Dicicco M, Hackam DG, Galil R, Lohmann T. Carotid
plaque area: a tool for targeting and evaluating vascular preventive therapy. Stroke.
2002;33:2916-2922.
9. Ballotta E, Angelini A, Mazzalai F, Piatto G, Toniato A, Baracchini C. Carotid
endarterectomy for symptomatic low-grade carotid stenosis. Journal of Vascular
Surgery. 2013;59:25-31.
10. Markus HS, Mackinnon A. Asymptomatic embolization detected by Doppler
ultrasound predicts stroke risk in symptomatic carotid artery stenosis. Stroke.
2005;36:971-975.
11. World Health Organization. The Atlas of Heart Disease and Stroke. 2004.
12. National Audit Office. Progress in improving stroke care. 2010.
13. Wolfe C, Rudd T. The Burden of Stroke / Stroke Alliance For Europe.; 2007.
14. Stroke Association. Stroke Statistics (Factsheet); 2013.
15. Ingall T. Stroke: incidence, mortality, morbidity and risk. Journal of Insurance
Medicine. 2004;36:143-152.

214
16. Suri JS, Kathuria C, Molinari F. Atherosclerosis disease management. New York:
Springer; 2011.
17. Underhill HR, Hatsukami TS, Cai J, Yu W, Demarco JK, Polissar NL, et al. A
noninvasive imaging approach to assess plaque severity: the carotid atherosclerosis
score. American Journal of Neuroradiology. 2010;31:1068-1075.
18. Watanabe Y, Nagayama M, Suga T, Yoshida K, Yamagata S, Okumura A, et al.
Characterization of atherosclerotic plaque of carotid arteries with histopathological
correlation: vascular wall MR imaging vs. color Doppler ultrasonography (US). Journal
of Magnetic Resonance Imaging. 2008;28:478-485.
19. Bamford J, Sandercock P, Dennis M, Burn J, Warlow C. Classification and natural
history of clinically identifiable subtypes of cerebral infarction. Lancet. 1991;337:1521-
1526.
20. Adams HP, Bendixen BH, Kappelle LJ, Biller J, Love BB, Gordon DL, et al.
Classification of subtype of acute ischemic stroke. Definitions for use in a multicenter
clinical trial. TOAST. Trial of Org 10172 in Acute Stroke Treatment. Stroke. 1993;24:35-41.
21. Hill MD, Yiannakoulias N, Jeerakathil T, Tu JV, Svenson LW, Schopflocher DP. The
high risk of stroke immediately after transient ischemic attack: a population-based
study. Neurology. 2004;62:2015-2020.
22. Lovett JK, Dennis MS, Sandercock PAG, Bamford J, Warlow CP, Rothwell PM. Very
early risk of stroke after a first transient ischemic attack. Stroke. 2003;34:E138-e140.
23. Johnston SC, Rothwell PM, Nguyen-huynh MN, Giles MF, Elkins JS, Bernstein AL,
et al. Validation and refinement of scores to predict very early stroke risk after
transient ischaemic attack. Lancet. 2007;369:283-292.
24. Khashram M, Vasudevan TM, Donnell A, Lewis DR. Correlation of the ABCD2
score with the Degree of Internal Carotid Artery Stenosis: An Observational Pilot Study.
Annals of Vascular Surgery. 2013.
25. Wolfe CD. The impact of stroke. British Medical Bulletin. 2000;56:275-286.
26. Von Sarnowski B, Schminke U, Tatlisumak T, Putaala J, Grittner U, Kaps M, et al.
Prevalence of stenoses and occlusions of brain-supplying arteries in young stroke
patients. Neurology. 2013;80:1287-1294.
27. Gemmete JJ, Davagnanam I, Toma AK, Brew S, Ganesan V. Arterial ischemic
stroke in children. Neuroimaging Clinics of North America. 2013;23:781-798.
28. Sacco RL. Newer risk factors for stroke. Neurology. 2001;57:S31-S34.

215
29. Van Den Oord SCH, Van Der Burg J, Akkus Z, Bosch JG, Van Domburg RT,
Sijbrands EJG, et al. Impact of gender on the density of intraplaque neovascularization:
A quantitative contrast-enhanced ultrasound study. Atherosclerosis. 2014;233:461-466.
30. Elkind MS, Sacco RL. Stroke risk factors and stroke prevention. Seminars in
Neurology. 1999;18:429-440.
31. Misita CP, Moll S. Antiphospholipid antibodies. Circulation. 2005;112:E39-e44.
32. Brey RL, Stallworth CL, McGlasson DL, Wozniak MA, Wityk RJ, Stern BJ, et al.
Antiphospholipid antibodies and stroke in young women. Stroke. 2002;33:2396-2400.
33. Brey RL. Antiphospholipid antibodies in young adults with stroke. Journal of
Thrombosis and Thrombolysis. 2005;20:105-112.
34. Homocysteine Studies Collaboration. Homocysteine and risk of ischemic heart
disease and stroke: a meta-analysis. Journal of the American Medical Association.
2002;288:2015-2022.
35. Lindsberg PJ, Grau AJ. Inflammation and infections as risk factors for ischemic
stroke. Stroke. 2003;34:2518-2532.
36. Marnane M, Prendeville S, McDonnell C, Noone I, Barry M, Crowe M, et al.
Plaque Inflammation and Unstable Morphology Are Associated With Early Stroke
Recurrence in Symptomatic Carotid Stenosis. Stroke. 2014.
37. Rocque BG, Jackson D, Varghese T, Hermann B, McCormick M, Kliewer M, et al.
Impaired cognitive function in patients with atherosclerotic carotid stenosis and
correlation with ultrasound strain measurements. Journal of the Neurological Sciences.
2013;322:20-24.
38. North American Symptomatic Carotid Endarterectomy Trial Collaborators.
Beneficial effect of carotid endarterectomy in symptomatic patients with high-grade
carotid stenosis. The New England Journal of Medicine. 1991;325:445-453.
39. European Carotid Surgery Trialists' Collaborative Group. MRC European Carotid
Surgery Trial: interim results for symptomatic patients with severe (70-99%) or with
mild (0-29%) carotid stenosis. Lancet. 1991;337:1235-1243.
40. Williams MA, Nicolaides AN. Predicting the normal dimensions of the internal
and external carotid arteries from the diameter of the common carotid. European
Journal of Vascular Surgery. 1987;1:91-96.

216
41. Bladin CF, Alexandrov AV, Murphy J, Maggisano R, Norris JW. Carotid Stenosis
Index. A new method of measuring internal carotid artery stenosis. Stroke. 1995;26:230-
234.
42. Cumming MJ, Morrow IM. Carotid artery stenosis: a prospective comparison of
CT angiography and conventional angiography. AJR. American Journal of Roentgenology.
1994;163:517-523.
43. Rothwell PM, Gibson RJ, Slattery J, Sellar RJ, Warlow CP. Equivalence of
measurements of carotid stenosis. A comparison of three methods on 1001
angiograms. European Carotid Surgery Trialists' Collaborative Group. Stroke.
1994;25:2435-2439.
44. Beach KW, Bergelin RO, Leotta DF, Primozich JF, Sevareid PM, Stutzman ET, et al.
Standardized ultrasound evaluation of carotid stenosis for clinical trials: University of
Washington Ultrasound Reading Center. Cardiovascular Ultrasound. 2010;8:39.
45. Moneta GL, Edwards JM, Chitwood RW, Taylor LM, Lee RW, Cummings CA, et al.
Correlation of North American Symptomatic Carotid Endarterectomy Trial (NASCET)
angiographic definition of 70% to 99% internal carotid artery stenosis with duplex
scanning. Journal of Vascular Surgery. 1993;17:152-157.
46. Zierler RE, Strandness DE. Standness's duplex scanning in vascular disorders.
4th ed. Philadelphia, London: Lippincott Williams & Wilkins; 2010.
47. Oates CP, Naylor AR, Hartshorne T, Charles SM, Fail T, Humphries K, et al. Joint
recommendations for reporting carotid ultrasound investigations in the United
Kingdom. European Journal of Vascular and Endovascular Surgery. 2008;37:251-261.
48. Carnicelli AP, Stone JJ, Doyle A, Chowdhry AK, Mix D, Ellis J, et al. Cross-
sectional area for the calculation of carotid artery stenosis on computed tomographic
angiography. Journal of Vascular Surgery. 2013;58:659-665.
49. Stary HC, Chandler AB, Glagov S, Guyton JR, Insull W, Rosenfeld ME, et al. A
definition of initial, fatty streak, and intermediate lesions of atherosclerosis. A report
from the Committee on Vascular Lesions of the Council on Arteriosclerosis, American
Heart Association. Circulation. 1994;89:2462-2478.
50. Stary HC, Chandler AB, Dinsmore RE, Fuster V, Glagov S, Insull W, et al. A
definition of advanced types of atherosclerotic lesions and a histological classification
of atherosclerosis. A report from the Committee on Vascular Lesions of the Council on
Arteriosclerosis, American Heart Association. Circulation. 1995;92:1355-1374.

217
51. Salem MK, Sayers RD, Bown MJ, West K, Moore D, Nicolaides A, et al. Patients
with recurrent ischaemic events from carotid artery disease have a large lipid core and
low GSM. European Journal of Vascular and Endovascular Surgery. 2012;43:147-153.
52. Baroncini LAV, Filho AP, Ramos SG, Martins AR, Murta LO. Histological
composition and progression of carotid plaque. Thrombosis Journal. 2007;5:4.
53. European Carotid Plaque Study Group. Carotid artery plaque composition--
relationship to clinical presentation and ultrasound B-mode imaging. European Journal
of Vascular and Endovascular Surgery. 1995;10:23-30.
54. Rakebrandt F, Crawford DC, Havard D, Coleman D, Woodcock JP. Relationship
between ultrasound texture classification images and histology of atherosclerotic
plaque. Ultrasound in Medicine & Biology. 2001;26:1393-1402.
55. Golledge J, Greenhalgh RM, Davies AH. The symptomatic carotid plaque. Stroke.
2000;31:774-781.
56. Saam T, Hetterich H, Hoffmann V, Yuan C, Dichgans M, Poppert H, et al. Meta-
analysis and systematic review of the predictive value of carotid plaque hemorrhage
on cerebrovascular events by magnetic resonance imaging. Journal of the American
College of Cardiology. 2013;62:1081-1091.
57. Ijäs P, Saksi J, Soinne L, Tuimala J, Jauhiainen M, Jula A, et al. Haptoglobin 2
allele associates with unstable carotid plaque and major cardiovascular events.
Atherosclerosis. 2013;230:228-234.
58. Nighoghossian N, Derex L, Douek P. The vulnerable carotid artery plaque:
current imaging methods and new perspectives. Stroke. 2005;36:2764-2772.
59. Carr S, Farb A, Pearce WH, Virmani R, Yao JS. Atherosclerotic plaque rupture in
symptomatic carotid artery stenosis. Journal of Vascular Surgery. 1996;23:755-n 765.
60. Woodcock JP. Characterisation of the atheromatous plaque in the carotid
arteries. Clinical Physics and Physiological Measurement. 1989;10 Suppl A:45-49.
61. Iannuzzi A, Wilcosky T, Mercuri M, Rubba P, Bryan FA, Bond MG.
Ultrasonographic correlates of carotid atherosclerosis in transient ischemic attack and
stroke. Stroke. 1995;26:614-619.
62. Heiland VM, Forsell C, Roy J, Hedin U, Gasser TC. Identification of carotid plaque
tissue properties using an experimental-numerical approach. Journal of the Mechanical
Behavior of Biomedical Materials. 2013;27:226-238.

218
63. Rothwell PM, Villagra R, Gibson R, Donders RC, Warlow CP. Evidence of a
chronic systemic cause of instability of atherosclerotic plaques. Lancet. 2000;355:19-24.
64. Hellings WE, Moll FL, De Kleijn DPV, Pasterkamp G. 10-years experience with the
Athero-Express study. Cardiovascular Diagnosis and Therapy. 2012.
65. Hellings WE, Peeters W, Moll FL, Piers SRD, Van Setten J, Van Spek D, et al.
Composition of carotid atherosclerotic plaque is associated with cardiovascular
outcome: a prognostic study. Circulation. 2010;121:1941-1950.
66. Dunmore BJ, McCarthy MJ, Naylor AR, Brindle NPJ. Carotid plaque instability and
ischemic symptoms are linked to immaturity of microvessels within plaques. Journal of
Vascular Surgery. 2007;45:155-159.
67. Shah PK. Molecular mechanisms of plaque instability. Current Opinion in
Lipidology. 2007;18:492-499.
68. Clarke MCH, Figg N, Maguire JJ, Davenport AP, Goddard M, Littlewood TD, et al.
Apoptosis of vascular smooth muscle cells induces features of plaque vulnerability in
atherosclerosis. Nature Medicine. 2006;12:1075-1080.
69. Clarke MCH, Littlewood TD, Figg N, Maguire JJ, Davenport AP, Goddard M, et al.
Chronic apoptosis of vascular smooth muscle cells accelerates atherosclerosis and
promotes calcification and medial degeneration. Circulation Research. 2008;102:1529-
1538.
70. Bennett MR. Apoptosis of vascular smooth muscle cells in vascular remodelling
and atherosclerotic plaque rupture. Cardiovascular Research. 1999;41:361-368.
71. Yu E, Calvert PA, Mercer JR, Harrison J, Baker L, Figg NL, et al. Mitochondrial DNA
damage can promote atherosclerosis independently of reactive oxygen species through
effects on smooth muscle cells and monocytes and correlates with higher-risk plaques
in humans. Circulation. 2013;128:702-712.
72. Hankey GJ, Warlow CP, Sellar RJ. Cerebral angiographic risk in mild
cerebrovascular disease. Stroke. 1990;21:209-222.
73. Gomez CR. Carotid plaque morphology and risk for stroke. Stroke. 1990;21:148-
151.
74. Houser OW, Sundt TM, Holman CB, Sandok BA, Burton RC. Atheromatous disease
of the carotid artery. Correlation of angiographic, clinical, and surgical findings. Journal
of Neurosurgery. 1974;41:321-331.

219
75. Croft RJ, Ellam LD, Harrison MJ. Accuracy of carotid angiography in the
assessment of atheroma of the internal carotid artery. Lancet. 1980;1:997-1000.
76. Eikelboom BC, Riles TR, Mintzer R, Baumann FG, Defillip G, Lin J, et al.
Inaccuracy of angiography in the diagnosis of carotid ulceration. Stroke. 1983;14:882-
885.
77. Schaar JA, Mastik F, Regar E, Uil D, Cornelis A, Gijsen FJ, et al. Current diagnostic
modalities for vulnerable plaque detection. Current Pharmaceutical Design.
2007;13:995-1001.
78. Xu D, Hippe DS, Underhill HR, Oikawa-wakayama M, Dong L, Yamada K, et al.
Prediction of High-Risk Plaque Development and Plaque Progression With the Carotid
Atherosclerosis Score. JACC. Cardiovascular Imaging. 2014.
79. Chu B, Kampschulte A, Ferguson MS, Kerwin WS, Yarnykh VL, Brien KD, et al.
Hemorrhage in the atherosclerotic carotid plaque: a high-resolution MRI study. Stroke.
2004;35:1079-1084.
80. Li Z, Howarth SPS, Tang T, Graves MJ, U-king-im J, Trivedi RA, et al. Structural
analysis and magnetic resonance imaging predict plaque vulnerability: a study
comparing symptomatic and asymptomatic individuals. Journal of Vascular Surgery.
2007;45:768-775.
81. Hatsukami TS, Ross R, Polissar NL, Yuan C. Visualization of fibrous cap
thickness and rupture in human atherosclerotic carotid plaque in vivo with high-
resolution magnetic resonance imaging. Circulation. 2000;102:959-964.
82. Geroulakos G, Ramaswami G, Nicolaides A, James K, Labropoulos N, Belcaro G,
et al. Characterization of symptomatic and asymptomatic carotid plaques using high-
resolution real-time ultrasonography. The British Journal of Surgery. 1993;80:1274-1277.
83. Balu N, Chu B, Hatsukami TS, Yuan C, Yarnykh VL. Comparison between 2D and
3D high-resolution black-blood techniques for carotid artery wall imaging in clinically
significant atherosclerosis. Journal of Magnetic Resonance Imaging. 2008;27:918-924.
84. Fayad ZA, Fuster V. Clinical imaging of the high-risk or vulnerable
atherosclerotic plaque. Circulation Research. 2001;89:305-316.
85. Van Der Meer FJ, Faber DJ, Perrée J, Pasterkamp G, Baraznji Sassoon D, Van
Leeuwen TG. Quantitative optical coherence tomography of arterial wall components.
Lasers in Medical Science. 2005;20:45-51.

220
86. Yabushita H, Bouma BE, Houser SL, Aretz HT, Jang I, Schlendorf KH, et al.
Characterization of human atherosclerosis by optical coherence tomography.
Circulation. 2002;106:1640-1645.
87. Graebe M, Pedersen SF, Højgaard L, Kjaer A, Sillesen H. 18FDG PET and
ultrasound echolucency in carotid artery plaques. JACC. Cardiovascular Imaging.
2010;3:289-295.
88. Tawakol A, Fayad ZA, Mogg R, Alon A, Klimas MT, Dansky H, et al. Intensification
of statin therapy results in a rapid reduction in atherosclerotic inflammation: results of
a multicenter fluorodeoxyglucose-positron emission tomography/computed
tomography feasibility study. Journal of the American College of Cardiology.
2013;62:909-917.
89. Schaar JA, Regar E, Mastik F, McFadden EP, Saia F, Disco C, et al. Incidence of
high-strain patterns in human coronary arteries: assessment with three-dimensional
intravascular palpography and correlation with clinical presentation. Circulation.
2004;109:2716-2719.
90. Schaar JA, Van Der Steen AFW, Mastik F, Baldewsing RA, Serruys PW.
Intravascular palpography for vulnerable plaque assessment. Journal of the American
College of Cardiology. 2006;47:C86-C91.
91. Baldewsing RA, Schaar JA, De Korte CL, Mastik F, Serruys PW, Van Steen D, et al.
Intravascular Ultrasound Elastography: A Clinician's Tool for Assessing Vulnerability and
Material Composition of Plaques. Studies in Health Technology and Informatics.
2005;113:75-96.
92. Schaar JA, De Korte CL, Mastik F, Baldewsing R, Regar E, De Feyter P, et al.
Intravascular palpography for high-risk vulnerable plaque assessment. Herz.
2003;28:488-495.
93. McCormick M, Varghese T, Wang X, Mitchell C, Kliewer MA, Dempsey RJ.
Methods for robust in vivo strain estimation in the carotid artery. Physics in Medicine
and Biology. 2012;57:7329-7353.
94. Shi H, Mitchell CC, McCormick M, Kliewer MA, Dempsey RJ, Varghese T.
Preliminary in vivo atherosclerotic carotid plaque characterization using the
accumulated axial strain and relative lateral shift strain indices. Physics in Medicine
and Biology. 2008;53:6377-6394.

221
95. Allen JD, Ham KL, Dumont DM, Sileshi B, Trahey GE, Dahl JJ. The development
and potential of acoustic radiation force impulse (ARFI) imaging for carotid artery
plaque characterization. Vascular Medicine. 2011;16:302-311.
96. Couade M, Pernot M, Prada C, Messas E, Emmerich J, Bruneval P, et al.
Quantitative assessment of arterial wall biomechanical properties using shear wave
imaging. Ultrasound in Medicine & Biology. 2011;36:1662-1676.
97. Ramnarine KV, Hartshorne T, Sensier Y, Naylor M, Walker J, Naylor AR, et al.
Tissue Doppler imaging of carotid plaque wall motion: a pilot study. Cardiovascular
Ultrasound. 2003.
98. Jansen K, Van Soest G, Van Der Steen AFW. Intravascular Photoacoustic Imaging:
A New Tool for Vulnerable Plaque Identification. Ultrasound in Medicine and Biology.
2014.
99. Wang B, Karpiouk A, Yeager D, Amirian J, Litovsky S, Smalling R, et al. In vivo
intravascular ultrasound-guided photoacoustic imaging of lipid in plaques using an
animal model of atherosclerosis. Ultrasound in Medicine & Biology. 2013;38:2098-2103.
100. Jansen K, Van Der Steen AFW, Van Beusekom HMM, Oosterhuis JW, Van Soest G.
Intravascular photoacoustic imaging of human coronary atherosclerosis. Optics Letters.
2011;36:597-599.
101. Sethuraman S, Aglyamov SR, Smalling RW, Emelianov SY. Remote temperature
estimation in intravascular photoacoustic imaging. Ultrasound in Medicine & Biology.
2007;34:299-308.
102. Emelianov S, Wang B, Su J, Karpiouk A, Yantsen E, Sokolov K, et al. Intravascular
ultrasound and photoacoustic imaging. Proceedings of the IEEE Engineering in
Medicine and Biology Society. 2009;2008:2-5.
103. Jansen K, Wu M, Van Der Steen AFW, Van Soest G. Lipid detection in
atherosclerotic human coronaries by spectroscopic intravascular photoacoustic
imaging. Optics Express. 2013;21:21472-21484.
104. Karpiouk AB, Wang B, Amirian J, Smalling RW, Emelianov SY. Feasibility of in
vivo intravascular photoacoustic imaging using integrated ultrasound and
photoacoustic imaging catheter. Journal of Biomedical Optics. 2013;17:96008-96001.
105. Allen TJ, Hall A, Dhillon AP, Owen JS, Beard PC. Spectroscopic photoacoustic
imaging of lipid-rich plaques in the human aorta in the 740 to 1400 nm wavelength
range. Journal of Biomedical Optics. 2012;17:061209.

222
106. Sethuraman S, Amirian JH, Litovsky SH, Smalling RW, Emelianov SY. Ex vivo
Characterization of Atherosclerosis using Intravascular Photoacoustic Imaging. Optics
Express. 2007;15:16657-16666.
107. Wang B, Su JL, Amirian J, Litovsky SH, Smalling R, Emelianov S. Detection of lipid
in atherosclerotic vessels using ultrasound-guided spectroscopic intravascular
photoacoustic imaging. Optics Express. 2010;18:4889-4897.
108. Wang B, Su J, Amirian J, Litovsky SH, Smalling R, Emelianov S. On the possibility
to detect lipid in atherosclerotic plaques using intravascular photoacoustic imaging.
Proceedings of the IEEE Engineering in Medicine and Biology Society. 2010;2009:4767-
4770.
109. Sethuraman S, Amirian JH, Litovsky SH, Smalling RW, Emelianov SY.
Spectroscopic intravascular photoacoustic imaging to differentiate atherosclerotic
plaques. Optics Express. 2008;16:3362-3367.
110. Jansen K, Van Der Steen AFW, Wu M, Van Beusekom HMM, Springeling G, Li X,
et al. Spectroscopic intravascular photoacoustic imaging of lipids in atherosclerosis.
Journal of Biomedical Optics. 2014;19:026006.
111. Wang B, Emelianov S. Thermal intravascular photoacoustic imaging. Biomedical
Optics Express. 2011;2:3072-3078.
112. Barbut D, Yao FS, Lo YW, Silverman R, Hager DN, Trifiletti RR, et al.
Determination of size of aortic emboli and embolic load during coronary artery bypass
grafting. The Annals of Thoracic Surgery. 1997;63:1262-1267.
113. Topakian R, King A, Kwon SU, Schaafsma A, Shipley M, Markus HS, et al.
Ultrasonic plaque echolucency and emboli signals predict stroke in asymptomatic
carotid stenosis. Neurology. 2011;77:751-758.
114. Wilson LS, Neale ML, Talhami HE, Appleberg M. Preliminary results from
attenuation-slope mapping of plaque using intravascular ultrasound. Ultrasound in
Medicine & Biology. 1994;20:529-542.
115. Bridal SL, Fornés P, Bruneval P, Berger G. Correlation of ultrasonic attenuation
(30 to 50 MHz and constituents of atherosclerotic plaque. Ultrasound in Medicine &
Biology. 1997;23:691-703.
116. Noritomi T, Sigel B, Swami V, Justin J, Gahtan V, Chen X, et al. Carotid plaque
typing by multiple-parameter ultrasonic tissue characterization. Ultrasound in Medicine
& Biology. 1997;23:643-650.

223
117. Nair A, Kuban BD, Tuzcu EM, Schoenhagen P, Nissen SE, Vince DG. Coronary
plaque classification with intravascular ultrasound radiofrequency data analysis.
Circulation. 2002;106:2200-2206.
118. Waters KR, Bridal SL, Cohen-bacrie C, Levrier C, Fornès P, Laugier P. Parametric
analysis of carotid plaque using a clinical ultrasound imaging system. Ultrasound in
Medicine & Biology. 2003;29:1521-1530.
119. Shi H, Varghese T, Dempsey RJ, Salamat MS, Zagzebski JA. Relationship between
ultrasonic attenuation, size and axial strain parameters for ex vivo atherosclerotic
carotid plaque. Ultrasound in Medicine & Biology. 2008;34:1666-1677.
120. He W, Zhang H, Shi C, Chen J, Gao J. Fly through ultrasound imaging in
assessment of carotid atherosclerosis: a pictorial essay. Clinical Imaging. 2013;37:811-
820.
121. Weinstein R. Noninvasive carotid duplex ultrasound imaging for the evaluation
and management of carotid atherosclerotic disease. Hematology/Oncology Clinics of
North America. 1992;6:1131-1139.
122. Kingstone LL, Torres C, Currie G. A Systematic Literature Review of
Ultrasonography for Morphology and Characterization of Vulnerable Carotid Artery
Plaques. Journal for Vascular Ultrasound. 2012;36:191-198.
123. Geroulakos G, Hobson RW, Nicolaides A. Ultrasonographic carotid plaque
morphology in predicting stroke risk. British Journal of Surgery. 1996;83:582-587.
124. Gray-weale AC, Graham JC, Burnett JR, Byrne K, Lusby RJ. Carotid artery
atheroma: comparison of preoperative B-mode ultrasound appearance with carotid
endarterectomy specimen pathology. The Journal of Cardiovascular Surgery.
1988;29:676-681.
125. Lal BK, Hobson RW, Pappas PJ, Kubicka R, Hameed M, Chakhtoura EY, et al.
Pixel distribution analysis of B-mode ultrasound scan images predicts histologic
features of atherosclerotic carotid plaques. Journal of Vascular Surgery. 2002;35:1210-
1217.
126. Lal BK, Hobson RW, Hameed M, Pappas PJ, Padberg FT, Jamil Z, et al.
Noninvasive identification of the unstable carotid plaque. Annals of Vascular Surgery.
2006;20:167-174.

224
127. Poepping TL, Rankin RN, Holdsworth DW. Flow patterns in carotid bifurcation
models using pulsed Doppler ultrasound: effect of concentric vs. eccentric stenosis on
turbulence and recirculation. Ultrasound in Medicine & Biology. 2010;36:1125-1134.
128. Tsiaparas NN, Golemati S, Andreadis I, Stoitsis J, Valavanis I, Nikita KS.
Assessment of carotid atherosclerosis from B-mode ultrasound images using
directional multiscale texture features. Measurement Science and Technology. 2012.
129. Elatrozy T, Nicolaides A, Tegos T, Griffin M. The objective characterisation of
ultrasonic carotid plaque features. European Journal of Vascular and Endovascular
Surgery. 1998;16:223-230.
130. Geroulakos G, Domjan J, Nicolaides A, Stevens J, Labropoulos N, Ramaswami G,
et al. Ultrasonic carotid artery plaque structure and the risk of cerebral infarction on
computed tomography. Journal of Vascular Surgery. 1994;20:263-266.
131. Tegos TJ, Stavropoulos P, Sabetai MM, Khodabakhsh P, Sassano A, Nicolaides
AN. Determinants of carotid plaque instability: echoicity versus heterogeneity.
European Journal of Vascular and Endovascular Surgery. 2001;22:22-30.
132. El-barghouty N, Geroulakos G, Nicolaides A, Androulakis A, Bahal V. Computer-
assisted carotid plaque characterisation. European Journal of Vascular and
Endovascular Surgery. 1995;9:389-393.
133. El-barghouty N, Nicolaides A, Bahal V, Geroulakos G, Androulakis A. The
identification of the high risk carotid plaque. European Journal of Vascular and
Endovascular Surgery. 1996;11:470-478.
134. Grønholdt ML, Nordestgaard BG, Schroeder TV, Vorstrup S, Sillesen H. Ultrasonic
echolucent carotid plaques predict future strokes. Circulation. 2001;104:68-73.
135. Polak JF, Shemanski L, Leary DH, Lefkowitz D, Price TR, Savage PJ, et al.
Hypoechoic plaque at US of the carotid artery: an independent risk factor for incident
stroke in adults aged 65 years or older. Cardiovascular Health Study. Radiology.
1998;208:649-654.
136. Mathiesen EB, Bønaa KH, Joakimsen O. Echolucent plaques are associated with
high risk of ischemic cerebrovascular events in carotid stenosis: the tromsø study.
Circulation. 2001;103:2171-2175.
137. Sabetai MM, Tegos TJ, Nicolaides AN, Dhanjil S, Pare GJ, Stevens JM.
Reproducibility of computer-quantified carotid plaque echogenicity: can we overcome
the subjectivity? Stroke. 2000;31:2189-2196.
225
138. Biasi GM, Froio A, Diethrich EB, Deleo G, Galimberti S, Mingazzini P, et al.
Carotid plaque echolucency increases the risk of stroke in carotid stenting: the Imaging
in Carotid Angioplasty and Risk of Stroke (ICAROS) study. Circulation. 2004;110:756-762.
139. Pavela J, Ahanchi S, Steerman SN, Higgins JA, Panneton JM. Grayscale median
analysis of primary stenosis and restenosis after carotid endarterectomy. Journal of
Vascular Surgery. 2013.
140. Biasi GM, Sampaolo A, Mingazzini P, De Amicis P, El-barghouty N, Nicolaides AN.
Computer analysis of ultrasonic plaque echolucency in identifying high risk carotid
bifurcation lesions. European Journal of Vascular and Endovascular Surgery.
1999;17:476-479.
141. Seo Y, Watanabe S, Ishizu T, Moriyama N, Takeyasu N, Maeda H, et al.
Echolucent carotid plaques as a feature in patients with acute coronary syndrome.
Circulation Journal. 2006;70:1629-1634.
142. Holdsworth RJ, McCollum PT, Bryce JS, Harrison DK. Symptoms, stenosis and
carotid plaque morphology. Is plaque morphology relevant? European Journal of
Vascular and Endovascular Surgery. 1995;9:80-85.
143. Aburahma AF, Wulu JT, Crotty B. Carotid plaque ultrasonic heterogeneity and
severity of stenosis. Stroke. 2002;33:1772-1775.
144. Kardoulas DG, Katsamouris AN, Gallis PT, Philippides TP, Anagnostakos NK,
Gorgoyannis DS, et al. Ultrasonographic and histologic characteristics of symptom-free
and symptomatic carotid plaque. Cardiovascular Surgery. 1996;4:580-590.
145. Van Damme H, Vivario M. Pathologic aspects of carotid plaques: surgical and
clinical significance. International Angiology. 1993;12:299-311.
146. Ruiz-ares G, Fuentes B, Martínez-sánchez P, Martínez-martínez M, Díez-tejedor
E. Utility of the assessment of echogenicity in the identification of symptomatic carotid
artery atheroma plaques in ischemic stroke patients. Cerebrovascular Diseases.
2012;32:535-541.
147. Elatrozy TS, Zarka ZA, Griffin M, Tegos T, Nicolaides A. The way to standardize
reporting on carotid plaque echodensity: application of image processing techniques.
Presented at the 8th Mediterranean congress of angiology and vascular surgery,
Alexandria, 31 May-3 April 1997.

226
148. Elatrozy T, Nicolaides A, Tegos T, Zarka AZ, Griffin M, Sabetai M. The effect of B-
mode ultrasonic image standardisation on the echodensity of symptomatic and
asymptomatic carotid bifurcation plaques. International Angiology. 1998;17:179-186.
149. De Bray JM, Baud JM, Dauzat M. Consensus Concerning the Morphology and the
Risk of Carotid Plaques. Cerebrovascular Diseases. 1997;7:289-296.
150. Van Swijndregt ADM, Elbers HRJ, Moll FL, De Letter J, Ackerstaff RGA.
Ultrasonographic characterization of carotid plaques. Ultrasound in Medicine and
Biology. 1998;24:489-493.
151. Joakimsen O, Bønaa KH, Stensland-bugge E. Reproducibility of ultrasound
assessment of carotid plaque occurrence, thickness, and morphology. The Tromsø
Study. Stroke. 1997;28:2201-2207.
152. Wilhjelm JE, Grønholdt ML, Wiebe B, Jespersen SK, Hansen LK, Sillesen H.
Quantitative analysis of ultrasound B-mode images of carotid atherosclerotic plaque:
correlation with visual classification and histological examination. IEEE Transactions on
Medical Imaging. 1999;17:910-922.
153. Christodoulou CI, Pattichis CS, Pantziaris M, Nicolaides A. Texture-based
classification of atherosclerotic carotid plaques. IEEE Transactions on Medical Imaging.
2003;22:902-912.
154. Golemati S, Tegos TJ, Sassano A, Nikita KS, Nicolaides AN. Echogenicity of B-
mode sonographic images of the carotid artery: work in progress. Journal of Ultrasound
in Medicine. 2004;23:659-669.
155. Lind L, Andersson J, Rönn M, Gustavsson T. The echogenecity of the intima-
media complex in the common carotid artery is closely related to the echogenecity in
plaques. Atherosclerosis. 2007;195:411-414.
156. Droste DW, Karl M, Bohle RM, Kaps M. Comparison of ultrasonic and
histopathological features of carotid artery stenosis. Neurological Research.
1997;19:380-384.
157. Grønholdt ML, Wiebe BM, Laursen H, Nielsen TG, Schroeder TV, Sillesen H. Lipid-
rich carotid artery plaques appear echolucent on ultrasound B-mode images and may
be associated with intraplaque haemorrhage. European Journal of Vascular and
Endovascular Surgery. 1998;14:439-445.
158. Golledge J, Cuming R, Ellis M, Davies AH, Greenhalgh RM. Carotid plaque
characteristics and presenting symptom. British Journal of Surgery. 1998;84:1697-1701.

227
159. Liapis CD, Kakisis JD, Kostakis AG. Carotid stenosis: factors affecting
symptomatology. Stroke. 2001;32:2782-2786.
160. Grogan JK, Shaalan WE, Cheng H, Gewertz B, Desai T, Schwarze G, et al. B-mode
ultrasonographic characterization of carotid atherosclerotic plaques in symptomatic
and asymptomatic patients. Journal of Vascular Surgery. 2005;42:435-441.
161. Kalogeropoulos A, Terzis G, Chrysanthopoulou A, Hahalis G, Siablis D,
Alexopoulos D. Risk for transient ischemic attacks is mainly determined by intima-
media thickness and carotid plaque echogenicity. Atherosclerosis. 2006;192:190-196.
162. Ding S, Zhang M, Zhao Y, Chen W, Yao G, Zhang C, et al. The role of carotid
plaque vulnerability and inflammation in the pathogenesis of acute ischemic stroke.
The American Journal of the Medical Sciences. 2008;336:27-31.
163. Rosenkranz M, Wittkugel O, Waiblinger C, Thomalla G, Krutzelmann A,
Havemeister S, et al. Cerebral embolism during carotid artery stenting: role of carotid
plaque echolucency. Cerebrovascular Diseases. 2009;27:443-449.
164. Dósa E, Hirschberg K, Apor A, Járányi Z, Entz L, Acsády G, et al. Echolucent or
predominantly echolucent femoral plaques predict early restenosis after eversion
carotid endarterectomy. Journal of Vascular Surgery. 2010;51:345-350.
165. Staub D, Partovi S, Schinkel AFL, Coll B, Uthoff H, Aschwanden M, et al.
Correlation of carotid artery atherosclerotic lesion echogenicity and severity at
standard US with intraplaque neovascularization detected at contrast-enhanced US.
Radiology. 2011;258:618-626.
166. Kolkert JL, Meerwaldt R, Loonstra J, Schenk M, Van Der Palen J, Van Dungen D,
et al. Relation between B-mode Gray-scale Median and Clinical Features of Carotid
Stenosis Vulnerability. Annals of Vascular Surgery. 2013.
167. Irie Y, Katakami N, Kaneto H, Takahara M, Nishio M, Kasami R, et al. The utility
of ultrasonic tissue characterization of carotid plaque in the prediction of
cardiovascular events in diabetic patients. Atherosclerosis. 2013;230:399-405.
168. Singh AS, Atam V, Jain N, Yathish BE, Patil MR, Das L. Association of carotid
plaque echogenicity with recurrence of ischemic stroke. North American Journal of
Medical Sciences. 2013;5:371-376.
169. Moore WS, Boren C, Malone JM, Roon AJ, Eisenberg R, Goldstone J, et al. Natural
history of nonstenotic, asymptomatic ulcerative lesions of the carotid artery. Archives
of Surgery. 1978;113:1352-1359.

228
170. Fisher M, Paganini-hill A, Martin A, Cosgrove M, Toole JF, Barnett HJM, et al.
Carotid plaque pathology: thrombosis, ulceration, and stroke pathogenesis. Stroke.
2005;36:253-257.
171. Sitzer M, Müller W, Siebler M, Hort W, Kniemeyer HW, Jäncke L, et al. Plaque
ulceration and lumen thrombus are the main sources of cerebral microemboli in high-
grade internal carotid artery stenosis. Stroke. 1995;26:1231-1233.
172. Aburahma AF, Kyer PD, Robinson PA, Hannay RS. The correlation of ultrasonic
carotid plaque morphology and carotid plaque hemorrhage: clinical implications.
Surgery. 1998;124:721-n 726.
173. Kuk M, Wannarong T, Beletsky V, Parraga G, Fenster A, Spence JD. Volume of
Carotid Artery Ulceration as a Predictor of Cardiovascular Events. Stroke. 2014.
174. Prati P, Tosetto A, Casaroli M, Bignamini A, Canciani L, Bornstein N, et al.
Carotid plaque morphology improves stroke risk prediction: usefulness of a new
ultrasonographic score. Cerebrovascular Diseases. 2011;31:300-304.
175. Handa N, Matsumoto M, Maeda H, Hougaku H, Kamada T. Ischemic stroke
events and carotid atherosclerosis. Results of the Osaka Follow-up Study for
Ultrasonographic Assessment of Carotid Atherosclerosis (the OSACA Study). Stroke.
1995;26:1781-1786.
176. Eliasziw M, Streifler JY, Fox AJ, Hachinski VC, Ferguson GG, Barnett HJ.
Significance of plaque ulceration in symptomatic patients with high-grade carotid
stenosis. North American Symptomatic Carotid Endarterectomy Trial. Stroke.
1994;25:304-308.
177. Rothwell PM, Gibson R, Warlow CP. Interrelation between plaque surface
morphology and degree of stenosis on carotid angiograms and the risk of ischemic
stroke in patients with symptomatic carotid stenosis. On behalf of the European
Carotid Surgery Trialists' Collaborative Group. Stroke. 2000;31:615-621.
178. Rosenkranz M, Russjan A, Goebell E, Havemeister S, Thomalla G, Cheng B, et al.
Carotid plaque surface irregularity predicts cerebral embolism during carotid artery
stenting. Cerebrovascular Diseases. 2012;32:163-169.
179. Pedro LM, Fernandes J, Pedro MM, Gonçalves I, Dias NV, Fernandes R, et al.
Ultrasonographic risk score of carotid plaques. European Journal of Vascular and
Endovascular Surgery. 2002;24:492-498.

229
180. Carra G, Visonà A, Bonanome A, Lusiani L, Pesavento R, Bortolon M, et al.
Carotid plaque morphology and cerebrovascular events. International Angiology.
2003;22:284-289.
181. Ten Kate GL, Van Dijk AC, Van Den Oord SCH, Hussain B, Verhagen HJM,
Sijbrands EJG, et al. Usefulness of contrast-enhanced ultrasound for detection of
carotid plaque ulceration in patients with symptomatic carotid atherosclerosis. The
American Journal of Cardiology. 2013;112:292-298.
182. Barry R, Pienaar C, Nel CJ. Accuracy of B-mode ultrasonography in detecting
carotid plaque hemorrhage and ulceration. Annals of Vascular Surgery. 1990;4:466-470.
183. Bluth EI, McVay LV, Merritt CR, Sullivan MA. The identification of ulcerative
plaque with high resolution duplex carotid scanning. Journal of Ultrasound in
Medicine. 1988;7:73-76.
184. Hennerici M, Baezner H, Daffertshofer M. Ultrasound and arterial wall disease.
Cerebrovascular Diseases. 2003;17 Suppl 1:19-33.
185. Stoitsis J, Golemati S, Nikita KS, Nicolaides AN. Characterization of carotid
atherosclerosis based on motion and texture features and clustering using fuzzy c-
means. Proceedings of the IEEE Engineering in Medicine and Biology Society.
2007;2:1407-1410.
186. Asvestas P, Golemati S, Matsopoulos GK, Nikita KS, Nicolaides AN. Fractal
dimension estimation of carotid atherosclerotic plaques from B-mode ultrasound: a
pilot study. Ultrasound in Medicine & Biology. 2002;28:1129-1136.
187. Kakkos SK, Griffin MB, Nicolaides AN, Kyriacou E, Sabetai MM, Tegos T, et al. The
size of juxtaluminal hypoechoic area in ultrasound images of asymptomatic carotid
plaques predicts the occurrence of stroke. Journal of Vascular Surgery. 2013;57:609-618.
188. Acharya UR, Sree SV, Krishnan MMR, Molinari F, Saba L, Ho SYS, et al.
Atherosclerotic risk stratification strategy for carotid arteries using texture-based
features. Ultrasound in Medicine & Biology. 2012;38:899-915.
189. Tsiaparas NN, Golemati S, Andreadis I, Stoitsis JS, Valavanis I, Nikita KS.
Comparison of multiresolution features for texture classification of carotid
atherosclerosis from B-mode ultrasound. IEEE Transactions on Information Technology
in Biomedicine. 2011;15:130-137.

230
190. Mougiakakou SGR, Golemati S, Gousias I, Nicolaides AN, Nikita KS. Computer-
aided diagnosis of carotid atherosclerosis based on ultrasound image statistics, laws'
texture and neural networks. Ultrasound in Medicine & Biology. 2006;33:26-36.
191. Thornhill RE, Lum C, Jaberi A, Stefanski P, Torres CH, Momoli F, et al. Can Shape
Analysis Differentiate Free-floating Internal Carotid Artery Thrombus from
Atherosclerotic Plaque in Patients Evaluated with CTA for Stroke or Transient Ischemic
Attack? Academic Radiology. 2014;21:345-354.
192. Sztajzel R, Momjian S, Momjian-mayor I, Murith N, Djebaili K, Boissard G, et al.
Stratified gray-scale median analysis and color mapping of the carotid plaque:
correlation with endarterectomy specimen histology of 28 patients. Stroke. 2005;36:741-
745.
193. Ogata J, Masuda J, Yutani C, Yamaguchi T. Rupture of atheromatous plaque as a
cause of thrombotic occlusion of stenotic internal carotid artery. Stroke. 1990;21:1740-
1745.
194. Moon WK, Lo C, Huang C, Chen J, Chang R. Computer-aided diagnosis based on
speckle patterns in ultrasound images. Ultrasound in Medicine & Biology. 2012;38:1251-
1261.
195. Zhang PF, Su HJ, Yao GH, Wu W, Zhang M, Liu CX, et al. Plaque volume
compression ratio, a novel biomechanical index, is independently associated with
ischemic cerebrovascular events. Journal of Hypertension. 2009;27:348-356.
196. Golemati S, Sassano A, Lever MJ, Bharath AA, Dhanjil S, Nicolaides AN. Carotid
artery wall motion estimated from B-mode ultrasound using region tracking and block
matching. Ultrasound in Medicine & Biology. 2003;29:387-399.
197. Bang J, Dahl T, Bruinsma A, Kaspersen JH, Nagelhus Hernes TA, Myhre HO. A
new method for analysis of motion of carotid plaques from RF ultrasound images.
Ultrasound in Medicine & Biology. 2003;29:967-976.
198. Kashiwazaki D, Yoshimoto T, Mikami T, Muraki M, Fujimoto S, Abiko K, et al.
Identification of high-risk carotid artery stenosis: motion of intraplaque contents
detected using B-mode ultrasonography. Journal of Neurosurgery. 2013;117:574-578.
199. Chan KL. Two approaches to motion analysis of the ultrasound image sequence
of carotid atheromatous plaque. Ultrasonics. 1993;31:117-123.

231
200. Meairs S, Hennerici M. Four-dimensional ultrasonographic characterization of
plaque surface motion in patients with symptomatic and asymptomatic carotid artery
stenosis. Stroke. 1999;30:1807-1813.
201. Dahl T, Bang J, Ushakova A, Lydersen S, Myhre HO. Parameters describing
motion in carotid artery plaques from ultrasound examination: A reproducibility study.
Ultrasound in Medicine & Biology. 2004;30:1133-1143.
202. Akkus Z, Ramnarine KV. Dynamic assessment of carotid plaque motion.
Ultrasound. 2010;18:140-147.
203. Momjian-mayor I, Kuzmanovic I, Momjian S, Bonvin C, Albanese S, Bichsel D, et
al. Accuracy of a novel risk index combining degree of stenosis of the carotid artery
and plaque surface echogenicity. Stroke. 2012;43:1260-1265.
204. Tahmasebpour HR, Buckley AR, Cooperberg PL, Fix CH. Sonographic examination
of the carotid arteries. Radiographics. 2005;25:1561-1575.
205. Martin AJ, Ryan LK, Gotlieb AI, Henkelman RM, Foster FS. Arterial imaging:
comparison of high-resolution US and MR imaging with histologic correlation.
Radiographics. 1997;17:189-202.
206. Naylor AR. You May Delay, but Time Will Not. Stroke. 2014.
207. Webb S. The Physics of medical imaging. Institute of Physics Publishing; 1988.
208. McGahan JP, Goldberg BB. Diagnostic ultrasound. 2nd ed. New York; London:
Informa Healthcare; 2008.
209. Wells PNT. Physical principles of ultrasonic diagnosis. London: Academic Press;
1969.
210. Duck FA, Baker AC, Starritt HC. Ultrasound in medicine. Philadelphia, Pa:
Institute of Physics Publishing; 1998.
211. Culjat MO, Goldenberg D, Tewari P, Singh RS. A review of tissue substitutes for
ultrasound imaging. Ultrasound in Medicine & Biology. 2010;36:861-873.
212. Laland J. US data for solids (web resource:
http://traktoria.org/files/sonar/passive_materials/acoustic_impedace_of_some_solids.ht
m).
213. European Federation of Societies for Ultrasound in Medicine. Safety of
ultrasound. Journal of Perinatal Medicine. 1984;12:289-290.
214. Bromer RH, Mitchell JB, Soares N. Response of human hematopoietic precursor
cells (CFUc) to hyperthermia and radiation. Cancer Research. 1982;42:1261-1265.

232
215. World Federation for Ultrasound in Medicine. WFUMB Symposium on Safety of
Ultrasound in Medicine: Conclusions and recommendations on thermal and non-
thermal mechanisms for biological effects of ultrasound. Ultrasound in Medicine &
Biology. 1998;24:1-55.
216. Safety Group of the British Medical Ultrasound Society. Guidelines for the safe
use of diagnostic ultrasound equipment. BMUS Bulletin. 2000.
217. Kanber B, Ramnarine KV. A Probabilistic Approach to Computerized Tracking of
Arterial Walls in Ultrasound Image Sequences. ISRN Signal Processing. 2012.
218. Selzer RH, Mack WJ, Lee PL, Kwong-fu H, Hodis HN. Improved common carotid
elasticity and intima-media thickness measurements from computer analysis of
sequential ultrasound frames. Atherosclerosis. 2001;154:185-193.
219. Wendelhag I, Liang Q, Gustavsson T, Wikstrand J. A new automated
computerized analyzing system simplifies readings and reduces the variability in
ultrasound measurement of intima-media thickness. Stroke. 1997;28:2195-2200.
220. Beux F, Carmassi S, Salvetti MV, Ghiadoni L, Huang Y, Taddei S, et al. Automatic
evaluation of arterial diameter variation from vascular echographic images. Ultrasound
in Medicine & Biology. 2002;27:1621-1629.
221. Cheng D, Schmidt-trucksäss A, Cheng K, Burkhardt H. Using snakes to detect
the intimal and adventitial layers of the common carotid artery wall in sonographic
images. Computer Methods and Programs in Biomedicine. 2002;67:27-37.
222. Newey VR, Nassiri DK. Online artery diameter measurement in ultrasound
images using artificial neural networks. Ultrasound in Medicine & Biology. 2002;28:209-
216.
223. Chen C, Chou Y, Chen CSK, Cheng J, Ou Y, Yeh F, et al. Cell-competition
algorithm: a new segmentation algorithm for multiple objects with irregular boundaries
in ultrasound images. Ultrasound in Medicine & Biology. 2005;31:1647-1664.
224. Hii A, Hann CE, Chase JG, Van Houten EEW. Fast normalized cross correlation for
motion tracking using basis functions. Computer Methods and Programs in
Biomedicine. 2006;82:144-156.
225. Cardinal MR, Meunier J, Soulez G, Maurice RL, Therasse E, Cloutier G.
Intravascular ultrasound image segmentation: a three-dimensional fast-marching
method based on gray level distributions. IEEE Transactions on Medical Imaging. 2006.

233
226. Golemati S, Stoitsis J, Sifakis EG, Balkizas T, Nikita KS. Using the Hough
transform to segment ultrasound images of longitudinal and transverse sections of the
carotid artery. Ultrasound in Medicine & Biology. 2007;33:1918-1932.
227. Mendizabal-ruiz G, Rivera M, Kakadiaris IA. A probabilistic segmentation
method for the identification of luminal borders in intravascular ultrasound images.
IEEE Conference on Computer Vision and Pattern Recognition. 2008.
228. Yang X, Ding M, Lou L, Yuchi M, Qiu W, Sun Y. Common Carotid Artery Lumen
Segmentation in B-mode Ultrasound Transverse View Images. International Journal of
Image Graphics and Signal Processing. 2011;5:15-21.
229. Bellman RE, Dreyfus SE. Applied dynamic programming, by Richard E. Bellman
and Stuart E. Dreyfus. Princeton, N.J., Princeton University Press; 1962.
230. Noble JA, Boukerroui D. Ultrasound Image Segmentation: A Survey. IEEE
Transactions on Medical Imaging. 2006;25:987-1010.
231. Ramnarine KV, Kanber B, Panerai RB. Assessing the performance of vessel wall
tracking algorithms: the importance of the test phantom. Journal of Physics Conference
Series. 2004;1:199-204.
232. Claridge MW, Bate GR, Dineley JA, Hoskins PR, Marshall T, Adam DA, et al. A
reproducibility study of a TDI-based method to calculate indices of arterial stiffness.
Ultrasound in Medicine & Biology. 2007;34:215-220.
233. Teirlinck CJP, Bezemer RA, Kollmann C, Lubbers J, Hoskins PR, Ramnarine KV, et
al. Development of an example flow test object and comparison of five of these test
objects, constructed in various laboratories. Ultrasonics. 1998;36:653-660.
234. Ramnarine KV, Nassiri DK, Hoskins PR, Lubbers J. Validation of a new blood-
mimicking fluid for use in Doppler flow test objects. Ultrasound in Medicine & Biology.
1998;24:451-459.
235. Ramnarine KV, Hoskins PR, Routh HF, Davidson F. Doppler backscatter
properties of a blood-mimicking fluid for Doppler performance assessment. Ultrasound
in Medicine & Biology. 1999;25:105-110.
236. Germond L, Bonnefous O, Loupas T. Quantitative assessment of the artery
dilation measurements with an arterial phantom. IEEE Ultrasonics Symposium. 2001.
237. Matlab Central File Exchange. Region Growing (2D/3D greyscale). 2011.
234
238. Kanber B, Hartshorne TC, Horsfield MA, Naylor AR, Robinson TG, Ramnarine KV.
Dynamic variations in the ultrasound greyscale median of carotid artery plaques.
Cardiovascular Ultrasound. 2013;11:21.
239. Olshansky B, Collins SM, Skorton DJ, Prasad NV. Variation of left ventricular
myocardial gray level on two-dimensional echocardiograms as a result of cardiac
contraction. Circulation. 1984;70:972-977.
240. Grant EG, Benson CB, Moneta GL, Alexandrov AV, Baker JD, Bluth EI, et al.
Carotid artery stenosis: gray-scale and Doppler US diagnosis--Society of Radiologists in
Ultrasound Consensus Conference. Radiology. 2003;229:340-346.
241. Jansen M, Van Alfen N, Nijhuis Van Der Sanden MWG, Van Dijk JP, Pillen S, De
Groot IJM. Quantitative muscle ultrasound is a promising longitudinal follow-up tool in
Duchenne muscular dystrophy. Neuromuscular Disorders. 2012;22:306-317.
242. Lewis JP. Fast Normalized Cross-Correlation. Vision Interface. 1995.
243. Kanber B, Hartshorne TC, Horsfield MA, Naylor AR, Robinson TG, Ramnarine KV.
Quantitative assessment of carotid plaque surface irregularities and correlation to
cerebrovascular symptoms. Cardiovascular Ultrasound. 2013;11:38.
244. Leary DH, Holen J, Ricotta JJ, Roe S, Schenk EA. Carotid bifurcation disease:
prediction of ulceration with B-mode US. Radiology. 1987;162:523-525.
245. Muraki M, Mikami T, Yoshimoto T, Fujimoto S, Tokuda K, Kaneko S, et al. New
criteria for the sonographic diagnosis of a plaque ulcer in the extracranial carotid
artery. American Journal of Roentgenology. 2012;198:1161-1166.
246. Schminke U, Motsch L, Hilker L, Kessler C. Three-dimensional ultrasound
observation of carotid artery plaque ulceration. Stroke. 2000;31:1651-1655.
247. Sitzer M, Müller W, Rademacher J, Siebler M, Hort W, Kniemeyer HW, et al.
Color-flow Doppler-assisted duplex imaging fails to detect ulceration in high-grade
internal carotid artery stenosis. Journal of Vascular Surgery. 1996;23:461-465.
248. Steinke W, Hennerici M, Rautenberg W, Mohr JP. Symptomatic and
asymptomatic high-grade carotid stenoses in Doppler color-flow imaging. Neurology.
1992;42:131-138.
249. Young N, Soo YS, Fischer P. Comparison of duplex ultrasound with angiography
in assessment of carotid bifurcation disease. Australasian Radiology. 1992;36:54-58.

235
250. Aburahma AF, Covelli MA, Robinson PA, Holt SM. The role of carotid duplex
ultrasound in evaluating plaque morphology: potential use in selecting patients for
carotid stenting. Journal of Endovascular Surgery. 1999;6:59-65.
251. Kessler C, Von Maravic M, Brückmann H, Kömpf D. Ultrasound for the
assessment of the embolic risk of carotid plaques. Acta Neurologica Scandinavica.
1995;92:231-234.
252. Manolio TA, Burke GL, Leary DH, Evans G, Beauchamp N, Knepper L, et al.
Relationships of cerebral MRI findings to ultrasonographic carotid atherosclerosis in
older adults : the Cardiovascular Health Study. CHS Collaborative Research Group.
Arteriosclerosis Thrombosis and Vascular Biology. 1999;19:356-365.
253. Pedro LM, Pedro MM, Gonçalves I, Carneiro TF, Balsinha C, Fernandes R, et al.
Computer-assisted carotid plaque analysis: characteristics of plaques associated with
cerebrovascular symptoms and cerebral infarction. European Journal of Vascular and
Endovascular Surgery. 2000;19:118-123.
254. Ding S, Zhang M, Zhao Y, Chen W, Yao G, Zhang C, et al. The role of carotid
plaque vulnerability and inflammation in the pathogenesis of acute ischemic stroke.
American Journal of the Medical Sciences. 2008;336:27-31.
255. Denzel C, Fellner F, Wutke R, Bazler K, Müller K, Lang W. Ultrasonographic
analysis of arteriosclerotic plaques in the internal carotid artery. European Journal of
Ultrasound. 2003;16:161-167.
256. Gaunt ME, Brown L, Hartshorne T, Bell PR, Naylor AR. Unstable carotid plaques:
preoperative identification and association with intraoperative embolisation detected
by transcranial Doppler. European Journal of Vascular and Endovascular Surgery.
1996;11:78-82.
257. Rubin JR, Bondi JA, Rhodes RS. Duplex scanning versus conventional
arteriography for the evaluation of carotid artery plaque morphology. Surgery.
1987;102:749-755.
258. Widder B, Paulat K, Hackspacher J, Hamann H, Hutschenreiter S, Kreutzer C, et
al. Morphological characterization of carotid artery stenoses by ultrasound duplex
scanning. Ultrasound in Medicine and Biology. 1990;16:349-354.
259. Wolverson MK, Bashiti HM, Peterson GJ. Ultrasonic tissue characterization of
atheromatous plaques using a high resolution real time scanner. Ultrasound in
Medicine and Biology. 1983;9:599-609.

236
260. Comerota AJ, Katz ML, White JV, Grosh JD. The preoperative diagnosis of the
ulcerated carotid atheroma. Journal of Vascular Surgery. 1990;11:505-510.
261. European Carotid Plaque Study Group. Carotid artery plaque composition--
relationship to clinical presentation and ultrasound B-mode imaging. European Journal
of Vascular and Endovascular Surgery. 1995;10:23-30.
262. Prabhakaran S, Rundek T, Ramas R, Elkind MSV, Paik MC, Boden-albala B, et al.
Carotid plaque surface irregularity predicts ischemic stroke: the northern Manhattan
study. Stroke. 2006;37:2696-2701.
263. Tegos TJ, Kalomiris KJ, Sabetai MM, Kalodiki E, Nicolaides AN. Significance of
sonographic tissue and surface characteristics of carotid plaques. American Journal of
Neuroradiology. 2001;22:1605-1612.
264. Chiu B, Beletsky V, Spence JD, Parraga G, Fenster A. Analysis of carotid lumen
surface morphology using three-dimensional ultrasound imaging. Physics in Medicine
and Biology. 2009;54:1149-1167.
265. Fenster A, Blake C, Gyacskov I, Landry A, Spence JD. 3D ultrasound analysis of
carotid plaque volume and surface morphology. Ultrasonics. 2006;44 Suppl 1:E153-E157.
266. Kanber B, Hartshorne TC, Horsfield MA, Naylor AR, Robinson TG, Ramnarine KV.
Wall motion in the stenotic carotid artery: association with greyscale plaque
characteristics, the degree of stenosis and cerebrovascular symptoms. Cardiovascular
Ultrasound. 2013;11:37.
267. Ramnarine KV, Garrard JW, Dexter K, Nduwayo S, Panerai RB, Robinson TG. Shear
wave elastography assessment of carotid plaque stiffness: in-vitro reproducibility
study. Ultrasound in Medicine and Biology (in Press). 2013.
268. Dijk JM, Van Der Graaf Y, Grobbee DE, Banga JD, Bots ML. Increased arterial
stiffness is independently related to cerebrovascular disease and aneurysms of the
abdominal aorta: the Second Manifestations of Arterial Disease (SMART) Study. Stroke.
2004;35:1642-1646.
269. Leone N, Ducimetière P, Gariépy J, Courbon D, Tzourio C, Dartigues J, et al.
Distension of the carotid artery and risk of coronary events: the three-city study.
Arteriosclerosis Thrombosis and Vascular Biology. 2008;28:1392-1397.
270. Agabiti-rosei E, Muiesan ML. Carotid atherosclerosis, arterial stiffness and
stroke events. Advances in Cardiology. 2006;44:173-186.

237
271. Rothwell PM. Carotid artery disease and the risk of ischaemic stroke and
coronary vascular events. Cerebrovascular Diseases. 2000;10 Suppl 5:21-33.
272. Lenzi GL, Vicenzini E. The ruler is dead: an analysis of carotid plaque motion.
Cerebrovascular Diseases. 2006;23:121-125.
273. Kashiwazaki D, Yoshimoto T, Mikami T, Muraki M, Fujimoto S, Abiko K, et al.
Identification of high-risk carotid artery stenosis: motion of intraplaque contents
detected using B-mode ultrasonography. Journal of Neurosurgery. 2013;117:574-578.
274. Kume S, Hama S, Yamane K, Wada S, Nishida T, Kurisu K. Vulnerable carotid
arterial plaque causing repeated ischemic stroke can be detected with B-mode
ultrasonography as a mobile component: Jellyfish sign. Neurosurgical Review.
2011;33:419-430.
275. Giannattasio C, Failla M, Emanuelli G, Grappiolo A, Boffi L, Corsi D, et al. Local
effects of atherosclerotic plaque on arterial distensibility. Hypertension. 2001;38:1177-
1180.
276. Lee KW, Wood NB, Xu XY. Ultrasound image-based computer model of a
common carotid artery with a plaque. Medical Engineering & Physics. 2004;26:823-840.
277. Hsu H, Chen Y, Sheu WH, Sheng W, Chao A. Comparison of brachial artery flow-
mediated vasodilatation in symptomatic and asymptomatic patients with carotid
arterial stenosis. The American Journal of Cardiology. 2002;90:814-816.
278. Paini A, Boutouyrie P, Calvet D, Zidi M, Agabiti-rosei E, Laurent S. Multiaxial
mechanical characteristics of carotid plaque: analysis by multiarray echotracking
system. Stroke. 2006;38:117-123.
279. Beaussier H, Naggara O, Calvet D, Joannides R, Guegan-massardier E, Gerardin
E, et al. Mechanical and structural characteristics of carotid plaques by combined
analysis with echotracking system and MR imaging. JACC. Cardiovascular Imaging.
2011;4:468-477.
280. Long Q, Xu XY, Ramnarine KV, Hoskins P. Numerical investigation of
physiologically realistic pulsatile flow through arterial stenosis. Journal of
Biomechanics. 2001;34:1229-1242.
281. Meagher S, Poepping TL, Ramnarine KV, Black RA, Hoskins PR. Anatomical flow
phantoms of the nonplanar carotid bifurcation, part II: experimental validation with
Doppler ultrasound. Ultrasound in Medicine & Biology. 2007;33:303-310.

238
282. Watts DM, Sutcliffe CJ, Morgan RH, Meagher S, Wardlaw J, Connell M, et al.
Anatomical flow phantoms of the nonplanar carotid bifurcation, part I: computer-aided
design and fabrication. Ultrasound in Medicine & Biology. 2007;33:296-302.
283. Schmidt-trucksäss A, Grathwohl D, Schmid A, Boragk R, Upmeier C, Keul J, et al.
Structural, functional, and hemodynamic changes of the common carotid artery with
age in male subjects. Arteriosclerosis Thrombosis and Vascular Biology. 1999;19:1091-
1097.
284. Kanters SD, Elgersma OE, Banga JD, Van Leeuwen MS, Algra A. Reproducibility of
measurements of intima-media thickness and distensibility in the common carotid
artery. European Journal of Vascular and Endovascular Surgery the Official Journal of
the European Society for Vascular Surgery. 1998;16:28-35.
285. Godia EC, Madhok R, Pittman J, Trocio S, Ramas R, Cabral D, et al. Carotid artery
distensibility: a reliability study. Journal of Ultrasound in Medicine Official Journal of
the American Institute of Ultrasound in Medicine. 2007;26:1157-1165.
286. Falk E. Why do plaques rupture? Circulation. 1992;86:III30-III42.
287. Hennerici MG. The unstable plaque. Cerebrovascular Diseases. 2004;17 Suppl
3:17-22.
288. Ogata T, Yasaka M, Wakugawa Y, Kitazono T, Okada Y. Morphological
classification of mobile plaques and their association with early recurrence of stroke.
Cerebrovascular Diseases. 2011;30:606-611.
289. Gastounioti A, Golemati S, Stoitsis JS, Nikita KS. Carotid artery wall motion
analysis from B-mode ultrasound using adaptive block matching: in silico evaluation
and in vivo application. Physics in Medicine and Biology. 2013;58:8647-8661.
290. Nasrabadi H, Pattichis MS, Fisher P, Nicolaides AN, Griffin M, Makris GC, et al.
Measurement of motion of carotid bifurcation plaques. Proceedings of the IEEE
International Conference on Bioinformatics & Bioengineering. 2012.
291. Teirlinck CJ, Bezemer RA, Kollmann C, Lubbers J, Hoskins PR, Ramnarine KV, et
al. Development of an example flow test object and comparison of five of these test
objects, constructed in various laboratories. Ultrasonics. 1998;36:653-660.
292. Ramnarine KV, Anderson T, Hoskins PR. Construction and geometric stability of
physiological flow rate wall-less stenosis phantoms. Ultrasound in Medicine & Biology.
2001;27:245-250.

239
293. Ramnarine KV, Garrard JW, Dexter K, Nduwayo S, Panerai RB, Robinson TG. Shear
wave elastography assessment of carotid plaque stiffness: in vitro reproducibility
study. Ultrasound in Medicine & Biology. 2013;40:200-209.
294. Garrard JW, Ramnarine KV. Shear-Wave Elastography in Carotid Plaques:
Comparison with Grayscale Median and Histological Assessment in an Interesting Case.
Ultraschall in der Medizin. 2013.
295. Mayberg MR, Wilson SE, Yatsu F, Weiss DG, Messina L, Hershey LA, et al. Carotid
endarterectomy and prevention of cerebral ischemia in symptomatic carotid stenosis.
Veterans Affairs Cooperative Studies Program 309 Trialist Group. Journal of the
American Medical Association. 1991;266:3289-3294.
296. Naylor AR, Rothwell PM, Bell PRF. Overview of the principal results and
secondary analyses from the European and North American randomised trials of
endarterectomy for symptomatic carotid stenosis. European Journal of Vascular and
Endovascular Surgery. 2003;26:115-129.
297. Rothwell PM, Eliasziw M, Gutnikov SA, Fox AJ, Taylor DW, Mayberg MR, et al.
Analysis of pooled data from the randomised controlled trials of endarterectomy for
symptomatic carotid stenosis. Lancet. 2003;361:107-116.
298. Rothwell PM, Goldstein LB. Carotid endarterectomy for asymptomatic carotid
stenosis: asymptomatic carotid surgery trial. Stroke. 2004;35:2425-2427.
299. Executive Committee for the Asymptomatic Carotid Atherosclerosis Study.
Endarterectomy for asymptomatic carotid artery stenosis. Journal of the American
Medical Association. 1995;273:1421-1428.
300. Halliday A, Mansfield A, Marro J, Peto C, Peto R, Potter J, et al. Prevention of
disabling and fatal strokes by successful carotid endarterectomy in patients without
recent neurological symptoms: randomised controlled trial. Lancet. 2004;363:1491-1502.
301. Naylor AR. Time to rethink management strategies in asymptomatic carotid
artery disease. Nature Reviews Cardiology. 2012;9:116-124.
302. Chambers BR, Donnan GA. Carotid endarterectomy for asymptomatic carotid
stenosis. The Cochrane Database of Systematic Reviews. 2005.
303. Conrad MF, Baloum V, Mukhopadhyay S, Garg A, Patel VI, Cambria RP.
Progression of asymptomatic carotid stenosis despite optimal medical therapy. Journal
of Vascular Surgery. 2013;58:128-35.E1.

240
304. Hobson RW, Weiss DG, Fields WS, Goldstone J, Moore WS, Towne JB, et al.
Efficacy of carotid endarterectomy for asymptomatic carotid stenosis. The Veterans
Affairs Cooperative Study Group. The New England Journal of Medicine. 1993;328:221-
227.
305. Mayo Asymptomatic Carotid Endarterectomy Study Group. Results of a
randomized controlled trial of carotid endarterectomy for asymptomatic carotid
stenosis. Mayo Clinic Proceedings. 1992;67:513-518.
306. Naylor AR, Golledge J. High risk plaque, high risk patient or high risk procedure?
European Journal of Vascular and Endovascular Surgery. 2006;32:557-560.
307. Mas J, Chatellier G, Beyssen B, Branchereau A, Moulin T, Becquemin J, et al.
Endarterectomy versus stenting in patients with symptomatic severe carotid stenosis.
The New England Journal of Medicine. 2006;355:1660-1671.
308. Yadav JS, Wholey MH, Kuntz RE, Fayad P, Katzen BT, Mishkel GJ, et al. Protected
carotid-artery stenting versus endarterectomy in high-risk patients. The New England
Journal of Medicine. 2004;351:1493-1501.
309. Ammirati E, Magnoni M, Camici PG. Need for new non-invasive imaging
strategies to identify high-risk asymptomatic patients with carotid stenosis.
International Journal of Cardiology. 2013;168:4342–4343.
310. Spence JD. Asymptomatic carotid stenosis. Circulation. 2013;127:739-742.
311. Afonso D, Seabra J, Suri JS, Sanches JM. A CAD system for atherosclerotic plaque
assessment. Proceedings of the Annual International Conference of the IEEE
Engineering in Medicine and Biology Society. 2013;2012:1008-1011.
312. Nicolaides AN, Kakkos SK, Kyriacou E, Griffin M, Sabetai M, Thomas DJ, et al.
Asymptomatic internal carotid artery stenosis and cerebrovascular risk stratification.
Journal of Vascular Surgery. 2011;52:1486-1496.
313. Kyriacou E, Nicolaides A, Pattichis CS, Petroudi S, Pattichis M, Griffin M, et al.
First and second order statistical texture features in carotid plaque image analysis:
preliminary results from ongoing research. Proceedings of the Annual International
Conference of the IEEE Engineering in Medicine and Biology Society. 2012;2011:6655-
6658.
314. Mayor I, Momjian S, Lalive P, Sztajzel R. Carotid plaque: comparison between
visual and grey-scale median analysis. Ultrasound in Medicine & Biology. 2003;29:961-
966.

241
315. Seabra J, Pedro LM, Fernandes JFE, Sanches J. Ultrasound Plaque Enhanced
Activity Index for Predicting Neurological Symptoms. Pattern Recognition and Image
Analysis. 2011;6669:184-191.
316. Piliouras N, Kalatzis I, Theocharakis P, Dimitropoulos N, Cavouras D.
Development of the probabilistic neural network–cubic least squares mapping (PNN–
LSM3) classifier to assess carotid plaque's risk. Pattern Recognition Letters.
2004;25:249-258.
317. Seabra J, Pedro LM, Fernandes J, Sanches J. Ultrasonographic characterization
and identification of symptomatic carotid plaques. Proceedings of the Annual
International Conference of the IEEE Engineering in Medicine and Biology Society.
2011;2010:6110-6113.
318. Kyriacou EC, Petroudi S, Pattichis CS, Pattichis MS, Griffin M, Kakkos S, et al.
Prediction of high-risk asymptomatic carotid plaques based on ultrasonic image
features. IEEE Transactions on Information Technology in Biomedicine. 2013;16:966-973.
319. Acharya UR, Mookiah MRK, Vinitha Sree S, Afonso D, Sanches J, Shafique S, et
al. Atherosclerotic plaque tissue characterization in 2D ultrasound longitudinal carotid
scans for automated classification: a paradigm for stroke risk assessment. Medical &
Biological Engineering & Computing. 2013;51:513-523.
Related Documents