F1000Research Open Peer Review , Natural Resource Elena Bennett Sciences and the McGill School of the Environment, McGill University Canada , University of Canterbury David Norton New Zealand Discuss this article (0) Comments 2 1 RESEARCH ARTICLE Identifying spatial priorities for protecting ecosystem services [version 1; referees: 2 approved] Gary W Luck , Kai MA Chan , Carissa J Klien 3 Institute for Land, Water and Society, Charles Sturt University, Albury, NSW, Australia Institute for Resources, Environment and Sustainability, University of British Columbia, Vancouver, British Columbia, Canada The Ecology Centre, University of Queensland, St. Lucia, Queensland, Australia Abstract Priorities for protecting ecosystem services must be identified to ensure future human well-being. Approaches to broad-scale spatial prioritization of ecosystem services are becoming increasingly popular and are a vital precursor to identifying locations where further detailed analyses of the management of ecosystem services is required (e.g., examining trade-offs among management actions). Prioritization approaches often examine the spatial congruence between priorities for protecting ecosystem services and priorities for protecting biodiversity; therefore, the spatial prioritization method used is crucial because it will influence the alignment of service protection and conservation goals. While spatial prioritization of ecosystem services and prioritization for conservation share similarities, such as the need to document threats and costs, the former differs substantially from the latter owing to the requirement to measure the following components: supply of services; availability of human-derived alternatives to service provision; capacity to meet beneficiary demand; and site dependency in and scale of service delivery. We review studies that identify broad-scale spatial priorities for managing ecosystem services and demonstrate that researchers have used different approaches and included various measures for identifying priorities, and most studies do not consider all of the components listed above. We describe a conceptual framework for integrating each of these components into spatial prioritization of ecosystem services and illustrate our approach using a worked example for water provision. A fuller characterization of the biophysical and social context for ecosystem services that we call for should improve future prioritization and the identification of locations where ecosystem-service management is especially important or cost effective. 1 2 3 1 2 3 Referee Status: Invited Referees version 1 published 27 Sep 2012 1 2 report report 27 Sep 2012, :17 (doi: ) First published: 1 10.12688/f1000research.1-17.v1 27 Sep 2012, :17 (doi: ) Latest published: 1 10.12688/f1000research.1-17.v1 v1 Page 1 of 16 F1000Research 2012, 1:17 Last updated: 09 SEP 2015

Welcome message from author
This document is posted to help you gain knowledge. Please leave a comment to let me know what you think about it! Share it to your friends and learn new things together.
Transcript
F1000Research
Open Peer Review
Natural ResourceElena Bennett
Sciences and the McGill School of theEnvironment McGill University Canada
University of CanterburyDavid Norton
New Zealand
Discuss this article
(0)Comments
2
1
RESEARCH ARTICLE
Identifying spatial priorities for protecting ecosystem services[version 1 referees 2 approved]Gary W Luck Kai MA Chan Carissa J Klien3
Institute for Land Water and Society Charles Sturt University Albury NSW AustraliaInstitute for Resources Environment and Sustainability University of British Columbia Vancouver British Columbia CanadaThe Ecology Centre University of Queensland St Lucia Queensland Australia
AbstractPriorities for protecting ecosystem services must be identified to ensure futurehuman well-being Approaches to broad-scale spatial prioritization ofecosystem services are becoming increasingly popular and are a vitalprecursor to identifying locations where further detailed analyses of themanagement of ecosystem services is required (eg examining trade-offsamong management actions) Prioritization approaches often examine thespatial congruence between priorities for protecting ecosystem services andpriorities for protecting biodiversity therefore the spatial prioritization methodused is crucial because it will influence the alignment of service protection andconservation goals While spatial prioritization of ecosystem services andprioritization for conservation share similarities such as the need to documentthreats and costs the former differs substantially from the latter owing to therequirement to measure the following components supply of servicesavailability of human-derived alternatives to service provision capacity to meetbeneficiary demand and site dependency in and scale of service delivery Wereview studies that identify broad-scale spatial priorities for managingecosystem services and demonstrate that researchers have used differentapproaches and included various measures for identifying priorities and moststudies do not consider all of the components listed above We describe aconceptual framework for integrating each of these components into spatialprioritization of ecosystem services and illustrate our approach using a workedexample for water provision A fuller characterization of the biophysical andsocial context for ecosystem services that we call for should improve futureprioritization and the identification of locations where ecosystem-servicemanagement is especially important or cost effective
1 2 3
1
2
3
Referee Status
Invited Referees
version 1published27 Sep 2012
1 2
report report
27 Sep 2012 17 (doi )First published 1 1012688f1000research1-17v1 27 Sep 2012 17 (doi )Latest published 1 1012688f1000research1-17v1
v1
Page 1 of 16
F1000Research 2012 117 Last updated 09 SEP 2015
F1000Research
Associated Commentary
raquo Faith DP Common ground for biodiversity and ecosystem services the ldquopartial protectionrdquo challenge 2012 30 (doiF1000Research 11012688f1000research1-30v1)
Gary W Luck ( )Corresponding author galuckcsueduau Luck GW Chan KM and Klien CJ How to cite this article Identifying spatial priorities for protecting ecosystem services [version 1
2012 17 (doi )referees 2 approved] F1000Research 1 1012688f1000research1-17v1 copy 2012 Luck GW This is an open access article distributed under the terms of the whichCopyright et al Creative Commons Attribution Licence
permits unrestricted use distribution and reproduction in any medium provided the original work is properly cited Data associated with the articleare available under the terms of the (CC0 10 Public domain dedication)Creative Commons Zero No rights reserved data waiver
The contribution of GL and CK was supported by the Australian Research Councilrsquos Future Fellowship (project numberGrant informationFT0990436G) and Postdoctoral Fellowship (project number DP110102153) programs respectively The contribution of KC was supported by theCanada Research Chairs program and the Canadian Foundation for InnovationBritish Columbia Knowledge Development Fund (LeadersOpportunity Fund)The funders had no role in study design data collection and analysis decision to publish or preparation of the manuscript
Competing interests We declare no competing interests
27 Sep 2012 17 (doi ) First published 1 1012688f1000research1-17v1
Page 2 of 16
F1000Research 2012 117 Last updated 09 SEP 2015
IntroductionEcosystem services (ES) are vital for human well-being1 Much at-tention has been devoted to mapping and quantifying ES to achieve the dual goals of protecting biodiversity and human well-being A growing number of broad-scale mapping studies aim to identify priority regions for conducting more localised place-based man-agement of ES [eg2ndash5] Place-based management requires inten-sive collection of detailed socio-economic and biophysical data and close collaboration with stakeholders for effective decision making67 Given limited resources and information and increasing threats to ecosystems it is not possible to do these comprehensive analyses everywhere in a timely manner We argue that there is cur-rently an under-appreciated but vital role for spatial prioritization of locations in which place-based management should occur so that attention is focussed on those locations where resource investment will yield the greatest return for human well-being Indeed data are deficient in most locations for informing comprehensive and accu-rate analyses of trade-offs in ES management and spatial prioriti-zation is a crucial precursor to attempting such trade-off analyses so that data mining efforts occur in the most critical locations Moreover prioritization is essential because much ES management is conducted by government or non-government organizations (NGOs) that could potentially operate in many places
Given the important role that broad-scale prioritization can play in guiding decisions about where to conduct place-based ES manage-ment a critical assessment of current prioritization approaches is warranted Some schemes for identifying spatial priorities for man-aging ES are simple characterizations of biophysical processes and social demand with little consideration of important information such as the availability of alternatives to ES for meeting human needs threats to service provision and the costs of management ac-tions Although fundamentally different to spatial prioritization for biodiversity conservation spatial prioritization of ES may be guid-ed by some of the key principles of the former Spatial prioritization for conservation is well established and may be applied at coarse (eg biodiversity hotspots or priority ecoregions8) or fine scales identifying locations or actions in locations that are relatively more important for protecting biodiversity than other actions or other lo-cations9 As with spatial prioritization of ES spatial prioritization for conservation may help to identify locations where more detailed systematic conservation planning should be conducted and is just one component of the planning process1011
Spatial prioritization of ES differs from spatial prioritization for conservation because ES are valued primarily for their worth to humans can be transferable across space (may not need to be pro-tected at a specific location) are sometimes substitutable by human engineering and service beneficiaries define the success of man-agement actions Yet as with spatial prioritization for conservation spatial prioritization of ES can guide decsions about local-scale planning and inform the allocation of resources from management agencies (eg World Wildlife Fund12) Moreover spatial prioritiza-tion for conservation is a useful starting framework for ES prioriti-zation because the former is well entrenched in planning discourse13 and yields valuable lessons for ES management14
Current approaches to identifying spatial priorities for managing ES apply different prioritization methods (see Table 1) and devel-oping more consistent and comprehensive methods is an important goal for future prioritization studies We review past approaches to spatial prioritization of ES identifying key aspects that should be considered in future analyses At appropriate places we discuss the relevance of spatial prioritization for biodiversity conservation to spatial prioritization of ES because certain aspects such as account-ing for costs and threats are common to both We then demonstrate the importance of these aspects through a conceptual framework for prioritization that outlines an approach for managing the most vital ES for the least cost where they are most needed15 We illustrate the framework with a worked example using the ES of water provision Egoh et al14 reviewed the extent to which ES were included in con-servation assessments (asymp identifying spatial priorities) Our work differs from Egoh et al by assessing how ES priorities have been identified and how methods for prioritization should be improved It also complements discussions of other aspects of ES management such as how to operationalize ES on the ground16 developing ap-propriate payments for services schemes (eg1718) or how to man-age service provision at specific sites [eg1920]
Components of spatial prioritizationThe following are key elements to any conservation prioritiza-tion problem biodiversity features [assets] that need protection (eg species or habitats) processes that threaten these features (eg habitat loss) a set of actions that may be effective at abating the threats (eg manage invasive species) and financial informa-tion specifying the cost of implementing each action and the avail-able conservation budget11 ES prioritization shares these elements that is identifying ecosystem features that supply services threats to service provision potential actions to ensure future supply of services and the costs of these actions Yet prioritization of ser-vices requires at least the following additional considerations the availability of alternative means of providing benefits supplied by services the capacity of an ES to meet human demands and scale of and site dependency in the delivery of services
While each of these factors may contribute to the economic val-uation of an ES (ie captured by a metric such as dollar value) such complete and site-specific economic values are rare Studies that estimate the financial value of ES facilitate the appreciation of services in widely understood terms but this approach has well recognised limitations including the fact that financial values under-represent benefits to the poor as they have less capacity to pay than rich people21ndash23 Therefore it is important to explore alternative ap-proaches to identifying spatial priorities for ES management that circumvent some of the limitations of using financial values
Supplybenefits of ecosystem servicesQuantifying the benefits of protecting the supply of ES is gener-ally most appropriately assessed in terms of the difference between protecting supply and not protecting supply The advantages of pro-tecting ES supply may be represented as benefits expressed in dol-lar values or avoided ecosystem damage (eg prioritizing locations with high soil erosion potential but where vegetation cover ensures
Page 3 of 16
F1000Research 2012 117 Last updated 31 OCT 2013
Page 3 of 16
F1000Research 2012 117 Last updated 09 SEP 2015
Tab
le 1
Stu
die
s id
enti
fyin
g b
road
-sca
le s
pat
ial p
rio
riti
es fo
r p
rote
ctin
g e
cosy
stem
ser
vice
s (p
ub
lish
ed f
rom
200
0ndash20
11)
Show
n ar
e th
e ec
osys
tem
ser
vice
s in
clud
ed in
th
e st
udy
and
how
the
auth
ors
expr
esse
d su
pply
ben
efits
dem
and
thre
ats
cos
ts o
r ava
ilabi
lity
of a
ltern
ativ
es to
ser
vice
pro
visi
on B
lank
cel
ls re
pres
ent a
lack
of i
nfor
mat
ion
A
cons
iste
nt ty
polo
gy fo
r eco
syst
em s
ervi
ces
is n
ot p
rese
nted
in th
e ta
ble
beca
use
we
have
pre
sent
ed th
e ec
osys
tem
-ser
vice
labe
ls th
at w
ere
used
in th
e or
igin
al s
tudy
Cit
atio
nE
cosy
stem
ser
vice
sS
up
ply
Ben
efits
Dem
and
Th
reat
sC
ost
sA
lter
nat
ives
2 (s
ee a
lso
Hol
land
et a
l 48
[not
e 1])
Car
bon
stor
age
Bio
phys
ical
qua
ntity
[not
e 2]
Agr
icul
tura
l val
ue[n
ote
3]G
ross
mar
gin
of c
rops
and
liv
esto
ck[n
ote
4]
Rec
reat
ion[n
ote
5]
of v
isits
[not
e 6]
53C
arbo
n se
ques
tratio
nB
ioph
ysic
al q
uant
ity[n
ote
7]
Wat
er q
ualit
yA
mou
nt o
f pol
luta
nts
rem
oved
[not
e 8]
Soil
rete
ntio
nB
ioph
ysic
al q
uant
ity[n
ote
9]
Wat
er y
ield
Bio
phys
ical
qua
ntity
Polli
natio
nA
bund
ance
of p
ollin
ator
s[not
e 10
]
39C
arbo
n st
orag
eB
ioph
ysic
al q
uant
ity
Targ
et b
ased
[not
e 11
]A
rea
of p
lann
ing
unit[n
ote
12]
Floo
d co
ntro
lA
vert
ed fl
ood
risk[n
ote
13]
Targ
et b
ased
[not
e 14
]A
rea
of p
lann
ing
unit
Fora
ge p
rodu
ctio
n[not
e 15
]$
valu
e[not
e 16
]Ta
rget
bas
ed[n
ote
17]
Sum
of lsquo
deve
lopm
entrsquo
valu
es[n
ote
18]
Impl
icit
in
tegr
ated
into
be
nefit
val
ues
Out
door
recr
eatio
n[not
e 19
]B
ioph
ysic
al q
uant
ity[n
ote
20]
12 d
ays
per p
erso
n[not
e 21
]Su
m o
f lsquode
velo
pmen
trsquo va
lues
Polli
natio
n[not
e 22
]$
valu
e[not
e 23
]Ta
rget
bas
ed[n
ote
24]
Are
a of
pla
nnin
g un
itW
ater
pro
visi
on[n
ote
25]
Bio
phys
ical
qua
ntity
A
frac
tion
of a
ctua
l use
w
ithin
eac
h st
ratifi
catio
n un
it[not
e 26
]
Are
a of
pla
nnin
g un
it
4C
arbo
n st
orag
eB
ioph
ysic
al q
uant
ity a
nd $
va
lue
Targ
et-b
ased
and
thro
ugh
$ va
lue[n
ote
27]
Roa
d-de
nsity
pro
xy a
nd
serv
ices
as
adde
d co
sts
bene
fits
Rec
reat
iona
l ang
ling
Bio
phys
ical
qua
ntity
and
$
valu
eTa
rget
-bas
ed a
nd th
roug
h $
valu
e[not
e 27
]R
oad-
dens
ity p
roxy
and
ser
vice
s as
add
ed c
osts
ben
efits
Tim
ber h
arve
st$
valu
e (n
et b
enefi
ts ndash
har
vest
co
st)
Targ
et-b
ased
and
thro
ugh
$ va
lue[n
ote
27]
Flat
(cos
ts in
clud
ed in
$ v
alue
)
47Ec
onom
ic a
nd c
ultu
ral v
alue
of
spec
ies[n
ote
28]
Bin
ary
cate
gorie
s[not
e 29
]Th
reat
s fro
m
land
use
[not
e 30
]
245
4 Su
rfac
e w
ater
sup
ply
Bio
phys
ical
qua
ntity
[not
e 31
]
Wat
er fl
ow re
gula
tion
Bio
phys
ical
qua
ntity
[not
e 32
]
Soil
rete
ntio
nEr
osio
n po
tent
ial[n
ote
33]
Soil
accu
mul
atio
nB
ioph
ysic
al q
uant
ity[n
ote
34]
Car
bon
stor
age
Bio
phys
ical
qua
ntity
3 (s
ee a
lso
Egoh
et
al
40 R
eyer
s et
al
55)
Car
bon
stor
age
Bio
phys
ical
qua
ntity
Ta
rget
bas
ed[n
ote
35]
Vege
tatio
n de
grad
atio
n [n
ote
36]
Con
serv
atio
n of
pla
nnin
g un
it an
d op
port
unity
cos
ts[n
ote
37]
Page 4 of 16
F1000Research 2012 117 Last updated 31 OCT 2013
Page 4 of 16
F1000Research 2012 117 Last updated 09 SEP 2015
Cit
atio
nE
cosy
stem
ser
vice
sS
up
ply
Ben
efits
Dem
and
Th
reat
sC
ost
sA
lter
nat
ives
Fodd
er p
rovi
sion
[not
e 38
]B
ioph
ysic
al q
uant
ityTa
rget
bas
edSt
ocki
ng
rate
s[not
e 39
]C
onse
rvat
ion
of p
lann
ing
unit
and
oppo
rtun
ity c
osts
W
ater
rech
arge
Bio
phys
ical
qua
ntity
[not
e 40
]Ta
rget
bas
edC
onse
rvat
ion
of p
lann
ing
unit
and
oppo
rtun
ity c
osts
56 (s
ee a
lso
Guo
et
al
19)
Wat
er re
tent
ion[n
ote
41]
Bio
phys
ical
qua
ntity
15W
ater
pro
visi
onB
ioph
ysic
al q
uant
ity[n
ote
42]
Supp
ly re
lativ
e to
de
man
d[not
e 43
]Ve
geta
tion
cove
r and
lo
ss[n
ote
44]
Prox
y of
cos
ts p
er u
nit
area
[not
e 45
]C
apac
ity to
pay
fo
r alte
rnat
ives
[n
ote
46]
Floo
d m
itiga
tion
Bio
phys
ical
qua
ntity
[not
e 47
]C
aptu
red
in m
easu
res
of
flood
act
ivity
and
HPD
in
wat
ersh
ed
Ann
ual c
hang
e in
fore
st a
nd
woo
dlan
d co
ver[n
ote
48]
Prox
y of
cos
ts p
er u
nit a
rea
Fina
ncia
l ca
paci
ty to
pay
fo
r alte
rnat
ives
(le
vee
bank
s)C
arbo
n st
orag
eB
ioph
ysic
al q
uant
ityPr
oxy
of c
osts
per
uni
t are
a28
Car
bon
sequ
estra
tion
Bio
phys
ical
qua
ntity
Land
tra
nsfo
rmat
ion
[not
e 49
]
Econ
omic
val
ue o
f mar
keta
ble
prod
uce
(eg
tim
ber
rice
and
non-
timbe
r for
est p
rodu
ce)
Qua
litat
ive
rank
ing[n
ote
50]
Incl
usio
n of
st
akeh
olde
rs[n
ote
51]
Ren
ewal
of s
oil f
ertil
ityQ
ualit
ativ
e ra
nkin
g[not
e 52
]
34Su
stai
nabl
e bu
shm
eat
cons
umpt
ion
$ va
lue
Prob
abili
ty o
f co
nver
sion
fa
ctor
s in
thre
at
Opp
ortu
nity
cos
ts[n
ote
53]
Mar
ket p
rice
of
beef
[not
e 54
]
Sust
aina
ble
timbe
r har
vest
$ va
lue
Opp
ortu
nity
cos
tsB
io-p
rosp
ectin
g[not
e 55
]W
illin
gnes
s to
pay
Opp
ortu
nity
cos
tsEx
iste
nce
valu
eW
illin
gnes
s to
pay
Opp
ortu
nity
cos
tsC
arbo
n st
orag
e$
valu
eD
efor
esta
tion
[not
e 56
]O
ppor
tuni
ty c
osts
26C
arbo
n se
ques
tratio
nB
ioph
ysic
al q
uant
ity[n
ote
57]
Are
a co
nstra
int[n
ote
58]
Car
bon
stor
age
Bio
phys
ical
qua
ntity
A
rea
cons
train
tG
rass
land
pro
duct
ion
of
lives
tock
Bio
phys
ical
qua
ntity
[not
e 59
] Va
riatio
n in
hum
an
popu
latio
n de
nsity
[not
e 60
]A
rea
cons
train
t
Wat
er p
rovi
sion
Bio
phys
ical
qua
ntity
[not
e 61
]A
rea
cons
train
t30
[not
e 62
]W
ater
qua
lity
Bio
phys
ical
qua
ntity
Land
scap
e ch
ange
[not
e 63
]
Stor
m p
eak
miti
gatio
nB
ioph
ysic
al q
uant
ityLa
ndsc
ape
chan
geSo
il co
nser
vatio
n[not
e 64
]B
ioph
ysic
al q
uant
ityLa
ndsc
ape
chan
geC
arbo
n se
ques
tratio
n B
ioph
ysic
al q
uant
ity a
nd s
ocia
l va
lue
(in $
)La
ndsc
ape
chan
ge57
W
ater
sup
ply
Bio
phys
ical
qua
ntity
[not
e 65
]Id
entifi
ed b
enefi
ciar
ies
[not
e 66
]
Gra
zing
pro
visi
onB
ioph
ysic
al q
uant
ity[n
ote
67]
Tour
ism
Dis
tanc
e-ba
sed
aest
hetic
s [n
ote
68]
Page 5 of 16
F1000Research 2012 117 Last updated 31 OCT 2013
Page 5 of 16
F1000Research 2012 117 Last updated 09 SEP 2015
Cit
atio
nE
cosy
stem
ser
vice
sS
up
ply
Ben
efits
Dem
and
Th
reat
sC
ost
sA
lter
nat
ives
58So
il an
d w
ater
con
serv
atio
n [n
ote
69]
Land
slid
e fl
ood
and
drou
ght
prev
entio
n7[no
te 7
0]D
efor
esta
tion
pote
ntia
l[not
e 71
]
55Fo
rage
pro
duct
ion
for l
ives
tock
Bio
phys
ical
qua
ntity
[not
e 72
]La
nd-c
over
ch
ange
[not
e 73
]
Car
bon
stor
age
Bio
phys
ical
qua
ntity
Land
-cov
er
chan
geEr
osio
n co
ntro
lVu
lner
abili
ty to
ero
sion
[not
e 74
]La
nd-c
over
ch
ange
Fres
hwat
er fl
ow a
nd q
ualit
y re
gula
tion
Bio
phys
ical
qua
ntity
[not
e 75
] La
nd-c
over
ch
ange
Tour
ism
Dis
tanc
e-ba
sed
aest
hetic
s [n
ote
76]
Land
-cov
er
chan
ge31
[not
e 77
]H
ydro
logi
cal s
ervi
ces
Bio
phys
ical
qua
ntity
[not
e 78
]H
uman
pre
ssur
e in
dex
rela
ted
to
key
biod
iver
sity
ar
eas[n
ote
79]
59C
arbo
n st
orag
eB
ioph
ysic
al q
uant
ity[n
ote
80]
29Va
rious
[not
e 81
]$
valu
e[not
e 82
]La
nd
trans
form
atio
n [n
ote
83]
60Va
rious
[not
e 84
]$
valu
eVu
lner
abili
ty
of b
iodi
vers
ity
[not
e 85
]
41 (s
ee a
lso
Boh
ensk
y et
al
43)
Fres
hwat
er p
rovi
sion
Bio
phys
ical
qua
ntity
[not
e 86
]W
ater
use
and
acc
ess
[not
e 87
]
Food
pro
visi
onB
ioph
ysic
al q
uant
ity[n
ote
88]
Die
tary
inta
ke[n
ote
89]
Woo
d fu
elB
ioph
ysic
al q
uant
ity (l
ocal
pr
oduc
tion)
Loca
l har
vest
rate
61C
arbo
n st
orag
eB
ioph
ysic
al q
uant
ityD
efor
esta
tion
rate
s an
d co
ver
of p
rote
cted
ar
eas
Opp
ortu
nity
cos
ts
18C
arbo
n st
orag
eB
ioph
ysic
al q
uant
ityPr
obab
ility
of
defo
rest
atio
nO
ppor
tuni
ty c
osts
[not
e 90
]
Wat
er q
ualit
yPr
oxy[n
ote
91]
Estim
ated
dow
nstre
am
user
s[not
e 92
]Pr
obab
ility
of
defo
rest
atio
nTa
ble
1 N
ote
s
1
Hol
land
et a
l48 u
sed
four
indi
cato
rs o
f riv
er s
tatu
s ndash
envi
ronm
enta
l qua
lity
inde
x ta
xon
richn
ess
hab
itat q
ualit
y as
sess
men
t and
hab
itat m
odifi
catio
n in
dex
ndash to
repr
esen
t the
cap
acity
of r
iver
sys
tem
s an
d ca
tchm
ents
to p
rovi
de fr
eshw
ater
eco
syst
em s
ervi
ces
The
aut
hors
arg
ue th
at c
hang
es in
the
valu
e of
thes
e in
dice
s re
flect
cha
nges
in th
e ca
paci
ty o
f riv
er s
yste
ms
to p
rovi
de s
ervi
ces
such
as
mai
ntai
ning
wat
er q
ualit
y c
ontro
lling
sed
imen
tatio
n an
d er
osio
n m
itiga
ting
flood
s c
yclin
g nu
trien
ts a
nd fi
lterin
g po
lluta
nts
2
C
arbo
n st
ored
in s
oils
and
veg
etat
ion
The
aut
hors
con
duct
ed a
naly
ses
at d
iffer
ent g
rain
siz
es (4
km
2 and
100
km
2 ) a
nd d
iffer
ent s
patia
l ext
ents
(Brit
ain
Engl
and
and
100
x 10
0 km
squ
ares
acr
oss
Brit
ain)
and
exa
min
ed v
aria
tion
acro
ss re
gion
s w
ithin
Brit
ain
3
Ann
ual i
ncom
e4
Th
e gr
oss
mar
gin
is th
e va
lue
of o
utpu
ts m
inus
var
iabl
e co
sts
and
subs
idy
paym
ents
5
R
ecre
atio
nal u
se o
f the
cou
ntry
side
6
Th
e nu
mbe
r of d
ay le
isur
e vi
sits
as
a m
easu
re o
f the
recr
eatio
nal v
alue
of p
artic
ular
rura
l loc
atio
ns (t
his
mea
sure
cou
ld b
e in
terp
rete
d as
the
dem
and
for r
ecre
atio
nal s
ervi
ces)
7
A
mou
nt o
f car
bon
sequ
este
red
each
yea
r8
N
itrog
en a
nd p
hosp
horu
s re
mov
ed in
par
ticul
ar la
ndsc
apes
9
C
apac
ity o
f lan
d to
reta
in s
edim
ent
10
Com
bini
ng in
form
atio
n on
nes
t site
s fl
oral
reso
urce
s an
d be
e fli
ght r
ange
s to
est
imat
e po
llina
tor a
bund
ance
and
like
ly v
isita
tion
to a
gric
ultu
ral a
reas
Page 6 of 16
F1000Research 2012 117 Last updated 31 OCT 2013
Page 6 of 16
F1000Research 2012 117 Last updated 09 SEP 2015
11
The
auth
ors
set t
arge
ts to
add
ress
the
issu
e of
dem
and
(eg
ca
ptur
ing
50
of t
otal
car
bon
stor
ed in
an
ecor
egio
n)
12
Cos
ts a
re re
pres
ente
d by
the
suita
bilit
y of
are
as fo
r con
serv
atio
n ba
sed
on n
umer
ical
val
ues
that
refle
ct th
e de
gree
of i
mpe
dim
ents
to c
onse
rvat
ion
succ
ess
For
car
bon
stor
age
it is
a fl
at c
ost
the
area
of
the
plan
ning
uni
t13
A
vert
ed ri
sk o
f ext
rem
e flo
ods
14
The
fract
ion
of to
tal fl
ood
cont
rol v
alue
as
a fu
nctio
n of
the
num
ber o
f hou
sing
uni
ts in
the
flood
plai
n
15
Prod
uctio
n of
fora
ge fo
r gra
zing
rang
elan
d st
ock
16
Dol
lar v
alue
of f
orag
e pr
oduc
tion
17
The
targ
et w
as 7
5 o
f for
age
prod
uctio
n va
lue
18
The
sum
of w
eigh
ted
valu
es a
ssoc
iate
d w
ith d
evel
oped
land
agr
icul
ture
roa
d de
nsity
and
leng
th o
f hum
an-in
duce
d pa
tch
edge
s19
Pr
ovis
ion
of re
crea
tion
oppo
rtun
ities
20
Q
uant
ity o
f sui
tabl
e ha
bita
t in
addi
tion
to a
cces
sibi
lity
issu
es a
nd ri
ghts
to a
cces
s21
A
bas
elin
e ta
rget
(ass
umed
min
imum
requ
irem
ent)
of 1
2 da
ys o
f out
door
recr
eatio
n pe
r per
son
per y
ear
22
Cro
p po
llina
tion
by n
atur
al p
ollin
ator
s23
Th
e do
llar v
alue
of a
gric
ultu
ral c
rops
ben
efitti
ng fr
om p
ollin
atio
n
24
75
of f
eatu
re v
alue
acr
oss
the
ecor
egio
n25
Th
e su
pply
of f
resh
wat
er
26
40
of t
otal
fres
hwat
er u
se
27
The
auth
ors
purs
ued
two
appr
oach
es a
targ
et-b
ased
app
roac
h an
d in
corp
orat
ing
ecos
yste
m s
ervi
ces
as e
xtra
cos
ts o
r ben
efits
in th
e co
st la
yer
28
This
is a
spe
cies
-bas
ed a
ppro
ach
so th
e pr
iorit
ies
are
base
d on
spe
cies
and
thei
r dis
tribu
tion
acro
ss th
e la
ndsc
ape
29
For e
xam
ple
pos
itive
or n
egat
ive
econ
omic
val
ue
30
The
mag
nitu
de o
f thr
eats
affe
ctin
g ea
ch s
peci
es b
ased
on
maj
or la
nd u
ses
The
loss
of a
spe
cies
is e
quiv
alen
t to
the
loss
of t
he s
ervi
ce(s
) tha
t spe
cies
pro
vide
s31
M
edia
n an
nual
sim
ulat
ed ru
n-of
f32
G
roun
dwat
er c
ontri
butio
n to
sur
face
run-
off
33
Hot
spot
s m
appe
d as
are
as w
ith s
ever
e er
osio
n po
tent
ial a
nd v
eget
atio
n an
d lit
ter c
over
of a
t lea
st 7
0 w
here
mai
ntai
ning
the
cove
r is
esse
ntia
l to
prev
ent e
rosi
on
34
Soil
dept
h an
d le
af li
tter
35
The
auth
ors
asse
ssed
var
ious
sce
nario
s fo
r cap
turin
g ec
osys
tem
ser
vice
s ba
sed
on in
cide
ntal
pro
tect
ion
thro
ugh
the
cons
erva
tion
of b
iodi
vers
ity o
r the
incl
usio
n of
spa
tially
exp
licit
data
on
serv
ice
dist
ribut
ion
usin
g M
arxa
n In
Ego
h et
al40
the
aut
hors
set
diff
eren
t tar
get t
hres
hold
s fo
r cap
turin
g ce
rtai
n pe
rcen
tage
s of
ser
vice
pro
visi
on fo
r sur
face
wat
er s
uppl
y w
ater
flow
regu
latio
n c
arbo
n st
orag
e s
oil r
eten
tion
and
soil
accu
mul
atio
n
36
The
auth
ors
estim
ated
the
amou
nt o
f eac
h ec
osys
tem
ser
vice
pro
vide
d by
veg
etat
ion
type
s un
der i
ntac
t and
deg
rade
d co
nditi
ons
Mea
surin
g th
e di
ffere
nce
betw
een
the
two
is in
dica
tive
of th
e th
reat
of
degr
adat
ion
to s
ervi
ce p
rovi
sion
37
Th
e co
st o
f con
serv
ing
a pl
anni
ng u
nit w
as e
quiv
alen
t to
the
valu
e of
irrig
ated
cro
ppin
g or
gra
zing
The
opp
ortu
nity
cos
ts o
f con
serv
atio
n w
ere
addr
esse
d in
term
s of
lost
pro
duct
ion
The
aut
hors
in
clud
ed s
patia
l var
iabi
lity
in c
osts
bec
ause
val
ues
are
per p
lann
ing
unit
In E
goh
et a
l40 c
atch
men
t are
a is
use
d as
a c
ost l
ayer
(lar
ger a
reas
= g
reat
er c
ost)
38
B
y na
tura
l veg
etat
ion
39
Th
e au
thor
s ex
amin
ed th
e re
latio
nshi
p be
twee
n fo
dder
pro
visi
on a
nd s
tock
ing
rate
s to
det
erm
ine
the
stoc
king
rate
s th
at c
an b
e im
plem
ente
d w
ithou
t deg
radi
ng th
e en
viro
nmen
t (ie
su
stai
nabl
e st
ocki
ng ra
tes)
Hen
ce o
ver-s
tock
ing
is c
onsi
dere
d im
plic
itly
as a
thre
at to
veg
etat
ion
cond
ition
40
G
roun
dwat
er re
char
ge
41
For e
xam
ple
for fl
ood
miti
gatio
n T
he a
utho
rs a
lso
exam
ined
opp
ortu
nitie
s fo
r ser
vice
enh
ance
men
t 42
In
corp
orat
ing
the
dens
ity o
f peo
ple
who
rely
on
the
serv
ice
(ben
efici
arie
s) a
s de
nsity
per
wat
ersh
ed a
nd th
e w
ater
ndashpro
duct
ion
effic
ienc
y as
wat
er s
uppl
y di
vide
d by
are
a of
wat
ersh
ed
43
Wat
er s
uppl
y re
lativ
e to
dem
and
adju
sted
for t
he n
eed
to re
dist
ribut
e su
pply
with
in w
ater
shed
s W
ater
shed
s w
ere
supp
ly d
oes
not (
or o
nly
just
) mee
ts d
eman
d w
ere
prio
ritiz
ed
44
Am
ount
of v
eget
atio
n co
ver a
nd ra
te o
f veg
etat
ion
loss
with
mid
-ran
ge v
alue
s de
sign
ated
as
prio
ritie
s45
A
pro
xy w
as u
sed
repr
esen
ting
reso
urce
and
mai
nten
ance
cos
ts (e
g
land
acq
uisi
tion
infra
stru
ctur
e an
d la
bour
) and
con
side
ring
wat
ersh
ed-le
vel m
easu
res
of in
com
e p
opul
atio
n si
ze a
nd a
rea
46
Fina
ncia
l cap
acity
to p
ay fo
r alte
rnat
ives
to s
ervi
ce p
rovi
sion
suc
h as
dam
s an
d fil
tratio
n pl
ants
47
In
clud
es th
e tra
de-o
ff be
twee
n a
high
leve
l of fl
ood
activ
ity (n
umbe
r of fl
oods
dur
atio
n of
floo
ds a
nd a
rea
affe
cted
) and
a h
igh
leve
l of i
mpa
ct o
n hu
man
pop
ulat
ions
(dea
ths
and
disp
lace
men
t an
d hu
man
pop
ulat
ion
dens
ity in
wat
ersh
ed)
and
the
cost
s of
ser
vice
pro
tect
ion
48
A
s a
prop
ortio
n of
all
land
The
aut
hors
exa
min
e al
so th
e op
port
uniti
es fo
r ser
vice
enh
ance
men
t thr
ough
land
scap
e re
stor
atio
n
49
The
auth
ors
used
exp
ert o
pini
on to
est
imat
e po
ssib
le la
nd tr
ansf
orm
atio
n w
ithin
the
next
5 y
ears
Thi
s id
entifi
ed n
egat
ive
and
posi
tive
chan
ges
to s
ervi
ce p
rovi
sion
50
B
ased
on
stak
ehol
der p
refe
renc
e51
Th
e in
clus
ion
of s
take
hold
ers
in th
e ra
nkin
g pr
oces
s ad
dres
ses
to a
deg
ree
the
dem
and
for s
ervi
ces
and
or th
e va
lue
of s
ervi
ces
to b
enefi
ciar
ies
Thi
s is
an
expl
icit
inco
rpor
atio
n of
ben
efici
arie
s in
the
proc
ess
52
Bas
ed o
n la
nd m
anag
emen
t and
sta
keho
lder
per
cept
ion
53
The
auth
ors
com
pare
d th
e ec
osys
tem
-ser
vice
val
ues
to th
e co
st o
f con
serv
ing
the
natu
ral h
abita
t tha
t und
erlie
s th
eir p
rovi
sion
The
opp
ortu
nity
cos
t was
cal
cula
ted
as th
e ex
pect
ed a
gric
ultu
ral v
alue
of
each
fore
sted
par
cel o
f lan
d
54
To e
stim
ate
the
econ
omic
val
ue o
f bus
hmea
t the
aut
hors
use
d th
e lo
cal m
arke
t pric
e of
a k
ilo o
f bee
f sin
ce d
omes
tic m
eat i
s a
poss
ible
sub
stitu
te fo
r bus
hmea
t Th
is a
ppro
ach
impl
icitl
y re
cogn
ises
al
tern
ativ
es to
ser
vice
pro
visi
on
55
Valu
e fo
r new
pha
rmac
eutic
al p
rodu
cts
56
The
auth
ors
assu
med
imm
inen
t def
ores
tatio
n ou
tsid
e of
cor
e pr
otec
ted
area
s57
N
et a
nnua
l rat
e of
atm
osph
eric
car
bon
adde
d to
exi
stin
g bi
omas
s ca
rbon
poo
ls (m
easu
red
usin
g a
prox
y)
Page 7 of 16
F1000Research 2012 117 Last updated 31 OCT 2013
Page 7 of 16
F1000Research 2012 117 Last updated 09 SEP 2015
58
The
auth
orsrsquo
max
imiz
ed s
ervi
ce p
rovi
sion
for a
giv
en e
core
gion
are
a co
nstra
int u
sing
opt
imiz
atio
n m
etho
ds
Inco
rpor
atin
g th
e is
sue
of a
rea
cons
train
ts a
ddre
sses
cos
ts a
nd th
e m
axim
izat
ion
goal
get
s so
mew
hat a
t dem
and
59
Ann
ual p
rodu
ctio
n of
live
stoc
k fro
m g
razi
ng o
n un
impr
oved
nat
ural
pas
ture
s (e
xpre
ssed
as
tons
of m
eat)
60
B
enefi
ciar
ies
wer
e at
the
poin
t of p
rodu
ctio
n on
ly (w
here
eco
nom
ic b
enefi
ts a
re re
aliz
ed)
The
auth
ors
iden
tified
pro
duct
ion
peak
s of
wat
er p
rovi
sion
and
gra
ssla
nd p
rodu
ctio
n in
den
sely
pop
ulat
ed
biod
iver
sity
hot
spot
s in
dire
ctly
add
ress
ing
the
issu
e of
spa
tial v
aria
bilit
y in
dem
and
61
Wat
er a
vaila
bilit
y an
d w
ater
use
62
O
nly
the
key
poin
ts a
re c
aptu
red
here
see
the
publ
icat
ion
for f
ull d
etai
ls
63
Scen
ario
ana
lyse
s ex
plor
e im
plic
atio
ns o
f pos
sibl
e fu
ture
land
scap
e ch
ange
s64
Es
timat
ed th
roug
h so
il lo
ss R
egio
ns w
ith lo
wer
pot
entia
l soi
l los
s w
ere
a pr
iorit
y w
hich
impl
icitl
y re
cogn
ises
the
impo
rtan
ce o
f thr
eats
65
W
ater
-sup
ply
func
tion
and
flow
regu
latio
n (m
ean
annu
al c
atch
men
t run
off a
nd m
ean
annu
al g
roun
dwat
er re
char
ge)
66
Iden
tified
ben
efici
arie
s in
the
biom
e th
roug
h a
liter
atur
e re
view
and
exp
ert c
onsu
ltatio
n
67
Mea
n ca
rryi
ng c
apac
ity o
f the
land
inco
rpor
atin
g cl
imat
e s
oil t
ype
and
vege
tatio
n68
A
reas
that
tour
ists
can
see
with
in a
10
km b
uffe
r sur
roun
ding
the
maj
or to
uris
t driv
ing
rout
es (s
ee R
eyer
s et
al55
)69
La
ndsl
ide
floo
d an
d dr
ough
t pre
vent
ion
func
tions
70
La
ndsl
ide
prev
entio
n co
nsid
ered
in te
rms
of la
ndsl
ide
haza
rd t
he m
ore
haza
rdou
s an
are
a th
e m
ore
impo
rtan
t it i
s to
kee
p fo
rest
in p
lace
(an
alte
rnat
ive
perc
eptio
n of
lsquodem
andrsquo
) D
roug
ht a
nd fl
ood
prev
entio
n re
flect
s w
ater
rete
ntio
n ca
pabi
lity
of fo
rest
71
Es
timat
ed u
sing
the
prox
imity
to s
ettle
men
ts a
nd ro
ads
(mea
sure
s of
acc
ess
for d
efor
esta
tion)
and
dis
tribu
tion
of th
e nu
mbe
r of c
omm
erci
al s
peci
es o
f tre
es (a
mea
sure
of f
ores
t des
irabi
lity
for l
oggi
ng)
72
Car
ryin
g ca
paci
ties
for d
omes
tic s
tock
exp
ress
ed a
s th
e nu
mbe
r of h
ecta
res
requ
ired
per l
arge
sto
ck u
nit (
hect
ares
val
ues
wer
e de
term
ined
for p
ristin
e ex
ampl
es o
f hab
itat t
ypes
) 73
Th
e au
thor
s co
mpa
red
the
pote
ntia
l del
iver
y of
eco
syst
em s
ervi
ces
from
lsquopris
tinersquo
loca
tions
to th
at p
rovi
ded
by d
egra
ded
loca
tions
est
imat
ing
how
land
scap
e de
grad
atio
n m
ay d
imin
ish
the
capa
city
of
loca
tions
to p
rovi
de a
giv
en s
ervi
ce (a
n in
dire
ct a
sses
smen
t of t
hrea
t)
74
The
auth
ors
map
ped
area
s vu
lner
able
to e
rosi
on a
nd c
lass
ified
them
as
high
med
ium
and
low
ero
sion
haz
ard
Hab
itat t
ypes
pro
vide
ero
sion
con
trol w
here
ther
e is
a h
igh
thre
at o
f ero
sion
ow
ing
to
fact
ors
such
as
topo
grap
hy r
ainf
all a
nd s
oil (
indi
rect
ly a
ddre
ssin
g th
e is
sue
of th
reat
) 75
M
illio
ns o
f cub
ic m
eter
s of
gro
undw
ater
rech
arge
per
1-k
m2 g
rid c
ell
76
A re
late
d st
udy
by W
endl
and
et a
l18 in
clud
ed c
osts
thr
eats
and
dem
and
but
it is
unc
lear
if th
ese
are
incl
uded
in th
e m
easu
re o
f hyd
rolo
gica
l im
port
ance
use
d in
Rog
ers
et a
l31
77
Prov
isio
n of
drin
king
wat
er to
dow
nstre
am u
sers
and
irrig
atio
n fo
r ric
e pa
ddie
s78
Th
e au
thor
s ex
amin
ed th
e th
reat
s to
the
biol
ogic
al v
alue
of k
ey b
iodi
vers
ity a
reas
(KB
As)
bas
ed o
n a
lsquohum
an p
ress
ure
inde
xrsquo c
alcu
late
d fro
m m
easu
res
of h
uman
pop
ulat
ion
dens
ity r
oad
dens
ity fi
re
prev
alen
ce a
nd a
gric
ultu
ral s
uita
bilit
y T
hey
did
not d
irect
ly e
xam
ine
thre
ats
to e
cosy
stem
-ser
vice
pro
visi
on b
ut d
id th
is in
dire
ctly
by
look
ing
at th
reat
s to
the
prot
ectio
n of
KB
As
whi
ch w
ere
rank
ed
base
d on
thei
r hyd
rolo
gica
l ser
vice
val
ue
79
The
carb
on d
ensi
ty o
f liv
ing
biom
ass
80
Th
e nu
mbe
r (an
d ty
pe) o
f ser
vice
s is
a li
ttle
ambi
guou
s it
app
ears
to b
e be
twee
n 9
and
13 d
epen
ding
on
the
anal
ysis
The
aut
hors
als
o co
nduc
ted
anal
yses
at t
hree
diff
eren
t spa
tial s
cale
s81
Ec
osys
tem
ser
vice
val
ues
wer
e ex
pres
sed
in d
olla
r val
ues
of la
nd u
nits
bas
ed o
n la
nd c
over
and
the
serv
ices
pro
vide
d by
par
ticul
ar la
nd c
over
s82
Th
e au
thor
s de
al w
ith th
reat
(s) t
o se
rvic
e pr
ovis
ion
indi
rect
ly b
y m
odel
ling
the
chan
ge in
eco
syst
em s
ervi
ce v
alue
with
two
alte
rnat
ive
deve
lopm
ent s
cena
rios
83
Th
e au
thor
s ca
lcul
ated
the
ecos
yste
m-s
ervi
ce v
alue
s ($
val
ue) f
or 1
7 di
ffere
nt s
ervi
ces
and
reco
gnis
ed v
aria
tion
in th
e sp
atia
l dep
ende
ncie
s of
ser
vice
s
84
The
auth
ors
asse
ssed
the
vuln
erab
ility
of b
iodi
vers
ity (lsquo
thre
atrsquo)
and
then
det
erm
ined
the
ecos
yste
m-s
ervi
ce v
alue
cap
ture
d in
bio
dive
rsity
tem
plat
es w
here
low
vul
nera
bilit
y is
a p
riorit
y an
d hi
gh
vuln
erab
ility
is a
prio
rity
85
Th
e au
thor
s ca
lcul
ated
wat
er a
vaila
bilit
y (to
tal a
nd p
er p
erso
n) a
nd m
appe
d su
pply
and
dem
and
ratio
s86
W
ater
ava
ilabi
lity
per p
erso
n w
as re
fere
nced
aga
inst
an
acce
pted
min
imum
targ
et (1
000
m3 )
set
by
the
Uni
ted
Nat
ions
(hen
ce t
his
targ
et re
pres
ents
lsquodem
andrsquo
) Th
e au
thor
s al
so c
alcu
late
d th
e pe
rcen
tage
of t
he p
opul
atio
n w
ith a
cces
s to
impr
oved
wat
er a
nd im
prov
ed s
anita
tion
and
und
er fi
ve m
orta
lity
per 1
000
birt
hs
87
The
perc
enta
ge c
ontri
butio
n of
car
bohy
drat
e an
d pr
otei
n-su
pply
ing
crop
s to
tota
l die
tary
inta
ke
88
Serv
ice
prov
isio
n is
com
pare
d to
reco
mm
ende
d m
inim
um d
aily
inta
ke (2
100
kcal
per
per
son)
and
min
imum
dai
ly in
take
of p
rote
in
89
Lost
agr
icul
tura
l pro
duct
ion
90
Opp
ortu
nity
cos
ts fo
r agr
icul
ture
and
sto
ck
91
The
auth
ors
did
not c
alcu
late
wat
er q
uant
ity b
ut u
sed
a pr
oxy
for t
he s
uppl
y of
sed
imen
t-fre
e w
ater
bas
ed o
n po
pula
tion
data
lan
d co
ver a
nd w
ater
flow
dire
ctio
n92
Th
e au
thor
s m
easu
red
dow
nstre
am u
sers
thro
ugh
the
dow
nstre
am p
opul
atio
nsrsquo n
eed
for q
ualit
y dr
inki
ng w
ater
dow
nstre
am a
rea
of ir
rigat
ed ri
ce fi
elds
and
dow
nstre
am a
rea
of m
angr
oves
Page 8 of 16
F1000Research 2012 117 Last updated 31 OCT 2013
Page 8 of 16
F1000Research 2012 117 Last updated 09 SEP 2015
soil retention24) or through quantifying the supply of services often in biophysical units The latter is the most common approach in broad-scale prioritization studies (Table 1) Biophysical quan-tities can include for example the amount of carbon stored in particular ecosystem types water availability or supply or fodder production However it is crucial to address also the issue of the level of biophysical quantity demanded by service beneficiaries We refer to the level of human need for a service as lsquodemandrsquo but recognise that this level changes with context and differs from the economic perspective of demand as the amount of a good or service that can be purchased at a given price
Simply increasing the quantity of a given service maymay not be appropriate depending on human need It could also divert funds from more necessary actions because if the quantities of certain ES are adequate and not under threat investment in the protection of these services could be a lower priority compared to services currently unable to meet human needs (see lsquoTarget setting and the capacity to meet demandrsquo) Luck et al15 explicitly addressed this issue by prioritizing locations for managing ES based on the hu-man need for the services of water provision and flood mitigation This directly links the quantity of service provided with the needs of beneficiaries and better identifies where needs are not being met
The benefits of managing for ES vary across space and time re-flecting for example variation in human need and the capacity to pay for human-derived alternatives This spatio-temporal vari-ation is decidedly complex influenced by factors such as the type of service being considered market fluctuations and the changing needs of beneficiaries This dynamism magnifies the complexity of ES prioritization beyond that of biodiversity prioritization For example Wilson et al11 note that the benefit-protection function in conservation planning is asymptotic in that benefit accumulation is less and less with the protection of more land While the same is true for some ES25 the shape of the curve will vary over time and space with beneficiary demand driven by among other things markets and changing needs Moreover owing to global markets it can be extremely difficult to identify who benefits from a given service It is less problematic to focus on the immediate beneficiar-ies of service provision (eg growers benefiting from crop polli-nation) rather than also considering those individuals that benefit from the products of services (eg consumers of crop commodi-ties26) In some cases it may be sufficient to recognise simply that the benefits from the provision of a particular service are globally widespread and diffuse (eg carbon storage)
Threats to service provisionConservation planners may quantify threatening processes that in-crease the risk of biodiversity loss27 and a similar focus on threats to ES provision is an appropriate way to incorporate threats into ser-vice prioritization It is also important to recognise the fundamental difference between the vulnerability of an ES to threat(s) and the level of threat a particular service is under Some services may be particularly vulnerable to threats (eg crop pollination reliant on a single pollinator species) but not currently threatened whereas other services may be resilient to a range of threats but at risk of decline owing to the magnitude of threat(s)
Despite its importance few ES prioritization schemes to date have explicitly incorporated threats (Table 1) Egoh et al3 document-ed biophysical quantities of ES provided by intact and degraded vegetation which implicitly addresses threat to service provision through landscape degradation Others examined changes in quan-tities or dollar values of services through modelling alternative future land-use scenarios recognising that some scenarios (eg extensive development) represent a greater threat to service pro-vision than others28ndash30 A more explicit approach to incorporating threats is to document the likelihood of decline or loss of service-providing ecosystems through for example human development or habitat loss1831
Addressing threats to ES is most important when service provision is not substitutable across space (ie site dependency is high be-cause the service must be provided in a specific location eg storm protection) there are no human-derived alternatives to service pro-vision or these alternatives are expensive relative to the capacity of local communities to pay for the alternatives or ecosystem changes are irreversible (eg species extinction)
Costs of actions to manage servicesConservation planners list a variety of costs that should be con-sidered when assessing options for protecting biodiversity32 These range from acquisition costs (eg purchasing land for conserva-tion) and management costs (eg maintaining conservation areas) through to social costs (eg the number of people displaced from conservation areas1133) Costs will vary across space and must be linked to actions to improve planning relevance9 For example if the action required is land acquisition then a relevant cost is land price if the action is management of a conservation area then a relevant cost would be the salaries of conservation managers
The management of ES attracts similar costs dependent on the type of action required to protect the service Indeed some ES prioritiza-tion schemes incorporate opportunity costs in a similar way to bio-diversity prioritization recognising that managing ecosystems for service provision can yield the same opportunity costs as protecting ecosystems for biodiversity (eg when an area cannot be used for production31834 Table 1) Costs may also be incorporated through the use of proxies for resource and maintenance expenses (see lsquoAn example of spatial prioritizationrsquo)
It is important to identify the assignation of costs (who pays) and benefits in both biodiversity conservation and ES prioritization35 For example designation of a conservation area yields benefits that are primarily public notwithstanding for example income gener-ated from nature tourism but sometimes at a cost to private interests (eg opportunity cost of lost revenue from production) Managing an area for the delivery of ES can yield relatively greater private benefits particularly for service beneficiaries with costs borne by both public and other private interests For example a forest des-ignated for timber harvest will yield financial benefits to logging companies at a cost to the public (eg through lost carbon storage) and other private interests (eg those interested in using the forest for ecotourism) Ensuring greater equity in the distribution of ben-efits and costs from services provided by public or private assets
Page 9 of 16
F1000Research 2012 117 Last updated 31 OCT 2013
Page 9 of 16
F1000Research 2012 117 Last updated 09 SEP 2015
may be achieved through various mechanisms such as government regulation self-regulation (enforced by societal norms) or market approaches like cap and trade or payments for ES3637 Yet the ap-propriateness of a particular mechanism depends on the character-istics of the service being targeted (eg who generates the service management jurisdiction and providerndashbeneficiary spatio-temporal dynamics see Kinzig et al37)
Availability of alternatives to service provisionThe availability of human-derived alternatives to the provision of ES is a vital consideration in service prioritization These alter-natives can include for example a water filtration plant to cover the filtration services of wetlands or pesticides to cover biological control The availability of alternatives and the capacity of relevant human communities to pay for these alternatives can influence the treatment of other factors such as benefits threats actions and costs For example managing a particular service may be given lower priority if human-derived alternatives are readily available and affordable although the associated costs of these alternatives must be considered also (eg the health costs of increasing pesti-cide use) Only a few studies that attempt ES prioritization address the issue of availability of alternatives (Table 1) As part of the pri-oritization process the availability and cost of alternatives should be considered simultaneously with the list of potential actions for service protection or enhancing service provision
Target setting and the capacity to meet demandSetting targets is common in conservation planning and can be a requirement for assessing the capacity of selection procedures to meet conservation objectives38 In most cases setting a target is equivalent to meeting a baseline threshold Target setting in ES pri-oritization is rare and has to the best of our knowledge only oc-curred in four published studies343940 (Table 1) For example Chan et al39 set a baseline target (assumed minimum requirement) of 12 days of outdoor recreation per person per year and determined the space required to provide that level of service from data on park visitation Chan et al39 also stipulated that targets had to be met in different stratification zones within the study area which accounted somewhat for the site dependency of service production and vari-ability in the spatial distribution of beneficiary needs
While target setting is one approach to assessing the capacity of eco-systems to meet the demands of beneficiaries provisionndashdemand re-lations have been variously dealt with in the literature (Table 1) For example some studies included data on water use when calculating water provision capacity [eg1526] while others measured down-stream need for water of a given quality through the calculation of population densities and areas of irrigated rice and mangroves18 Van Jaarsveld et al41 calculated water and food provision relative to accepted minimum standards for human consumption The need and approach to calculating demand for service provision will vary depending on the service of interest For example it is generally considered unnecessary to calculate spatially explicit demand for carbon storage because this service benefits the global community and demand is not spatially variable
Site dependency and scaleSite dependency in the provision of an ES reflects the level of need for a particular service to be provided in a particular location in
order to deliver benefits to a given set of beneficiaries This can be interpreted also in the context of the scale of service provision (eg local to global) For example storm protection from mangroves has high site dependency in provision ndash mangrove forests must occur in locations where local communities are threatened by storm activity This should not be confused with the substitutability of the service that is whether human-derived alternatives (eg sea walls) or other coastal vegetation types can provide a similar service In contrast global climate regulation through ecosystems storing carbon has lower site dependency in provision because it does not have to occur at a particular location (ie there are various options for managing ecosystems to store carbon) However there is still some level of site preference because certain ecosystems (eg rainforests) store more carbon than others Site dependency and scale varies also in the use of the service For example the beneficiaries of biological control in agro-ecosystems generally occur at the local to regional scale if the emphasis is on growers whereas the beneficiaries of climate regulation occur at the global scale
Variation in the site dependency and scale of the provision and use of ES has major implications for the valuation of services which must consider spatially explicit and scale-dependent relationships in productionndashconsumption flows42 Such relationships also have im-portant implications for prioritization strategies High site depend-ency could result in certain locations that generate that service being classified as irreplaceable For example Bohensky et al43 identified irreplaceable land units for food and water provision to meet pre-determined targets of caloric intake for a given population When services have lower levels of site dependency in production there is greater flexibility in site selection during the prioritization process (all else being equal)
An example of spatial prioritizationThe relationships among the various components of our conceptual framework for spatial prioritization of ES are presented in Figure 1 We illustrate our approach in this section using a worked example based on data published in Luck et al15 focussing for the sake of simplicity on a single ES water provision
The global analysis of Luck et al15 identified watersheds that are a priority for protecting particular ES The first step in the analysis was to quantify the benefits and supply of the service The benefits of protecting the supply of potable water was measured through hu-man population density in each watershed that is there were greater benefits to protecting supply in watersheds with higher population density compared to those with lower density Water supply was measured using a global hydrological model and lsquowater-production efficiencyrsquo was calculated for each watershed by dividing supply in each watershed with watershed area
The costs of actions to manage water provision were represented using a proxy for resource (eg land acquisition and infrastructure) and maintenance (eg labour) costs This proxy incorporated data on total income in the watershed (per capita gross national income) population size and watershed area Resource costs were assumed to scale positively with per-capita wealth and population density (assuming that land and infrastructure prices are generally higher where population density is higher) while maintenance costs were assumed to also scale positively with per-capita wealth Finally the
Page 10 of 16
F1000Research 2012 117 Last updated 31 OCT 2013
Page 10 of 16
F1000Research 2012 117 Last updated 09 SEP 2015
and change in vegetation cover can be considered a proxy for threat to water provision To quantify this threat the following data were used the proportion of each watershed covered in tree shrub and herbaceous vegetation the annual rate of change in vegetation cover (over a proceeding 5-year period) the time span over which change in cover would be predicted (eg 20 years) and the proportion of the watershed that was protected (assuming vegetation in protected areas could not be cleared) Watersheds with mid-range values of vegetation cover rates of vegetation loss andor area protected were considered priorities for water provision management because for example watersheds with low cover and high rates of loss would require large investments in ES management relative to return whereas watersheds with high cover and low rates of loss are under less threat to the disruption of the service
The final consideration in spatial prioritization is the availability of alternatives to the provision of the service via ecosystems Im-provements in the supply of potable water may be made through the construction of dams and building of filtration plants for example rather than ecosystem management The availability of these alter-natives is often a function of the capacity of local communities to
cost-effectiveness of protecting the service in each watershed was calculated by dividing human population density and water supply (benefits) by the cost
The capacity to meet demand was measured using values for water supply and water withdrawals in each watershed It also considered regional water deficits (withdrawals gt supply) and the proportion of total supply that remained once demands were met adjusting the watershed-level capacity measure downwards proportional to the need to move water to regions (within a watershed) where supply did not meet demand It was assumed that managing the service of water provision was most important in watersheds where supply barely meets or is short of demand and less important when supply greatly exceeded demand
To estimate threat to water provision expected vegetation cover in each watershed was used recognising the link between vegetation and water provision filtration and the maintenance of water qual-ity (although this link is decidedly complex see Luck et al15 for details) Vegetation cover and type in a watershed may be indicative of the capacity of the watershed to provide potable water naturally
Figure 1 Key aspects for consideration in ecosystem-service prioritization
Pre-prioritization
Prioritization process
Post-prioritization Reduce conicts and assess trade-os among priorities through multi-objective planning frameworks
Determine services toprioritize throughstakeholder consultation
Determine availability ofspatially explicit data
Assess data quality foreach component ofprioritization
bull Identify beneciaries (immediate and non- immediate)bull Determine social needbull Assess capacity of ecosystem to meet demand
bull Dene metric to measure supplybull Calculate dierence made by actionbull Assess site dependency of supplybull Identify alternatives
bull Identify threats to supply Assess impact of threat on service deliverybull Assess if impacts of threats are irreversible
bull Estimate cost of action needed to abate threat Identify who pays costbull Determine budget
Demand Supply
Costs Threats
Page 11 of 16
F1000Research 2012 117 Last updated 31 OCT 2013
Page 11 of 16
F1000Research 2012 117 Last updated 09 SEP 2015
ES management The selection of different services will influence the approach to spatial prioritization because ES management will have different objectives (eg improving timber harvest or main-taining water supply) However the major steps we outline here will be relevant in most cases
Application of our approach requires spatially explicit data on where services are produced benefits costs and threats Data on spatially explicit production is usually obtained through mapping the loca-tion of ecosystems that provide services (eg grasslands that sup-port livestock) Mostly this involves maps of vegetation types or water sources (Table 1) Benefits are represented spatially generally via the biophysical quantity of a given service produced by a given location (eg carbon stored) andor its financial value To represent costs spatially researchers have used simply the area of the planning unit (eg39 for some services) or current land values [eg34] Docu-menting costs is problematic because of spatio-temporal variation in financial values which is possibly why some researchers have resorted to more simple rules-of-thumb (eg assuming that manag-ing larger areas yields greater costs) Also problematic is spatially explicit measures of threat which have been represented by for ex-ample maps of land-use or historical or potential land-cover change and how these relate spatially to the location of service provision [eg3047] (Table 1)
Finally the type of data used in prioritization will greatly affect out-comes For example Anderson et al2 demonstrated that variation in the resolution (asymp grain size) andor spatial extent of a prioritization analysis influenced the level of congruence between biodiversity and ES priorities Moreover data quality may be poor for certain services and certain components of prioritization For example crude proxies or indicators may be required for services for which it is difficult to obtain accurate spatially explicit measures of sup-ply and demand (eg flood mitigation see Holland et al48) Our framework which promotes the use also of data on threats costs alternatives and site dependency may help to alleviate this issue because prioritization could be based just on those components for which data quality is acceptable
The most appropriate metric to represent the supply of the service will be context dependent but the use of biophysical quantities will be suitable in most cases For example if the service is storm protec-tion then a suitable metric may be the area of mangroves that needs to be maintained to deliver a given level of protection [eg25] ES supply should be assessed relative to the demand for the service which can be measured using a target-based approach through cur-rent or projected use of the service or its products through dem-onstrated need for the service (eg historical impacts of storms) or through meeting an accepted minimum standard (eg acceptable losses due to storm damage) Quantifying demand for a service re-quires the implicit or preferably explicit identification of beneficiar-ies which may be immediate beneficiaries (eg residents of coastal villages threatened by storms) andor lsquonon-immediatersquo beneficiaries (eg consumers of goods produced by the villages)
The application of prioritization frameworks generally involves multiple services across many planning units and priorities for different services are not necessarily congruent2 This requires an analysis of trade-offs between services in managing landsea-space
pay for them in addition to other constraints (eg topographic suit-ability for dam construction) Therefore Luck et al15 used the gross national income per capita of countries spanning each watershed as an indicator of the capacity of communities reliant on the watershed to pay for alternatives to natural water provision
The above components were combined into a single index repre-senting the relative importance of each watershed for protecting water supply This example and our prioritization framework gen-erally is appropriate when planning units are large and there are a variety of available options for managing services and it is difficult to express the components of prioritization precisely Our frame-work treats the supply of services threats and costs in ES prioritiza-tion inclusive of beneficiary demand capacity to meet demand and availability of alternatives to ES provision
DiscussionOur review of current approaches to identifying spatial priorities for managing ES found that the important components of prioritization (benefits costs threats availability of alternative and capacity to meet demand) were treated in substantially different ways or some-times omitted completely (although not all components are appli-cable in every context) Moreover few studies explicitly addressed the issue of site dependency and scale in the provision of services andor location of beneficiaries Accordingly there is substan-tial scope for improving ES analyses aimed at identifying spatial priorities for managing services
If ES benefits were commodities in perfect markets the price of such benefits would reflect all of the spatial prioritization components identified above Yet many ES benefits are not commodities and for those that are the associated markets are far from perfect suffering from numerous market failures including monopsony (single buy-ers as in reverse auctions) oligopoly (few sellers as in many pay-ments-for-ES schemes) externalities and information asymmetries This means that market prices will not generally reflect all of the components of prioritization appropriately Stated-preference non-market valuation approaches can be informative in certain settings where markets do not apply but they are generally of limited utility reflecting the various dimensions of valuesocial priority4445 Ac-cordingly even where economic valuation data are available it will still be appropriate for ES prioritization exercises to separately inte-grate some of the components we identify
Although we have focussed on the mechanics of prioritization the following issues must be addressed prior to such analyses 1) iden-tification of the ES to be included 2) capacity to access spatially explicit data and 3) data quality (Figure 1) Identifying important ES should occur through in-depth consultation among scientists policy-makers managers and stakeholders (especially service ben-eficiaries see Fisher et al46) For example if prioritization was required across a particular country federal management agencies and relevant stakeholders may engage in a process of identifying those services most important to the well-being of the country lsquoImportancersquo may be a factor of the total financial value of a ser-vice (eg agricultural production) andor the societal need for a service (eg provision of potable water) and assessed through ap-propriate valuation approaches Hence a priority list of which ser-vices to focus on is required prior to deciding on where to invest in
Page 12 of 16
F1000Research 2012 117 Last updated 31 OCT 2013
Page 12 of 16
F1000Research 2012 117 Last updated 09 SEP 2015
China Costa Rica and Mexico pay landholders that engage in man-agement that protects the supply of hydrological services50ndash52 Vital to this process is identifying locations that offer the greatest return on investment This requires a systematic and thorough approach to identifying spatial priorities for protecting ES
Author contributionsGL and KC conceived the study GL summarised the information in Table 1 and prepared the first draft of the manuscript All authors revised subsequent drafts of the manuscript and have agreed to the final content
Competing interestsWe declare no competing interests
Grant informationThe contribution of GL and CK was supported by the Australian Re-search Councilrsquos Future Fellowship (project number FT0990436G) and Postdoctoral Fellowship (project number DP110102153) pro-grams respectively The contribution of KC was supported by the Canada Research Chairs program and the Canadian Foundation for InnovationBritish Columbia Knowledge Development Fund (Leaders Opportunity Fund)
The funders had no role in study design data collection and analy-sis decision to publish or preparation of the manuscript
for service provision5 Moilanen et al49 addressed this issue using a multi-objective prioritization approach for biodiversity and ES based on the conservation planning software Zonation The au-thors argued that regional variation in land-use priorities meant that spatial separation of land uses may reduce management conflicts Moreover areas that are a priority for multiple ES could be used in trade-offs assuming the areas were not critical priorities for every service
In multi-objective prioritization frameworks that consider spatial separation of ES management or trade-offs in land-use priorities it is vital to address site-dependency and scale of service provision and location of beneficiaries As we argue above there is little flex-ibility in managing for the provision of services that are delivered locally to in situ beneficiaries (eg flood mitigation) Avoiding in-appropriate management decisions and trade-offs rests entirely on taking a comprehensive approach to identifying priorities Here we describe the major factors that must be considered in ES prioritiza-tion and argue that addressing as many of these factors as possible will improve the outcomes of multi-objective prioritization frame-works that aim to promote human well-being through the protection of services
Developing comprehensive methods for identifying ES priorities is much more than just an academic exercise Governments and NGOs across the world are increasingly including the protection of ES into their policy directives For example the governments of
References
1 MA (Millennium Ecosystem Assessment) Ecosystems and human well-being synthesis Island Press Washington DC 2005 Reference Source
2 Anderson BJ Armsworth PR Eigenbrod F et al Spatial covariance between biodiversity and other ecosystem service priorities J Appl Ecol 2009 46(4) 888ndash896 Publisher Full Text
3 Egoh BN Reyers B Carwardine J et al Safeguarding biodiversity and ecosystem services in the Little Karoo South Africa Conserv Biol 2010 24(4) 1021ndash1030 PubMed Abstract | Publisher Full Text
4 Chan KMA Hoshizaki L Klinkenberg B et al Ecosystem services in conservation planning targeted benefits or co-benefitscosts PLoS One 2011 6(9) e24378 PubMed Abstract | Publisher Full Text | Free Full Text
5 White C Halpern BS Kappel CV et al Ecosystem service tradeoff analysis reveals the value of marine spatial planning for multiple ocean uses Proc Natl Acad Sci U S A 2012 109(12) 4696ndash701 PubMed Abstract | Publisher Full Text | Free Full Text
6 Menzel S Teng J Ecosystem services as a stakeholder-driven concept for conservation science Conserv Biol 2010 24(3) 907ndash909 PubMed Abstract | Publisher Full Text
7 Kareiva P Tallis H Ricketts TH et al Natural capital theory and practice of mapping ecosystem services Oxford University Press Oxford 2011 365 Reference Source
8 Brooks TM Mittermeier RA da Fonseca GAB et al Global biodiversity conservation priorities Science 2006 313(5783) 58ndash61 PubMed Abstract | Publisher Full Text
9 Carwardine J Wilson KA Watts M et al Avoiding costly conservation mistakes the importance of defining actions and costs in spatial priority setting PLoS One 2008 3(7) e2586 PubMed Abstract | Publisher Full Text | Free Full Text
10 Pressey RL Bottrill MC Approaches to landscape- and seascape-scale conservation planning convergence contrasts and challenges Oryx 2009 43(4) 464ndash475 Publisher Full Text
11 Wilson KA Carwardine J Possingham HP et al Setting conservation priorities Ann N Y Acad Sci 2009 1162 237ndash264 PubMed Abstract | Publisher Full Text
12 Mills M Pressey RL Weeks R et al A mismatch of scales challenges in planning for implementation of marine protected areas in the Coral Triangle Conservation Letters 2010 3(5) 291ndash303 Publisher Full Text
13 Margules CR Pressey RL Systematic conservation planning Nature 2000 405 243ndash253 Publisher Full Text
14 Egoh B Rouget M Reyers B et al Integrating ecosystem services into conservation assessments a review Ecol Econ 2007 63(4) 714ndash721 Publisher Full Text
15 Luck GW Chan KMA Fay JP et al Protecting ecosystem services and biodiversity in the worldrsquos watersheds Conservation Letters 2009 2(4) 179ndash188 Publisher Full Text
16 Cowling RM Egoh B Knight AT et al An operational model for mainstreaming ecosystem services for implementation Proc Natl Acad Sci U S A 2008 105(28) 9483ndash9488 PubMed Abstract | Publisher Full Text | Free Full Text
17 Chen X Lupi F Vintildea A et al Using cost-effective targeting to enhance the efficiency of conservation investments in payments for ecosystem services Conserv Biol 2010 24(6) 1469ndash1478 PubMed Abstract | Publisher Full Text
18 Wendland KJ Honzaacutek M Portela R et al Targeting and implementing payments for ecosystem services opportunities for bundling biodiversity conservation with carbon and water services in Madagascar Ecol Econ 2010 69(11) 2093ndash2107 Publisher Full Text
Page 13 of 16
F1000Research 2012 117 Last updated 31 OCT 2013
Page 13 of 16
F1000Research 2012 117 Last updated 09 SEP 2015
Sci 2005 360(1454) 425ndash441 PubMed Abstract | Publisher Full Text | Free Full Text
42 Balmford A Fisher B Green RE et al Bringing ecosystem services into the real world an operational framework for assessing the economic consequences of losing wild nature Environmental and Resource Economics 2011 48(2) 161ndash175 Publisher Full Text
43 Bohensky E Reyers B van Jaarsveld A et al Ecosystem services in the Gariep basin a component of the Southern African Millennium Ecosystem Assessment (SAfMA) Stellenbosch University Stellenbosch South Africa 2004 Reference Source
44 Gregory R Lichtenstein S Slovic P et al Valuing environmental resources a constructive approach J Risk Uncertain 1993 7(2) 177ndash197 Publisher Full Text
45 Sagoff M Aggregation and deliberation in valuing environmental public goods a look beyond contingent pricing Ecol Econ 1998 24(2ndash3) 213ndash230 Publisher Full Text
46 Fisher B Turner RK Burgess ND et al Measuring modeling and mapping ecosystem services in the Eastern Arc Mountains of Tanzania Progress is Physical Geography 2011 35(5) 595ndash611 Publisher Full Text
47 Coppolillo P Gomez H Maisels F et al Selection criteria for suites of landscape species as a basis for site-based conservation Biol Conserv 2004 115(3) 419ndash430 Publisher Full Text
48 Holland RA Eigenbrod F Armsworth PR et al Spatial covariation between freshwater and terrestrial ecosystem services Ecol Appl 2011 21(6) 2034ndash2048 PubMed Abstract | Publisher Full Text
49 Moilanen A Anderson BJ Eigenbrod F et al Balancing alternative land uses in conservation prioritization Ecol Appl 2011 21(xx) 1419ndash1426 PubMed Abstract | Publisher Full Text
50 Sanchez-Azofeifa GA Pfaff A Robalino JA et al Costa Ricarsquos payment for environmental services program intention implementation and impact Conserv Biol 2007 21(5) 1165ndash1173 PubMed Abstract | Publisher Full Text
51 Liu JG Li SX Ouyang ZY et al Ecological and socioeconomic effects of Chinarsquos policies for ecosystem services Proc Natl Acad Sci U S A 2008 105(28) 9477ndash9482 PubMed Abstract | Publisher Full Text | Free Full Text
52 Muntildeoz-Pintildea C Guevara A Torres JM et al Paying for the hydrological services of Mexicorsquos forests analysis negotiations and results Ecol Econ 2008 65(4) 725ndash736 Publisher Full Text
53 Bai Y Zhuang C Ouyang Z et al Spatial characteristics between biodiversity and ecosystem services in a human-dominated watershed Ecological Complexity 2011 8(2) 177ndash183 Publisher Full Text
54 Egoh B Reyers B Rouget M et al Spatial congruence between biodiversity and ecosystem services in South Africa Biol Conserv 2009 142(3) 553ndash562 Publisher Full Text
55 Reyers B OrsquoFarrell PJ Cowling RM et al Ecosystem services land-cover change and stakeholders finding a sustainable foothold for a semiarid biodiversity hotspot Ecology and Society 2009 14(1) 38 Reference Source
56 Guo Z Gan Y Ecosystem function for water retention and forest ecosystem conservation in a watershed of the Yangtze River Biodivers Conserv 2002 11(4) 599ndash614 Publisher Full Text
57 OrsquoFarrell PJ Reyers B Le Maitre DC et al Multi-functional landscapes in semi arid environments implications for biodiversity and ecosystem services Landscape Ecology 2010 25(8) 1231ndash1246 Publisher Full Text
58 Phua MH Minowa M A GIS-based multi-criteria decision making approach to forest conservation planning at a landscape scale a case study in the Kinabalu Area Sabah Malaysia Landsc Urban Plan 2005 71(2ndash4) 207ndash222 Publisher Full Text
59 Strassburg BBN Kelly A Balmford A et al Global congruence of carbon storage and biodiversity in terrestrial ecosystems Conservation Letters 2010 3(2) 98ndash105 Publisher Full Text
60 Turner WR Brandon K Brooks TM et al Global conservation of biodiversity and ecosystem services BioScience 2007 57(10) 868ndash873 Publisher Full Text
61 Venter O Laurance WF Iwamura WF et al Harnessing carbon payments to protect biodiversity Science 2009 326(5958) 1368 PubMed Abstract | Publisher Full Text
19 Guo ZW Xiao XM Li DM et al An assessment of ecosystem services water flow regulation and hydroelectric power production Ecol Appl 2000 10(3) 925ndash936 Publisher Full Text
20 Ricketts TH Tropical forest fragments enhance pollinator activity in nearby coffee crops Conserv Biol 2004 18(5) 1262ndash1271 Publisher Full Text
21 Bockstael NE Freeman AM Kopp RJ et al On measuring economic values for nature Environ Sci Technol 2000 34(8) 1384ndash1389 Publisher Full Text
22 Aldred J Incommensurability and monetary valuation Land Economics 2006 82(2) 141ndash161 Publisher Full Text
23 Turner RK Fisher B Environmental economics to the rich man the spoils Nature 2008 451(7182) 1067ndash1068 PubMed Abstract | Publisher Full Text
24 Egoh B Reyers B Rouget M et al Mapping ecosystem services for planning and management Agric Ecosyst Environ 2008 127(1ndash2) 135ndash140 Publisher Full Text
25 Barbier EB Koch EW Silliman BR et al Coastal ecosystem-based management with nonlinear ecological functions and values Science 2008 319(5861) 321ndash323 PubMed Abstract | Publisher Full Text
26 Naidoo R Balmford A Costanza R et al Global mapping of ecosystem services and conservation priorities Proc Natl Acad Sci U S A 2008 105(28) 9495ndash9500 PubMed Abstract | Publisher Full Text | Free Full Text
27 Klein CJ Ban NC Halpern BS et al Prioritizing land and sea conservation investments to protect coral reefs PLoS One 2010 5(8) e12431 PubMed Abstract | Publisher Full Text | Free Full Text
28 Nagendra H Incorporating landscape transformation into local conservation prioritization a case study in the Western Ghats India Biodivers Conserv 2001 10(3) 353ndash365 Publisher Full Text
29 Troy A Wilson MA Mapping ecosystem services practical challenges and opportunities in linking GIS and value transfer Ecol Econ 2006 60(2) 435ndash449 Publisher Full Text
30 Nelson E Mendoza G Regetz J et al Modeling multiple ecosystem services biodiversity conservation commodity production and tradeoffs at landscape scales Front Ecol Environ 2009 7(1) 4ndash11 Publisher Full Text
31 Rogers HM Glew L Honzak M et al Prioritizing key biodiversity areas in Madagascar by including data on human pressure and ecosystem services Landsc Urban Plan 2010 96(1) 48ndash56 Publisher Full Text
32 Naidoo R Balmford A Ferraro PJ et al Integrating economic costs into conservation planning Trends Ecol Evol 2006 21(12) 681ndash687 PubMed Abstract | Publisher Full Text
33 Ban NC Klein CJ Spatial socioeconomic data as a cost in systematic marine conservation planning Conservation Letters 2009 2(5) 206ndash215 Publisher Full Text
34 Naidoo R Ricketts TH Mapping the economic costs and benefits of conservation PLoS Biol 2006 4(11) e360 PubMed Abstract | Publisher Full Text | Free Full Text
35 Adams V Pressey R Naidoo R et al Opportunity costs who really pays for conservation Biol Conserv 2010 143(2) 439ndash448 Publisher Full Text
36 Pagiola S Bishop J Landell-Mills N (eds) et al Selling forest environmental services market-based mechanisms for conservation and development Earthscan London 2002 299 Reference Source
37 Kinzig AP Perrings C Chapin FS III et al Sustainability Paying for ecosystem servicesndashpromise and peril Science 2011 334(6056) 603ndash604 PubMed Abstract | Publisher Full Text
38 Carwardine J Klein CJ Wilson KA et al Hitting the target and missing the point target-based conservation planning in context Conservation Letters 2009 2(1) 4ndash11 Publisher Full Text
39 Chan KMA Shaw MR Cameron DR et al Conservation planning for ecosystem services PLoS Biol 2006 4(11) e379 PubMed Abstract | Publisher Full Text | Free Full Text
40 Egoh BN Reyers B Rouget M et al Identifying priority areas for ecosystem service management in South African grasslands J Environ Manage 2011 92(6) 1642ndash1650 PubMed Abstract | Publisher Full Text
41 Van Jaarsveld AS Biggs R Scholes RJ et al Measuring conditions and trends in ecosystem services at multiple scales the Southern African Millennium Ecosystem Assessment (SAfMA) experience Philos Trans R Soc Lond B Biol
Page 14 of 16
F1000Research 2012 117 Last updated 31 OCT 2013
Page 14 of 16
F1000Research 2012 117 Last updated 09 SEP 2015
F1000Research
Open Peer Review
Current Referee Status
Version 1
04 October 2012Referee Report
doi105256f1000research119r307
David NortonCollege of Engineering University of Canterbury Christchurch New Zealand
This is an interesting article that provides a conceptual framework for prioritizing areas for protectingecosystem services (ES) such as water provision
The article explores similarities and differences between ES prioritization and biodiversity prioritizationand highlights several key components that need to be considered in prioritizing areas for protecting ESTwo key components are the need to consider the costs of protecting areas and the importance ofconsidering human-derived alternatives The conceptual framework is then applied to a case study basedon water provision
I have read this submission I believe that I have an appropriate level of expertise to confirm thatit is of an acceptable scientific standard
No competing interests were disclosedCompeting Interests
29 September 2012Referee Report
doi105256f1000research119r306
Elena BennettNatural Resource Sciences and the McGill School of the Environment McGill University SteAnne-de-Bellevue Canada
This work presents an interesting conceptual framework that researchers as well as governments or otherstakeholders could use to identify priority areas for protecting ecosystem services
The authors suggest the following key elements (1) determine the services of interest (2) quantify thedemand for the service(s) and capacity of the ecosystem to meet demand through supply of the service(3) identify the threats and level of threat and (4) estimate the cost of protecting the service as well as anyalternative means of providing the service The authors then review the literature in which priorities havebeen assessed and identify which steps have been taken and which not in each study or effort I hope thispaper will increase our attention to key aspects of ES assessment that are often ignored especially theinteraction among all of these key factors
I have read this submission I believe that I have an appropriate level of expertise to confirm that
Page 15 of 16
F1000Research 2012 117 Last updated 09 SEP 2015
F1000Research
I have read this submission I believe that I have an appropriate level of expertise to confirm thatit is of an acceptable scientific standard
No competing interests were disclosedCompeting Interests
Page 16 of 16
F1000Research 2012 117 Last updated 09 SEP 2015
F1000Research
Associated Commentary
raquo Faith DP Common ground for biodiversity and ecosystem services the ldquopartial protectionrdquo challenge 2012 30 (doiF1000Research 11012688f1000research1-30v1)
Gary W Luck ( )Corresponding author galuckcsueduau Luck GW Chan KM and Klien CJ How to cite this article Identifying spatial priorities for protecting ecosystem services [version 1
2012 17 (doi )referees 2 approved] F1000Research 1 1012688f1000research1-17v1 copy 2012 Luck GW This is an open access article distributed under the terms of the whichCopyright et al Creative Commons Attribution Licence
permits unrestricted use distribution and reproduction in any medium provided the original work is properly cited Data associated with the articleare available under the terms of the (CC0 10 Public domain dedication)Creative Commons Zero No rights reserved data waiver
The contribution of GL and CK was supported by the Australian Research Councilrsquos Future Fellowship (project numberGrant informationFT0990436G) and Postdoctoral Fellowship (project number DP110102153) programs respectively The contribution of KC was supported by theCanada Research Chairs program and the Canadian Foundation for InnovationBritish Columbia Knowledge Development Fund (LeadersOpportunity Fund)The funders had no role in study design data collection and analysis decision to publish or preparation of the manuscript
Competing interests We declare no competing interests
27 Sep 2012 17 (doi ) First published 1 1012688f1000research1-17v1
Page 2 of 16
F1000Research 2012 117 Last updated 09 SEP 2015
IntroductionEcosystem services (ES) are vital for human well-being1 Much at-tention has been devoted to mapping and quantifying ES to achieve the dual goals of protecting biodiversity and human well-being A growing number of broad-scale mapping studies aim to identify priority regions for conducting more localised place-based man-agement of ES [eg2ndash5] Place-based management requires inten-sive collection of detailed socio-economic and biophysical data and close collaboration with stakeholders for effective decision making67 Given limited resources and information and increasing threats to ecosystems it is not possible to do these comprehensive analyses everywhere in a timely manner We argue that there is cur-rently an under-appreciated but vital role for spatial prioritization of locations in which place-based management should occur so that attention is focussed on those locations where resource investment will yield the greatest return for human well-being Indeed data are deficient in most locations for informing comprehensive and accu-rate analyses of trade-offs in ES management and spatial prioriti-zation is a crucial precursor to attempting such trade-off analyses so that data mining efforts occur in the most critical locations Moreover prioritization is essential because much ES management is conducted by government or non-government organizations (NGOs) that could potentially operate in many places
Given the important role that broad-scale prioritization can play in guiding decisions about where to conduct place-based ES manage-ment a critical assessment of current prioritization approaches is warranted Some schemes for identifying spatial priorities for man-aging ES are simple characterizations of biophysical processes and social demand with little consideration of important information such as the availability of alternatives to ES for meeting human needs threats to service provision and the costs of management ac-tions Although fundamentally different to spatial prioritization for biodiversity conservation spatial prioritization of ES may be guid-ed by some of the key principles of the former Spatial prioritization for conservation is well established and may be applied at coarse (eg biodiversity hotspots or priority ecoregions8) or fine scales identifying locations or actions in locations that are relatively more important for protecting biodiversity than other actions or other lo-cations9 As with spatial prioritization of ES spatial prioritization for conservation may help to identify locations where more detailed systematic conservation planning should be conducted and is just one component of the planning process1011
Spatial prioritization of ES differs from spatial prioritization for conservation because ES are valued primarily for their worth to humans can be transferable across space (may not need to be pro-tected at a specific location) are sometimes substitutable by human engineering and service beneficiaries define the success of man-agement actions Yet as with spatial prioritization for conservation spatial prioritization of ES can guide decsions about local-scale planning and inform the allocation of resources from management agencies (eg World Wildlife Fund12) Moreover spatial prioritiza-tion for conservation is a useful starting framework for ES prioriti-zation because the former is well entrenched in planning discourse13 and yields valuable lessons for ES management14
Current approaches to identifying spatial priorities for managing ES apply different prioritization methods (see Table 1) and devel-oping more consistent and comprehensive methods is an important goal for future prioritization studies We review past approaches to spatial prioritization of ES identifying key aspects that should be considered in future analyses At appropriate places we discuss the relevance of spatial prioritization for biodiversity conservation to spatial prioritization of ES because certain aspects such as account-ing for costs and threats are common to both We then demonstrate the importance of these aspects through a conceptual framework for prioritization that outlines an approach for managing the most vital ES for the least cost where they are most needed15 We illustrate the framework with a worked example using the ES of water provision Egoh et al14 reviewed the extent to which ES were included in con-servation assessments (asymp identifying spatial priorities) Our work differs from Egoh et al by assessing how ES priorities have been identified and how methods for prioritization should be improved It also complements discussions of other aspects of ES management such as how to operationalize ES on the ground16 developing ap-propriate payments for services schemes (eg1718) or how to man-age service provision at specific sites [eg1920]
Components of spatial prioritizationThe following are key elements to any conservation prioritiza-tion problem biodiversity features [assets] that need protection (eg species or habitats) processes that threaten these features (eg habitat loss) a set of actions that may be effective at abating the threats (eg manage invasive species) and financial informa-tion specifying the cost of implementing each action and the avail-able conservation budget11 ES prioritization shares these elements that is identifying ecosystem features that supply services threats to service provision potential actions to ensure future supply of services and the costs of these actions Yet prioritization of ser-vices requires at least the following additional considerations the availability of alternative means of providing benefits supplied by services the capacity of an ES to meet human demands and scale of and site dependency in the delivery of services
While each of these factors may contribute to the economic val-uation of an ES (ie captured by a metric such as dollar value) such complete and site-specific economic values are rare Studies that estimate the financial value of ES facilitate the appreciation of services in widely understood terms but this approach has well recognised limitations including the fact that financial values under-represent benefits to the poor as they have less capacity to pay than rich people21ndash23 Therefore it is important to explore alternative ap-proaches to identifying spatial priorities for ES management that circumvent some of the limitations of using financial values
Supplybenefits of ecosystem servicesQuantifying the benefits of protecting the supply of ES is gener-ally most appropriately assessed in terms of the difference between protecting supply and not protecting supply The advantages of pro-tecting ES supply may be represented as benefits expressed in dol-lar values or avoided ecosystem damage (eg prioritizing locations with high soil erosion potential but where vegetation cover ensures
Page 3 of 16
F1000Research 2012 117 Last updated 31 OCT 2013
Page 3 of 16
F1000Research 2012 117 Last updated 09 SEP 2015
Tab
le 1
Stu
die
s id
enti
fyin
g b
road
-sca
le s
pat
ial p
rio
riti
es fo
r p
rote
ctin
g e
cosy
stem
ser
vice
s (p
ub
lish
ed f
rom
200
0ndash20
11)
Show
n ar
e th
e ec
osys
tem
ser
vice
s in
clud
ed in
th
e st
udy
and
how
the
auth
ors
expr
esse
d su
pply
ben
efits
dem
and
thre
ats
cos
ts o
r ava
ilabi
lity
of a
ltern
ativ
es to
ser
vice
pro
visi
on B
lank
cel
ls re
pres
ent a
lack
of i
nfor
mat
ion
A
cons
iste
nt ty
polo
gy fo
r eco
syst
em s
ervi
ces
is n
ot p
rese
nted
in th
e ta
ble
beca
use
we
have
pre
sent
ed th
e ec
osys
tem
-ser
vice
labe
ls th
at w
ere
used
in th
e or
igin
al s
tudy
Cit
atio
nE
cosy
stem
ser
vice
sS
up
ply
Ben
efits
Dem
and
Th
reat
sC
ost
sA
lter
nat
ives
2 (s
ee a
lso
Hol
land
et a
l 48
[not
e 1])
Car
bon
stor
age
Bio
phys
ical
qua
ntity
[not
e 2]
Agr
icul
tura
l val
ue[n
ote
3]G
ross
mar
gin
of c
rops
and
liv
esto
ck[n
ote
4]
Rec
reat
ion[n
ote
5]
of v
isits
[not
e 6]
53C
arbo
n se
ques
tratio
nB
ioph
ysic
al q
uant
ity[n
ote
7]
Wat
er q
ualit
yA
mou
nt o
f pol
luta
nts
rem
oved
[not
e 8]
Soil
rete
ntio
nB
ioph
ysic
al q
uant
ity[n
ote
9]
Wat
er y
ield
Bio
phys
ical
qua
ntity
Polli
natio
nA
bund
ance
of p
ollin
ator
s[not
e 10
]
39C
arbo
n st
orag
eB
ioph
ysic
al q
uant
ity
Targ
et b
ased
[not
e 11
]A
rea
of p
lann
ing
unit[n
ote
12]
Floo
d co
ntro
lA
vert
ed fl
ood
risk[n
ote
13]
Targ
et b
ased
[not
e 14
]A
rea
of p
lann
ing
unit
Fora
ge p
rodu
ctio
n[not
e 15
]$
valu
e[not
e 16
]Ta
rget
bas
ed[n
ote
17]
Sum
of lsquo
deve
lopm
entrsquo
valu
es[n
ote
18]
Impl
icit
in
tegr
ated
into
be
nefit
val
ues
Out
door
recr
eatio
n[not
e 19
]B
ioph
ysic
al q
uant
ity[n
ote
20]
12 d
ays
per p
erso
n[not
e 21
]Su
m o
f lsquode
velo
pmen
trsquo va
lues
Polli
natio
n[not
e 22
]$
valu
e[not
e 23
]Ta
rget
bas
ed[n
ote
24]
Are
a of
pla
nnin
g un
itW
ater
pro
visi
on[n
ote
25]
Bio
phys
ical
qua
ntity
A
frac
tion
of a
ctua
l use
w
ithin
eac
h st
ratifi
catio
n un
it[not
e 26
]
Are
a of
pla
nnin
g un
it
4C
arbo
n st
orag
eB
ioph
ysic
al q
uant
ity a
nd $
va
lue
Targ
et-b
ased
and
thro
ugh
$ va
lue[n
ote
27]
Roa
d-de
nsity
pro
xy a
nd
serv
ices
as
adde
d co
sts
bene
fits
Rec
reat
iona
l ang
ling
Bio
phys
ical
qua
ntity
and
$
valu
eTa
rget
-bas
ed a
nd th
roug
h $
valu
e[not
e 27
]R
oad-
dens
ity p
roxy
and
ser
vice
s as
add
ed c
osts
ben
efits
Tim
ber h
arve
st$
valu
e (n
et b
enefi
ts ndash
har
vest
co
st)
Targ
et-b
ased
and
thro
ugh
$ va
lue[n
ote
27]
Flat
(cos
ts in
clud
ed in
$ v
alue
)
47Ec
onom
ic a
nd c
ultu
ral v
alue
of
spec
ies[n
ote
28]
Bin
ary
cate
gorie
s[not
e 29
]Th
reat
s fro
m
land
use
[not
e 30
]
245
4 Su
rfac
e w
ater
sup
ply
Bio
phys
ical
qua
ntity
[not
e 31
]
Wat
er fl
ow re
gula
tion
Bio
phys
ical
qua
ntity
[not
e 32
]
Soil
rete
ntio
nEr
osio
n po
tent
ial[n
ote
33]
Soil
accu
mul
atio
nB
ioph
ysic
al q
uant
ity[n
ote
34]
Car
bon
stor
age
Bio
phys
ical
qua
ntity
3 (s
ee a
lso
Egoh
et
al
40 R
eyer
s et
al
55)
Car
bon
stor
age
Bio
phys
ical
qua
ntity
Ta
rget
bas
ed[n
ote
35]
Vege
tatio
n de
grad
atio
n [n
ote
36]
Con
serv
atio
n of
pla
nnin
g un
it an
d op
port
unity
cos
ts[n
ote
37]
Page 4 of 16
F1000Research 2012 117 Last updated 31 OCT 2013
Page 4 of 16
F1000Research 2012 117 Last updated 09 SEP 2015
Cit
atio
nE
cosy
stem
ser
vice
sS
up
ply
Ben
efits
Dem
and
Th
reat
sC
ost
sA
lter
nat
ives
Fodd
er p
rovi
sion
[not
e 38
]B
ioph
ysic
al q
uant
ityTa
rget
bas
edSt
ocki
ng
rate
s[not
e 39
]C
onse
rvat
ion
of p
lann
ing
unit
and
oppo
rtun
ity c
osts
W
ater
rech
arge
Bio
phys
ical
qua
ntity
[not
e 40
]Ta
rget
bas
edC
onse
rvat
ion
of p
lann
ing
unit
and
oppo
rtun
ity c
osts
56 (s
ee a
lso
Guo
et
al
19)
Wat
er re
tent
ion[n
ote
41]
Bio
phys
ical
qua
ntity
15W
ater
pro
visi
onB
ioph
ysic
al q
uant
ity[n
ote
42]
Supp
ly re
lativ
e to
de
man
d[not
e 43
]Ve
geta
tion
cove
r and
lo
ss[n
ote
44]
Prox
y of
cos
ts p
er u
nit
area
[not
e 45
]C
apac
ity to
pay
fo
r alte
rnat
ives
[n
ote
46]
Floo
d m
itiga
tion
Bio
phys
ical
qua
ntity
[not
e 47
]C
aptu
red
in m
easu
res
of
flood
act
ivity
and
HPD
in
wat
ersh
ed
Ann
ual c
hang
e in
fore
st a
nd
woo
dlan
d co
ver[n
ote
48]
Prox
y of
cos
ts p
er u
nit a
rea
Fina
ncia
l ca
paci
ty to
pay
fo
r alte
rnat
ives
(le
vee
bank
s)C
arbo
n st
orag
eB
ioph
ysic
al q
uant
ityPr
oxy
of c
osts
per
uni
t are
a28
Car
bon
sequ
estra
tion
Bio
phys
ical
qua
ntity
Land
tra
nsfo
rmat
ion
[not
e 49
]
Econ
omic
val
ue o
f mar
keta
ble
prod
uce
(eg
tim
ber
rice
and
non-
timbe
r for
est p
rodu
ce)
Qua
litat
ive
rank
ing[n
ote
50]
Incl
usio
n of
st
akeh
olde
rs[n
ote
51]
Ren
ewal
of s
oil f
ertil
ityQ
ualit
ativ
e ra
nkin
g[not
e 52
]
34Su
stai
nabl
e bu
shm
eat
cons
umpt
ion
$ va
lue
Prob
abili
ty o
f co
nver
sion
fa
ctor
s in
thre
at
Opp
ortu
nity
cos
ts[n
ote
53]
Mar
ket p
rice
of
beef
[not
e 54
]
Sust
aina
ble
timbe
r har
vest
$ va
lue
Opp
ortu
nity
cos
tsB
io-p
rosp
ectin
g[not
e 55
]W
illin
gnes
s to
pay
Opp
ortu
nity
cos
tsEx
iste
nce
valu
eW
illin
gnes
s to
pay
Opp
ortu
nity
cos
tsC
arbo
n st
orag
e$
valu
eD
efor
esta
tion
[not
e 56
]O
ppor
tuni
ty c
osts
26C
arbo
n se
ques
tratio
nB
ioph
ysic
al q
uant
ity[n
ote
57]
Are
a co
nstra
int[n
ote
58]
Car
bon
stor
age
Bio
phys
ical
qua
ntity
A
rea
cons
train
tG
rass
land
pro
duct
ion
of
lives
tock
Bio
phys
ical
qua
ntity
[not
e 59
] Va
riatio
n in
hum
an
popu
latio
n de
nsity
[not
e 60
]A
rea
cons
train
t
Wat
er p
rovi
sion
Bio
phys
ical
qua
ntity
[not
e 61
]A
rea
cons
train
t30
[not
e 62
]W
ater
qua
lity
Bio
phys
ical
qua
ntity
Land
scap
e ch
ange
[not
e 63
]
Stor
m p
eak
miti
gatio
nB
ioph
ysic
al q
uant
ityLa
ndsc
ape
chan
geSo
il co
nser
vatio
n[not
e 64
]B
ioph
ysic
al q
uant
ityLa
ndsc
ape
chan
geC
arbo
n se
ques
tratio
n B
ioph
ysic
al q
uant
ity a
nd s
ocia
l va
lue
(in $
)La
ndsc
ape
chan
ge57
W
ater
sup
ply
Bio
phys
ical
qua
ntity
[not
e 65
]Id
entifi
ed b
enefi
ciar
ies
[not
e 66
]
Gra
zing
pro
visi
onB
ioph
ysic
al q
uant
ity[n
ote
67]
Tour
ism
Dis
tanc
e-ba
sed
aest
hetic
s [n
ote
68]
Page 5 of 16
F1000Research 2012 117 Last updated 31 OCT 2013
Page 5 of 16
F1000Research 2012 117 Last updated 09 SEP 2015
Cit
atio
nE
cosy
stem
ser
vice
sS
up
ply
Ben
efits
Dem
and
Th
reat
sC
ost
sA
lter
nat
ives
58So
il an
d w
ater
con
serv
atio
n [n
ote
69]
Land
slid
e fl
ood
and
drou
ght
prev
entio
n7[no
te 7
0]D
efor
esta
tion
pote
ntia
l[not
e 71
]
55Fo
rage
pro
duct
ion
for l
ives
tock
Bio
phys
ical
qua
ntity
[not
e 72
]La
nd-c
over
ch
ange
[not
e 73
]
Car
bon
stor
age
Bio
phys
ical
qua
ntity
Land
-cov
er
chan
geEr
osio
n co
ntro
lVu
lner
abili
ty to
ero
sion
[not
e 74
]La
nd-c
over
ch
ange
Fres
hwat
er fl
ow a
nd q
ualit
y re
gula
tion
Bio
phys
ical
qua
ntity
[not
e 75
] La
nd-c
over
ch
ange
Tour
ism
Dis
tanc
e-ba
sed
aest
hetic
s [n
ote
76]
Land
-cov
er
chan
ge31
[not
e 77
]H
ydro
logi
cal s
ervi
ces
Bio
phys
ical
qua
ntity
[not
e 78
]H
uman
pre
ssur
e in
dex
rela
ted
to
key
biod
iver
sity
ar
eas[n
ote
79]
59C
arbo
n st
orag
eB
ioph
ysic
al q
uant
ity[n
ote
80]
29Va
rious
[not
e 81
]$
valu
e[not
e 82
]La
nd
trans
form
atio
n [n
ote
83]
60Va
rious
[not
e 84
]$
valu
eVu
lner
abili
ty
of b
iodi
vers
ity
[not
e 85
]
41 (s
ee a
lso
Boh
ensk
y et
al
43)
Fres
hwat
er p
rovi
sion
Bio
phys
ical
qua
ntity
[not
e 86
]W
ater
use
and
acc
ess
[not
e 87
]
Food
pro
visi
onB
ioph
ysic
al q
uant
ity[n
ote
88]
Die
tary
inta
ke[n
ote
89]
Woo
d fu
elB
ioph
ysic
al q
uant
ity (l
ocal
pr
oduc
tion)
Loca
l har
vest
rate
61C
arbo
n st
orag
eB
ioph
ysic
al q
uant
ityD
efor
esta
tion
rate
s an
d co
ver
of p
rote
cted
ar
eas
Opp
ortu
nity
cos
ts
18C
arbo
n st
orag
eB
ioph
ysic
al q
uant
ityPr
obab
ility
of
defo
rest
atio
nO
ppor
tuni
ty c
osts
[not
e 90
]
Wat
er q
ualit
yPr
oxy[n
ote
91]
Estim
ated
dow
nstre
am
user
s[not
e 92
]Pr
obab
ility
of
defo
rest
atio
nTa
ble
1 N
ote
s
1
Hol
land
et a
l48 u
sed
four
indi
cato
rs o
f riv
er s
tatu
s ndash
envi
ronm
enta
l qua
lity
inde
x ta
xon
richn
ess
hab
itat q
ualit
y as
sess
men
t and
hab
itat m
odifi
catio
n in
dex
ndash to
repr
esen
t the
cap
acity
of r
iver
sys
tem
s an
d ca
tchm
ents
to p
rovi
de fr
eshw
ater
eco
syst
em s
ervi
ces
The
aut
hors
arg
ue th
at c
hang
es in
the
valu
e of
thes
e in
dice
s re
flect
cha
nges
in th
e ca
paci
ty o
f riv
er s
yste
ms
to p
rovi
de s
ervi
ces
such
as
mai
ntai
ning
wat
er q
ualit
y c
ontro
lling
sed
imen
tatio
n an
d er
osio
n m
itiga
ting
flood
s c
yclin
g nu
trien
ts a
nd fi
lterin
g po
lluta
nts
2
C
arbo
n st
ored
in s
oils
and
veg
etat
ion
The
aut
hors
con
duct
ed a
naly
ses
at d
iffer
ent g
rain
siz
es (4
km
2 and
100
km
2 ) a
nd d
iffer
ent s
patia
l ext
ents
(Brit
ain
Engl
and
and
100
x 10
0 km
squ
ares
acr
oss
Brit
ain)
and
exa
min
ed v
aria
tion
acro
ss re
gion
s w
ithin
Brit
ain
3
Ann
ual i
ncom
e4
Th
e gr
oss
mar
gin
is th
e va
lue
of o
utpu
ts m
inus
var
iabl
e co
sts
and
subs
idy
paym
ents
5
R
ecre
atio
nal u
se o
f the
cou
ntry
side
6
Th
e nu
mbe
r of d
ay le
isur
e vi
sits
as
a m
easu
re o
f the
recr
eatio
nal v
alue
of p
artic
ular
rura
l loc
atio
ns (t
his
mea
sure
cou
ld b
e in
terp
rete
d as
the
dem
and
for r
ecre
atio
nal s
ervi
ces)
7
A
mou
nt o
f car
bon
sequ
este
red
each
yea
r8
N
itrog
en a
nd p
hosp
horu
s re
mov
ed in
par
ticul
ar la
ndsc
apes
9
C
apac
ity o
f lan
d to
reta
in s
edim
ent
10
Com
bini
ng in
form
atio
n on
nes
t site
s fl
oral
reso
urce
s an
d be
e fli
ght r
ange
s to
est
imat
e po
llina
tor a
bund
ance
and
like
ly v
isita
tion
to a
gric
ultu
ral a
reas
Page 6 of 16
F1000Research 2012 117 Last updated 31 OCT 2013
Page 6 of 16
F1000Research 2012 117 Last updated 09 SEP 2015
11
The
auth
ors
set t
arge
ts to
add
ress
the
issu
e of
dem
and
(eg
ca
ptur
ing
50
of t
otal
car
bon
stor
ed in
an
ecor
egio
n)
12
Cos
ts a
re re
pres
ente
d by
the
suita
bilit
y of
are
as fo
r con
serv
atio
n ba
sed
on n
umer
ical
val
ues
that
refle
ct th
e de
gree
of i
mpe
dim
ents
to c
onse
rvat
ion
succ
ess
For
car
bon
stor
age
it is
a fl
at c
ost
the
area
of
the
plan
ning
uni
t13
A
vert
ed ri
sk o
f ext
rem
e flo
ods
14
The
fract
ion
of to
tal fl
ood
cont
rol v
alue
as
a fu
nctio
n of
the
num
ber o
f hou
sing
uni
ts in
the
flood
plai
n
15
Prod
uctio
n of
fora
ge fo
r gra
zing
rang
elan
d st
ock
16
Dol
lar v
alue
of f
orag
e pr
oduc
tion
17
The
targ
et w
as 7
5 o
f for
age
prod
uctio
n va
lue
18
The
sum
of w
eigh
ted
valu
es a
ssoc
iate
d w
ith d
evel
oped
land
agr
icul
ture
roa
d de
nsity
and
leng
th o
f hum
an-in
duce
d pa
tch
edge
s19
Pr
ovis
ion
of re
crea
tion
oppo
rtun
ities
20
Q
uant
ity o
f sui
tabl
e ha
bita
t in
addi
tion
to a
cces
sibi
lity
issu
es a
nd ri
ghts
to a
cces
s21
A
bas
elin
e ta
rget
(ass
umed
min
imum
requ
irem
ent)
of 1
2 da
ys o
f out
door
recr
eatio
n pe
r per
son
per y
ear
22
Cro
p po
llina
tion
by n
atur
al p
ollin
ator
s23
Th
e do
llar v
alue
of a
gric
ultu
ral c
rops
ben
efitti
ng fr
om p
ollin
atio
n
24
75
of f
eatu
re v
alue
acr
oss
the
ecor
egio
n25
Th
e su
pply
of f
resh
wat
er
26
40
of t
otal
fres
hwat
er u
se
27
The
auth
ors
purs
ued
two
appr
oach
es a
targ
et-b
ased
app
roac
h an
d in
corp
orat
ing
ecos
yste
m s
ervi
ces
as e
xtra
cos
ts o
r ben
efits
in th
e co
st la
yer
28
This
is a
spe
cies
-bas
ed a
ppro
ach
so th
e pr
iorit
ies
are
base
d on
spe
cies
and
thei
r dis
tribu
tion
acro
ss th
e la
ndsc
ape
29
For e
xam
ple
pos
itive
or n
egat
ive
econ
omic
val
ue
30
The
mag
nitu
de o
f thr
eats
affe
ctin
g ea
ch s
peci
es b
ased
on
maj
or la
nd u
ses
The
loss
of a
spe
cies
is e
quiv
alen
t to
the
loss
of t
he s
ervi
ce(s
) tha
t spe
cies
pro
vide
s31
M
edia
n an
nual
sim
ulat
ed ru
n-of
f32
G
roun
dwat
er c
ontri
butio
n to
sur
face
run-
off
33
Hot
spot
s m
appe
d as
are
as w
ith s
ever
e er
osio
n po
tent
ial a
nd v
eget
atio
n an
d lit
ter c
over
of a
t lea
st 7
0 w
here
mai
ntai
ning
the
cove
r is
esse
ntia
l to
prev
ent e
rosi
on
34
Soil
dept
h an
d le
af li
tter
35
The
auth
ors
asse
ssed
var
ious
sce
nario
s fo
r cap
turin
g ec
osys
tem
ser
vice
s ba
sed
on in
cide
ntal
pro
tect
ion
thro
ugh
the
cons
erva
tion
of b
iodi
vers
ity o
r the
incl
usio
n of
spa
tially
exp
licit
data
on
serv
ice
dist
ribut
ion
usin
g M
arxa
n In
Ego
h et
al40
the
aut
hors
set
diff
eren
t tar
get t
hres
hold
s fo
r cap
turin
g ce
rtai
n pe
rcen
tage
s of
ser
vice
pro
visi
on fo
r sur
face
wat
er s
uppl
y w
ater
flow
regu
latio
n c
arbo
n st
orag
e s
oil r
eten
tion
and
soil
accu
mul
atio
n
36
The
auth
ors
estim
ated
the
amou
nt o
f eac
h ec
osys
tem
ser
vice
pro
vide
d by
veg
etat
ion
type
s un
der i
ntac
t and
deg
rade
d co
nditi
ons
Mea
surin
g th
e di
ffere
nce
betw
een
the
two
is in
dica
tive
of th
e th
reat
of
degr
adat
ion
to s
ervi
ce p
rovi
sion
37
Th
e co
st o
f con
serv
ing
a pl
anni
ng u
nit w
as e
quiv
alen
t to
the
valu
e of
irrig
ated
cro
ppin
g or
gra
zing
The
opp
ortu
nity
cos
ts o
f con
serv
atio
n w
ere
addr
esse
d in
term
s of
lost
pro
duct
ion
The
aut
hors
in
clud
ed s
patia
l var
iabi
lity
in c
osts
bec
ause
val
ues
are
per p
lann
ing
unit
In E
goh
et a
l40 c
atch
men
t are
a is
use
d as
a c
ost l
ayer
(lar
ger a
reas
= g
reat
er c
ost)
38
B
y na
tura
l veg
etat
ion
39
Th
e au
thor
s ex
amin
ed th
e re
latio
nshi
p be
twee
n fo
dder
pro
visi
on a
nd s
tock
ing
rate
s to
det
erm
ine
the
stoc
king
rate
s th
at c
an b
e im
plem
ente
d w
ithou
t deg
radi
ng th
e en
viro
nmen
t (ie
su
stai
nabl
e st
ocki
ng ra
tes)
Hen
ce o
ver-s
tock
ing
is c
onsi
dere
d im
plic
itly
as a
thre
at to
veg
etat
ion
cond
ition
40
G
roun
dwat
er re
char
ge
41
For e
xam
ple
for fl
ood
miti
gatio
n T
he a
utho
rs a
lso
exam
ined
opp
ortu
nitie
s fo
r ser
vice
enh
ance
men
t 42
In
corp
orat
ing
the
dens
ity o
f peo
ple
who
rely
on
the
serv
ice
(ben
efici
arie
s) a
s de
nsity
per
wat
ersh
ed a
nd th
e w
ater
ndashpro
duct
ion
effic
ienc
y as
wat
er s
uppl
y di
vide
d by
are
a of
wat
ersh
ed
43
Wat
er s
uppl
y re
lativ
e to
dem
and
adju
sted
for t
he n
eed
to re
dist
ribut
e su
pply
with
in w
ater
shed
s W
ater
shed
s w
ere
supp
ly d
oes
not (
or o
nly
just
) mee
ts d
eman
d w
ere
prio
ritiz
ed
44
Am
ount
of v
eget
atio
n co
ver a
nd ra
te o
f veg
etat
ion
loss
with
mid
-ran
ge v
alue
s de
sign
ated
as
prio
ritie
s45
A
pro
xy w
as u
sed
repr
esen
ting
reso
urce
and
mai
nten
ance
cos
ts (e
g
land
acq
uisi
tion
infra
stru
ctur
e an
d la
bour
) and
con
side
ring
wat
ersh
ed-le
vel m
easu
res
of in
com
e p
opul
atio
n si
ze a
nd a
rea
46
Fina
ncia
l cap
acity
to p
ay fo
r alte
rnat
ives
to s
ervi
ce p
rovi
sion
suc
h as
dam
s an
d fil
tratio
n pl
ants
47
In
clud
es th
e tra
de-o
ff be
twee
n a
high
leve
l of fl
ood
activ
ity (n
umbe
r of fl
oods
dur
atio
n of
floo
ds a
nd a
rea
affe
cted
) and
a h
igh
leve
l of i
mpa
ct o
n hu
man
pop
ulat
ions
(dea
ths
and
disp
lace
men
t an
d hu
man
pop
ulat
ion
dens
ity in
wat
ersh
ed)
and
the
cost
s of
ser
vice
pro
tect
ion
48
A
s a
prop
ortio
n of
all
land
The
aut
hors
exa
min
e al
so th
e op
port
uniti
es fo
r ser
vice
enh
ance
men
t thr
ough
land
scap
e re
stor
atio
n
49
The
auth
ors
used
exp
ert o
pini
on to
est
imat
e po
ssib
le la
nd tr
ansf
orm
atio
n w
ithin
the
next
5 y
ears
Thi
s id
entifi
ed n
egat
ive
and
posi
tive
chan
ges
to s
ervi
ce p
rovi
sion
50
B
ased
on
stak
ehol
der p
refe
renc
e51
Th
e in
clus
ion
of s
take
hold
ers
in th
e ra
nkin
g pr
oces
s ad
dres
ses
to a
deg
ree
the
dem
and
for s
ervi
ces
and
or th
e va
lue
of s
ervi
ces
to b
enefi
ciar
ies
Thi
s is
an
expl
icit
inco
rpor
atio
n of
ben
efici
arie
s in
the
proc
ess
52
Bas
ed o
n la
nd m
anag
emen
t and
sta
keho
lder
per
cept
ion
53
The
auth
ors
com
pare
d th
e ec
osys
tem
-ser
vice
val
ues
to th
e co
st o
f con
serv
ing
the
natu
ral h
abita
t tha
t und
erlie
s th
eir p
rovi
sion
The
opp
ortu
nity
cos
t was
cal
cula
ted
as th
e ex
pect
ed a
gric
ultu
ral v
alue
of
each
fore
sted
par
cel o
f lan
d
54
To e
stim
ate
the
econ
omic
val
ue o
f bus
hmea
t the
aut
hors
use
d th
e lo
cal m
arke
t pric
e of
a k
ilo o
f bee
f sin
ce d
omes
tic m
eat i
s a
poss
ible
sub
stitu
te fo
r bus
hmea
t Th
is a
ppro
ach
impl
icitl
y re
cogn
ises
al
tern
ativ
es to
ser
vice
pro
visi
on
55
Valu
e fo
r new
pha
rmac
eutic
al p
rodu
cts
56
The
auth
ors
assu
med
imm
inen
t def
ores
tatio
n ou
tsid
e of
cor
e pr
otec
ted
area
s57
N
et a
nnua
l rat
e of
atm
osph
eric
car
bon
adde
d to
exi
stin
g bi
omas
s ca
rbon
poo
ls (m
easu
red
usin
g a
prox
y)
Page 7 of 16
F1000Research 2012 117 Last updated 31 OCT 2013
Page 7 of 16
F1000Research 2012 117 Last updated 09 SEP 2015
58
The
auth
orsrsquo
max
imiz
ed s
ervi
ce p
rovi
sion
for a
giv
en e
core
gion
are
a co
nstra
int u
sing
opt
imiz
atio
n m
etho
ds
Inco
rpor
atin
g th
e is
sue
of a
rea
cons
train
ts a
ddre
sses
cos
ts a
nd th
e m
axim
izat
ion
goal
get
s so
mew
hat a
t dem
and
59
Ann
ual p
rodu
ctio
n of
live
stoc
k fro
m g
razi
ng o
n un
impr
oved
nat
ural
pas
ture
s (e
xpre
ssed
as
tons
of m
eat)
60
B
enefi
ciar
ies
wer
e at
the
poin
t of p
rodu
ctio
n on
ly (w
here
eco
nom
ic b
enefi
ts a
re re
aliz
ed)
The
auth
ors
iden
tified
pro
duct
ion
peak
s of
wat
er p
rovi
sion
and
gra
ssla
nd p
rodu
ctio
n in
den
sely
pop
ulat
ed
biod
iver
sity
hot
spot
s in
dire
ctly
add
ress
ing
the
issu
e of
spa
tial v
aria
bilit
y in
dem
and
61
Wat
er a
vaila
bilit
y an
d w
ater
use
62
O
nly
the
key
poin
ts a
re c
aptu
red
here
see
the
publ
icat
ion
for f
ull d
etai
ls
63
Scen
ario
ana
lyse
s ex
plor
e im
plic
atio
ns o
f pos
sibl
e fu
ture
land
scap
e ch
ange
s64
Es
timat
ed th
roug
h so
il lo
ss R
egio
ns w
ith lo
wer
pot
entia
l soi
l los
s w
ere
a pr
iorit
y w
hich
impl
icitl
y re
cogn
ises
the
impo
rtan
ce o
f thr
eats
65
W
ater
-sup
ply
func
tion
and
flow
regu
latio
n (m
ean
annu
al c
atch
men
t run
off a
nd m
ean
annu
al g
roun
dwat
er re
char
ge)
66
Iden
tified
ben
efici
arie
s in
the
biom
e th
roug
h a
liter
atur
e re
view
and
exp
ert c
onsu
ltatio
n
67
Mea
n ca
rryi
ng c
apac
ity o
f the
land
inco
rpor
atin
g cl
imat
e s
oil t
ype
and
vege
tatio
n68
A
reas
that
tour
ists
can
see
with
in a
10
km b
uffe
r sur
roun
ding
the
maj
or to
uris
t driv
ing
rout
es (s
ee R
eyer
s et
al55
)69
La
ndsl
ide
floo
d an
d dr
ough
t pre
vent
ion
func
tions
70
La
ndsl
ide
prev
entio
n co
nsid
ered
in te
rms
of la
ndsl
ide
haza
rd t
he m
ore
haza
rdou
s an
are
a th
e m
ore
impo
rtan
t it i
s to
kee
p fo
rest
in p
lace
(an
alte
rnat
ive
perc
eptio
n of
lsquodem
andrsquo
) D
roug
ht a
nd fl
ood
prev
entio
n re
flect
s w
ater
rete
ntio
n ca
pabi
lity
of fo
rest
71
Es
timat
ed u
sing
the
prox
imity
to s
ettle
men
ts a
nd ro
ads
(mea
sure
s of
acc
ess
for d
efor
esta
tion)
and
dis
tribu
tion
of th
e nu
mbe
r of c
omm
erci
al s
peci
es o
f tre
es (a
mea
sure
of f
ores
t des
irabi
lity
for l
oggi
ng)
72
Car
ryin
g ca
paci
ties
for d
omes
tic s
tock
exp
ress
ed a
s th
e nu
mbe
r of h
ecta
res
requ
ired
per l
arge
sto
ck u
nit (
hect
ares
val
ues
wer
e de
term
ined
for p
ristin
e ex
ampl
es o
f hab
itat t
ypes
) 73
Th
e au
thor
s co
mpa
red
the
pote
ntia
l del
iver
y of
eco
syst
em s
ervi
ces
from
lsquopris
tinersquo
loca
tions
to th
at p
rovi
ded
by d
egra
ded
loca
tions
est
imat
ing
how
land
scap
e de
grad
atio
n m
ay d
imin
ish
the
capa
city
of
loca
tions
to p
rovi
de a
giv
en s
ervi
ce (a
n in
dire
ct a
sses
smen
t of t
hrea
t)
74
The
auth
ors
map
ped
area
s vu
lner
able
to e
rosi
on a
nd c
lass
ified
them
as
high
med
ium
and
low
ero
sion
haz
ard
Hab
itat t
ypes
pro
vide
ero
sion
con
trol w
here
ther
e is
a h
igh
thre
at o
f ero
sion
ow
ing
to
fact
ors
such
as
topo
grap
hy r
ainf
all a
nd s
oil (
indi
rect
ly a
ddre
ssin
g th
e is
sue
of th
reat
) 75
M
illio
ns o
f cub
ic m
eter
s of
gro
undw
ater
rech
arge
per
1-k
m2 g
rid c
ell
76
A re
late
d st
udy
by W
endl
and
et a
l18 in
clud
ed c
osts
thr
eats
and
dem
and
but
it is
unc
lear
if th
ese
are
incl
uded
in th
e m
easu
re o
f hyd
rolo
gica
l im
port
ance
use
d in
Rog
ers
et a
l31
77
Prov
isio
n of
drin
king
wat
er to
dow
nstre
am u
sers
and
irrig
atio
n fo
r ric
e pa
ddie
s78
Th
e au
thor
s ex
amin
ed th
e th
reat
s to
the
biol
ogic
al v
alue
of k
ey b
iodi
vers
ity a
reas
(KB
As)
bas
ed o
n a
lsquohum
an p
ress
ure
inde
xrsquo c
alcu
late
d fro
m m
easu
res
of h
uman
pop
ulat
ion
dens
ity r
oad
dens
ity fi
re
prev
alen
ce a
nd a
gric
ultu
ral s
uita
bilit
y T
hey
did
not d
irect
ly e
xam
ine
thre
ats
to e
cosy
stem
-ser
vice
pro
visi
on b
ut d
id th
is in
dire
ctly
by
look
ing
at th
reat
s to
the
prot
ectio
n of
KB
As
whi
ch w
ere
rank
ed
base
d on
thei
r hyd
rolo
gica
l ser
vice
val
ue
79
The
carb
on d
ensi
ty o
f liv
ing
biom
ass
80
Th
e nu
mbe
r (an
d ty
pe) o
f ser
vice
s is
a li
ttle
ambi
guou
s it
app
ears
to b
e be
twee
n 9
and
13 d
epen
ding
on
the
anal
ysis
The
aut
hors
als
o co
nduc
ted
anal
yses
at t
hree
diff
eren
t spa
tial s
cale
s81
Ec
osys
tem
ser
vice
val
ues
wer
e ex
pres
sed
in d
olla
r val
ues
of la
nd u
nits
bas
ed o
n la
nd c
over
and
the
serv
ices
pro
vide
d by
par
ticul
ar la
nd c
over
s82
Th
e au
thor
s de
al w
ith th
reat
(s) t
o se
rvic
e pr
ovis
ion
indi
rect
ly b
y m
odel
ling
the
chan
ge in
eco
syst
em s
ervi
ce v
alue
with
two
alte
rnat
ive
deve
lopm
ent s
cena
rios
83
Th
e au
thor
s ca
lcul
ated
the
ecos
yste
m-s
ervi
ce v
alue
s ($
val
ue) f
or 1
7 di
ffere
nt s
ervi
ces
and
reco
gnis
ed v
aria
tion
in th
e sp
atia
l dep
ende
ncie
s of
ser
vice
s
84
The
auth
ors
asse
ssed
the
vuln
erab
ility
of b
iodi
vers
ity (lsquo
thre
atrsquo)
and
then
det
erm
ined
the
ecos
yste
m-s
ervi
ce v
alue
cap
ture
d in
bio
dive
rsity
tem
plat
es w
here
low
vul
nera
bilit
y is
a p
riorit
y an
d hi
gh
vuln
erab
ility
is a
prio
rity
85
Th
e au
thor
s ca
lcul
ated
wat
er a
vaila
bilit
y (to
tal a
nd p
er p
erso
n) a
nd m
appe
d su
pply
and
dem
and
ratio
s86
W
ater
ava
ilabi
lity
per p
erso
n w
as re
fere
nced
aga
inst
an
acce
pted
min
imum
targ
et (1
000
m3 )
set
by
the
Uni
ted
Nat
ions
(hen
ce t
his
targ
et re
pres
ents
lsquodem
andrsquo
) Th
e au
thor
s al
so c
alcu
late
d th
e pe
rcen
tage
of t
he p
opul
atio
n w
ith a
cces
s to
impr
oved
wat
er a
nd im
prov
ed s
anita
tion
and
und
er fi
ve m
orta
lity
per 1
000
birt
hs
87
The
perc
enta
ge c
ontri
butio
n of
car
bohy
drat
e an
d pr
otei
n-su
pply
ing
crop
s to
tota
l die
tary
inta
ke
88
Serv
ice
prov
isio
n is
com
pare
d to
reco
mm
ende
d m
inim
um d
aily
inta
ke (2
100
kcal
per
per
son)
and
min
imum
dai
ly in
take
of p
rote
in
89
Lost
agr
icul
tura
l pro
duct
ion
90
Opp
ortu
nity
cos
ts fo
r agr
icul
ture
and
sto
ck
91
The
auth
ors
did
not c
alcu
late
wat
er q
uant
ity b
ut u
sed
a pr
oxy
for t
he s
uppl
y of
sed
imen
t-fre
e w
ater
bas
ed o
n po
pula
tion
data
lan
d co
ver a
nd w
ater
flow
dire
ctio
n92
Th
e au
thor
s m
easu
red
dow
nstre
am u
sers
thro
ugh
the
dow
nstre
am p
opul
atio
nsrsquo n
eed
for q
ualit
y dr
inki
ng w
ater
dow
nstre
am a
rea
of ir
rigat
ed ri
ce fi
elds
and
dow
nstre
am a
rea
of m
angr
oves
Page 8 of 16
F1000Research 2012 117 Last updated 31 OCT 2013
Page 8 of 16
F1000Research 2012 117 Last updated 09 SEP 2015
soil retention24) or through quantifying the supply of services often in biophysical units The latter is the most common approach in broad-scale prioritization studies (Table 1) Biophysical quan-tities can include for example the amount of carbon stored in particular ecosystem types water availability or supply or fodder production However it is crucial to address also the issue of the level of biophysical quantity demanded by service beneficiaries We refer to the level of human need for a service as lsquodemandrsquo but recognise that this level changes with context and differs from the economic perspective of demand as the amount of a good or service that can be purchased at a given price
Simply increasing the quantity of a given service maymay not be appropriate depending on human need It could also divert funds from more necessary actions because if the quantities of certain ES are adequate and not under threat investment in the protection of these services could be a lower priority compared to services currently unable to meet human needs (see lsquoTarget setting and the capacity to meet demandrsquo) Luck et al15 explicitly addressed this issue by prioritizing locations for managing ES based on the hu-man need for the services of water provision and flood mitigation This directly links the quantity of service provided with the needs of beneficiaries and better identifies where needs are not being met
The benefits of managing for ES vary across space and time re-flecting for example variation in human need and the capacity to pay for human-derived alternatives This spatio-temporal vari-ation is decidedly complex influenced by factors such as the type of service being considered market fluctuations and the changing needs of beneficiaries This dynamism magnifies the complexity of ES prioritization beyond that of biodiversity prioritization For example Wilson et al11 note that the benefit-protection function in conservation planning is asymptotic in that benefit accumulation is less and less with the protection of more land While the same is true for some ES25 the shape of the curve will vary over time and space with beneficiary demand driven by among other things markets and changing needs Moreover owing to global markets it can be extremely difficult to identify who benefits from a given service It is less problematic to focus on the immediate beneficiar-ies of service provision (eg growers benefiting from crop polli-nation) rather than also considering those individuals that benefit from the products of services (eg consumers of crop commodi-ties26) In some cases it may be sufficient to recognise simply that the benefits from the provision of a particular service are globally widespread and diffuse (eg carbon storage)
Threats to service provisionConservation planners may quantify threatening processes that in-crease the risk of biodiversity loss27 and a similar focus on threats to ES provision is an appropriate way to incorporate threats into ser-vice prioritization It is also important to recognise the fundamental difference between the vulnerability of an ES to threat(s) and the level of threat a particular service is under Some services may be particularly vulnerable to threats (eg crop pollination reliant on a single pollinator species) but not currently threatened whereas other services may be resilient to a range of threats but at risk of decline owing to the magnitude of threat(s)
Despite its importance few ES prioritization schemes to date have explicitly incorporated threats (Table 1) Egoh et al3 document-ed biophysical quantities of ES provided by intact and degraded vegetation which implicitly addresses threat to service provision through landscape degradation Others examined changes in quan-tities or dollar values of services through modelling alternative future land-use scenarios recognising that some scenarios (eg extensive development) represent a greater threat to service pro-vision than others28ndash30 A more explicit approach to incorporating threats is to document the likelihood of decline or loss of service-providing ecosystems through for example human development or habitat loss1831
Addressing threats to ES is most important when service provision is not substitutable across space (ie site dependency is high be-cause the service must be provided in a specific location eg storm protection) there are no human-derived alternatives to service pro-vision or these alternatives are expensive relative to the capacity of local communities to pay for the alternatives or ecosystem changes are irreversible (eg species extinction)
Costs of actions to manage servicesConservation planners list a variety of costs that should be con-sidered when assessing options for protecting biodiversity32 These range from acquisition costs (eg purchasing land for conserva-tion) and management costs (eg maintaining conservation areas) through to social costs (eg the number of people displaced from conservation areas1133) Costs will vary across space and must be linked to actions to improve planning relevance9 For example if the action required is land acquisition then a relevant cost is land price if the action is management of a conservation area then a relevant cost would be the salaries of conservation managers
The management of ES attracts similar costs dependent on the type of action required to protect the service Indeed some ES prioritiza-tion schemes incorporate opportunity costs in a similar way to bio-diversity prioritization recognising that managing ecosystems for service provision can yield the same opportunity costs as protecting ecosystems for biodiversity (eg when an area cannot be used for production31834 Table 1) Costs may also be incorporated through the use of proxies for resource and maintenance expenses (see lsquoAn example of spatial prioritizationrsquo)
It is important to identify the assignation of costs (who pays) and benefits in both biodiversity conservation and ES prioritization35 For example designation of a conservation area yields benefits that are primarily public notwithstanding for example income gener-ated from nature tourism but sometimes at a cost to private interests (eg opportunity cost of lost revenue from production) Managing an area for the delivery of ES can yield relatively greater private benefits particularly for service beneficiaries with costs borne by both public and other private interests For example a forest des-ignated for timber harvest will yield financial benefits to logging companies at a cost to the public (eg through lost carbon storage) and other private interests (eg those interested in using the forest for ecotourism) Ensuring greater equity in the distribution of ben-efits and costs from services provided by public or private assets
Page 9 of 16
F1000Research 2012 117 Last updated 31 OCT 2013
Page 9 of 16
F1000Research 2012 117 Last updated 09 SEP 2015
may be achieved through various mechanisms such as government regulation self-regulation (enforced by societal norms) or market approaches like cap and trade or payments for ES3637 Yet the ap-propriateness of a particular mechanism depends on the character-istics of the service being targeted (eg who generates the service management jurisdiction and providerndashbeneficiary spatio-temporal dynamics see Kinzig et al37)
Availability of alternatives to service provisionThe availability of human-derived alternatives to the provision of ES is a vital consideration in service prioritization These alter-natives can include for example a water filtration plant to cover the filtration services of wetlands or pesticides to cover biological control The availability of alternatives and the capacity of relevant human communities to pay for these alternatives can influence the treatment of other factors such as benefits threats actions and costs For example managing a particular service may be given lower priority if human-derived alternatives are readily available and affordable although the associated costs of these alternatives must be considered also (eg the health costs of increasing pesti-cide use) Only a few studies that attempt ES prioritization address the issue of availability of alternatives (Table 1) As part of the pri-oritization process the availability and cost of alternatives should be considered simultaneously with the list of potential actions for service protection or enhancing service provision
Target setting and the capacity to meet demandSetting targets is common in conservation planning and can be a requirement for assessing the capacity of selection procedures to meet conservation objectives38 In most cases setting a target is equivalent to meeting a baseline threshold Target setting in ES pri-oritization is rare and has to the best of our knowledge only oc-curred in four published studies343940 (Table 1) For example Chan et al39 set a baseline target (assumed minimum requirement) of 12 days of outdoor recreation per person per year and determined the space required to provide that level of service from data on park visitation Chan et al39 also stipulated that targets had to be met in different stratification zones within the study area which accounted somewhat for the site dependency of service production and vari-ability in the spatial distribution of beneficiary needs
While target setting is one approach to assessing the capacity of eco-systems to meet the demands of beneficiaries provisionndashdemand re-lations have been variously dealt with in the literature (Table 1) For example some studies included data on water use when calculating water provision capacity [eg1526] while others measured down-stream need for water of a given quality through the calculation of population densities and areas of irrigated rice and mangroves18 Van Jaarsveld et al41 calculated water and food provision relative to accepted minimum standards for human consumption The need and approach to calculating demand for service provision will vary depending on the service of interest For example it is generally considered unnecessary to calculate spatially explicit demand for carbon storage because this service benefits the global community and demand is not spatially variable
Site dependency and scaleSite dependency in the provision of an ES reflects the level of need for a particular service to be provided in a particular location in
order to deliver benefits to a given set of beneficiaries This can be interpreted also in the context of the scale of service provision (eg local to global) For example storm protection from mangroves has high site dependency in provision ndash mangrove forests must occur in locations where local communities are threatened by storm activity This should not be confused with the substitutability of the service that is whether human-derived alternatives (eg sea walls) or other coastal vegetation types can provide a similar service In contrast global climate regulation through ecosystems storing carbon has lower site dependency in provision because it does not have to occur at a particular location (ie there are various options for managing ecosystems to store carbon) However there is still some level of site preference because certain ecosystems (eg rainforests) store more carbon than others Site dependency and scale varies also in the use of the service For example the beneficiaries of biological control in agro-ecosystems generally occur at the local to regional scale if the emphasis is on growers whereas the beneficiaries of climate regulation occur at the global scale
Variation in the site dependency and scale of the provision and use of ES has major implications for the valuation of services which must consider spatially explicit and scale-dependent relationships in productionndashconsumption flows42 Such relationships also have im-portant implications for prioritization strategies High site depend-ency could result in certain locations that generate that service being classified as irreplaceable For example Bohensky et al43 identified irreplaceable land units for food and water provision to meet pre-determined targets of caloric intake for a given population When services have lower levels of site dependency in production there is greater flexibility in site selection during the prioritization process (all else being equal)
An example of spatial prioritizationThe relationships among the various components of our conceptual framework for spatial prioritization of ES are presented in Figure 1 We illustrate our approach in this section using a worked example based on data published in Luck et al15 focussing for the sake of simplicity on a single ES water provision
The global analysis of Luck et al15 identified watersheds that are a priority for protecting particular ES The first step in the analysis was to quantify the benefits and supply of the service The benefits of protecting the supply of potable water was measured through hu-man population density in each watershed that is there were greater benefits to protecting supply in watersheds with higher population density compared to those with lower density Water supply was measured using a global hydrological model and lsquowater-production efficiencyrsquo was calculated for each watershed by dividing supply in each watershed with watershed area
The costs of actions to manage water provision were represented using a proxy for resource (eg land acquisition and infrastructure) and maintenance (eg labour) costs This proxy incorporated data on total income in the watershed (per capita gross national income) population size and watershed area Resource costs were assumed to scale positively with per-capita wealth and population density (assuming that land and infrastructure prices are generally higher where population density is higher) while maintenance costs were assumed to also scale positively with per-capita wealth Finally the
Page 10 of 16
F1000Research 2012 117 Last updated 31 OCT 2013
Page 10 of 16
F1000Research 2012 117 Last updated 09 SEP 2015
and change in vegetation cover can be considered a proxy for threat to water provision To quantify this threat the following data were used the proportion of each watershed covered in tree shrub and herbaceous vegetation the annual rate of change in vegetation cover (over a proceeding 5-year period) the time span over which change in cover would be predicted (eg 20 years) and the proportion of the watershed that was protected (assuming vegetation in protected areas could not be cleared) Watersheds with mid-range values of vegetation cover rates of vegetation loss andor area protected were considered priorities for water provision management because for example watersheds with low cover and high rates of loss would require large investments in ES management relative to return whereas watersheds with high cover and low rates of loss are under less threat to the disruption of the service
The final consideration in spatial prioritization is the availability of alternatives to the provision of the service via ecosystems Im-provements in the supply of potable water may be made through the construction of dams and building of filtration plants for example rather than ecosystem management The availability of these alter-natives is often a function of the capacity of local communities to
cost-effectiveness of protecting the service in each watershed was calculated by dividing human population density and water supply (benefits) by the cost
The capacity to meet demand was measured using values for water supply and water withdrawals in each watershed It also considered regional water deficits (withdrawals gt supply) and the proportion of total supply that remained once demands were met adjusting the watershed-level capacity measure downwards proportional to the need to move water to regions (within a watershed) where supply did not meet demand It was assumed that managing the service of water provision was most important in watersheds where supply barely meets or is short of demand and less important when supply greatly exceeded demand
To estimate threat to water provision expected vegetation cover in each watershed was used recognising the link between vegetation and water provision filtration and the maintenance of water qual-ity (although this link is decidedly complex see Luck et al15 for details) Vegetation cover and type in a watershed may be indicative of the capacity of the watershed to provide potable water naturally
Figure 1 Key aspects for consideration in ecosystem-service prioritization
Pre-prioritization
Prioritization process
Post-prioritization Reduce conicts and assess trade-os among priorities through multi-objective planning frameworks
Determine services toprioritize throughstakeholder consultation
Determine availability ofspatially explicit data
Assess data quality foreach component ofprioritization
bull Identify beneciaries (immediate and non- immediate)bull Determine social needbull Assess capacity of ecosystem to meet demand
bull Dene metric to measure supplybull Calculate dierence made by actionbull Assess site dependency of supplybull Identify alternatives
bull Identify threats to supply Assess impact of threat on service deliverybull Assess if impacts of threats are irreversible
bull Estimate cost of action needed to abate threat Identify who pays costbull Determine budget
Demand Supply
Costs Threats
Page 11 of 16
F1000Research 2012 117 Last updated 31 OCT 2013
Page 11 of 16
F1000Research 2012 117 Last updated 09 SEP 2015
ES management The selection of different services will influence the approach to spatial prioritization because ES management will have different objectives (eg improving timber harvest or main-taining water supply) However the major steps we outline here will be relevant in most cases
Application of our approach requires spatially explicit data on where services are produced benefits costs and threats Data on spatially explicit production is usually obtained through mapping the loca-tion of ecosystems that provide services (eg grasslands that sup-port livestock) Mostly this involves maps of vegetation types or water sources (Table 1) Benefits are represented spatially generally via the biophysical quantity of a given service produced by a given location (eg carbon stored) andor its financial value To represent costs spatially researchers have used simply the area of the planning unit (eg39 for some services) or current land values [eg34] Docu-menting costs is problematic because of spatio-temporal variation in financial values which is possibly why some researchers have resorted to more simple rules-of-thumb (eg assuming that manag-ing larger areas yields greater costs) Also problematic is spatially explicit measures of threat which have been represented by for ex-ample maps of land-use or historical or potential land-cover change and how these relate spatially to the location of service provision [eg3047] (Table 1)
Finally the type of data used in prioritization will greatly affect out-comes For example Anderson et al2 demonstrated that variation in the resolution (asymp grain size) andor spatial extent of a prioritization analysis influenced the level of congruence between biodiversity and ES priorities Moreover data quality may be poor for certain services and certain components of prioritization For example crude proxies or indicators may be required for services for which it is difficult to obtain accurate spatially explicit measures of sup-ply and demand (eg flood mitigation see Holland et al48) Our framework which promotes the use also of data on threats costs alternatives and site dependency may help to alleviate this issue because prioritization could be based just on those components for which data quality is acceptable
The most appropriate metric to represent the supply of the service will be context dependent but the use of biophysical quantities will be suitable in most cases For example if the service is storm protec-tion then a suitable metric may be the area of mangroves that needs to be maintained to deliver a given level of protection [eg25] ES supply should be assessed relative to the demand for the service which can be measured using a target-based approach through cur-rent or projected use of the service or its products through dem-onstrated need for the service (eg historical impacts of storms) or through meeting an accepted minimum standard (eg acceptable losses due to storm damage) Quantifying demand for a service re-quires the implicit or preferably explicit identification of beneficiar-ies which may be immediate beneficiaries (eg residents of coastal villages threatened by storms) andor lsquonon-immediatersquo beneficiaries (eg consumers of goods produced by the villages)
The application of prioritization frameworks generally involves multiple services across many planning units and priorities for different services are not necessarily congruent2 This requires an analysis of trade-offs between services in managing landsea-space
pay for them in addition to other constraints (eg topographic suit-ability for dam construction) Therefore Luck et al15 used the gross national income per capita of countries spanning each watershed as an indicator of the capacity of communities reliant on the watershed to pay for alternatives to natural water provision
The above components were combined into a single index repre-senting the relative importance of each watershed for protecting water supply This example and our prioritization framework gen-erally is appropriate when planning units are large and there are a variety of available options for managing services and it is difficult to express the components of prioritization precisely Our frame-work treats the supply of services threats and costs in ES prioritiza-tion inclusive of beneficiary demand capacity to meet demand and availability of alternatives to ES provision
DiscussionOur review of current approaches to identifying spatial priorities for managing ES found that the important components of prioritization (benefits costs threats availability of alternative and capacity to meet demand) were treated in substantially different ways or some-times omitted completely (although not all components are appli-cable in every context) Moreover few studies explicitly addressed the issue of site dependency and scale in the provision of services andor location of beneficiaries Accordingly there is substan-tial scope for improving ES analyses aimed at identifying spatial priorities for managing services
If ES benefits were commodities in perfect markets the price of such benefits would reflect all of the spatial prioritization components identified above Yet many ES benefits are not commodities and for those that are the associated markets are far from perfect suffering from numerous market failures including monopsony (single buy-ers as in reverse auctions) oligopoly (few sellers as in many pay-ments-for-ES schemes) externalities and information asymmetries This means that market prices will not generally reflect all of the components of prioritization appropriately Stated-preference non-market valuation approaches can be informative in certain settings where markets do not apply but they are generally of limited utility reflecting the various dimensions of valuesocial priority4445 Ac-cordingly even where economic valuation data are available it will still be appropriate for ES prioritization exercises to separately inte-grate some of the components we identify
Although we have focussed on the mechanics of prioritization the following issues must be addressed prior to such analyses 1) iden-tification of the ES to be included 2) capacity to access spatially explicit data and 3) data quality (Figure 1) Identifying important ES should occur through in-depth consultation among scientists policy-makers managers and stakeholders (especially service ben-eficiaries see Fisher et al46) For example if prioritization was required across a particular country federal management agencies and relevant stakeholders may engage in a process of identifying those services most important to the well-being of the country lsquoImportancersquo may be a factor of the total financial value of a ser-vice (eg agricultural production) andor the societal need for a service (eg provision of potable water) and assessed through ap-propriate valuation approaches Hence a priority list of which ser-vices to focus on is required prior to deciding on where to invest in
Page 12 of 16
F1000Research 2012 117 Last updated 31 OCT 2013
Page 12 of 16
F1000Research 2012 117 Last updated 09 SEP 2015
China Costa Rica and Mexico pay landholders that engage in man-agement that protects the supply of hydrological services50ndash52 Vital to this process is identifying locations that offer the greatest return on investment This requires a systematic and thorough approach to identifying spatial priorities for protecting ES
Author contributionsGL and KC conceived the study GL summarised the information in Table 1 and prepared the first draft of the manuscript All authors revised subsequent drafts of the manuscript and have agreed to the final content
Competing interestsWe declare no competing interests
Grant informationThe contribution of GL and CK was supported by the Australian Re-search Councilrsquos Future Fellowship (project number FT0990436G) and Postdoctoral Fellowship (project number DP110102153) pro-grams respectively The contribution of KC was supported by the Canada Research Chairs program and the Canadian Foundation for InnovationBritish Columbia Knowledge Development Fund (Leaders Opportunity Fund)
The funders had no role in study design data collection and analy-sis decision to publish or preparation of the manuscript
for service provision5 Moilanen et al49 addressed this issue using a multi-objective prioritization approach for biodiversity and ES based on the conservation planning software Zonation The au-thors argued that regional variation in land-use priorities meant that spatial separation of land uses may reduce management conflicts Moreover areas that are a priority for multiple ES could be used in trade-offs assuming the areas were not critical priorities for every service
In multi-objective prioritization frameworks that consider spatial separation of ES management or trade-offs in land-use priorities it is vital to address site-dependency and scale of service provision and location of beneficiaries As we argue above there is little flex-ibility in managing for the provision of services that are delivered locally to in situ beneficiaries (eg flood mitigation) Avoiding in-appropriate management decisions and trade-offs rests entirely on taking a comprehensive approach to identifying priorities Here we describe the major factors that must be considered in ES prioritiza-tion and argue that addressing as many of these factors as possible will improve the outcomes of multi-objective prioritization frame-works that aim to promote human well-being through the protection of services
Developing comprehensive methods for identifying ES priorities is much more than just an academic exercise Governments and NGOs across the world are increasingly including the protection of ES into their policy directives For example the governments of
References
1 MA (Millennium Ecosystem Assessment) Ecosystems and human well-being synthesis Island Press Washington DC 2005 Reference Source
2 Anderson BJ Armsworth PR Eigenbrod F et al Spatial covariance between biodiversity and other ecosystem service priorities J Appl Ecol 2009 46(4) 888ndash896 Publisher Full Text
3 Egoh BN Reyers B Carwardine J et al Safeguarding biodiversity and ecosystem services in the Little Karoo South Africa Conserv Biol 2010 24(4) 1021ndash1030 PubMed Abstract | Publisher Full Text
4 Chan KMA Hoshizaki L Klinkenberg B et al Ecosystem services in conservation planning targeted benefits or co-benefitscosts PLoS One 2011 6(9) e24378 PubMed Abstract | Publisher Full Text | Free Full Text
5 White C Halpern BS Kappel CV et al Ecosystem service tradeoff analysis reveals the value of marine spatial planning for multiple ocean uses Proc Natl Acad Sci U S A 2012 109(12) 4696ndash701 PubMed Abstract | Publisher Full Text | Free Full Text
6 Menzel S Teng J Ecosystem services as a stakeholder-driven concept for conservation science Conserv Biol 2010 24(3) 907ndash909 PubMed Abstract | Publisher Full Text
7 Kareiva P Tallis H Ricketts TH et al Natural capital theory and practice of mapping ecosystem services Oxford University Press Oxford 2011 365 Reference Source
8 Brooks TM Mittermeier RA da Fonseca GAB et al Global biodiversity conservation priorities Science 2006 313(5783) 58ndash61 PubMed Abstract | Publisher Full Text
9 Carwardine J Wilson KA Watts M et al Avoiding costly conservation mistakes the importance of defining actions and costs in spatial priority setting PLoS One 2008 3(7) e2586 PubMed Abstract | Publisher Full Text | Free Full Text
10 Pressey RL Bottrill MC Approaches to landscape- and seascape-scale conservation planning convergence contrasts and challenges Oryx 2009 43(4) 464ndash475 Publisher Full Text
11 Wilson KA Carwardine J Possingham HP et al Setting conservation priorities Ann N Y Acad Sci 2009 1162 237ndash264 PubMed Abstract | Publisher Full Text
12 Mills M Pressey RL Weeks R et al A mismatch of scales challenges in planning for implementation of marine protected areas in the Coral Triangle Conservation Letters 2010 3(5) 291ndash303 Publisher Full Text
13 Margules CR Pressey RL Systematic conservation planning Nature 2000 405 243ndash253 Publisher Full Text
14 Egoh B Rouget M Reyers B et al Integrating ecosystem services into conservation assessments a review Ecol Econ 2007 63(4) 714ndash721 Publisher Full Text
15 Luck GW Chan KMA Fay JP et al Protecting ecosystem services and biodiversity in the worldrsquos watersheds Conservation Letters 2009 2(4) 179ndash188 Publisher Full Text
16 Cowling RM Egoh B Knight AT et al An operational model for mainstreaming ecosystem services for implementation Proc Natl Acad Sci U S A 2008 105(28) 9483ndash9488 PubMed Abstract | Publisher Full Text | Free Full Text
17 Chen X Lupi F Vintildea A et al Using cost-effective targeting to enhance the efficiency of conservation investments in payments for ecosystem services Conserv Biol 2010 24(6) 1469ndash1478 PubMed Abstract | Publisher Full Text
18 Wendland KJ Honzaacutek M Portela R et al Targeting and implementing payments for ecosystem services opportunities for bundling biodiversity conservation with carbon and water services in Madagascar Ecol Econ 2010 69(11) 2093ndash2107 Publisher Full Text
Page 13 of 16
F1000Research 2012 117 Last updated 31 OCT 2013
Page 13 of 16
F1000Research 2012 117 Last updated 09 SEP 2015
Sci 2005 360(1454) 425ndash441 PubMed Abstract | Publisher Full Text | Free Full Text
42 Balmford A Fisher B Green RE et al Bringing ecosystem services into the real world an operational framework for assessing the economic consequences of losing wild nature Environmental and Resource Economics 2011 48(2) 161ndash175 Publisher Full Text
43 Bohensky E Reyers B van Jaarsveld A et al Ecosystem services in the Gariep basin a component of the Southern African Millennium Ecosystem Assessment (SAfMA) Stellenbosch University Stellenbosch South Africa 2004 Reference Source
44 Gregory R Lichtenstein S Slovic P et al Valuing environmental resources a constructive approach J Risk Uncertain 1993 7(2) 177ndash197 Publisher Full Text
45 Sagoff M Aggregation and deliberation in valuing environmental public goods a look beyond contingent pricing Ecol Econ 1998 24(2ndash3) 213ndash230 Publisher Full Text
46 Fisher B Turner RK Burgess ND et al Measuring modeling and mapping ecosystem services in the Eastern Arc Mountains of Tanzania Progress is Physical Geography 2011 35(5) 595ndash611 Publisher Full Text
47 Coppolillo P Gomez H Maisels F et al Selection criteria for suites of landscape species as a basis for site-based conservation Biol Conserv 2004 115(3) 419ndash430 Publisher Full Text
48 Holland RA Eigenbrod F Armsworth PR et al Spatial covariation between freshwater and terrestrial ecosystem services Ecol Appl 2011 21(6) 2034ndash2048 PubMed Abstract | Publisher Full Text
49 Moilanen A Anderson BJ Eigenbrod F et al Balancing alternative land uses in conservation prioritization Ecol Appl 2011 21(xx) 1419ndash1426 PubMed Abstract | Publisher Full Text
50 Sanchez-Azofeifa GA Pfaff A Robalino JA et al Costa Ricarsquos payment for environmental services program intention implementation and impact Conserv Biol 2007 21(5) 1165ndash1173 PubMed Abstract | Publisher Full Text
51 Liu JG Li SX Ouyang ZY et al Ecological and socioeconomic effects of Chinarsquos policies for ecosystem services Proc Natl Acad Sci U S A 2008 105(28) 9477ndash9482 PubMed Abstract | Publisher Full Text | Free Full Text
52 Muntildeoz-Pintildea C Guevara A Torres JM et al Paying for the hydrological services of Mexicorsquos forests analysis negotiations and results Ecol Econ 2008 65(4) 725ndash736 Publisher Full Text
53 Bai Y Zhuang C Ouyang Z et al Spatial characteristics between biodiversity and ecosystem services in a human-dominated watershed Ecological Complexity 2011 8(2) 177ndash183 Publisher Full Text
54 Egoh B Reyers B Rouget M et al Spatial congruence between biodiversity and ecosystem services in South Africa Biol Conserv 2009 142(3) 553ndash562 Publisher Full Text
55 Reyers B OrsquoFarrell PJ Cowling RM et al Ecosystem services land-cover change and stakeholders finding a sustainable foothold for a semiarid biodiversity hotspot Ecology and Society 2009 14(1) 38 Reference Source
56 Guo Z Gan Y Ecosystem function for water retention and forest ecosystem conservation in a watershed of the Yangtze River Biodivers Conserv 2002 11(4) 599ndash614 Publisher Full Text
57 OrsquoFarrell PJ Reyers B Le Maitre DC et al Multi-functional landscapes in semi arid environments implications for biodiversity and ecosystem services Landscape Ecology 2010 25(8) 1231ndash1246 Publisher Full Text
58 Phua MH Minowa M A GIS-based multi-criteria decision making approach to forest conservation planning at a landscape scale a case study in the Kinabalu Area Sabah Malaysia Landsc Urban Plan 2005 71(2ndash4) 207ndash222 Publisher Full Text
59 Strassburg BBN Kelly A Balmford A et al Global congruence of carbon storage and biodiversity in terrestrial ecosystems Conservation Letters 2010 3(2) 98ndash105 Publisher Full Text
60 Turner WR Brandon K Brooks TM et al Global conservation of biodiversity and ecosystem services BioScience 2007 57(10) 868ndash873 Publisher Full Text
61 Venter O Laurance WF Iwamura WF et al Harnessing carbon payments to protect biodiversity Science 2009 326(5958) 1368 PubMed Abstract | Publisher Full Text
19 Guo ZW Xiao XM Li DM et al An assessment of ecosystem services water flow regulation and hydroelectric power production Ecol Appl 2000 10(3) 925ndash936 Publisher Full Text
20 Ricketts TH Tropical forest fragments enhance pollinator activity in nearby coffee crops Conserv Biol 2004 18(5) 1262ndash1271 Publisher Full Text
21 Bockstael NE Freeman AM Kopp RJ et al On measuring economic values for nature Environ Sci Technol 2000 34(8) 1384ndash1389 Publisher Full Text
22 Aldred J Incommensurability and monetary valuation Land Economics 2006 82(2) 141ndash161 Publisher Full Text
23 Turner RK Fisher B Environmental economics to the rich man the spoils Nature 2008 451(7182) 1067ndash1068 PubMed Abstract | Publisher Full Text
24 Egoh B Reyers B Rouget M et al Mapping ecosystem services for planning and management Agric Ecosyst Environ 2008 127(1ndash2) 135ndash140 Publisher Full Text
25 Barbier EB Koch EW Silliman BR et al Coastal ecosystem-based management with nonlinear ecological functions and values Science 2008 319(5861) 321ndash323 PubMed Abstract | Publisher Full Text
26 Naidoo R Balmford A Costanza R et al Global mapping of ecosystem services and conservation priorities Proc Natl Acad Sci U S A 2008 105(28) 9495ndash9500 PubMed Abstract | Publisher Full Text | Free Full Text
27 Klein CJ Ban NC Halpern BS et al Prioritizing land and sea conservation investments to protect coral reefs PLoS One 2010 5(8) e12431 PubMed Abstract | Publisher Full Text | Free Full Text
28 Nagendra H Incorporating landscape transformation into local conservation prioritization a case study in the Western Ghats India Biodivers Conserv 2001 10(3) 353ndash365 Publisher Full Text
29 Troy A Wilson MA Mapping ecosystem services practical challenges and opportunities in linking GIS and value transfer Ecol Econ 2006 60(2) 435ndash449 Publisher Full Text
30 Nelson E Mendoza G Regetz J et al Modeling multiple ecosystem services biodiversity conservation commodity production and tradeoffs at landscape scales Front Ecol Environ 2009 7(1) 4ndash11 Publisher Full Text
31 Rogers HM Glew L Honzak M et al Prioritizing key biodiversity areas in Madagascar by including data on human pressure and ecosystem services Landsc Urban Plan 2010 96(1) 48ndash56 Publisher Full Text
32 Naidoo R Balmford A Ferraro PJ et al Integrating economic costs into conservation planning Trends Ecol Evol 2006 21(12) 681ndash687 PubMed Abstract | Publisher Full Text
33 Ban NC Klein CJ Spatial socioeconomic data as a cost in systematic marine conservation planning Conservation Letters 2009 2(5) 206ndash215 Publisher Full Text
34 Naidoo R Ricketts TH Mapping the economic costs and benefits of conservation PLoS Biol 2006 4(11) e360 PubMed Abstract | Publisher Full Text | Free Full Text
35 Adams V Pressey R Naidoo R et al Opportunity costs who really pays for conservation Biol Conserv 2010 143(2) 439ndash448 Publisher Full Text
36 Pagiola S Bishop J Landell-Mills N (eds) et al Selling forest environmental services market-based mechanisms for conservation and development Earthscan London 2002 299 Reference Source
37 Kinzig AP Perrings C Chapin FS III et al Sustainability Paying for ecosystem servicesndashpromise and peril Science 2011 334(6056) 603ndash604 PubMed Abstract | Publisher Full Text
38 Carwardine J Klein CJ Wilson KA et al Hitting the target and missing the point target-based conservation planning in context Conservation Letters 2009 2(1) 4ndash11 Publisher Full Text
39 Chan KMA Shaw MR Cameron DR et al Conservation planning for ecosystem services PLoS Biol 2006 4(11) e379 PubMed Abstract | Publisher Full Text | Free Full Text
40 Egoh BN Reyers B Rouget M et al Identifying priority areas for ecosystem service management in South African grasslands J Environ Manage 2011 92(6) 1642ndash1650 PubMed Abstract | Publisher Full Text
41 Van Jaarsveld AS Biggs R Scholes RJ et al Measuring conditions and trends in ecosystem services at multiple scales the Southern African Millennium Ecosystem Assessment (SAfMA) experience Philos Trans R Soc Lond B Biol
Page 14 of 16
F1000Research 2012 117 Last updated 31 OCT 2013
Page 14 of 16
F1000Research 2012 117 Last updated 09 SEP 2015
F1000Research
Open Peer Review
Current Referee Status
Version 1
04 October 2012Referee Report
doi105256f1000research119r307
David NortonCollege of Engineering University of Canterbury Christchurch New Zealand
This is an interesting article that provides a conceptual framework for prioritizing areas for protectingecosystem services (ES) such as water provision
The article explores similarities and differences between ES prioritization and biodiversity prioritizationand highlights several key components that need to be considered in prioritizing areas for protecting ESTwo key components are the need to consider the costs of protecting areas and the importance ofconsidering human-derived alternatives The conceptual framework is then applied to a case study basedon water provision
I have read this submission I believe that I have an appropriate level of expertise to confirm thatit is of an acceptable scientific standard
No competing interests were disclosedCompeting Interests
29 September 2012Referee Report
doi105256f1000research119r306
Elena BennettNatural Resource Sciences and the McGill School of the Environment McGill University SteAnne-de-Bellevue Canada
This work presents an interesting conceptual framework that researchers as well as governments or otherstakeholders could use to identify priority areas for protecting ecosystem services
The authors suggest the following key elements (1) determine the services of interest (2) quantify thedemand for the service(s) and capacity of the ecosystem to meet demand through supply of the service(3) identify the threats and level of threat and (4) estimate the cost of protecting the service as well as anyalternative means of providing the service The authors then review the literature in which priorities havebeen assessed and identify which steps have been taken and which not in each study or effort I hope thispaper will increase our attention to key aspects of ES assessment that are often ignored especially theinteraction among all of these key factors
I have read this submission I believe that I have an appropriate level of expertise to confirm that
Page 15 of 16
F1000Research 2012 117 Last updated 09 SEP 2015
F1000Research
I have read this submission I believe that I have an appropriate level of expertise to confirm thatit is of an acceptable scientific standard
No competing interests were disclosedCompeting Interests
Page 16 of 16
F1000Research 2012 117 Last updated 09 SEP 2015
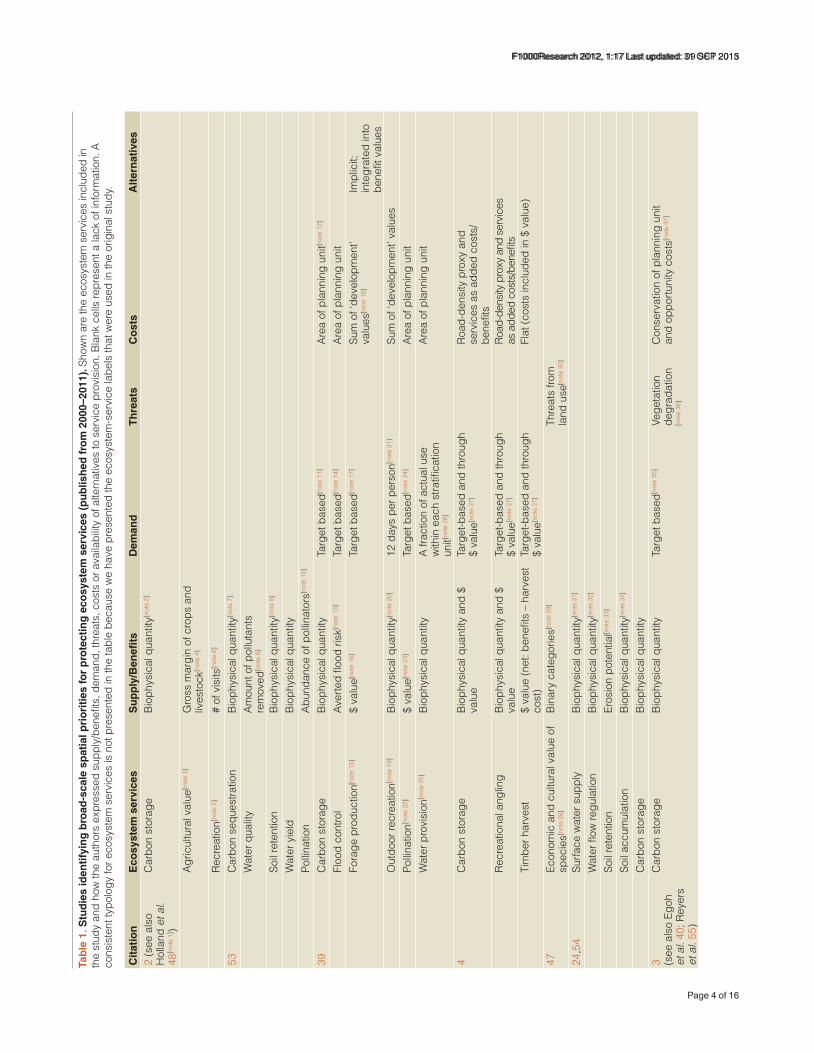
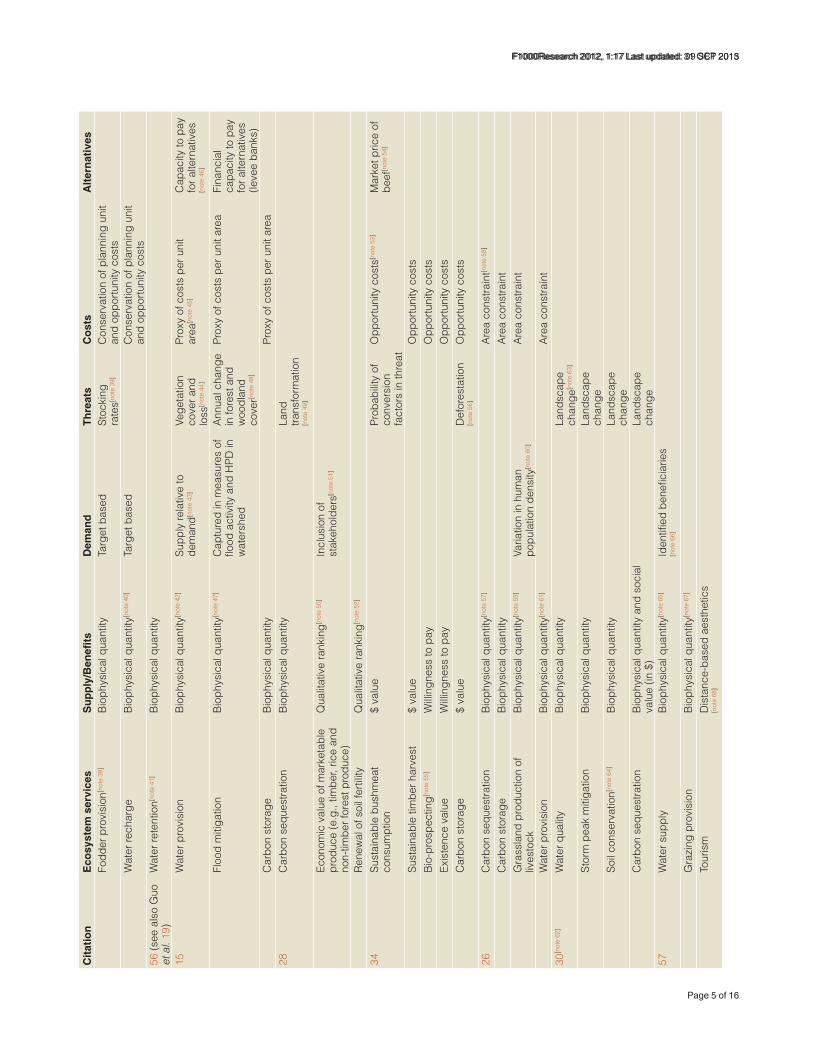
Cit
atio
nE
cosy
stem
ser
vice
sS
up
ply
Ben
efits
Dem
and
Th
reat
sC
ost
sA
lter
nat
ives
Fodd
er p
rovi
sion
[not
e 38
]B
ioph
ysic
al q
uant
ityTa
rget
bas
edSt
ocki
ng
rate
s[not
e 39
]C
onse
rvat
ion
of p
lann
ing
unit
and
oppo
rtun
ity c
osts
W
ater
rech
arge
Bio
phys
ical
qua
ntity
[not
e 40
]Ta
rget
bas
edC
onse
rvat
ion
of p
lann
ing
unit
and
oppo
rtun
ity c
osts
56 (s
ee a
lso
Guo
et
al
19)
Wat
er re
tent
ion[n
ote
41]
Bio
phys
ical
qua
ntity
15W
ater
pro
visi
onB
ioph
ysic
al q
uant
ity[n
ote
42]
Supp
ly re
lativ
e to
de
man
d[not
e 43
]Ve
geta
tion
cove
r and
lo
ss[n
ote
44]
Prox
y of
cos
ts p
er u
nit
area
[not
e 45
]C
apac
ity to
pay
fo
r alte
rnat
ives
[n
ote
46]
Floo
d m
itiga
tion
Bio
phys
ical
qua
ntity
[not
e 47
]C
aptu
red
in m
easu
res
of
flood
act
ivity
and
HPD
in
wat
ersh
ed
Ann
ual c
hang
e in
fore
st a
nd
woo
dlan
d co
ver[n
ote
48]
Prox
y of
cos
ts p
er u
nit a
rea
Fina
ncia
l ca
paci
ty to
pay
fo
r alte
rnat
ives
(le
vee
bank
s)C
arbo
n st
orag
eB
ioph
ysic
al q
uant
ityPr
oxy
of c
osts
per
uni
t are
a28
Car
bon
sequ
estra
tion
Bio
phys
ical
qua
ntity
Land
tra
nsfo
rmat
ion
[not
e 49
]
Econ
omic
val
ue o
f mar
keta
ble
prod
uce
(eg
tim
ber
rice
and
non-
timbe
r for
est p
rodu
ce)
Qua
litat
ive
rank
ing[n
ote
50]
Incl
usio
n of
st
akeh
olde
rs[n
ote
51]
Ren
ewal
of s
oil f
ertil
ityQ
ualit
ativ
e ra
nkin
g[not
e 52
]
34Su
stai
nabl
e bu
shm
eat
cons
umpt
ion
$ va
lue
Prob
abili
ty o
f co
nver
sion
fa
ctor
s in
thre
at
Opp
ortu
nity
cos
ts[n
ote
53]
Mar
ket p
rice
of
beef
[not
e 54
]
Sust
aina
ble
timbe
r har
vest
$ va
lue
Opp
ortu
nity
cos
tsB
io-p
rosp
ectin
g[not
e 55
]W
illin
gnes
s to
pay
Opp
ortu
nity
cos
tsEx
iste
nce
valu
eW
illin
gnes
s to
pay
Opp
ortu
nity
cos
tsC
arbo
n st
orag
e$
valu
eD
efor
esta
tion
[not
e 56
]O
ppor
tuni
ty c
osts
26C
arbo
n se
ques
tratio
nB
ioph
ysic
al q
uant
ity[n
ote
57]
Are
a co
nstra
int[n
ote
58]
Car
bon
stor
age
Bio
phys
ical
qua
ntity
A
rea
cons
train
tG
rass
land
pro
duct
ion
of
lives
tock
Bio
phys
ical
qua
ntity
[not
e 59
] Va
riatio
n in
hum
an
popu
latio
n de
nsity
[not
e 60
]A
rea
cons
train
t
Wat
er p
rovi
sion
Bio
phys
ical
qua
ntity
[not
e 61
]A
rea
cons
train
t30
[not
e 62
]W
ater
qua
lity
Bio
phys
ical
qua
ntity
Land
scap
e ch
ange
[not
e 63
]
Stor
m p
eak
miti
gatio
nB
ioph
ysic
al q
uant
ityLa
ndsc
ape
chan
geSo
il co
nser
vatio
n[not
e 64
]B
ioph
ysic
al q
uant
ityLa
ndsc
ape
chan
geC
arbo
n se
ques
tratio
n B
ioph
ysic
al q
uant
ity a
nd s
ocia
l va
lue
(in $
)La
ndsc
ape
chan
ge57
W
ater
sup
ply
Bio
phys
ical
qua
ntity
[not
e 65
]Id
entifi
ed b
enefi
ciar
ies
[not
e 66
]
Gra
zing
pro
visi
onB
ioph
ysic
al q
uant
ity[n
ote
67]
Tour
ism
Dis
tanc
e-ba
sed
aest
hetic
s [n
ote
68]
Page 5 of 16
F1000Research 2012 117 Last updated 31 OCT 2013
Page 5 of 16
F1000Research 2012 117 Last updated 09 SEP 2015
Cit
atio
nE
cosy
stem
ser
vice
sS
up
ply
Ben
efits
Dem
and
Th
reat
sC
ost
sA
lter
nat
ives
58So
il an
d w
ater
con
serv
atio
n [n
ote
69]
Land
slid
e fl
ood
and
drou
ght
prev
entio
n7[no
te 7
0]D
efor
esta
tion
pote
ntia
l[not
e 71
]
55Fo
rage
pro
duct
ion
for l
ives
tock
Bio
phys
ical
qua
ntity
[not
e 72
]La
nd-c
over
ch
ange
[not
e 73
]
Car
bon
stor
age
Bio
phys
ical
qua
ntity
Land
-cov
er
chan
geEr
osio
n co
ntro
lVu
lner
abili
ty to
ero
sion
[not
e 74
]La
nd-c
over
ch
ange
Fres
hwat
er fl
ow a
nd q
ualit
y re
gula
tion
Bio
phys
ical
qua
ntity
[not
e 75
] La
nd-c
over
ch
ange
Tour
ism
Dis
tanc
e-ba
sed
aest
hetic
s [n
ote
76]
Land
-cov
er
chan
ge31
[not
e 77
]H
ydro
logi
cal s
ervi
ces
Bio
phys
ical
qua
ntity
[not
e 78
]H
uman
pre
ssur
e in
dex
rela
ted
to
key
biod
iver
sity
ar
eas[n
ote
79]
59C
arbo
n st
orag
eB
ioph
ysic
al q
uant
ity[n
ote
80]
29Va
rious
[not
e 81
]$
valu
e[not
e 82
]La
nd
trans
form
atio
n [n
ote
83]
60Va
rious
[not
e 84
]$
valu
eVu
lner
abili
ty
of b
iodi
vers
ity
[not
e 85
]
41 (s
ee a
lso
Boh
ensk
y et
al
43)
Fres
hwat
er p
rovi
sion
Bio
phys
ical
qua
ntity
[not
e 86
]W
ater
use
and
acc
ess
[not
e 87
]
Food
pro
visi
onB
ioph
ysic
al q
uant
ity[n
ote
88]
Die
tary
inta
ke[n
ote
89]
Woo
d fu
elB
ioph
ysic
al q
uant
ity (l
ocal
pr
oduc
tion)
Loca
l har
vest
rate
61C
arbo
n st
orag
eB
ioph
ysic
al q
uant
ityD
efor
esta
tion
rate
s an
d co
ver
of p
rote
cted
ar
eas
Opp
ortu
nity
cos
ts
18C
arbo
n st
orag
eB
ioph
ysic
al q
uant
ityPr
obab
ility
of
defo
rest
atio
nO
ppor
tuni
ty c
osts
[not
e 90
]
Wat
er q
ualit
yPr
oxy[n
ote
91]
Estim
ated
dow
nstre
am
user
s[not
e 92
]Pr
obab
ility
of
defo
rest
atio
nTa
ble
1 N
ote
s
1
Hol
land
et a
l48 u
sed
four
indi
cato
rs o
f riv
er s
tatu
s ndash
envi
ronm
enta
l qua
lity
inde
x ta
xon
richn
ess
hab
itat q
ualit
y as
sess
men
t and
hab
itat m
odifi
catio
n in
dex
ndash to
repr
esen
t the
cap
acity
of r
iver
sys
tem
s an
d ca
tchm
ents
to p
rovi
de fr
eshw
ater
eco
syst
em s
ervi
ces
The
aut
hors
arg
ue th
at c
hang
es in
the
valu
e of
thes
e in
dice
s re
flect
cha
nges
in th
e ca
paci
ty o
f riv
er s
yste
ms
to p
rovi
de s
ervi
ces
such
as
mai
ntai
ning
wat
er q
ualit
y c
ontro
lling
sed
imen
tatio
n an
d er
osio
n m
itiga
ting
flood
s c
yclin
g nu
trien
ts a
nd fi
lterin
g po
lluta
nts
2
C
arbo
n st
ored
in s
oils
and
veg
etat
ion
The
aut
hors
con
duct
ed a
naly
ses
at d
iffer
ent g
rain
siz
es (4
km
2 and
100
km
2 ) a
nd d
iffer
ent s
patia
l ext
ents
(Brit
ain
Engl
and
and
100
x 10
0 km
squ
ares
acr
oss
Brit
ain)
and
exa
min
ed v
aria
tion
acro
ss re
gion
s w
ithin
Brit
ain
3
Ann
ual i
ncom
e4
Th
e gr
oss
mar
gin
is th
e va
lue
of o
utpu
ts m
inus
var
iabl
e co
sts
and
subs
idy
paym
ents
5
R
ecre
atio
nal u
se o
f the
cou
ntry
side
6
Th
e nu
mbe
r of d
ay le
isur
e vi
sits
as
a m
easu
re o
f the
recr
eatio
nal v
alue
of p
artic
ular
rura
l loc
atio
ns (t
his
mea
sure
cou
ld b
e in
terp
rete
d as
the
dem
and
for r
ecre
atio
nal s
ervi
ces)
7
A
mou
nt o
f car
bon
sequ
este
red
each
yea
r8
N
itrog
en a
nd p
hosp
horu
s re
mov
ed in
par
ticul
ar la
ndsc
apes
9
C
apac
ity o
f lan
d to
reta
in s
edim
ent
10
Com
bini
ng in
form
atio
n on
nes
t site
s fl
oral
reso
urce
s an
d be
e fli
ght r
ange
s to
est
imat
e po
llina
tor a
bund
ance
and
like
ly v
isita
tion
to a
gric
ultu
ral a
reas
Page 6 of 16
F1000Research 2012 117 Last updated 31 OCT 2013
Page 6 of 16
F1000Research 2012 117 Last updated 09 SEP 2015
11
The
auth
ors
set t
arge
ts to
add
ress
the
issu
e of
dem
and
(eg
ca
ptur
ing
50
of t
otal
car
bon
stor
ed in
an
ecor
egio
n)
12
Cos
ts a
re re
pres
ente
d by
the
suita
bilit
y of
are
as fo
r con
serv
atio
n ba
sed
on n
umer
ical
val
ues
that
refle
ct th
e de
gree
of i
mpe
dim
ents
to c
onse
rvat
ion
succ
ess
For
car
bon
stor
age
it is
a fl
at c
ost
the
area
of
the
plan
ning
uni
t13
A
vert
ed ri
sk o
f ext
rem
e flo
ods
14
The
fract
ion
of to
tal fl
ood
cont
rol v
alue
as
a fu
nctio
n of
the
num
ber o
f hou
sing
uni
ts in
the
flood
plai
n
15
Prod
uctio
n of
fora
ge fo
r gra
zing
rang
elan
d st
ock
16
Dol
lar v
alue
of f
orag
e pr
oduc
tion
17
The
targ
et w
as 7
5 o
f for
age
prod
uctio
n va
lue
18
The
sum
of w
eigh
ted
valu
es a
ssoc
iate
d w
ith d
evel
oped
land
agr
icul
ture
roa
d de
nsity
and
leng
th o
f hum
an-in
duce
d pa
tch
edge
s19
Pr
ovis
ion
of re
crea
tion
oppo
rtun
ities
20
Q
uant
ity o
f sui
tabl
e ha
bita
t in
addi
tion
to a
cces
sibi
lity
issu
es a
nd ri
ghts
to a
cces
s21
A
bas
elin
e ta
rget
(ass
umed
min
imum
requ
irem
ent)
of 1
2 da
ys o
f out
door
recr
eatio
n pe
r per
son
per y
ear
22
Cro
p po
llina
tion
by n
atur
al p
ollin
ator
s23
Th
e do
llar v
alue
of a
gric
ultu
ral c
rops
ben
efitti
ng fr
om p
ollin
atio
n
24
75
of f
eatu
re v
alue
acr
oss
the
ecor
egio
n25
Th
e su
pply
of f
resh
wat
er
26
40
of t
otal
fres
hwat
er u
se
27
The
auth
ors
purs
ued
two
appr
oach
es a
targ
et-b
ased
app
roac
h an
d in
corp
orat
ing
ecos
yste
m s
ervi
ces
as e
xtra
cos
ts o
r ben
efits
in th
e co
st la
yer
28
This
is a
spe
cies
-bas
ed a
ppro
ach
so th
e pr
iorit
ies
are
base
d on
spe
cies
and
thei
r dis
tribu
tion
acro
ss th
e la
ndsc
ape
29
For e
xam
ple
pos
itive
or n
egat
ive
econ
omic
val
ue
30
The
mag
nitu
de o
f thr
eats
affe
ctin
g ea
ch s
peci
es b
ased
on
maj
or la
nd u
ses
The
loss
of a
spe
cies
is e
quiv
alen
t to
the
loss
of t
he s
ervi
ce(s
) tha
t spe
cies
pro
vide
s31
M
edia
n an
nual
sim
ulat
ed ru
n-of
f32
G
roun
dwat
er c
ontri
butio
n to
sur
face
run-
off
33
Hot
spot
s m
appe
d as
are
as w
ith s
ever
e er
osio
n po
tent
ial a
nd v
eget
atio
n an
d lit
ter c
over
of a
t lea
st 7
0 w
here
mai
ntai
ning
the
cove
r is
esse
ntia
l to
prev
ent e
rosi
on
34
Soil
dept
h an
d le
af li
tter
35
The
auth
ors
asse
ssed
var
ious
sce
nario
s fo
r cap
turin
g ec
osys
tem
ser
vice
s ba
sed
on in
cide
ntal
pro
tect
ion
thro
ugh
the
cons
erva
tion
of b
iodi
vers
ity o
r the
incl
usio
n of
spa
tially
exp
licit
data
on
serv
ice
dist
ribut
ion
usin
g M
arxa
n In
Ego
h et
al40
the
aut
hors
set
diff
eren
t tar
get t
hres
hold
s fo
r cap
turin
g ce
rtai
n pe
rcen
tage
s of
ser
vice
pro
visi
on fo
r sur
face
wat
er s
uppl
y w
ater
flow
regu
latio
n c
arbo
n st
orag
e s
oil r
eten
tion
and
soil
accu
mul
atio
n
36
The
auth
ors
estim
ated
the
amou
nt o
f eac
h ec
osys
tem
ser
vice
pro
vide
d by
veg
etat
ion
type
s un
der i
ntac
t and
deg
rade
d co
nditi
ons
Mea
surin
g th
e di
ffere
nce
betw
een
the
two
is in
dica
tive
of th
e th
reat
of
degr
adat
ion
to s
ervi
ce p
rovi
sion
37
Th
e co
st o
f con
serv
ing
a pl
anni
ng u
nit w
as e
quiv
alen
t to
the
valu
e of
irrig
ated
cro
ppin
g or
gra
zing
The
opp
ortu
nity
cos
ts o
f con
serv
atio
n w
ere
addr
esse
d in
term
s of
lost
pro
duct
ion
The
aut
hors
in
clud
ed s
patia
l var
iabi
lity
in c
osts
bec
ause
val
ues
are
per p
lann
ing
unit
In E
goh
et a
l40 c
atch
men
t are
a is
use
d as
a c
ost l
ayer
(lar
ger a
reas
= g
reat
er c
ost)
38
B
y na
tura
l veg
etat
ion
39
Th
e au
thor
s ex
amin
ed th
e re
latio
nshi
p be
twee
n fo
dder
pro
visi
on a
nd s
tock
ing
rate
s to
det
erm
ine
the
stoc
king
rate
s th
at c
an b
e im
plem
ente
d w
ithou
t deg
radi
ng th
e en
viro
nmen
t (ie
su
stai
nabl
e st
ocki
ng ra
tes)
Hen
ce o
ver-s
tock
ing
is c
onsi
dere
d im
plic
itly
as a
thre
at to
veg
etat
ion
cond
ition
40
G
roun
dwat
er re
char
ge
41
For e
xam
ple
for fl
ood
miti
gatio
n T
he a
utho
rs a
lso
exam
ined
opp
ortu
nitie
s fo
r ser
vice
enh
ance
men
t 42
In
corp
orat
ing
the
dens
ity o
f peo
ple
who
rely
on
the
serv
ice
(ben
efici
arie
s) a
s de
nsity
per
wat
ersh
ed a
nd th
e w
ater
ndashpro
duct
ion
effic
ienc
y as
wat
er s
uppl
y di
vide
d by
are
a of
wat
ersh
ed
43
Wat
er s
uppl
y re
lativ
e to
dem
and
adju
sted
for t
he n
eed
to re
dist
ribut
e su
pply
with
in w
ater
shed
s W
ater
shed
s w
ere
supp
ly d
oes
not (
or o
nly
just
) mee
ts d
eman
d w
ere
prio
ritiz
ed
44
Am
ount
of v
eget
atio
n co
ver a
nd ra
te o
f veg
etat
ion
loss
with
mid
-ran
ge v
alue
s de
sign
ated
as
prio
ritie
s45
A
pro
xy w
as u
sed
repr
esen
ting
reso
urce
and
mai
nten
ance
cos
ts (e
g
land
acq
uisi
tion
infra
stru
ctur
e an
d la
bour
) and
con
side
ring
wat
ersh
ed-le
vel m
easu
res
of in
com
e p
opul
atio
n si
ze a
nd a
rea
46
Fina
ncia
l cap
acity
to p
ay fo
r alte
rnat
ives
to s
ervi
ce p
rovi
sion
suc
h as
dam
s an
d fil
tratio
n pl
ants
47
In
clud
es th
e tra
de-o
ff be
twee
n a
high
leve
l of fl
ood
activ
ity (n
umbe
r of fl
oods
dur
atio
n of
floo
ds a
nd a
rea
affe
cted
) and
a h
igh
leve
l of i
mpa
ct o
n hu
man
pop
ulat
ions
(dea
ths
and
disp
lace
men
t an
d hu
man
pop
ulat
ion
dens
ity in
wat
ersh
ed)
and
the
cost
s of
ser
vice
pro
tect
ion
48
A
s a
prop
ortio
n of
all
land
The
aut
hors
exa
min
e al
so th
e op
port
uniti
es fo
r ser
vice
enh
ance
men
t thr
ough
land
scap
e re
stor
atio
n
49
The
auth
ors
used
exp
ert o
pini
on to
est
imat
e po
ssib
le la
nd tr
ansf
orm
atio
n w
ithin
the
next
5 y
ears
Thi
s id
entifi
ed n
egat
ive
and
posi
tive
chan
ges
to s
ervi
ce p
rovi
sion
50
B
ased
on
stak
ehol
der p
refe
renc
e51
Th
e in
clus
ion
of s
take
hold
ers
in th
e ra
nkin
g pr
oces
s ad
dres
ses
to a
deg
ree
the
dem
and
for s
ervi
ces
and
or th
e va
lue
of s
ervi
ces
to b
enefi
ciar
ies
Thi
s is
an
expl
icit
inco
rpor
atio
n of
ben
efici
arie
s in
the
proc
ess
52
Bas
ed o
n la
nd m
anag
emen
t and
sta
keho
lder
per
cept
ion
53
The
auth
ors
com
pare
d th
e ec
osys
tem
-ser
vice
val
ues
to th
e co
st o
f con
serv
ing
the
natu
ral h
abita
t tha
t und
erlie
s th
eir p
rovi
sion
The
opp
ortu
nity
cos
t was
cal
cula
ted
as th
e ex
pect
ed a
gric
ultu
ral v
alue
of
each
fore
sted
par
cel o
f lan
d
54
To e
stim
ate
the
econ
omic
val
ue o
f bus
hmea
t the
aut
hors
use
d th
e lo
cal m
arke
t pric
e of
a k
ilo o
f bee
f sin
ce d
omes
tic m
eat i
s a
poss
ible
sub
stitu
te fo
r bus
hmea
t Th
is a
ppro
ach
impl
icitl
y re
cogn
ises
al
tern
ativ
es to
ser
vice
pro
visi
on
55
Valu
e fo
r new
pha
rmac
eutic
al p
rodu
cts
56
The
auth
ors
assu
med
imm
inen
t def
ores
tatio
n ou
tsid
e of
cor
e pr
otec
ted
area
s57
N
et a
nnua
l rat
e of
atm
osph
eric
car
bon
adde
d to
exi
stin
g bi
omas
s ca
rbon
poo
ls (m
easu
red
usin
g a
prox
y)
Page 7 of 16
F1000Research 2012 117 Last updated 31 OCT 2013
Page 7 of 16
F1000Research 2012 117 Last updated 09 SEP 2015
58
The
auth
orsrsquo
max
imiz
ed s
ervi
ce p
rovi
sion
for a
giv
en e
core
gion
are
a co
nstra
int u
sing
opt
imiz
atio
n m
etho
ds
Inco
rpor
atin
g th
e is
sue
of a
rea
cons
train
ts a
ddre
sses
cos
ts a
nd th
e m
axim
izat
ion
goal
get
s so
mew
hat a
t dem
and
59
Ann
ual p
rodu
ctio
n of
live
stoc
k fro
m g
razi
ng o
n un
impr
oved
nat
ural
pas
ture
s (e
xpre
ssed
as
tons
of m
eat)
60
B
enefi
ciar
ies
wer
e at
the
poin
t of p
rodu
ctio
n on
ly (w
here
eco
nom
ic b
enefi
ts a
re re
aliz
ed)
The
auth
ors
iden
tified
pro
duct
ion
peak
s of
wat
er p
rovi
sion
and
gra
ssla
nd p
rodu
ctio
n in
den
sely
pop
ulat
ed
biod
iver
sity
hot
spot
s in
dire
ctly
add
ress
ing
the
issu
e of
spa
tial v
aria
bilit
y in
dem
and
61
Wat
er a
vaila
bilit
y an
d w
ater
use
62
O
nly
the
key
poin
ts a
re c
aptu
red
here
see
the
publ
icat
ion
for f
ull d
etai
ls
63
Scen
ario
ana
lyse
s ex
plor
e im
plic
atio
ns o
f pos
sibl
e fu
ture
land
scap
e ch
ange
s64
Es
timat
ed th
roug
h so
il lo
ss R
egio
ns w
ith lo
wer
pot
entia
l soi
l los
s w
ere
a pr
iorit
y w
hich
impl
icitl
y re
cogn
ises
the
impo
rtan
ce o
f thr
eats
65
W
ater
-sup
ply
func
tion
and
flow
regu
latio
n (m
ean
annu
al c
atch
men
t run
off a
nd m
ean
annu
al g
roun
dwat
er re
char
ge)
66
Iden
tified
ben
efici
arie
s in
the
biom
e th
roug
h a
liter
atur
e re
view
and
exp
ert c
onsu
ltatio
n
67
Mea
n ca
rryi
ng c
apac
ity o
f the
land
inco
rpor
atin
g cl
imat
e s
oil t
ype
and
vege
tatio
n68
A
reas
that
tour
ists
can
see
with
in a
10
km b
uffe
r sur
roun
ding
the
maj
or to
uris
t driv
ing
rout
es (s
ee R
eyer
s et
al55
)69
La
ndsl
ide
floo
d an
d dr
ough
t pre
vent
ion
func
tions
70
La
ndsl
ide
prev
entio
n co
nsid
ered
in te
rms
of la
ndsl
ide
haza
rd t
he m
ore
haza
rdou
s an
are
a th
e m
ore
impo
rtan
t it i
s to
kee
p fo
rest
in p
lace
(an
alte
rnat
ive
perc
eptio
n of
lsquodem
andrsquo
) D
roug
ht a
nd fl
ood
prev
entio
n re
flect
s w
ater
rete
ntio
n ca
pabi
lity
of fo
rest
71
Es
timat
ed u
sing
the
prox
imity
to s
ettle
men
ts a
nd ro
ads
(mea
sure
s of
acc
ess
for d
efor
esta
tion)
and
dis
tribu
tion
of th
e nu
mbe
r of c
omm
erci
al s
peci
es o
f tre
es (a
mea
sure
of f
ores
t des
irabi
lity
for l
oggi
ng)
72
Car
ryin
g ca
paci
ties
for d
omes
tic s
tock
exp
ress
ed a
s th
e nu
mbe
r of h
ecta
res
requ
ired
per l
arge
sto
ck u
nit (
hect
ares
val
ues
wer
e de
term
ined
for p
ristin
e ex
ampl
es o
f hab
itat t
ypes
) 73
Th
e au
thor
s co
mpa
red
the
pote
ntia
l del
iver
y of
eco
syst
em s
ervi
ces
from
lsquopris
tinersquo
loca
tions
to th
at p
rovi
ded
by d
egra
ded
loca
tions
est
imat
ing
how
land
scap
e de
grad
atio
n m
ay d
imin
ish
the
capa
city
of
loca
tions
to p
rovi
de a
giv
en s
ervi
ce (a
n in
dire
ct a
sses
smen
t of t
hrea
t)
74
The
auth
ors
map
ped
area
s vu
lner
able
to e
rosi
on a
nd c
lass
ified
them
as
high
med
ium
and
low
ero
sion
haz
ard
Hab
itat t
ypes
pro
vide
ero
sion
con
trol w
here
ther
e is
a h
igh
thre
at o
f ero
sion
ow
ing
to
fact
ors
such
as
topo
grap
hy r
ainf
all a
nd s
oil (
indi
rect
ly a
ddre
ssin
g th
e is
sue
of th
reat
) 75
M
illio
ns o
f cub
ic m
eter
s of
gro
undw
ater
rech
arge
per
1-k
m2 g
rid c
ell
76
A re
late
d st
udy
by W
endl
and
et a
l18 in
clud
ed c
osts
thr
eats
and
dem
and
but
it is
unc
lear
if th
ese
are
incl
uded
in th
e m
easu
re o
f hyd
rolo
gica
l im
port
ance
use
d in
Rog
ers
et a
l31
77
Prov
isio
n of
drin
king
wat
er to
dow
nstre
am u
sers
and
irrig
atio
n fo
r ric
e pa
ddie
s78
Th
e au
thor
s ex
amin
ed th
e th
reat
s to
the
biol
ogic
al v
alue
of k
ey b
iodi
vers
ity a
reas
(KB
As)
bas
ed o
n a
lsquohum
an p
ress
ure
inde
xrsquo c
alcu
late
d fro
m m
easu
res
of h
uman
pop
ulat
ion
dens
ity r
oad
dens
ity fi
re
prev
alen
ce a
nd a
gric
ultu
ral s
uita
bilit
y T
hey
did
not d
irect
ly e
xam
ine
thre
ats
to e
cosy
stem
-ser
vice
pro
visi
on b
ut d
id th
is in
dire
ctly
by
look
ing
at th
reat
s to
the
prot
ectio
n of
KB
As
whi
ch w
ere
rank
ed
base
d on
thei
r hyd
rolo
gica
l ser
vice
val
ue
79
The
carb
on d
ensi
ty o
f liv
ing
biom
ass
80
Th
e nu
mbe
r (an
d ty
pe) o
f ser
vice
s is
a li
ttle
ambi
guou
s it
app
ears
to b
e be
twee
n 9
and
13 d
epen
ding
on
the
anal
ysis
The
aut
hors
als
o co
nduc
ted
anal
yses
at t
hree
diff
eren
t spa
tial s
cale
s81
Ec
osys
tem
ser
vice
val
ues
wer
e ex
pres
sed
in d
olla
r val
ues
of la
nd u
nits
bas
ed o
n la
nd c
over
and
the
serv
ices
pro
vide
d by
par
ticul
ar la
nd c
over
s82
Th
e au
thor
s de
al w
ith th
reat
(s) t
o se
rvic
e pr
ovis
ion
indi
rect
ly b
y m
odel
ling
the
chan
ge in
eco
syst
em s
ervi
ce v
alue
with
two
alte
rnat
ive
deve
lopm
ent s
cena
rios
83
Th
e au
thor
s ca
lcul
ated
the
ecos
yste
m-s
ervi
ce v
alue
s ($
val
ue) f
or 1
7 di
ffere
nt s
ervi
ces
and
reco
gnis
ed v
aria
tion
in th
e sp
atia
l dep
ende
ncie
s of
ser
vice
s
84
The
auth
ors
asse
ssed
the
vuln
erab
ility
of b
iodi
vers
ity (lsquo
thre
atrsquo)
and
then
det
erm
ined
the
ecos
yste
m-s
ervi
ce v
alue
cap
ture
d in
bio
dive
rsity
tem
plat
es w
here
low
vul
nera
bilit
y is
a p
riorit
y an
d hi
gh
vuln
erab
ility
is a
prio
rity
85
Th
e au
thor
s ca
lcul
ated
wat
er a
vaila
bilit
y (to
tal a
nd p
er p
erso
n) a
nd m
appe
d su
pply
and
dem
and
ratio
s86
W
ater
ava
ilabi
lity
per p
erso
n w
as re
fere
nced
aga
inst
an
acce
pted
min
imum
targ
et (1
000
m3 )
set
by
the
Uni
ted
Nat
ions
(hen
ce t
his
targ
et re
pres
ents
lsquodem
andrsquo
) Th
e au
thor
s al
so c
alcu
late
d th
e pe
rcen
tage
of t
he p
opul
atio
n w
ith a
cces
s to
impr
oved
wat
er a
nd im
prov
ed s
anita
tion
and
und
er fi
ve m
orta
lity
per 1
000
birt
hs
87
The
perc
enta
ge c
ontri
butio
n of
car
bohy
drat
e an
d pr
otei
n-su
pply
ing
crop
s to
tota
l die
tary
inta
ke
88
Serv
ice
prov
isio
n is
com
pare
d to
reco
mm
ende
d m
inim
um d
aily
inta
ke (2
100
kcal
per
per
son)
and
min
imum
dai
ly in
take
of p
rote
in
89
Lost
agr
icul
tura
l pro
duct
ion
90
Opp
ortu
nity
cos
ts fo
r agr
icul
ture
and
sto
ck
91
The
auth
ors
did
not c
alcu
late
wat
er q
uant
ity b
ut u
sed
a pr
oxy
for t
he s
uppl
y of
sed
imen
t-fre
e w
ater
bas
ed o
n po
pula
tion
data
lan
d co
ver a
nd w
ater
flow
dire
ctio
n92
Th
e au
thor
s m
easu
red
dow
nstre
am u
sers
thro
ugh
the
dow
nstre
am p
opul
atio
nsrsquo n
eed
for q
ualit
y dr
inki
ng w
ater
dow
nstre
am a
rea
of ir
rigat
ed ri
ce fi
elds
and
dow
nstre
am a
rea
of m
angr
oves
Page 8 of 16
F1000Research 2012 117 Last updated 31 OCT 2013
Page 8 of 16
F1000Research 2012 117 Last updated 09 SEP 2015
soil retention24) or through quantifying the supply of services often in biophysical units The latter is the most common approach in broad-scale prioritization studies (Table 1) Biophysical quan-tities can include for example the amount of carbon stored in particular ecosystem types water availability or supply or fodder production However it is crucial to address also the issue of the level of biophysical quantity demanded by service beneficiaries We refer to the level of human need for a service as lsquodemandrsquo but recognise that this level changes with context and differs from the economic perspective of demand as the amount of a good or service that can be purchased at a given price
Simply increasing the quantity of a given service maymay not be appropriate depending on human need It could also divert funds from more necessary actions because if the quantities of certain ES are adequate and not under threat investment in the protection of these services could be a lower priority compared to services currently unable to meet human needs (see lsquoTarget setting and the capacity to meet demandrsquo) Luck et al15 explicitly addressed this issue by prioritizing locations for managing ES based on the hu-man need for the services of water provision and flood mitigation This directly links the quantity of service provided with the needs of beneficiaries and better identifies where needs are not being met
The benefits of managing for ES vary across space and time re-flecting for example variation in human need and the capacity to pay for human-derived alternatives This spatio-temporal vari-ation is decidedly complex influenced by factors such as the type of service being considered market fluctuations and the changing needs of beneficiaries This dynamism magnifies the complexity of ES prioritization beyond that of biodiversity prioritization For example Wilson et al11 note that the benefit-protection function in conservation planning is asymptotic in that benefit accumulation is less and less with the protection of more land While the same is true for some ES25 the shape of the curve will vary over time and space with beneficiary demand driven by among other things markets and changing needs Moreover owing to global markets it can be extremely difficult to identify who benefits from a given service It is less problematic to focus on the immediate beneficiar-ies of service provision (eg growers benefiting from crop polli-nation) rather than also considering those individuals that benefit from the products of services (eg consumers of crop commodi-ties26) In some cases it may be sufficient to recognise simply that the benefits from the provision of a particular service are globally widespread and diffuse (eg carbon storage)
Threats to service provisionConservation planners may quantify threatening processes that in-crease the risk of biodiversity loss27 and a similar focus on threats to ES provision is an appropriate way to incorporate threats into ser-vice prioritization It is also important to recognise the fundamental difference between the vulnerability of an ES to threat(s) and the level of threat a particular service is under Some services may be particularly vulnerable to threats (eg crop pollination reliant on a single pollinator species) but not currently threatened whereas other services may be resilient to a range of threats but at risk of decline owing to the magnitude of threat(s)
Despite its importance few ES prioritization schemes to date have explicitly incorporated threats (Table 1) Egoh et al3 document-ed biophysical quantities of ES provided by intact and degraded vegetation which implicitly addresses threat to service provision through landscape degradation Others examined changes in quan-tities or dollar values of services through modelling alternative future land-use scenarios recognising that some scenarios (eg extensive development) represent a greater threat to service pro-vision than others28ndash30 A more explicit approach to incorporating threats is to document the likelihood of decline or loss of service-providing ecosystems through for example human development or habitat loss1831
Addressing threats to ES is most important when service provision is not substitutable across space (ie site dependency is high be-cause the service must be provided in a specific location eg storm protection) there are no human-derived alternatives to service pro-vision or these alternatives are expensive relative to the capacity of local communities to pay for the alternatives or ecosystem changes are irreversible (eg species extinction)
Costs of actions to manage servicesConservation planners list a variety of costs that should be con-sidered when assessing options for protecting biodiversity32 These range from acquisition costs (eg purchasing land for conserva-tion) and management costs (eg maintaining conservation areas) through to social costs (eg the number of people displaced from conservation areas1133) Costs will vary across space and must be linked to actions to improve planning relevance9 For example if the action required is land acquisition then a relevant cost is land price if the action is management of a conservation area then a relevant cost would be the salaries of conservation managers
The management of ES attracts similar costs dependent on the type of action required to protect the service Indeed some ES prioritiza-tion schemes incorporate opportunity costs in a similar way to bio-diversity prioritization recognising that managing ecosystems for service provision can yield the same opportunity costs as protecting ecosystems for biodiversity (eg when an area cannot be used for production31834 Table 1) Costs may also be incorporated through the use of proxies for resource and maintenance expenses (see lsquoAn example of spatial prioritizationrsquo)
It is important to identify the assignation of costs (who pays) and benefits in both biodiversity conservation and ES prioritization35 For example designation of a conservation area yields benefits that are primarily public notwithstanding for example income gener-ated from nature tourism but sometimes at a cost to private interests (eg opportunity cost of lost revenue from production) Managing an area for the delivery of ES can yield relatively greater private benefits particularly for service beneficiaries with costs borne by both public and other private interests For example a forest des-ignated for timber harvest will yield financial benefits to logging companies at a cost to the public (eg through lost carbon storage) and other private interests (eg those interested in using the forest for ecotourism) Ensuring greater equity in the distribution of ben-efits and costs from services provided by public or private assets
Page 9 of 16
F1000Research 2012 117 Last updated 31 OCT 2013
Page 9 of 16
F1000Research 2012 117 Last updated 09 SEP 2015
may be achieved through various mechanisms such as government regulation self-regulation (enforced by societal norms) or market approaches like cap and trade or payments for ES3637 Yet the ap-propriateness of a particular mechanism depends on the character-istics of the service being targeted (eg who generates the service management jurisdiction and providerndashbeneficiary spatio-temporal dynamics see Kinzig et al37)
Availability of alternatives to service provisionThe availability of human-derived alternatives to the provision of ES is a vital consideration in service prioritization These alter-natives can include for example a water filtration plant to cover the filtration services of wetlands or pesticides to cover biological control The availability of alternatives and the capacity of relevant human communities to pay for these alternatives can influence the treatment of other factors such as benefits threats actions and costs For example managing a particular service may be given lower priority if human-derived alternatives are readily available and affordable although the associated costs of these alternatives must be considered also (eg the health costs of increasing pesti-cide use) Only a few studies that attempt ES prioritization address the issue of availability of alternatives (Table 1) As part of the pri-oritization process the availability and cost of alternatives should be considered simultaneously with the list of potential actions for service protection or enhancing service provision
Target setting and the capacity to meet demandSetting targets is common in conservation planning and can be a requirement for assessing the capacity of selection procedures to meet conservation objectives38 In most cases setting a target is equivalent to meeting a baseline threshold Target setting in ES pri-oritization is rare and has to the best of our knowledge only oc-curred in four published studies343940 (Table 1) For example Chan et al39 set a baseline target (assumed minimum requirement) of 12 days of outdoor recreation per person per year and determined the space required to provide that level of service from data on park visitation Chan et al39 also stipulated that targets had to be met in different stratification zones within the study area which accounted somewhat for the site dependency of service production and vari-ability in the spatial distribution of beneficiary needs
While target setting is one approach to assessing the capacity of eco-systems to meet the demands of beneficiaries provisionndashdemand re-lations have been variously dealt with in the literature (Table 1) For example some studies included data on water use when calculating water provision capacity [eg1526] while others measured down-stream need for water of a given quality through the calculation of population densities and areas of irrigated rice and mangroves18 Van Jaarsveld et al41 calculated water and food provision relative to accepted minimum standards for human consumption The need and approach to calculating demand for service provision will vary depending on the service of interest For example it is generally considered unnecessary to calculate spatially explicit demand for carbon storage because this service benefits the global community and demand is not spatially variable
Site dependency and scaleSite dependency in the provision of an ES reflects the level of need for a particular service to be provided in a particular location in
order to deliver benefits to a given set of beneficiaries This can be interpreted also in the context of the scale of service provision (eg local to global) For example storm protection from mangroves has high site dependency in provision ndash mangrove forests must occur in locations where local communities are threatened by storm activity This should not be confused with the substitutability of the service that is whether human-derived alternatives (eg sea walls) or other coastal vegetation types can provide a similar service In contrast global climate regulation through ecosystems storing carbon has lower site dependency in provision because it does not have to occur at a particular location (ie there are various options for managing ecosystems to store carbon) However there is still some level of site preference because certain ecosystems (eg rainforests) store more carbon than others Site dependency and scale varies also in the use of the service For example the beneficiaries of biological control in agro-ecosystems generally occur at the local to regional scale if the emphasis is on growers whereas the beneficiaries of climate regulation occur at the global scale
Variation in the site dependency and scale of the provision and use of ES has major implications for the valuation of services which must consider spatially explicit and scale-dependent relationships in productionndashconsumption flows42 Such relationships also have im-portant implications for prioritization strategies High site depend-ency could result in certain locations that generate that service being classified as irreplaceable For example Bohensky et al43 identified irreplaceable land units for food and water provision to meet pre-determined targets of caloric intake for a given population When services have lower levels of site dependency in production there is greater flexibility in site selection during the prioritization process (all else being equal)
An example of spatial prioritizationThe relationships among the various components of our conceptual framework for spatial prioritization of ES are presented in Figure 1 We illustrate our approach in this section using a worked example based on data published in Luck et al15 focussing for the sake of simplicity on a single ES water provision
The global analysis of Luck et al15 identified watersheds that are a priority for protecting particular ES The first step in the analysis was to quantify the benefits and supply of the service The benefits of protecting the supply of potable water was measured through hu-man population density in each watershed that is there were greater benefits to protecting supply in watersheds with higher population density compared to those with lower density Water supply was measured using a global hydrological model and lsquowater-production efficiencyrsquo was calculated for each watershed by dividing supply in each watershed with watershed area
The costs of actions to manage water provision were represented using a proxy for resource (eg land acquisition and infrastructure) and maintenance (eg labour) costs This proxy incorporated data on total income in the watershed (per capita gross national income) population size and watershed area Resource costs were assumed to scale positively with per-capita wealth and population density (assuming that land and infrastructure prices are generally higher where population density is higher) while maintenance costs were assumed to also scale positively with per-capita wealth Finally the
Page 10 of 16
F1000Research 2012 117 Last updated 31 OCT 2013
Page 10 of 16
F1000Research 2012 117 Last updated 09 SEP 2015
and change in vegetation cover can be considered a proxy for threat to water provision To quantify this threat the following data were used the proportion of each watershed covered in tree shrub and herbaceous vegetation the annual rate of change in vegetation cover (over a proceeding 5-year period) the time span over which change in cover would be predicted (eg 20 years) and the proportion of the watershed that was protected (assuming vegetation in protected areas could not be cleared) Watersheds with mid-range values of vegetation cover rates of vegetation loss andor area protected were considered priorities for water provision management because for example watersheds with low cover and high rates of loss would require large investments in ES management relative to return whereas watersheds with high cover and low rates of loss are under less threat to the disruption of the service
The final consideration in spatial prioritization is the availability of alternatives to the provision of the service via ecosystems Im-provements in the supply of potable water may be made through the construction of dams and building of filtration plants for example rather than ecosystem management The availability of these alter-natives is often a function of the capacity of local communities to
cost-effectiveness of protecting the service in each watershed was calculated by dividing human population density and water supply (benefits) by the cost
The capacity to meet demand was measured using values for water supply and water withdrawals in each watershed It also considered regional water deficits (withdrawals gt supply) and the proportion of total supply that remained once demands were met adjusting the watershed-level capacity measure downwards proportional to the need to move water to regions (within a watershed) where supply did not meet demand It was assumed that managing the service of water provision was most important in watersheds where supply barely meets or is short of demand and less important when supply greatly exceeded demand
To estimate threat to water provision expected vegetation cover in each watershed was used recognising the link between vegetation and water provision filtration and the maintenance of water qual-ity (although this link is decidedly complex see Luck et al15 for details) Vegetation cover and type in a watershed may be indicative of the capacity of the watershed to provide potable water naturally
Figure 1 Key aspects for consideration in ecosystem-service prioritization
Pre-prioritization
Prioritization process
Post-prioritization Reduce conicts and assess trade-os among priorities through multi-objective planning frameworks
Determine services toprioritize throughstakeholder consultation
Determine availability ofspatially explicit data
Assess data quality foreach component ofprioritization
bull Identify beneciaries (immediate and non- immediate)bull Determine social needbull Assess capacity of ecosystem to meet demand
bull Dene metric to measure supplybull Calculate dierence made by actionbull Assess site dependency of supplybull Identify alternatives
bull Identify threats to supply Assess impact of threat on service deliverybull Assess if impacts of threats are irreversible
bull Estimate cost of action needed to abate threat Identify who pays costbull Determine budget
Demand Supply
Costs Threats
Page 11 of 16
F1000Research 2012 117 Last updated 31 OCT 2013
Page 11 of 16
F1000Research 2012 117 Last updated 09 SEP 2015
ES management The selection of different services will influence the approach to spatial prioritization because ES management will have different objectives (eg improving timber harvest or main-taining water supply) However the major steps we outline here will be relevant in most cases
Application of our approach requires spatially explicit data on where services are produced benefits costs and threats Data on spatially explicit production is usually obtained through mapping the loca-tion of ecosystems that provide services (eg grasslands that sup-port livestock) Mostly this involves maps of vegetation types or water sources (Table 1) Benefits are represented spatially generally via the biophysical quantity of a given service produced by a given location (eg carbon stored) andor its financial value To represent costs spatially researchers have used simply the area of the planning unit (eg39 for some services) or current land values [eg34] Docu-menting costs is problematic because of spatio-temporal variation in financial values which is possibly why some researchers have resorted to more simple rules-of-thumb (eg assuming that manag-ing larger areas yields greater costs) Also problematic is spatially explicit measures of threat which have been represented by for ex-ample maps of land-use or historical or potential land-cover change and how these relate spatially to the location of service provision [eg3047] (Table 1)
Finally the type of data used in prioritization will greatly affect out-comes For example Anderson et al2 demonstrated that variation in the resolution (asymp grain size) andor spatial extent of a prioritization analysis influenced the level of congruence between biodiversity and ES priorities Moreover data quality may be poor for certain services and certain components of prioritization For example crude proxies or indicators may be required for services for which it is difficult to obtain accurate spatially explicit measures of sup-ply and demand (eg flood mitigation see Holland et al48) Our framework which promotes the use also of data on threats costs alternatives and site dependency may help to alleviate this issue because prioritization could be based just on those components for which data quality is acceptable
The most appropriate metric to represent the supply of the service will be context dependent but the use of biophysical quantities will be suitable in most cases For example if the service is storm protec-tion then a suitable metric may be the area of mangroves that needs to be maintained to deliver a given level of protection [eg25] ES supply should be assessed relative to the demand for the service which can be measured using a target-based approach through cur-rent or projected use of the service or its products through dem-onstrated need for the service (eg historical impacts of storms) or through meeting an accepted minimum standard (eg acceptable losses due to storm damage) Quantifying demand for a service re-quires the implicit or preferably explicit identification of beneficiar-ies which may be immediate beneficiaries (eg residents of coastal villages threatened by storms) andor lsquonon-immediatersquo beneficiaries (eg consumers of goods produced by the villages)
The application of prioritization frameworks generally involves multiple services across many planning units and priorities for different services are not necessarily congruent2 This requires an analysis of trade-offs between services in managing landsea-space
pay for them in addition to other constraints (eg topographic suit-ability for dam construction) Therefore Luck et al15 used the gross national income per capita of countries spanning each watershed as an indicator of the capacity of communities reliant on the watershed to pay for alternatives to natural water provision
The above components were combined into a single index repre-senting the relative importance of each watershed for protecting water supply This example and our prioritization framework gen-erally is appropriate when planning units are large and there are a variety of available options for managing services and it is difficult to express the components of prioritization precisely Our frame-work treats the supply of services threats and costs in ES prioritiza-tion inclusive of beneficiary demand capacity to meet demand and availability of alternatives to ES provision
DiscussionOur review of current approaches to identifying spatial priorities for managing ES found that the important components of prioritization (benefits costs threats availability of alternative and capacity to meet demand) were treated in substantially different ways or some-times omitted completely (although not all components are appli-cable in every context) Moreover few studies explicitly addressed the issue of site dependency and scale in the provision of services andor location of beneficiaries Accordingly there is substan-tial scope for improving ES analyses aimed at identifying spatial priorities for managing services
If ES benefits were commodities in perfect markets the price of such benefits would reflect all of the spatial prioritization components identified above Yet many ES benefits are not commodities and for those that are the associated markets are far from perfect suffering from numerous market failures including monopsony (single buy-ers as in reverse auctions) oligopoly (few sellers as in many pay-ments-for-ES schemes) externalities and information asymmetries This means that market prices will not generally reflect all of the components of prioritization appropriately Stated-preference non-market valuation approaches can be informative in certain settings where markets do not apply but they are generally of limited utility reflecting the various dimensions of valuesocial priority4445 Ac-cordingly even where economic valuation data are available it will still be appropriate for ES prioritization exercises to separately inte-grate some of the components we identify
Although we have focussed on the mechanics of prioritization the following issues must be addressed prior to such analyses 1) iden-tification of the ES to be included 2) capacity to access spatially explicit data and 3) data quality (Figure 1) Identifying important ES should occur through in-depth consultation among scientists policy-makers managers and stakeholders (especially service ben-eficiaries see Fisher et al46) For example if prioritization was required across a particular country federal management agencies and relevant stakeholders may engage in a process of identifying those services most important to the well-being of the country lsquoImportancersquo may be a factor of the total financial value of a ser-vice (eg agricultural production) andor the societal need for a service (eg provision of potable water) and assessed through ap-propriate valuation approaches Hence a priority list of which ser-vices to focus on is required prior to deciding on where to invest in
Page 12 of 16
F1000Research 2012 117 Last updated 31 OCT 2013
Page 12 of 16
F1000Research 2012 117 Last updated 09 SEP 2015
China Costa Rica and Mexico pay landholders that engage in man-agement that protects the supply of hydrological services50ndash52 Vital to this process is identifying locations that offer the greatest return on investment This requires a systematic and thorough approach to identifying spatial priorities for protecting ES
Author contributionsGL and KC conceived the study GL summarised the information in Table 1 and prepared the first draft of the manuscript All authors revised subsequent drafts of the manuscript and have agreed to the final content
Competing interestsWe declare no competing interests
Grant informationThe contribution of GL and CK was supported by the Australian Re-search Councilrsquos Future Fellowship (project number FT0990436G) and Postdoctoral Fellowship (project number DP110102153) pro-grams respectively The contribution of KC was supported by the Canada Research Chairs program and the Canadian Foundation for InnovationBritish Columbia Knowledge Development Fund (Leaders Opportunity Fund)
The funders had no role in study design data collection and analy-sis decision to publish or preparation of the manuscript
for service provision5 Moilanen et al49 addressed this issue using a multi-objective prioritization approach for biodiversity and ES based on the conservation planning software Zonation The au-thors argued that regional variation in land-use priorities meant that spatial separation of land uses may reduce management conflicts Moreover areas that are a priority for multiple ES could be used in trade-offs assuming the areas were not critical priorities for every service
In multi-objective prioritization frameworks that consider spatial separation of ES management or trade-offs in land-use priorities it is vital to address site-dependency and scale of service provision and location of beneficiaries As we argue above there is little flex-ibility in managing for the provision of services that are delivered locally to in situ beneficiaries (eg flood mitigation) Avoiding in-appropriate management decisions and trade-offs rests entirely on taking a comprehensive approach to identifying priorities Here we describe the major factors that must be considered in ES prioritiza-tion and argue that addressing as many of these factors as possible will improve the outcomes of multi-objective prioritization frame-works that aim to promote human well-being through the protection of services
Developing comprehensive methods for identifying ES priorities is much more than just an academic exercise Governments and NGOs across the world are increasingly including the protection of ES into their policy directives For example the governments of
References
1 MA (Millennium Ecosystem Assessment) Ecosystems and human well-being synthesis Island Press Washington DC 2005 Reference Source
2 Anderson BJ Armsworth PR Eigenbrod F et al Spatial covariance between biodiversity and other ecosystem service priorities J Appl Ecol 2009 46(4) 888ndash896 Publisher Full Text
3 Egoh BN Reyers B Carwardine J et al Safeguarding biodiversity and ecosystem services in the Little Karoo South Africa Conserv Biol 2010 24(4) 1021ndash1030 PubMed Abstract | Publisher Full Text
4 Chan KMA Hoshizaki L Klinkenberg B et al Ecosystem services in conservation planning targeted benefits or co-benefitscosts PLoS One 2011 6(9) e24378 PubMed Abstract | Publisher Full Text | Free Full Text
5 White C Halpern BS Kappel CV et al Ecosystem service tradeoff analysis reveals the value of marine spatial planning for multiple ocean uses Proc Natl Acad Sci U S A 2012 109(12) 4696ndash701 PubMed Abstract | Publisher Full Text | Free Full Text
6 Menzel S Teng J Ecosystem services as a stakeholder-driven concept for conservation science Conserv Biol 2010 24(3) 907ndash909 PubMed Abstract | Publisher Full Text
7 Kareiva P Tallis H Ricketts TH et al Natural capital theory and practice of mapping ecosystem services Oxford University Press Oxford 2011 365 Reference Source
8 Brooks TM Mittermeier RA da Fonseca GAB et al Global biodiversity conservation priorities Science 2006 313(5783) 58ndash61 PubMed Abstract | Publisher Full Text
9 Carwardine J Wilson KA Watts M et al Avoiding costly conservation mistakes the importance of defining actions and costs in spatial priority setting PLoS One 2008 3(7) e2586 PubMed Abstract | Publisher Full Text | Free Full Text
10 Pressey RL Bottrill MC Approaches to landscape- and seascape-scale conservation planning convergence contrasts and challenges Oryx 2009 43(4) 464ndash475 Publisher Full Text
11 Wilson KA Carwardine J Possingham HP et al Setting conservation priorities Ann N Y Acad Sci 2009 1162 237ndash264 PubMed Abstract | Publisher Full Text
12 Mills M Pressey RL Weeks R et al A mismatch of scales challenges in planning for implementation of marine protected areas in the Coral Triangle Conservation Letters 2010 3(5) 291ndash303 Publisher Full Text
13 Margules CR Pressey RL Systematic conservation planning Nature 2000 405 243ndash253 Publisher Full Text
14 Egoh B Rouget M Reyers B et al Integrating ecosystem services into conservation assessments a review Ecol Econ 2007 63(4) 714ndash721 Publisher Full Text
15 Luck GW Chan KMA Fay JP et al Protecting ecosystem services and biodiversity in the worldrsquos watersheds Conservation Letters 2009 2(4) 179ndash188 Publisher Full Text
16 Cowling RM Egoh B Knight AT et al An operational model for mainstreaming ecosystem services for implementation Proc Natl Acad Sci U S A 2008 105(28) 9483ndash9488 PubMed Abstract | Publisher Full Text | Free Full Text
17 Chen X Lupi F Vintildea A et al Using cost-effective targeting to enhance the efficiency of conservation investments in payments for ecosystem services Conserv Biol 2010 24(6) 1469ndash1478 PubMed Abstract | Publisher Full Text
18 Wendland KJ Honzaacutek M Portela R et al Targeting and implementing payments for ecosystem services opportunities for bundling biodiversity conservation with carbon and water services in Madagascar Ecol Econ 2010 69(11) 2093ndash2107 Publisher Full Text
Page 13 of 16
F1000Research 2012 117 Last updated 31 OCT 2013
Page 13 of 16
F1000Research 2012 117 Last updated 09 SEP 2015
Sci 2005 360(1454) 425ndash441 PubMed Abstract | Publisher Full Text | Free Full Text
42 Balmford A Fisher B Green RE et al Bringing ecosystem services into the real world an operational framework for assessing the economic consequences of losing wild nature Environmental and Resource Economics 2011 48(2) 161ndash175 Publisher Full Text
43 Bohensky E Reyers B van Jaarsveld A et al Ecosystem services in the Gariep basin a component of the Southern African Millennium Ecosystem Assessment (SAfMA) Stellenbosch University Stellenbosch South Africa 2004 Reference Source
44 Gregory R Lichtenstein S Slovic P et al Valuing environmental resources a constructive approach J Risk Uncertain 1993 7(2) 177ndash197 Publisher Full Text
45 Sagoff M Aggregation and deliberation in valuing environmental public goods a look beyond contingent pricing Ecol Econ 1998 24(2ndash3) 213ndash230 Publisher Full Text
46 Fisher B Turner RK Burgess ND et al Measuring modeling and mapping ecosystem services in the Eastern Arc Mountains of Tanzania Progress is Physical Geography 2011 35(5) 595ndash611 Publisher Full Text
47 Coppolillo P Gomez H Maisels F et al Selection criteria for suites of landscape species as a basis for site-based conservation Biol Conserv 2004 115(3) 419ndash430 Publisher Full Text
48 Holland RA Eigenbrod F Armsworth PR et al Spatial covariation between freshwater and terrestrial ecosystem services Ecol Appl 2011 21(6) 2034ndash2048 PubMed Abstract | Publisher Full Text
49 Moilanen A Anderson BJ Eigenbrod F et al Balancing alternative land uses in conservation prioritization Ecol Appl 2011 21(xx) 1419ndash1426 PubMed Abstract | Publisher Full Text
50 Sanchez-Azofeifa GA Pfaff A Robalino JA et al Costa Ricarsquos payment for environmental services program intention implementation and impact Conserv Biol 2007 21(5) 1165ndash1173 PubMed Abstract | Publisher Full Text
51 Liu JG Li SX Ouyang ZY et al Ecological and socioeconomic effects of Chinarsquos policies for ecosystem services Proc Natl Acad Sci U S A 2008 105(28) 9477ndash9482 PubMed Abstract | Publisher Full Text | Free Full Text
52 Muntildeoz-Pintildea C Guevara A Torres JM et al Paying for the hydrological services of Mexicorsquos forests analysis negotiations and results Ecol Econ 2008 65(4) 725ndash736 Publisher Full Text
53 Bai Y Zhuang C Ouyang Z et al Spatial characteristics between biodiversity and ecosystem services in a human-dominated watershed Ecological Complexity 2011 8(2) 177ndash183 Publisher Full Text
54 Egoh B Reyers B Rouget M et al Spatial congruence between biodiversity and ecosystem services in South Africa Biol Conserv 2009 142(3) 553ndash562 Publisher Full Text
55 Reyers B OrsquoFarrell PJ Cowling RM et al Ecosystem services land-cover change and stakeholders finding a sustainable foothold for a semiarid biodiversity hotspot Ecology and Society 2009 14(1) 38 Reference Source
56 Guo Z Gan Y Ecosystem function for water retention and forest ecosystem conservation in a watershed of the Yangtze River Biodivers Conserv 2002 11(4) 599ndash614 Publisher Full Text
57 OrsquoFarrell PJ Reyers B Le Maitre DC et al Multi-functional landscapes in semi arid environments implications for biodiversity and ecosystem services Landscape Ecology 2010 25(8) 1231ndash1246 Publisher Full Text
58 Phua MH Minowa M A GIS-based multi-criteria decision making approach to forest conservation planning at a landscape scale a case study in the Kinabalu Area Sabah Malaysia Landsc Urban Plan 2005 71(2ndash4) 207ndash222 Publisher Full Text
59 Strassburg BBN Kelly A Balmford A et al Global congruence of carbon storage and biodiversity in terrestrial ecosystems Conservation Letters 2010 3(2) 98ndash105 Publisher Full Text
60 Turner WR Brandon K Brooks TM et al Global conservation of biodiversity and ecosystem services BioScience 2007 57(10) 868ndash873 Publisher Full Text
61 Venter O Laurance WF Iwamura WF et al Harnessing carbon payments to protect biodiversity Science 2009 326(5958) 1368 PubMed Abstract | Publisher Full Text
19 Guo ZW Xiao XM Li DM et al An assessment of ecosystem services water flow regulation and hydroelectric power production Ecol Appl 2000 10(3) 925ndash936 Publisher Full Text
20 Ricketts TH Tropical forest fragments enhance pollinator activity in nearby coffee crops Conserv Biol 2004 18(5) 1262ndash1271 Publisher Full Text
21 Bockstael NE Freeman AM Kopp RJ et al On measuring economic values for nature Environ Sci Technol 2000 34(8) 1384ndash1389 Publisher Full Text
22 Aldred J Incommensurability and monetary valuation Land Economics 2006 82(2) 141ndash161 Publisher Full Text
23 Turner RK Fisher B Environmental economics to the rich man the spoils Nature 2008 451(7182) 1067ndash1068 PubMed Abstract | Publisher Full Text
24 Egoh B Reyers B Rouget M et al Mapping ecosystem services for planning and management Agric Ecosyst Environ 2008 127(1ndash2) 135ndash140 Publisher Full Text
25 Barbier EB Koch EW Silliman BR et al Coastal ecosystem-based management with nonlinear ecological functions and values Science 2008 319(5861) 321ndash323 PubMed Abstract | Publisher Full Text
26 Naidoo R Balmford A Costanza R et al Global mapping of ecosystem services and conservation priorities Proc Natl Acad Sci U S A 2008 105(28) 9495ndash9500 PubMed Abstract | Publisher Full Text | Free Full Text
27 Klein CJ Ban NC Halpern BS et al Prioritizing land and sea conservation investments to protect coral reefs PLoS One 2010 5(8) e12431 PubMed Abstract | Publisher Full Text | Free Full Text
28 Nagendra H Incorporating landscape transformation into local conservation prioritization a case study in the Western Ghats India Biodivers Conserv 2001 10(3) 353ndash365 Publisher Full Text
29 Troy A Wilson MA Mapping ecosystem services practical challenges and opportunities in linking GIS and value transfer Ecol Econ 2006 60(2) 435ndash449 Publisher Full Text
30 Nelson E Mendoza G Regetz J et al Modeling multiple ecosystem services biodiversity conservation commodity production and tradeoffs at landscape scales Front Ecol Environ 2009 7(1) 4ndash11 Publisher Full Text
31 Rogers HM Glew L Honzak M et al Prioritizing key biodiversity areas in Madagascar by including data on human pressure and ecosystem services Landsc Urban Plan 2010 96(1) 48ndash56 Publisher Full Text
32 Naidoo R Balmford A Ferraro PJ et al Integrating economic costs into conservation planning Trends Ecol Evol 2006 21(12) 681ndash687 PubMed Abstract | Publisher Full Text
33 Ban NC Klein CJ Spatial socioeconomic data as a cost in systematic marine conservation planning Conservation Letters 2009 2(5) 206ndash215 Publisher Full Text
34 Naidoo R Ricketts TH Mapping the economic costs and benefits of conservation PLoS Biol 2006 4(11) e360 PubMed Abstract | Publisher Full Text | Free Full Text
35 Adams V Pressey R Naidoo R et al Opportunity costs who really pays for conservation Biol Conserv 2010 143(2) 439ndash448 Publisher Full Text
36 Pagiola S Bishop J Landell-Mills N (eds) et al Selling forest environmental services market-based mechanisms for conservation and development Earthscan London 2002 299 Reference Source
37 Kinzig AP Perrings C Chapin FS III et al Sustainability Paying for ecosystem servicesndashpromise and peril Science 2011 334(6056) 603ndash604 PubMed Abstract | Publisher Full Text
38 Carwardine J Klein CJ Wilson KA et al Hitting the target and missing the point target-based conservation planning in context Conservation Letters 2009 2(1) 4ndash11 Publisher Full Text
39 Chan KMA Shaw MR Cameron DR et al Conservation planning for ecosystem services PLoS Biol 2006 4(11) e379 PubMed Abstract | Publisher Full Text | Free Full Text
40 Egoh BN Reyers B Rouget M et al Identifying priority areas for ecosystem service management in South African grasslands J Environ Manage 2011 92(6) 1642ndash1650 PubMed Abstract | Publisher Full Text
41 Van Jaarsveld AS Biggs R Scholes RJ et al Measuring conditions and trends in ecosystem services at multiple scales the Southern African Millennium Ecosystem Assessment (SAfMA) experience Philos Trans R Soc Lond B Biol
Page 14 of 16
F1000Research 2012 117 Last updated 31 OCT 2013
Page 14 of 16
F1000Research 2012 117 Last updated 09 SEP 2015
F1000Research
Open Peer Review
Current Referee Status
Version 1
04 October 2012Referee Report
doi105256f1000research119r307
David NortonCollege of Engineering University of Canterbury Christchurch New Zealand
This is an interesting article that provides a conceptual framework for prioritizing areas for protectingecosystem services (ES) such as water provision
The article explores similarities and differences between ES prioritization and biodiversity prioritizationand highlights several key components that need to be considered in prioritizing areas for protecting ESTwo key components are the need to consider the costs of protecting areas and the importance ofconsidering human-derived alternatives The conceptual framework is then applied to a case study basedon water provision
I have read this submission I believe that I have an appropriate level of expertise to confirm thatit is of an acceptable scientific standard
No competing interests were disclosedCompeting Interests
29 September 2012Referee Report
doi105256f1000research119r306
Elena BennettNatural Resource Sciences and the McGill School of the Environment McGill University SteAnne-de-Bellevue Canada
This work presents an interesting conceptual framework that researchers as well as governments or otherstakeholders could use to identify priority areas for protecting ecosystem services
The authors suggest the following key elements (1) determine the services of interest (2) quantify thedemand for the service(s) and capacity of the ecosystem to meet demand through supply of the service(3) identify the threats and level of threat and (4) estimate the cost of protecting the service as well as anyalternative means of providing the service The authors then review the literature in which priorities havebeen assessed and identify which steps have been taken and which not in each study or effort I hope thispaper will increase our attention to key aspects of ES assessment that are often ignored especially theinteraction among all of these key factors
I have read this submission I believe that I have an appropriate level of expertise to confirm that
Page 15 of 16
F1000Research 2012 117 Last updated 09 SEP 2015
F1000Research
I have read this submission I believe that I have an appropriate level of expertise to confirm thatit is of an acceptable scientific standard
No competing interests were disclosedCompeting Interests
Page 16 of 16
F1000Research 2012 117 Last updated 09 SEP 2015
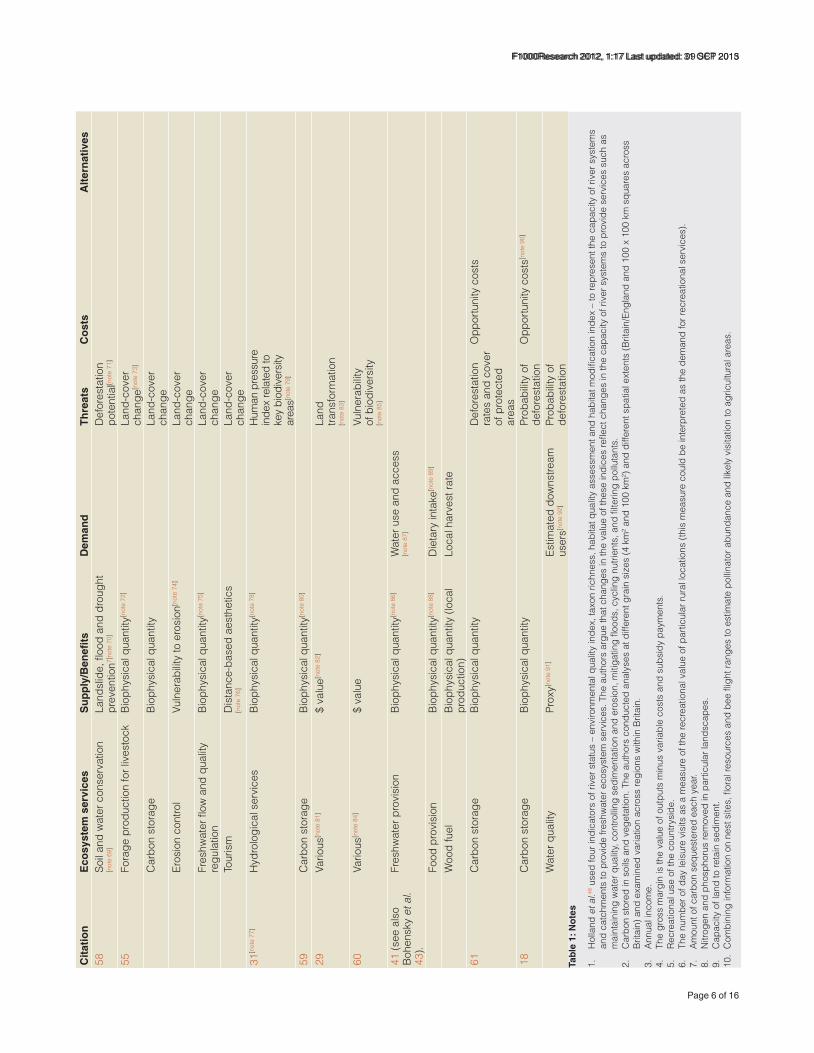
Cit
atio
nE
cosy
stem
ser
vice
sS
up
ply
Ben
efits
Dem
and
Th
reat
sC
ost
sA
lter
nat
ives
58So
il an
d w
ater
con
serv
atio
n [n
ote
69]
Land
slid
e fl
ood
and
drou
ght
prev
entio
n7[no
te 7
0]D
efor
esta
tion
pote
ntia
l[not
e 71
]
55Fo
rage
pro
duct
ion
for l
ives
tock
Bio
phys
ical
qua
ntity
[not
e 72
]La
nd-c
over
ch
ange
[not
e 73
]
Car
bon
stor
age
Bio
phys
ical
qua
ntity
Land
-cov
er
chan
geEr
osio
n co
ntro
lVu
lner
abili
ty to
ero
sion
[not
e 74
]La
nd-c
over
ch
ange
Fres
hwat
er fl
ow a
nd q
ualit
y re
gula
tion
Bio
phys
ical
qua
ntity
[not
e 75
] La
nd-c
over
ch
ange
Tour
ism
Dis
tanc
e-ba
sed
aest
hetic
s [n
ote
76]
Land
-cov
er
chan
ge31
[not
e 77
]H
ydro
logi
cal s
ervi
ces
Bio
phys
ical
qua
ntity
[not
e 78
]H
uman
pre
ssur
e in
dex
rela
ted
to
key
biod
iver
sity
ar
eas[n
ote
79]
59C
arbo
n st
orag
eB
ioph
ysic
al q
uant
ity[n
ote
80]
29Va
rious
[not
e 81
]$
valu
e[not
e 82
]La
nd
trans
form
atio
n [n
ote
83]
60Va
rious
[not
e 84
]$
valu
eVu
lner
abili
ty
of b
iodi
vers
ity
[not
e 85
]
41 (s
ee a
lso
Boh
ensk
y et
al
43)
Fres
hwat
er p
rovi
sion
Bio
phys
ical
qua
ntity
[not
e 86
]W
ater
use
and
acc
ess
[not
e 87
]
Food
pro
visi
onB
ioph
ysic
al q
uant
ity[n
ote
88]
Die
tary
inta
ke[n
ote
89]
Woo
d fu
elB
ioph
ysic
al q
uant
ity (l
ocal
pr
oduc
tion)
Loca
l har
vest
rate
61C
arbo
n st
orag
eB
ioph
ysic
al q
uant
ityD
efor
esta
tion
rate
s an
d co
ver
of p
rote
cted
ar
eas
Opp
ortu
nity
cos
ts
18C
arbo
n st
orag
eB
ioph
ysic
al q
uant
ityPr
obab
ility
of
defo
rest
atio
nO
ppor
tuni
ty c
osts
[not
e 90
]
Wat
er q
ualit
yPr
oxy[n
ote
91]
Estim
ated
dow
nstre
am
user
s[not
e 92
]Pr
obab
ility
of
defo
rest
atio
nTa
ble
1 N
ote
s
1
Hol
land
et a
l48 u
sed
four
indi
cato
rs o
f riv
er s
tatu
s ndash
envi
ronm
enta
l qua
lity
inde
x ta
xon
richn
ess
hab
itat q
ualit
y as
sess
men
t and
hab
itat m
odifi
catio
n in
dex
ndash to
repr
esen
t the
cap
acity
of r
iver
sys
tem
s an
d ca
tchm
ents
to p
rovi
de fr
eshw
ater
eco
syst
em s
ervi
ces
The
aut
hors
arg
ue th
at c
hang
es in
the
valu
e of
thes
e in
dice
s re
flect
cha
nges
in th
e ca
paci
ty o
f riv
er s
yste
ms
to p
rovi
de s
ervi
ces
such
as
mai
ntai
ning
wat
er q
ualit
y c
ontro
lling
sed
imen
tatio
n an
d er
osio
n m
itiga
ting
flood
s c
yclin
g nu
trien
ts a
nd fi
lterin
g po
lluta
nts
2
C
arbo
n st
ored
in s
oils
and
veg
etat
ion
The
aut
hors
con
duct
ed a
naly
ses
at d
iffer
ent g
rain
siz
es (4
km
2 and
100
km
2 ) a
nd d
iffer
ent s
patia
l ext
ents
(Brit
ain
Engl
and
and
100
x 10
0 km
squ
ares
acr
oss
Brit
ain)
and
exa
min
ed v
aria
tion
acro
ss re
gion
s w
ithin
Brit
ain
3
Ann
ual i
ncom
e4
Th
e gr
oss
mar
gin
is th
e va
lue
of o
utpu
ts m
inus
var
iabl
e co
sts
and
subs
idy
paym
ents
5
R
ecre
atio
nal u
se o
f the
cou
ntry
side
6
Th
e nu
mbe
r of d
ay le
isur
e vi
sits
as
a m
easu
re o
f the
recr
eatio
nal v
alue
of p
artic
ular
rura
l loc
atio
ns (t
his
mea
sure
cou
ld b
e in
terp
rete
d as
the
dem
and
for r
ecre
atio
nal s
ervi
ces)
7
A
mou
nt o
f car
bon
sequ
este
red
each
yea
r8
N
itrog
en a
nd p
hosp
horu
s re
mov
ed in
par
ticul
ar la
ndsc
apes
9
C
apac
ity o
f lan
d to
reta
in s
edim
ent
10
Com
bini
ng in
form
atio
n on
nes
t site
s fl
oral
reso
urce
s an
d be
e fli
ght r
ange
s to
est
imat
e po
llina
tor a
bund
ance
and
like
ly v
isita
tion
to a
gric
ultu
ral a
reas
Page 6 of 16
F1000Research 2012 117 Last updated 31 OCT 2013
Page 6 of 16
F1000Research 2012 117 Last updated 09 SEP 2015
11
The
auth
ors
set t
arge
ts to
add
ress
the
issu
e of
dem
and
(eg
ca
ptur
ing
50
of t
otal
car
bon
stor
ed in
an
ecor
egio
n)
12
Cos
ts a
re re
pres
ente
d by
the
suita
bilit
y of
are
as fo
r con
serv
atio
n ba
sed
on n
umer
ical
val
ues
that
refle
ct th
e de
gree
of i
mpe
dim
ents
to c
onse
rvat
ion
succ
ess
For
car
bon
stor
age
it is
a fl
at c
ost
the
area
of
the
plan
ning
uni
t13
A
vert
ed ri
sk o
f ext
rem
e flo
ods
14
The
fract
ion
of to
tal fl
ood
cont
rol v
alue
as
a fu
nctio
n of
the
num
ber o
f hou
sing
uni
ts in
the
flood
plai
n
15
Prod
uctio
n of
fora
ge fo
r gra
zing
rang
elan
d st
ock
16
Dol
lar v
alue
of f
orag
e pr
oduc
tion
17
The
targ
et w
as 7
5 o
f for
age
prod
uctio
n va
lue
18
The
sum
of w
eigh
ted
valu
es a
ssoc
iate
d w
ith d
evel
oped
land
agr
icul
ture
roa
d de
nsity
and
leng
th o
f hum
an-in
duce
d pa
tch
edge
s19
Pr
ovis
ion
of re
crea
tion
oppo
rtun
ities
20
Q
uant
ity o
f sui
tabl
e ha
bita
t in
addi
tion
to a
cces
sibi
lity
issu
es a
nd ri
ghts
to a
cces
s21
A
bas
elin
e ta
rget
(ass
umed
min
imum
requ
irem
ent)
of 1
2 da
ys o
f out
door
recr
eatio
n pe
r per
son
per y
ear
22
Cro
p po
llina
tion
by n
atur
al p
ollin
ator
s23
Th
e do
llar v
alue
of a
gric
ultu
ral c
rops
ben
efitti
ng fr
om p
ollin
atio
n
24
75
of f
eatu
re v
alue
acr
oss
the
ecor
egio
n25
Th
e su
pply
of f
resh
wat
er
26
40
of t
otal
fres
hwat
er u
se
27
The
auth
ors
purs
ued
two
appr
oach
es a
targ
et-b
ased
app
roac
h an
d in
corp
orat
ing
ecos
yste
m s
ervi
ces
as e
xtra
cos
ts o
r ben
efits
in th
e co
st la
yer
28
This
is a
spe
cies
-bas
ed a
ppro
ach
so th
e pr
iorit
ies
are
base
d on
spe
cies
and
thei
r dis
tribu
tion
acro
ss th
e la
ndsc
ape
29
For e
xam
ple
pos
itive
or n
egat
ive
econ
omic
val
ue
30
The
mag
nitu
de o
f thr
eats
affe
ctin
g ea
ch s
peci
es b
ased
on
maj
or la
nd u
ses
The
loss
of a
spe
cies
is e
quiv
alen
t to
the
loss
of t
he s
ervi
ce(s
) tha
t spe
cies
pro
vide
s31
M
edia
n an
nual
sim
ulat
ed ru
n-of
f32
G
roun
dwat
er c
ontri
butio
n to
sur
face
run-
off
33
Hot
spot
s m
appe
d as
are
as w
ith s
ever
e er
osio
n po
tent
ial a
nd v
eget
atio
n an
d lit
ter c
over
of a
t lea
st 7
0 w
here
mai
ntai
ning
the
cove
r is
esse
ntia
l to
prev
ent e
rosi
on
34
Soil
dept
h an
d le
af li
tter
35
The
auth
ors
asse
ssed
var
ious
sce
nario
s fo
r cap
turin
g ec
osys
tem
ser
vice
s ba
sed
on in
cide
ntal
pro
tect
ion
thro
ugh
the
cons
erva
tion
of b
iodi
vers
ity o
r the
incl
usio
n of
spa
tially
exp
licit
data
on
serv
ice
dist
ribut
ion
usin
g M
arxa
n In
Ego
h et
al40
the
aut
hors
set
diff
eren
t tar
get t
hres
hold
s fo
r cap
turin
g ce
rtai
n pe
rcen
tage
s of
ser
vice
pro
visi
on fo
r sur
face
wat
er s
uppl
y w
ater
flow
regu
latio
n c
arbo
n st
orag
e s
oil r
eten
tion
and
soil
accu
mul
atio
n
36
The
auth
ors
estim
ated
the
amou
nt o
f eac
h ec
osys
tem
ser
vice
pro
vide
d by
veg
etat
ion
type
s un
der i
ntac
t and
deg
rade
d co
nditi
ons
Mea
surin
g th
e di
ffere
nce
betw
een
the
two
is in
dica
tive
of th
e th
reat
of
degr
adat
ion
to s
ervi
ce p
rovi
sion
37
Th
e co
st o
f con
serv
ing
a pl
anni
ng u
nit w
as e
quiv
alen
t to
the
valu
e of
irrig
ated
cro
ppin
g or
gra
zing
The
opp
ortu
nity
cos
ts o
f con
serv
atio
n w
ere
addr
esse
d in
term
s of
lost
pro
duct
ion
The
aut
hors
in
clud
ed s
patia
l var
iabi
lity
in c
osts
bec
ause
val
ues
are
per p
lann
ing
unit
In E
goh
et a
l40 c
atch
men
t are
a is
use
d as
a c
ost l
ayer
(lar
ger a
reas
= g
reat
er c
ost)
38
B
y na
tura
l veg
etat
ion
39
Th
e au
thor
s ex
amin
ed th
e re
latio
nshi
p be
twee
n fo
dder
pro
visi
on a
nd s
tock
ing
rate
s to
det
erm
ine
the
stoc
king
rate
s th
at c
an b
e im
plem
ente
d w
ithou
t deg
radi
ng th
e en
viro
nmen
t (ie
su
stai
nabl
e st
ocki
ng ra
tes)
Hen
ce o
ver-s
tock
ing
is c
onsi
dere
d im
plic
itly
as a
thre
at to
veg
etat
ion
cond
ition
40
G
roun
dwat
er re
char
ge
41
For e
xam
ple
for fl
ood
miti
gatio
n T
he a
utho
rs a
lso
exam
ined
opp
ortu
nitie
s fo
r ser
vice
enh
ance
men
t 42
In
corp
orat
ing
the
dens
ity o
f peo
ple
who
rely
on
the
serv
ice
(ben
efici
arie
s) a
s de
nsity
per
wat
ersh
ed a
nd th
e w
ater
ndashpro
duct
ion
effic
ienc
y as
wat
er s
uppl
y di
vide
d by
are
a of
wat
ersh
ed
43
Wat
er s
uppl
y re
lativ
e to
dem
and
adju
sted
for t
he n
eed
to re
dist
ribut
e su
pply
with
in w
ater
shed
s W
ater
shed
s w
ere
supp
ly d
oes
not (
or o
nly
just
) mee
ts d
eman
d w
ere
prio
ritiz
ed
44
Am
ount
of v
eget
atio
n co
ver a
nd ra
te o
f veg
etat
ion
loss
with
mid
-ran
ge v
alue
s de
sign
ated
as
prio
ritie
s45
A
pro
xy w
as u
sed
repr
esen
ting
reso
urce
and
mai
nten
ance
cos
ts (e
g
land
acq
uisi
tion
infra
stru
ctur
e an
d la
bour
) and
con
side
ring
wat
ersh
ed-le
vel m
easu
res
of in
com
e p
opul
atio
n si
ze a
nd a
rea
46
Fina
ncia
l cap
acity
to p
ay fo
r alte
rnat
ives
to s
ervi
ce p
rovi
sion
suc
h as
dam
s an
d fil
tratio
n pl
ants
47
In
clud
es th
e tra
de-o
ff be
twee
n a
high
leve
l of fl
ood
activ
ity (n
umbe
r of fl
oods
dur
atio
n of
floo
ds a
nd a
rea
affe
cted
) and
a h
igh
leve
l of i
mpa
ct o
n hu
man
pop
ulat
ions
(dea
ths
and
disp
lace
men
t an
d hu
man
pop
ulat
ion
dens
ity in
wat
ersh
ed)
and
the
cost
s of
ser
vice
pro
tect
ion
48
A
s a
prop
ortio
n of
all
land
The
aut
hors
exa
min
e al
so th
e op
port
uniti
es fo
r ser
vice
enh
ance
men
t thr
ough
land
scap
e re
stor
atio
n
49
The
auth
ors
used
exp
ert o
pini
on to
est
imat
e po
ssib
le la
nd tr
ansf
orm
atio
n w
ithin
the
next
5 y
ears
Thi
s id
entifi
ed n
egat
ive
and
posi
tive
chan
ges
to s
ervi
ce p
rovi
sion
50
B
ased
on
stak
ehol
der p
refe
renc
e51
Th
e in
clus
ion
of s
take
hold
ers
in th
e ra
nkin
g pr
oces
s ad
dres
ses
to a
deg
ree
the
dem
and
for s
ervi
ces
and
or th
e va
lue
of s
ervi
ces
to b
enefi
ciar
ies
Thi
s is
an
expl
icit
inco
rpor
atio
n of
ben
efici
arie
s in
the
proc
ess
52
Bas
ed o
n la
nd m
anag
emen
t and
sta
keho
lder
per
cept
ion
53
The
auth
ors
com
pare
d th
e ec
osys
tem
-ser
vice
val
ues
to th
e co
st o
f con
serv
ing
the
natu
ral h
abita
t tha
t und
erlie
s th
eir p
rovi
sion
The
opp
ortu
nity
cos
t was
cal
cula
ted
as th
e ex
pect
ed a
gric
ultu
ral v
alue
of
each
fore
sted
par
cel o
f lan
d
54
To e
stim
ate
the
econ
omic
val
ue o
f bus
hmea
t the
aut
hors
use
d th
e lo
cal m
arke
t pric
e of
a k
ilo o
f bee
f sin
ce d
omes
tic m
eat i
s a
poss
ible
sub
stitu
te fo
r bus
hmea
t Th
is a
ppro
ach
impl
icitl
y re
cogn
ises
al
tern
ativ
es to
ser
vice
pro
visi
on
55
Valu
e fo
r new
pha
rmac
eutic
al p
rodu
cts
56
The
auth
ors
assu
med
imm
inen
t def
ores
tatio
n ou
tsid
e of
cor
e pr
otec
ted
area
s57
N
et a
nnua
l rat
e of
atm
osph
eric
car
bon
adde
d to
exi
stin
g bi
omas
s ca
rbon
poo
ls (m
easu
red
usin
g a
prox
y)
Page 7 of 16
F1000Research 2012 117 Last updated 31 OCT 2013
Page 7 of 16
F1000Research 2012 117 Last updated 09 SEP 2015
58
The
auth
orsrsquo
max
imiz
ed s
ervi
ce p
rovi
sion
for a
giv
en e
core
gion
are
a co
nstra
int u
sing
opt
imiz
atio
n m
etho
ds
Inco
rpor
atin
g th
e is
sue
of a
rea
cons
train
ts a
ddre
sses
cos
ts a
nd th
e m
axim
izat
ion
goal
get
s so
mew
hat a
t dem
and
59
Ann
ual p
rodu
ctio
n of
live
stoc
k fro
m g
razi
ng o
n un
impr
oved
nat
ural
pas
ture
s (e
xpre
ssed
as
tons
of m
eat)
60
B
enefi
ciar
ies
wer
e at
the
poin
t of p
rodu
ctio
n on
ly (w
here
eco
nom
ic b
enefi
ts a
re re
aliz
ed)
The
auth
ors
iden
tified
pro
duct
ion
peak
s of
wat
er p
rovi
sion
and
gra
ssla
nd p
rodu
ctio
n in
den
sely
pop
ulat
ed
biod
iver
sity
hot
spot
s in
dire
ctly
add
ress
ing
the
issu
e of
spa
tial v
aria
bilit
y in
dem
and
61
Wat
er a
vaila
bilit
y an
d w
ater
use
62
O
nly
the
key
poin
ts a
re c
aptu
red
here
see
the
publ
icat
ion
for f
ull d
etai
ls
63
Scen
ario
ana
lyse
s ex
plor
e im
plic
atio
ns o
f pos
sibl
e fu
ture
land
scap
e ch
ange
s64
Es
timat
ed th
roug
h so
il lo
ss R
egio
ns w
ith lo
wer
pot
entia
l soi
l los
s w
ere
a pr
iorit
y w
hich
impl
icitl
y re
cogn
ises
the
impo
rtan
ce o
f thr
eats
65
W
ater
-sup
ply
func
tion
and
flow
regu
latio
n (m
ean
annu
al c
atch
men
t run
off a
nd m
ean
annu
al g
roun
dwat
er re
char
ge)
66
Iden
tified
ben
efici
arie
s in
the
biom
e th
roug
h a
liter
atur
e re
view
and
exp
ert c
onsu
ltatio
n
67
Mea
n ca
rryi
ng c
apac
ity o
f the
land
inco
rpor
atin
g cl
imat
e s
oil t
ype
and
vege
tatio
n68
A
reas
that
tour
ists
can
see
with
in a
10
km b
uffe
r sur
roun
ding
the
maj
or to
uris
t driv
ing
rout
es (s
ee R
eyer
s et
al55
)69
La
ndsl
ide
floo
d an
d dr
ough
t pre
vent
ion
func
tions
70
La
ndsl
ide
prev
entio
n co
nsid
ered
in te
rms
of la
ndsl
ide
haza
rd t
he m
ore
haza
rdou
s an
are
a th
e m
ore
impo
rtan
t it i
s to
kee
p fo
rest
in p
lace
(an
alte
rnat
ive
perc
eptio
n of
lsquodem
andrsquo
) D
roug
ht a
nd fl
ood
prev
entio
n re
flect
s w
ater
rete
ntio
n ca
pabi
lity
of fo
rest
71
Es
timat
ed u
sing
the
prox
imity
to s
ettle
men
ts a
nd ro
ads
(mea
sure
s of
acc
ess
for d
efor
esta
tion)
and
dis
tribu
tion
of th
e nu
mbe
r of c
omm
erci
al s
peci
es o
f tre
es (a
mea
sure
of f
ores
t des
irabi
lity
for l
oggi
ng)
72
Car
ryin
g ca
paci
ties
for d
omes
tic s
tock
exp
ress
ed a
s th
e nu
mbe
r of h
ecta
res
requ
ired
per l
arge
sto
ck u
nit (
hect
ares
val
ues
wer
e de
term
ined
for p
ristin
e ex
ampl
es o
f hab
itat t
ypes
) 73
Th
e au
thor
s co
mpa
red
the
pote
ntia
l del
iver
y of
eco
syst
em s
ervi
ces
from
lsquopris
tinersquo
loca
tions
to th
at p
rovi
ded
by d
egra
ded
loca
tions
est
imat
ing
how
land
scap
e de
grad
atio
n m
ay d
imin
ish
the
capa
city
of
loca
tions
to p
rovi
de a
giv
en s
ervi
ce (a
n in
dire
ct a
sses
smen
t of t
hrea
t)
74
The
auth
ors
map
ped
area
s vu
lner
able
to e
rosi
on a
nd c
lass
ified
them
as
high
med
ium
and
low
ero
sion
haz
ard
Hab
itat t
ypes
pro
vide
ero
sion
con
trol w
here
ther
e is
a h
igh
thre
at o
f ero
sion
ow
ing
to
fact
ors
such
as
topo
grap
hy r
ainf
all a
nd s
oil (
indi
rect
ly a
ddre
ssin
g th
e is
sue
of th
reat
) 75
M
illio
ns o
f cub
ic m
eter
s of
gro
undw
ater
rech
arge
per
1-k
m2 g
rid c
ell
76
A re
late
d st
udy
by W
endl
and
et a
l18 in
clud
ed c
osts
thr
eats
and
dem
and
but
it is
unc
lear
if th
ese
are
incl
uded
in th
e m
easu
re o
f hyd
rolo
gica
l im
port
ance
use
d in
Rog
ers
et a
l31
77
Prov
isio
n of
drin
king
wat
er to
dow
nstre
am u
sers
and
irrig
atio
n fo
r ric
e pa
ddie
s78
Th
e au
thor
s ex
amin
ed th
e th
reat
s to
the
biol
ogic
al v
alue
of k
ey b
iodi
vers
ity a
reas
(KB
As)
bas
ed o
n a
lsquohum
an p
ress
ure
inde
xrsquo c
alcu
late
d fro
m m
easu
res
of h
uman
pop
ulat
ion
dens
ity r
oad
dens
ity fi
re
prev
alen
ce a
nd a
gric
ultu
ral s
uita
bilit
y T
hey
did
not d
irect
ly e
xam
ine
thre
ats
to e
cosy
stem
-ser
vice
pro
visi
on b
ut d
id th
is in
dire
ctly
by
look
ing
at th
reat
s to
the
prot
ectio
n of
KB
As
whi
ch w
ere
rank
ed
base
d on
thei
r hyd
rolo
gica
l ser
vice
val
ue
79
The
carb
on d
ensi
ty o
f liv
ing
biom
ass
80
Th
e nu
mbe
r (an
d ty
pe) o
f ser
vice
s is
a li
ttle
ambi
guou
s it
app
ears
to b
e be
twee
n 9
and
13 d
epen
ding
on
the
anal
ysis
The
aut
hors
als
o co
nduc
ted
anal
yses
at t
hree
diff
eren
t spa
tial s
cale
s81
Ec
osys
tem
ser
vice
val
ues
wer
e ex
pres
sed
in d
olla
r val
ues
of la
nd u
nits
bas
ed o
n la
nd c
over
and
the
serv
ices
pro
vide
d by
par
ticul
ar la
nd c
over
s82
Th
e au
thor
s de
al w
ith th
reat
(s) t
o se
rvic
e pr
ovis
ion
indi
rect
ly b
y m
odel
ling
the
chan
ge in
eco
syst
em s
ervi
ce v
alue
with
two
alte
rnat
ive
deve
lopm
ent s
cena
rios
83
Th
e au
thor
s ca
lcul
ated
the
ecos
yste
m-s
ervi
ce v
alue
s ($
val
ue) f
or 1
7 di
ffere
nt s
ervi
ces
and
reco
gnis
ed v
aria
tion
in th
e sp
atia
l dep
ende
ncie
s of
ser
vice
s
84
The
auth
ors
asse
ssed
the
vuln
erab
ility
of b
iodi
vers
ity (lsquo
thre
atrsquo)
and
then
det
erm
ined
the
ecos
yste
m-s
ervi
ce v
alue
cap
ture
d in
bio
dive
rsity
tem
plat
es w
here
low
vul
nera
bilit
y is
a p
riorit
y an
d hi
gh
vuln
erab
ility
is a
prio
rity
85
Th
e au
thor
s ca
lcul
ated
wat
er a
vaila
bilit
y (to
tal a
nd p
er p
erso
n) a
nd m
appe
d su
pply
and
dem
and
ratio
s86
W
ater
ava
ilabi
lity
per p
erso
n w
as re
fere
nced
aga
inst
an
acce
pted
min
imum
targ
et (1
000
m3 )
set
by
the
Uni
ted
Nat
ions
(hen
ce t
his
targ
et re
pres
ents
lsquodem
andrsquo
) Th
e au
thor
s al
so c
alcu
late
d th
e pe
rcen
tage
of t
he p
opul
atio
n w
ith a
cces
s to
impr
oved
wat
er a
nd im
prov
ed s
anita
tion
and
und
er fi
ve m
orta
lity
per 1
000
birt
hs
87
The
perc
enta
ge c
ontri
butio
n of
car
bohy
drat
e an
d pr
otei
n-su
pply
ing
crop
s to
tota
l die
tary
inta
ke
88
Serv
ice
prov
isio
n is
com
pare
d to
reco
mm
ende
d m
inim
um d
aily
inta
ke (2
100
kcal
per
per
son)
and
min
imum
dai
ly in
take
of p
rote
in
89
Lost
agr
icul
tura
l pro
duct
ion
90
Opp
ortu
nity
cos
ts fo
r agr
icul
ture
and
sto
ck
91
The
auth
ors
did
not c
alcu
late
wat
er q
uant
ity b
ut u
sed
a pr
oxy
for t
he s
uppl
y of
sed
imen
t-fre
e w
ater
bas
ed o
n po
pula
tion
data
lan
d co
ver a
nd w
ater
flow
dire
ctio
n92
Th
e au
thor
s m
easu
red
dow
nstre
am u
sers
thro
ugh
the
dow
nstre
am p
opul
atio
nsrsquo n
eed
for q
ualit
y dr
inki
ng w
ater
dow
nstre
am a
rea
of ir
rigat
ed ri
ce fi
elds
and
dow
nstre
am a
rea
of m
angr
oves
Page 8 of 16
F1000Research 2012 117 Last updated 31 OCT 2013
Page 8 of 16
F1000Research 2012 117 Last updated 09 SEP 2015
soil retention24) or through quantifying the supply of services often in biophysical units The latter is the most common approach in broad-scale prioritization studies (Table 1) Biophysical quan-tities can include for example the amount of carbon stored in particular ecosystem types water availability or supply or fodder production However it is crucial to address also the issue of the level of biophysical quantity demanded by service beneficiaries We refer to the level of human need for a service as lsquodemandrsquo but recognise that this level changes with context and differs from the economic perspective of demand as the amount of a good or service that can be purchased at a given price
Simply increasing the quantity of a given service maymay not be appropriate depending on human need It could also divert funds from more necessary actions because if the quantities of certain ES are adequate and not under threat investment in the protection of these services could be a lower priority compared to services currently unable to meet human needs (see lsquoTarget setting and the capacity to meet demandrsquo) Luck et al15 explicitly addressed this issue by prioritizing locations for managing ES based on the hu-man need for the services of water provision and flood mitigation This directly links the quantity of service provided with the needs of beneficiaries and better identifies where needs are not being met
The benefits of managing for ES vary across space and time re-flecting for example variation in human need and the capacity to pay for human-derived alternatives This spatio-temporal vari-ation is decidedly complex influenced by factors such as the type of service being considered market fluctuations and the changing needs of beneficiaries This dynamism magnifies the complexity of ES prioritization beyond that of biodiversity prioritization For example Wilson et al11 note that the benefit-protection function in conservation planning is asymptotic in that benefit accumulation is less and less with the protection of more land While the same is true for some ES25 the shape of the curve will vary over time and space with beneficiary demand driven by among other things markets and changing needs Moreover owing to global markets it can be extremely difficult to identify who benefits from a given service It is less problematic to focus on the immediate beneficiar-ies of service provision (eg growers benefiting from crop polli-nation) rather than also considering those individuals that benefit from the products of services (eg consumers of crop commodi-ties26) In some cases it may be sufficient to recognise simply that the benefits from the provision of a particular service are globally widespread and diffuse (eg carbon storage)
Threats to service provisionConservation planners may quantify threatening processes that in-crease the risk of biodiversity loss27 and a similar focus on threats to ES provision is an appropriate way to incorporate threats into ser-vice prioritization It is also important to recognise the fundamental difference between the vulnerability of an ES to threat(s) and the level of threat a particular service is under Some services may be particularly vulnerable to threats (eg crop pollination reliant on a single pollinator species) but not currently threatened whereas other services may be resilient to a range of threats but at risk of decline owing to the magnitude of threat(s)
Despite its importance few ES prioritization schemes to date have explicitly incorporated threats (Table 1) Egoh et al3 document-ed biophysical quantities of ES provided by intact and degraded vegetation which implicitly addresses threat to service provision through landscape degradation Others examined changes in quan-tities or dollar values of services through modelling alternative future land-use scenarios recognising that some scenarios (eg extensive development) represent a greater threat to service pro-vision than others28ndash30 A more explicit approach to incorporating threats is to document the likelihood of decline or loss of service-providing ecosystems through for example human development or habitat loss1831
Addressing threats to ES is most important when service provision is not substitutable across space (ie site dependency is high be-cause the service must be provided in a specific location eg storm protection) there are no human-derived alternatives to service pro-vision or these alternatives are expensive relative to the capacity of local communities to pay for the alternatives or ecosystem changes are irreversible (eg species extinction)
Costs of actions to manage servicesConservation planners list a variety of costs that should be con-sidered when assessing options for protecting biodiversity32 These range from acquisition costs (eg purchasing land for conserva-tion) and management costs (eg maintaining conservation areas) through to social costs (eg the number of people displaced from conservation areas1133) Costs will vary across space and must be linked to actions to improve planning relevance9 For example if the action required is land acquisition then a relevant cost is land price if the action is management of a conservation area then a relevant cost would be the salaries of conservation managers
The management of ES attracts similar costs dependent on the type of action required to protect the service Indeed some ES prioritiza-tion schemes incorporate opportunity costs in a similar way to bio-diversity prioritization recognising that managing ecosystems for service provision can yield the same opportunity costs as protecting ecosystems for biodiversity (eg when an area cannot be used for production31834 Table 1) Costs may also be incorporated through the use of proxies for resource and maintenance expenses (see lsquoAn example of spatial prioritizationrsquo)
It is important to identify the assignation of costs (who pays) and benefits in both biodiversity conservation and ES prioritization35 For example designation of a conservation area yields benefits that are primarily public notwithstanding for example income gener-ated from nature tourism but sometimes at a cost to private interests (eg opportunity cost of lost revenue from production) Managing an area for the delivery of ES can yield relatively greater private benefits particularly for service beneficiaries with costs borne by both public and other private interests For example a forest des-ignated for timber harvest will yield financial benefits to logging companies at a cost to the public (eg through lost carbon storage) and other private interests (eg those interested in using the forest for ecotourism) Ensuring greater equity in the distribution of ben-efits and costs from services provided by public or private assets
Page 9 of 16
F1000Research 2012 117 Last updated 31 OCT 2013
Page 9 of 16
F1000Research 2012 117 Last updated 09 SEP 2015
may be achieved through various mechanisms such as government regulation self-regulation (enforced by societal norms) or market approaches like cap and trade or payments for ES3637 Yet the ap-propriateness of a particular mechanism depends on the character-istics of the service being targeted (eg who generates the service management jurisdiction and providerndashbeneficiary spatio-temporal dynamics see Kinzig et al37)
Availability of alternatives to service provisionThe availability of human-derived alternatives to the provision of ES is a vital consideration in service prioritization These alter-natives can include for example a water filtration plant to cover the filtration services of wetlands or pesticides to cover biological control The availability of alternatives and the capacity of relevant human communities to pay for these alternatives can influence the treatment of other factors such as benefits threats actions and costs For example managing a particular service may be given lower priority if human-derived alternatives are readily available and affordable although the associated costs of these alternatives must be considered also (eg the health costs of increasing pesti-cide use) Only a few studies that attempt ES prioritization address the issue of availability of alternatives (Table 1) As part of the pri-oritization process the availability and cost of alternatives should be considered simultaneously with the list of potential actions for service protection or enhancing service provision
Target setting and the capacity to meet demandSetting targets is common in conservation planning and can be a requirement for assessing the capacity of selection procedures to meet conservation objectives38 In most cases setting a target is equivalent to meeting a baseline threshold Target setting in ES pri-oritization is rare and has to the best of our knowledge only oc-curred in four published studies343940 (Table 1) For example Chan et al39 set a baseline target (assumed minimum requirement) of 12 days of outdoor recreation per person per year and determined the space required to provide that level of service from data on park visitation Chan et al39 also stipulated that targets had to be met in different stratification zones within the study area which accounted somewhat for the site dependency of service production and vari-ability in the spatial distribution of beneficiary needs
While target setting is one approach to assessing the capacity of eco-systems to meet the demands of beneficiaries provisionndashdemand re-lations have been variously dealt with in the literature (Table 1) For example some studies included data on water use when calculating water provision capacity [eg1526] while others measured down-stream need for water of a given quality through the calculation of population densities and areas of irrigated rice and mangroves18 Van Jaarsveld et al41 calculated water and food provision relative to accepted minimum standards for human consumption The need and approach to calculating demand for service provision will vary depending on the service of interest For example it is generally considered unnecessary to calculate spatially explicit demand for carbon storage because this service benefits the global community and demand is not spatially variable
Site dependency and scaleSite dependency in the provision of an ES reflects the level of need for a particular service to be provided in a particular location in
order to deliver benefits to a given set of beneficiaries This can be interpreted also in the context of the scale of service provision (eg local to global) For example storm protection from mangroves has high site dependency in provision ndash mangrove forests must occur in locations where local communities are threatened by storm activity This should not be confused with the substitutability of the service that is whether human-derived alternatives (eg sea walls) or other coastal vegetation types can provide a similar service In contrast global climate regulation through ecosystems storing carbon has lower site dependency in provision because it does not have to occur at a particular location (ie there are various options for managing ecosystems to store carbon) However there is still some level of site preference because certain ecosystems (eg rainforests) store more carbon than others Site dependency and scale varies also in the use of the service For example the beneficiaries of biological control in agro-ecosystems generally occur at the local to regional scale if the emphasis is on growers whereas the beneficiaries of climate regulation occur at the global scale
Variation in the site dependency and scale of the provision and use of ES has major implications for the valuation of services which must consider spatially explicit and scale-dependent relationships in productionndashconsumption flows42 Such relationships also have im-portant implications for prioritization strategies High site depend-ency could result in certain locations that generate that service being classified as irreplaceable For example Bohensky et al43 identified irreplaceable land units for food and water provision to meet pre-determined targets of caloric intake for a given population When services have lower levels of site dependency in production there is greater flexibility in site selection during the prioritization process (all else being equal)
An example of spatial prioritizationThe relationships among the various components of our conceptual framework for spatial prioritization of ES are presented in Figure 1 We illustrate our approach in this section using a worked example based on data published in Luck et al15 focussing for the sake of simplicity on a single ES water provision
The global analysis of Luck et al15 identified watersheds that are a priority for protecting particular ES The first step in the analysis was to quantify the benefits and supply of the service The benefits of protecting the supply of potable water was measured through hu-man population density in each watershed that is there were greater benefits to protecting supply in watersheds with higher population density compared to those with lower density Water supply was measured using a global hydrological model and lsquowater-production efficiencyrsquo was calculated for each watershed by dividing supply in each watershed with watershed area
The costs of actions to manage water provision were represented using a proxy for resource (eg land acquisition and infrastructure) and maintenance (eg labour) costs This proxy incorporated data on total income in the watershed (per capita gross national income) population size and watershed area Resource costs were assumed to scale positively with per-capita wealth and population density (assuming that land and infrastructure prices are generally higher where population density is higher) while maintenance costs were assumed to also scale positively with per-capita wealth Finally the
Page 10 of 16
F1000Research 2012 117 Last updated 31 OCT 2013
Page 10 of 16
F1000Research 2012 117 Last updated 09 SEP 2015
and change in vegetation cover can be considered a proxy for threat to water provision To quantify this threat the following data were used the proportion of each watershed covered in tree shrub and herbaceous vegetation the annual rate of change in vegetation cover (over a proceeding 5-year period) the time span over which change in cover would be predicted (eg 20 years) and the proportion of the watershed that was protected (assuming vegetation in protected areas could not be cleared) Watersheds with mid-range values of vegetation cover rates of vegetation loss andor area protected were considered priorities for water provision management because for example watersheds with low cover and high rates of loss would require large investments in ES management relative to return whereas watersheds with high cover and low rates of loss are under less threat to the disruption of the service
The final consideration in spatial prioritization is the availability of alternatives to the provision of the service via ecosystems Im-provements in the supply of potable water may be made through the construction of dams and building of filtration plants for example rather than ecosystem management The availability of these alter-natives is often a function of the capacity of local communities to
cost-effectiveness of protecting the service in each watershed was calculated by dividing human population density and water supply (benefits) by the cost
The capacity to meet demand was measured using values for water supply and water withdrawals in each watershed It also considered regional water deficits (withdrawals gt supply) and the proportion of total supply that remained once demands were met adjusting the watershed-level capacity measure downwards proportional to the need to move water to regions (within a watershed) where supply did not meet demand It was assumed that managing the service of water provision was most important in watersheds where supply barely meets or is short of demand and less important when supply greatly exceeded demand
To estimate threat to water provision expected vegetation cover in each watershed was used recognising the link between vegetation and water provision filtration and the maintenance of water qual-ity (although this link is decidedly complex see Luck et al15 for details) Vegetation cover and type in a watershed may be indicative of the capacity of the watershed to provide potable water naturally
Figure 1 Key aspects for consideration in ecosystem-service prioritization
Pre-prioritization
Prioritization process
Post-prioritization Reduce conicts and assess trade-os among priorities through multi-objective planning frameworks
Determine services toprioritize throughstakeholder consultation
Determine availability ofspatially explicit data
Assess data quality foreach component ofprioritization
bull Identify beneciaries (immediate and non- immediate)bull Determine social needbull Assess capacity of ecosystem to meet demand
bull Dene metric to measure supplybull Calculate dierence made by actionbull Assess site dependency of supplybull Identify alternatives
bull Identify threats to supply Assess impact of threat on service deliverybull Assess if impacts of threats are irreversible
bull Estimate cost of action needed to abate threat Identify who pays costbull Determine budget
Demand Supply
Costs Threats
Page 11 of 16
F1000Research 2012 117 Last updated 31 OCT 2013
Page 11 of 16
F1000Research 2012 117 Last updated 09 SEP 2015
ES management The selection of different services will influence the approach to spatial prioritization because ES management will have different objectives (eg improving timber harvest or main-taining water supply) However the major steps we outline here will be relevant in most cases
Application of our approach requires spatially explicit data on where services are produced benefits costs and threats Data on spatially explicit production is usually obtained through mapping the loca-tion of ecosystems that provide services (eg grasslands that sup-port livestock) Mostly this involves maps of vegetation types or water sources (Table 1) Benefits are represented spatially generally via the biophysical quantity of a given service produced by a given location (eg carbon stored) andor its financial value To represent costs spatially researchers have used simply the area of the planning unit (eg39 for some services) or current land values [eg34] Docu-menting costs is problematic because of spatio-temporal variation in financial values which is possibly why some researchers have resorted to more simple rules-of-thumb (eg assuming that manag-ing larger areas yields greater costs) Also problematic is spatially explicit measures of threat which have been represented by for ex-ample maps of land-use or historical or potential land-cover change and how these relate spatially to the location of service provision [eg3047] (Table 1)
Finally the type of data used in prioritization will greatly affect out-comes For example Anderson et al2 demonstrated that variation in the resolution (asymp grain size) andor spatial extent of a prioritization analysis influenced the level of congruence between biodiversity and ES priorities Moreover data quality may be poor for certain services and certain components of prioritization For example crude proxies or indicators may be required for services for which it is difficult to obtain accurate spatially explicit measures of sup-ply and demand (eg flood mitigation see Holland et al48) Our framework which promotes the use also of data on threats costs alternatives and site dependency may help to alleviate this issue because prioritization could be based just on those components for which data quality is acceptable
The most appropriate metric to represent the supply of the service will be context dependent but the use of biophysical quantities will be suitable in most cases For example if the service is storm protec-tion then a suitable metric may be the area of mangroves that needs to be maintained to deliver a given level of protection [eg25] ES supply should be assessed relative to the demand for the service which can be measured using a target-based approach through cur-rent or projected use of the service or its products through dem-onstrated need for the service (eg historical impacts of storms) or through meeting an accepted minimum standard (eg acceptable losses due to storm damage) Quantifying demand for a service re-quires the implicit or preferably explicit identification of beneficiar-ies which may be immediate beneficiaries (eg residents of coastal villages threatened by storms) andor lsquonon-immediatersquo beneficiaries (eg consumers of goods produced by the villages)
The application of prioritization frameworks generally involves multiple services across many planning units and priorities for different services are not necessarily congruent2 This requires an analysis of trade-offs between services in managing landsea-space
pay for them in addition to other constraints (eg topographic suit-ability for dam construction) Therefore Luck et al15 used the gross national income per capita of countries spanning each watershed as an indicator of the capacity of communities reliant on the watershed to pay for alternatives to natural water provision
The above components were combined into a single index repre-senting the relative importance of each watershed for protecting water supply This example and our prioritization framework gen-erally is appropriate when planning units are large and there are a variety of available options for managing services and it is difficult to express the components of prioritization precisely Our frame-work treats the supply of services threats and costs in ES prioritiza-tion inclusive of beneficiary demand capacity to meet demand and availability of alternatives to ES provision
DiscussionOur review of current approaches to identifying spatial priorities for managing ES found that the important components of prioritization (benefits costs threats availability of alternative and capacity to meet demand) were treated in substantially different ways or some-times omitted completely (although not all components are appli-cable in every context) Moreover few studies explicitly addressed the issue of site dependency and scale in the provision of services andor location of beneficiaries Accordingly there is substan-tial scope for improving ES analyses aimed at identifying spatial priorities for managing services
If ES benefits were commodities in perfect markets the price of such benefits would reflect all of the spatial prioritization components identified above Yet many ES benefits are not commodities and for those that are the associated markets are far from perfect suffering from numerous market failures including monopsony (single buy-ers as in reverse auctions) oligopoly (few sellers as in many pay-ments-for-ES schemes) externalities and information asymmetries This means that market prices will not generally reflect all of the components of prioritization appropriately Stated-preference non-market valuation approaches can be informative in certain settings where markets do not apply but they are generally of limited utility reflecting the various dimensions of valuesocial priority4445 Ac-cordingly even where economic valuation data are available it will still be appropriate for ES prioritization exercises to separately inte-grate some of the components we identify
Although we have focussed on the mechanics of prioritization the following issues must be addressed prior to such analyses 1) iden-tification of the ES to be included 2) capacity to access spatially explicit data and 3) data quality (Figure 1) Identifying important ES should occur through in-depth consultation among scientists policy-makers managers and stakeholders (especially service ben-eficiaries see Fisher et al46) For example if prioritization was required across a particular country federal management agencies and relevant stakeholders may engage in a process of identifying those services most important to the well-being of the country lsquoImportancersquo may be a factor of the total financial value of a ser-vice (eg agricultural production) andor the societal need for a service (eg provision of potable water) and assessed through ap-propriate valuation approaches Hence a priority list of which ser-vices to focus on is required prior to deciding on where to invest in
Page 12 of 16
F1000Research 2012 117 Last updated 31 OCT 2013
Page 12 of 16
F1000Research 2012 117 Last updated 09 SEP 2015
China Costa Rica and Mexico pay landholders that engage in man-agement that protects the supply of hydrological services50ndash52 Vital to this process is identifying locations that offer the greatest return on investment This requires a systematic and thorough approach to identifying spatial priorities for protecting ES
Author contributionsGL and KC conceived the study GL summarised the information in Table 1 and prepared the first draft of the manuscript All authors revised subsequent drafts of the manuscript and have agreed to the final content
Competing interestsWe declare no competing interests
Grant informationThe contribution of GL and CK was supported by the Australian Re-search Councilrsquos Future Fellowship (project number FT0990436G) and Postdoctoral Fellowship (project number DP110102153) pro-grams respectively The contribution of KC was supported by the Canada Research Chairs program and the Canadian Foundation for InnovationBritish Columbia Knowledge Development Fund (Leaders Opportunity Fund)
The funders had no role in study design data collection and analy-sis decision to publish or preparation of the manuscript
for service provision5 Moilanen et al49 addressed this issue using a multi-objective prioritization approach for biodiversity and ES based on the conservation planning software Zonation The au-thors argued that regional variation in land-use priorities meant that spatial separation of land uses may reduce management conflicts Moreover areas that are a priority for multiple ES could be used in trade-offs assuming the areas were not critical priorities for every service
In multi-objective prioritization frameworks that consider spatial separation of ES management or trade-offs in land-use priorities it is vital to address site-dependency and scale of service provision and location of beneficiaries As we argue above there is little flex-ibility in managing for the provision of services that are delivered locally to in situ beneficiaries (eg flood mitigation) Avoiding in-appropriate management decisions and trade-offs rests entirely on taking a comprehensive approach to identifying priorities Here we describe the major factors that must be considered in ES prioritiza-tion and argue that addressing as many of these factors as possible will improve the outcomes of multi-objective prioritization frame-works that aim to promote human well-being through the protection of services
Developing comprehensive methods for identifying ES priorities is much more than just an academic exercise Governments and NGOs across the world are increasingly including the protection of ES into their policy directives For example the governments of
References
1 MA (Millennium Ecosystem Assessment) Ecosystems and human well-being synthesis Island Press Washington DC 2005 Reference Source
2 Anderson BJ Armsworth PR Eigenbrod F et al Spatial covariance between biodiversity and other ecosystem service priorities J Appl Ecol 2009 46(4) 888ndash896 Publisher Full Text
3 Egoh BN Reyers B Carwardine J et al Safeguarding biodiversity and ecosystem services in the Little Karoo South Africa Conserv Biol 2010 24(4) 1021ndash1030 PubMed Abstract | Publisher Full Text
4 Chan KMA Hoshizaki L Klinkenberg B et al Ecosystem services in conservation planning targeted benefits or co-benefitscosts PLoS One 2011 6(9) e24378 PubMed Abstract | Publisher Full Text | Free Full Text
5 White C Halpern BS Kappel CV et al Ecosystem service tradeoff analysis reveals the value of marine spatial planning for multiple ocean uses Proc Natl Acad Sci U S A 2012 109(12) 4696ndash701 PubMed Abstract | Publisher Full Text | Free Full Text
6 Menzel S Teng J Ecosystem services as a stakeholder-driven concept for conservation science Conserv Biol 2010 24(3) 907ndash909 PubMed Abstract | Publisher Full Text
7 Kareiva P Tallis H Ricketts TH et al Natural capital theory and practice of mapping ecosystem services Oxford University Press Oxford 2011 365 Reference Source
8 Brooks TM Mittermeier RA da Fonseca GAB et al Global biodiversity conservation priorities Science 2006 313(5783) 58ndash61 PubMed Abstract | Publisher Full Text
9 Carwardine J Wilson KA Watts M et al Avoiding costly conservation mistakes the importance of defining actions and costs in spatial priority setting PLoS One 2008 3(7) e2586 PubMed Abstract | Publisher Full Text | Free Full Text
10 Pressey RL Bottrill MC Approaches to landscape- and seascape-scale conservation planning convergence contrasts and challenges Oryx 2009 43(4) 464ndash475 Publisher Full Text
11 Wilson KA Carwardine J Possingham HP et al Setting conservation priorities Ann N Y Acad Sci 2009 1162 237ndash264 PubMed Abstract | Publisher Full Text
12 Mills M Pressey RL Weeks R et al A mismatch of scales challenges in planning for implementation of marine protected areas in the Coral Triangle Conservation Letters 2010 3(5) 291ndash303 Publisher Full Text
13 Margules CR Pressey RL Systematic conservation planning Nature 2000 405 243ndash253 Publisher Full Text
14 Egoh B Rouget M Reyers B et al Integrating ecosystem services into conservation assessments a review Ecol Econ 2007 63(4) 714ndash721 Publisher Full Text
15 Luck GW Chan KMA Fay JP et al Protecting ecosystem services and biodiversity in the worldrsquos watersheds Conservation Letters 2009 2(4) 179ndash188 Publisher Full Text
16 Cowling RM Egoh B Knight AT et al An operational model for mainstreaming ecosystem services for implementation Proc Natl Acad Sci U S A 2008 105(28) 9483ndash9488 PubMed Abstract | Publisher Full Text | Free Full Text
17 Chen X Lupi F Vintildea A et al Using cost-effective targeting to enhance the efficiency of conservation investments in payments for ecosystem services Conserv Biol 2010 24(6) 1469ndash1478 PubMed Abstract | Publisher Full Text
18 Wendland KJ Honzaacutek M Portela R et al Targeting and implementing payments for ecosystem services opportunities for bundling biodiversity conservation with carbon and water services in Madagascar Ecol Econ 2010 69(11) 2093ndash2107 Publisher Full Text
Page 13 of 16
F1000Research 2012 117 Last updated 31 OCT 2013
Page 13 of 16
F1000Research 2012 117 Last updated 09 SEP 2015
Sci 2005 360(1454) 425ndash441 PubMed Abstract | Publisher Full Text | Free Full Text
42 Balmford A Fisher B Green RE et al Bringing ecosystem services into the real world an operational framework for assessing the economic consequences of losing wild nature Environmental and Resource Economics 2011 48(2) 161ndash175 Publisher Full Text
43 Bohensky E Reyers B van Jaarsveld A et al Ecosystem services in the Gariep basin a component of the Southern African Millennium Ecosystem Assessment (SAfMA) Stellenbosch University Stellenbosch South Africa 2004 Reference Source
44 Gregory R Lichtenstein S Slovic P et al Valuing environmental resources a constructive approach J Risk Uncertain 1993 7(2) 177ndash197 Publisher Full Text
45 Sagoff M Aggregation and deliberation in valuing environmental public goods a look beyond contingent pricing Ecol Econ 1998 24(2ndash3) 213ndash230 Publisher Full Text
46 Fisher B Turner RK Burgess ND et al Measuring modeling and mapping ecosystem services in the Eastern Arc Mountains of Tanzania Progress is Physical Geography 2011 35(5) 595ndash611 Publisher Full Text
47 Coppolillo P Gomez H Maisels F et al Selection criteria for suites of landscape species as a basis for site-based conservation Biol Conserv 2004 115(3) 419ndash430 Publisher Full Text
48 Holland RA Eigenbrod F Armsworth PR et al Spatial covariation between freshwater and terrestrial ecosystem services Ecol Appl 2011 21(6) 2034ndash2048 PubMed Abstract | Publisher Full Text
49 Moilanen A Anderson BJ Eigenbrod F et al Balancing alternative land uses in conservation prioritization Ecol Appl 2011 21(xx) 1419ndash1426 PubMed Abstract | Publisher Full Text
50 Sanchez-Azofeifa GA Pfaff A Robalino JA et al Costa Ricarsquos payment for environmental services program intention implementation and impact Conserv Biol 2007 21(5) 1165ndash1173 PubMed Abstract | Publisher Full Text
51 Liu JG Li SX Ouyang ZY et al Ecological and socioeconomic effects of Chinarsquos policies for ecosystem services Proc Natl Acad Sci U S A 2008 105(28) 9477ndash9482 PubMed Abstract | Publisher Full Text | Free Full Text
52 Muntildeoz-Pintildea C Guevara A Torres JM et al Paying for the hydrological services of Mexicorsquos forests analysis negotiations and results Ecol Econ 2008 65(4) 725ndash736 Publisher Full Text
53 Bai Y Zhuang C Ouyang Z et al Spatial characteristics between biodiversity and ecosystem services in a human-dominated watershed Ecological Complexity 2011 8(2) 177ndash183 Publisher Full Text
54 Egoh B Reyers B Rouget M et al Spatial congruence between biodiversity and ecosystem services in South Africa Biol Conserv 2009 142(3) 553ndash562 Publisher Full Text
55 Reyers B OrsquoFarrell PJ Cowling RM et al Ecosystem services land-cover change and stakeholders finding a sustainable foothold for a semiarid biodiversity hotspot Ecology and Society 2009 14(1) 38 Reference Source
56 Guo Z Gan Y Ecosystem function for water retention and forest ecosystem conservation in a watershed of the Yangtze River Biodivers Conserv 2002 11(4) 599ndash614 Publisher Full Text
57 OrsquoFarrell PJ Reyers B Le Maitre DC et al Multi-functional landscapes in semi arid environments implications for biodiversity and ecosystem services Landscape Ecology 2010 25(8) 1231ndash1246 Publisher Full Text
58 Phua MH Minowa M A GIS-based multi-criteria decision making approach to forest conservation planning at a landscape scale a case study in the Kinabalu Area Sabah Malaysia Landsc Urban Plan 2005 71(2ndash4) 207ndash222 Publisher Full Text
59 Strassburg BBN Kelly A Balmford A et al Global congruence of carbon storage and biodiversity in terrestrial ecosystems Conservation Letters 2010 3(2) 98ndash105 Publisher Full Text
60 Turner WR Brandon K Brooks TM et al Global conservation of biodiversity and ecosystem services BioScience 2007 57(10) 868ndash873 Publisher Full Text
61 Venter O Laurance WF Iwamura WF et al Harnessing carbon payments to protect biodiversity Science 2009 326(5958) 1368 PubMed Abstract | Publisher Full Text
19 Guo ZW Xiao XM Li DM et al An assessment of ecosystem services water flow regulation and hydroelectric power production Ecol Appl 2000 10(3) 925ndash936 Publisher Full Text
20 Ricketts TH Tropical forest fragments enhance pollinator activity in nearby coffee crops Conserv Biol 2004 18(5) 1262ndash1271 Publisher Full Text
21 Bockstael NE Freeman AM Kopp RJ et al On measuring economic values for nature Environ Sci Technol 2000 34(8) 1384ndash1389 Publisher Full Text
22 Aldred J Incommensurability and monetary valuation Land Economics 2006 82(2) 141ndash161 Publisher Full Text
23 Turner RK Fisher B Environmental economics to the rich man the spoils Nature 2008 451(7182) 1067ndash1068 PubMed Abstract | Publisher Full Text
24 Egoh B Reyers B Rouget M et al Mapping ecosystem services for planning and management Agric Ecosyst Environ 2008 127(1ndash2) 135ndash140 Publisher Full Text
25 Barbier EB Koch EW Silliman BR et al Coastal ecosystem-based management with nonlinear ecological functions and values Science 2008 319(5861) 321ndash323 PubMed Abstract | Publisher Full Text
26 Naidoo R Balmford A Costanza R et al Global mapping of ecosystem services and conservation priorities Proc Natl Acad Sci U S A 2008 105(28) 9495ndash9500 PubMed Abstract | Publisher Full Text | Free Full Text
27 Klein CJ Ban NC Halpern BS et al Prioritizing land and sea conservation investments to protect coral reefs PLoS One 2010 5(8) e12431 PubMed Abstract | Publisher Full Text | Free Full Text
28 Nagendra H Incorporating landscape transformation into local conservation prioritization a case study in the Western Ghats India Biodivers Conserv 2001 10(3) 353ndash365 Publisher Full Text
29 Troy A Wilson MA Mapping ecosystem services practical challenges and opportunities in linking GIS and value transfer Ecol Econ 2006 60(2) 435ndash449 Publisher Full Text
30 Nelson E Mendoza G Regetz J et al Modeling multiple ecosystem services biodiversity conservation commodity production and tradeoffs at landscape scales Front Ecol Environ 2009 7(1) 4ndash11 Publisher Full Text
31 Rogers HM Glew L Honzak M et al Prioritizing key biodiversity areas in Madagascar by including data on human pressure and ecosystem services Landsc Urban Plan 2010 96(1) 48ndash56 Publisher Full Text
32 Naidoo R Balmford A Ferraro PJ et al Integrating economic costs into conservation planning Trends Ecol Evol 2006 21(12) 681ndash687 PubMed Abstract | Publisher Full Text
33 Ban NC Klein CJ Spatial socioeconomic data as a cost in systematic marine conservation planning Conservation Letters 2009 2(5) 206ndash215 Publisher Full Text
34 Naidoo R Ricketts TH Mapping the economic costs and benefits of conservation PLoS Biol 2006 4(11) e360 PubMed Abstract | Publisher Full Text | Free Full Text
35 Adams V Pressey R Naidoo R et al Opportunity costs who really pays for conservation Biol Conserv 2010 143(2) 439ndash448 Publisher Full Text
36 Pagiola S Bishop J Landell-Mills N (eds) et al Selling forest environmental services market-based mechanisms for conservation and development Earthscan London 2002 299 Reference Source
37 Kinzig AP Perrings C Chapin FS III et al Sustainability Paying for ecosystem servicesndashpromise and peril Science 2011 334(6056) 603ndash604 PubMed Abstract | Publisher Full Text
38 Carwardine J Klein CJ Wilson KA et al Hitting the target and missing the point target-based conservation planning in context Conservation Letters 2009 2(1) 4ndash11 Publisher Full Text
39 Chan KMA Shaw MR Cameron DR et al Conservation planning for ecosystem services PLoS Biol 2006 4(11) e379 PubMed Abstract | Publisher Full Text | Free Full Text
40 Egoh BN Reyers B Rouget M et al Identifying priority areas for ecosystem service management in South African grasslands J Environ Manage 2011 92(6) 1642ndash1650 PubMed Abstract | Publisher Full Text
41 Van Jaarsveld AS Biggs R Scholes RJ et al Measuring conditions and trends in ecosystem services at multiple scales the Southern African Millennium Ecosystem Assessment (SAfMA) experience Philos Trans R Soc Lond B Biol
Page 14 of 16
F1000Research 2012 117 Last updated 31 OCT 2013
Page 14 of 16
F1000Research 2012 117 Last updated 09 SEP 2015
F1000Research
Open Peer Review
Current Referee Status
Version 1
04 October 2012Referee Report
doi105256f1000research119r307
David NortonCollege of Engineering University of Canterbury Christchurch New Zealand
This is an interesting article that provides a conceptual framework for prioritizing areas for protectingecosystem services (ES) such as water provision
The article explores similarities and differences between ES prioritization and biodiversity prioritizationand highlights several key components that need to be considered in prioritizing areas for protecting ESTwo key components are the need to consider the costs of protecting areas and the importance ofconsidering human-derived alternatives The conceptual framework is then applied to a case study basedon water provision
I have read this submission I believe that I have an appropriate level of expertise to confirm thatit is of an acceptable scientific standard
No competing interests were disclosedCompeting Interests
29 September 2012Referee Report
doi105256f1000research119r306
Elena BennettNatural Resource Sciences and the McGill School of the Environment McGill University SteAnne-de-Bellevue Canada
This work presents an interesting conceptual framework that researchers as well as governments or otherstakeholders could use to identify priority areas for protecting ecosystem services
The authors suggest the following key elements (1) determine the services of interest (2) quantify thedemand for the service(s) and capacity of the ecosystem to meet demand through supply of the service(3) identify the threats and level of threat and (4) estimate the cost of protecting the service as well as anyalternative means of providing the service The authors then review the literature in which priorities havebeen assessed and identify which steps have been taken and which not in each study or effort I hope thispaper will increase our attention to key aspects of ES assessment that are often ignored especially theinteraction among all of these key factors
I have read this submission I believe that I have an appropriate level of expertise to confirm that
Page 15 of 16
F1000Research 2012 117 Last updated 09 SEP 2015
F1000Research
I have read this submission I believe that I have an appropriate level of expertise to confirm thatit is of an acceptable scientific standard
No competing interests were disclosedCompeting Interests
Page 16 of 16
F1000Research 2012 117 Last updated 09 SEP 2015
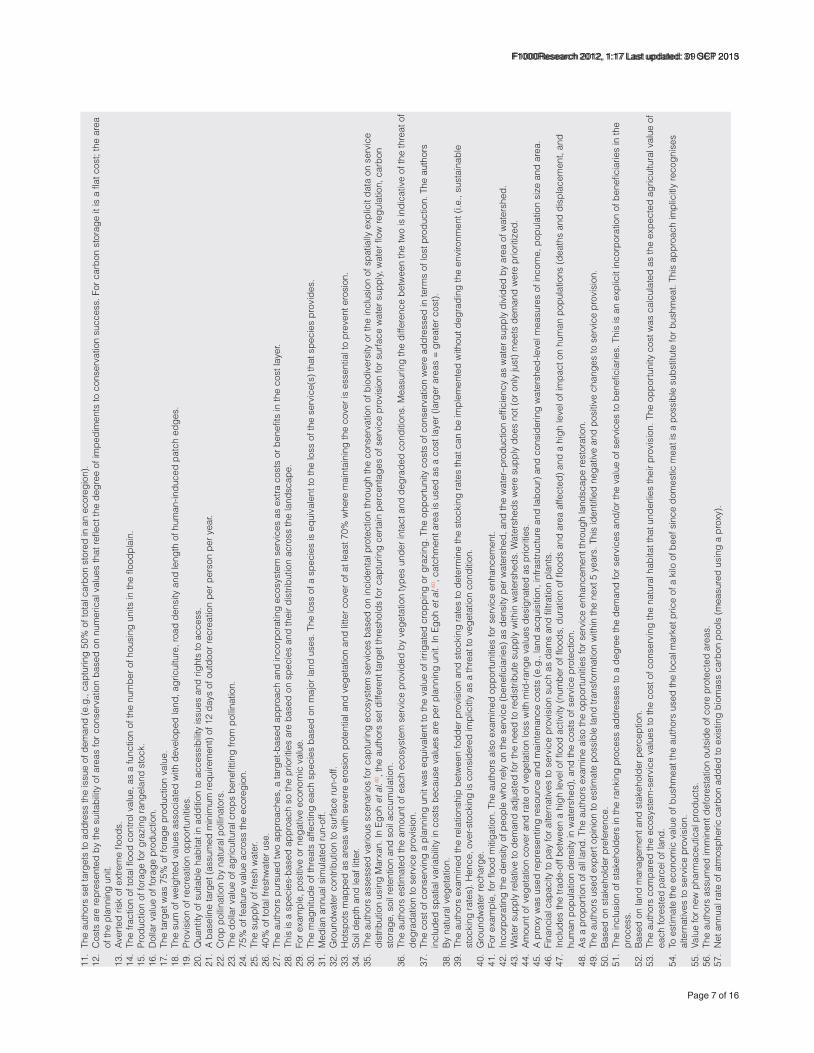
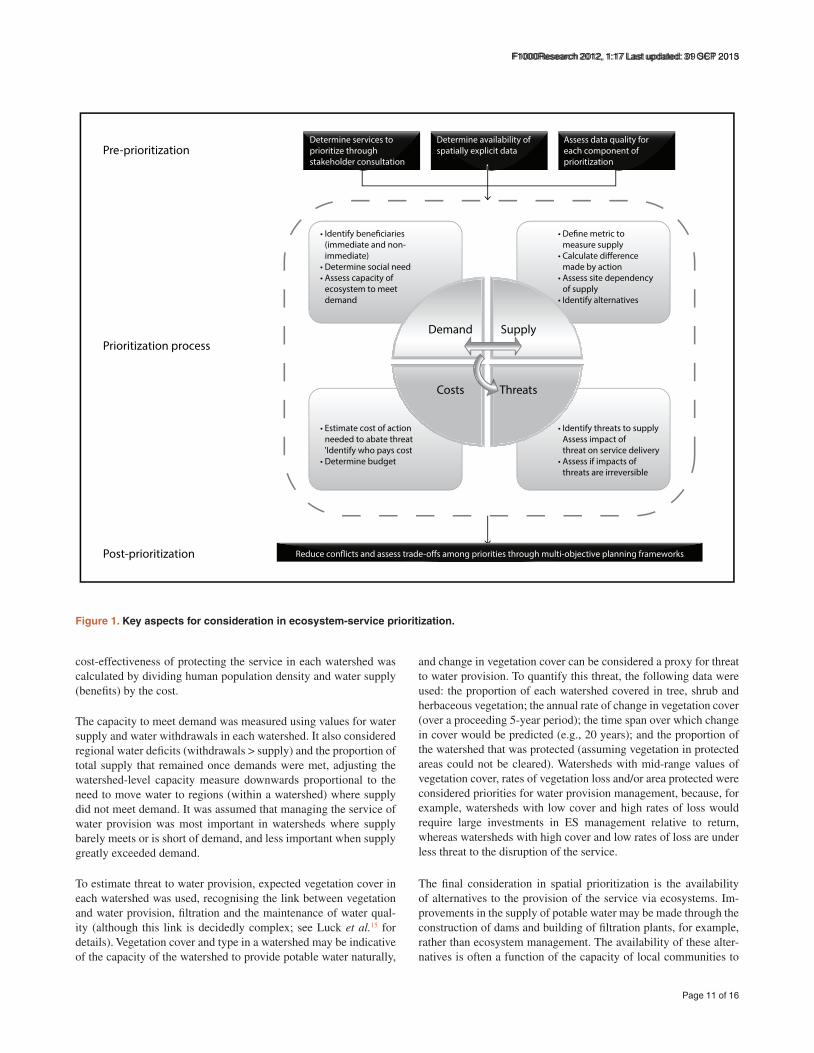

F1000Research
I have read this submission I believe that I have an appropriate level of expertise to confirm thatit is of an acceptable scientific standard
No competing interests were disclosedCompeting Interests
Page 16 of 16
F1000Research 2012 117 Last updated 09 SEP 2015
Related Documents