IDENTIFYING SOURCES OF OCEAN PLASTICS: A methodology for supply chains ABSTRACT Recent research estimates that an average of 8 million metric tons of plastic materials enter the worlds’ oceans annually, increasing at the rate of 7% per year as of 2015. Ocean plastic is a global environmental concern due to micro-fracturing and the subsequent harmful effect these particles have on sea life. Approximately 80% of the ocean plastic starts its journey on land with resultant deleterious effects in drainage areas, riverine environments and estuaries along the way. Jenna Jambeck, PhD, Associate Professor of Environmental Engineering, University of Georgia and Kara Lavender Law, PhD, Research Professor of Oceanography estimate if current trends continue there will be more plastic than fish in the ocean by 2050. This paper uses parameters based on two 2016 Dell expeditions to Port-au-Prince, Haiti to study the causes of ocean plastic and to understand the supply chain segments of small- scale plastic recycling infrastructure. Subsequent GIS mapping of economic, population, and geographic data, coupled with satellite imagery, indicated that most Port-au-Prince plastic collection facilities are located within walking distance from a river, within 50 km of a seaport, and usually established within densely populated urban areas. There are two main drivers that compelled Dell to focus additional attention on Southeast Asia: the current existence of a portion of Dell’s supply chain network in the area and the fact that over 60% of ocean plastics originates in Southeast Asia. Using the same criteria and approach as the Haiti study, we developed GIS maps to locate the highest concentrations of land-based ocean plastics in China, India, Indonesia, The Philippines and Vietnam. This led to identifying more than 100 ocean plastics waste accumulation sites. Results indicate that the top urban coastal locations with high plastic concentrations (Port- au-Prince, Haiti; Chennai, India; and Manila, The Philippines), if viewed as a supply chain network, can provide substantial ocean plastics materials each day. Collecting ocean plastics at the earliest stages in these coastal metropolitan areas just after being discarded but before micro-fracturing and excessive degradation offers the best chance at slowing, and possibly reducing, the environmental damage done to the world’s oceans, rivers and estuaries. It also represents the most commercially viable solution for creating an ocean plastics supply chain. Oliver Campbell, Adam Bushong, Drew Gartman, Saanya Bhargava February, 2017

Welcome message from author
This document is posted to help you gain knowledge. Please leave a comment to let me know what you think about it! Share it to your friends and learn new things together.
Transcript
IDENTIFYING SOURCES OF OCEAN PLASTICS: A methodology for supply chains
ABSTRACT Recent research estimates that an average of 8 million metric tons of plastic materials enter the worlds’ oceans annually, increasing at the rate of 7% per year as of 2015. Ocean plastic is a global environmental concern due to micro-fracturing and the subsequent harmful effect these particles have on sea life. Approximately 80% of the ocean plastic starts its journey on land with resultant deleterious effects in drainage areas, riverine environments and estuaries along the way. Jenna Jambeck, PhD, Associate Professor of Environmental Engineering, University of Georgia and Kara Lavender Law, PhD, Research Professor of Oceanography estimate if current trends continue there will be more plastic than fish in the ocean by 2050.
This paper uses parameters based on two 2016 Dell expeditions to Port-au-Prince, Haiti to study the causes of ocean plastic and to understand the supply chain segments of small-scale plastic recycling infrastructure. Subsequent GIS mapping of economic, population, and geographic data, coupled with satellite imagery, indicated that most Port-au-Prince plastic collection facilities are located within walking distance from a river, within 50 km of a seaport, and usually established within densely populated urban areas.
There are two main drivers that compelled Dell to focus additional attention on Southeast Asia: the current existence of a portion of Dell’s supply chain network in the area and the fact that over 60% of ocean plastics originates in Southeast Asia. Using the same criteria and approach as the Haiti study, we developed GIS maps to locate the highest concentrations of land-based ocean plastics in China, India, Indonesia, The Philippines and Vietnam. This led to identifying more than 100 ocean plastics waste accumulation sites.
Results indicate that the top urban coastal locations with high plastic concentrations (Port-au-Prince, Haiti; Chennai, India; and Manila, The Philippines), if viewed as a supply chain network, can provide substantial ocean plastics materials each day. Collecting ocean plastics at the earliest stages in these coastal metropolitan areas just after being discarded but before micro-fracturing and excessive degradation offers the best chance at slowing, and possibly reducing, the environmental damage done to the world’s oceans, rivers and estuaries. It also represents the most commercially viable solution for creating an ocean plastics supply chain.
Oliver Campbell, Adam Bushong, Drew Gartman, Saanya Bhargava February, 2017
2
TABLE OF CONTENTS
INTRODUCTION ........................................................................................................................3 Ocean Plastics Defined ..................................................................................................................... 3
Micro-fracturing ................................................................................................................................. 3
Sense of Urgency .............................................................................................................................. 3
Current “Mining” strategies to collect Ocean Plastics on land ........................................................... 4
Purpose of this Research .................................................................................................................. 4
MATERIALS AND METHODS ...................................................................................................6 Establishing Haiti Baseline GIS Map ................................................................................................. 6
Geographical Distance ............................................................................................................... 6 Population Density ..................................................................................................................... 6
GIS MAP AND DATA RESULTS ...............................................................................................8
CONCLUSION ........................................................................................................................ 10
LITERATURE CITED .............................................................................................................. 16
3
INTRODUCTION
Ocean Plastics Defined
Ocean plastics come in two main forms. Approximately 20% emanates from ocean-based sources such as fisheries and fishing vessels. The remaining 80% originates from land-based sources, of which 75% comes from litter and uncollected waste. This is plastic waste that is discarded on the ground due to a lack of sanitation or waste collection infrastructure. It washes directly into the sea via rivers or drainage ways and may also be dumped directly into the ocean. The remaining 25% of the land-based sources is plastic which “escapes” from existing recycling or waste infrastructure and becomes ocean bound. For land-based sources of ocean plastics, the geographic inclusion zone is defined as within 50 km of the seashore (Jambeck).
Micro-fracturing
The discarded plastic is subjected to numerous physical stressors, over a short period of time, as it progresses from land to a waterway and out to the ocean. Prolonged exposure to sunlight, temperature variations, wave action, and saltwater can degrade the chemical and mechanical characteristics of the plastic through oxidation and micro-fracturing. The “macro-plastic” polymers fracture into successively smaller “micro-plastics” and disperse over an ever larger area of ocean through the action of currents. Further complicating matters, ocean plastic materials can sink to varying depths based on the density of the specific material within a given column of ocean water, greatly increasing the harm to the aquatic environment and substantially increasing the total volume of ocean impacted. The result is the collection of ocean plastics, once in the ocean, becomes increasing difficult as the material deteriorates and becomes more dispersed. Identifying the most commercially promising land-based ocean plastics locations is the focus of this paper.
Sense of Urgency
The concern with the extraordinary volume of plastics reaching the oceans and the increasing levels of plastic toxicity in the food chain are primary drivers for finding economically and environmentally sound solutions to reducing ocean plastics. Small plastic pieces can be ingested by birds and other animals. Perhaps more troubling, micro-fractured plastics have now been found in plankton (Eco-watch 2015). As plastic is consumed by these organisms and travels up the food chain, the plastic becomes concentrated in the fatty tissue with an increasing effect of toxicity. The damage is not just confined to the marine habitats, though: along plastic’s journey from land to waterway to the ocean, there are many opportunities to cause environmental harm. Discarded bottles can collect water and become breeding grounds for mosquitos – increasing the spread of vector-borne diseases like malaria, dengue and the Zika virus among others.
The types of plastic found in the ocean includes a wide variety and range of plastics. Sadly, the ocean has become a supermarket of plastic. LDPE plastic bags, polypropylene, PET, HDPE, Styrofoam, and Nylon are some of the most common. While this diversity of plastic, as it were, is harmful in multiple ways to the ocean environment, it also points to the paradoxical advantage of creating more product use applications if incorporated into a commercially viable supply chain. Such a solution is of interest to a wide variety of producers; additionally, collection and recycling facilities would lessen risk by reducing the reliance on any one material.
Annual production of plastic has been increasing since 1970, with a large portion of these materials consumed by the packaging industry (Cressey, 2016). The advantageous mechanical, design, cost and manufacturing qualities of plastic has driven its adoption into nearly every industry. Particularly germane to land-based sources of ocean plastic is the use of plastic in both the consumer packaged goods and the food and beverage industries. These products are purchased frequently (in some cases daily if potable water is only available in bottles or packets) in economically impoverished coastal areas where there is little or no waste infrastructure or recycling established. This leads to discarded bottles and packaging quickly winding up in the ocean.
In recent years, annual plastic production has peaked at approximately 300 million metric tons (Cressey, 2016). Research indicates that 1.4% to 2.5% of annual plastic production ultimately ends up in the world’ oceans. That rate correlates to an
4
estimated 8 million metric tons of plastic being added to the estimated 86 million metric tons currently in open ocean waters, coastal areas, on the sea floor and on the shoreline (Jambeck, 2015) (Jang et. al, 2015) (Gourmelon, 2015). If the current trajectory of plastics entering the ocean continues, the amount of ocean plastic could double in quantity over the next ten years (Chen, 2016) (Jambeck, 2015). Further, if current trends continue unabated, the amount of plastic in the ocean will exceed that of fish by 2050 (Jambeck and Law, 2016).
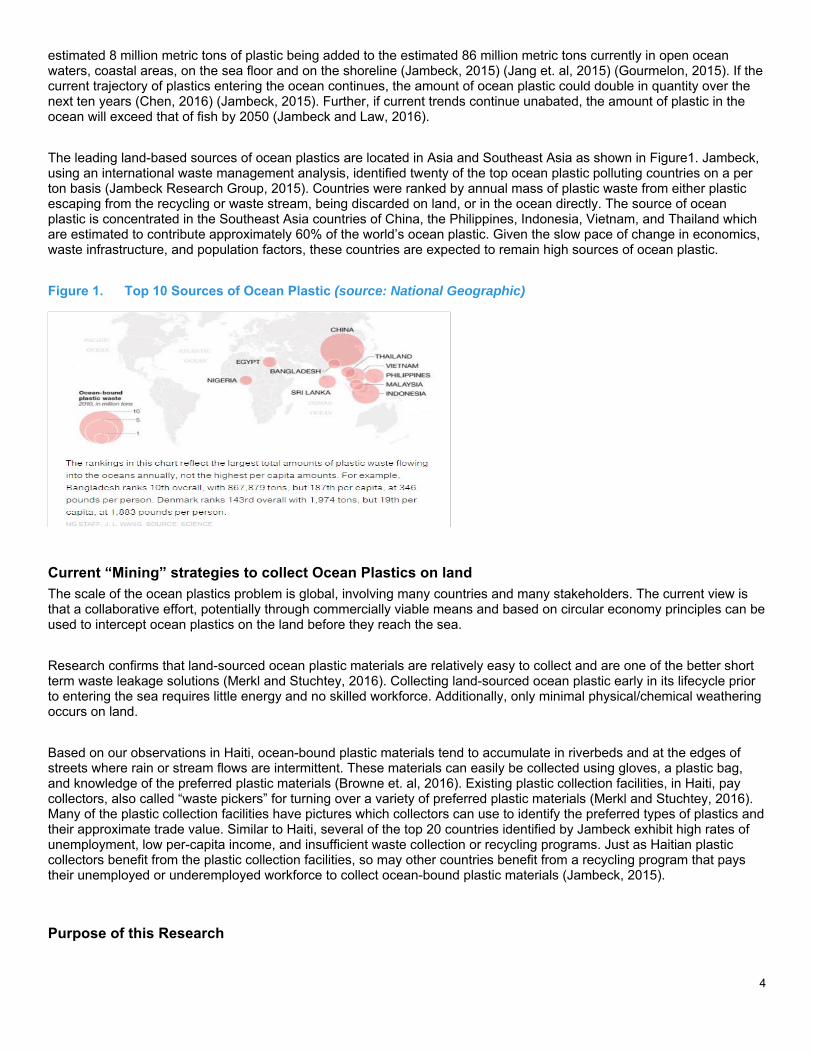
The leading land-based sources of ocean plastics are located in Asia and Southeast Asia as shown in Figure1. Jambeck, using an international waste management analysis, identified twenty of the top ocean plastic polluting countries on a per ton basis (Jambeck Research Group, 2015). Countries were ranked by annual mass of plastic waste from either plastic escaping from the recycling or waste stream, being discarded on land, or in the ocean directly. The source of ocean plastic is concentrated in the Southeast Asia countries of China, the Philippines, Indonesia, Vietnam, and Thailand which are estimated to contribute approximately 60% of the world’s ocean plastic. Given the slow pace of change in economics, waste infrastructure, and population factors, these countries are expected to remain high sources of ocean plastic.
Figure 1. Top 10 Sources of Ocean Plastic (source: National Geographic)
Current “Mining” strategies to collect Ocean Plastics on land
The scale of the ocean plastics problem is global, involving many countries and many stakeholders. The current view is that a collaborative effort, potentially through commercially viable means and based on circular economy principles can be used to intercept ocean plastics on the land before they reach the sea.
Research confirms that land-sourced ocean plastic materials are relatively easy to collect and are one of the better short term waste leakage solutions (Merkl and Stuchtey, 2016). Collecting land-sourced ocean plastic early in its lifecycle prior to entering the sea requires little energy and no skilled workforce. Additionally, only minimal physical/chemical weathering occurs on land.
Based on our observations in Haiti, ocean-bound plastic materials tend to accumulate in riverbeds and at the edges of streets where rain or stream flows are intermittent. These materials can easily be collected using gloves, a plastic bag, and knowledge of the preferred plastic materials (Browne et. al, 2016). Existing plastic collection facilities, in Haiti, pay collectors, also called “waste pickers” for turning over a variety of preferred plastic materials (Merkl and Stuchtey, 2016). Many of the plastic collection facilities have pictures which collectors can use to identify the preferred types of plastics and their approximate trade value. Similar to Haiti, several of the top 20 countries identified by Jambeck exhibit high rates of unemployment, low per-capita income, and insufficient waste collection or recycling programs. Just as Haitian plastic collectors benefit from the plastic collection facilities, so may other countries benefit from a recycling program that pays their unemployed or underemployed workforce to collect ocean-bound plastic materials (Jambeck, 2015).
Purpose of this Research

5
The main goal of this research is to determine what sites, among the countries identified by Jambeck in Southeast Asia, are the most promising in terms of available material quantity. Characterizing the potential material quantity accurately is crucial for making the right investments in the right places when creating an efficient supply chain. Factors of an efficient supply chain include continuity of supply, proximity to transportation logistics, economic and social conditions conducive to picking plastic, and sufficient availability of material to encourage other users to invest.
In this research, the current conditions of Port-au-Prince, Haiti were used as a baseline to understand how plastic materials accumulate on land and in water ways. Haiti was selected for its proximity to Dell offices in North America and the fact there was an existing rudimentary plastic collection infrastructure. The Haiti baseline of geographic, economic, and population factors was then used to determine if similar conditions exist in other countries, especially those within Southeast Asia listed in Jambeck’s top 20. This data was then used to establish a list of potential sites from which to stand up a commercially viable ocean plastics supply chain. The subsequent step, which is not part of this paper, is to visit and evaluate those sites for social, governmental, and infrastructural factors, material quantities, and project costs in order to confirm the most promising sites.

6
Materials and Methods
Establishing Haiti Baseline GIS Map
The first step in the establishing the Haitian baseline was to map the location of commercial collection facilities compared to population density and adjacency to several points of interest, including rivers, seaports, and major cities. These parameters were used to develop criteria for identifying potential plastic collection sites in other countries.
The Haitian baseline analysis was completed using the open-sourced Quantum Geographic Information System (QGIS) version 2.14, with supplemental data gathered from the following sources:
http://www.mapcruzin.com/ (administrative boundaries, points of interest, and river layers)
http://www.geocomm.com/ (administrative boundaries, and river layers)
http://www.census.gov/population/international/data/mapping/demobase.html (population, and land area layers)
http://www.gadm.org/ (administrative boundary layers)
https://www.google.com/earth/ (seaport layers, and satellite imagery for remote sensing)
Developing QGIS Area of Interest Maps for Haiti
Geographical Distance The following criteria provided preliminary results from the analysis conducted in Haiti and were then used to locate potential plastic collection site locations in China, India, Indonesia, The Philippines, and Vietnam. The most important factors determined by this baseline analysis are the maximum, mean and minimum distance from existing collection sites to rivers. Results from the QGIS vector analysis tool “sum line lengths” indicate an average distance of 0.08 km, and a maximum distance of 0.26 km from collection facility to a waterway.
Population Density The next criteria analyzed was the relationship between population density and collection facilities. Results indicate that most of the collection facilities (23 of 27) exist in locations with higher-than-average population density – in excess of 500 people per square kilometer (people/ km2). More than half (15 of 27) of these collection facilities in the Haitian baseline exist in the highest population density region of Port-au-Prince, with population densities greater than 25,000 people/ km2.
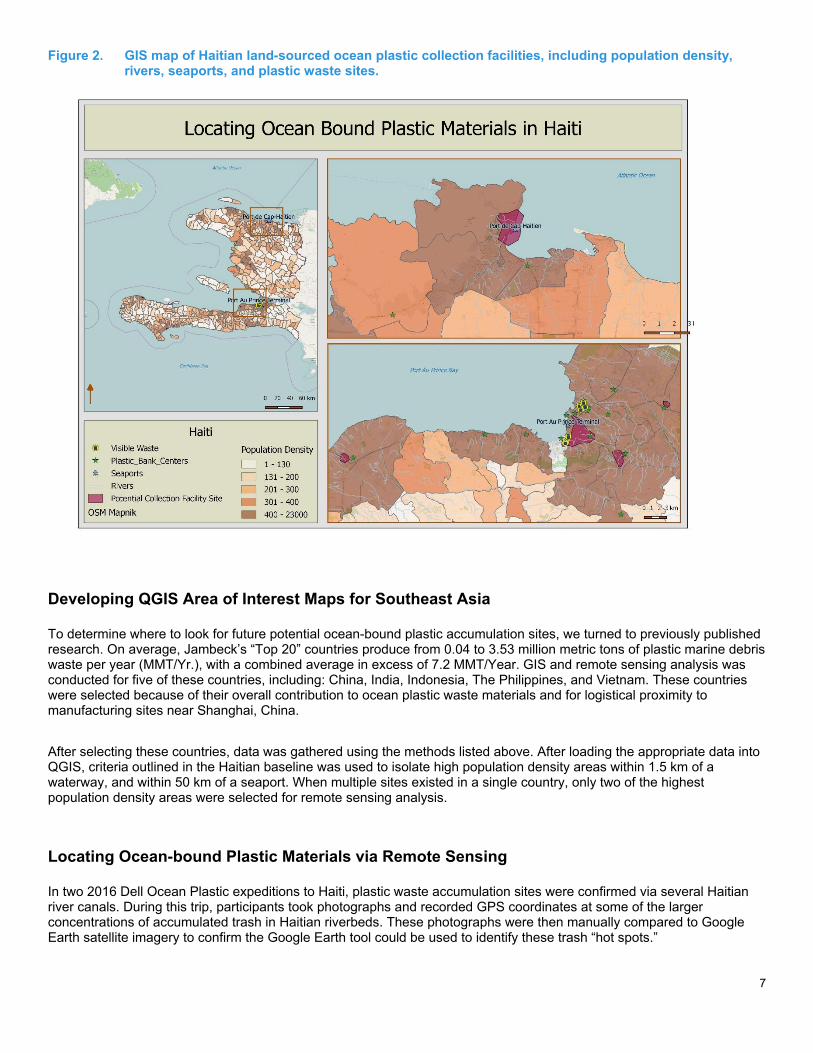
Figure 2 shows the locations of existing Haitian collection facilities (green stars), rivers (blue lines), ocean-bound trash accumulation sites (yellow trash cans), and areas of high population density (red polygons). Most of the collection facilities (22 of 27) were located within 50 kilometers of a seaport; only five of these facilities were farther than 50 kilometers (km) from a seaport. On average, the visible waste accumulation sites were about 370 meters from a collection facility, with a maximum average distance of about 1,500 meters. Finally, 20 of 27 plastic collection facilities were located less than 6 km from high population density areas. These high population density polygons will be later referred to as potential plastic facility site polygons during the analysis outside of Haiti.
This base-line analysis provides criteria used to determine the relationship between land-sourced ocean plastic waste accumulation sites and plastic collection facilities, population density, and geographical conditions currently found in Haiti.
7
Figure 2. GIS map of Haitian land-sourced ocean plastic collection facilities, including population density, rivers, seaports, and plastic waste sites.
Developing QGIS Area of Interest Maps for Southeast Asia
To determine where to look for future potential ocean-bound plastic accumulation sites, we turned to previously published research. On average, Jambeck’s “Top 20” countries produce from 0.04 to 3.53 million metric tons of plastic marine debris waste per year (MMT/Yr.), with a combined average in excess of 7.2 MMT/Year. GIS and remote sensing analysis was conducted for five of these countries, including: China, India, Indonesia, The Philippines, and Vietnam. These countries were selected because of their overall contribution to ocean plastic waste materials and for logistical proximity to manufacturing sites near Shanghai, China.
After selecting these countries, data was gathered using the methods listed above. After loading the appropriate data into QGIS, criteria outlined in the Haitian baseline was used to isolate high population density areas within 1.5 km of a waterway, and within 50 km of a seaport. When multiple sites existed in a single country, only two of the highest population density areas were selected for remote sensing analysis.
Locating Ocean-bound Plastic Materials via Remote Sensing
In two 2016 Dell Ocean Plastic expeditions to Haiti, plastic waste accumulation sites were confirmed via several Haitian river canals. During this trip, participants took photographs and recorded GPS coordinates at some of the larger concentrations of accumulated trash in Haitian riverbeds. These photographs were then manually compared to Google Earth satellite imagery to confirm the Google Earth tool could be used to identify these trash “hot spots.”

8
This process of searching for trash accumulation sites required manual effort and large quantities of time, so we completed a land cover and land change analysis within QGIS version 2.8 using the “Semi-Automatic Classification Plugin (SCP).” This software allows a user to assign a known land cover type (Grass, Trees, Soil, Water, and “Trash”) to a location within a satellite image. After samples of each cover type were allocated, an automatic classification was completed throughout the remaining image. Imagery was selected using Sentinel 2 and Landsat imagery between 2015 and 2016. Unfortunately, even the known Haitian trash accumulation sites were consistently coded as either soil or concrete.
Since SCP results were unsatisfactory, we reverted back to using Google Earth to manually scan for large, easily visible waste accumulation sites within riverbeds and along roads. Researchers then identified the potential collection facility site polygons by visually examining and interpreting waste accumulation sites using GIS maps and the Google Earth place mark tool.
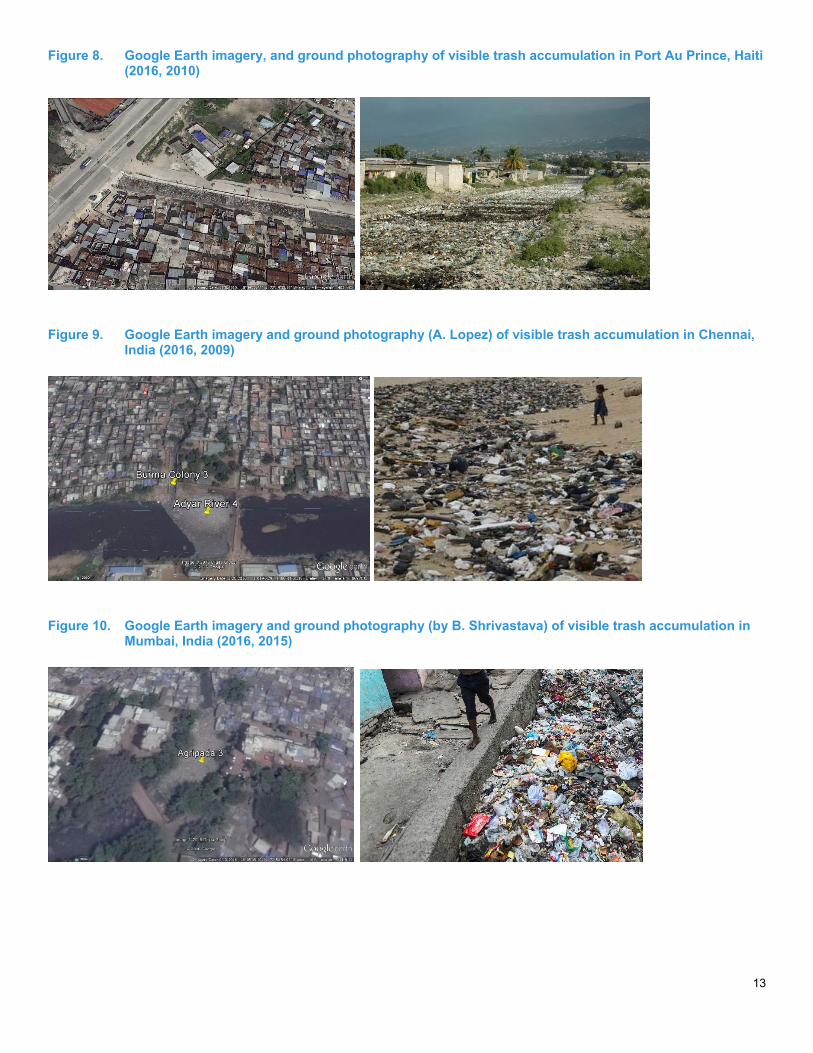
The imagery analysis of these waste accumulation sites appear in Google Earth with a unique bumpy, grainy look, which occasionally resembled white and grey rocks. These photographs, uploaded into Google Earth, were analyzed whenever possible to help differentiate between rocks and trash (Figures 8, 9, 10, & 11). In most cases, ground photography confirmed that trash hot spots did exist in the areas identified as waste accumulation sites. In only a few scenarios, there were no ground photographs available to validate the potential waste accumulation sites, so these locations were omitted. After scanning all areas of interest, researchers exported all marked locations from Google Earth and imported them into the corresponding QGIS maps.
Gathering Statistical Data for Plastic and Workforce Supply Analysis
Several sources were used to calculate the supply of plastic materials selected in top waste accumulating countries. Population density data was calculated using basic statistical analysis in QGIS. These metrics were cross-compared to each countries’ census data to ensure numbers were similar. Unemployment rates were collected from each country’s most recent census data and compared to the particular countries’ Wiki page if the census had not been completed within the last five years.
Values for the count and length of rivers and waterways found within densely populated potential collection facility sites were gathered using the “sum to line” tool and basic statistics function in QGIS.
The plastic supply estimates were calculated by multiplying all of the values from the solid waste generation columns, found in Table 2, using the following formula:
(TONS/DAY) * (% PLASTIC /100) * (100 – % COLLECTED)
Solid waste generation data were collected from Hoornweg’s and Bhada-Tata’s 2012 research. However, several of the actual percent collection rates and percent plastic rates needed for complete analysis were not available. These missing rates were estimated using the average rates across all countries in that 2012 research and are highlighted in Table 2.
GIS Map and Data Results In developing a commercially viable ocean plastic supply chain, the ability to locate sites with the highest concentration of land-sourced ocean plastic offers the best initial chance of commercial success combined with the best effect to slow the flow of plastic into the oceans. Commercial viability depends on the ability to scale volume, maintain continuity of supply, and attract investment.
Based on the factors described earlier (population density, number of waterways, coastal proximity, waste generation, and proximity to seaports), Manila in the Philippines is the leading candidate for collecting land-sourced ocean plastic in Southeast Asia. The population density of Manila is 43,600 people / sq km – nearly 60 times the rest of the country
9
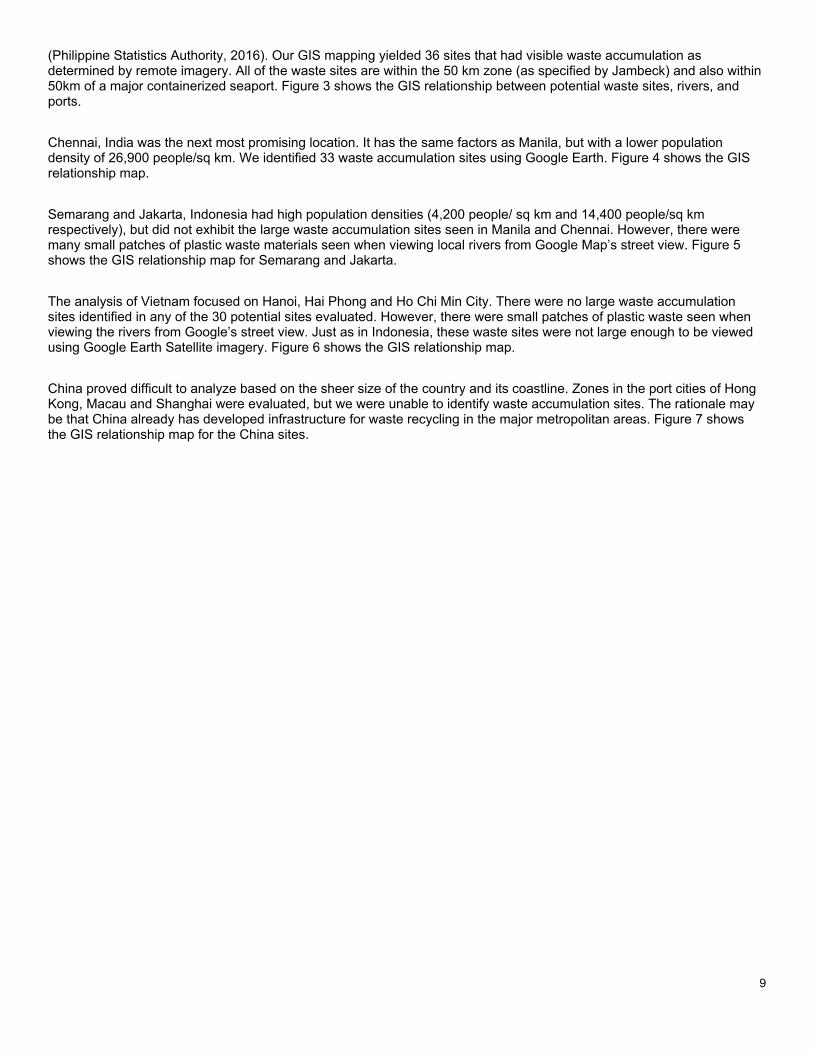
(Philippine Statistics Authority, 2016). Our GIS mapping yielded 36 sites that had visible waste accumulation as determined by remote imagery. All of the waste sites are within the 50 km zone (as specified by Jambeck) and also within 50km of a major containerized seaport. Figure 3 shows the GIS relationship between potential waste sites, rivers, and ports.
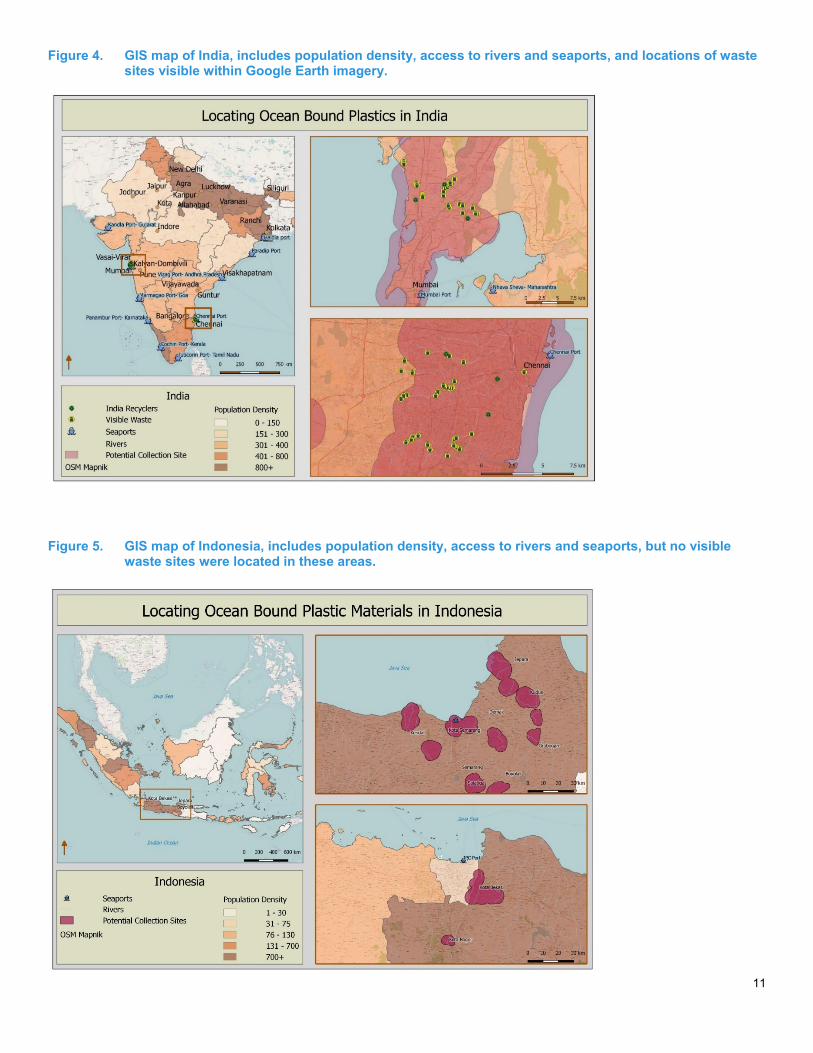
Chennai, India was the next most promising location. It has the same factors as Manila, but with a lower population density of 26,900 people/sq km. We identified 33 waste accumulation sites using Google Earth. Figure 4 shows the GIS relationship map.
Semarang and Jakarta, Indonesia had high population densities (4,200 people/ sq km and 14,400 people/sq km respectively), but did not exhibit the large waste accumulation sites seen in Manila and Chennai. However, there were many small patches of plastic waste materials seen when viewing local rivers from Google Map’s street view. Figure 5 shows the GIS relationship map for Semarang and Jakarta.
The analysis of Vietnam focused on Hanoi, Hai Phong and Ho Chi Min City. There were no large waste accumulation sites identified in any of the 30 potential sites evaluated. However, there were small patches of plastic waste seen when viewing the rivers from Google’s street view. Just as in Indonesia, these waste sites were not large enough to be viewed using Google Earth Satellite imagery. Figure 6 shows the GIS relationship map.
China proved difficult to analyze based on the sheer size of the country and its coastline. Zones in the port cities of Hong Kong, Macau and Shanghai were evaluated, but we were unable to identify waste accumulation sites. The rationale may be that China already has developed infrastructure for waste recycling in the major metropolitan areas. Figure 7 shows the GIS relationship map for the China sites.
10
Conclusion The analysis indicated that, based on the existing ocean plastic supply chain in Haiti, similar conditions exist in India and The Philippines. Together there are over 100 waste accumulation sites visibly identified among these three countries. These locations should serve as the first-tier targets for developing a land-based ocean plastics supply chain.
Meanwhile, several smaller plastic debris locations were identified in Indonesia and Vietnam. These smaller plastic debris areas were not visible from satellite imagery, but were visible using ground photography posted to Google Earth.
The results from China, Indonesia and Vietnam were unexpected. On a country basis, they are near the top contributors to land-sourced ocean plastic, but they did not exhibit the same visible accumulation found in Haiti, India and The Philippines. Our data suggests two possible reasons: first, in the metropolitan areas of China we studied, there may already be substantial recycling occurring; second, the relatively lower population densities in Indonesia and Vietnam might not correlate as closely to the high concentrations of land-sourced ocean plastics despite having high country totals.
This does not mean these types of sites are not commercially viable – they just may not be the first choice, based upon material availability, when constructing an ocean plastic supply chain oriented toward large-scale usage. In this sense, there are parallels to the strategies employed for the urban mining of other waste resources.
Our next step for the summer of 2017 is to make expeditionary visits to India, Indonesia and The Philippines to validate on-the-ground findings presented in this paper.
Figure 3. GIS map of The Philippines that includes population density, access to rivers and seaports, and locations of waste sites visible with Google Earth imagery.
11
Figure 4. GIS map of India, includes population density, access to rivers and seaports, and locations of waste sites visible within Google Earth imagery.
Figure 5. GIS map of Indonesia, includes population density, access to rivers and seaports, but no visible
waste sites were located in these areas.

12
Figure 6. GIS map of Vietnam, includes population density, access to rivers and seaports, but no visible waste sites were located in these areas.
Figure 7. GIS map of China, includes population density, access to rivers and seaports, but no visible waste sites were located in these areas.
13
Figure 8. Google Earth imagery, and ground photography of visible trash accumulation in Port Au Prince, Haiti (2016, 2010)
Figure 9. Google Earth imagery and ground photography (A. Lopez) of visible trash accumulation in Chennai,
India (2016, 2009)
Figure 10. Google Earth imagery and ground photography (by B. Shrivastava) of visible trash accumulation in Mumbai, India (2016, 2015)
14
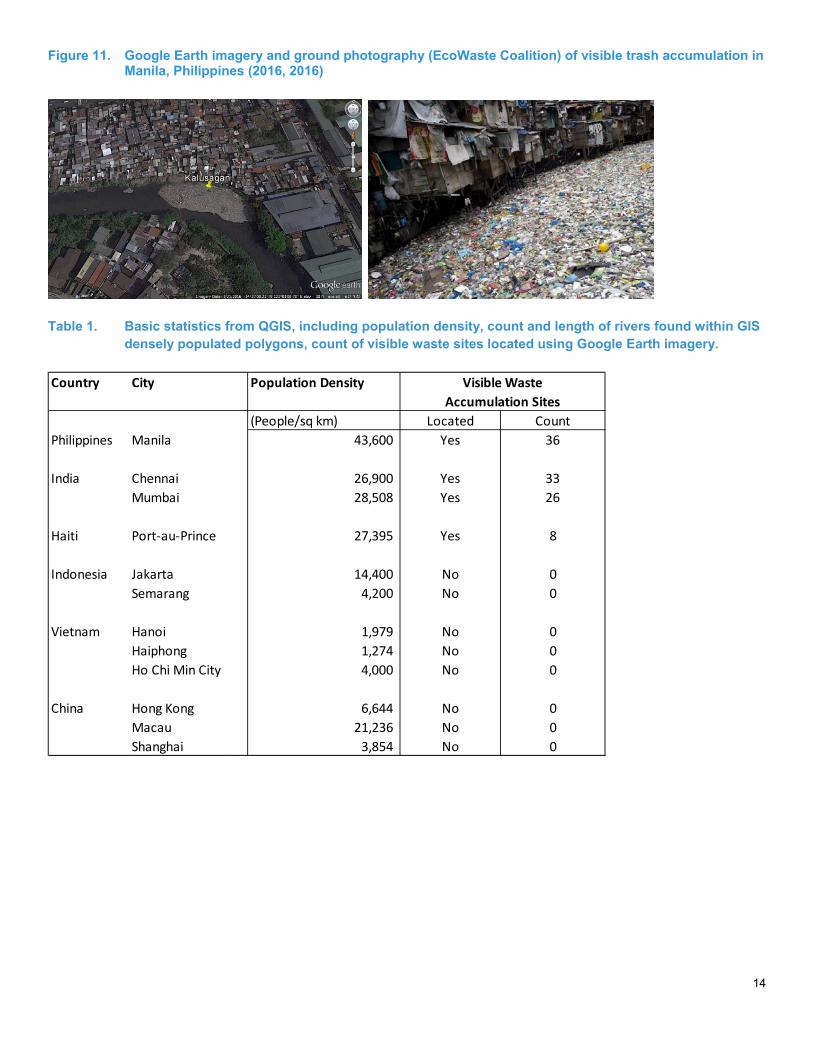
Figure 11. Google Earth imagery and ground photography (EcoWaste Coalition) of visible trash accumulation in Manila, Philippines (2016, 2016)
Table 1. Basic statistics from QGIS, including population density, count and length of rivers found within GIS
densely populated polygons, count of visible waste sites located using Google Earth imagery.
Country City Population Density
(People/sq km) Located Count
Philippines Manila 43,600 Yes 36
India Chennai 26,900 Yes 33
Mumbai 28,508 Yes 26
Haiti Port‐au‐Prince 27,395 Yes 8
Indonesia Jakarta 14,400 No 0
Semarang 4,200 No 0
Vietnam Hanoi 1,979 No 0
Haiphong 1,274 No 0
Ho Chi Min City 4,000 No 0
China Hong Kong 6,644 No 0
Macau 21,236 No 0
Shanghai 3,854 No 0
Visible Waste
Accumulation Sites

15
Table 2. Additional data from cited literature including average unemployment rates per country, solid waste production and collection averages, percent plastic concentration, and the estimated plastic supply based on these materials.
Supplemental Materials
Table 3. GPS latitude and longitude coordinates of all waste accumulation sites located using Google Earth Imagery, by country and province. QGIS name refers to names of sites used in QGIS to uniquely identify a waste accumulation site.
UnemploymentPlastic Supply -
Estimates
Country Avg % Tons/Day % Collected % Plastic Tons/Day
China 3.3% 520,548 100** 24** 0
Haiti 40.6% 3,233 11 10**** 288
India 4.9% 109,589 81*** 2 416
Indonesia 5.9% 61,644 80 10 1,233
Philippines 5.4% 29,315 81*** 14 780
Vietnam 2.1% 35,068 81*** 16 1,066
* Data comes from"What a Waste…" article by Ross and Rogoff (2012)
** China results only reflect Macao and Hong Kong
*** Average collection rate across all 85 countries = 81%
**** Average percent of MSW across across all 85 countries = 10%
Solid Waste Generation*
QGIS Name Latitude Longitude Country Province QGIS Name Latitude Longitude CountryProvince QGIS Name Latitude Longitude Country Province
Adyar 5 13.02734984 80.19313771 India Chennai Agripada 1 19.086676 72.84719205 India Mumbai Bicentennaire 1 18.536916 ‐72.34952255 Haiti Port Au Prince
Adyar River 1 13.01757671 80.22445152 India Chennai Agripada 2 19.08587418 72.84820331 India Mumbai Bicentennaire 2 18.53417163 ‐72.35027067 Haiti Port Au Prince
Adyar River 2 13.02188185 80.2112203 India Chennai Agripada 3 19.08474681 72.84833736 India Mumbai Bicentennaire 3 18.53285091 ‐72.35160658 Haiti Port Au Prince
Adyar River 3 13.02571567 80.20950496 India Chennai Agripada 4 19.08338503 72.84782318 India Mumbai Cite Soleil 1 18.57283576 ‐72.33195021 Haiti Port Au Prince
Adyar River 4 13.0289901 80.19752079 India Chennai Andheri W. 1 19.13382383 72.81921617 India Mumbai Cite Soleil 2 18.57752686 ‐72.33369863 Haiti Port Au Prince
Anna Colony 13.03351095 80.24253781 India Chennai Andheri W. 2 19.13068296 72.81937703 India Mumbai Cite Soleil 3 18.5790335 ‐72.32943459 Haiti Port Au Prince
Annagar East 13.09050814 80.2256782 India Chennai Bengaluru 1 19.07352544 72.9031306 India Mumbai Cite Soleil 4 18.57556878 ‐72.32658348 Haiti Port Au Prince
Aspiran Colony 13.08595586 80.23642904 India Chennai Bengaluru 2 19.07151698 72.90773796 India Mumbai Cite Soleil 5 18.58121981 ‐72.32873102 Haiti Port Au Prince
Burma Colony 1 13.03227835 80.20231052 India Chennai Govandi E 1 19.06804286 72.92259161 India Mumbai Morne Au Tuff 1 18.54054323 ‐72.34790521 Haiti Port Au Prince
Burma Colony 2 13.03142095 80.1984408 India Chennai Govandi E 2 19.05981122 72.93026821 India Mumbai
Burma Colony 3 13.02928486 80.19719162 India Chennai Govandi E 3 19.0598228 72.92716979 India Mumbai QGIS Name Latitude Longitude Country Province
CIT Nagar 1 13.02237967 80.23346679 India Chennai Mithi River 1 19.08526255 72.87883627 India Mumbai Alicia 1 14.66301905 121.0238673 Philippines Manila
CIT Nagar 2 13.02387222 80.23076206 India Chennai Mithi River 2 19.09137367 72.87905061 India Mumbai Alicia 2 14.66167149 121.0223021 Philippines Manila
CIT Nagar 3 13.02464357 80.2295635 India Chennai Rahul Nagar 19.06086695 72.90783715 India Mumbai Bahay Toro 14.66374718 121.0302585 Philippines Manila
CIT Nagar 4 13.0250343 80.22912616 India Chennai Sabel Nagar 1 19.06770417 72.88793272 India Mumbai Damayan 14.63723052 121.0113509 Philippines Manila
CIT Nagar 5 13.02959792 80.2294853 India Chennai Sabel Nagar 2 19.06850412 72.88745103 India Mumbai Hulong Duhat 14.68454499 120.9387278 Philippines Manila
CIT Nagar 6 13.03049938 80.23089062 India Chennai Sakinaka 1 19.09644606 72.88197606 India Mumbai Kalusagan 14.61901785 121.0191132 Philippines Manila
Kamaraj Nagar 1 13.06697724 80.22761329 India Chennai Sakinaka 2 19.09748238 72.88502455 India Mumbai Metro Manila 7 14.5996727 120.9733381 Philippines Manila
Kamaraj Nagar 2 13.06702141 80.22571237 India Chennai Sakinaka 3 19.09999635 72.88737028 India Mumbai Metro Manila 6 14.6210788 120.9588455 Philippines Manila
Kamaraj Nagar 3 13.06742039 80.22415055 India Chennai Sakinaka 4 19.10152005 72.88936883 India Mumbai Metro Manila 5 14.60307098 120.9717228 Philippines Manila
Kamaraj Nagar 4 13.06799656 80.22201768 India Chennai Sakinaka 5 19.10375144 72.88879386 India Mumbai Metro Manila 1 14.62124778 120.9675312 Philippines Manila
Kamaraj Nagar 5 13.06893204 80.22129394 India Chennai Sakinaka 6 19.10867825 72.8954092 India Mumbai Metro Manila 2 14.61699007 120.9709325 Philippines Manila
Kamaraj Nagar 6 13.06409726 80.21719127 India Chennai VB Nagar 19.07127353 72.88597698 India Mumbai Metro Manila 3 14.61581731 120.9709316 Philippines Manila
Kamaraj Nagar 7 13.06158557 80.21556184 India Chennai Vile Parle E 1 19.10247111 72.83797532 India Mumbai Metro Manila 4 14.60607752 120.9707236 Philippines Manila
Kumaran Nagar 1 13.06191912 80.19386388 India Chennai Vile Parle E 2 19.0996289 72.8390826 India Mumbai Novaliches Pr. 14.71545095 121.0372218 Philippines Manila
Kumaran Nagar 2 13.06126606 80.19133359 India Chennai Quezon City 14.669272 121.0362977 Philippines Manila
Kumaran Nagar 3 13.05898338 80.1894214 India Chennai Santulan 14.68712416 120.9607274 Philippines Manila
Kuvam River 13.07860078 80.28199391 India Chennai Ugong 1 14.68555227 121.0138322 Philippines Manila
Kuvam River 2 13.06740083 80.22830621 India Chennai Ugong 2 14.69116452 121.0200815 Philippines Manila
Kuvam River 3 13.0719223 80.22952138 India Chennai
Kuvam River 4 13.07839587 80.1979377 India Chennai
Mogappair East 13.07966929 80.1895989 India Chennai
Mogappair East 2 13.08713651 80.19200074 India Chennai
Udyam Nagar 13.09289232 80.20958083 India Chennai
16
Literature Cited
Bindel, Marcus, Sören Hese, Christian Berger, and Christiane Schmullius. "Evaluation of Red-edge
Spectral Information for Biotope Mapping Using RapidEye." Remote Sensing for Agriculture,
Ecosystems, and Hydrology XIII (2011): n. pag. Web. 18 July 2016.
Browne, Mark Anthony, M. Gee Chapman, Richard C. Thompson, Linda A. Amaral Zettler, Jenna
Jambeck, and Nicholas J. Mallos. "Spatial and Temporal Patterns of Stranded Intertidal Marine
Debris: Is There a Picture of Global Change?" Environmental Science & Technology Environ. Sci.
Technol. 49.12 (2015): 7082-094. Web. 18 July 2016.
Chen, Angus. "Here’s How Much Plastic Enters the Ocean Each Year." Science (2015): n. page.
Web. 20 Sept. 2016.
Cressey, Daniel. "Bottles, Bags, Ropes and Toothbrushes: The Struggle to Track Ocean Plastics."
Nature 536.7616 (2016): 263-65. Web. 20 Sept. 2016.
Driedger, Alexander G.J., Hans H. Dürr, Kristen Mitchell, and Philippe Van Cappellen. "Plastic Debris
in the Laurentian Great Lakes: A Review." Journal of Great Lakes Research 41.1 (2015): 9-19. Web.
18 July 2016.
Gourmelon, Gaelle. "Global Plastic Production Rises, Recycling Lags." Vital Signs Online.
Worldwatch Institute, 27 Jan. 2015. Web. 23 Sept. 2016.
Hoornweg, Dan; Lam, Philip; Chaudhry, Manisha. 2005. Waste management in China: issues and
recommendations. Urban development working papers; no. 9. Washington, DC: World Bank.

17
http://documents.worldbank.org/curated/en/237151468025135801/Waste-management-in-China-
issues-and-recommendations
Hörig, B., F. Kühn, F. Oschütz, and F. Lehmann. "HyMap Hyperspectral Remote Sensing to Detect
Hydrocarbons." International Journal of Remote Sensing 22.8 (2001): 1413-422. Web. 18 July 2016.
Hoornweg, Daniel, and Perinaz Bhada-Tata. "What a Waste : A Global Review of Solid Waste
Management." Knowledge Papers No. 15 15 (2012): n. pag. Urban Development Series. World Bank,
Mar. 2012. Web. 02 Sept. 2016. <https://openknowledge.worldbank.org/handle/10986/17388>.
Jambeck, Jenna R., and Kyle Johnsen. "Citizen-Based Litter and Marine Debris Data Collection and
Mapping." Comput. Sci. Eng. Computing in Science & Engineering 17.4 (2015): 20-26. Web. 18 July
2016.
Jambeck, J. R., R. Geyer, C. Wilcox, T. R. Siegler, M. Perryman, A. Andrady, R. Narayan, and K. L.
Law. "Plastic Waste Inputs from Land into the Ocean." Science 347.6223 (2015): 768-71. Web. 18
July 2016.
Jang, Yong Chang, Jongmyoung Lee, Sunwook Hong, Hyun Woo Choi, Won Joon Shim, and Su
Yeon Hong. "Estimating the Global Inflow and Stock of Plastic Marine Debris Using Material Flow
Analysis: A Preliminary Approach." Journal of the Korean Society for Marine Environment & Energy
18.4 (2015): 263-73. Web. 18 July 2016.
Lopez, Aolysius X. "Beach at Adyar Estuary Strewn with Trash, Rubble." Beach at Adyar Estuary
Strewn with Trash, Rubble. The Hindu, 25 Oct. 2013. Web. 1 Oct. 2016.

18
Mace, Thomas H. "At-sea Detection of Marine Debris: Overview of Technologies, Processes, Issues,
and Options." Marine Pollution Bulletin 65.1-3 (2012): 23-27. Web. 18 July 2016.
Merkl, Andreas, and Martin Stuchtey. "Land-based Strategies for a Plastic - Free Ocean" Stemming
the Tide. Full-report-stemming-the.pdf. McKinsey & Company and Ocean Conservancy, Sept. 2015.
Web. 18 July 2016.
Meuser, Michael. "Free GIS Shapefiles, Software, Resources and Geography Maps." Free GIS
Mapping, ArcGIS Shapefiles, Tools, News, Geography Maps and Resources. MapCruzin, 2016. Web.
17 Aug. 2016.
Müller, Christin, Kathy Townsend, and Jörg Matschullat. "Experimental Degradation of Polymer
Shopping Bags (standard and Degradable Plastic, and Biodegradable) in the Gastrointestinal Fluids
of Sea Turtles." Science of the Total Environment 416 (2012): 464-67. Web. 20 Sept. 2016.
Pichel, William G., James H. Churnside, Timothy S. Veenstra, David G. Foley, Karen S. Friedman,
Russell E. Brainard, Jeremy B. Nicoll, Quanan Zheng, and Pablo Clemente-Colón. "Marine Debris
Collects within the North Pacific Subtropical Convergence Zone." Marine Pollution Bulletin 54.8
(2007): 1207-211. Web. 18 July 2016.
Ross, D. E., and M. Rogoff J. "What a Waste...' the World Bank's Call for Action." Waste
Management & Research 30.8 (2012): 755-57. Web

19
Shrivastava, Bhuma. "Mumbai Is Being Buried Under a Mountain of Its Own Trash." Bloomberg.com.
Bloomberg, 16 Mar. 2015. Web. 01 Oct. 2016.
Unknown Author. "DNR Garmin Application.” Minnesota DNR. Minnesota Department of Natural
Resources, 23 Sept. 2008. Web. 24 Sept. 2016.
Unknown Author. "EcoWaste Coalition Seeks Public Cooperation to Keep Manila Esteros Garbage-
Free." EcoWaste Coalition. EcoWaste, 30 Jan. 2015. Web. 01 Oct. 2016.
Unknown Author. "Free GIS Data - GIS Data Depot." Free GIS Data - GIS Data Depot. MindSites
Group, 2014. Web. 17 July 2016.
Unknown Author. "States Census 2011." List of States with Population, Sex Ratio and Literacy
Census 2011. Census Population 2015 Data, 2015. Web. 17 Aug. 2016.
Weinstein, John E., Brittany Crocker K., and Austin Gray D. "From Macroplastic to Microplastic:
Degradation of High-density Polyethylene, Polypropylene, and Polystyrene in a Salt Marsh Habitat."
Environmental Toxicology and Chemistry 35.7 (2016): 1632-640. Web. 20 Sept. 2016.
Related Documents