IDENTIFYING REVEALED COMPARATIVE ADVANTAGES IN AN EU REGIONAL CONTEXT Prepared for: European Commission Executive Agency for Small and Medium-sized Enterprises (EASME) Hannover/Mannheim/Vienna, November 2015 Authors: Alexander Cordes (NIW)*, Birgit Gehrke (NIW), Roman Römisch (wiiw), Christian Rammer (ZEW), Paula Schliessler (ZEW), Pia Wassmann (NIW) * corresponding author

Welcome message from author
This document is posted to help you gain knowledge. Please leave a comment to let me know what you think about it! Share it to your friends and learn new things together.
Transcript
IDENTIFYING REVEALED COMPARATIVE ADVANTAGES IN AN EU REGIONAL CONTEXT
Prepared for:
European Commission
Executive Agency for Small and Medium-sized Enterprises (EASME)
Hannover/Mannheim/Vienna,
November 2015
Authors:
Alexander Cordes (NIW)*, Birgit Gehrke (NIW), Roman Römisch (wiiw),
Christian Rammer (ZEW), Paula Schliessler (ZEW), Pia Wassmann (NIW)
* corresponding author
This study has been prepared for the Executive Agency for Small and Medium-sized Enterprises (EASME),
under Specific Contract ENT-SME-14-F-S107-SI2-698053 implementing the Framework Service Contract
ENTR/300/PP/2013/FC-WIFO on ‘Studies in the Area of European Competitiveness’ coordinated by the Aus-
trian Institute of Economic Research (WIFO) (coordinator: Andreas Reinstaller). This service contract is fi-
nanced by the EU Programme for the Competitiveness of Enterprises and SMEs (COSME).
© European Union, 2015. All rights reserved.
The information and views set out in this study are those of the author(s) and do not necessarily reflect the offi-
cial opinion of the EASME or of the Commission. Neither EASME nor the Commission, guarantee the accuracy
of the data included in this study. Neither the EASME, nor the Commission or any person acting on their behalf
may be held responsible for the use which may be made of the information contained therein.
Research Team:
Lower Saxony Institute for
Economic Research (NIW)
The Vienna Institute for
International Economic
Studies (wiiw)
Center for European
Economic Research (ZEW)
Alexander Cordes
Birgit Gehrke
Jonas Peisker
Ulrich Schasse
Daniel Schiller
Pia Wassmann
Michael Landesmann
Roman Römisch
Sandra Leitner
Simona Jokubauskaite
Christian Rammer
Paula Schliessler

I
Table of Contents
Executive Summary ............................................................................................................................................... 1
Chapter 1. Introduction ............................................................................................................................................ 3
Chapter 2. Patterns of Regional Export Specialisation ............................................................................................ 5
2.1. Indicators for measuring trade specialisation and trade performance .................................... 6
2.2. Status quo of revealed export advantages............................................................................... 7
2.3. Changes in revealed export advantages ................................................................................ 11
2.4. Revealed advantages in value added exports ....................................................................... 16
2.4.1. Manufacturing industries ........................................................................................ 17
2.4.2. Revealed advantages in value added exports of the services sector ....................... 23
Chapter 3. Regional Determinants of International trade Performance ................................................................. 27
3.1. Introduction .......................................................................................................................... 27
3.2. Drivers of Regional Trade Specialisation ............................................................................. 27
3.3. Descriptive statistics ............................................................................................................. 30
3.3.1. RXA and RCA ....................................................................................................... 30
3.3.2. Industry-specific characteristics: patent intensity and cluster rating ...................... 31
3.3.3. Region-specific characteristics ............................................................................... 31
3.4. Estimation Results ................................................................................................................ 33
3.4.1. Industry-specific results ......................................................................................... 34
3.4.2. Robustness checks .................................................................................................. 37
3.5. Summary .............................................................................................................................. 42
Chapter 4. Case Studies ......................................................................................................................................... 43
4.1. Case Selection ...................................................................................................................... 43
4.2. Selected Regions .................................................................................................................. 45
4.2.1. Apulia ..................................................................................................................... 45
4.2.2. Berkshire, Buckinghamshire, Oxfordshire ............................................................. 51
4.2.3. Castile–La Mancha ................................................................................................. 58
4.2.4. Chemnitz ................................................................................................................ 64
4.2.5. Jihozápad ................................................................................................................ 70
4.2.6. Middle Franconia ................................................................................................... 76
4.2.7. Norte....................................................................................................................... 82
4.2.8. Overijissel .............................................................................................................. 87
4.2.9. Sydsverige (Southern Sweden) .............................................................................. 94
4.2.10. West-Transdanubia .............................................................................................. 100
4.3. Main Results of the Case Studies ....................................................................................... 107
Chapter 5. Conclusions and Policy implications .................................................................................................. 111
Chapter 6. References .......................................................................................................................................... 115
Chapter 7. Appendix ............................................................................................................................................ 121
7.1. Methodological Appendix .................................................................................................. 121
7.1.1. Regional exports ................................................................................................... 121
7.1.2. Intermediate consumption .................................................................................... 126
7.2. Estimating regional trade in value added ........................................................................... 127
7.3. Appendix of Tables ............................................................................................................ 129
II
List of Figures
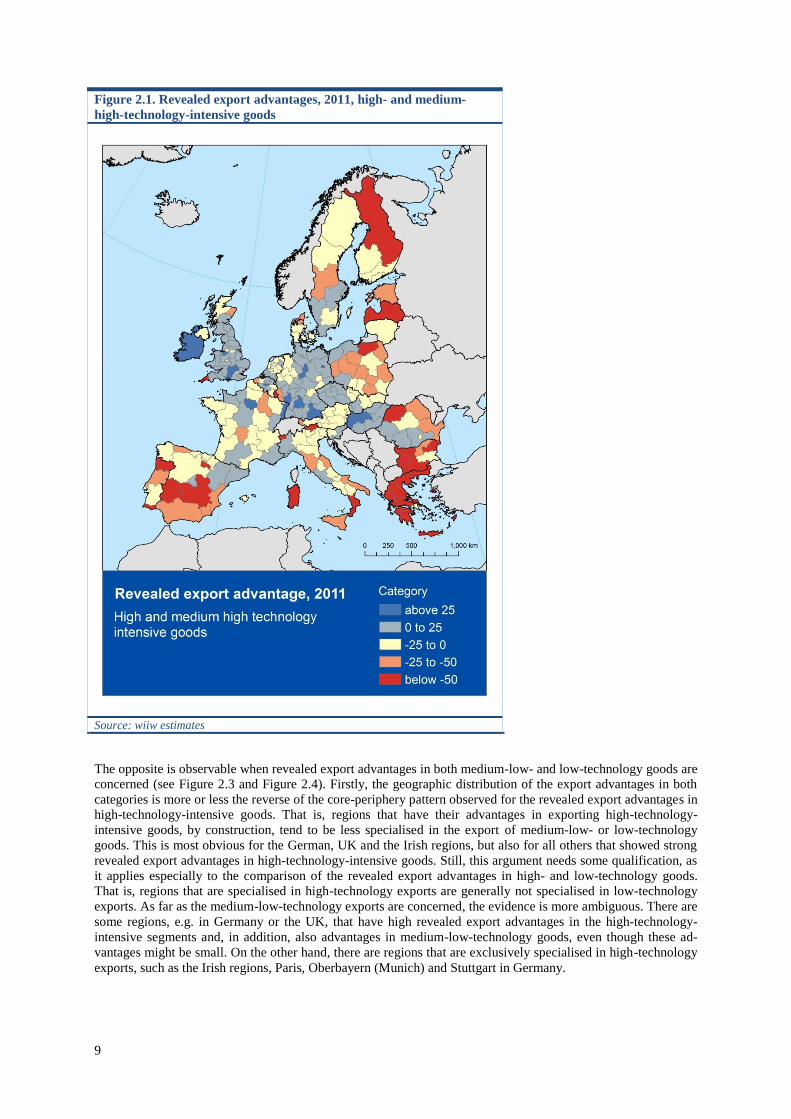
Figure 2.1. Revealed export advantages, 2011, high- and medium-high-technology-intensive goods .................... 9
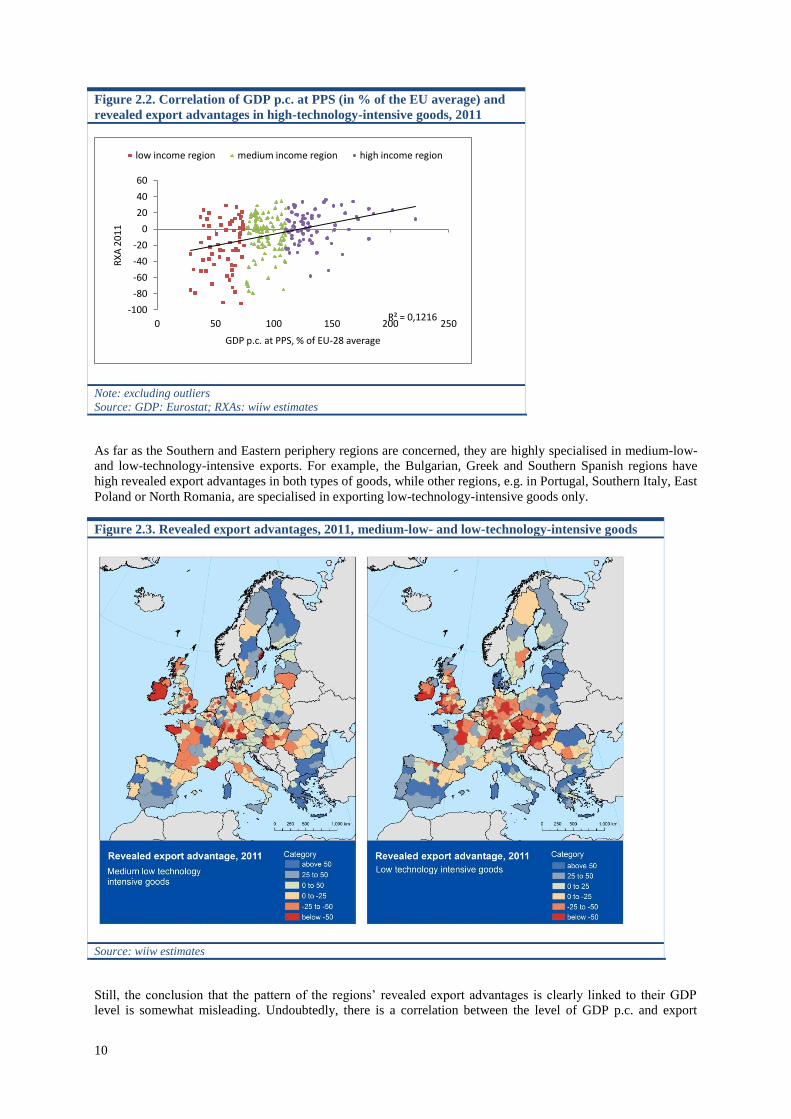
Figure 2.2. Correlation of GDP p.c. at PPS (in % of the EU average) and revealed export advantages in
high-technology-intensive goods, 2011 ......................................................................................................... 10
Figure 2.3. Revealed export advantages, 2011, medium-low- and low-technology-intensive goods .................... 10
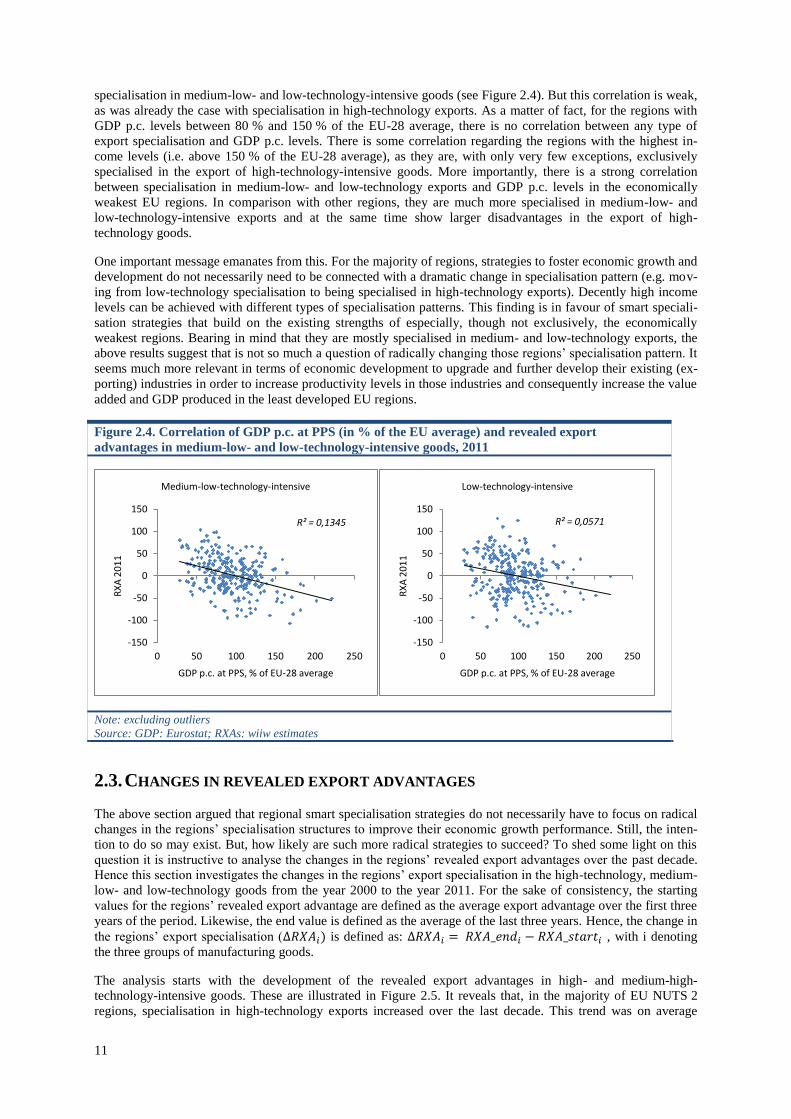
Figure 2.4. Correlation of GDP p.c. at PPS (in % of the EU average) and revealed export advantages in
medium-low- and low-technology-intensive goods, 2011 ............................................................................. 11
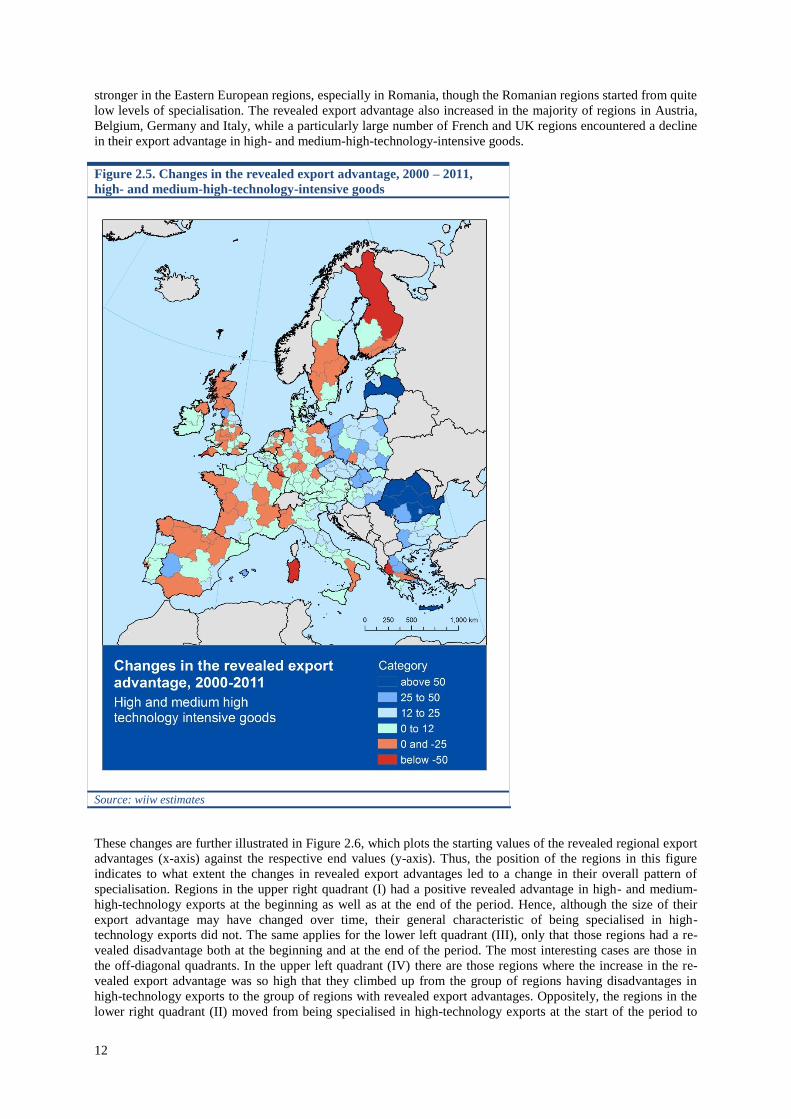
Figure 2.5. Changes in the revealed export advantage, 2000 – 2011, high- and medium-high-technology-
intensive goods .............................................................................................................................................. 12
Figure 2.6. Revealed export advantages, high- and medium-high-technology goods, 2000 and 2011 .................. 13
Figure 2.7. Changes in the revealed export advantage, 2000 – 2011, medium-low- and low-technology-
intensive goods .............................................................................................................................................. 14
Figure 2.8. Revealed export advantages, medium-low- and low-technology goods, 2000 and 2011 .................... 15
Figure 2.9. Revealed advantages in value added exports in manufacturing industry sectors ................................. 18
Figure 2.10. Correlation of GDP p.c. at PPS (in % of the EU average) and revealed advantages in value
added exports in manufacturing industry sectors, 2011 ................................................................................. 19
Figure 2.11. Revealed advantages in valued added exports 2000 and 2011; manufacturing industry sectors ....... 20
Figure 2.12. Correlation of revealed advantages in value added exports and revealed gross export
advantages by aggregated industry groups, 2011 .......................................................................................... 21
Figure 2.13. Differences in RXAs based on value added exports and foreign trade exports, 2011 ....................... 22
Figure 2.14. RXAs – Value added exports: Business services, 2011 ..................................................................... 23
Figure 2.15. RXAs – Value added exports: Financial and tourism services, 2011 ................................................ 24
Figure 2.16. Correlation of GDP p.c. at PPS (in % of the EU average) and revealed advantages in value
added exports in Business services, 2011 ...................................................................................................... 24
Figure 2.17. Correlation of GDP p.c. at PPS (in % of the EU average) and revealed advantages in value
added exports in Financial and Tourism services, 2011 ................................................................................ 25
Figure 2.18. Revealed advantages in valued added exports 2000 and 2011; Business services ............................ 26
Figure 2.19. Revealed advantages in valued added exports 2000 and 2011; Financial and Tourism services....... 26
Figure 3.1. Distribution of regional variables by structural funds category (Box plots), 2011 ............................. 32
Figure 4.1. Trade Indicators of Apulia ................................................................................................................... 47
Figure 4.2. Trade Indicators of Berkshire, Buckinghamshire, Oxfordshire (BBO) ............................................... 53
Figure 4.3. Trade Indicators of Castile–La Mancha ............................................................................................... 59
Figure 4.4. Trade Indicators of Chemnitz .............................................................................................................. 66
Figure 4.5. Trade Indicators of Jihozápad .............................................................................................................. 72
Figure 4.6. Trade Indicators of Middle Franconia ................................................................................................. 78
Figure 4.7. Trade Indicators of Norte ..................................................................................................................... 83
Figure 4.8. Trade Indicators of Overijssel .............................................................................................................. 89
Figure 4.9. Trade Indicators of Sydsverige ............................................................................................................ 95
Figure 4.10. Trade Indicators of West Transdanubia (WT) ................................................................................. 102
III
List of Tables
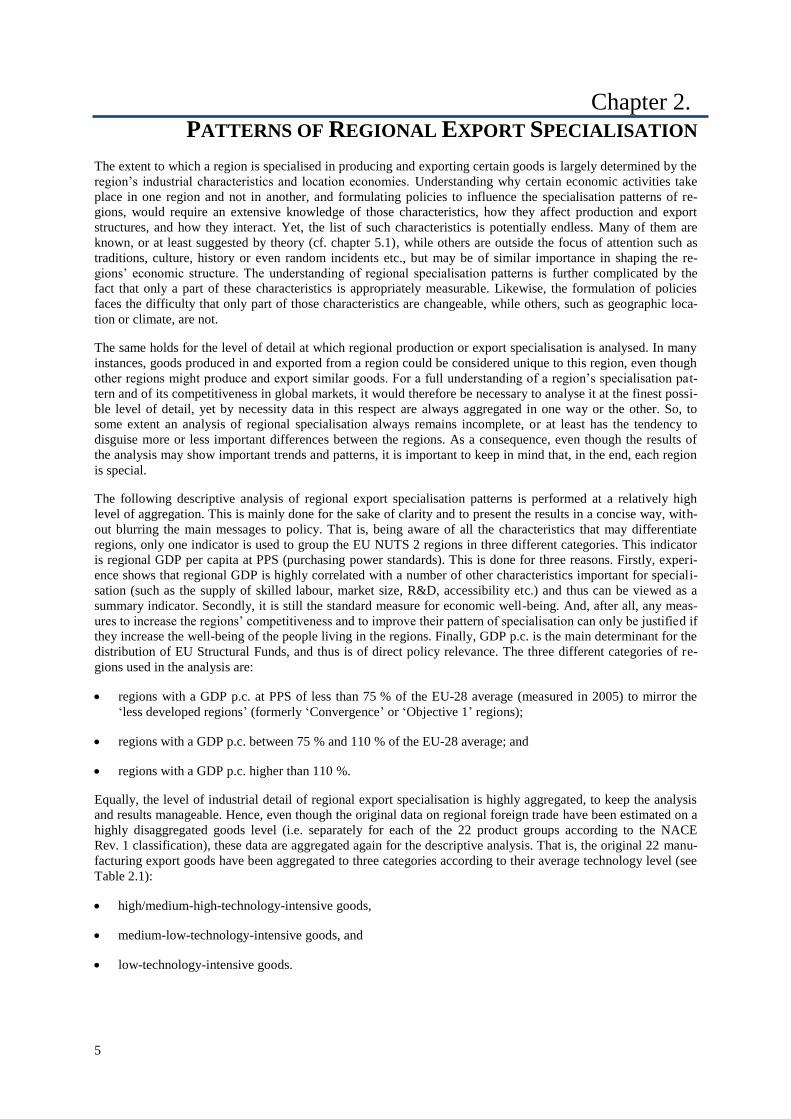
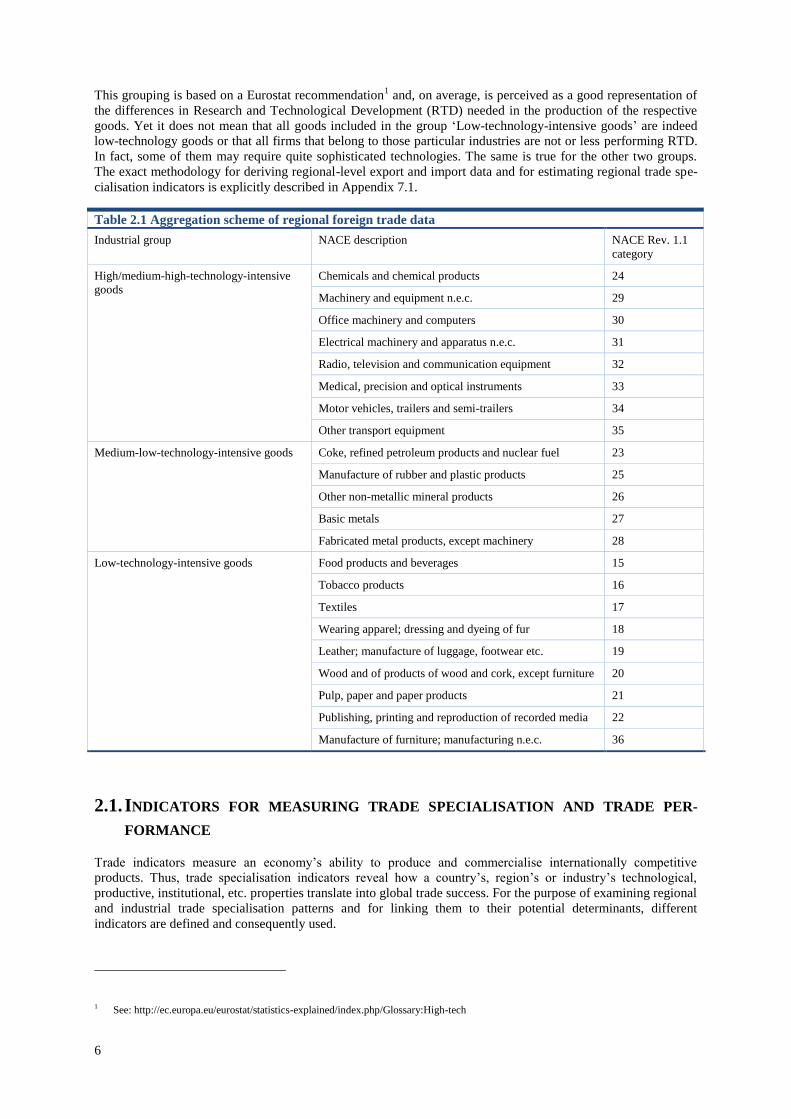
Table 2.1 Aggregation scheme of regional foreign trade data ................................................................................. 6
Table 2.2. Average RXAs by regional income groups and trade categories, 2011 (population-weighted
average) ........................................................................................................................................................... 8
Table 2.3. Regression results; dependent variable growth of GDP 2000-2011 ...................................................... 15
Table 2.4. Regression results; dependent variable growth of GDP 2000-2011; by income groups of regions ...... 16
Table 3.1 Explanatory Variables ............................................................................................................................ 28
Table 3.2. Regression of RXA in the low-technology sector ................................................................................. 35
Table 3.3. Regression of RXA in the medium-low-technology sector................................................................... 36
Table 3.4. Regression of RXA in the high/medium-high-technology sector ......................................................... 37
Table 3.5. OLS regression of different dependent variables and datasets .............................................................. 38
Table 3.6. Robustness check II: omission of variables .......................................................................................... 39
Table 3.7. Robustness check III: sub-samples of regions (structural fund categories) .......................................... 41
Table 4.1. Selection Criteria for Case Study Regions ............................................................................................ 44
Table 4.2. List of Potential Case Study Regions .................................................................................................... 45
Table 4.3. Regional Key Figures of Apulia............................................................................................................ 48
Table 4.4. Stylised industry-specific regression results for Apulia ........................................................................ 51
Table 4.5. Regional Key Figures of Berkshire, Buckinghamshire, Oxfordshire .................................................... 54
Table 4.6. Stylised industry-specific regression results for Berkshire, Buckinghamshire, Oxfordshire ................ 57
Table 4.7. Regional Key Figures of Castile–La Mancha ....................................................................................... 60
Table 4.8. Stylised industry-specific regression results for Castile–La Mancha .................................................... 64
Table 4.9. Regional Key Figures of Chemnitz ....................................................................................................... 67
Table 4.10. Stylised industry-specific regression results for Chemnitz ................................................................. 70
Table 4.11. Regional Key Figures of Jihozápad .................................................................................................... 73
Table 4.12. Stylised industry-specific regression results for Jihozápad ................................................................. 76
Table 4.13. Regional Key Figures of Middle Franconia ........................................................................................ 79
Table 4.14. Stylised industry-specific regression results for Middle Franconia .................................................... 81
Table 4.15. Regional Key Figures of Norte ........................................................................................................... 84
Table 4.16. Stylised industry-specific regression results for Norte ........................................................................ 87
Table 4.17. Regional Key Figures of Overijssel .................................................................................................... 90
Table 4.18. Stylised industry-specific regression results for Overijssel ................................................................. 93
Table 4.19 Regional Key Figures of Sydsverige .................................................................................................... 96
Table 4.20. Stylised industry-specific regression results for Sydsverige ............................................................. 100
Table 4.21. Regional Key Figures of West Transdanubia.................................................................................... 103
Table 4.22. Stylised industry-specific regression results for Transdanubia ......................................................... 107
Table A 1. Distribution of industry-specific RXA by structural funds category (Box plots), 2011 ..................... 130
Table A 2. Distribution of industry-specific RCA by structural funds category (Box plots), 2011 ..................... 132
Table A 3. Distribution of industry-specific patent intensity by structural funds category (Box plots), 2011 ..... 134
Table A 4. Distribution of industry-specific cluster ratings by structural funds category (Box plots), 2011 ....... 136
1
EXECUTIVE SUMMARY
Smart specialisation aims at understanding and exploiting the strengths of European regions in order to boost
innovation, competitiveness and, ultimately, economic growth. For regional policy strategies to be effective, and
for an efficient use of the available funds, it is crucial to analyse in detail the assets with which each region is
endowed, the technologies available, and the business connections among different regions. This study
introduces a suitable method to break down national trade data to the regional level. This allows producing trade
indicators at the regional level, revealed export advantages (RXA) in particular. Identifying industries in which a
region realises a strong trade specialisation plays a twofold role in industrial and regional policy-making. Firstly,
identifying successful structures at the industry-region level helps to improve the understanding of micro- and
meso-foundations for competitiveness as well as scope and cases for policy intervention. Secondly, the spatial
distribution of competititve industries and required location factors is necessary for differentiated perspectives on
future economic development and the choice of policy instruments.
Descriptive results of regional-industrial RXAs show that high- and low-income regions exhibit different trade
specialisation patterns. While high-income regions on average tend to be specialised in high-technology-
intensive goods, low-income regions are specialised in medium-low- and low-technology-intensive goods trade.
The medium-income regions are somewhere in between, having slight disadvantages in the high-technology
trade, and a more or less balanced specialisation in the medium-low- and low-technology goods trade.
Accordingly, the geographic distribution of export advantages in the ‘high/medium-high-technology-intensive’
goods trade follows a more or less distinct core-periphery pattern in the EU. When looking at the dynamics,
results suggest that large changes in the regions’ specialisation patterns over time are relatively rare events.
Although the size of revealed export advantages may increase or decrease over time, a complete shift of the
revealed specialisation structure, i.e. moving from being specialised in exporting low-technology-intensive
goods to being specialised in exporting high- and medium-high-technology goods is quite unlikely. This implies
that the development of specialisation patterns is path-dependent. This is important to know for the development
of smart specialisation strategies, because it suggests that their reference point should be the existing strengths of
the regions. It also confirms the important role scientific, technological and economic specialisation plays for the
development of comparative advantage and regional economic growth as it is also one distinct area for
conceptual and policy implications of smart specialisation (OECD, 2013).
Along with the descriptive analysis, the study also investigates in a multivariate approach as to which region-
and industry-specific factors are related to success on international markets. As far as the cross-sectional analysis
is interpreted, shifting from competitive low-technology to competitive high-technology exports would also
require fundamental changes in other regional characteristics, the innovation system in particular. Although
innovation (measured by patents as a throughput indicator) significantly increases competitiveness in nearly
every industry, it becomes clear that the structures of regional innovation systems vary between industries.
Competitiveness in low- and medium-low-technology industries is linked to innovative SMEs, although it is not
necessarily linked to firm-specific R&D. Instead, non-technological innovations without significant R&D efforts
or impulses from other actors, such as High Education Institututions (HEIs), seem to be similarly important. This
illustrates the high relevance of successful cooperation and knowledge transfer between local firms and higher
education institutions particularly in those low- and medium-low-technology industries. High-technology
industries, in contrast, are often located in larger and diverse regions and their innovation outcomes rely more
heavily on the innovation performance of larger firms.
The regional endowment with HEIs is possibly one of the most directly susceptible regional characteristics when
it comes to policy implications. However, in order to promote competitiveness in medium-high/high-technology
industries, guaranteeing quality of government is likewise important; it probably requires fewer fiscal resources
and enables the economy to evolve independently of industrial and related planning strategies. Also several other
studies conclude that the regions with good governance are generally those which are less likely to require policy
assistance (McCann and Ortega-Argilés, 2013; Ederveen et al., 2006). Cluster effects, i.e. the presence of several
firms working in similar or related industries within a region, are still visible. This underlines the structural
embeddedness of highly competitive industries. However, cluster policies need to provide perspectives on future
technological developments, in related industries in particular, in order to meet the requirements of smart
specialisation strategies (S3). In regions with lower political capacities (governmental quality, cluster
management) it is suggested first to build up social capital and opportunities for entreprenurial discovery as a
necessary precondition before initiating bottom-up processes such as S3 (European Commission, 2013).
Three types of regions are analysed through in-depth case studies. In the more advanced and developed regions
(Berkshire, Buckinghamshire, Oxfordshire; Middle Franconia; Overijssel; Sydsverige) universities are key
actors, accompanied by sufficiently present business services and the larger market potential of regional firms
2
resulting from the proximate metropolitan centres. They host not only high-tech industries, but also low-tech
industries with high comparative advantages. The latter, however, are of decreasing importance or have
successfully transformed themselves and now focus on innovation in niche products. (Regional) policy is further
developing the research infrastructure and clearly addresses its agile SMEs. Leading companies are identified to
some extent, but regions’ economies and innovation systems do not substantially depend on them. In contrast,
they increasingly benefit from the local innovation potential and knowledge-oriented structural change. Future
perspectives are thus positive.
The less developed and transition regions regarded (e.g. Castile–La Mancha, Norte, Puglia) are somewhat
trapped in their specialisation. Approaches aiming to diversify the industry structure suffer from low critical
mass and a lack of attractiveness for FDI. Universities have not played a crucial role thus far. Existing
comparative advantages rely on long industrial traditions and are found to be driven mainly by innovative SMEs
in the region. Price competition on international markets, however, is a permanent challenge, and the regions
under consideration would probably benefit from refining their industrial composition in favour of business
services and functional specialisation on higher-value activities such as design, marketing and management. This
goal is challenged by the problem of skilled labour supply; here, the less developed regions face additional
challenges as they compete with more central locations over high potentials.
The transforming regions in Central and Eastern Europe (Chemnitz, Jihozápad, West Transdanubia), in contrast,
attracted significant FDI and established large production clusters with several multinational leading companies.
Chemnitz, in particular, succeeded in restructuring its outdated industries and production sites and created
conditions for increasing integration into a rich regional innovation system. The two Eastern European regions
still face the challenge of transforming their initial cost and fiscal advantages into knowledge-based foundations
in order to raise income levels and sustain or expand their industrial competencies in and around the city centres.
The cases of the two Eastern European regions provide evidence that not just the accumulation of capital, but
also structural change, is a driver of economic growth.
The results of the analyses are in line with preceding studies. They show that trade specialisation patterns are
highly path-dependent and do not significantly change over time. More specifically, the results show that the
industrial history is a decisive factor and greatly determines the current trade specialisation patterns of European
regions. Hence, it its recommended to strengthen the endogenous potential of regions by encouraging the
transformation of economic activities based on the existing economic structure. In most cases this implies
modernising existing industries or enabling lagging sectors to improve their competitiveness, for instance
through the adoption of General Purpose Technologies (GPT) such as ICT and the specialisation in specific
functions or activities along the supply chain. This is particularly relevant for innovative SMEs that play an
important role for revealed export specialisation advantages in low- and medium-low-technology industries.
Furthermore, HEIs are potentially crucial actors for providing access to GPT applications and organisational
strategies, both via collaboration as well as developing the local highly skilled labour supply. If they succeed in
creating not just geographical but also cognitive and technological proximity, HEIs are important vehicles for
implementing place-based approaches in different transmission channels (European Commission, 2014).
To improve growth opportunities, innovation strategies should also place emphasis on the development of inter-
regional cooperations and support firms engaged in inter-regional and international knowledge networks
(Charles et al., 2012). Policies promoting labour mobility between related industries may also enhance structural
changes due to a recombination of regional skills and potentials, which, in turn, may increase regional
competitiveness and growth. It might also be crucial to stimulate the inflow of skilled labour from other regions
and countries, because it brings new ideas and knowledge to the regions (Saxenian, 2006; Boschma and
Gianelle, 2014). Existing clusters in particular can play an important role in promoting these dynamics
(European Commission, 2013). However, following this approach also requires the formulation of exit strategies
in order to avoid adverse (political) lock-in effects (European Commission, 2013).
3
Chapter 1. INTRODUCTION
Smart specialisation aims at understanding and exploiting the strengths of European regions in order to boost
innovation, competitiveness and, ultimately, economic growth. In this context, the European Commission's
Cohesion Policy sets a framework to reduce differences between regions and to ensure growth across Europe
through the help of Structural Funds. For regional policy strategies to be effective, and for an efficient use of the
available funds, it is crucial to analyse in detail the assets each region is endowed with, the technologies
available, and the business connections among different regions. Since Smart Specialisation is fundamentally a
bottom-up approach to policy, starting from the initial industrial structure, European regions need to identify
niche areas of competitive strength in order to accumulate demand-driven investments and innovation
partnerships and to align resources and strategies between private and public actors of different governance
levels.
One of the tools that can be used to support the design of appropriate regional policies is the analysis of
international trade performance of European regions. Identifying industries in which a region realises a strong
trade specialisation may enable policy-makers and regional stakeholders to understand the sectoral specialisation
of each region and the related success on international markets. This information plays a twofold role in
industrial and regional policy-making to increase competitiveness at the regional level as well as in the EU as a
whole. First, identifying succesful structures at the industry-region level helps to improve the understanding of
micro- and meso-foundations for competitiveness and scope and cases for policy intervention. Second,
information on the spatial distribution of competititve industries and required location factors is necessary for
differentiated perspectives on future economic development and the choice of policy instruments.
In this study, the focus is on export specialisation, which illustrates the export advantage of a a country or region
in a certain industry. This is traditionally measured by the Revealed Export Advantage (RXA), which indicates
whether a country or region puts more or less focus on exporting particular products than other countries or
regions do. Thus, a positive RXA value indicates that the country (region) realises comparably higher export
market shares in this specific product group/industry than it does in total manufacturing goods.
However, so far, analyses of trade specialisation and trade performance indicators at the regional level have been
limited by the lack of available data. Since trade data are usually collected at the national level, it has not been
possible to examine trade specialisation and performance at the regional-industry level. This report aims at
introducing a suitable method to break down national trade data to the regional level. In addition to regional
gross exports, this report will also analyse regional Trade in Value Added (TiVA). Such analysis has become
increasingly popular, and this report for the first time presents such analysis at the level of EU regions. The
method to estimate regional TiVA data is based on well-established methods to estimate national TiVA flows
and uses a straightforward method to disaggregate these data to the regional level. The analysis of regional TiVA
flows also allows analysing the role and importance of services, which is not possible in the case of using
international (product) trade statistics. Hence, providing a reliable methodology to produce trade indicators at the
regional level is the aim of this study. Besides the key task to provide the European Commission with an initial
dataset and the computational information required for future updates, supplemental analyses are conducted in
order to validate the data and give first indications for related policy issues by means of descriptive and
multivariate analyses as well as case study evidence. In general, when confronting the generated data with
additional quantitative and qualitative information, it becomes clear that the proposed regional trade indicators
are adequate to identify regions and industries with exceptional trade performance.
The results of the analyses are in line with preceding studies. One major insight is that high income levels and
regional growth are not necessarily related to fundamental changes in the sectoral strength of a region. Given a
suitable industrial configuration, regional endowment with Higher Education Institutions (HEIs) as well as
focused policies, international competitiveness is achieved in very different industries. Historical roots and path-
dependencies are decisive factors. However, while in some highly competitive regions the regional industrial
legacy may hinder future growth perspectives, in several lagging regions entrepreneurial discovery processes
succeeded in refining the regional specialisation by developing new applications of already existing products.
Despite this case-specific evidence, there is still a divide in the specialisation of high- and low-income regions:
While high-income regions on average tend to be specialised in high-technology-intensive goods, but are less
competitive in less technology-intensive goods, low-income regions are specialised in medium-low- and low-
technology-intensive goods trade, but show some deficits in the high-technology trade

4
Overall, this report is structured as follows: the next chapter (2) briefly outlines the relevance of regional trade
indicators for determining the competitiveness of a region. In chapter 3, the methodology for the calculation of
regional trade performance indicators is introduced, and the elementary results are described. Chapter 4 presents
an econometric analysis relating key regional characteristics to international success of local industries. Based
upon the regional distribution of comparative advantages, chapter 5 reports the results of ten regional case
studies. Finally, chapter 6 summarises the results and provides policy implications.
5
Chapter 2. PATTERNS OF REGIONAL EXPORT SPECIALISATION
The extent to which a region is specialised in producing and exporting certain goods is largely determined by the
region’s industrial characteristics and location economies. Understanding why certain economic activities take
place in one region and not in another, and formulating policies to influence the specialisation patterns of re-
gions, would require an extensive knowledge of those characteristics, how they affect production and export
structures, and how they interact. Yet, the list of such characteristics is potentially endless. Many of them are
known, or at least suggested by theory (cf. chapter 5.1), while others are outside the focus of attention such as
traditions, culture, history or even random incidents etc., but may be of similar importance in shaping the re-
gions’ economic structure. The understanding of regional specialisation patterns is further complicated by the
fact that only a part of these characteristics is appropriately measurable. Likewise, the formulation of policies
faces the difficulty that only part of those characteristics are changeable, while others, such as geographic loca-
tion or climate, are not.
The same holds for the level of detail at which regional production or export specialisation is analysed. In many
instances, goods produced in and exported from a region could be considered unique to this region, even though
other regions might produce and export similar goods. For a full understanding of a region’s specialisation pat-
tern and of its competitiveness in global markets, it would therefore be necessary to analyse it at the finest possi-
ble level of detail, yet by necessity data in this respect are always aggregated in one way or the other. So, to
some extent an analysis of regional specialisation always remains incomplete, or at least has the tendency to
disguise more or less important differences between the regions. As a consequence, even though the results of
the analysis may show important trends and patterns, it is important to keep in mind that, in the end, each region
is special.
The following descriptive analysis of regional export specialisation patterns is performed at a relatively high
level of aggregation. This is mainly done for the sake of clarity and to present the results in a concise way, with-
out blurring the main messages to policy. That is, being aware of all the characteristics that may differentiate
regions, only one indicator is used to group the EU NUTS 2 regions in three different categories. This indicator
is regional GDP per capita at PPS (purchasing power standards). This is done for three reasons. Firstly, experi-
ence shows that regional GDP is highly correlated with a number of other characteristics important for speciali-
sation (such as the supply of skilled labour, market size, R&D, accessibility etc.) and thus can be viewed as a
summary indicator. Secondly, it is still the standard measure for economic well-being. And, after all, any meas-
ures to increase the regions’ competitiveness and to improve their pattern of specialisation can only be justified if
they increase the well-being of the people living in the regions. Finally, GDP p.c. is the main determinant for the
distribution of EU Structural Funds, and thus is of direct policy relevance. The three different categories of re-
gions used in the analysis are:
regions with a GDP p.c. at PPS of less than 75 % of the EU-28 average (measured in 2005) to mirror the
‘less developed regions’ (formerly ‘Convergence’ or ‘Objective 1’ regions);
regions with a GDP p.c. between 75 % and 110 % of the EU-28 average; and
regions with a GDP p.c. higher than 110 %.
Equally, the level of industrial detail of regional export specialisation is highly aggregated, to keep the analysis
and results manageable. Hence, even though the original data on regional foreign trade have been estimated on a
highly disaggregated goods level (i.e. separately for each of the 22 product groups according to the NACE
Rev. 1 classification), these data are aggregated again for the descriptive analysis. That is, the original 22 manu-
facturing export goods have been aggregated to three categories according to their average technology level (see
Table 2.1):
high/medium-high-technology-intensive goods,
medium-low-technology-intensive goods, and
low-technology-intensive goods.
6
This grouping is based on a Eurostat recommendation1 and, on average, is perceived as a good representation of
the differences in Research and Technological Development (RTD) needed in the production of the respective
goods. Yet it does not mean that all goods included in the group ‘Low-technology-intensive goods’ are indeed
low-technology goods or that all firms that belong to those particular industries are not or less performing RTD.
In fact, some of them may require quite sophisticated technologies. The same is true for the other two groups.
The exact methodology for deriving regional-level export and import data and for estimating regional trade spe-
cialisation indicators is explicitly described in Appendix 7.1.
Table 2.1 Aggregation scheme of regional foreign trade data
Industrial group NACE description NACE Rev. 1.1
category
High/medium-high-technology-intensive
goods
Chemicals and chemical products 24
Machinery and equipment n.e.c. 29
Office machinery and computers 30
Electrical machinery and apparatus n.e.c. 31
Radio, television and communication equipment 32
Medical, precision and optical instruments 33
Motor vehicles, trailers and semi-trailers 34
Other transport equipment 35
Medium-low-technology-intensive goods Coke, refined petroleum products and nuclear fuel 23
Manufacture of rubber and plastic products 25
Other non-metallic mineral products 26
Basic metals 27
Fabricated metal products, except machinery 28
Low-technology-intensive goods Food products and beverages 15
Tobacco products 16
Textiles 17
Wearing apparel; dressing and dyeing of fur 18
Leather; manufacture of luggage, footwear etc. 19
Wood and of products of wood and cork, except furniture 20
Pulp, paper and paper products 21
Publishing, printing and reproduction of recorded media 22
Manufacture of furniture; manufacturing n.e.c. 36
2.1. INDICATORS FOR MEASURING TRADE SPECIALISATION AND TRADE PER-
FORMANCE
Trade indicators measure an economy’s ability to produce and commercialise internationally competitive
products. Thus, trade specialisation indicators reveal how a country’s, region’s or industry’s technological,
productive, institutional, etc. properties translate into global trade success. For the purpose of examining regional
and industrial trade specialisation patterns and for linking them to their potential determinants, different
indicators are defined and consequently used.
1 See: http://ec.europa.eu/eurostat/statistics-explained/index.php/Glossary:High-tech
7
The idea to measure a nation’s (and region’s, respectively) international trade performance by trade
specialisation indicators such as the Revealed Export Advantage (RXA) or Revealed Comparative Advantages
(RCA) instead of absolute shares in global exports goes back to Balassa (1965). Since Balassa’s seminal work,
many studies (e.g. Vollrath, 1991; Greenaway and Milner, 1993; Iapadre, 2001; Fertö and Hubbard, 2001;
Utkulu and Seymen, 2004) have discussed, refined (normalised), and employed his indicators. The theoretical
background of using the trade specialisation approach is based on the presumption that the international
competitiveness of industries or products relies on their performance in national (or regional) inter-industry
factor competition.
In this study, the focus is on the export specialisation that illustrates the export advantage of a a country or region
in a certain industry, which ist traditionally measured by the Revealed Export Advantage (RXA). The RXA
indicates whether a country or region puts more or less focus on exporting particular products than other
countries or regions do. It, thus, reveals in which industries a country or region realises an export advantage or
export disadvantage. More precisely, the RXA compares the export share of a certain industry in all
manufacturing exports in a given region with the global export shares of these industry in the global exports in
manufacturing goods. The RXA, thus, indicates whether the significance of a certain industry in a country’s
(region’s) total manufacturing exports is higher or lower compared to the significance the industry has in global
manufacturing exports.
Formally, the RXA of a certain industry i in year t can be expressed as follows:
,
whereby Xirt denotes the export volume X in region r and industry i in year t, Xrt denotes the total export volume
in region r in year t, Xit denotes the total global export volume of a certain industry i in year t and, finally, Xt
denotes the total global export volume across all manufacturing industries in year t. By using the log calculation,
a positive RXA value indicates that the country (region) realises comparably higher export market shares in this
specific product group/industry than it does in total manufacturing goods.
The advantage of the RXA in comparison to absolute trade indicators such as export market shares is that
relative indicators like the RXA allow comparisons between larger and smaller countries or regions and avoid
distorting effects that result from cyclical or exchange rate fluctuations (Gehle-Dechant et al., 2010). Moreover,
the RXA considers the global export performance in a certain industry and compares regional or national export
shares with their global counterparts. Thus, the regional export specialisation allows drawing conclusions about
the regional export advantages and (smart) specialisation strategies, making the RXA a very relevant indicator
for this study.
Additionally to the Revealed Export Advantage (RXA), which constitutes the main trade indicator in this report,
the Revealed Comparative Advantage (RCA) is analysed. In contrast to the RXA, the RCA considers both sides
of the trade balance. Technically, the RCA indicator relates the ratio of exports (X) to imports (M) in a certain
country (and region, respectively) r for a respective product group or industry i to the export to import ratio for
total manufactured goods in year t. Formally, it can be expressed as follows
.
A positive (negative) Revealed Comparative Advantage (RCA), thus, indicates a positive (negative) trade
specialisation and, in turn, a comparative advantage (disadvantage) for the respective product group/industry.
Hence, positive RCA values reveal a highly competitive performance of domestic firms in the industry/sector
under consideration.
2.2. STATUS QUO OF REVEALED EXPORT ADVANTAGES
The analysis starts with the status quo of the regions’ export specialisation, which for data reasons refers to the
year 2011. In this respect, Table 2.2. captures the essence of the present situation, by summarising the regions’
export specialisation by aggregated regional income groups and aggregated trade categories.
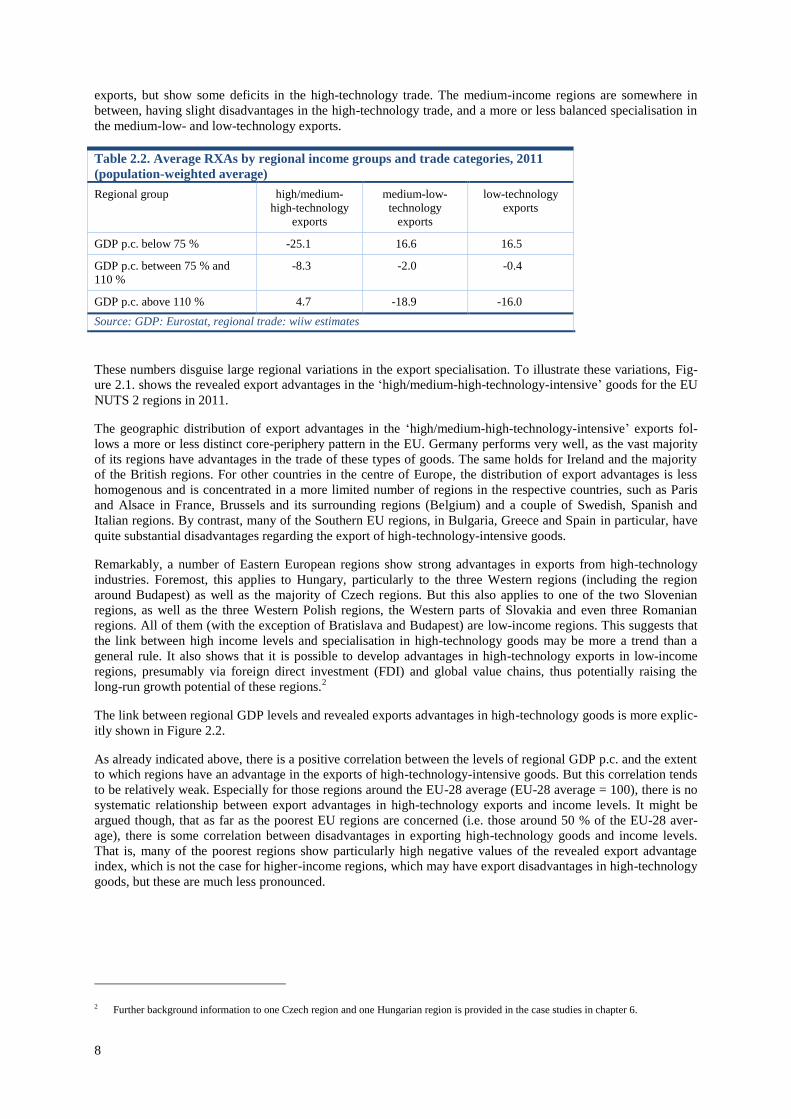
The results in Table 2.2 are quite likely to fit common expectations. High-income regions (i.e. regions with a
GDP p.c. above 110 % of the EU average) on average tend to be specialised in high-technology-intensive goods,
but are less competitive regarding the trade in less technology-intensive goods. Vice versa low-income regions
(GDP p.c. level below 75 % of the EU average) are specialised in medium-low- and low-technology-intensive
8
exports, but show some deficits in the high-technology trade. The medium-income regions are somewhere in
between, having slight disadvantages in the high-technology trade, and a more or less balanced specialisation in
the medium-low- and low-technology exports.
Table 2.2. Average RXAs by regional income groups and trade categories, 2011
(population-weighted average)
Regional group high/medium-
high-technology
exports
medium-low-
technology
exports
low-technology
exports
GDP p.c. below 75 % -25.1 16.6 16.5
GDP p.c. between 75 % and
110 %
-8.3 -2.0 -0.4
GDP p.c. above 110 % 4.7 -18.9 -16.0
Source: GDP: Eurostat, regional trade: wiiw estimates
These numbers disguise large regional variations in the export specialisation. To illustrate these variations, Fig-
ure 2.1. shows the revealed export advantages in the ‘high/medium-high-technology-intensive’ goods for the EU
NUTS 2 regions in 2011.
The geographic distribution of export advantages in the ‘high/medium-high-technology-intensive’ exports fol-
lows a more or less distinct core-periphery pattern in the EU. Germany performs very well, as the vast majority
of its regions have advantages in the trade of these types of goods. The same holds for Ireland and the majority
of the British regions. For other countries in the centre of Europe, the distribution of export advantages is less
homogenous and is concentrated in a more limited number of regions in the respective countries, such as Paris
and Alsace in France, Brussels and its surrounding regions (Belgium) and a couple of Swedish, Spanish and
Italian regions. By contrast, many of the Southern EU regions, in Bulgaria, Greece and Spain in particular, have
quite substantial disadvantages regarding the export of high-technology-intensive goods.
Remarkably, a number of Eastern European regions show strong advantages in exports from high-technology
industries. Foremost, this applies to Hungary, particularly to the three Western regions (including the region
around Budapest) as well as the majority of Czech regions. But this also applies to one of the two Slovenian
regions, as well as the three Western Polish regions, the Western parts of Slovakia and even three Romanian
regions. All of them (with the exception of Bratislava and Budapest) are low-income regions. This suggests that
the link between high income levels and specialisation in high-technology goods may be more a trend than a
general rule. It also shows that it is possible to develop advantages in high-technology exports in low-income
regions, presumably via foreign direct investment (FDI) and global value chains, thus potentially raising the
long-run growth potential of these regions.2
The link between regional GDP levels and revealed exports advantages in high-technology goods is more explic-
itly shown in Figure 2.2.
As already indicated above, there is a positive correlation between the levels of regional GDP p.c. and the extent
to which regions have an advantage in the exports of high-technology-intensive goods. But this correlation tends
to be relatively weak. Especially for those regions around the EU-28 average (EU-28 average = 100), there is no
systematic relationship between export advantages in high-technology exports and income levels. It might be
argued though, that as far as the poorest EU regions are concerned (i.e. those around 50 % of the EU-28 aver-
age), there is some correlation between disadvantages in exporting high-technology goods and income levels.
That is, many of the poorest regions show particularly high negative values of the revealed export advantage
index, which is not the case for higher-income regions, which may have export disadvantages in high-technology
goods, but these are much less pronounced.
2 Further background information to one Czech region and one Hungarian region is provided in the case studies in chapter 6.
9
Figure 2.1. Revealed export advantages, 2011, high- and medium-
high-technology-intensive goods
Source: wiiw estimates
The opposite is observable when revealed export advantages in both medium-low- and low-technology goods are
concerned (see Figure 2.3 and Figure 2.4). Firstly, the geographic distribution of the export advantages in both
categories is more or less the reverse of the core-periphery pattern observed for the revealed export advantages in
high-technology-intensive goods. That is, regions that have their advantages in exporting high-technology-
intensive goods, by construction, tend to be less specialised in the export of medium-low- or low-technology
goods. This is most obvious for the German, UK and the Irish regions, but also for all others that showed strong
revealed export advantages in high-technology-intensive goods. Still, this argument needs some qualification, as
it applies especially to the comparison of the revealed export advantages in high- and low-technology goods.
That is, regions that are specialised in high-technology exports are generally not specialised in low-technology
exports. As far as the medium-low-technology exports are concerned, the evidence is more ambiguous. There are
some regions, e.g. in Germany or the UK, that have high revealed export advantages in the high-technology-
intensive segments and, in addition, also advantages in medium-low-technology goods, even though these ad-
vantages might be small. On the other hand, there are regions that are exclusively specialised in high-technology
exports, such as the Irish regions, Paris, Oberbayern (Munich) and Stuttgart in Germany.
10
Figure 2.2. Correlation of GDP p.c. at PPS (in % of the EU average) and
revealed export advantages in high-technology-intensive goods, 2011
Note: excluding outliers
Source: GDP: Eurostat; RXAs: wiiw estimates
As far as the Southern and Eastern periphery regions are concerned, they are highly specialised in medium-low-
and low-technology-intensive exports. For example, the Bulgarian, Greek and Southern Spanish regions have
high revealed export advantages in both types of goods, while other regions, e.g. in Portugal, Southern Italy, East
Poland or North Romania, are specialised in exporting low-technology-intensive goods only.
Figure 2.3. Revealed export advantages, 2011, medium-low- and low-technology-intensive goods
Source: wiiw estimates
Still, the conclusion that the pattern of the regions’ revealed export advantages is clearly linked to their GDP
level is somewhat misleading. Undoubtedly, there is a correlation between the level of GDP p.c. and export
R² = 0,1216 -100
-80
-60
-40
-20
0
20
40
60
0 50 100 150 200 250
RX
A 2
01
1
GDP p.c. at PPS, % of EU-28 average
low income region medium income region high income region
11
specialisation in medium-low- and low-technology-intensive goods (see Figure 2.4). But this correlation is weak,
as was already the case with specialisation in high-technology exports. As a matter of fact, for the regions with
GDP p.c. levels between 80 % and 150 % of the EU-28 average, there is no correlation between any type of
export specialisation and GDP p.c. levels. There is some correlation regarding the regions with the highest in-
come levels (i.e. above 150 % of the EU-28 average), as they are, with only very few exceptions, exclusively
specialised in the export of high-technology-intensive goods. More importantly, there is a strong correlation
between specialisation in medium-low- and low-technology exports and GDP p.c. levels in the economically
weakest EU regions. In comparison with other regions, they are much more specialised in medium-low- and
low-technology-intensive exports and at the same time show larger disadvantages in the export of high-
technology goods.
One important message emanates from this. For the majority of regions, strategies to foster economic growth and
development do not necessarily need to be connected with a dramatic change in specialisation pattern (e.g. mov-
ing from low-technology specialisation to being specialised in high-technology exports). Decently high income
levels can be achieved with different types of specialisation patterns. This finding is in favour of smart speciali-
sation strategies that build on the existing strengths of especially, though not exclusively, the economically
weakest regions. Bearing in mind that they are mostly specialised in medium- and low-technology exports, the
above results suggest that is not so much a question of radically changing those regions’ specialisation pattern. It
seems much more relevant in terms of economic development to upgrade and further develop their existing (ex-
porting) industries in order to increase productivity levels in those industries and consequently increase the value
added and GDP produced in the least developed EU regions.
Figure 2.4. Correlation of GDP p.c. at PPS (in % of the EU average) and revealed export
advantages in medium-low- and low-technology-intensive goods, 2011
Note: excluding outliers
Source: GDP: Eurostat; RXAs: wiiw estimates
2.3. CHANGES IN REVEALED EXPORT ADVANTAGES
The above section argued that regional smart specialisation strategies do not necessarily have to focus on radical
changes in the regions’ specialisation structures to improve their economic growth performance. Still, the inten-
tion to do so may exist. But, how likely are such more radical strategies to succeed? To shed some light on this
question it is instructive to analyse the changes in the regions’ revealed export advantages over the past decade.
Hence this section investigates the changes in the regions’ export specialisation in the high-technology, medium-
low- and low-technology goods from the year 2000 to the year 2011. For the sake of consistency, the starting
values for the regions’ revealed export advantage are defined as the average export advantage over the first three
years of the period. Likewise, the end value is defined as the average of the last three years. Hence, the change in
the regions’ export specialisation ( is defined as: , with i denoting
the three groups of manufacturing goods.
The analysis starts with the development of the revealed export advantages in high- and medium-high-
technology-intensive goods. These are illustrated in Figure 2.5. It reveals that, in the majority of EU NUTS 2
regions, specialisation in high-technology exports increased over the last decade. This trend was on average
R² = 0,1345
-150
-100
-50
0
50
100
150
0 50 100 150 200 250
RX
A 2
01
1
GDP p.c. at PPS, % of EU-28 average
Medium-low-technology-intensive
R² = 0,0571
-150
-100
-50
0
50
100
150
0 50 100 150 200 250
RX
A 2
01
1
GDP p.c. at PPS, % of EU-28 average
Low-technology-intensive
12
stronger in the Eastern European regions, especially in Romania, though the Romanian regions started from quite
low levels of specialisation. The revealed export advantage also increased in the majority of regions in Austria,
Belgium, Germany and Italy, while a particularly large number of French and UK regions encountered a decline
in their export advantage in high- and medium-high-technology-intensive goods.
Figure 2.5. Changes in the revealed export advantage, 2000 – 2011,
high- and medium-high-technology-intensive goods
Source: wiiw estimates
These changes are further illustrated in Figure 2.6, which plots the starting values of the revealed regional export
advantages (x-axis) against the respective end values (y-axis). Thus, the position of the regions in this figure
indicates to what extent the changes in revealed export advantages led to a change in their overall pattern of
specialisation. Regions in the upper right quadrant (I) had a positive revealed advantage in high- and medium-
high-technology exports at the beginning as well as at the end of the period. Hence, although the size of their
export advantage may have changed over time, their general characteristic of being specialised in high-
technology exports did not. The same applies for the lower left quadrant (III), only that those regions had a re-
vealed disadvantage both at the beginning and at the end of the period. The most interesting cases are those in
the off-diagonal quadrants. In the upper left quadrant (IV) there are those regions where the increase in the re-
vealed export advantage was so high that they climbed up from the group of regions having disadvantages in
high-technology exports to the group of regions with revealed export advantages. Oppositely, the regions in the
lower right quadrant (II) moved from being specialised in high-technology exports at the start of the period to
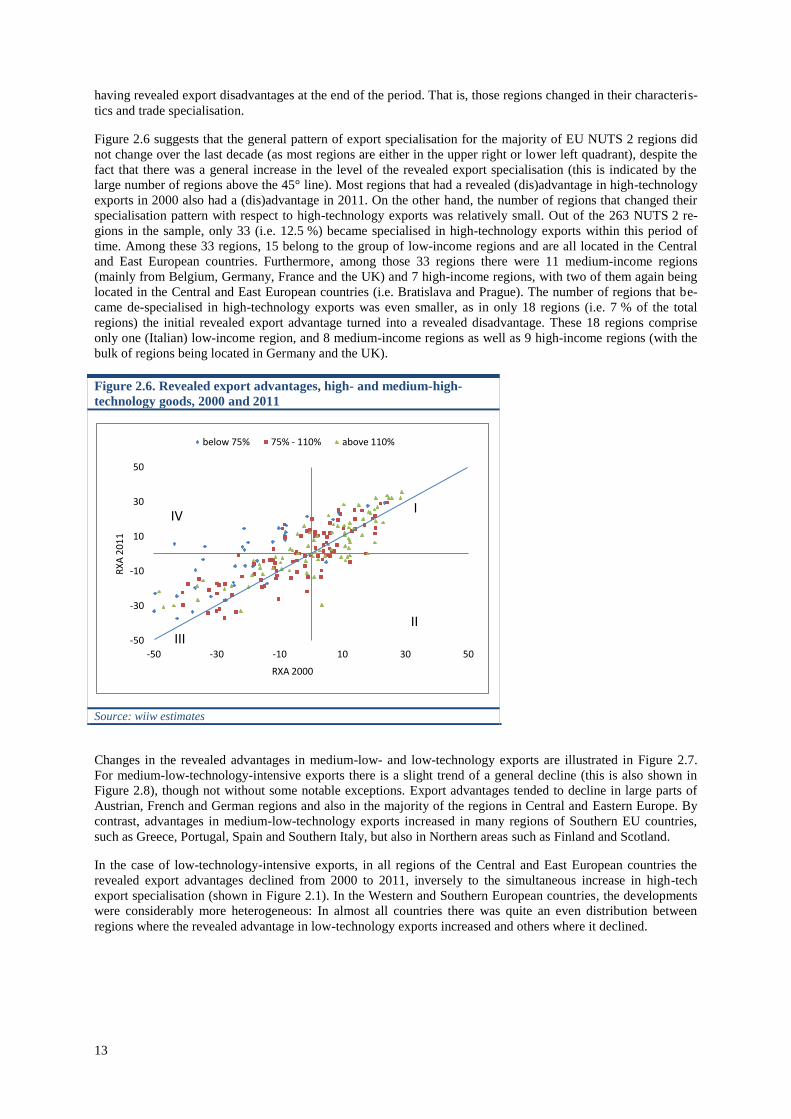
13
having revealed export disadvantages at the end of the period. That is, those regions changed in their characteris-
tics and trade specialisation.
Figure 2.6 suggests that the general pattern of export specialisation for the majority of EU NUTS 2 regions did
not change over the last decade (as most regions are either in the upper right or lower left quadrant), despite the
fact that there was a general increase in the level of the revealed export specialisation (this is indicated by the
large number of regions above the 45° line). Most regions that had a revealed (dis)advantage in high-technology
exports in 2000 also had a (dis)advantage in 2011. On the other hand, the number of regions that changed their
specialisation pattern with respect to high-technology exports was relatively small. Out of the 263 NUTS 2 re-
gions in the sample, only 33 (i.e. 12.5 %) became specialised in high-technology exports within this period of
time. Among these 33 regions, 15 belong to the group of low-income regions and are all located in the Central
and East European countries. Furthermore, among those 33 regions there were 11 medium-income regions
(mainly from Belgium, Germany, France and the UK) and 7 high-income regions, with two of them again being
located in the Central and East European countries (i.e. Bratislava and Prague). The number of regions that be-
came de-specialised in high-technology exports was even smaller, as in only 18 regions (i.e. 7 % of the total
regions) the initial revealed export advantage turned into a revealed disadvantage. These 18 regions comprise
only one (Italian) low-income region, and 8 medium-income regions as well as 9 high-income regions (with the
bulk of regions being located in Germany and the UK).
Figure 2.6. Revealed export advantages, high- and medium-high-
technology goods, 2000 and 2011
Source: wiiw estimates
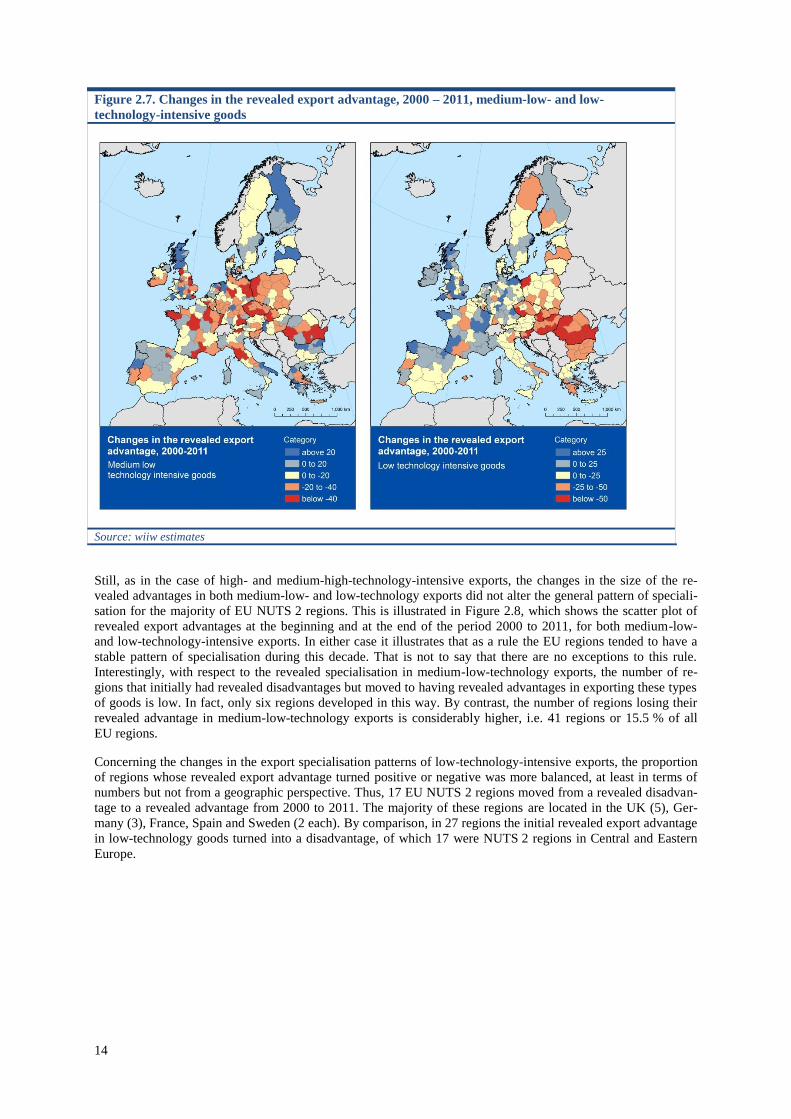
Changes in the revealed advantages in medium-low- and low-technology exports are illustrated in Figure 2.7.
For medium-low-technology-intensive exports there is a slight trend of a general decline (this is also shown in
Figure 2.8), though not without some notable exceptions. Export advantages tended to decline in large parts of
Austrian, French and German regions and also in the majority of the regions in Central and Eastern Europe. By
contrast, advantages in medium-low-technology exports increased in many regions of Southern EU countries,
such as Greece, Portugal, Spain and Southern Italy, but also in Northern areas such as Finland and Scotland.
In the case of low-technology-intensive exports, in all regions of the Central and East European countries the
revealed export advantages declined from 2000 to 2011, inversely to the simultaneous increase in high-tech
export specialisation (shown in Figure 2.1). In the Western and Southern European countries, the developments
were considerably more heterogeneous: In almost all countries there was quite an even distribution between
regions where the revealed advantage in low-technology exports increased and others where it declined.
-50
-30
-10
10
30
50
-50 -30 -10 10 30 50
RX
A 2
01
1
RXA 2000
below 75% 75% - 110% above 110%
I
II III
IV
14
Figure 2.7. Changes in the revealed export advantage, 2000 – 2011, medium-low- and low-
technology-intensive goods
Source: wiiw estimates
Still, as in the case of high- and medium-high-technology-intensive exports, the changes in the size of the re-
vealed advantages in both medium-low- and low-technology exports did not alter the general pattern of speciali-
sation for the majority of EU NUTS 2 regions. This is illustrated in Figure 2.8, which shows the scatter plot of
revealed export advantages at the beginning and at the end of the period 2000 to 2011, for both medium-low-
and low-technology-intensive exports. In either case it illustrates that as a rule the EU regions tended to have a
stable pattern of specialisation during this decade. That is not to say that there are no exceptions to this rule.
Interestingly, with respect to the revealed specialisation in medium-low-technology exports, the number of re-
gions that initially had revealed disadvantages but moved to having revealed advantages in exporting these types
of goods is low. In fact, only six regions developed in this way. By contrast, the number of regions losing their
revealed advantage in medium-low-technology exports is considerably higher, i.e. 41 regions or 15.5 % of all
EU regions.
Concerning the changes in the export specialisation patterns of low-technology-intensive exports, the proportion
of regions whose revealed export advantage turned positive or negative was more balanced, at least in terms of
numbers but not from a geographic perspective. Thus, 17 EU NUTS 2 regions moved from a revealed disadvan-
tage to a revealed advantage from 2000 to 2011. The majority of these regions are located in the UK (5), Ger-
many (3), France, Spain and Sweden (2 each). By comparison, in 27 regions the initial revealed export advantage
in low-technology goods turned into a disadvantage, of which 17 were NUTS 2 regions in Central and Eastern
Europe.

15
Figure 2.8. Revealed export advantages, medium-low- and low-technology goods, 2000 and 2011
Source: wiiw estimates
The descriptive analysis above already suggests that, in general, there is no systematic relationship between the
specialisation pattern of the regions and their GDP level. Yet the focus of smart specialisation strategies is not
necessarily the level of GDP per capita in a region, but rather the changes therein, i.e. economic growth. From
this point of view, it is of interest whether shifts in specialisation are associated with higher regional growth
rates. To analyse this, the following simple convergence equation is estimated:
In this equation is the average annual regional GDP per capita growth rate of the years 2000 to 2011,
is the initial GDP level of the region, is the change in the revealed export advantage from 2000 to
2011 and is the residual term. This equation is estimated using least squares, including country dummies in
order to account for country growth effects. The estimation is first run for the changes in the export advantage in
each of the three aggregated trade sectors. Secondly, these estimations are repeated for each income group of
regions as changes in specialisation might have different effects on the regions depending on their state of eco-
nomic development. The results are presented in Table 2.3 and Table 2.4.
Table 2.3. Regression results; dependent variable growth of GDP 2000-2011
High- and medium-
high-technology
Medium-low-
technology
Low-technology
GDP per capita in 2000 0.067 0.066 0.069
(-0.37) (-0.36) (-0.38)
Change in the revealed
export advantage
0.001 0.001 0.001
(0.38) (-0.54) (-0.32)
Observations 260 260 260
R-squared 0.78 0.78 0.78
Note: Absolute value of t-statistics in parentheses ; *significant at 5 %; ** significant at 1 %
All estimation results indicate that there is no systematic correlation between changes in specialisation and re-
gional growth performance. This is not to say that for individual regions it may not pay off to become increas-
ingly specialised in one or the other sector. It just means that there is no general trend across regions, that e.g.
becoming more specialised in exporting high-technology-intensive goods is conducive to economic growth.
Hence, if there exist specialisation advantages with respect to economic growth, they appear to be region-
Medium-low-technology
below 75% 75% - 110% above 110%
Low-technology
below 75% 75% - 110% above 110%
16
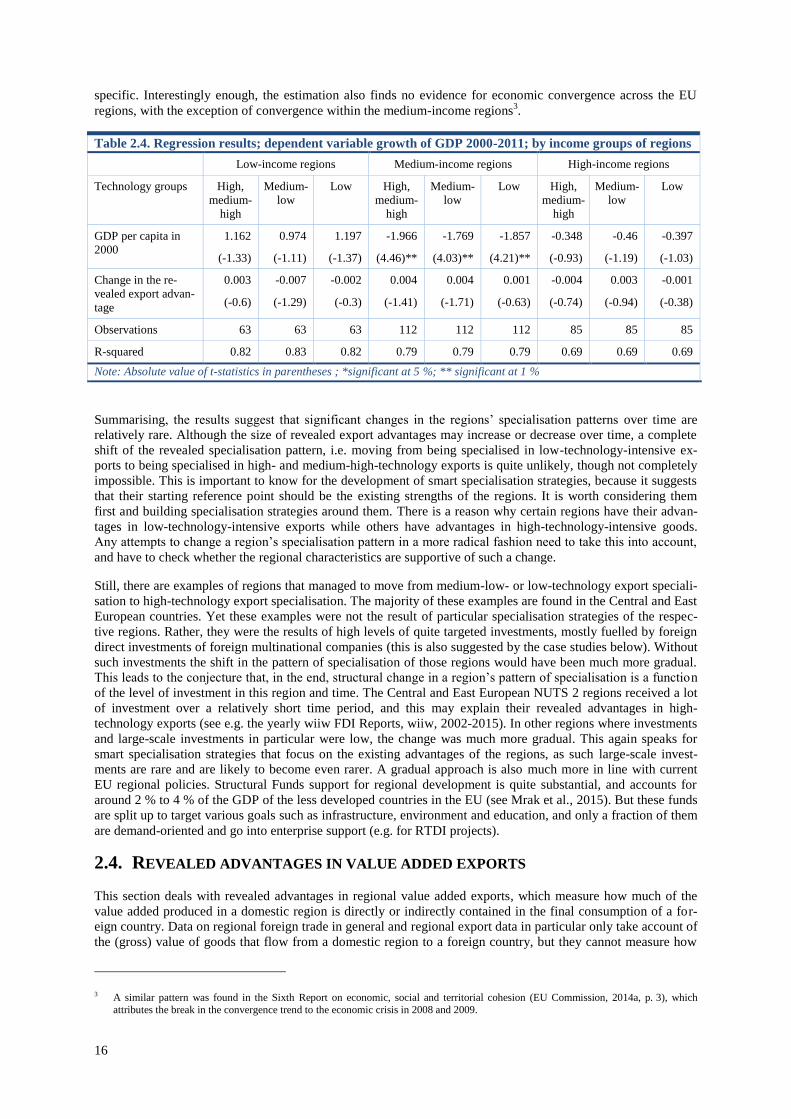
specific. Interestingly enough, the estimation also finds no evidence for economic convergence across the EU
regions, with the exception of convergence within the medium-income regions3.
Table 2.4. Regression results; dependent variable growth of GDP 2000-2011; by income groups of regions
Low-income regions Medium-income regions High-income regions
Technology groups High,
medium-
high
Medium-
low
Low High,
medium-
high
Medium-
low
Low High,
medium-
high
Medium-
low
Low
GDP per capita in
2000
1.162 0.974 1.197 -1.966 -1.769 -1.857 -0.348 -0.46 -0.397
(-1.33) (-1.11) (-1.37) (4.46)** (4.03)** (4.21)** (-0.93) (-1.19) (-1.03)
Change in the re-
vealed export advan-
tage
0.003 -0.007 -0.002 0.004 0.004 0.001 -0.004 0.003 -0.001
(-0.6) (-1.29) (-0.3) (-1.41) (-1.71) (-0.63) (-0.74) (-0.94) (-0.38)
Observations 63 63 63 112 112 112 85 85 85
R-squared 0.82 0.83 0.82 0.79 0.79 0.79 0.69 0.69 0.69
Note: Absolute value of t-statistics in parentheses ; *significant at 5 %; ** significant at 1 %
Summarising, the results suggest that significant changes in the regions’ specialisation patterns over time are
relatively rare. Although the size of revealed export advantages may increase or decrease over time, a complete
shift of the revealed specialisation pattern, i.e. moving from being specialised in low-technology-intensive ex-
ports to being specialised in high- and medium-high-technology exports is quite unlikely, though not completely
impossible. This is important to know for the development of smart specialisation strategies, because it suggests
that their starting reference point should be the existing strengths of the regions. It is worth considering them
first and building specialisation strategies around them. There is a reason why certain regions have their advan-
tages in low-technology-intensive exports while others have advantages in high-technology-intensive goods.
Any attempts to change a region’s specialisation pattern in a more radical fashion need to take this into account,
and have to check whether the regional characteristics are supportive of such a change.
Still, there are examples of regions that managed to move from medium-low- or low-technology export speciali-
sation to high-technology export specialisation. The majority of these examples are found in the Central and East
European countries. Yet these examples were not the result of particular specialisation strategies of the respec-
tive regions. Rather, they were the results of high levels of quite targeted investments, mostly fuelled by foreign
direct investments of foreign multinational companies (this is also suggested by the case studies below). Without
such investments the shift in the pattern of specialisation of those regions would have been much more gradual.
This leads to the conjecture that, in the end, structural change in a region’s pattern of specialisation is a function
of the level of investment in this region and time. The Central and East European NUTS 2 regions received a lot
of investment over a relatively short time period, and this may explain their revealed advantages in high-
technology exports (see e.g. the yearly wiiw FDI Reports, wiiw, 2002-2015). In other regions where investments
and large-scale investments in particular were low, the change was much more gradual. This again speaks for
smart specialisation strategies that focus on the existing advantages of the regions, as such large-scale invest-
ments are rare and are likely to become even rarer. A gradual approach is also much more in line with current
EU regional policies. Structural Funds support for regional development is quite substantial, and accounts for
around 2 % to 4 % of the GDP of the less developed countries in the EU (see Mrak et al., 2015). But these funds
are split up to target various goals such as infrastructure, environment and education, and only a fraction of them
are demand-oriented and go into enterprise support (e.g. for RTDI projects).
2.4. REVEALED ADVANTAGES IN VALUE ADDED EXPORTS
This section deals with revealed advantages in regional value added exports, which measure how much of the
value added produced in a domestic region is directly or indirectly contained in the final consumption of a for-
eign country. Data on regional foreign trade in general and regional export data in particular only take account of
the (gross) value of goods that flow from a domestic region to a foreign country, but they cannot measure how
3 A similar pattern was found in the Sixth Report on economic, social and territorial cohesion (EU Commission, 2014a, p. 3), which
attributes the break in the convergence trend to the economic crisis in 2008 and 2009.
17
much of this value is actually produced in the respective region. In fact, if the exports of a region are to a large
extent made of imported intermediate inputs, the actual value added produced in the region might be quite low.
Still, despite that, this region may record high exports, on the basis of foreign trade statistics. Arguably, this
induces a certain bias to the true extent of regional trade specialisation. Regional value added exports are sup-
posed to correct for this bias.
The methodology to estimate regional value added exports is described in detail in the Appendix. In short, re-
gional value added exports are not based on foreign trade statistics but on global input-output tables.
The analysis is split into two parts, the first dealing with manufacturing industries and the second dealing with
services sectors. This is done because the results regarding manufacturing industries are to a large extent similar
to the results of the previous section, though it was on goods instead of industries. In contrast, the second part
deals explicitly with selected services sectors (business, financial and tourism services) as they are economically
important but have not been covered so far.
2.4.1. Manufacturing industries
The analysis of revealed advantages in value added exports is based on the classification of industry by sectors
(NACE Rev 1.1). Importantly, though the same classification as in the analysis of revealed export advantages is
used, the analysis of value added exports is in terms of industry sectors. This is in contrast to the above analysis,
which was based on a classification by products. 14 different industry sectors are available in the original dataset
(from the WIOD database) but in order to keep the analysis and the presentation of results manageable, we ag-
gregated them into three groups of industries:
a) high- and medium-high-technology-intensive industries,
b) medium-low-technology-intensive industries, and
c) low-technology-intensive industries.
The grouping of industries follows the scheme in Table 2.1 above, only that instead of being applied to goods
exports it is applied to manufacturing industry sectors.
The fact that value added exports are in terms of industry sectors also has implications for comparing the results
with those derived above from the analysis of revealed export advantages as there is no exact one-to-one match
between industry and product level data. Although being correlated, industry and product level data differ, as e.g.
one product could be produced by different industry sectors. Even if this difference may be small in practice, it
has to be kept in mind when comparing the results of the two analyses.
Figure 2.9 shows three maps (one for each aggregated industry group) on the regional distribution of revealed
advantages in value added exports. As already mentioned, from a general perspective the geographic pattern of
revealed advantages in value added exports of high- and medium-high-, medium-low- and low-technology-
intensive industries corresponds strongly to the respective pattern of revealed gross export advantages described
above. Thus, there is strong evidence of a core-periphery distribution in revealed advantages for high- and me-
dium-high-tech and low-technology industry value added exports. For medium-low-technology industries, the
geographic pattern is much more heterogeneous, with revealed advantages quite evenly distributed over the EU
regions.
Similarly, the correlation of GDP per capita levels and the size of revealed advantages in value added exports for
each industry group in 2011 (Figure 2.10) strongly resembles the correlation of GDP per capita and revealed
gross export advantages (Figure 2.2. and Figure 2.4). There is a positive but weak correlation between GDP per
capita levels for high- and medium-high-technology industries value added exports, while for medium-low- and
low-tech industries value added exports there is a weak negative correlation with GDP levels.
The similarity between revealed advantages in value added and gross exports holds also over time as Figure 2.11
demonstrates. Plotting the revealed advantages in value added exports for the three industry groups for the year
2000 against the respective value for 2011 indicates, just as in the analysis above, that the regional patterns of
revealed advantages in value added exports tend to be very stable over time, with only few regions experiencing
a shift in their patterns.
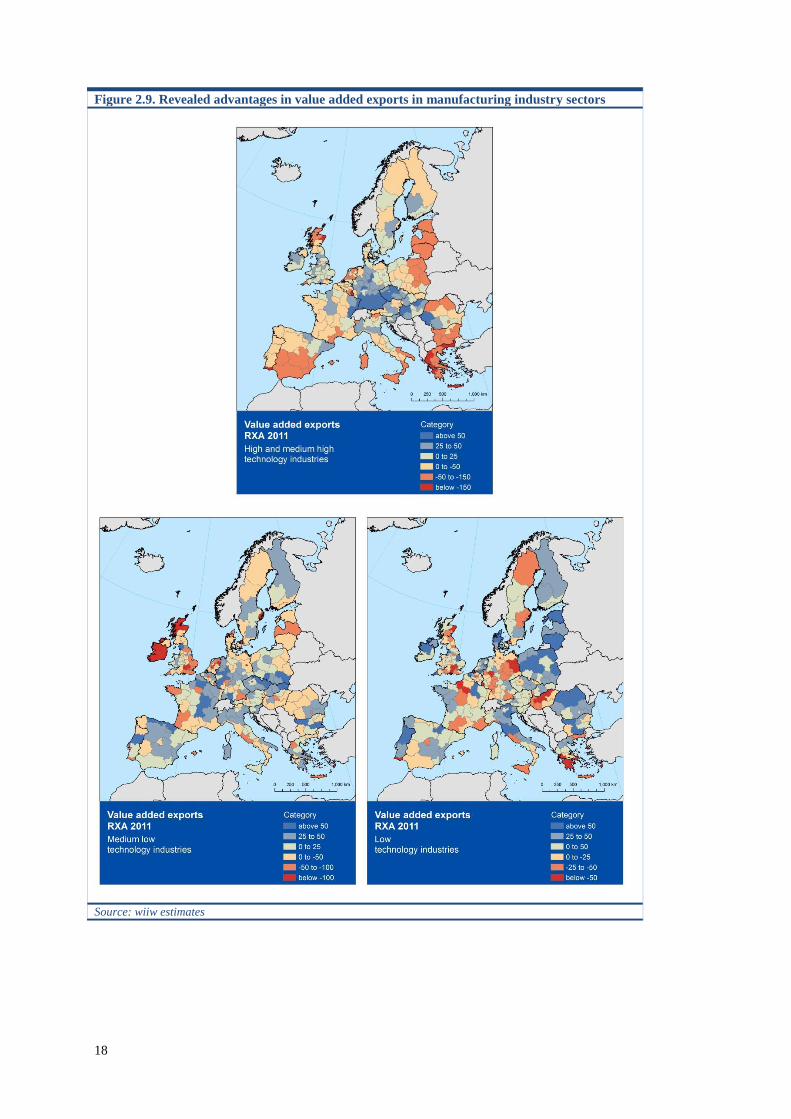
18
Figure 2.9. Revealed advantages in value added exports in manufacturing industry sectors
Source: wiiw estimates
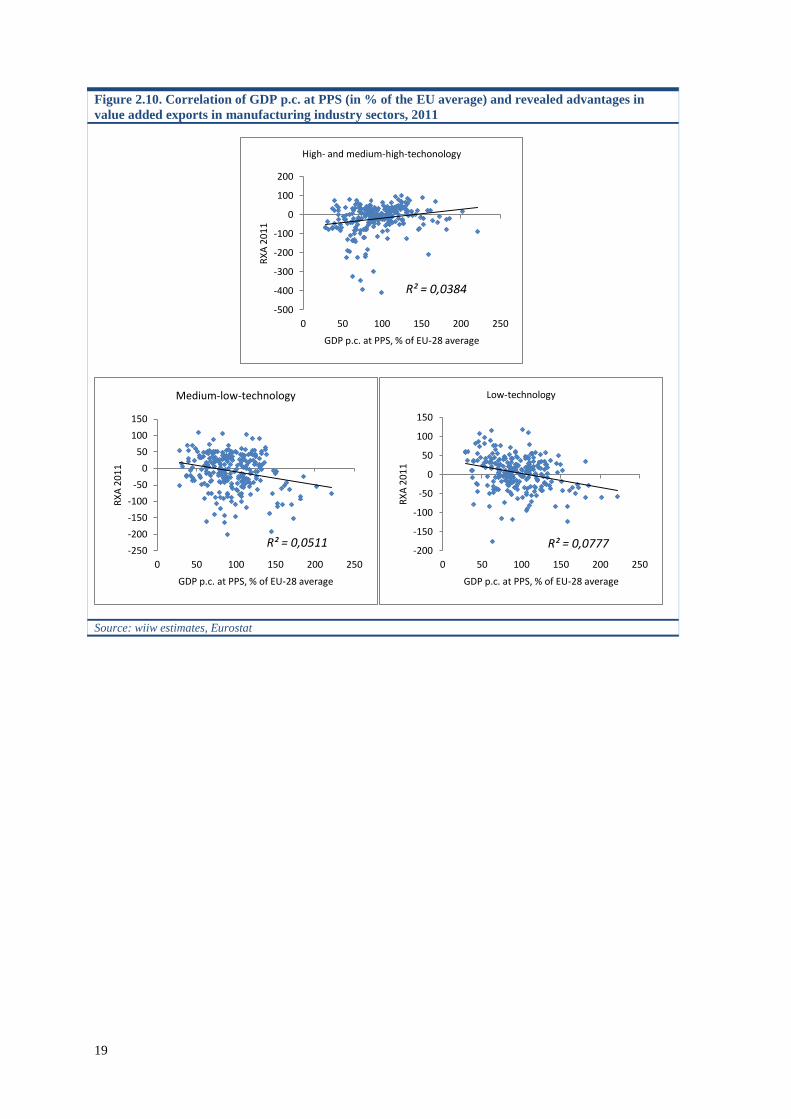
19
Figure 2.10. Correlation of GDP p.c. at PPS (in % of the EU average) and revealed advantages in
value added exports in manufacturing industry sectors, 2011
Source: wiiw estimates, Eurostat
R² = 0,0384
-500
-400
-300
-200
-100
0
100
200
0 50 100 150 200 250
RX
A 2
01
1
GDP p.c. at PPS, % of EU-28 average
High- and medium-high-techonology
R² = 0,0511 -250
-200
-150
-100
-50
0
50
100
150
0 50 100 150 200 250
RX
A 2
01
1
GDP p.c. at PPS, % of EU-28 average
Medium-low-technology
R² = 0,0777 -200
-150
-100
-50
0
50
100
150
0 50 100 150 200 250
RX
A 2
01
1
GDP p.c. at PPS, % of EU-28 average
Low-technology
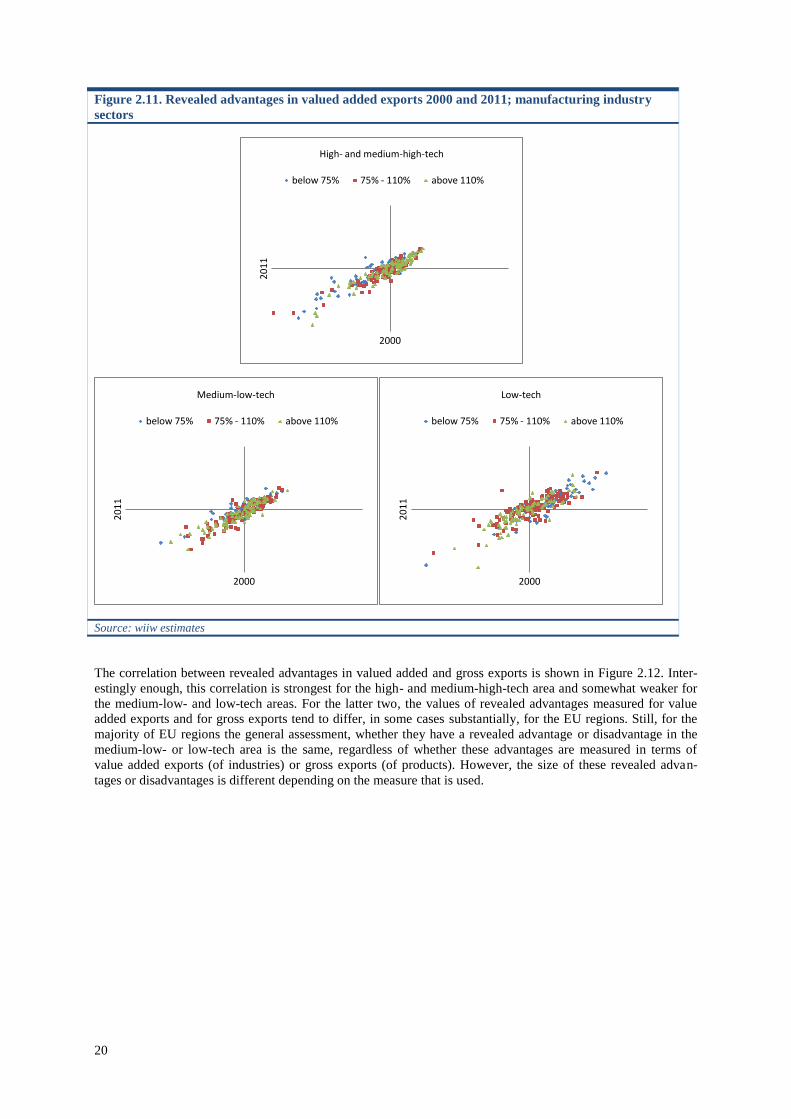
20
Figure 2.11. Revealed advantages in valued added exports 2000 and 2011; manufacturing industry
sectors
Source: wiiw estimates
The correlation between revealed advantages in valued added and gross exports is shown in Figure 2.12. Inter-
estingly enough, this correlation is strongest for the high- and medium-high-tech area and somewhat weaker for
the medium-low- and low-tech areas. For the latter two, the values of revealed advantages measured for value
added exports and for gross exports tend to differ, in some cases substantially, for the EU regions. Still, for the
majority of EU regions the general assessment, whether they have a revealed advantage or disadvantage in the
medium-low- or low-tech area is the same, regardless of whether these advantages are measured in terms of
value added exports (of industries) or gross exports (of products). However, the size of these revealed advan-
tages or disadvantages is different depending on the measure that is used.
20
11
2000
High- and medium-high-tech
below 75% 75% - 110% above 110%
20
11
2000
Medium-low-tech
below 75% 75% - 110% above 110%
20
11
2000
Low-tech
below 75% 75% - 110% above 110%
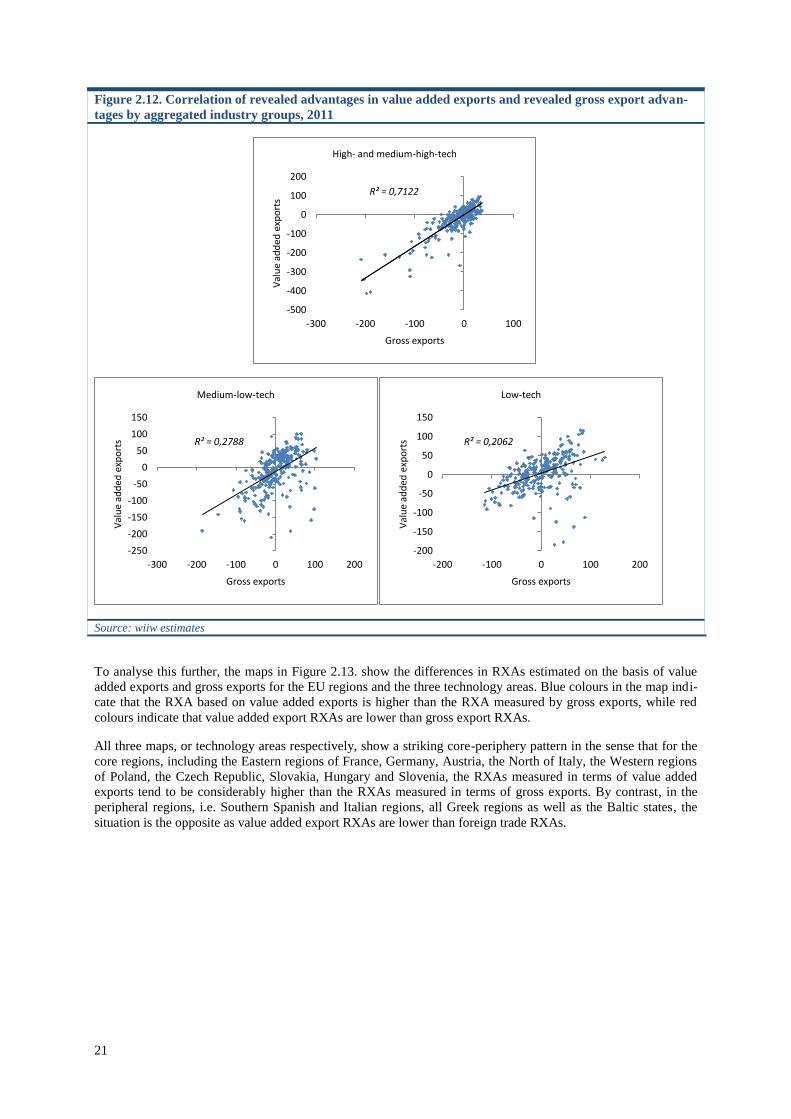
21
Figure 2.12. Correlation of revealed advantages in value added exports and revealed gross export advan-
tages by aggregated industry groups, 2011
Source: wiiw estimates
To analyse this further, the maps in Figure 2.13. show the differences in RXAs estimated on the basis of value
added exports and gross exports for the EU regions and the three technology areas. Blue colours in the map indi-
cate that the RXA based on value added exports is higher than the RXA measured by gross exports, while red
colours indicate that value added export RXAs are lower than gross export RXAs.
All three maps, or technology areas respectively, show a striking core-periphery pattern in the sense that for the
core regions, including the Eastern regions of France, Germany, Austria, the North of Italy, the Western regions
of Poland, the Czech Republic, Slovakia, Hungary and Slovenia, the RXAs measured in terms of value added
exports tend to be considerably higher than the RXAs measured in terms of gross exports. By contrast, in the
peripheral regions, i.e. Southern Spanish and Italian regions, all Greek regions as well as the Baltic states, the
situation is the opposite as value added export RXAs are lower than foreign trade RXAs.
R² = 0,7122
-500
-400
-300
-200
-100
0
100
200
-300 -200 -100 0 100
Val
ue
add
ed e
xpo
rts
Gross exports
High- and medium-high-tech
R² = 0,2788
-250
-200
-150
-100
-50
0
50
100
150
-300 -200 -100 0 100 200
Val
ue
add
ed e
xpo
rts
Gross exports
Medium-low-tech
R² = 0,2062
-200
-150
-100
-50
0
50
100
150
-200 -100 0 100 200
Val
ue
add
ed e
xpo
rts
Gross exports
Low-tech
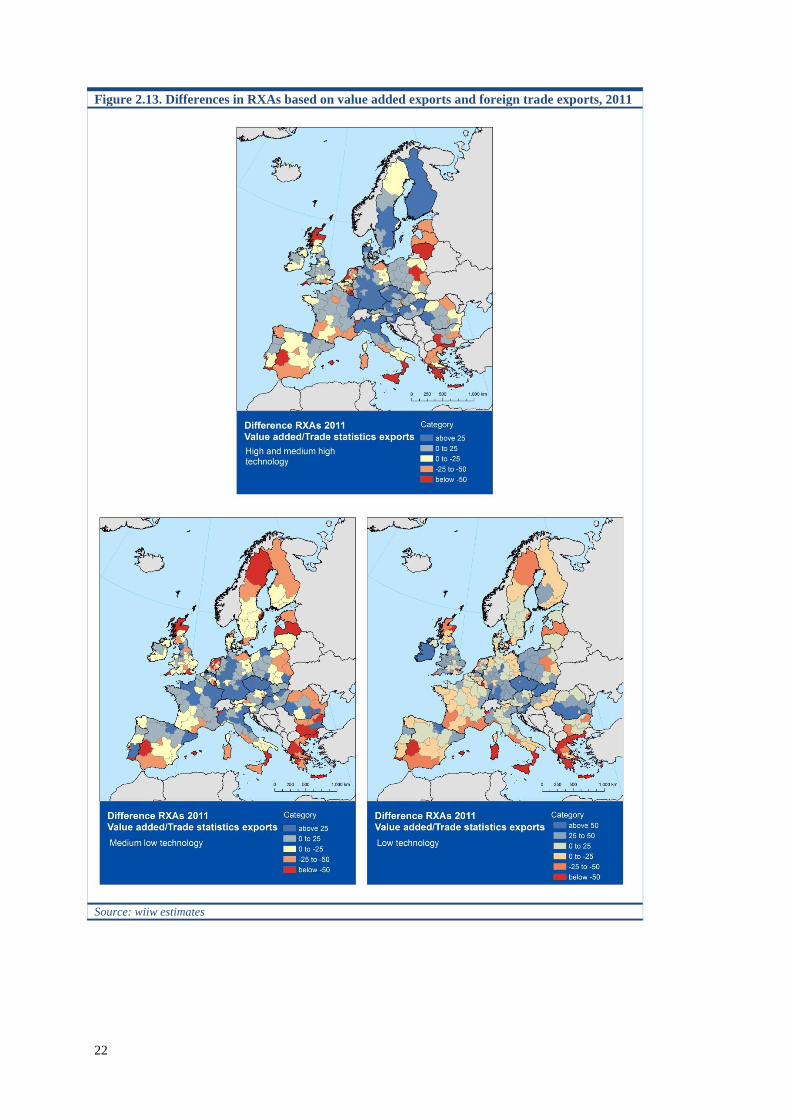
22
Figure 2.13. Differences in RXAs based on value added exports and foreign trade exports, 2011
Source: wiiw estimates
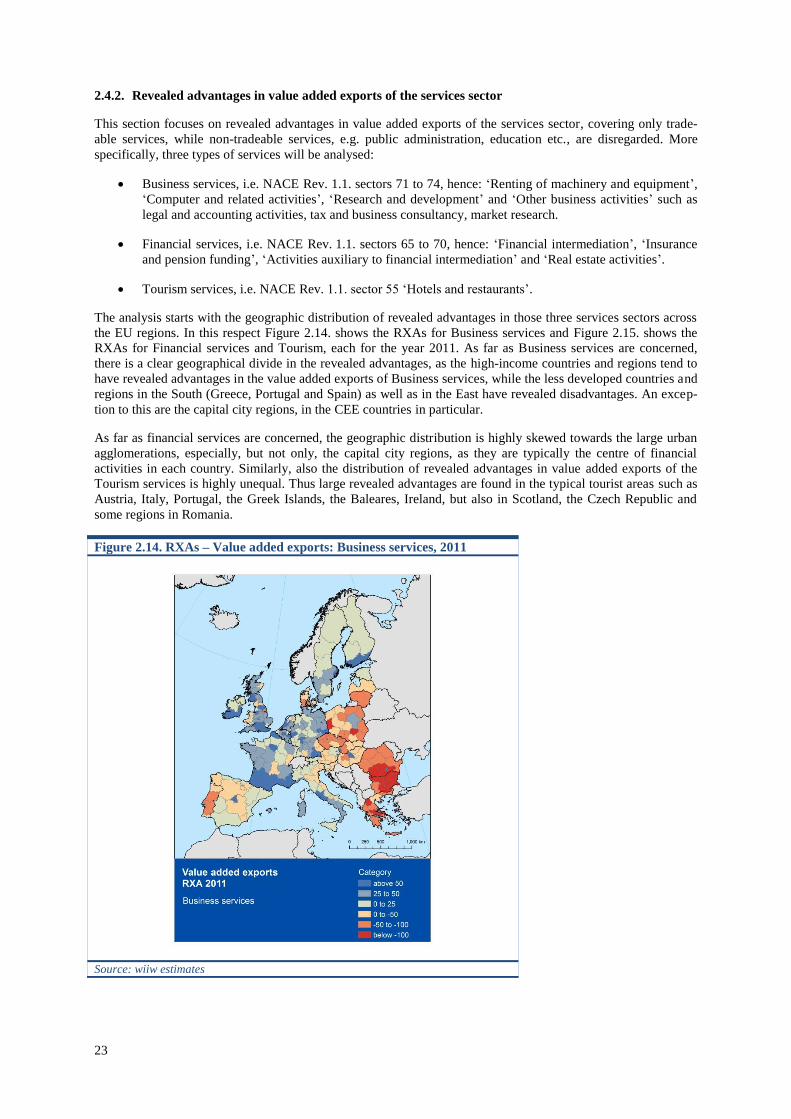
23
2.4.2. Revealed advantages in value added exports of the services sector
This section focuses on revealed advantages in value added exports of the services sector, covering only trade-
able services, while non-tradeable services, e.g. public administration, education etc., are disregarded. More
specifically, three types of services will be analysed:
Business services, i.e. NACE Rev. 1.1. sectors 71 to 74, hence: ‘Renting of machinery and equipment’,
‘Computer and related activities’, ‘Research and development’ and ‘Other business activities’ such as
legal and accounting activities, tax and business consultancy, market research.
Financial services, i.e. NACE Rev. 1.1. sectors 65 to 70, hence: ‘Financial intermediation’, ‘Insurance
and pension funding’, ‘Activities auxiliary to financial intermediation’ and ‘Real estate activities’.
Tourism services, i.e. NACE Rev. 1.1. sector 55 ‘Hotels and restaurants’.
The analysis starts with the geographic distribution of revealed advantages in those three services sectors across
the EU regions. In this respect Figure 2.14. shows the RXAs for Business services and Figure 2.15. shows the
RXAs for Financial services and Tourism, each for the year 2011. As far as Business services are concerned,
there is a clear geographical divide in the revealed advantages, as the high-income countries and regions tend to
have revealed advantages in the value added exports of Business services, while the less developed countries and
regions in the South (Greece, Portugal and Spain) as well as in the East have revealed disadvantages. An excep-
tion to this are the capital city regions, in the CEE countries in particular.
As far as financial services are concerned, the geographic distribution is highly skewed towards the large urban
agglomerations, especially, but not only, the capital city regions, as they are typically the centre of financial
activities in each country. Similarly, also the distribution of revealed advantages in value added exports of the
Tourism services is highly unequal. Thus large revealed advantages are found in the typical tourist areas such as
Austria, Italy, Portugal, the Greek Islands, the Baleares, Ireland, but also in Scotland, the Czech Republic and
some regions in Romania.
Figure 2.14. RXAs – Value added exports: Business services, 2011
Source: wiiw estimates
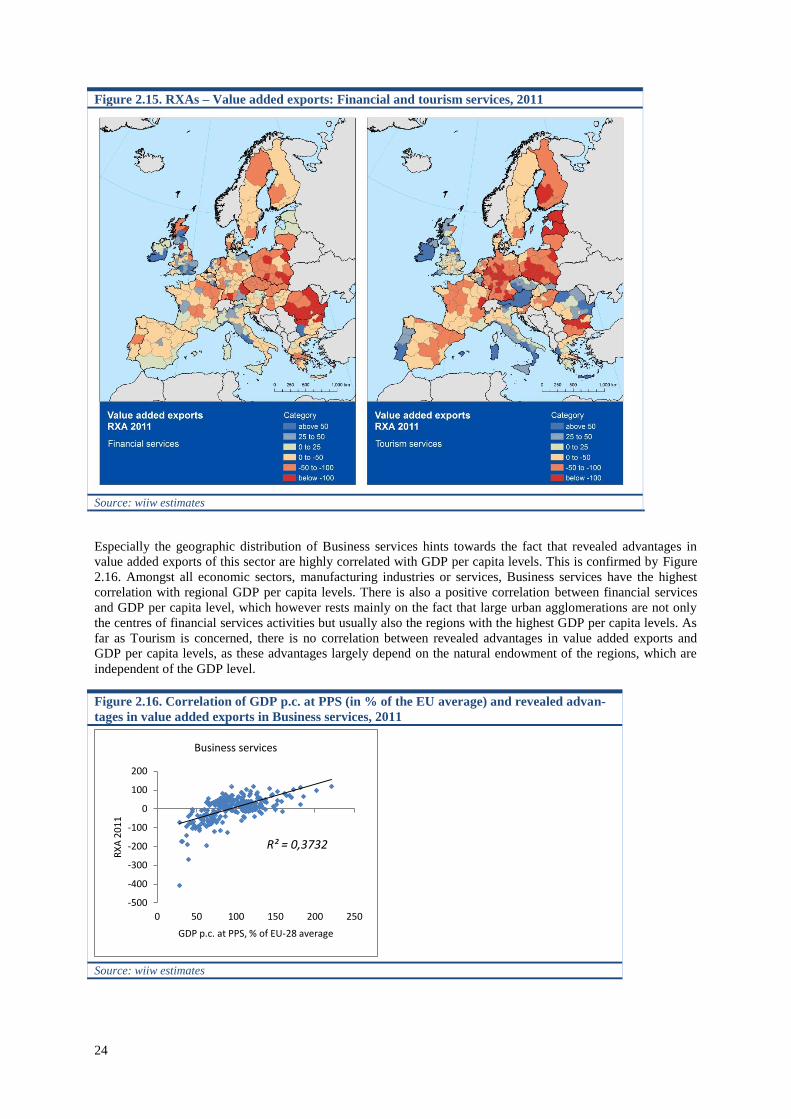
24
Figure 2.15. RXAs – Value added exports: Financial and tourism services, 2011
Source: wiiw estimates
Especially the geographic distribution of Business services hints towards the fact that revealed advantages in
value added exports of this sector are highly correlated with GDP per capita levels. This is confirmed by Figure
2.16. Amongst all economic sectors, manufacturing industries or services, Business services have the highest
correlation with regional GDP per capita levels. There is also a positive correlation between financial services
and GDP per capita level, which however rests mainly on the fact that large urban agglomerations are not only
the centres of financial services activities but usually also the regions with the highest GDP per capita levels. As
far as Tourism is concerned, there is no correlation between revealed advantages in value added exports and
GDP per capita levels, as these advantages largely depend on the natural endowment of the regions, which are
independent of the GDP level.
Figure 2.16. Correlation of GDP p.c. at PPS (in % of the EU average) and revealed advan-
tages in value added exports in Business services, 2011
Source: wiiw estimates
R² = 0,3732
-500
-400
-300
-200
-100
0
100
200
0 50 100 150 200 250
RX
A 2
01
1
GDP p.c. at PPS, % of EU-28 average
Business services
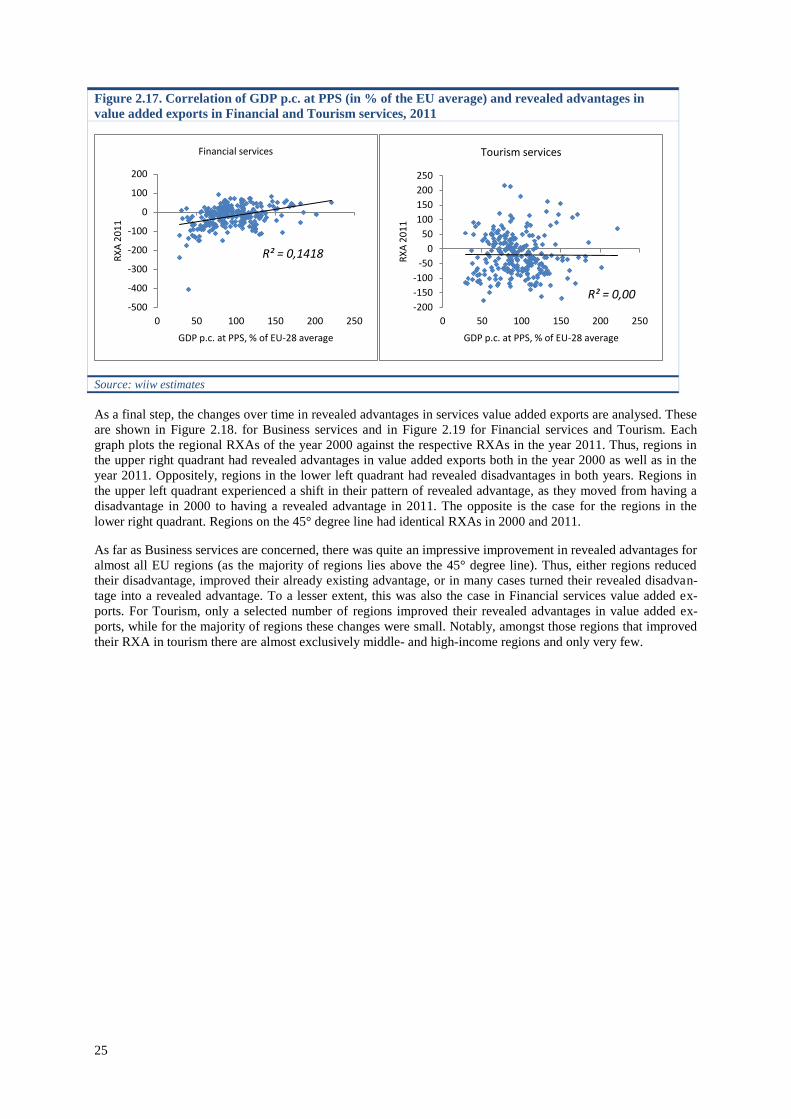
25
Figure 2.17. Correlation of GDP p.c. at PPS (in % of the EU average) and revealed advantages in
value added exports in Financial and Tourism services, 2011
Source: wiiw estimates
As a final step, the changes over time in revealed advantages in services value added exports are analysed. These
are shown in Figure 2.18. for Business services and in Figure 2.19 for Financial services and Tourism. Each
graph plots the regional RXAs of the year 2000 against the respective RXAs in the year 2011. Thus, regions in
the upper right quadrant had revealed advantages in value added exports both in the year 2000 as well as in the
year 2011. Oppositely, regions in the lower left quadrant had revealed disadvantages in both years. Regions in
the upper left quadrant experienced a shift in their pattern of revealed advantage, as they moved from having a
disadvantage in 2000 to having a revealed advantage in 2011. The opposite is the case for the regions in the
lower right quadrant. Regions on the 45° degree line had identical RXAs in 2000 and 2011.
As far as Business services are concerned, there was quite an impressive improvement in revealed advantages for
almost all EU regions (as the majority of regions lies above the 45° degree line). Thus, either regions reduced
their disadvantage, improved their already existing advantage, or in many cases turned their revealed disadvan-
tage into a revealed advantage. To a lesser extent, this was also the case in Financial services value added ex-
ports. For Tourism, only a selected number of regions improved their revealed advantages in value added ex-
ports, while for the majority of regions these changes were small. Notably, amongst those regions that improved
their RXA in tourism there are almost exclusively middle- and high-income regions and only very few.
R² = 0,1418
-500
-400
-300
-200
-100
0
100
200
0 50 100 150 200 250
RX
A 2
01
1
GDP p.c. at PPS, % of EU-28 average
Financial services
R² = 0,00 -200
-150
-100
-50
0
50
100
150
200
250
0 50 100 150 200 250
RX
A 2
01
1
GDP p.c. at PPS, % of EU-28 average
Tourism services
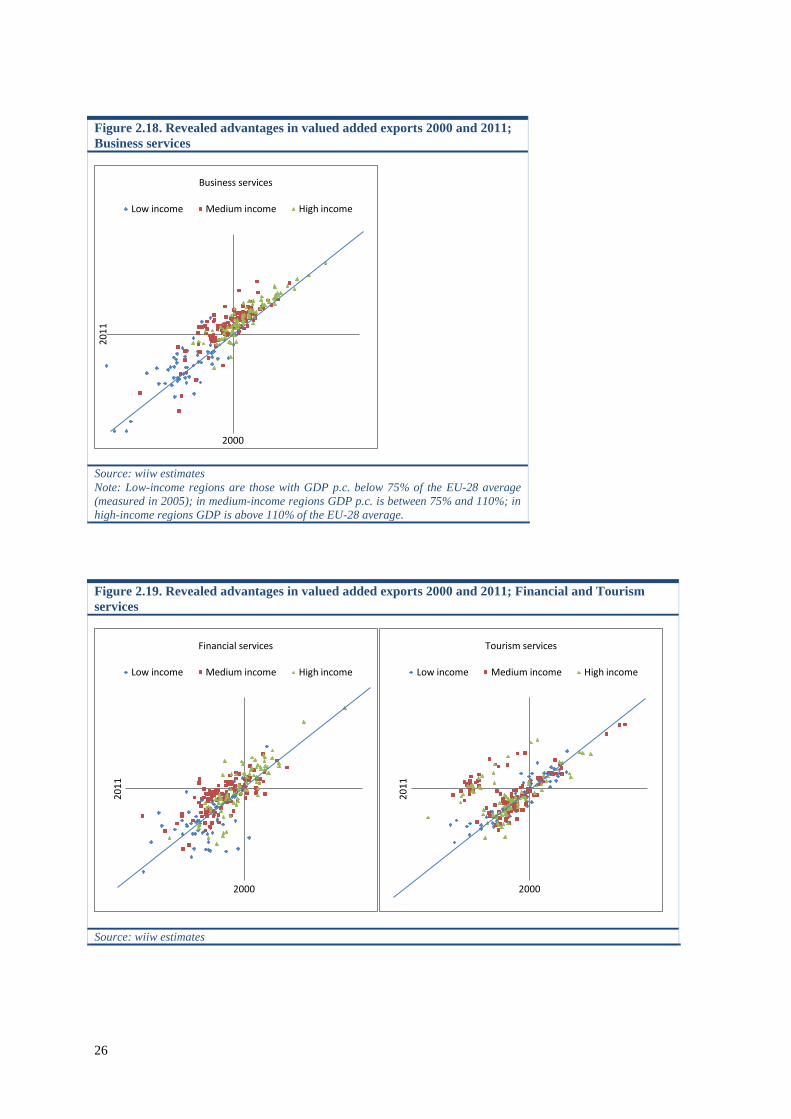
26
Figure 2.18. Revealed advantages in valued added exports 2000 and 2011;
Business services
Source: wiiw estimates
Note: Low-income regions are those with GDP p.c. below 75% of the EU-28 average
(measured in 2005); in medium-income regions GDP p.c. is between 75% and 110%; in
high-income regions GDP is above 110% of the EU-28 average.
Figure 2.19. Revealed advantages in valued added exports 2000 and 2011; Financial and Tourism
services
Source: wiiw estimates
20
11
2000
Business services
Low income Medium income High income
20
11
2000
Financial services
Low income Medium income High income
20
11
2000
Tourism services
Low income Medium income High income
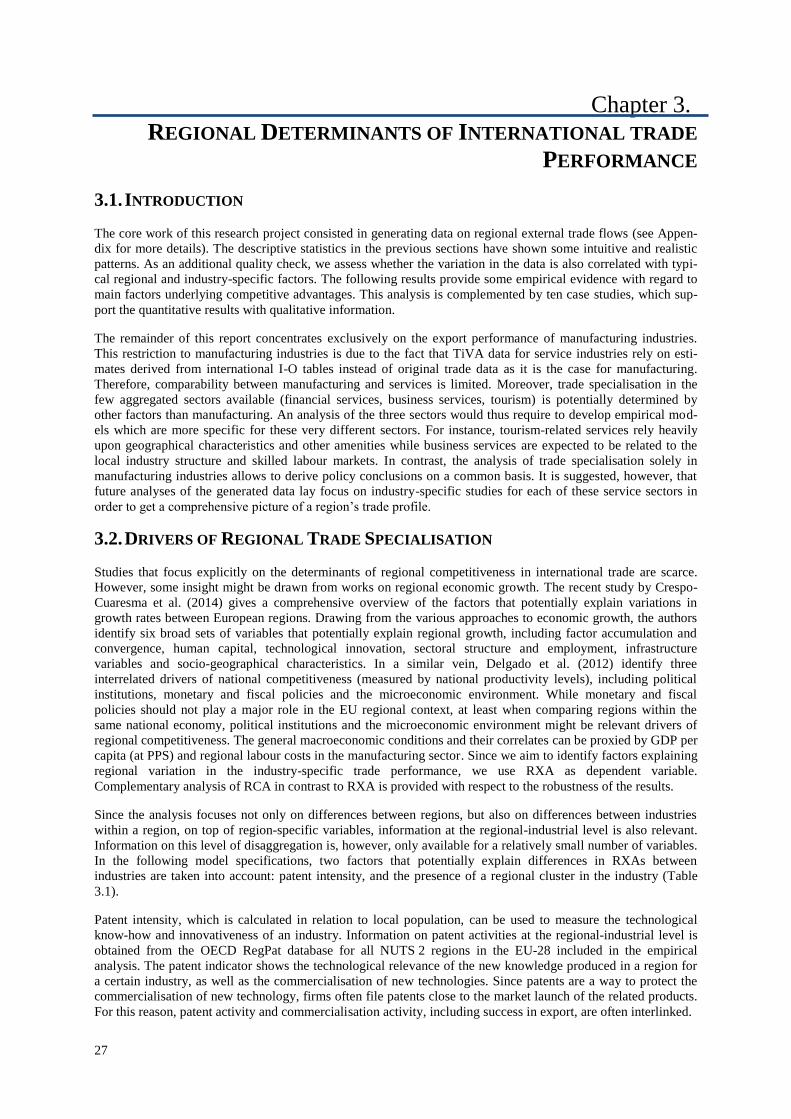
27
Chapter 3. REGIONAL DETERMINANTS OF INTERNATIONAL TRADE
PERFORMANCE
3.1. INTRODUCTION
The core work of this research project consisted in generating data on regional external trade flows (see Appen-
dix for more details). The descriptive statistics in the previous sections have shown some intuitive and realistic
patterns. As an additional quality check, we assess whether the variation in the data is also correlated with typi-
cal regional and industry-specific factors. The following results provide some empirical evidence with regard to
main factors underlying competitive advantages. This analysis is complemented by ten case studies, which sup-
port the quantitative results with qualitative information.
The remainder of this report concentrates exclusively on the export performance of manufacturing industries.
This restriction to manufacturing industries is due to the fact that TiVA data for service industries rely on esti-
mates derived from international I-O tables instead of original trade data as it is the case for manufacturing.
Therefore, comparability between manufacturing and services is limited. Moreover, trade specialisation in the
few aggregated sectors available (financial services, business services, tourism) is potentially determined by
other factors than manufacturing. An analysis of the three sectors would thus require to develop empirical mod-
els which are more specific for these very different sectors. For instance, tourism-related services rely heavily
upon geographical characteristics and other amenities while business services are expected to be related to the
local industry structure and skilled labour markets. In contrast, the analysis of trade specialisation solely in
manufacturing industries allows to derive policy conclusions on a common basis. It is suggested, however, that
future analyses of the generated data lay focus on industry-specific studies for each of these service sectors in
order to get a comprehensive picture of a region’s trade profile.
3.2. DRIVERS OF REGIONAL TRADE SPECIALISATION
Studies that focus explicitly on the determinants of regional competitiveness in international trade are scarce.
However, some insight might be drawn from works on regional economic growth. The recent study by Crespo-
Cuaresma et al. (2014) gives a comprehensive overview of the factors that potentially explain variations in
growth rates between European regions. Drawing from the various approaches to economic growth, the authors
identify six broad sets of variables that potentially explain regional growth, including factor accumulation and
convergence, human capital, technological innovation, sectoral structure and employment, infrastructure
variables and socio-geographical characteristics. In a similar vein, Delgado et al. (2012) identify three
interrelated drivers of national competitiveness (measured by national productivity levels), including political
institutions, monetary and fiscal policies and the microeconomic environment. While monetary and fiscal
policies should not play a major role in the EU regional context, at least when comparing regions within the
same national economy, political institutions and the microeconomic environment might be relevant drivers of
regional competitiveness. The general macroeconomic conditions and their correlates can be proxied by GDP per
capita (at PPS) and regional labour costs in the manufacturing sector. Since we aim to identify factors explaining
regional variation in the industry-specific trade performance, we use RXA as dependent variable.
Complementary analysis of RCA in contrast to RXA is provided with respect to the robustness of the results.
Since the analysis focuses not only on differences between regions, but also on differences between industries
within a region, on top of region-specific variables, information at the regional-industrial level is also relevant.
Information on this level of disaggregation is, however, only available for a relatively small number of variables.
In the following model specifications, two factors that potentially explain differences in RXAs between
industries are taken into account: patent intensity, and the presence of a regional cluster in the industry (Table
3.1).
Patent intensity, which is calculated in relation to local population, can be used to measure the technological
know-how and innovativeness of an industry. Information on patent activities at the regional-industrial level is
obtained from the OECD RegPat database for all NUTS 2 regions in the EU-28 included in the empirical
analysis. The patent indicator shows the technological relevance of the new knowledge produced in a region for
a certain industry, as well as the commercialisation of new technologies. Since patents are a way to protect the
commercialisation of new technology, firms often file patents close to the market launch of the related products.
For this reason, patent activity and commercialisation activity, including success in export, are often interlinked.
28
Table 3.1 Explanatory Variables
Variable Measures Data Source
Regional knowledge base/innovation capacity
Industry-specific patent intensity
Number of Patents filed in a certain industry in a
given year per 1,000 inhabitants (log.). See Schmoch
et al. (2003) for the industry-specific assignment of
patents.
OECD RegPat
Technological and
non-technological
innovations
reported by SMEs
Normalised indicator for innovating SMEs as a share
on all SMEs. Two types of innovation are
distinguished:
Technological innovations
Non-technological innovations
EU Regional Innovation Scoreboard
Business
expenditure on
R&D (BERD)
BERD related to GDP (log.). Annual data partially
estimated through linear interpolation.
Eurostat Regional Database
Higher education
expenditure on
R&D (HERD)
HERD related to GDP (log.) Annual data partially
estimated through linear interpolation.
Eurostat Regional Database
Share of 30 to 34-
year olds with
tertiary education
Share of 30 to 34-year olds with tertiary education
(ISCED97 5 and 6).
Eurostat Regional Database
Regional economic characteristics
GDP per capita Gross domestic product (GDP) at current market
prices divided by total population (in 1,000s)
Eurostat Regional Data Base
Population Density Total Population (as on January, 1st) divided by the
size of the region.
Eurostat, Regional Database
Industry-specific clusters
Variable indicating the size of an industrial cluster
within a certain region, yearly values from 0 to 3. The
average over the whole time span was calculated in
order to overcome missing information in single
years.
European Cluster Observatory
Business Service
Clusters
Binary Variables indicating the presence of relevant
service clusters in a given region. The service sectors
include: business services, distribution, education and
knowledge creation, financial services and
transportation and logistics. Constant averages (see
‘Clusters’).
European Cluster Observatory
Regional institutional characteristics
ERDF innovation Regional ERDF Funding (2007-2012) devoted to
research and innovation, share of priority 1 on total
funding
DG Regio
(raw data downloaded on 12/11/2014 from
http://ec.europa.eu/regional_policy/index.cf
m/de/policy/evaluations/data-for-research/),
own estimations (e.g. assignement of funding
information only available at NUTS 1 level.)
Institutional
Quality
Quality of Government Index 2010 (log.) Charron et al. (2014)
Accessibility and borders
Accessibility Composite index including regional endowment with
road, railroad and airports.
ESPON
Border Region Dummy variable indicating whether a region is
located at the national border.
Own reseach
Sea Border Dummy variable indicating whether a region is
located at the sea.
Own reseach
Source: Own compilation by NIW.
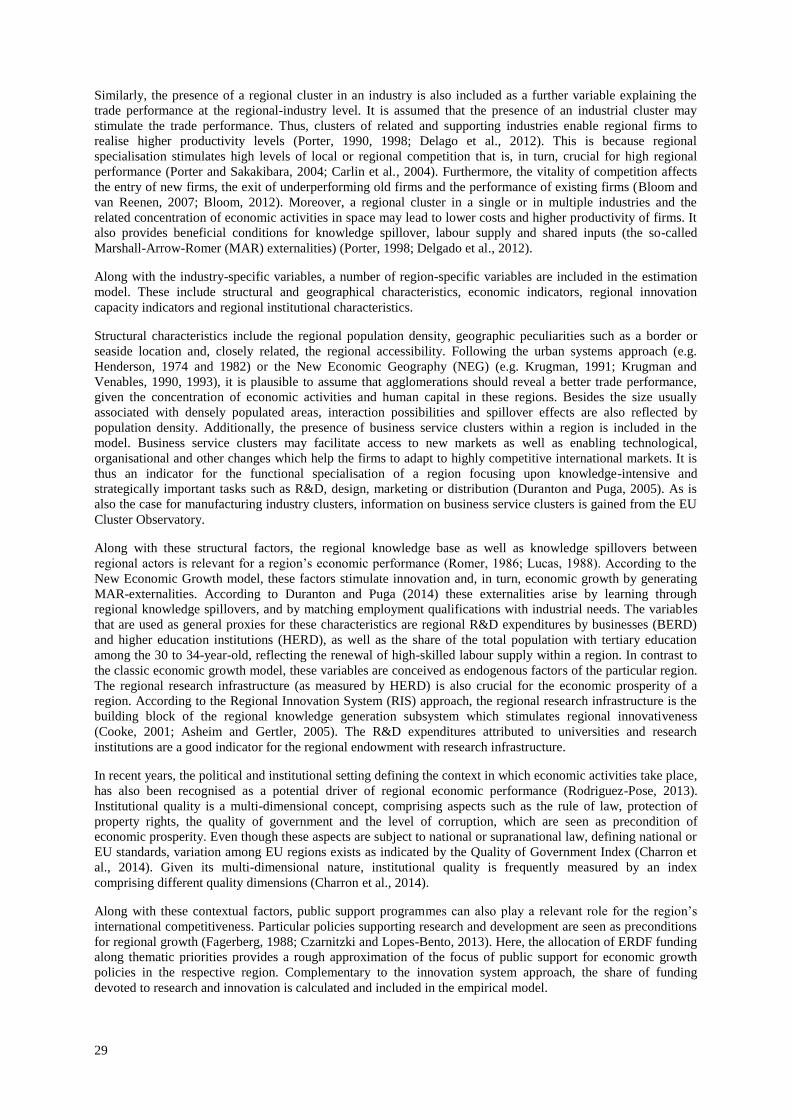
29
Similarly, the presence of a regional cluster in an industry is also included as a further variable explaining the
trade performance at the regional-industry level. It is assumed that the presence of an industrial cluster may
stimulate the trade performance. Thus, clusters of related and supporting industries enable regional firms to
realise higher productivity levels (Porter, 1990, 1998; Delago et al., 2012). This is because regional
specialisation stimulates high levels of local or regional competition that is, in turn, crucial for high regional
performance (Porter and Sakakibara, 2004; Carlin et al., 2004). Furthermore, the vitality of competition affects
the entry of new firms, the exit of underperforming old firms and the performance of existing firms (Bloom and
van Reenen, 2007; Bloom, 2012). Moreover, a regional cluster in a single or in multiple industries and the
related concentration of economic activities in space may lead to lower costs and higher productivity of firms. It
also provides beneficial conditions for knowledge spillover, labour supply and shared inputs (the so-called
Marshall-Arrow-Romer (MAR) externalities) (Porter, 1998; Delgado et al., 2012).
Along with the industry-specific variables, a number of region-specific variables are included in the estimation
model. These include structural and geographical characteristics, economic indicators, regional innovation
capacity indicators and regional institutional characteristics.
Structural characteristics include the regional population density, geographic peculiarities such as a border or
seaside location and, closely related, the regional accessibility. Following the urban systems approach (e.g.
Henderson, 1974 and 1982) or the New Economic Geography (NEG) (e.g. Krugman, 1991; Krugman and
Venables, 1990, 1993), it is plausible to assume that agglomerations should reveal a better trade performance,
given the concentration of economic activities and human capital in these regions. Besides the size usually
associated with densely populated areas, interaction possibilities and spillover effects are also reflected by
population density. Additionally, the presence of business service clusters within a region is included in the
model. Business service clusters may facilitate access to new markets as well as enabling technological,
organisational and other changes which help the firms to adapt to highly competitive international markets. It is
thus an indicator for the functional specialisation of a region focusing upon knowledge-intensive and
strategically important tasks such as R&D, design, marketing or distribution (Duranton and Puga, 2005). As is
also the case for manufacturing industry clusters, information on business service clusters is gained from the EU
Cluster Observatory.
Along with these structural factors, the regional knowledge base as well as knowledge spillovers between
regional actors is relevant for a region’s economic performance (Romer, 1986; Lucas, 1988). According to the
New Economic Growth model, these factors stimulate innovation and, in turn, economic growth by generating
MAR-externalities. According to Duranton and Puga (2014) these externalities arise by learning through
regional knowledge spillovers, and by matching employment qualifications with industrial needs. The variables
that are used as general proxies for these characteristics are regional R&D expenditures by businesses (BERD)
and higher education institutions (HERD), as well as the share of the total population with tertiary education
among the 30 to 34-year-old, reflecting the renewal of high-skilled labour supply within a region. In contrast to
the classic economic growth model, these variables are conceived as endogenous factors of the particular region.
The regional research infrastructure (as measured by HERD) is also crucial for the economic prosperity of a
region. According to the Regional Innovation System (RIS) approach, the regional research infrastructure is the
building block of the regional knowledge generation subsystem which stimulates regional innovativeness
(Cooke, 2001; Asheim and Gertler, 2005). The R&D expenditures attributed to universities and research
institutions are a good indicator for the regional endowment with research infrastructure.
In recent years, the political and institutional setting defining the context in which economic activities take place,
has also been recognised as a potential driver of regional economic performance (Rodriguez-Pose, 2013).
Institutional quality is a multi-dimensional concept, comprising aspects such as the rule of law, protection of
property rights, the quality of government and the level of corruption, which are seen as precondition of
economic prosperity. Even though these aspects are subject to national or supranational law, defining national or
EU standards, variation among EU regions exists as indicated by the Quality of Government Index (Charron et
al., 2014). Given its multi-dimensional nature, institutional quality is frequently measured by an index
comprising different quality dimensions (Charron et al., 2014).
Along with these contextual factors, public support programmes can also play a relevant role for the region’s
international competitiveness. Particular policies supporting research and development are seen as preconditions
for regional growth (Fagerberg, 1988; Czarnitzki and Lopes-Bento, 2013). Here, the allocation of ERDF funding
along thematic priorities provides a rough approximation of the focus of public support for economic growth
policies in the respective region. Complementary to the innovation system approach, the share of funding
devoted to research and innovation is calculated and included in the empirical model.
30
The region’s endowment with physical infrastructure may also play an important role for explaining variations in
international trade performances. Thus, in several of the more recent regional economic development theories,
physical infrastructure, including roads, railroads, waterways and airports is an important asset, as it determines
the cost of trade between different regions (Thissen, 2005; Bröcker et al., 2010). In this study, the regional
endowment with physical infrastructure, is measured by the aggregated accessibility indicator, comprising the
endowment with roads, railroads and airports. A further aspect related to transportation costs is the sheer
geographic location of a region. As Brühlhart et al. (2004) point out, bordering regions located at the EU external
border might engage stronger in international trade. Therefore, marginality and accessibility are also included as
control variables in the empirical model.
3.3. DESCRIPTIVE STATISTICS
Before trade specialisation is analysed as a dependent variable of different regional and industry-specific
characteristics, some descriptive evidence is provided on the distribution of these characteristics over the
European regions which constitute the sample. The main distinction is between regions of different income and
development levels, i.e. the structural funds categories (1) ‘less developed regions’, (2) ‘transition regions’, and
(3) ‘more developed regions’. Firstly, results for RXA and RCA (gross exports)4 are presented. Secondly, the
two variables which are available at the industry-region level, i.e. patent intensity and cluster rating, are
described for each of the 22 industries and comparing the three structural funds categories. Thirdly, the
distribution of the (solely) region-specific variables is presented. In order to provide information for the
commonly most recent point of time, the descriptive data analysis refers to 2011.
For a comprehensive picture, the distribution of the single data points is shown as box plots which depict the
middle half of the sample (the values between the 25 %- and the 75 %-quartile) within a box. The full range is
covered by vertical lines, and, in extreme cases of outliers, single dots. The intermediate horizontal line presents
the median, i.e. the observation value which half of the sample exceeds while the other half is below. From these
information, one can get a first idea of whether the distribution is broad (large box) or concentrated (small box)
or whether the distribution is skewed to the left (median is nearer to the first quartile) or to the right (nearer to
the third quartile). In order to facilitate the description of the results, the interpretation aims at summarising at
the level of the three major industry sectors (low-technology, medium-low, high/medium-high, see chapter 2).
3.3.1. RXA and RCA
RXA values are defined as the relative deviation of the regional export share of an industry from the share that
this industry holds within world manufacturing exports. Higher regional shares exceed the zero threshold, lower
shares are negative. Since the denominator not only contains EU exports it is possible that in some industries
which are typically the comparative advantage of non-EU countries, RXA values are mostly smaller than zero in
the majority of EU regions. This is especially the case in many low-technology industries such as textiles, wear-
ing apparel, leather, wood, refined petroleum products, and furniture. Only in few industries (tobacco, wearing
apparel, wood), at least the majority of less developed EU regions exhibits positive export specialisation. Among
the low-technology sectors only food manufacturing is a particular export strength for a substantial number of
regions although the RXA values are distributed quite broadly. In contrast, specialisation in the medium-low-
technology sector does not vary markedly between EU regions, yet it is mostly positive. The region types (by
structural funds categories) are not distinctive either (see Table A 1 in the appendix).
In the high-technology sector, EU regions are specialised below-average in the manufacture of office machinery
and computers, television and communication equipment, as well as medical, precision and optical instruments,
i.e. in these industries, the main body of the box plots is below zero (Table A 1). Regarding the manufacture of
chemicals, machinery and transport equipment other than motor vehicles, often half of the transition regions and
the more developed regions are globally important exporting regions. Finally, in each structural funds category
nearly half the regions are specialised in exports of the manufacture of motor vehicles.
The Revealed Comparative Advantage (RCA) indicator which considers both the export share and import share
of a region in an industry shows an even more distinctive pattern. Less developed regions often yield high RCA
values with respect to tobacco, wood and furniture, while for most industries the regional RCA in the two other
4 The results for trade-in-value-added RXA are available upon request. They are not presented here due to the differing industry classifica-tion of 14 industries. The additional presentation of trade specialisation, patent intensity and cluster ratings at this level in a comprehen-
sible manner would go beyond the scope of this report.
31
structural funds types is far below zero. The only exception is publishing etc. where regional RCA values are
quite evenly distributed around zero. In the medium low as well as the high/medium-high-technology sector the
median region often shows a RCA value near zero. As stated before, most regions also exhibit a comparative
trade disadvantage in office machinery and computers, television and communication equipment, and medical,
precision and optical instruments (Table A 2).
3.3.2. Industry-specific characteristics: patent intensity and cluster rating
Patent intensity is measured as patents in the corresponding industry related to total regional population
(10,000s). In less developed regions, in nearly every industry the number of patents per 10,000 inhabitants is
almost zero. In more developed regions, it is only the manufacture of tobacco products in which patent intensity
is also very low. The highest median values are found in the manufacture of machinery and equipment (5.2),
followed by chemicals and chemical products (including pharmaceuticals) as well as medical, precision and
optical instruments (2.8 each), and by television and communication equipment (1.7). All other industries show
median values of less than 1. However, the differences between more developed and other region types are
markedly (Table A 3).
Cluster ratings range from 0 to 3 and are averaged over the whole time span for each region. The picture of their
distribution is particularly polarised in the sense that, except as concerns the manufacture of food products, tran-
sition regions are not notably represented in the regional distribution. Interestingly, while clusters in the low-
technology sector are almost exclusively found in less developed regions (except for the manufacture of furniture
etc.), there are several industries in the medium-low as well as in the high/medium-high sectors which have
similarly distributed and on average high cluster ratings in less developed regions and more developed regions
alike. The respective industries are the manufacture of metals, fabricated metal products, machinery and equip-
ment, and electrical machinery and apparatus. By way of contrast, the manufacture of motor vehicles shows a
higher number of clusters in less developed regions than in more developed regions. Finally, some industries
from different sectors only have a small number of clusters, such as tobacco, publishing, rubber and plastic
products, and transport equipment other than motor vehicles (Table A 4).
These elaborations show that both indicators have an unambiguous regional distribution and no general conclu-
sion can be drawn. However, while patent intensity is clearly biased towards more developed regions, cluster
structures also play a role for less developed regions. Transition regions do not show any particularities with
respect to both industry-specific characteristics.
3.3.3. Region-specific characteristics
The region-specific characteristics are considered to be industry-unspecific in the sense that they are potentially
beneficial to any industry in a region. Two aspects, however, cannot be disentangled from the data. Firstly, the
data contain no information on the extent to which the regional characteristics are oriented towards the exporting
industries, e.g. whether regional business (BERD) or higher education expenditures on R&D (HERD) are fo-
cused on the industries in question, whether the education expansion develops in favour of their required occupa-
tions or whether accessibility is not only beneficial to individual traffic but also for the modes necessary to de-
liver the specific goods produced. Secondly, causal interpretations of the estimated effects are hindered by self-
selection, i.e. it is not clear whether the creation of high R&D activities, skilled labour supply etc. favoured the
development from non-specialised locations to specialised locations or whether existing leading firms decided to
(re-) locate sites and activities to these regions.
Comparing business and higher education expenditures on R&D, the two show a similar distribution between
and within region types: R&D efforts increase along with the level of development (Figure 3.1). The major dif-
ferences between both types of actors are, first, that BERD is generally higher, second, the regional variation
which is much lower, and third, the increase from transition to more developed regions is more pronounced than
compared to BERD. The share of innovating SMEs is distributed more broadly within the region types. In con-
trast to the distribution of R&D intensities, both, the share of SMEs with both technological and non-
technological innovations are of similar size – between 20 % and 60 % from the first quartile in the less devel-
oped regions to the third quartile in the more developed regions – and the slope with respect to the state of de-
velopment is steeper than it is the case for BERD and HERD. The similarity between R&D intensities and the
shares of innovating SMEs is that the distribution of less developed regions is well below that of transition and
more developed regions which are partially overlapping – at least regarding the lower half of more developed
regions. Concerning the of young talents, which is expressed by the share of the 30- to 34-year-old holding a
tertiary degree, the median values ranges from 24 % in the less developed regions to 38 % in the more developed
regions. The educational expansion is thus more pronounced in regions with higher income levels.
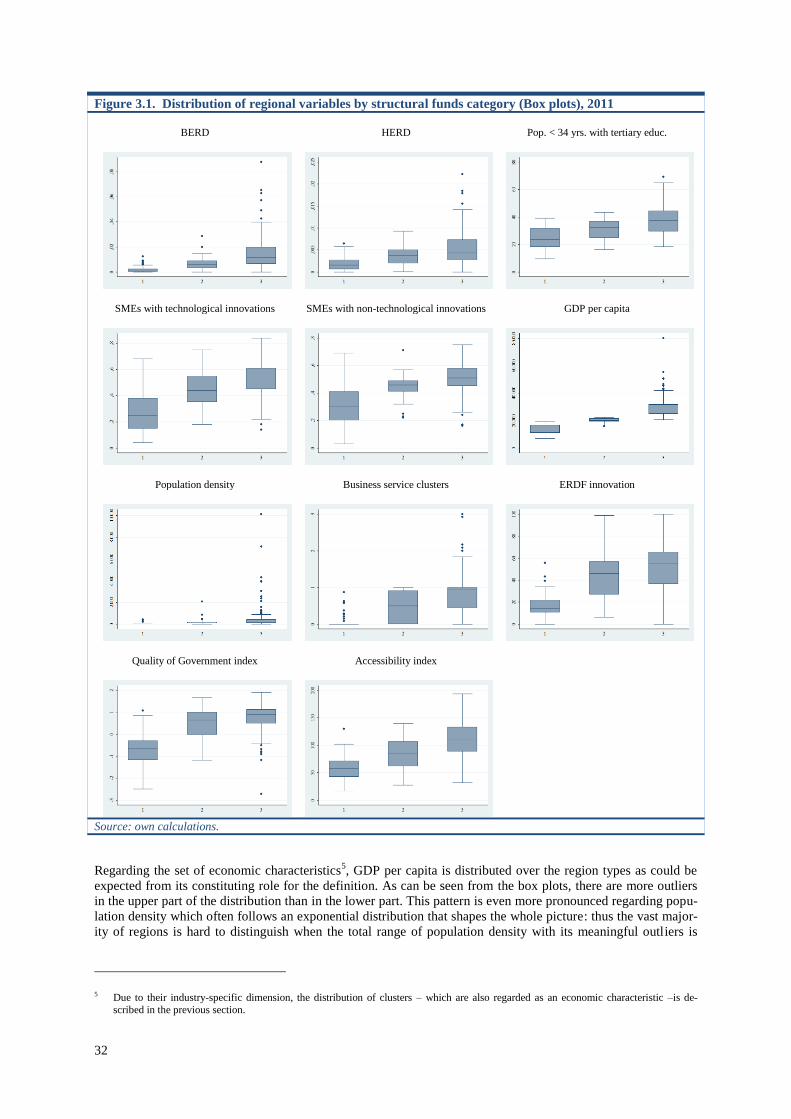
32
Regarding the set of economic characteristics5, GDP per capita is distributed over the region types as could be
expected from its constituting role for the definition. As can be seen from the box plots, there are more outliers
in the upper part of the distribution than in the lower part. This pattern is even more pronounced regarding popu-
lation density which often follows an exponential distribution that shapes the whole picture: thus the vast major-
ity of regions is hard to distinguish when the total range of population density with its meaningful outliers is
5 Due to their industry-specific dimension, the distribution of clusters – which are also regarded as an economic characteristic –is de-
scribed in the previous section.
Figure 3.1. Distribution of regional variables by structural funds category (Box plots), 2011
BERD HERD Pop. < 34 yrs. with tertiary educ.
SMEs with technological innovations SMEs with non-technological innovations GDP per capita
Population density Business service clusters ERDF innovation
Quality of Government index Accessibility index
Source: own calculations.
33
displayed. Therefore it has to be reported that while the median values of less developed and transition regions
are of similar size (93 vs. 99 persons per km²), the difference between the upper quartiles is quite larger (123 vs.
205). The figures for more developed regions, however, are more than twice that size (median: 211, 75 %-
quantile: 425). Business services are a particular feature of agglomerations that can make a difference in terms of
a region’s functional specialisation (Duranton and Puga, 2005). Like the industry clusters, business service clus-
ters are measured on a scale from 0 to 3 which has been developed by the European Cluster Observatory. Their
distribution, however, concentrates on the range from 0 to 1. The differences between the region categories are
very pronounced: Firstly, there are only few less developed regions with non-zero values (even the third quartile
amounts to zero). Secondly, the range of transition regions covers the span between 0 and 1 evenly. Thirdly, half
of the more developed regions have business service cluster ratings near 1 or larger, only the lowest quarter has
ratings from 0 to 0.5.
The policy variables deal with the innovation focus of regional policy (measured by the respective share of in-
vestments within the ERDF) and, more generally, the quality of government index by Charron et al. (2014).
With respect to innovation policy, most less developed regions devote not more than 20 % of their ERDF
funding to innovation policy instruments, while the median values of transition and more developed regions are
more than twice that size (46 % and 55 %, respectively). Interestingly, there is a similar distribution of the
quality of government index: more than three quarter of the less developed regions yield negative values but
most of the transition and more developed regions are between 0 and 1, each with a further quarter of their
regions between 1 and 2.
Finally, the accessibility index from the ESPON project shows that although the range of accessibility index
values increases along with the regional income level and state of development, also the main bodies of the
distribution achieve higher values than in the case of the regions with lower income levels.
The above box plots altogether show that there is a strong relationship between regional income levels and other
regional characteristics which potentially determine trade specialisation and competitiveness. Moreover, it is
intuitive that there are also correlations between different variables. For example, the last results for the accessi-
bility index are probably related to population density since both are characteristics of urbanised regions. An-
other possibility might is that large universities both promote HERD and shares of tertiary education among the
younger population. However, as is also visible, there are different patterns of distribution between regions, even
of the same income level. Therefore, all variables will also be included in the empirical model.
3.4. ESTIMATION RESULTS
This section firstly reports the industry-specific results of regressing the RXA of each industry on the character-
istics presented above. Gross exports are preferred to the TiVA data that has the limination of a smaller number
of industries to be distinguished (14 instead of 22) (see section 2.4.1) An advantage of taking RXA as opposed to
RCA is the more intuitive interpretation in terms of export specialisation rather than also considering imports to
be affected by the explanatory variables. In a second step, however, additionally to RXA based on gross exports,
also RXA based on TiVA data and RCA are considered as alternative dependent variables for the purpose of
robustness checks.
The analysis is based on a panel of partially aggregated manufacturing industries (NACE Rev. 1.1, 2-digit codes
15 to 36) at the NUTS 2 level in 21 EU Member States6 for the years 2000 to 2011. Overall, 22 (gross exports)
respective 14 (TiVA) single industries are distinguished (see section 2.2 and 2.4.1). The observation period is
sufficiently large for assessing trends and developments in regional trade competitiveness. The analysis also
considers subgroups of regions with similar income levels in order to assess possible determinants for
differences in trade specialisation between regions of a similar state of development. Here, regions are clustered
along their structural funds categories which provide a suitable and also policy-oriented distinction.
One important empirical feature to be kept in mind is that regional variables cannot exhibit effects of a certain
direction in all of the industries. By definition, the construction of the dependent variable (export specialisation)
implies an inverse relationship between RXA values of different industries in the same region. Since export
6 As regional export and import data are not available for Croatia, the two Croatian NUTS2 regions are not included in the dataset. Fur-
thermore, small countries constituting their own NUTS 2 region (LT, LV, EE, LU, MT, CY) were excluded for two reasons. First, their
inclusion would imply comparing sub-national entities in some countries with national entities in others although the policy-making pro-cess at the sub-national level follows a different logic (and especially political competencies) than it does at the national level. Second,
some explanatory variables (especially on clusters) are constructed differently.
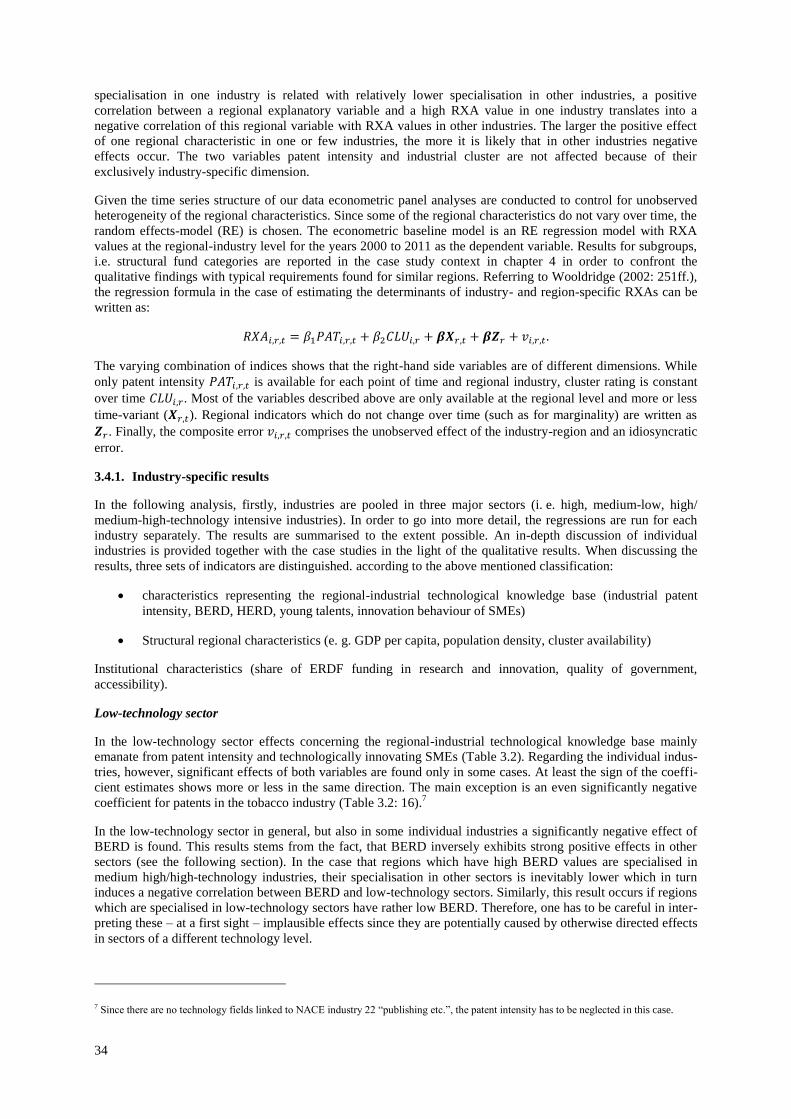
34
specialisation in one industry is related with relatively lower specialisation in other industries, a positive
correlation between a regional explanatory variable and a high RXA value in one industry translates into a
negative correlation of this regional variable with RXA values in other industries. The larger the positive effect
of one regional characteristic in one or few industries, the more it is likely that in other industries negative
effects occur. The two variables patent intensity and industrial cluster are not affected because of their
exclusively industry-specific dimension.
Given the time series structure of our data econometric panel analyses are conducted to control for unobserved
heterogeneity of the regional characteristics. Since some of the regional characteristics do not vary over time, the
random effects-model (RE) is chosen. The econometric baseline model is an RE regression model with RXA
values at the regional-industry level for the years 2000 to 2011 as the dependent variable. Results for subgroups,
i.e. structural fund categories are reported in the case study context in chapter 4 in order to confront the
qualitative findings with typical requirements found for similar regions. Referring to Wooldridge (2002: 251ff.),
the regression formula in the case of estimating the determinants of industry- and region-specific RXAs can be
written as:
The varying combination of indices shows that the right-hand side variables are of different dimensions. While
only patent intensity is available for each point of time and regional industry, cluster rating is constant
over time . Most of the variables described above are only available at the regional level and more or less
time-variant ( ). Regional indicators which do not change over time (such as for marginality) are written as
. Finally, the composite error comprises the unobserved effect of the industry-region and an idiosyncratic
error.
3.4.1. Industry-specific results
In the following analysis, firstly, industries are pooled in three major sectors (i. e. high, medium-low, high/
medium-high-technology intensive industries). In order to go into more detail, the regressions are run for each
industry separately. The results are summarised to the extent possible. An in-depth discussion of individual
industries is provided together with the case studies in the light of the qualitative results. When discussing the
results, three sets of indicators are distinguished. according to the above mentioned classification:
characteristics representing the regional-industrial technological knowledge base (industrial patent
intensity, BERD, HERD, young talents, innovation behaviour of SMEs)
Structural regional characteristics (e. g. GDP per capita, population density, cluster availability)
Institutional characteristics (share of ERDF funding in research and innovation, quality of government,
accessibility).
Low-technology sector
In the low-technology sector effects concerning the regional-industrial technological knowledge base mainly
emanate from patent intensity and technologically innovating SMEs (Table 3.2). Regarding the individual indus-
tries, however, significant effects of both variables are found only in some cases. At least the sign of the coeffi-
cient estimates shows more or less in the same direction. The main exception is an even significantly negative
coefficient for patents in the tobacco industry (Table 3.2: 16).7
In the low-technology sector in general, but also in some individual industries a significantly negative effect of
BERD is found. This results stems from the fact, that BERD inversely exhibits strong positive effects in other
sectors (see the following section). In the case that regions which have high BERD values are specialised in
medium high/high-technology industries, their specialisation in other sectors is inevitably lower which in turn
induces a negative correlation between BERD and low-technology sectors. Similarly, this result occurs if regions
which are specialised in low-technology sectors have rather low BERD. Therefore, one has to be careful in inter-
preting these – at a first sight – implausible effects since they are potentially caused by otherwise directed effects
in sectors of a different technology level.
7 Since there are no technology fields linked to NACE industry 22 “publishing etc.”, the patent intensity has to be neglected in this case.
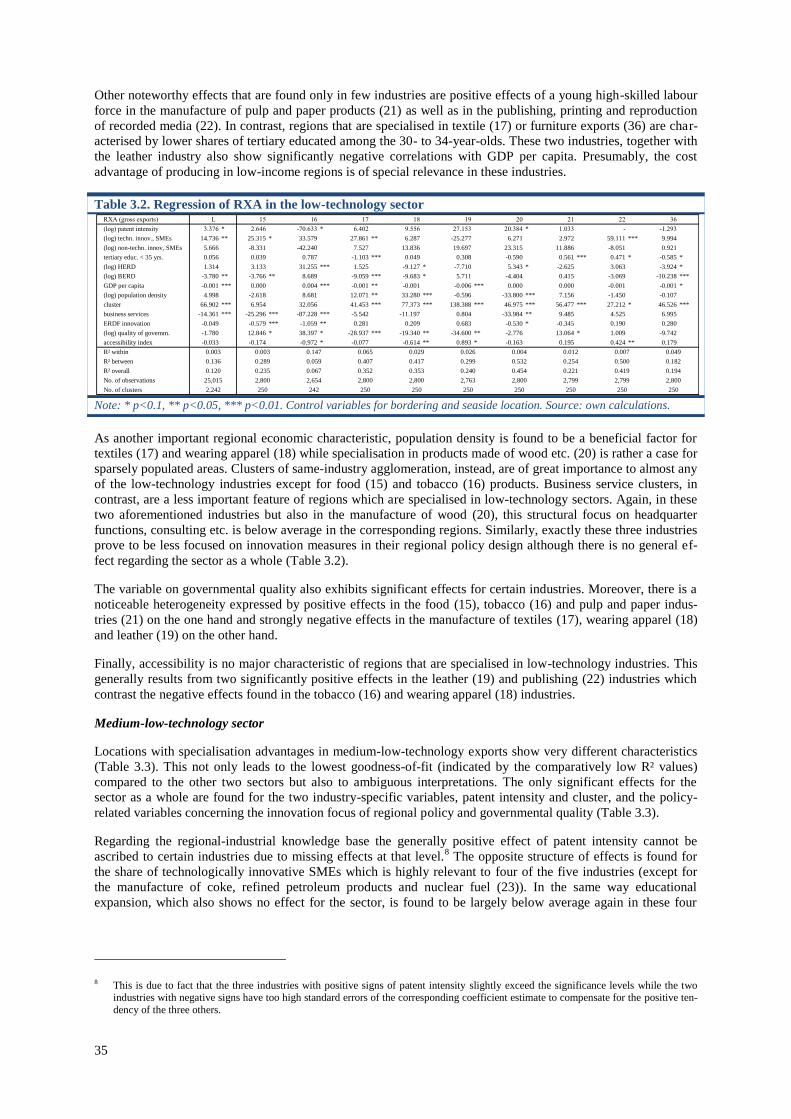
35
Other noteworthy effects that are found only in few industries are positive effects of a young high-skilled labour
force in the manufacture of pulp and paper products (21) as well as in the publishing, printing and reproduction
of recorded media (22). In contrast, regions that are specialised in textile (17) or furniture exports (36) are char-
acterised by lower shares of tertiary educated among the 30- to 34-year-olds. These two industries, together with
the leather industry also show significantly negative correlations with GDP per capita. Presumably, the cost
advantage of producing in low-income regions is of special relevance in these industries.
Table 3.2. Regression of RXA in the low-technology sector
Note: * p<0.1, ** p<0.05, *** p<0.01. Control variables for bordering and seaside location. Source: own calculations.
As another important regional economic characteristic, population density is found to be a beneficial factor for
textiles (17) and wearing apparel (18) while specialisation in products made of wood etc. (20) is rather a case for
sparsely populated areas. Clusters of same-industry agglomeration, instead, are of great importance to almost any
of the low-technology industries except for food (15) and tobacco (16) products. Business service clusters, in
contrast, are a less important feature of regions which are specialised in low-technology sectors. Again, in these
two aforementioned industries but also in the manufacture of wood (20), this structural focus on headquarter
functions, consulting etc. is below average in the corresponding regions. Similarly, exactly these three industries
prove to be less focused on innovation measures in their regional policy design although there is no general ef-
fect regarding the sector as a whole (Table 3.2).
The variable on governmental quality also exhibits significant effects for certain industries. Moreover, there is a
noticeable heterogeneity expressed by positive effects in the food (15), tobacco (16) and pulp and paper indus-
tries (21) on the one hand and strongly negative effects in the manufacture of textiles (17), wearing apparel (18)
and leather (19) on the other hand.
Finally, accessibility is no major characteristic of regions that are specialised in low-technology industries. This
generally results from two significantly positive effects in the leather (19) and publishing (22) industries which
contrast the negative effects found in the tobacco (16) and wearing apparel (18) industries.
Medium-low-technology sector
Locations with specialisation advantages in medium-low-technology exports show very different characteristics
(Table 3.3). This not only leads to the lowest goodness-of-fit (indicated by the comparatively low R² values)
compared to the other two sectors but also to ambiguous interpretations. The only significant effects for the
sector as a whole are found for the two industry-specific variables, patent intensity and cluster, and the policy-
related variables concerning the innovation focus of regional policy and governmental quality (Table 3.3).
Regarding the regional-industrial knowledge base the generally positive effect of patent intensity cannot be
ascribed to certain industries due to missing effects at that level.8 The opposite structure of effects is found for
the share of technologically innovative SMEs which is highly relevant to four of the five industries (except for
the manufacture of coke, refined petroleum products and nuclear fuel (23)). In the same way educational
expansion, which also shows no effect for the sector, is found to be largely below average again in these four
8 This is due to fact that the three industries with positive signs of patent intensity slightly exceed the significance levels while the two industries with negative signs have too high standard errors of the corresponding coefficient estimate to compensate for the positive ten-
dency of the three others.
RXA (gross exports) L 15 16 17 18 19 20 21 22 36
(log) patent intensity 3.376 * 2.646 -70.633 * 6.402 9.556 27.153 20.384 * 1.033 - -1.293
(log) techn. innov., SMEs 14.736 ** 25.315 * 33.579 27.861 ** 6.287 -25.277 6.271 2.972 59.111 *** 9.994
(log) non-techn. innov, SMEs 5.666 -8.331 -42.240 7.527 13.836 19.697 23.315 11.886 -8.051 0.921
tertiary educ. < 35 yrs. 0.056 0.039 0.787 -1.103 *** 0.049 0.308 -0.590 0.561 *** 0.471 * -0.585 *
(log) HERD 1.314 3.133 31.255 *** 1.525 -9.127 * -7.710 5.343 * -2.625 3.063 -3.924 *
(log) BERD -3.780 ** -3.766 ** 8.689 -9.059 *** -9.683 * 5.711 -4.404 0.415 -3.069 -10.238 ***
GDP per capita -0.001 *** 0.000 0.004 *** -0.001 ** -0.001 -0.006 *** 0.000 0.000 -0.001 -0.001 *
(log) population density 4.998 -2.618 8.681 12.071 ** 33.280 *** -0.596 -33.800 *** 7.156 -1.450 -0.107
cluster 66.902 *** 6.954 32.056 41.453 *** 77.373 *** 138.388 *** 46.975 *** 56.477 *** 27.212 * 46.526 ***
business services -14.361 *** -25.296 *** -87.228 *** -5.542 -11.197 0.804 -33.984 ** 9.485 4.525 6.995
ERDF innovation -0.049 -0.579 *** -1.059 ** 0.281 0.209 0.683 -0.530 * -0.345 0.190 0.280
(log) quality of governm. -1.780 12.846 * 38.397 * -28.937 *** -19.340 ** -34.600 ** -2.776 13.064 * 1.009 -9.742
accessibility index -0.033 -0.174 -0.972 * -0.077 -0.614 ** 0.893 * -0.163 0.195 0.424 ** 0.179
R² within 0.003 0.003 0.147 0.065 0.029 0.026 0.004 0.012 0.007 0.049
R² between 0.136 0.289 0.059 0.407 0.417 0.299 0.532 0.254 0.500 0.182
R² overall 0.120 0.235 0.067 0.352 0.353 0.240 0.454 0.221 0.419 0.194
No. of observations 25,015 2,800 2,654 2,800 2,800 2,763 2,800 2,799 2,799 2,800
No. of clusters 2,242 250 242 250 250 250 250 250 250 250
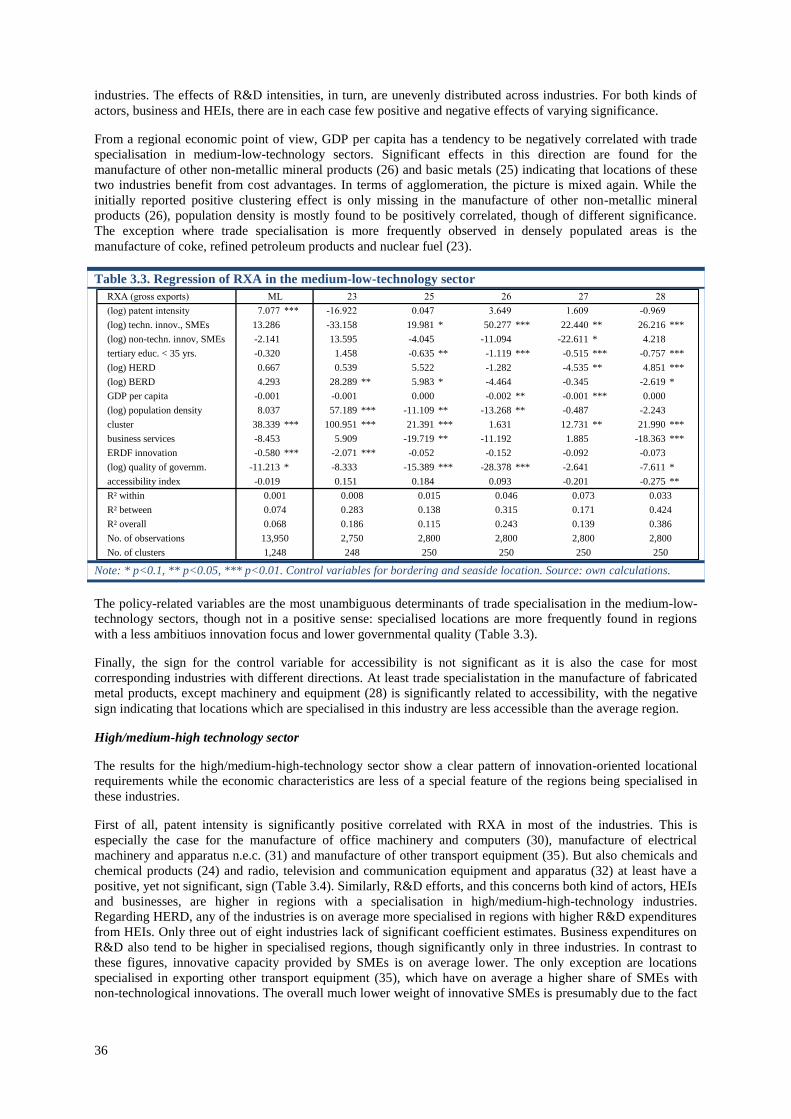
36
industries. The effects of R&D intensities, in turn, are unevenly distributed across industries. For both kinds of
actors, business and HEIs, there are in each case few positive and negative effects of varying significance.
From a regional economic point of view, GDP per capita has a tendency to be negatively correlated with trade
specialisation in medium-low-technology sectors. Significant effects in this direction are found for the
manufacture of other non-metallic mineral products (26) and basic metals (25) indicating that locations of these
two industries benefit from cost advantages. In terms of agglomeration, the picture is mixed again. While the
initially reported positive clustering effect is only missing in the manufacture of other non-metallic mineral
products (26), population density is mostly found to be positively correlated, though of different significance.
The exception where trade specialisation is more frequently observed in densely populated areas is the
manufacture of coke, refined petroleum products and nuclear fuel (23).
Table 3.3. Regression of RXA in the medium-low-technology sector
Note: * p<0.1, ** p<0.05, *** p<0.01. Control variables for bordering and seaside location. Source: own calculations.
The policy-related variables are the most unambiguous determinants of trade specialisation in the medium-low-
technology sectors, though not in a positive sense: specialised locations are more frequently found in regions
with a less ambitiuos innovation focus and lower governmental quality (Table 3.3).
Finally, the sign for the control variable for accessibility is not significant as it is also the case for most
corresponding industries with different directions. At least trade specialistation in the manufacture of fabricated
metal products, except machinery and equipment (28) is significantly related to accessibility, with the negative
sign indicating that locations which are specialised in this industry are less accessible than the average region.
High/medium-high technology sector
The results for the high/medium-high-technology sector show a clear pattern of innovation-oriented locational
requirements while the economic characteristics are less of a special feature of the regions being specialised in
these industries.
First of all, patent intensity is significantly positive correlated with RXA in most of the industries. This is
especially the case for the manufacture of office machinery and computers (30), manufacture of electrical
machinery and apparatus n.e.c. (31) and manufacture of other transport equipment (35). But also chemicals and
chemical products (24) and radio, television and communication equipment and apparatus (32) at least have a
positive, yet not significant, sign (Table 3.4). Similarly, R&D efforts, and this concerns both kind of actors, HEIs
and businesses, are higher in regions with a specialisation in high/medium-high-technology industries.
Regarding HERD, any of the industries is on average more specialised in regions with higher R&D expenditures
from HEIs. Only three out of eight industries lack of significant coefficient estimates. Business expenditures on
R&D also tend to be higher in specialised regions, though significantly only in three industries. In contrast to
these figures, innovative capacity provided by SMEs is on average lower. The only exception are locations
specialised in exporting other transport equipment (35), which have on average a higher share of SMEs with
non-technological innovations. The overall much lower weight of innovative SMEs is presumably due to the fact
RXA (gross exports) ML 23 25 26 27 28
(log) patent intensity 7.077 *** -16.922 0.047 3.649 1.609 -0.969
(log) techn. innov., SMEs 13.286 -33.158 19.981 * 50.277 *** 22.440 ** 26.216 ***
(log) non-techn. innov, SMEs -2.141 13.595 -4.045 -11.094 -22.611 * 4.218
tertiary educ. < 35 yrs. -0.320 1.458 -0.635 ** -1.119 *** -0.515 *** -0.757 ***
(log) HERD 0.667 0.539 5.522 -1.282 -4.535 ** 4.851 ***
(log) BERD 4.293 28.289 ** 5.983 * -4.464 -0.345 -2.619 *
GDP per capita -0.001 -0.001 0.000 -0.002 ** -0.001 *** 0.000
(log) population density 8.037 57.189 *** -11.109 ** -13.268 ** -0.487 -2.243
cluster 38.339 *** 100.951 *** 21.391 *** 1.631 12.731 ** 21.990 ***
business services -8.453 5.909 -19.719 ** -11.192 1.885 -18.363 ***
ERDF innovation -0.580 *** -2.071 *** -0.052 -0.152 -0.092 -0.073
(log) quality of governm. -11.213 * -8.333 -15.389 *** -28.378 *** -2.641 -7.611 *
accessibility index -0.019 0.151 0.184 0.093 -0.201 -0.275 **
R² within 0.001 0.008 0.015 0.046 0.073 0.033
R² between 0.074 0.283 0.138 0.315 0.171 0.424
R² overall 0.068 0.186 0.115 0.243 0.139 0.386
No. of observations 13,950 2,750 2,800 2,800 2,800 2,800
No. of clusters 1,248 248 250 250 250 250
37
tha smaller firms play less of a role in these industries. The same holds for the importance of patent intensity and
BERD since these activities are predominantly conducted by larger firms.
Table 3.4. Regression of RXA in the high/medium-high-technology sector
Note: * p<0.1, ** p<0.05, *** p<0.01.Control variables bordering and seaside location. Source: own calculations.
Except for the indicator of prevalent clusters which is throughout all industries (other than office machinery and
computers (30)) unambiguously positively related to export specialisation the other economic characteristics
show no clear distributional pattern. In two cases, manufacture of chemicals and chemical products (24) and
manufacture of other transport equipment (35), GDP per capita is on average lower in specialised industries
indicating that also in these high-tech industries cost advantages can play a decisive role. Furthermore, only
locations which are specialised in the exports of other transport equipment (35) are more densely populated,
especially as compared to regions specialised in machinery and equipment n.e.c. (29) and medical, precision and
optical instruments, watches and clocks (33). Business service clusters tend to be higher rated in most specialised
locations of the high/medium-high-technology sector. Although there is no significance of this characteristic
found at the sector level, at least chemicals and chemical products (24) and again medical, precision and optical
instruments, watches and clocks (33) exhibit significant coefficient estimates.
The policy-orientied indicators consistently have positive coefficient estimates on regional export specialisation
except for the manufacture of motor vehicles, trailers and semi-trailers (34) for both variables and for the
manufacture of office machinery and computers (30) as well as manufacture of radio, television and
communication equipment and apparatus (32) regarding the innovation focus of ERDF implementation in
specialised regions.
In contrast to the two sectors with lower technology intensity, accessibility is found to be a highly significant
feature of most high/medium-high-technology industries. The few cases with negative, yet not significant,
effects are the manufacture of electrical machinery and apparatus n.e.c. (31), manufacture of radio, television
and communication equipment and apparatus (32) and manufacture of other transport equipment (35).
3.4.2. Robustness checks
In order to check the robustness of the preceding results, in a first step the regression analyses for three aggregate
sectors are conducted for two other independent variables, i.e. the RCA based on gross exports and the RXA
(TiVA) considering trade in value-added (robustness check I). The second investigation of robustness is the
exclusion of two potentially problematic variables. The first is GDP per capita which expected to be inherently
and largely correlated with other regressors. The second crucial variable which is possibly too similarly con-
structed as the dependent variable is the cluster rating. Finally regressions are run by sub-samples, i. e. structural
fund categories (robustness check III).
In contrast to the industry-specific results, here only the perspective of major sectors (pooled disaggregated in-
dustries) is taken (Table 3.5). Generally, the coefficient estimates do not differ markedly, especially when com-
paring the results by major sector, significance and size are quite similar. Some coefficients turn significant
when using RCA (gross exports/imports) in contrast to RXA (gross exports). The overall goodness-of-fit,
however is slightly lower, especially the explanatory power regarding the variation between regions. Concerning
the TiVA-RXA, there are also only some changes of the significance but not in the sign of already significant
coefficients.
RXA (gross exports) MHH 24 29 30 31 32 33 34 35
(log) patent intensity 0.557 ** 0.306 -0.066 1.376 *** 2.809 *** 0.142 -0.070 -0.699 11.141 ***
(log) techn. innov., SMEs -26.133 *** -18.206 8.621 -23.853 -32.045 *** -32.954 ** -32.252 *** -15.365 -71.962 ***
(log) non-techn. innov, SMEs -12.052 * -14.674 -17.662 * -20.984 -5.744 -37.413 * -10.329 -8.432 39.389 ***
tertiary educ. < 35 yrs. -0.134 0.816 *** -0.287 -0.282 -0.660 *** -1.595 *** 0.253 0.289 0.445 *
(log) HERD 9.605 *** 0.767 8.140 * 17.693 *** 3.406 15.152 *** 7.268 ** 15.255 *** 2.456
(log) BERD 3.689 ** -0.666 0.039 2.867 8.203 * 16.467 *** 5.694 * -1.687 0.148
GDP per capita 0.000 -0.002 *** 0.000 0.000 0.000 0.001 0.000 0.000 -0.002 ***
(log) population density -2.760 4.353 -9.884 ** 1.827 4.824 -2.163 -11.833 * -7.907 15.876 **
cluster 47.484 *** 50.225 *** 32.625 *** 9.338 46.407 *** 26.107 ** 22.107 ** 48.705 *** 42.158 ***
business services 1.720 16.498 ** 3.823 2.460 0.409 8.008 18.416 *** -15.138 4.770
ERDF innovation 0.147 0.202 0.655 *** -0.210 0.126 -0.352 0.535 *** -0.151 0.544 **
(log) quality of governm. 20.903 *** 15.208 ** -2.210 44.922 *** 5.584 28.330 *** 27.184 *** 26.288 ** 26.588 **
accessibility index 0.487 *** 1.026 *** 0.375 * 0.646 * -0.063 -0.171 0.834 *** 0.858 ** -0.018
R² within 0.013 0.013 0.018 0.039 0.013 0.054 0.036 0.043 0.017
R² between 0.217 0.461 0.336 0.302 0.306 0.160 0.589 0.228 0.218
R² overall 0.167 0.368 0.263 0.234 0.233 0.107 0.546 0.190 0.187
No. of observations 22,398 2,798 2,800 2,800 2,800 2,800 2,800 2,800 2,800
No. of clusters 2,000 250 250 250 250 250 250 250 250
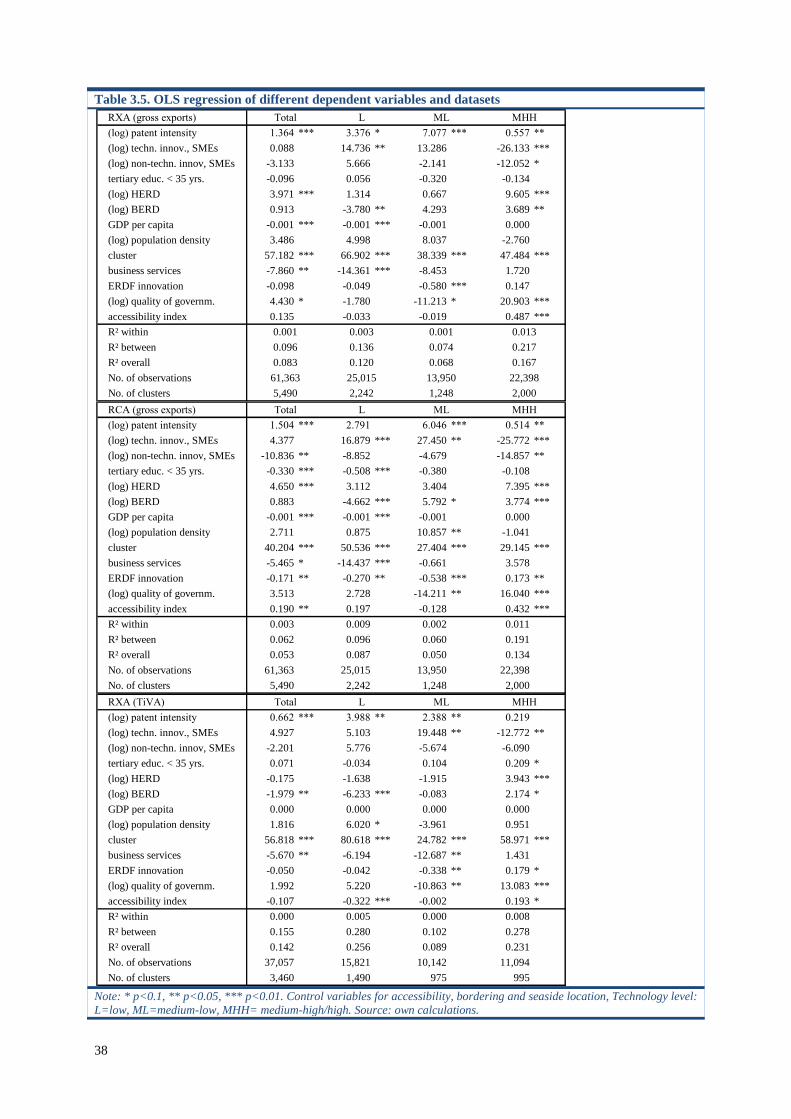
38
Table 3.5. OLS regression of different dependent variables and datasets
Note: * p<0.1, ** p<0.05, *** p<0.01. Control variables for accessibility, bordering and seaside location, Technology level:
L=low, ML=medium-low, MHH= medium-high/high. Source: own calculations.
RXA (gross exports) Total L ML MHH
(log) patent intensity 1.364 *** 3.376 * 7.077 *** 0.557 **
(log) techn. innov., SMEs 0.088 14.736 ** 13.286 -26.133 ***
(log) non-techn. innov, SMEs -3.133 5.666 -2.141 -12.052 *
tertiary educ. < 35 yrs. -0.096 0.056 -0.320 -0.134
(log) HERD 3.971 *** 1.314 0.667 9.605 ***
(log) BERD 0.913 -3.780 ** 4.293 3.689 **
GDP per capita -0.001 *** -0.001 *** -0.001 0.000
(log) population density 3.486 4.998 8.037 -2.760
cluster 57.182 *** 66.902 *** 38.339 *** 47.484 ***
business services -7.860 ** -14.361 *** -8.453 1.720
ERDF innovation -0.098 -0.049 -0.580 *** 0.147
(log) quality of governm. 4.430 * -1.780 -11.213 * 20.903 ***
accessibility index 0.135 -0.033 -0.019 0.487 ***
R² within 0.001 0.003 0.001 0.013
R² between 0.096 0.136 0.074 0.217
R² overall 0.083 0.120 0.068 0.167
No. of observations 61,363 25,015 13,950 22,398
No. of clusters 5,490 2,242 1,248 2,000
RCA (gross exports) Total L ML MHH
(log) patent intensity 1.504 *** 2.791 6.046 *** 0.514 **
(log) techn. innov., SMEs 4.377 16.879 *** 27.450 ** -25.772 ***
(log) non-techn. innov, SMEs -10.836 ** -8.852 -4.679 -14.857 **
tertiary educ. < 35 yrs. -0.330 *** -0.508 *** -0.380 -0.108
(log) HERD 4.650 *** 3.112 3.404 7.395 ***
(log) BERD 0.883 -4.662 *** 5.792 * 3.774 ***
GDP per capita -0.001 *** -0.001 *** -0.001 0.000
(log) population density 2.711 0.875 10.857 ** -1.041
cluster 40.204 *** 50.536 *** 27.404 *** 29.145 ***
business services -5.465 * -14.437 *** -0.661 3.578
ERDF innovation -0.171 ** -0.270 ** -0.538 *** 0.173 **
(log) quality of governm. 3.513 2.728 -14.211 ** 16.040 ***
accessibility index 0.190 ** 0.197 -0.128 0.432 ***
R² within 0.003 0.009 0.002 0.011
R² between 0.062 0.096 0.060 0.191
R² overall 0.053 0.087 0.050 0.134
No. of observations 61,363 25,015 13,950 22,398
No. of clusters 5,490 2,242 1,248 2,000
RXA (TiVA) Total L ML MHH
(log) patent intensity 0.662 *** 3.988 ** 2.388 ** 0.219
(log) techn. innov., SMEs 4.927 5.103 19.448 ** -12.772 **
(log) non-techn. innov, SMEs -2.201 5.776 -5.674 -6.090
tertiary educ. < 35 yrs. 0.071 -0.034 0.104 0.209 *
(log) HERD -0.175 -1.638 -1.915 3.943 ***
(log) BERD -1.979 ** -6.233 *** -0.083 2.174 *
GDP per capita 0.000 0.000 0.000 0.000
(log) population density 1.816 6.020 * -3.961 0.951
cluster 56.818 *** 80.618 *** 24.782 *** 58.971 ***
business services -5.670 ** -6.194 -12.687 ** 1.431
ERDF innovation -0.050 -0.042 -0.338 ** 0.179 *
(log) quality of governm. 1.992 5.220 -10.863 ** 13.083 ***
accessibility index -0.107 -0.322 *** -0.002 0.193 *
R² within 0.000 0.005 0.000 0.008
R² between 0.155 0.280 0.102 0.278
R² overall 0.142 0.256 0.089 0.231
No. of observations 37,057 15,821 10,142 11,094
No. of clusters 3,460 1,490 975 995
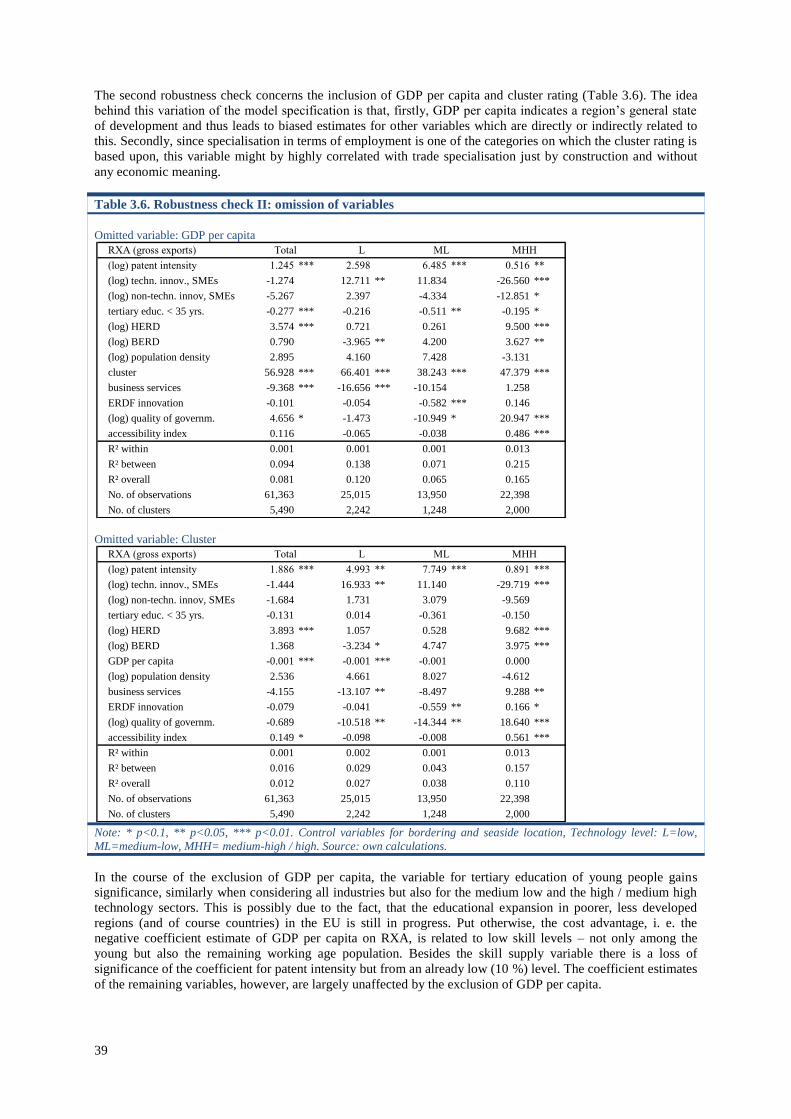
39
The second robustness check concerns the inclusion of GDP per capita and cluster rating (Table 3.6). The idea
behind this variation of the model specification is that, firstly, GDP per capita indicates a region’s general state
of development and thus leads to biased estimates for other variables which are directly or indirectly related to
this. Secondly, since specialisation in terms of employment is one of the categories on which the cluster rating is
based upon, this variable might by highly correlated with trade specialisation just by construction and without
any economic meaning.
Table 3.6. Robustness check II: omission of variables
Omitted variable: GDP per capita
Omitted variable: Cluster
Note: * p<0.1, ** p<0.05, *** p<0.01. Control variables for bordering and seaside location, Technology level: L=low,
ML=medium-low, MHH= medium-high / high. Source: own calculations.
In the course of the exclusion of GDP per capita, the variable for tertiary education of young people gains
significance, similarly when considering all industries but also for the medium low and the high / medium high
technology sectors. This is possibly due to the fact, that the educational expansion in poorer, less developed
regions (and of course countries) in the EU is still in progress. Put otherwise, the cost advantage, i. e. the
negative coefficient estimate of GDP per capita on RXA, is related to low skill levels – not only among the
young but also the remaining working age population. Besides the skill supply variable there is a loss of
significance of the coefficient for patent intensity but from an already low (10 %) level. The coefficient estimates
of the remaining variables, however, are largely unaffected by the exclusion of GDP per capita.
RXA (gross exports) Total L ML MHH
(log) patent intensity 1.245 *** 2.598 6.485 *** 0.516 **
(log) techn. innov., SMEs -1.274 12.711 ** 11.834 -26.560 ***
(log) non-techn. innov, SMEs -5.267 2.397 -4.334 -12.851 *
tertiary educ. < 35 yrs. -0.277 *** -0.216 -0.511 ** -0.195 *
(log) HERD 3.574 *** 0.721 0.261 9.500 ***
(log) BERD 0.790 -3.965 ** 4.200 3.627 **
(log) population density 2.895 4.160 7.428 -3.131
cluster 56.928 *** 66.401 *** 38.243 *** 47.379 ***
business services -9.368 *** -16.656 *** -10.154 1.258
ERDF innovation -0.101 -0.054 -0.582 *** 0.146
(log) quality of governm. 4.656 * -1.473 -10.949 * 20.947 ***
accessibility index 0.116 -0.065 -0.038 0.486 ***
R² within 0.001 0.001 0.001 0.013
R² between 0.094 0.138 0.071 0.215
R² overall 0.081 0.120 0.065 0.165
No. of observations 61,363 25,015 13,950 22,398
No. of clusters 5,490 2,242 1,248 2,000
RXA (gross exports) Total L ML MHH
(log) patent intensity 1.886 *** 4.993 ** 7.749 *** 0.891 ***
(log) techn. innov., SMEs -1.444 16.933 ** 11.140 -29.719 ***
(log) non-techn. innov, SMEs -1.684 1.731 3.079 -9.569
tertiary educ. < 35 yrs. -0.131 0.014 -0.361 -0.150
(log) HERD 3.893 *** 1.057 0.528 9.682 ***
(log) BERD 1.368 -3.234 * 4.747 3.975 ***
GDP per capita -0.001 *** -0.001 *** -0.001 0.000
(log) population density 2.536 4.661 8.027 -4.612
business services -4.155 -13.107 ** -8.497 9.288 **
ERDF innovation -0.079 -0.041 -0.559 ** 0.166 *
(log) quality of governm. -0.689 -10.518 ** -14.344 ** 18.640 ***
accessibility index 0.149 * -0.098 -0.008 0.561 ***
R² within 0.001 0.002 0.001 0.013
R² between 0.016 0.029 0.043 0.157
R² overall 0.012 0.027 0.038 0.110
No. of observations 61,363 25,015 13,950 22,398
No. of clusters 5,490 2,242 1,248 2,000
40
Concerning the relevance of the cluster rating for the model, its omission leads to several smaller variations in
the coefficient estimates of some variables. Firstly, in the high / medium high technology sector now the
business services variable shows a very significant positive sign. The consequence is that also for the whole
sample of industries the coefficient is no more significantly negative. Secondly, and again in the high / medium
high technology sector, the coefficient on the share of innovation-related ERDF funding turns slightly
significant. Thirdly, increasing significance is found for the negative coefficients on governmental quality in the
medium low as well as in the low technology sector. Thus, the estimate for the whole sample of industries is now
insignificant. And finally, accessibility now achieves a slightly significant estimate. To sum up the implications
of omitting the cluster variable, especially estimates for the policy-related variables as well as some structural
indicators like the presence of business service cluster and accessibility are affected. This would not be the case
if the cluster variable was just similarly constructed as the dependent variable. In contrast, the implications for
the estimated effects of other variables indicate that real economic relations are considered when including the
cluster variable.
The third robustness check is not for methodological purposes only but is also of interest as to content. Again,
the reference results are those for RXA (gross exports) (Table 3.5). The first sub-sample is the category of less
developed regions. Here the most markedly difference compared to the full sample is the lack of significance for
patent intensity. Like the descriptive evidence suggests, this is probably due to lower variation to be explained.
Significance also disappears concerning business services, quality of government (except the MHH sector) and
GDP per capita. The latter variable even turns out to be significantly positive with respect to RXA values in the
MHH sector. In contrast to that, within this group of regions those with higher shares of high-skilled among the
young working age population now exhibit significantly higher trade specialisation. These changes indicate that
within this group of regions with similar cost advantages those with slightly better structural characteristics are
favoured, especially in industries of higher technology intensity.
In the group of transition regions some deviations from the full sample are also in need of explanation. First of
all, in some sectors significance of patent intensity and the share of SMEs with technological innovations
diminishes as well as it is the case for HERD regarding the whole set of sectors. BERD, however, is now
significanctly positive related to trade specialisation, although still on a low (10 %) level. Similary to the set of
variables on the knowledge base and innovation focus of a region, also the variables on the economic structure
are less distinct than in the full sample of regions, i. e. significance is especially reduced for GDP per capita,
business services, and the share of innovation measures within ERDF funding.9 The interpretation of these
deviations again refers to the lower variation within this group like the distribution of characteristics in the
descriptive analysis shows.
Within the group of the more developed regions fewer changes are found than for the two other structural fund
categories. Regarding the total of industries only HERD and quality of government lose significance while
population density is now significantly positive related to trade specialisation. The latter two cases of deviations
from the full sample concern changes of a merely 10 % significance threshold and thus are of lower importance.
Interestingly it is found that in the low technology sector of more developed regions the share of SMEs with
non-technological innovations as well as as population density turn out to be significantly positive. In contrast,
the beneficial effects in the high / medium high technology sector emanating from regional HERD and BERD
diminish while business services (positive) and the share of tertiary educated 30- to 34 year olds (negative) now
show significant coefficient estimates.
To sum up the region type specific analysis it is found that many effects disappear when regarding variation
within groups of a similar state of development. Generally, most of the effects are related to this difference, i. e.
the characteristics are positively correlated with region income levels. Moreover, inter-sectoral differences are
also prevalent. It is thus of special interest to what extent these inter-regional and inter-sectoral differences are
explained on a more detailed level of analysis as it is the goal of the case studies.
9 However, this does not imply that the model is less suitable. At least the R² is slightly higher than for the full sample.
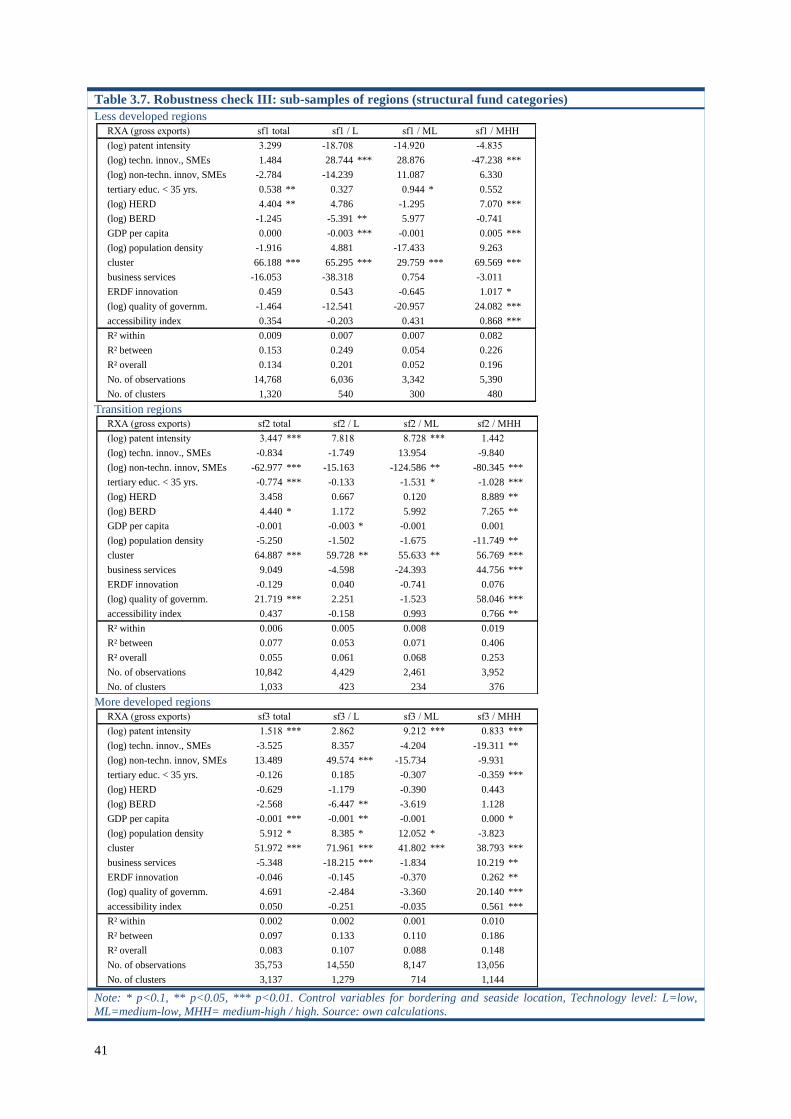
41
Table 3.7. Robustness check III: sub-samples of regions (structural fund categories)
Less developed regions
Transition regions
More developed regions
Note: * p<0.1, ** p<0.05, *** p<0.01. Control variables for bordering and seaside location, Technology level: L=low,
ML=medium-low, MHH= medium-high / high. Source: own calculations.
RXA (gross exports) sf1 total sf1 / L sf1 / ML sf1 / MHH
(log) patent intensity 3.299 -18.708 -14.920 -4.835
(log) techn. innov., SMEs 1.484 28.744 *** 28.876 -47.238 ***
(log) non-techn. innov, SMEs -2.784 -14.239 11.087 6.330
tertiary educ. < 35 yrs. 0.538 ** 0.327 0.944 * 0.552
(log) HERD 4.404 ** 4.786 -1.295 7.070 ***
(log) BERD -1.245 -5.391 ** 5.977 -0.741
GDP per capita 0.000 -0.003 *** -0.001 0.005 ***
(log) population density -1.916 4.881 -17.433 9.263
cluster 66.188 *** 65.295 *** 29.759 *** 69.569 ***
business services -16.053 -38.318 0.754 -3.011
ERDF innovation 0.459 0.543 -0.645 1.017 *
(log) quality of governm. -1.464 -12.541 -20.957 24.082 ***
accessibility index 0.354 -0.203 0.431 0.868 ***
R² within 0.009 0.007 0.007 0.082
R² between 0.153 0.249 0.054 0.226
R² overall 0.134 0.201 0.052 0.196
No. of observations 14,768 6,036 3,342 5,390
No. of clusters 1,320 540 300 480
RXA (gross exports) sf2 total sf2 / L sf2 / ML sf2 / MHH
(log) patent intensity 3.447 *** 7.818 8.728 *** 1.442
(log) techn. innov., SMEs -0.834 -1.749 13.954 -9.840
(log) non-techn. innov, SMEs -62.977 *** -15.163 -124.586 ** -80.345 ***
tertiary educ. < 35 yrs. -0.774 *** -0.133 -1.531 * -1.028 ***
(log) HERD 3.458 0.667 0.120 8.889 **
(log) BERD 4.440 * 1.172 5.992 7.265 **
GDP per capita -0.001 -0.003 * -0.001 0.001
(log) population density -5.250 -1.502 -1.675 -11.749 **
cluster 64.887 *** 59.728 ** 55.633 ** 56.769 ***
business services 9.049 -4.598 -24.393 44.756 ***
ERDF innovation -0.129 0.040 -0.741 0.076
(log) quality of governm. 21.719 *** 2.251 -1.523 58.046 ***
accessibility index 0.437 -0.158 0.993 0.766 **
R² within 0.006 0.005 0.008 0.019
R² between 0.077 0.053 0.071 0.406
R² overall 0.055 0.061 0.068 0.253
No. of observations 10,842 4,429 2,461 3,952
No. of clusters 1,033 423 234 376
RXA (gross exports) sf3 total sf3 / L sf3 / ML sf3 / MHH
(log) patent intensity 1.518 *** 2.862 9.212 *** 0.833 ***
(log) techn. innov., SMEs -3.525 8.357 -4.204 -19.311 **
(log) non-techn. innov, SMEs 13.489 49.574 *** -15.734 -9.931
tertiary educ. < 35 yrs. -0.126 0.185 -0.307 -0.359 ***
(log) HERD -0.629 -1.179 -0.390 0.443
(log) BERD -2.568 -6.447 ** -3.619 1.128
GDP per capita -0.001 *** -0.001 ** -0.001 0.000 *
(log) population density 5.912 * 8.385 * 12.052 * -3.823
cluster 51.972 *** 71.961 *** 41.802 *** 38.793 ***
business services -5.348 -18.215 *** -1.834 10.219 **
ERDF innovation -0.046 -0.145 -0.370 0.262 **
(log) quality of governm. 4.691 -2.484 -3.360 20.140 ***
accessibility index 0.050 -0.251 -0.035 0.561 ***
R² within 0.002 0.002 0.001 0.010
R² between 0.097 0.133 0.110 0.186
R² overall 0.083 0.107 0.088 0.148
No. of observations 35,753 14,550 8,147 13,056
No. of clusters 3,137 1,279 714 1,144
42
3.5. SUMMARY
In summary, measurements at the single industry level, represented by patent intensity and cluster structures, are
mostly positively correlated with high RXA values. This result is in line with the empirical literature and is an
important evaluation of the data created since innovation and (other) productivity enhancing factors such as
patents and clusters should be strongly related to competitiveness. Concerning the explanation of different
specialisation patterns especially clusters prove to play a decisive role if similar regions (in terms of income
levels) are compared. The distribution of patents, however, is too much concentrated on more developed regions
– regardless of the specific industry – to be of relevance for explaining variation within the same region
(structural funds) category.
Secondly, effects of regional characteristics which are not industry-specific but attributable to the whole regional
economy are not homogeneous across manufacturing industries. Innovation behaviour of SMEs only affects low-
and medium-low-technology industries. Presumably, this effect stems from the higher weight of SMEs in these
industries (making the indicator more industry-specific). High-technology industries, in contrast, are supposed to
be rather located in diverse regions and more heavily rely on larger firms than low-technology industries.
Thirdly, and in a similar vein, export specialisation in medium-high-/high-technology industries is associated
with above-average business R&D efforts which are supposed to be shaped by large firms. Since these industries
are defined by high R&D expenditures, among other things, it is not surprising that a higher BERD intensity on
the regional level is correlated with above-average export shares of these industries. As a further actor in the
innovation system, local institutions of higher education (HEI) are considered which also contribute more to
high- and medium-high-technology industries than to other industries.
Finally, with regard to variables showing a comprehensive pattern, governmental quality exhibits positive effects
mainly in medium-high/high-technology industries and, in two cases, also in low-technology industry. This
feature is expected to favour the advanced developed regions in particular. A similar pattern is found for
accessibility which hardly plays a role for low and medium low technology industries.
The results suggest that competitive high-technology industries rely on other regional features than most low-
and medium-low-technology industries. Without having analysed the effects of regional characteristics on
changes in the specialisation pattern, a cautious conclusion could be that a structural shift from competitive low-
technology- to competitive high-technology-exports is less likely – since it would require to alternate its whole
structure – than starting from non-competitive low-technology locations. This structural difference is expressed
by the varying emphasis of the innovation system. Although own R&D efforts as measured by patents as a
throughput indicator are effective in nearly every industry, it becomes clear that, on the one hand,
competitiveness in low- and medium-low-technology industries is linked to innovative SMEs, whereby innova-
tions do not necessarily have to be linked to industry-specific R&D. On the other hand, medium-high/high-
technology industries rely on high business R&D investments, which are more common for large companies.
The only characteristic which has an unambiguously robust and positive effect on specialisation of medium-
high/high-technology industries is quality of government which proves to be an unconditional prerequisite.
Instead of aiming at changes in a region’s industrial structure it is therefore recommended to strengthen the
endogenous potential. The role played by SMEs has been shown for low- and medium-low-technology sectors.
Innovation policy measures should not only focus on technological projects and capabilities but also on business
strategies of non-technological character (e.g. design, marketing, distribution). Exploiting cost advantages, also
via the attraction of foreign direct investment, seems to be a reasonable strategy for low income regions at a first
glance, but it has to be considered as well that within the less developed regions tertiary education and HEIs play
a non-negligible role.
43
Chapter 4. CASE STUDIES
4.1. CASE SELECTION
So far, our analysis has focused on a large-N design that allows identifying the extent to which certain variables
are correlated with the competitiveness of regions. However, this design and technique does not explain how
these effects occur. In order to investigate the emergence and interplay of determinants for international
competitiveness at the regional level, ten case studies of selected European regions are conducted. Their aim is to
identify regional characteristics that explain the exceptional industrial performance of the industries, expressed
by their high RXA or RCA values. Given their idiosyncratic nature, these factors vary across regions. Therefore,
it is not feasible to include them in the quantitative regression models.These regional factors encompass, for
instance, the quality and focus of regional universities, clusters, historical events causing path dependencies, and
other factors related to the idiosyncratic regional setting. To obtain background information on these factors,
additional documents and information sources are analysed. Additional data sources that are explored in the
course of the case studies include, for instance, the Regional Innovation Monitor Plus (RIM Plus), which
describes the innovation systems in selected European regions.10
The case studies further emphasise the
performance implications of local, regional and – if applicable – national policy instruments aiming at fostering
R&I investments and cluster creation. The goal is to descriptively trace the implications of specific policies and
assess the extent to which policy interventions contribute to the regional trade specialisation and trade
performance.
The case studies focus on best practice examples, i.e. regions that fulfil a number of selection criteria reflecting
their exceptional performance in international trade. The selection follows a two-step data-driven explorative
approach: In the first stage, three selection criteria are applied that target the performance of regions in
international trade. These include the durability, the variety, and the relevance of trade specialisation. In the
second stage, regions that meet these selection criteria are grouped along their settlement structure and their
structural funds category in order to obtain variation in main economic and geographical characteristics. The
rationale of these selection criteria is described in detail below. The selection is limited to regions in EU Member
States with at least two NUTS 2 regions. This ensures that the case studies cover only countries in which intra-
national variation and thus impacts of regional policies such as smart specialisation or similar strategies can be
observed. Therefore, regions in Cyprus, Estonia, Latvia, Lithuania, Luxemburg, and Malta are a priori excluded
from the sample.
Durability is defined as the property of regions that reveal above-average RCAs in a given industry throughout a
substantial period of time (i.e. from 2000 to 2011). RCAs for the respective regions and industries are calculated
based on national import and export data derived from the UN Comtrade Database. The durability selection
criterion ensures that only regions whose trade specialisation (RCA) is permanently above-average (i.e. above
the 75 %-quantile in a given industry in each year from 2000 to 2011) are taken into account. Regions whose
trade performance is volatile and only above-average in some years are not taken into consideration, as these
individual peaks may not be explained by any structural characteristics, but reflect short-termed increases that
are mainly driven by individual firms.
Variety is defined as the property of regions in which at least three industries exhibit high RCAs throughout the
period 2000 to 2011. This aims at capturing regions with a wider industry mix, which is a proxy for better
resilience against industry-specific shocks.11
Furthermore, the criterion increases the likelihood of selecting
regions which are dominated by SMEs and, hence, do not depend on one large company which shapes a
monostructural regional trade specialisation. The industries considered here are restricted to 22 manufacturing
sectors (i.e. product groups 15-36, according to the statistical classification of products by activity (CPA) 2002).
Service industries are not considered.
10 See European Commission (2015a – k).
11 If sectors belong to the same value chain, shocks can propagate through all of them. This possibility cannot be taken into account by the
Variety property. The lack of regional IO tables makes it very hard to use more precise indicators.
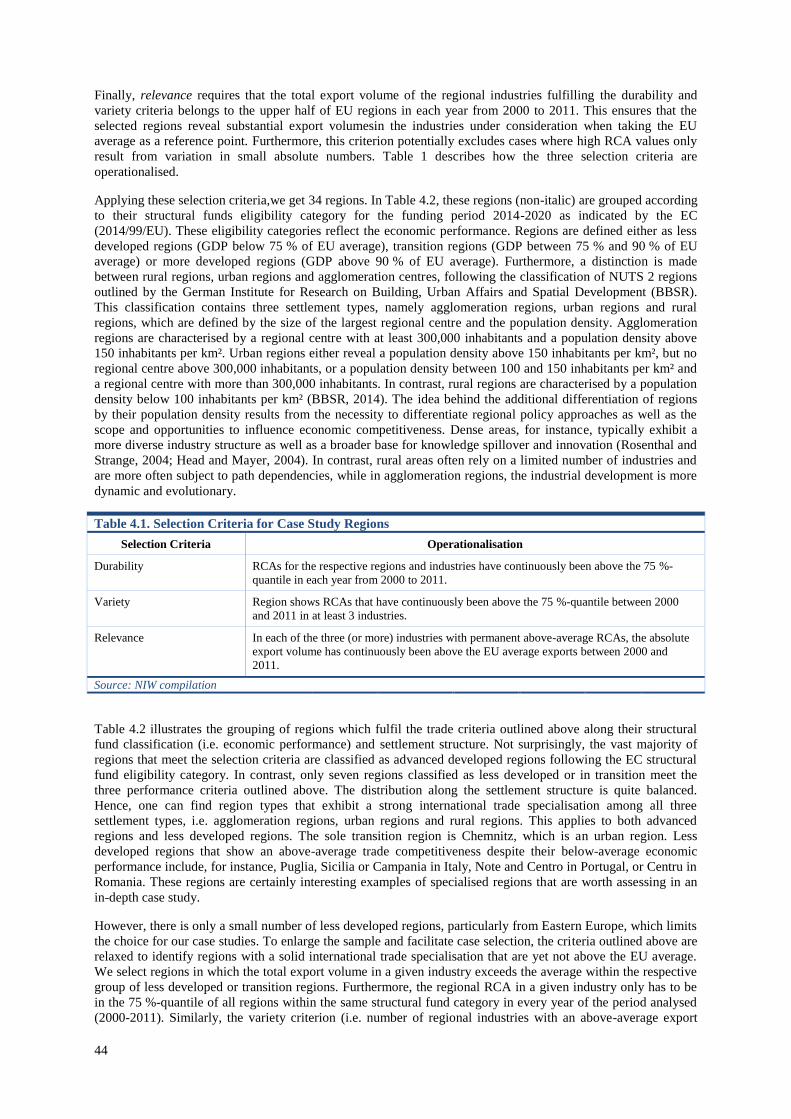
44
Finally, relevance requires that the total export volume of the regional industries fulfilling the durability and
variety criteria belongs to the upper half of EU regions in each year from 2000 to 2011. This ensures that the
selected regions reveal substantial export volumesin the industries under consideration when taking the EU
average as a reference point. Furthermore, this criterion potentially excludes cases where high RCA values only
result from variation in small absolute numbers. Table 1 describes how the three selection criteria are
operationalised.
Applying these selection criteria,we get 34 regions. In Table 4.2, these regions (non-italic) are grouped according
to their structural funds eligibility category for the funding period 2014-2020 as indicated by the EC
(2014/99/EU). These eligibility categories reflect the economic performance. Regions are defined either as less
developed regions (GDP below 75 % of EU average), transition regions (GDP between 75 % and 90 % of EU
average) or more developed regions (GDP above 90 % of EU average). Furthermore, a distinction is made
between rural regions, urban regions and agglomeration centres, following the classification of NUTS 2 regions
outlined by the German Institute for Research on Building, Urban Affairs and Spatial Development (BBSR).
This classification contains three settlement types, namely agglomeration regions, urban regions and rural
regions, which are defined by the size of the largest regional centre and the population density. Agglomeration
regions are characterised by a regional centre with at least 300,000 inhabitants and a population density above
150 inhabitants per km². Urban regions either reveal a population density above 150 inhabitants per km², but no
regional centre above 300,000 inhabitants, or a population density between 100 and 150 inhabitants per km² and
a regional centre with more than 300,000 inhabitants. In contrast, rural regions are characterised by a population
density below 100 inhabitants per km² (BBSR, 2014). The idea behind the additional differentiation of regions
by their population density results from the necessity to differentiate regional policy approaches as well as the
scope and opportunities to influence economic competitiveness. Dense areas, for instance, typically exhibit a
more diverse industry structure as well as a broader base for knowledge spillover and innovation (Rosenthal and
Strange, 2004; Head and Mayer, 2004). In contrast, rural areas often rely on a limited number of industries and
are more often subject to path dependencies, while in agglomeration regions, the industrial development is more
dynamic and evolutionary.
Table 4.1. Selection Criteria for Case Study Regions
Selection Criteria Operationalisation
Durability RCAs for the respective regions and industries have continuously been above the 75 %-
quantile in each year from 2000 to 2011.
Variety Region shows RCAs that have continuously been above the 75 %-quantile between 2000
and 2011 in at least 3 industries.
Relevance In each of the three (or more) industries with permanent above-average RCAs, the absolute
export volume has continuously been above the EU average exports between 2000 and
2011.
Source: NIW compilation
Table 4.2 illustrates the grouping of regions which fulfil the trade criteria outlined above along their structural
fund classification (i.e. economic performance) and settlement structure. Not surprisingly, the vast majority of
regions that meet the selection criteria are classified as advanced developed regions following the EC structural
fund eligibility category. In contrast, only seven regions classified as less developed or in transition meet the
three performance criteria outlined above. The distribution along the settlement structure is quite balanced.
Hence, one can find region types that exhibit a strong international trade specialisation among all three
settlement types, i.e. agglomeration regions, urban regions and rural regions. This applies to both advanced
regions and less developed regions. The sole transition region is Chemnitz, which is an urban region. Less
developed regions that show an above-average trade competitiveness despite their below-average economic
performance include, for instance, Puglia, Sicilia or Campania in Italy, Note and Centro in Portugal, or Centru in
Romania. These regions are certainly interesting examples of specialised regions that are worth assessing in an
in-depth case study.
However, there is only a small number of less developed regions, particularly from Eastern Europe, which limits
the choice for our case studies. To enlarge the sample and facilitate case selection, the criteria outlined above are
relaxed to identify regions with a solid international trade specialisation that are yet not above the EU average.
We select regions in which the total export volume in a given industry exceeds the average within the respective
group of less developed or transition regions. Furthermore, the regional RCA in a given industry only has to be
in the 75 %-quantile of all regions within the same structural fund category in every year of the period analysed
(2000-2011). Similarly, the variety criterion (i.e. number of regional industries with an above-average export
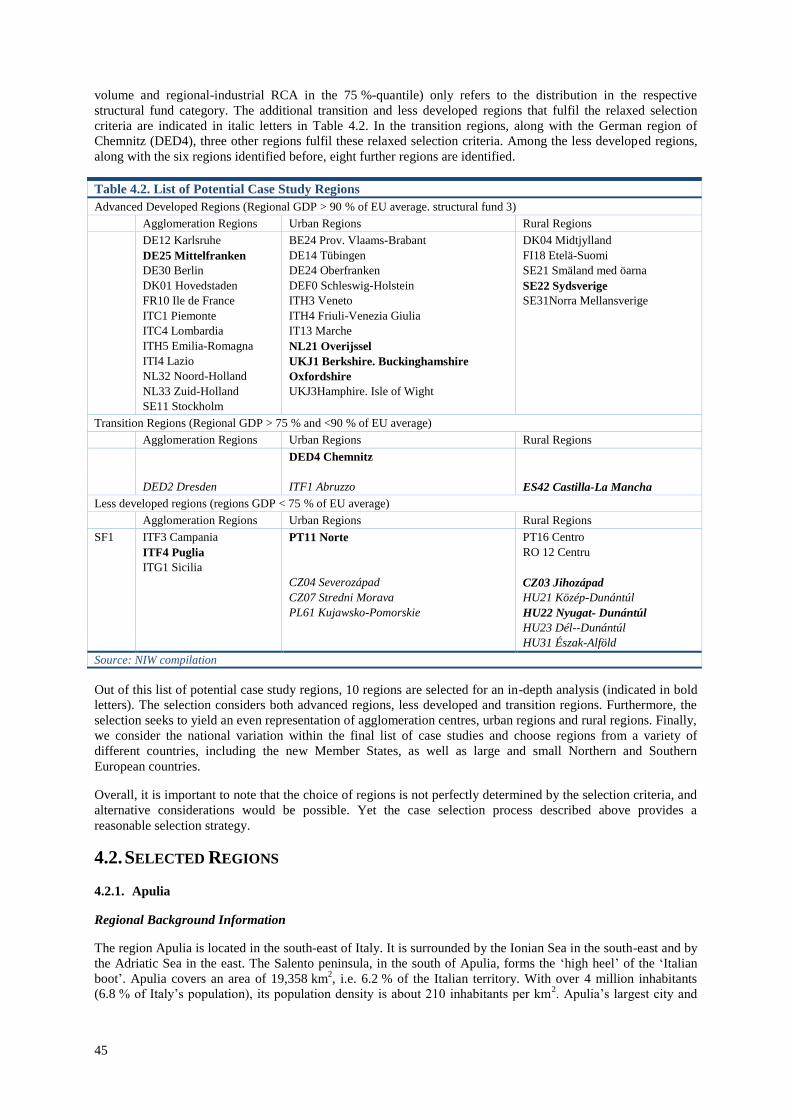
45
volume and regional-industrial RCA in the 75 %-quantile) only refers to the distribution in the respective
structural fund category. The additional transition and less developed regions that fulfil the relaxed selection
criteria are indicated in italic letters in Table 4.2. In the transition regions, along with the German region of
Chemnitz (DED4), three other regions fulfil these relaxed selection criteria. Among the less developed regions,
along with the six regions identified before, eight further regions are identified.
Table 4.2. List of Potential Case Study Regions
Advanced Developed Regions (Regional GDP > 90 % of EU average. structural fund 3)
Agglomeration Regions Urban Regions Rural Regions
DE12 Karlsruhe
DE25 Mittelfranken
DE30 Berlin
DK01 Hovedstaden
FR10 Ile de France
ITC1 Piemonte
ITC4 Lombardia
ITH5 Emilia-Romagna
ITI4 Lazio
NL32 Noord-Holland
NL33 Zuid-Holland
SE11 Stockholm
BE24 Prov. Vlaams-Brabant
DE14 Tübingen
DE24 Oberfranken
DEF0 Schleswig-Holstein
ITH3 Veneto
ITH4 Friuli-Venezia Giulia
IT13 Marche
NL21 Overijssel
UKJ1 Berkshire. Buckinghamshire
Oxfordshire
UKJ3Hamphire. Isle of Wight
DK04 Midtjylland
FI18 Etelä-Suomi
SE21 Smäland med öarna
SE22 Sydsverige
SE31Norra Mellansverige
Transition Regions (Regional GDP > 75 % and <90 % of EU average)
Agglomeration Regions Urban Regions Rural Regions
DED2 Dresden
DED4 Chemnitz
ITF1 Abruzzo
ES42 Castilla-La Mancha
Less developed regions (regions GDP < 75 % of EU average)
Agglomeration Regions Urban Regions Rural Regions
SF1 ITF3 Campania
ITF4 Puglia
ITG1 Sicilia
PT11 Norte
CZ04 Severozápad
CZ07 Stredni Morava
PL61 Kujawsko-Pomorskie
PT16 Centro
RO 12 Centru
CZ03 Jihozápad
HU21 Közép-Dunántúl
HU22 Nyugat- Dunántúl
HU23 Dél--Dunántúl
HU31 Észak-Alföld
Source: NIW compilation
Out of this list of potential case study regions, 10 regions are selected for an in-depth analysis (indicated in bold
letters). The selection considers both advanced regions, less developed and transition regions. Furthermore, the
selection seeks to yield an even representation of agglomeration centres, urban regions and rural regions. Finally,
we consider the national variation within the final list of case studies and choose regions from a variety of
different countries, including the new Member States, as well as large and small Northern and Southern
European countries.
Overall, it is important to note that the choice of regions is not perfectly determined by the selection criteria, and
alternative considerations would be possible. Yet the case selection process described above provides a
reasonable selection strategy.
4.2. SELECTED REGIONS
4.2.1. Apulia
Regional Background Information
The region Apulia is located in the south-east of Italy. It is surrounded by the Ionian Sea in the south-east and by
the Adriatic Sea in the east. The Salento peninsula, in the south of Apulia, forms the ‘high heel’ of the ‘Italian
boot’. Apulia covers an area of 19,358 km2, i.e. 6.2 % of the Italian territory. With over 4 million inhabitants
(6.8 % of Italy’s population), its population density is about 210 inhabitants per km2. Apulia’s largest city and
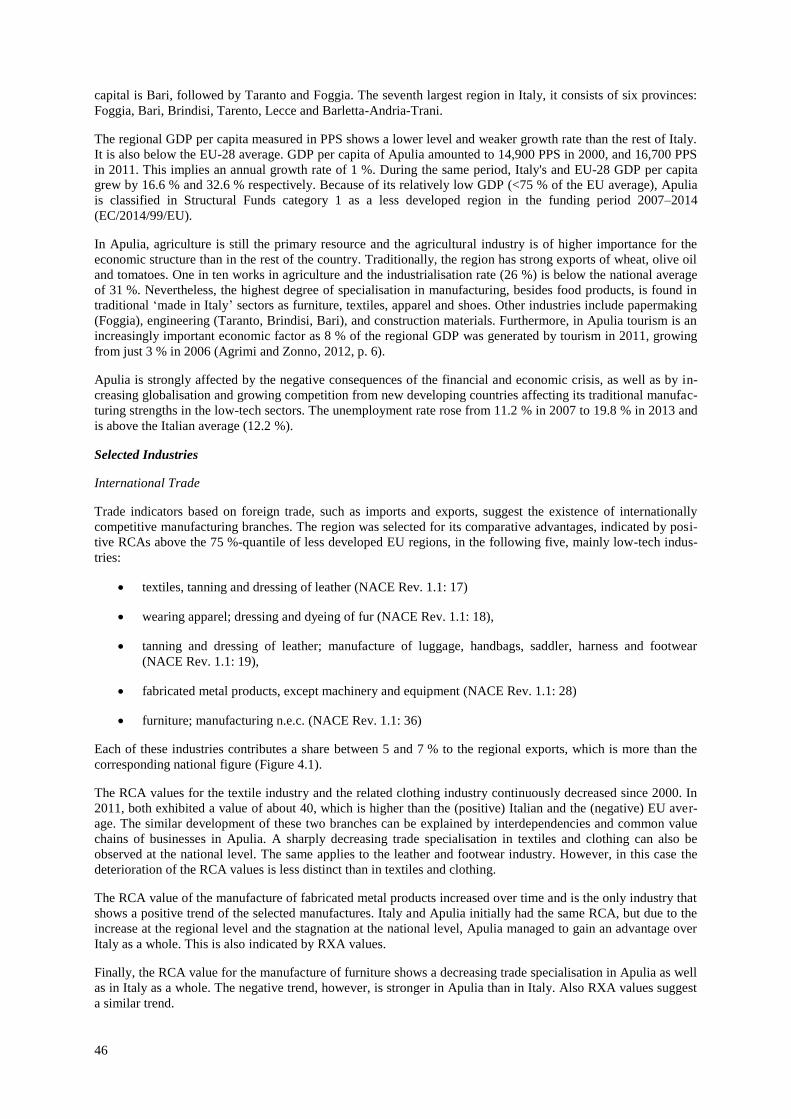
46
capital is Bari, followed by Taranto and Foggia. The seventh largest region in Italy, it consists of six provinces:
Foggia, Bari, Brindisi, Tarento, Lecce and Barletta-Andria-Trani.
The regional GDP per capita measured in PPS shows a lower level and weaker growth rate than the rest of Italy.
It is also below the EU-28 average. GDP per capita of Apulia amounted to 14,900 PPS in 2000, and 16,700 PPS
in 2011. This implies an annual growth rate of 1 %. During the same period, Italy's and EU-28 GDP per capita
grew by 16.6 % and 32.6 % respectively. Because of its relatively low GDP (<75 % of the EU average), Apulia
is classified in Structural Funds category 1 as a less developed region in the funding period 2007–2014
(EC/2014/99/EU).
In Apulia, agriculture is still the primary resource and the agricultural industry is of higher importance for the
economic structure than in the rest of the country. Traditionally, the region has strong exports of wheat, olive oil
and tomatoes. One in ten works in agriculture and the industrialisation rate (26 %) is below the national average
of 31 %. Nevertheless, the highest degree of specialisation in manufacturing, besides food products, is found in
traditional ‘made in Italy’ sectors as furniture, textiles, apparel and shoes. Other industries include papermaking
(Foggia), engineering (Taranto, Brindisi, Bari), and construction materials. Furthermore, in Apulia tourism is an
increasingly important economic factor as 8 % of the regional GDP was generated by tourism in 2011, growing
from just 3 % in 2006 (Agrimi and Zonno, 2012, p. 6).
Apulia is strongly affected by the negative consequences of the financial and economic crisis, as well as by in-
creasing globalisation and growing competition from new developing countries affecting its traditional manufac-
turing strengths in the low-tech sectors. The unemployment rate rose from 11.2 % in 2007 to 19.8 % in 2013 and
is above the Italian average (12.2 %).
Selected Industries
International Trade
Trade indicators based on foreign trade, such as imports and exports, suggest the existence of internationally
competitive manufacturing branches. The region was selected for its comparative advantages, indicated by posi-
tive RCAs above the 75 %-quantile of less developed EU regions, in the following five, mainly low-tech indus-
tries:
textiles, tanning and dressing of leather (NACE Rev. 1.1: 17)
wearing apparel; dressing and dyeing of fur (NACE Rev. 1.1: 18),
tanning and dressing of leather; manufacture of luggage, handbags, saddler, harness and footwear
(NACE Rev. 1.1: 19),
fabricated metal products, except machinery and equipment (NACE Rev. 1.1: 28)
furniture; manufacturing n.e.c. (NACE Rev. 1.1: 36)
Each of these industries contributes a share between 5 and 7 % to the regional exports, which is more than the
corresponding national figure (Figure 4.1).
The RCA values for the textile industry and the related clothing industry continuously decreased since 2000. In
2011, both exhibited a value of about 40, which is higher than the (positive) Italian and the (negative) EU aver-
age. The similar development of these two branches can be explained by interdependencies and common value
chains of businesses in Apulia. A sharply decreasing trade specialisation in textiles and clothing can also be
observed at the national level. The same applies to the leather and footwear industry. However, in this case the
deterioration of the RCA values is less distinct than in textiles and clothing.
The RCA value of the manufacture of fabricated metal products increased over time and is the only industry that
shows a positive trend of the selected manufactures. Italy and Apulia initially had the same RCA, but due to the
increase at the regional level and the stagnation at the national level, Apulia managed to gain an advantage over
Italy as a whole. This is also indicated by RXA values.
Finally, the RCA value for the manufacture of furniture shows a decreasing trade specialisation in Apulia as well
as in Italy as a whole. The negative trend, however, is stronger in Apulia than in Italy. Also RXA values suggest
a similar trend.
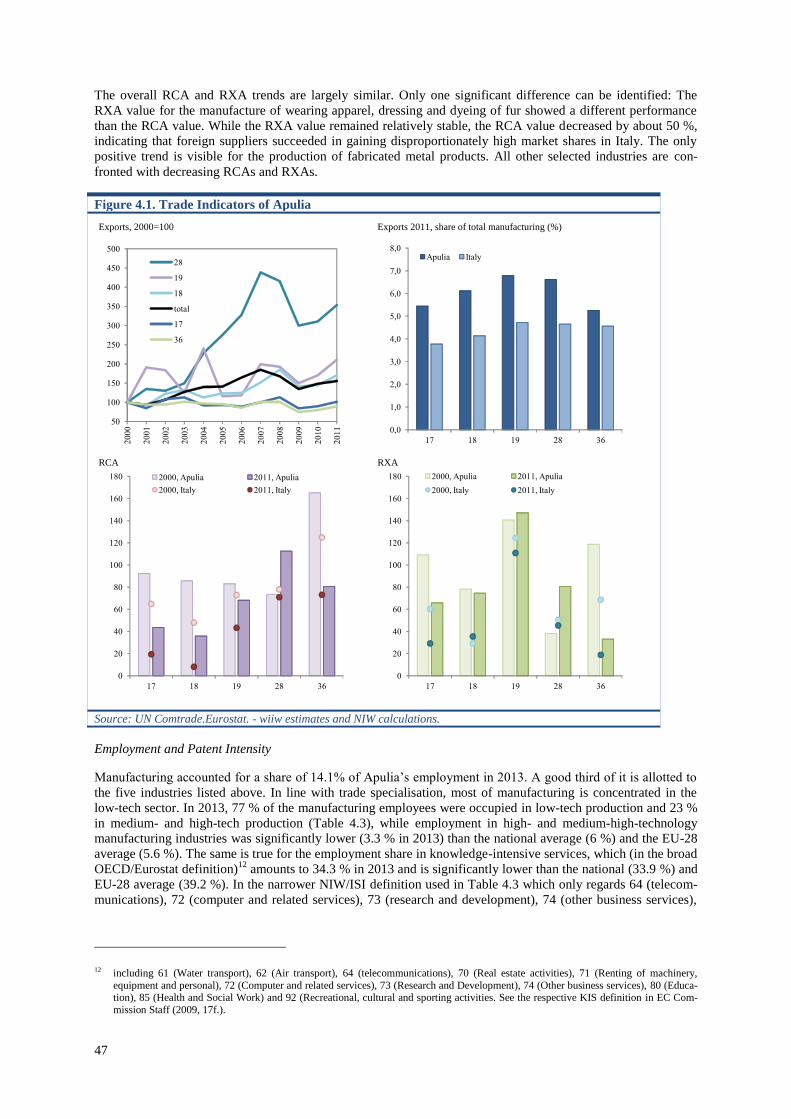
47
The overall RCA and RXA trends are largely similar. Only one significant difference can be identified: The
RXA value for the manufacture of wearing apparel, dressing and dyeing of fur showed a different performance
than the RCA value. While the RXA value remained relatively stable, the RCA value decreased by about 50 %,
indicating that foreign suppliers succeeded in gaining disproportionately high market shares in Italy. The only
positive trend is visible for the production of fabricated metal products. All other selected industries are con-
fronted with decreasing RCAs and RXAs.
Figure 4.1. Trade Indicators of Apulia
Source: UN Comtrade.Eurostat. - wiiw estimates and NIW calculations.
Employment and Patent Intensity
Manufacturing accounted for a share of 14.1% of Apulia’s employment in 2013. A good third of it is allotted to
the five industries listed above. In line with trade specialisation, most of manufacturing is concentrated in the
low-tech sector. In 2013, 77 % of the manufacturing employees were occupied in low-tech production and 23 %
in medium- and high-tech production (Table 4.3), while employment in high- and medium-high-technology
manufacturing industries was significantly lower (3.3 % in 2013) than the national average (6 %) and the EU-28
average (5.6 %). The same is true for the employment share in knowledge-intensive services, which (in the broad
OECD/Eurostat definition)12
amounts to 34.3 % in 2013 and is significantly lower than the national (33.9 %) and
EU-28 average (39.2 %). In the narrower NIW/ISI definition used in Table 4.3 which only regards 64 (telecom-
munications), 72 (computer and related services), 73 (research and development), 74 (other business services),
12 including 61 (Water transport), 62 (Air transport), 64 (telecommunications), 70 (Real estate activities), 71 (Renting of machinery,
equipment and personal), 72 (Computer and related services), 73 (Research and Development), 74 (Other business services), 80 (Educa-tion), 85 (Health and Social Work) and 92 (Recreational, cultural and sporting activities. See the respective KIS definition in EC Com-
mission Staff (2009, 17f.).
Exports, 2000=100 Exports 2011, share of total manufacturing (%)
RCA RXA
50
100
150
200
250
300
350
400
450
500
20
00
20
01
20
02
20
03
20
04
20
05
20
06
20
07
20
08
20
09
20
10
20
11
28
19
18
total
17
36
0,0
1,0
2,0
3,0
4,0
5,0
6,0
7,0
8,0
17 18 19 28 36
Apulia Italy
0
20
40
60
80
100
120
140
160
180
17 18 19 28 36
2000, Apulia 2011, Apulia
2000, Italy 2011, Italy
0
20
40
60
80
100
120
140
160
180
17 18 19 28 36
2000, Apulia 2011, Apulia
2000, Italy 2011, Italy
48
85 (health and social work) and 92 (recreational, cultural and sporting activities) as knowledge-intensive services
(Legler and Frietsch, 2007, pp. 19f.), 20.9 % of Apulia’s workforce was employed in this sector.
Table 4.3. Regional Key Figures of Apulia
Employment Patent intensity
Sector Number of
employees
Regional employment
structure (%)
Annual average
growth
rate of regional
employment
between 2000
and 2013 (%)
Patents per 10,000 employees
(average for 2000 to 2002 and
2009 to 2011)
2013 2000 2000-13 2000-02 2009-11
Region total 1,156,900 100.0 100.0 -0.3
Manufacturing 163,000 14.1 16.3 -1.5 2.6 6.8
High- and
medium-tech 38,600 3.3 4.0 -1.7 9.1 21.5
Low-tech 124,400 10.8 12.4 -1.4 0.8 2.2
Knowledge-
intensive services 241,900 20.9 15.2 2.1
Other 752,000 65.0 68.4 -0.7
Selected manufacturing industries:
17 4,100 0.4 1.2 -9.3 0.4 0.5
18 18,300 1.6 2.4 -3.4 0.1 0.2
19 6,300 0.5 0.8 -3.3 0.5 0.0
28 17,900 1.5 1.1 2.1 1.3 3.4
36 11,600 1.0 1.8 -4.7 1.0 3.3
Source: Eurostat. OECD RegPat. - NIW and ZEW calculations.
Note that only the manufacture of fabricated metal products (28) shows growing RCA and RXA values and an
employment increase of 2.1 % against the trend in total manufacturing (-1.5 % p.a., Table 4.3). Employment in
the other four industries considered declined at above-average rates of over 3% in the apparel (18) and leather
and footwear industry (19), nearly 5 % in the furniture industry (36) up to more than 9 % in the textiles industry
(17). Moreover, only the manufacture of fabricated metal products (with 3.4 patents per 10,000 employees) and
the manufacture of furniture (3.3 patents) display an above low-tech industry average (2.2 patents) and signifi-
cantly growing patent intensity over time. However, those trends take place on a very low level. Overall, the low
patent activity in total manufacturing mirrors the low-tech orientation of the industry in Apulia. It is a negative
indicator for the future development potential of the regional economy.
Drivers of Regional Trade Specialisation and Regional Growth
Economic Structure
The economic structure can give first insights on the main drivers of comparative advantages. Especially ag-
glomerations of similar businesses have the potential to increase productivity and innovativeness. Thus, clusters
are of particular importance. In recent years, the mechanical engineering and manufacturing industry have
played an important role in Apulia. Despite the initial orientation towards agriculture, the main focus has
changed to precision mechanics for the manufacturing industry. Today, 14 steel processing companies are lo-
cated in Apulia. (Bellais, 2014, p. 108). All these firms may explain the regional competitiveness in the manu-
facture of fabricated metal products (28). Financial incentives attracted large supplier companies from the auto-
motive industry and the machinery and equipment manufacturing for the oil and gas industry. Smaller firms
followed and according to Florio et al. (2014), in 2009, 184 firms operating in precision mechanics for the manu-
facturing industry were located in the region. With its 16,000 employees, this cluster was responsible for about
25 % of the regional exports (Florio et al., 2014).
49
Furthermore, the regional fashion cluster (particularly for footwear and apparel) and the wood and furniture
cluster, classified as European star clusters according to the European Cluster Observatory, are potential drivers
of the comparatively good trade performance of the region in these industries. Around the capital Bari, a ‘sofa
cluster’ has been established, dominated by a few large enterprises and a variety of smaller firms, often suppli-
ers, which are specialised in one single good. The cluster serves the markets in the EU and the USA (Veneto
Region, n.d., p. 5).
Moreover, six smaller regional clusters can be identified in Apulia. The DHITECH cluster in nanotechnology,
the DARe cluster in the sector of technologies for agriculture and food production, the MEDIS cluster in the
mechanical engineering and manufacturing technology, the DiNTE cluster in the renewable energy industry, the
DAP cluster in aerospace and finally the H-Bio Puglia District ‘Health and Biotechnology’ (BIAT, 2015; Florio
et al., 2014).
Yet, it seems that the existence of most of the regional clusters does not translate into a leading and innovative
role of the region. Apulia’s trade advantages are not in high-tech- or knowledge-intensive industries. Manufac-
turing activities play a more relevant role than innovation and research, also in the larger foreign companies in
the region. For instance, the German multinationals Bosch, Getrag (a world leader in the production of transmis-
sion systems for the automotive sector) and Osram (leading in producing lamps and lightning systems) have
facilities in Apulia. Another international company producing in Taranto is Vestas, a Danish company special-
ised in wind turbines. Other important employers in the region are Marcegaglia, an Italian steel company, the oil
and gas company Eni (IT), GE Oil & Gas (USA), ExxonMobil (USA), plus Enel (IT), a manufacturer and dis-
tributor of electricity and gas, pharmacy firms (Sanofi Aventis (FR), Merck Serono (GER)), the auto and truck
parts manufacturer Fiat (IT), Bridgestone (JP), high-technology and aerospace firms (Avio (IT), Finmeccanica
(IT)), food companies (Barilla (IT), Granarolo (IT), Amadori (IT)), Italian information and communication tech-
nology (ICT) firms (Transcom, Fastweb Telecom, Buzzi Unicem e Cementir, Teleperformance), and one of the
world leading (glass) manufacturers of packaging products (Owens Illinois (USA)).
Regional Innovation System
The overall R&D spending on GDP in the Apulia region is 0.7%,distinctly lower than the rest of Italy, where
1.3% of the GDP was invested in R&D in 2011. In absolute terms, EUR 500 million were spent in R&D in the
same year, to which universities contributed with a share of 54 %. Businesses invested 26 % of the total sum and
the public sector 14 % (Eurostat Regional Database, 2015). The absolute R&D expenditures are thus compara-
tively low and particularly the R&D spending of knowledge-intensive businesses is lacking. This is also re-
flected by the low patent intensity in regional manufacturing (Table 4.3).
More than twenty public R&D institutions belonging to the National Council of Research (CNR), are located in
Apulia. In addition, the region of Apulia hosts three important universities. The universities of Bari and Salento
and the Polytechnic University of Bari, doing research in the fields of engineering (innovation engineering, elec-
tronics, civil engineering and mechanical engineering), chemistry, informatics and physics (Florio et al., 2014).
In the private sector, Fiat was the first large company to open in 1976, a research and development institute in
Apulia. Fiat hired local engineers and opened two additional research and development institutes in Apulia.
Later, in 1994 the German company Bosch opened its own institute for research and development. Today, 160
engineers from local universities are working for Bosch in Apulia. Six years later, in 2000, Getrag opened a
branch office in Apulia, and employing 30 technicians and engineers (Florio et al., 2014).
The regional innovation system consisting of universities, enterprises and public funding seems only partially
successful, as is reflected in the relatively low patent intensity and low regional R&D expenditures. Three weak-
nesses can be identified. First, the communication and the links between universities and companies are very
weak. Second, the region has to deal with expenditure cuts for research and development programmes. Finally, a
low demand for services was recorded. All that can cause a lack of investments in research and development in
the mid run (Agrimi and Zonno, 2012, p. 7).
Political Context and Regional Growth Policies
As a less developed EU region (GDP <75 % of the EU average), Apulia profits greatly from the EU structural
funds (Technopolis group et al., 2011). For the current funding period, the region has set up a regional develop-
ment strategy, the so-called SmartPuglia 2020. In the course of the project, the region plans to invest EUR 2.7
billion between 2014 and 2020. More than EUR 1 billion comes from the EU structural funds and around 6,000
companies will benefit from the programme. By involving all regional stakeholders in a dialogue, the pro-
gramme tries to combine different policy fields, including internationalisation, employment and training, digital
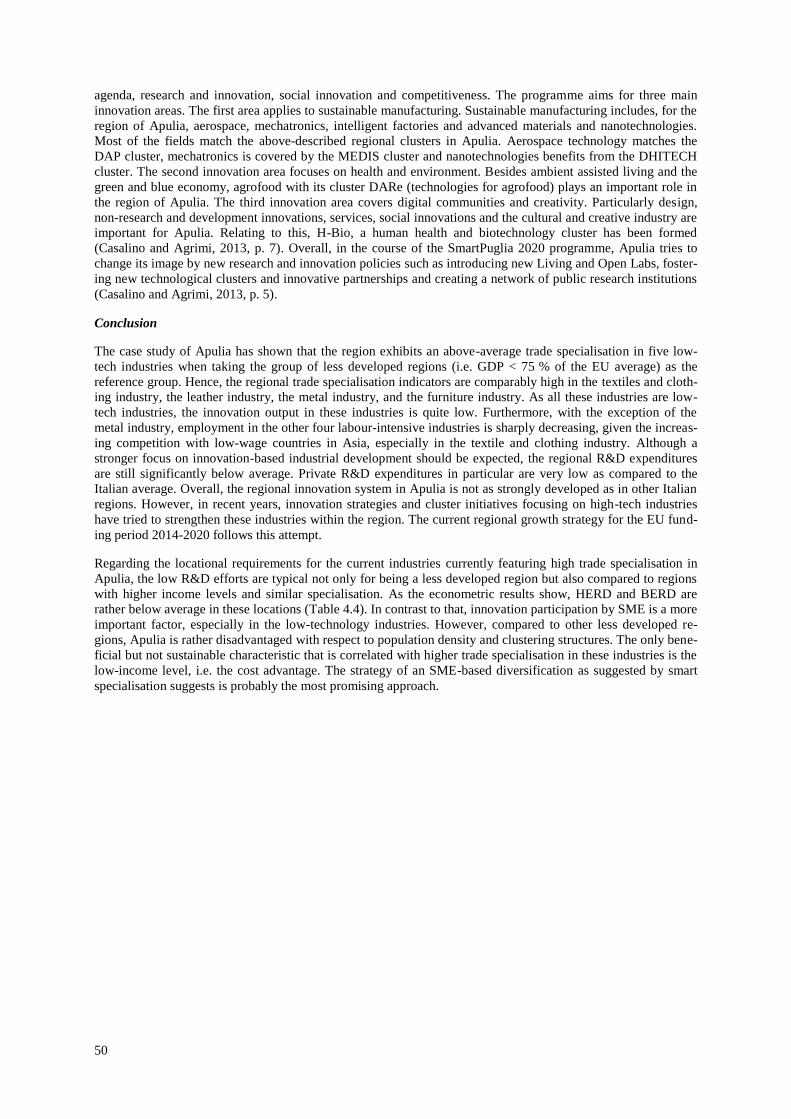
50
agenda, research and innovation, social innovation and competitiveness. The programme aims for three main
innovation areas. The first area applies to sustainable manufacturing. Sustainable manufacturing includes, for the
region of Apulia, aerospace, mechatronics, intelligent factories and advanced materials and nanotechnologies.
Most of the fields match the above-described regional clusters in Apulia. Aerospace technology matches the
DAP cluster, mechatronics is covered by the MEDIS cluster and nanotechnologies benefits from the DHITECH
cluster. The second innovation area focuses on health and environment. Besides ambient assisted living and the
green and blue economy, agrofood with its cluster DARe (technologies for agrofood) plays an important role in
the region of Apulia. The third innovation area covers digital communities and creativity. Particularly design,
non-research and development innovations, services, social innovations and the cultural and creative industry are
important for Apulia. Relating to this, H-Bio, a human health and biotechnology cluster has been formed
(Casalino and Agrimi, 2013, p. 7). Overall, in the course of the SmartPuglia 2020 programme, Apulia tries to
change its image by new research and innovation policies such as introducing new Living and Open Labs, foster-
ing new technological clusters and innovative partnerships and creating a network of public research institutions
(Casalino and Agrimi, 2013, p. 5).
Conclusion
The case study of Apulia has shown that the region exhibits an above-average trade specialisation in five low-
tech industries when taking the group of less developed regions (i.e. GDP < 75 % of the EU average) as the
reference group. Hence, the regional trade specialisation indicators are comparably high in the textiles and cloth-
ing industry, the leather industry, the metal industry, and the furniture industry. As all these industries are low-
tech industries, the innovation output in these industries is quite low. Furthermore, with the exception of the
metal industry, employment in the other four labour-intensive industries is sharply decreasing, given the increas-
ing competition with low-wage countries in Asia, especially in the textile and clothing industry. Although a
stronger focus on innovation-based industrial development should be expected, the regional R&D expenditures
are still significantly below average. Private R&D expenditures in particular are very low as compared to the
Italian average. Overall, the regional innovation system in Apulia is not as strongly developed as in other Italian
regions. However, in recent years, innovation strategies and cluster initiatives focusing on high-tech industries
have tried to strengthen these industries within the region. The current regional growth strategy for the EU fund-
ing period 2014-2020 follows this attempt.
Regarding the locational requirements for the current industries currently featuring high trade specialisation in
Apulia, the low R&D efforts are typical not only for being a less developed region but also compared to regions
with higher income levels and similar specialisation. As the econometric results show, HERD and BERD are
rather below average in these locations (Table 4.4). In contrast to that, innovation participation by SME is a more
important factor, especially in the low-technology industries. However, compared to other less developed re-
gions, Apulia is rather disadvantaged with respect to population density and clustering structures. The only bene-
ficial but not sustainable characteristic that is correlated with higher trade specialisation in these industries is the
low-income level, i.e. the cost advantage. The strategy of an SME-based diversification as suggested by smart
specialisation suggests is probably the most promising approach.
51
Table 4.4. Stylised industry-specific regression results for Apulia
Full sample
Less developed regions
Note: * p<0.1, ** p<0.05, *** p<0.01. Manufacture of food products and beverages (15), Manufacture of textiles (17),
Tanning and dressing of leather; manufacture of luggage, handbags, saddlery, harness and footwear (19), Manufacture of
fabricated metal products, except machinery and equipment (28), Manufacture of furniture; manufacturing n.e.c. (36). Con-
trol variables for bordering and seaside location. Source: own calculations.
4.2.2. Berkshire, Buckinghamshire, Oxfordshire
Regional Background Information
The region Berkshire, Buckinghamshire and Oxfordshire is located in the south-east of the United Kingdom,
covering an area of 5,741 km2 (2.3 % of the UK). The regional population amounts to 2.26 million. inhabitants,
representing 3.6 % of the British population. With a population density of 395 inhabitants per km2, the region is
one of the most densely populated areas of the UK and characterised by many London commuter towns of in-
termediate size. The centres of the region are the university cities Oxford in Oxfordshire and Milton Keynes in
Buckinghamshire. The proximity to the capital London is of high economic importance for the region.
RXA (gross exports) 15 17 19 36 28 29
(log) patent intensity 2.646 6.402 27.153 -1.293 -0.969 -0.066
(log) techn. innov., SMEs 25.315 * 27.861 ** -25.277 9.994 26.216 *** 8.621
(log) non-techn. innov, SMEs -8.331 7.527 19.697 0.921 4.218 -17.662 *
tertiary educ. < 35 yrs. 0.039 -1.103 *** 0.308 -0.585 * -0.757 *** -0.287
(log) HERD 3.133 1.525 -7.710 -3.924 * 4.851 *** 8.140 *
(log) BERD -3.766 ** -9.059 *** 5.711 -10.238 *** -2.619 * 0.039
GDP per capita 0.000 -0.001 ** -0.006 *** -0.001 * 0.000 0.000
(log) population density -2.618 12.071 ** -0.596 -0.107 -2.243 -9.884 **
cluster 6.954 41.453 *** 138.388 *** 46.526 *** 21.990 *** 32.625 ***
business services -25.296 *** -5.542 0.804 6.995 -18.363 *** 3.823
ERDF innovation -0.579 *** 0.281 0.683 0.280 -0.073 0.655 ***
(log) quality of governm. 12.846 * -28.937 *** -34.600 ** -9.742 -7.611 * -2.210
accessibility index -0.174 -0.077 0.893 * 0.179 -0.275 ** 0.375 *
R2_within 0.003 0.065 0.026 0.049 0.033 0.018
R2_between 0.289 0.407 0.299 0.182 0.424 0.336
R2_overall 0.235 0.352 0.240 0.194 0.386 0.263
No. of observations 2,800 2,800 2,763 2,800 2,800 2,800
No. of clusters 250 250 250 250 250 250
sf1 / p15 sf1 / p17 sf1 / p19 sf1 / p36 sf1 / p28 sf1 / p29 sf1 / p30
(log) patent intensity -25.253 * 1.399 252.980 -31.010 *** -7.496 -6.529
(log) techn. innov., SMEs 50.099 *** 41.239 *** -19.350 -1.353 31.182 -1.394
(log) non-techn. innov, SMEs -44.281 *** -15.798 -11.298 4.307 -1.842 -16.861
tertiary educ. < 35 yrs. 0.495 -0.931 -1.739 -0.851 -1.019 -0.613
(log) HERD 5.812 ** 5.926 -7.463 -2.687 5.369 1.526
(log) BERD -4.480 * -12.390 *** -9.180 -9.218 *** -2.858 6.562 *
GDP per capita -0.001 -0.005 *** -0.008 *** -0.005 *** 0.000 0.003
(log) population density -38.369 * 8.845 86.210 *** 56.048 *** -4.532 27.259 *
cluster 6.716 29.797 *** 122.296 *** 100.568 *** 25.840 9.906
business services -3.478 -31.208 95.635 91.302 ** -27.704 27.412
ERDF innovation 1.474 1.643 ** 1.566 -1.074 -0.764 1.774 ***
(log) quality of governm. -5.615 -43.495 *** -24.352 29.491 *** 0.124 -8.348
accessibility index -0.605 -0.320 -0.634 -0.437 0.335 -0.677 **
R2_within 0.037 0.298 0.126 0.310 0.085 0.037
R2_between 0.533 0.537 0.698 0.519 0.534 0.454
R2_overall 0.488 0.483 0.570 0.468 0.468 0.351
No. of observations 674 674 673 674 674 674
No. of clusters 60 60 60 60 60 60
52
In 2011 the region generated a GDP of 35,900 PPS13
per capita which is 36 % higher than the national average
and 43 % higher than the EU-28 average. The region is therefore classified as an advanced region in funding
period 2014–2020 (EC/49/2014). The formerly manufacturing-based economy has been transformed into an
economy that relies to a large extent on knowledge-intensive services and high-tech manufacturing. The innova-
tion induced by the major higher education institutions can be regarded as a key feature of the regional competi-
tiveness.
The comparatively good economic performance of the region is also reflected by the regional employment fig-
ures. The unemployment rate in South-East UK is consistently lower than the national average. However, fol-
lowing the onset of the financial crisis, unemployment increased from 4.1 % in 2008 to 5.2 % in 2011 in Oxford-
shire, Buckinghamshire and Berkshire and from 5.6 % to 8.0 % during the same period in the UK. Thus the
region has a lower unemployment rate than the country average, but follows a similar trend of rising unemploy-
ment since 2008. Compared to its neighbouring regions, there is, however, significant variance in economic
indicators within the larger (NUTS 1) region of South-East England (UKJ). The above-average employment and
GDP figures can partly be attributed to the positive effect of London in the vicinity. Many people are not em-
ployed in Oxfordshire, Berkshire or Buckinghamshire but in London and commute to the capital for work. Prox-
imity to business partners in London is also an important location factor for firms.
Selected Industries
International Trade
To identify above-average competitive industries, export levels and Revealed Comparative Advantages (RCAs)
are taken into consideration. According to these selection criteria, the region of Oxfordshire, Berkshire and
Buckinghamshire is specialised in three high-tech industries, namely manufacture of chemicals and chemical
products (NACE Rev. 1.1: 24), manufacture of office machinery and computers (30) and the manufacture of
medical, precision and optical instruments (33). As Figure 4.2 depicts, in terms of export shares, the chemical
industry is of particularly high importance for the region, since the export share of chemical exports amounts to
30.3 % of the total manufacturing exports of the region exceeding the national average by 8 percentage points.
The RCA indicates whether a region holds a comparative advantage (positive RCA) or disadvantage (negative
RCA) in a certain industry. Its values are positive in both the chemical industry and the manufacture of medical,
precision and optical instruments. In the chemical industry, the RCA has increased from 49 in 2000 to 81 in
2011, indicating further progress of the region’s comparative advantage in this industry. The regional RCA ex-
ceeds the values of the UK and the EU in the chemical industry. In contrast to the RCA, the RXA (Revealed
Export Advantage) indicates whether the significance of an industry in a certain region’s total manufacturing
exports is higher or lower compared to global manufacturing exports. The RXA indicator exhibits values for the
chemical industry in Berkshire, Buckinghamshire and Oxfordshire similar to those of the RCA. As will be out-
lined below, the main drivers of the strong trade performance of the regional chemical industry are pharmaceuti-
cal companies.
The production of medical, precision and optical instruments accounts for 8.7 % of total manufacturing exports
of the region and is, thus, above the national average. The industry yields high positive RCAs in the region and
lower positive RCAs at the country level. This indicates, that Berkshire, Buckinghamshire and Oxfordshire hold
a higher comparative advantage in this industry than the UK does on average. As it is the case in the chemical
industry, the RXA and RCA show similar values in this region. This correlation suggests that the chemical in-
dustry has a high share of pharmaceutical companies in the region that cooperate with companies in the business
for medical instruments. Accordingly, the performance of the two sectors in trade seems to be interrelated, at
least to some extent.
The third industry with above-average trade specialisation is the manufacture of office machinery and com-
puters. As Figure 4.2 depicts, the export share of this industry is significantly lower than in the other two indus-
tries. The low share of employees working in the industry underlines the comparatively lower importance of the
industry for the region. When looking at the trade specialisation indicators (Figure 4.2), it becomes evident that
the industry yielded negative RCA and RXA values in the region for 2011. A similar negative trend is observed
13 Purchasing power standards (PPS) are purchasing power parities (PPP) defined by Eurostat. PPS is a fictive currency that reflects the weighted average of the purchasing power of the national currencies of the EU Member States. The real exchange rate of the PPS there-
fore is approximately 1.
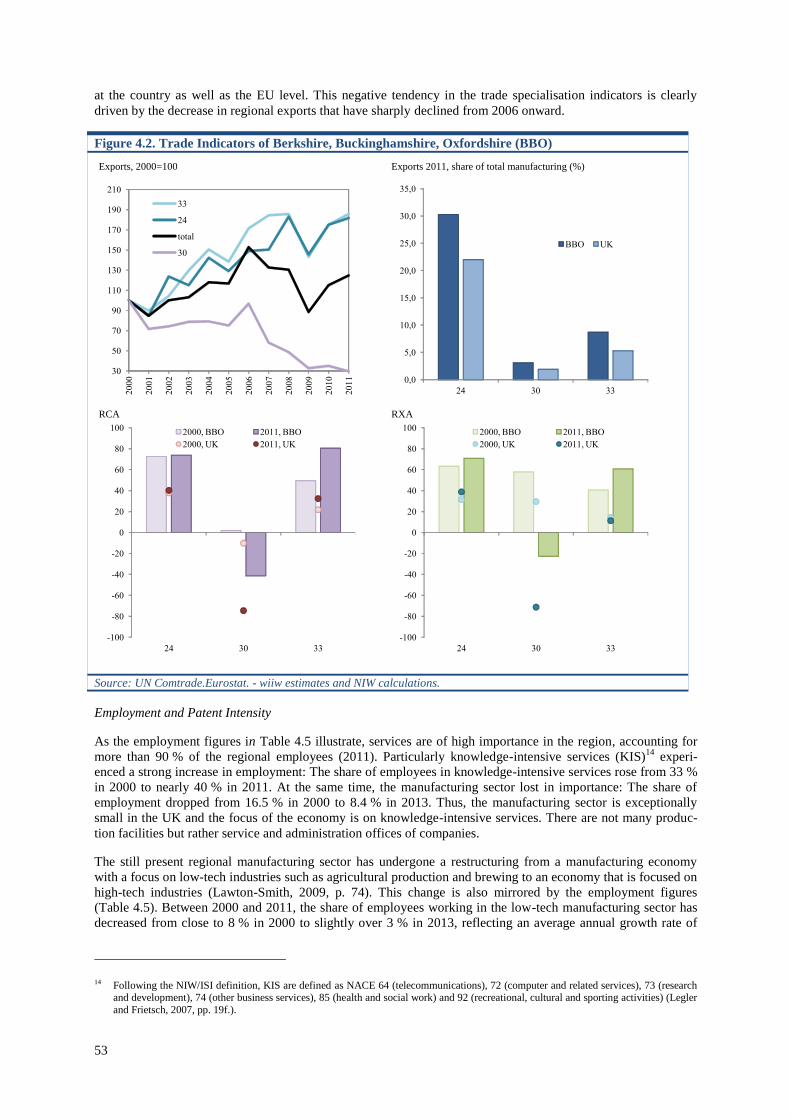
53
at the country as well as the EU level. This negative tendency in the trade specialisation indicators is clearly
driven by the decrease in regional exports that have sharply declined from 2006 onward.
Figure 4.2. Trade Indicators of Berkshire, Buckinghamshire, Oxfordshire (BBO)
Source: UN Comtrade.Eurostat. - wiiw estimates and NIW calculations.
Employment and Patent Intensity
As the employment figures in Table 4.5 illustrate, services are of high importance in the region, accounting for
more than 90 % of the regional employees (2011). Particularly knowledge-intensive services (KIS)14
experi-
enced a strong increase in employment: The share of employees in knowledge-intensive services rose from 33 %
in 2000 to nearly 40 % in 2011. At the same time, the manufacturing sector lost in importance: The share of
employment dropped from 16.5 % in 2000 to 8.4 % in 2013. Thus, the manufacturing sector is exceptionally
small in the UK and the focus of the economy is on knowledge-intensive services. There are not many produc-
tion facilities but rather service and administration offices of companies.
The still present regional manufacturing sector has undergone a restructuring from a manufacturing economy
with a focus on low-tech industries such as agricultural production and brewing to an economy that is focused on
high-tech industries (Lawton-Smith, 2009, p. 74). This change is also mirrored by the employment figures
(Table 4.5). Between 2000 and 2011, the share of employees working in the low-tech manufacturing sector has
decreased from close to 8 % in 2000 to slightly over 3 % in 2013, reflecting an average annual growth rate of
14 Following the NIW/ISI definition, KIS are defined as NACE 64 (telecommunications), 72 (computer and related services), 73 (research and development), 74 (other business services), 85 (health and social work) and 92 (recreational, cultural and sporting activities) (Legler
and Frietsch, 2007, pp. 19f.).
Exports, 2000=100 Exports 2011, share of total manufacturing (%)
RCA RXA
30
50
70
90
110
130
150
170
190
210
20
00
20
01
20
02
20
03
20
04
20
05
20
06
20
07
20
08
20
09
20
10
20
11
33
24
total
30
0,0
5,0
10,0
15,0
20,0
25,0
30,0
35,0
24 30 33
BBO UK
-100
-80
-60
-40
-20
0
20
40
60
80
100
24 30 33
2000, BBO 2011, BBO
2000, UK 2011, UK
-100
-80
-60
-40
-20
0
20
40
60
80
100
24 30 33
2000, BBO 2011, BBO
2000, UK 2011, UK
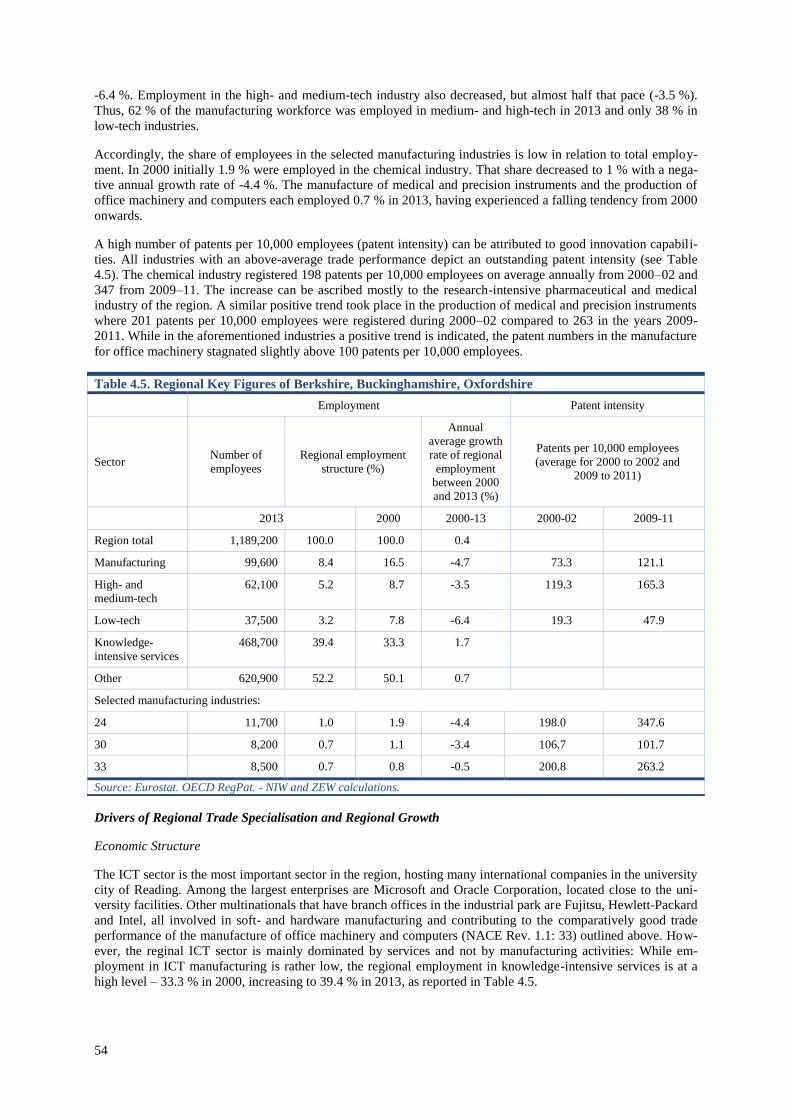
54
-6.4 %. Employment in the high- and medium-tech industry also decreased, but almost half that pace (-3.5 %).
Thus, 62 % of the manufacturing workforce was employed in medium- and high-tech in 2013 and only 38 % in
low-tech industries.
Accordingly, the share of employees in the selected manufacturing industries is low in relation to total employ-
ment. In 2000 initially 1.9 % were employed in the chemical industry. That share decreased to 1 % with a nega-
tive annual growth rate of -4.4 %. The manufacture of medical and precision instruments and the production of
office machinery and computers each employed 0.7 % in 2013, having experienced a falling tendency from 2000
onwards.
A high number of patents per 10,000 employees (patent intensity) can be attributed to good innovation capabili-
ties. All industries with an above-average trade performance depict an outstanding patent intensity (see Table
4.5). The chemical industry registered 198 patents per 10,000 employees on average annually from 2000–02 and
347 from 2009–11. The increase can be ascribed mostly to the research-intensive pharmaceutical and medical
industry of the region. A similar positive trend took place in the production of medical and precision instruments
where 201 patents per 10,000 employees were registered during 2000–02 compared to 263 in the years 2009-
2011. While in the aforementioned industries a positive trend is indicated, the patent numbers in the manufacture
for office machinery stagnated slightly above 100 patents per 10,000 employees.
Table 4.5. Regional Key Figures of Berkshire, Buckinghamshire, Oxfordshire
Employment Patent intensity
Sector Number of
employees
Regional employment
structure (%)
Annual
average growth
rate of regional
employment
between 2000
and 2013 (%)
Patents per 10,000 employees
(average for 2000 to 2002 and
2009 to 2011)
2013 2000 2000-13 2000-02 2009-11
Region total 1,189,200 100.0 100.0 0.4
Manufacturing 99,600 8.4 16.5 -4.7 73.3 121.1
High- and
medium-tech
62,100 5.2 8.7 -3.5 119.3 165.3
Low-tech 37,500 3.2 7.8 -6.4 19.3 47.9
Knowledge-
intensive services
468,700 39.4 33.3 1.7
Other 620,900 52.2 50.1 0.7
Selected manufacturing industries:
24 11,700 1.0 1.9 -4.4 198.0 347.6
30 8,200 0.7 1.1 -3.4 106.7 101.7
33 8,500 0.7 0.8 -0.5 200.8 263.2
Source: Eurostat. OECD RegPat. - NIW and ZEW calculations.
Drivers of Regional Trade Specialisation and Regional Growth
Economic Structure
The ICT sector is the most important sector in the region, hosting many international companies in the university
city of Reading. Among the largest enterprises are Microsoft and Oracle Corporation, located close to the uni-
versity facilities. Other multinationals that have branch offices in the industrial park are Fujitsu, Hewlett-Packard
and Intel, all involved in soft- and hardware manufacturing and contributing to the comparatively good trade
performance of the manufacture of office machinery and computers (NACE Rev. 1.1: 33) outlined above. How-
ever, the reginal ICT sector is mainly dominated by services and not by manufacturing activities: While em-
ployment in ICT manufacturing is rather low, the regional employment in knowledge-intensive services is at a
high level – 33.3 % in 2000, increasing to 39.4 % in 2013, as reported in Table 4.5.
55
The Slough industrial area also hosts some major IT companies such as the headquarters of the telecommunica-
tions and internet services provider O2 and offices of Blackberry, Amazon, HTC and others. The Slough indus-
trial park is an important business centre of South-East UK but is lacking the innovation and research intensity
which could be expected from the potential deriving from the endowment with higher education institutions.
Furthermore, Bracknell is host to a number of electro-technical and IT firms such as Panasonic, Fujitsu, Dell, HP
and Siemens.
Due to the outstanding reputation of Oxford University for life sciences many biotechnology companies are
located in the BBO region. Although the biotech industry is smaller than the regional ICT sector, it is still sig-
nificant for innovation and foreign trade. As outlined above, the regional chemical industry is a major driver of
the region’s favourable trade performance. Large chemical and pharmaceutical companies such as Honeywell
are located in the region. Also Bayer, one of the large multinational pharmaceutical companies, maintains head-
quarters in Newbury. Furthermore, a number of smaller, highly innovative biotechnological firms such as Oxford
Glycosciences, active in drug discovery, and PowderJect, which conducts research in vaccines and immuno-
therapeutics, are located in the region.
In terms of infrastructure, two international airports in the direct proximity and national highways are important
location factors for international businesses. Thus, several agglomerations of companies are situated in Berk-
shire, Buckinghamshire and Oxfordshire along the highways that are crossing the area. The M4 corridor com-
prises the cities along the highway stretching from London to South Wales which are both host to numerous
high-tech companies. The strong spatial concentration promotes the firms international competitiveness due to
knowledge spillover effects and cooperation within the clusters. Many business clusters are closely connected to
the local universities. Major industrial parks are found in Reading, Slough, Bracknell and Newbury.
Regional Innovation System
The regional knowledge base is largely characterised by major educational institutions such as the University of
Oxford, Oxford Brooks University, the University of Reading and the University of Surrey. The public research
activity is high due to a number of specialised research institutes that provide leading basic research. Further-
more, a growing number of spin-off companies utilise the knowledge created in and by the universities (Lawton-
Smith 2009, pp. 81f).
Given the large number of universities and innovating firms located in the region, the regional innovation system
of Berkshire, Buckinghamshire and Oxfordshire is quite strong. The volume of regional R&D expenditures is
higher than in most other British regions. The regional R&D spending in 2011 summed up to EUR 3.09 billion,
to which businesses contributed 57 %, universities 28 %, private organisations 0.18 % and governmental institu-
tions 13 %. Non-profit organisations thus contribute more substantially to the funding of innovation in the region
than in other English and European regions, although it is not much in relation to total spending. Even on this
high level of R&D activities a rising tendency is indicated. Only London (UJI1) excelled BBO in R&D expendi-
tures with a total of EUR 3.34 billion in 2011. The high R&D spending is also reflected in the regional patent
activity, as indicated in Table 4.5.
The two most prestigious universities located in the region are the University of Oxford and Oxford Brooks
University which together educated over 44,000 students in 2011/12. Around a fourth of all students were en-
rolled in STEM (Science, Technology, Engineering, and Mathematics) or other medical-related fields of study
thus also meeting local labour demand. ISIS Innovation is a subsidiary of the University of Oxford whose objec-
tive is to manage technology transfer in order to make new knowledge of the university available for business
applications. Science Vale Enterprise Zone UK in Southern Oxfordshire contains a concentration of leading
science and innovation enterprises focusing on advanced manufacturing and engineering, energy, ICT and phar-
maceuticals. 13 % of R&D employment in the South-East-UK and 4 % of the R&D employment in England is
located in the Science Vale area.
The University of Reading also hosts institutions and businesses directly on its campus, such as the Science
Technology Centre, which fosters and accommodates start-up companies or the Reading Enterprise Hub which is
a business incubator for high-tech firms with a focus on environmental technology, IT and life sciences.
One of the most important public research facilities is the Rutherford Appleton Laboratory, a facility for physics,
space and astronomy research that is operated by the Science Technology Facilities Council. It employs over
10,000 scientists and engineers and 1,200 staff members. The UK Atomic Energy Authority is an organisation
that researches and develops nuclear fusion power as an alternative to the traditional fission power. It operates
the Culham Centre for Fusion Energy at the Culham Science Centre in Oxfordshire. In 2009, the European Space
Agency (ESA) opened The European Centre for Space Applications and Telecommunication at the Harwell
56
campus. It researches topics related to telecommunication, integrated applications and space technology. The
opening of the facility mirrors the growing importance of the space industry in the UK. According to the ESA,
approximately 70 % of the products are exported and thus they also have a bearing on the ICT sector.
The knowledge base in Berkshire, Buckinghamshire but especially in Oxfordshire is thus not only outstanding in
the UK but also comprises a number of institutions that are innovation leaders worldwide. SME spin-offs are
crucial to apply the basic research mostly in the field of life sciences and IT and commercialise new knowledge.
Political Context and Regional Growth Strategies
The history of economic policy-making in the UK has been unsteady during the last decades. Both regional and
local approaches were subject to frequent reforms (Pike et al., 2015, p. 6). Regional Development Agencies
(RDAs) were established in 1998 with a growing focus on innovation policies over time. They intended to sup-
port the knowledge transfer between businesses and collaboration between research and companies. Also, they
aimed to foster clusters and science parks as well as investment in R&D infrastructure. The South East England
Development Agency aimed to increase the accessibility of new knowledge created in the educational institu-
tions for the local businesses (Lawton-Smith, 2009, pp. 87ff).
Based on increasing criticism of regional centralism, bureaucracy, mismatch with functional economic areas and
overly broad aims, the RDAs, which had previously been responsible for the development policies at NUTS 1
level, were abandoned in 2012 (Pike et al., 2015, p. 6). This resulted in a shift in the approach of policy-making
towards more local and varied strategies for growth and innovation. In most English regions including the south-
east there is not one single agency anymore. Innovation strategies and measures are delegated to local authori-
ties, e.g. city councils and other institutions at NUTS 3 level, or to Local Enterprise Partnerships (LEPs). LEPs
are business-led private-public partnerships that seek to facilitate growth and job creation. The board of an LEP
is typically constituted of local business actors, public sector leaders and members of the local university (Euro-
pean Commission, 2015b). There are three LEPs relevant for the region of Berkshire, Buckinghamshire and
Oxfordshire, namely the LEP ‘Oxfordshire’, the LEP ‘Buckinghamshire Thames Valley’ and the LEP ‘Thames
Valley Berkshire’.
Because of the restructuring from RDAs to LEPs, the LEP policies faced some initial technical problems. The
LEPs intend to provide a network for the exchange of information about their respective economic policies and
related issues. They thus link public administration and businesses. The LEPs will also be responsible for the
implementation of most of the programmes of the EU structural funds in the period 2014–2020, so consequently
the LEP policies will comprise innovation strategies in the future. The bulk of the funding of the LEPs comes
from the ERDF and the ESF. The priorities of the operational programme in 2007–2013 were to promote the
competitiveness of the region by knowledge transfer and a sustainable development in terms of reducing the
ecological footprint. The total means comprised EUR 47.4 million of EU investments and national contributions.
The policies of the LEPs are to improve infrastructure, e.g. the availability of broadband access in rural areas,
and to promote investment in the local companies. The LEP area ‘Thames Valley Berkshire’ has the highest per-
capita GVA of all LEP areas in the UK (Pike et al., 2015, p. 8). Currently there is a trend for LEPs to take over
tasks and funding of public institutions, thus problems with eligibility and legitimacy of private actors in the LEP
administering public funds may arise.
The Oxford Trust has the objective of supporting start-up companies and scaling up new enterprises. It also in-
tends to facilitate the communication between technology firms and the local and regional government as well as
providing public relations to the local businesses (such as Oxford Science). The Oxfordshire County Council
pursues an Economic Development Strategy that comprises the promotion of knowledge-intensive industries,
research activities and lifelong learning. Among other agencies relevant for the region is, for instance, the Ox-
fordshire Economic Partnership, which seeks to form a network of informal institutions as does, e.g., the Oxford
Trust.
After the RDAs had been abolished, innovation support measures were assigned to national institutions, e.g. the
Technology Strategy Boards. One policy of the agency is the Small Business Research Initiative, which has the
objective of improving the cooperation of innovative SMEs with the public sector. Thus a shift of innovation
policies from the regional to the national level took place while growth strategies were transferred to the local
level, namely LEPs. The reform towards the LEPs was motivated by the idea of administering policies in func-
tional economic areas rather than arbitrarily allocated RDA areas. However, the effectiveness of the LEPs is still
to be proven and the success will crucially depend on the transformation to legally accountable organisations.
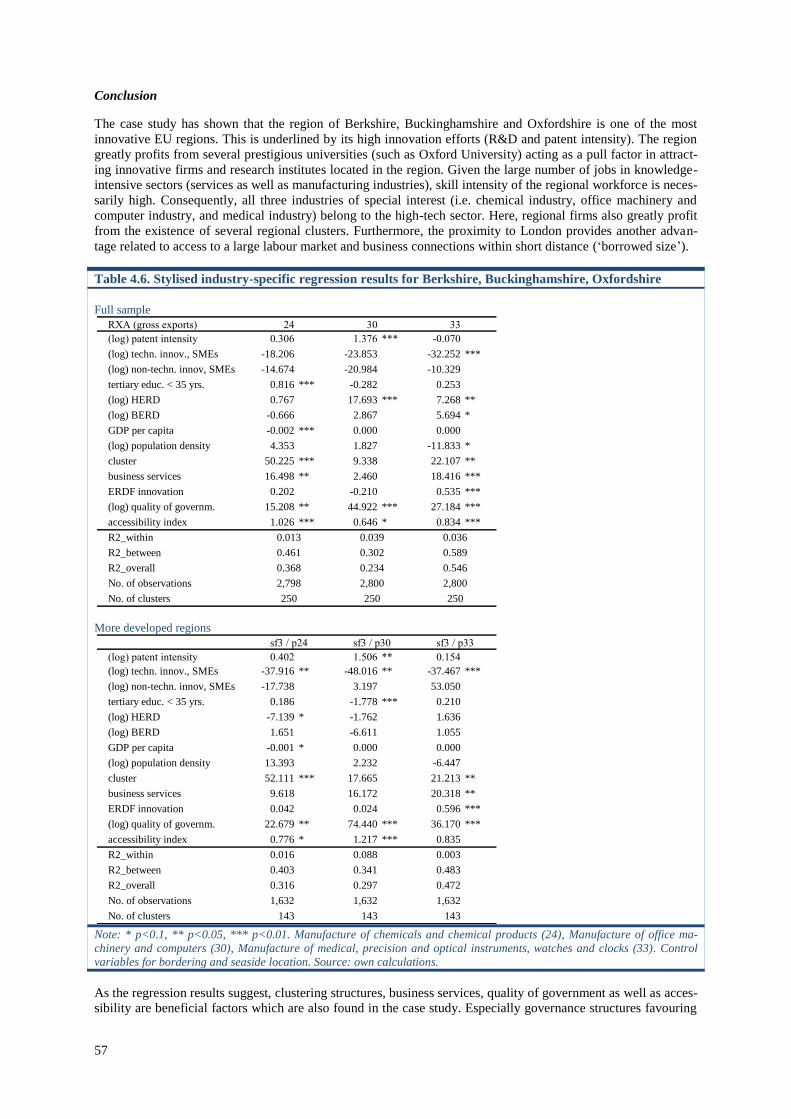
57
Conclusion
The case study has shown that the region of Berkshire, Buckinghamshire and Oxfordshire is one of the most
innovative EU regions. This is underlined by its high innovation efforts (R&D and patent intensity). The region
greatly profits from several prestigious universities (such as Oxford University) acting as a pull factor in attract-
ing innovative firms and research institutes located in the region. Given the large number of jobs in knowledge-
intensive sectors (services as well as manufacturing industries), skill intensity of the regional workforce is neces-
sarily high. Consequently, all three industries of special interest (i.e. chemical industry, office machinery and
computer industry, and medical industry) belong to the high-tech sector. Here, regional firms also greatly profit
from the existence of several regional clusters. Furthermore, the proximity to London provides another advan-
tage related to access to a large labour market and business connections within short distance (‘borrowed size’).
Table 4.6. Stylised industry-specific regression results for Berkshire, Buckinghamshire, Oxfordshire
Full sample
More developed regions
Note: * p<0.1, ** p<0.05, *** p<0.01. Manufacture of chemicals and chemical products (24), Manufacture of office ma-
chinery and computers (30), Manufacture of medical, precision and optical instruments, watches and clocks (33). Control
variables for bordering and seaside location. Source: own calculations.
As the regression results suggest, clustering structures, business services, quality of government as well as acces-
sibility are beneficial factors which are also found in the case study. Especially governance structures favouring
RXA (gross exports) 24 30 33
(log) patent intensity 0.306 1.376 *** -0.070
(log) techn. innov., SMEs -18.206 -23.853 -32.252 ***
(log) non-techn. innov, SMEs -14.674 -20.984 -10.329
tertiary educ. < 35 yrs. 0.816 *** -0.282 0.253
(log) HERD 0.767 17.693 *** 7.268 **
(log) BERD -0.666 2.867 5.694 *
GDP per capita -0.002 *** 0.000 0.000
(log) population density 4.353 1.827 -11.833 *
cluster 50.225 *** 9.338 22.107 **
business services 16.498 ** 2.460 18.416 ***
ERDF innovation 0.202 -0.210 0.535 ***
(log) quality of governm. 15.208 ** 44.922 *** 27.184 ***
accessibility index 1.026 *** 0.646 * 0.834 ***
R2_within 0.013 0.039 0.036
R2_between 0.461 0.302 0.589
R2_overall 0.368 0.234 0.546
No. of observations 2,798 2,800 2,800
No. of clusters 250 250 250
sf3 / p24 sf3 / p30 sf3 / p33 sf3 / p34
(log) patent intensity 0.402 1.506 ** 0.154
(log) techn. innov., SMEs -37.916 ** -48.016 ** -37.467 ***
(log) non-techn. innov, SMEs -17.738 3.197 53.050
tertiary educ. < 35 yrs. 0.186 -1.778 *** 0.210
(log) HERD -7.139 * -1.762 1.636
(log) BERD 1.651 -6.611 1.055
GDP per capita -0.001 * 0.000 0.000
(log) population density 13.393 2.232 -6.447
cluster 52.111 *** 17.665 21.213 **
business services 9.618 16.172 20.318 **
ERDF innovation 0.042 0.024 0.596 ***
(log) quality of governm. 22.679 ** 74.440 *** 36.170 ***
accessibility index 0.776 * 1.217 *** 0.835
R2_within 0.016 0.088 0.003
R2_between 0.403 0.341 0.483
R2_overall 0.316 0.297 0.472
No. of observations 1,632 1,632 1,632
No. of clusters 143 143 143
58
regional innovation policy proved to be relevant although this variable (ERDF innovation) has been found to
exhibit a significant effect only for the manufacture of medical, precision and optical instruments, watches and
clocks (33). Furthermore, innovative activities of SMEs are of minor importance. In accordance with the case
study, but with the exception of the manufacture of chemicals and chemical products (24), R&D efforts in uni-
versities are also of a certain relevance. However, the manufacture of chemicals and chemical products (24)
relies at least on the universities’ functions as indicated by the significance of tertiary educated indicates.
Thus, the case study emphasises the distinguishing role of strong universities compared to other economic and
innovation-oriented characteristics. However, these regional characteristics might be substituted by the availabil-
ity of short distance to London (‘borrowed size’).
4.2.3. Castile–La Mancha
Regional Background Information
Castile–La Mancha is the third largest Spanish region (after Castile y León and Andalusia). It is located in the
centre of Spain, partly surrounding the capital of Madrid. Its size adds up to an area of nearly 80,000 km², repre-
senting almost 16 % of the Spanish total territory. Despite its size, Castile–La Mancha is only the ninth most
populous region, accounting for only 4.4 % of Spain's population. Hence, it is one of the sparsely populated
Spanish regions with an average population density of 25.7 inhabitants per km² (compared to the Spanish aver-
age of 93.4 inhabitants per km², as of 2014). The region’s largest and most populous city is Albacete with
172,500 inhabitants, while Toledo (83,300 inhabitants), located approximately 65 km south of Madrid, is the
regional capital. Given its low population density and the lack of any major city with more than 300,000 inhabi-
tants, the region is classified as a rural region according to the regional classification of the German Institute for
Urban and Regional Development (BBRS). In the years 2008-2012 the region's population increased by 3.9 %,
which is above the 2.4 % national average. The registered foreign population is 236,049 people, or 11.1 % of the
total population (Eures, 2014). In 2012, the regional GDP amounted to EUR 17,698 per capita, which equals
77 % of both the national and the EU average. Correspondingly, Castile–La Mancha belongs to the transition
regions in the funding period 2014-2020 (EC/2014/99/EU). In 2012, the highest contribution to the regional
GDP was made by the public sector accounting for 20 % of GDP, despite the estimated 8.0 % decline compared
to 2011. The other most important sectors are trade, transportation, restaurants and hotels with 18 % and the
manufacturing industry with 14 %. (European Commission, 2015c).
The economy of Castile–La Mancha is dominated by agriculture, especially the raising of livestock, while the
manufacturing industry is traditionally underdeveloped (Vegas et al., 2003). However, since the accession of
Spain to the EU in 1986, the region has shown progress and its industrial sector has been growing at a faster pace
than the national average (European Commission, 2015). In recent years, tourism has become increasingly im-
portant for the region, in the form of agro-tourism in particular. Despite the fact that some important companies
have lately established in the region, Castile–La Mancha still faces some disadvantages, mainly due to its low
population density, a shortage of qualified workers, and a lack of any industrial networks resulting from the fact
that firms are scattered across a large geographic area (European Commission, 2015b). Furthermore, the regional
unemployment rate is still very high. In 2012, the regional unemployment rate was 29.5 %, and thus even higher
than the national average (26 %) (Eures, 2014).
The regional business structure is dominated by SMEs and family businesses. 96 % of regional firms operating
in the industrial sector have less than 10 employees. The region’s business network consists mainly of SMEs and
traditional enterprises with a less established R&D tradition (European Commission, 2015). Hence, private R&D
investments are very low in the region. In terms of higher education, the University of Castile–La Mancha
(UCLM) is the region’s largest public university. It is divided into four centres spread across the whole region.
Selected Industries
International Trade
Even though the region has traditionally hosted only few industrial production sites, it nevertheless reveals an
above-average trade performance in three predominantly low-technology manufacturing industries when taking
the group of transition regions (GDP 75 % and 90 % of the EU average) as a reference group. The industries in
which Castile–La Mancha shows an exceptional trade performance among the group of transition regions in-
clude manufacturing of wearing apparel, dressing and dyeing (NACE Rev. 1.1: 18), manufacturing and dressing
of leather (19), and manufacturing of other non-metallic mineral products (26) (Figure 4.3).
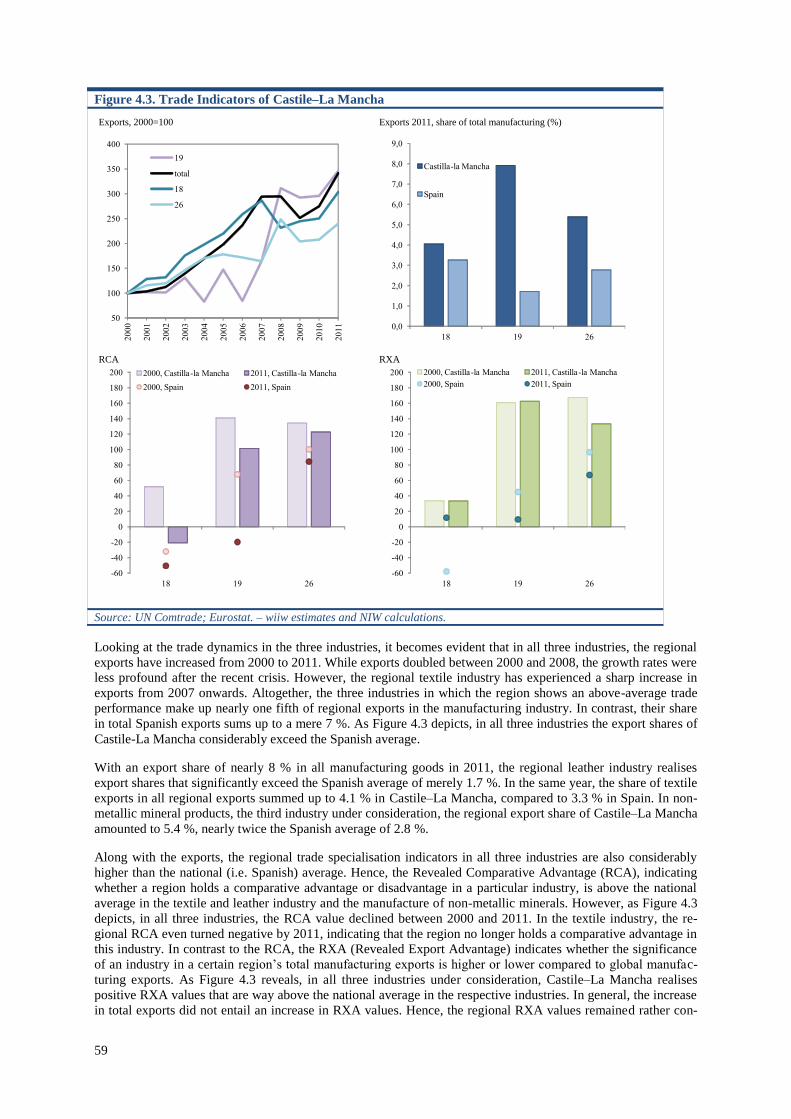
59
Figure 4.3. Trade Indicators of Castile–La Mancha
Source: UN Comtrade; Eurostat. – wiiw estimates and NIW calculations.
Looking at the trade dynamics in the three industries, it becomes evident that in all three industries, the regional
exports have increased from 2000 to 2011. While exports doubled between 2000 and 2008, the growth rates were
less profound after the recent crisis. However, the regional textile industry has experienced a sharp increase in
exports from 2007 onwards. Altogether, the three industries in which the region shows an above-average trade
performance make up nearly one fifth of regional exports in the manufacturing industry. In contrast, their share
in total Spanish exports sums up to a mere 7 %. As Figure 4.3 depicts, in all three industries the export shares of
Castile-La Mancha considerably exceed the Spanish average.
With an export share of nearly 8 % in all manufacturing goods in 2011, the regional leather industry realises
export shares that significantly exceed the Spanish average of merely 1.7 %. In the same year, the share of textile
exports in all regional exports summed up to 4.1 % in Castile–La Mancha, compared to 3.3 % in Spain. In non-
metallic mineral products, the third industry under consideration, the regional export share of Castile–La Mancha
amounted to 5.4 %, nearly twice the Spanish average of 2.8 %.
Along with the exports, the regional trade specialisation indicators in all three industries are also considerably
higher than the national (i.e. Spanish) average. Hence, the Revealed Comparative Advantage (RCA), indicating
whether a region holds a comparative advantage or disadvantage in a particular industry, is above the national
average in the textile and leather industry and the manufacture of non-metallic minerals. However, as Figure 4.3
depicts, in all three industries, the RCA value declined between 2000 and 2011. In the textile industry, the re-
gional RCA even turned negative by 2011, indicating that the region no longer holds a comparative advantage in
this industry. In contrast to the RCA, the RXA (Revealed Export Advantage) indicates whether the significance
of an industry in a certain region’s total manufacturing exports is higher or lower compared to global manufac-
turing exports. As Figure 4.3 reveals, in all three industries under consideration, Castile–La Mancha realises
positive RXA values that are way above the national average in the respective industries. In general, the increase
in total exports did not entail an increase in RXA values. Hence, the regional RXA values remained rather con-
Exports, 2000=100 Exports 2011, share of total manufacturing (%)
RCA RXA
50
100
150
200
250
300
350
400
20
00
20
01
20
02
20
03
20
04
20
05
20
06
20
07
20
08
20
09
20
10
20
11
19
total
18
26
0,0
1,0
2,0
3,0
4,0
5,0
6,0
7,0
8,0
9,0
18 19 26
Castilla-la Mancha
Spain
-60
-40
-20
0
20
40
60
80
100
120
140
160
180
200
18 19 26
2000, Castilla-la Mancha 2011, Castilla-la Mancha
2000, Spain 2011, Spain
-60
-40
-20
0
20
40
60
80
100
120
140
160
180
200
18 19 26
2000, Castilla-la Mancha 2011, Castilla-la Mancha
2000, Spain 2011, Spain
60
stant in both the textile and leather industries. In the manufacturing of other non-metallic mineral products, the
RXA slightly declined between 2000 and 2011.
Employment and Patent Intensity
Table 4.7 shows that the share of employment declined in both the textile and the leather industries. Especially
the former experienced a sharp decline. Hence, the employment share decreased from 2.8 % in 2000 to merely
0.5 % in 2011. In the leather industry, the decline was less pronounced and added up to a decrease by an average
of 1.5 % per year. Only in the manufacturing of other non-metallic mineral products did the regional employ-
ment share remain constant at 1.6 % in 2000 and 1.7 % in 2011. Summarising, the figures show a weak em-
ployment performance of the regional industry, even in the industries in which Castile–La Mancha holds a trade
specialisation.
In terms of regional innovativeness, it becomes evident that Castile–La Mancha is seriously lagging behind. The
number of patents in the regional manufacturing sector only sums up to an annual average of 0.04 patents per
10,000 employees (2009 to 2011). Looking only at high- and medium-tech industries, it was only slightly higher
(1.1 patents per 10,000 employees). With respect to the three industries with above-average trade specialisation
indicators, the figures in Table 4.7 show that the patent intensity increased in all three industries between the
years 2000 to 2011. However, with an annual average of 0.8 patents per 10,000 employees in the textile industry
and the leather industry, and 1.9 patents per 10,000 employees in the manufacturing of other non-metallic min-
eral products, the innovativeness of the three industries is clearly underdeveloped.
Table 4.7. Regional Key Figures of Castile–La Mancha
Employment Patent intensity
Sector Number of
employees
Regional employment
structure (%)
Annual
average growth
rate of regional
employment
between 2000
and 2013 (%)
Patents per 10,000 employees
(average for 2000 to 2002 and
2009 to 2011)
2013 2000 2000-13 2000-02 2009-11
Region total 715,800 100.0 100.0 1.2
Manufacturing 102,100 14.3 18.6 -0.9 1.2 4.4
High- and
medium-tech
16,006 2.3 2.2 1.4 5.2 19.5
Low-tech 85,500 11.9 16.4 -1.2 0.6 0.5
Knowledge-
intensive services
146,300 20.4 13.2 4.6
Other 467,400 65.3 68.2 0.9
Selected manufacturing industries:
18 3,700 0.5 2.8 -11.0 0.0 0.8
19 6,100 0.9 1.2 -1.5 0.0 0.8
26 11,200 1.6 1.7 0.5 0.7 1.9
Source: Eurostat. OECD RegPat. - NIW and ZEW calculations.
Drivers of Trade Specialisation and Regional Growth
Economic Structure
All three industries in which Castile–La Mancha reveals an above-average trade specialisation belong to the low-
tech industrial sector. Moreover, they all constitute traditionally strong regional industries. Embroidery, carpen-
try and work with leather belong to the common trades in the area. Most of them are very deeply rooted in the
towns of Castile–La Mancha. Fibres and leathers are involved in the most typical craftwork in Guadalajara and
the surroundings. Especially the towns of Azuqueca de Henares, Jadraque, Sigüenza and Brihuega host many
small workshops that are specialised in the design and production of clothes and leather works (TURÉSPANIA,
61
2015). Besides these small workshops, a number of larger firms operating in the clothing, shoes and leather in-
dustry are located in the region (e.g. Almansa Cuero Piel, Curtidos Requena, Pielcu SL) These larger firms are
more export-oriented than the smaller workshops that mainly produce for the local market (Curritidores Espa-
noles, 2015).
In the case of the manufacture of non-metallic mineral products, the region assumingly benefits from the re-
gional mineral deposits. Thus, the petro mine in Puertollano near Ciudad Real entailed the establishment of a
large petroleum refinery, which constitutes a major petrochemical centre in Spain (Rodriguez, 2014). Also the
mine in Almadén, producing mercury, led to a number of firms working in the manufacturing of other non-
metallic mineral products locating in the Castile–La Mancha. Furthermore, there are important deposits of iron in
Guadalajara, and kaolin in Cuenca, which further involved the location of firms operating in the manufacturing
of other non-metallic mineral products in the region (Rodriguez, 2014). Outside the province of Ciudad Real, the
regional industrial sector is, however, underdeveloped.
Besides the three industries outlined above, Castile–La Mancha also plays a major role in the Spanish agrifood
industry. Especially sectors such as wine, olive oil, vegetables, fresh and processed meat as well as cheese and
dairy products are important in the region (Vargas et al., 2011). In recent years, the bio-economy has played an
increasingly important role in the regional primary sector and renewable biological resources are now a core for
a new economy scheme (IPEX, 2015).
Given its central location within Spain and its proximity to the capital of Madrid, it is not surprising that trans-
port and logistics are important service industries within the region. Its central location and the fact that Castile–
La Mancha has the most kilometres of autopistas (a type of limited-access highway) and autovias (dual car-
riageways) of all Spanish regions makes it a preferred location for the logistics industry (IPEX, 2015). Alto-
gether, the regional infrastructure sums up to 2,790 road kilometres. The region greatly benefits from Spain’s
spider web structure transport network that positions Castile–La Mancha as a natural extension to metropolitan
Madrid. Four of the six motorways radiating from Madrid to the main sea ports pass through Castile–La Man-
cha. Furthermore the fact that Castile–La Mancha encloses much of the Madrid Region, the major consumer
centre in Spain, makes it a very interesting destination for distribution operators, logistics companies as well as
e-commerce logistic platforms at a more competitive price (IPEX, 2015).
Regional Innovation System
According to the Regional Innovation Scoreboard (RIS) 2014, Castile-La Mancha ranks as a moderate innovator
with an innovation performance below EU average. The comparatively weak innovation base is also visible
when looking at the regional R&D expenditures. In 2012, the share of R&D expenditures in Castile La Mancha
only represented 0.6 % of the regional GDP, which is less than half of the Spanish average (1.3 %). When look-
ing at the sources of R&D expenditures, 62.9 % of the regional R&D expenditure came from the private sector,
this is much higher than the national average, which amounted to 46.3 %. On the other hand, public R&D ex-
penditures are of lower importance. The public R&D expenditures have severely suffered from budget cuts im-
plemented during the recent economic crisis (European Commission, 2015c): The annual budget of Castile La
Mancha devoted to R&D decreased by 10 % in 2013. However, in 2014, there was again an increase of 11 % in
the R&D budget. Nevertheless, it is too early to judge the long-term impact of these changes on the R&D poli-
cies.
The main regional university is the University of Castile-La Mancha (UCLM), which is relatively young. It was
established in 1982, and consists of four centres spread across the whole region. Currently the UCLM has 30,043
students, among which 1,988 are enrolled in a postgraduates or PhD programme. 2,386 professors working in
115 research groups are employed at the UCLM. Those groups are very diverse and do not necessarily respond
to the needs of the local or regional economy. Yet, the UCLM also maintains a network of centres and institutes
in disciplines that are of special interest to the region, including clothing, wood, footwear, livestock, bio fuel or
hazardous waste. The centres are publically funded and undertake research activities in the respective industries
and, thereby, contribute to the regional development by transferring technology to companies and opening up the
possibilities for future graduates to enter the job market (Eures, 2014). Further regional institutions and organisa-
tions that foster knowledge exchange between science and businesses include the two regional Science and
Technology Parks in Albacete and Guadalajara, where universities, research institutions and businesses interact
and promote the creation and development of new businesses (European Commission, 2015c). CYTEMA (an
Energy and Environment Science and Technology Campus), which forms part of the University of Castile–La
Mancha is another regional institution that promotes research and knowledge transfer, especially in the fields of
energy and environmental industries (European Commission, 2015c). Furthermore, two independent research
institutes are located in the region: the National Centre for Hydrogen and Fuel Cell Technology Experimenta-
tion, and the Yebes Astronomical Observatory. They both are large facilities, dedicated to leading edge research
62
and technological development, as well as to promoting the exchange, transmission and preservation of knowl-
edge and technology (European Commission, 2015c).
Despite the two flagship research institutions located in the region, half of the regional employees working in the
field of R&D are employed at UCLM. 28.6 % work in the private sector, and 21.1 % in public administration.
The total number of workers engaged in R&D during 2012 in Castile La Mancha amounted to 7,607 persons,
representing 2.2 % of Spanish R&D workers. Still, the share of people working in the knowledge-intensive sec-
tor (KIS15
) significantly increased between 2000 and 2013. While in 2000, the share of employees in KIS was
only 13.2 %, by 2013, it achieved 20.4 % (Table 4.7). In the same period, the share of human resources allocated
to low-tech industries decreased from 16.4 % to 11.9 %. These results point towards an increase in the qualifica-
tion level of the regional human capital in Castile–La Mancha.
Yet Castile–La Mancha’s regional innovation system is still characterised by low R&D investment and low
innovation outputs, which has led the region to choose a strategy based on the creation of R&D Hot Spots, ac-
cording to geographical or industrial needs and capacities. However, as outlined above, the recent financial and
economic crisis has slowed down the implementation of some R&D strategies planned for these years.
Political Context and Regional Growth Policies
Given the comparatively underdeveloped regional innovation system, Castile–La Mancha has undertaken activi-
ties aimed at reinforcing the science, technology and industry system by defining a regional science and technol-
ogy policy. The priority of the regional government is to ensure that innovative business and research projects
benefit from public resources so that they can be performed in Castile–La Mancha and contribute towards its
economic and social progress. The EU structural funds are an important source for the region, given the national
austerity programmes implemented in Spain as a response to the recent crisis.
The regional programme for the EU funding period 2014-2010 identifies several priorities to achieve smart,
sustainable and inclusive growth and economic, social and territorial cohesion. The most important priorities are
the strengthening of research, technological development and innovation activities to create an environment
conducive to innovation and capable of attracting new investment and activity in the field of R&D. Given the
exceptionally high unemployment rate in the region, the ultimate goal is the creation of jobs. A further aspect
that is outlined in the programme is the enhancement of the access to, and the use and quality of information and
communication technologies by companies and public administrations in Castile–La Mancha in order to increase
the competitiveness of the economy, the participation of society and the efficiency of public administration. As a
third priority, the regional programme lists the increase in the competitiveness of small and medium-sized enter-
prises (SMEs), supporting their capacity to grow in regional, national and international markets, and to engage in
innovation processes.
Along with the regional operational programme for the EU funding period 2014 to 2020, Castile–La Mancha has
also formulated specific regional policy goals under the PRINCET 2011-2015 strategy. PRINCET (Regional
Plan for Scientific Research, Technological Development and Innovation) is a regional plan designed for pro-
moting the regional system of science and technology (European Commission, 2015c). The specific objectives of
the PRINCET plan are to increase and optimise existing resources, promote innovative and competitive business
networks, foster the internationalisation of public and private actors in the regional science and technology sys-
tem, promote public-private collaborations, boost research excellence of the public research organisations and
promote a culture favouring science and technology (European Commission, 2015c). Overall, the plan has been
structured along the thematic areas covered by FP7 and through six main action lines, namely internationalisa-
tion, training, collaboration between public and private sectors, fostering business activity, and dissemination of
science and technology. In addition, three new instruments of coordination will be created: RETCAM (Technol-
ogy Network of Castile–La Mancha) designed to foster business competitiveness; a Science Public Dissemina-
tion Unit that aims at spreading scientific culture; and the Institute of Agroforestry Research in Castile–La Man-
cha, which will be devoted to the agrarian and rural development (European Commission, 2015c). Besides the
PRINCET, which focuses primarily on science and technology, the regional Endowment Plan aims to strengthen
the industrial substance of the region. This plan is designed to support SMEs in gaining competences to increase
their competitiveness (European Commission, 2015c).
15 Following the NIW/ISI definition, KIS are defined as NACE 64 (telecommunications), 72 (computer and related services), 73 (research and development), 74 (other business services), 85 (health and social work) and 92 (recreational, cultural and sporting activities) (Legler
and Frietsch, 2007, pp. 19f.).
63
Conclusion
Summarising, the case study of Castile–La Mancha has shown that this rural and sparsely populated Spanish
region lags behind the leading European regions in a number of key characteristics such as the regional GDP per
capita or the regional employment rate. Furthermore, the regional R&D expenditures and patent activities are
quite low, pointing towards an underdeveloped regional innovation system. The main obstacles of the regional
economy are the low population density, a shortage of qualified workers, and a lack of any industrial networks
resulting from the fact that firms are scattered across a large geographic area. Despite these unfavourable condi-
tions, the region shows a lasting trade specialisation in three industries of the low- and medium-low-technology
manufacturing sectors. The comparatively good trade performance of Castile–La Mancha is mainly attributed to
the regional industrial legacy, with textile and leather crafts playing a traditionally strong role in the region. In
contrast, the strong performance of the manufacture of non-metallic mineral products is driven by the regional
endowment with natural resources. Given these trade specialisation patterns, it becomes obvious that the region
faces major challenges in the near future. Thus, in the wearing apparel and the leather industries, the region faces
an increasingly strong competition from Asian countries where labour costs are lower. Furthermore, the stock of
natural resources is not abundant and thus further challenges regional economic policy. Here, the latest attempts
to attract more firms operating in the bio-economy and to establish renewable energies, including bio fuels as the
basis of a new economy scheme certainly move in the right direction.
According to the empirical model, location requirements of the selected industries are not easily broken down to
a common basis. However, the weak innovation activities in regions with similarly high specialisation in these
three industries as it is expressed by the model in terms of lacking significant effects, mirrors the situation in
Castile–La Mancha. The only features found are that, while comparative advantages in wearing apparel and
leather manufacturing rely on industry-specific clustering, favourable innovation-related conditions for the third
industry, manufacture of other non-metallic mineral products, are expressed by innovative SMEs.
At least, low requirements concerning the political environment are common to all three industries. This is how-
ever, no ideal precondition for developing the industrial structure even though starting points for development
strategies are hard to identify by means of the results at hand. Industrial and innovation policy thus needs to be
implemented with caution and requires considering both the exploration of new technologies and industries, such
as renewable energies as described above, as well as supporting the prevalent industries in order to seek oppor-
tunities for diversification. In this process, policies supporting SME development can play a favourable role
since SMEs are sufficiently agile to adapt to emerging trends suitable for the region’s economic preconditions.
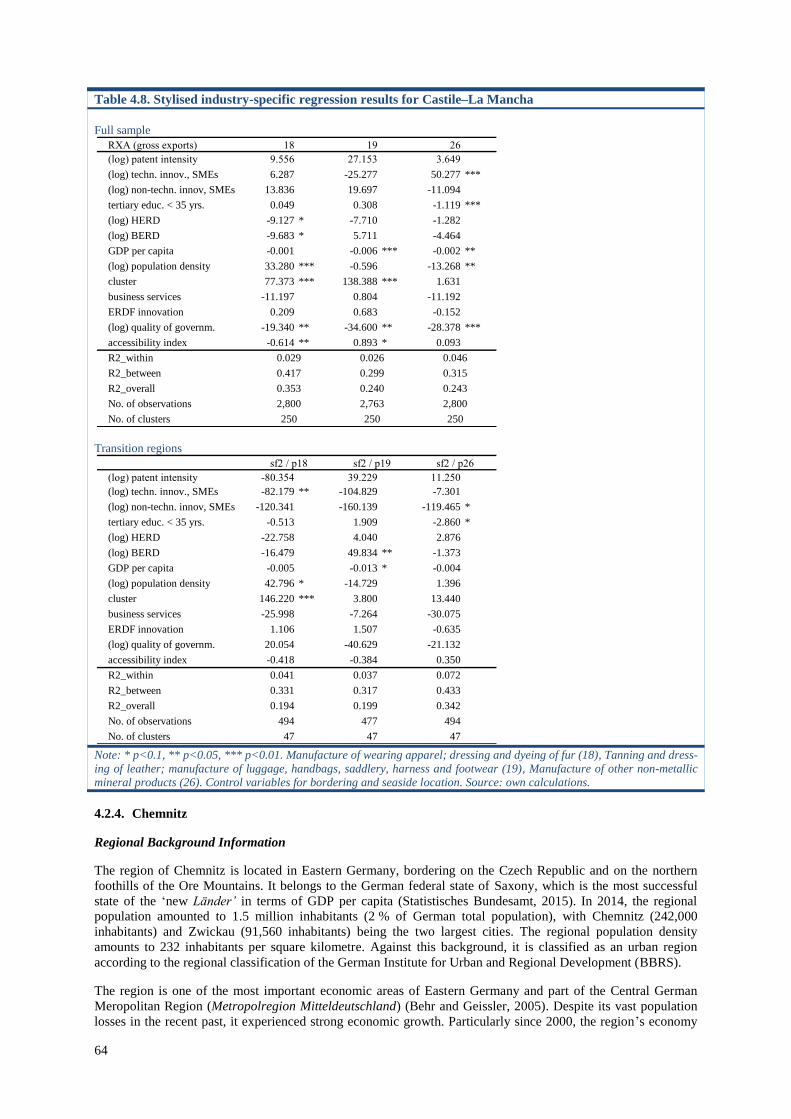
64
Table 4.8. Stylised industry-specific regression results for Castile–La Mancha
Full sample
Transition regions
Note: * p<0.1, ** p<0.05, *** p<0.01. Manufacture of wearing apparel; dressing and dyeing of fur (18), Tanning and dress-
ing of leather; manufacture of luggage, handbags, saddlery, harness and footwear (19), Manufacture of other non-metallic
mineral products (26). Control variables for bordering and seaside location. Source: own calculations.
4.2.4. Chemnitz
Regional Background Information
The region of Chemnitz is located in Eastern Germany, bordering on the Czech Republic and on the northern
foothills of the Ore Mountains. It belongs to the German federal state of Saxony, which is the most successful
state of the ‘new Länder’ in terms of GDP per capita (Statistisches Bundesamt, 2015). In 2014, the regional
population amounted to 1.5 million inhabitants (2 % of German total population), with Chemnitz (242,000
inhabitants) and Zwickau (91,560 inhabitants) being the two largest cities. The regional population density
amounts to 232 inhabitants per square kilometre. Against this background, it is classified as an urban region
according to the regional classification of the German Institute for Urban and Regional Development (BBRS).
The region is one of the most important economic areas of Eastern Germany and part of the Central German
Meropolitan Region (Metropolregion Mitteldeutschland) (Behr and Geissler, 2005). Despite its vast population
losses in the recent past, it experienced strong economic growth. Particularly since 2000, the region’s economy
RXA (gross exports) 18 19 26
(log) patent intensity 9.556 27.153 3.649
(log) techn. innov., SMEs 6.287 -25.277 50.277 ***
(log) non-techn. innov, SMEs 13.836 19.697 -11.094
tertiary educ. < 35 yrs. 0.049 0.308 -1.119 ***
(log) HERD -9.127 * -7.710 -1.282
(log) BERD -9.683 * 5.711 -4.464
GDP per capita -0.001 -0.006 *** -0.002 **
(log) population density 33.280 *** -0.596 -13.268 **
cluster 77.373 *** 138.388 *** 1.631
business services -11.197 0.804 -11.192
ERDF innovation 0.209 0.683 -0.152
(log) quality of governm. -19.340 ** -34.600 ** -28.378 ***
accessibility index -0.614 ** 0.893 * 0.093
R2_within 0.029 0.026 0.046
R2_between 0.417 0.299 0.315
R2_overall 0.353 0.240 0.243
No. of observations 2,800 2,763 2,800
No. of clusters 250 250 250
sf2 / p18 sf2 / p19 sf2 / p26 sf2 / p27
(log) patent intensity -80.354 39.229 11.250
(log) techn. innov., SMEs -82.179 ** -104.829 -7.301
(log) non-techn. innov, SMEs -120.341 -160.139 -119.465 *
tertiary educ. < 35 yrs. -0.513 1.909 -2.860 *
(log) HERD -22.758 4.040 2.876
(log) BERD -16.479 49.834 ** -1.373
GDP per capita -0.005 -0.013 * -0.004
(log) population density 42.796 * -14.729 1.396
cluster 146.220 *** 3.800 13.440
business services -25.998 -7.264 -30.075
ERDF innovation 1.106 1.507 -0.635
(log) quality of governm. 20.054 -40.629 -21.132
accessibility index -0.418 -0.384 0.350
R2_within 0.041 0.037 0.072
R2_between 0.331 0.317 0.433
R2_overall 0.194 0.199 0.342
No. of observations 494 477 494
No. of clusters 47 47 47
65
has recorded high annual GDP growth rates, with the regional economy being based on the services sector and
the manufacturing industry (Behr and Geissler, 2005).
Despite its above-average growth rates, the regional GDP still only amounts to 89 % of the EU average in 2011.
Given its GDP slightly below the 90 %-threshold, the region falls under the transition regions in the EU
structural fund period 2014-2020 (2014/99/EC). While unemployment was a major problem of the region in the
1990s, with rates frequently exceeding 20 %, in the last ten years, the unemployment rate has been constantly
declining from 18 % in 2005 (German average 10.7 %) to 8.8 % in 2011. Thus it is only slightly above the
German average of 6.4 %, but below the EU average of 9.5 % in that year.
The regional business structure is predominantly characterised by small and medium-sized enterprises (SMEs),
with mechanical engineering, metal processing and vehicle manufacturing the most important manufacturing
sectors. The industrial tradition in Chemnitz reaches back to the 19th
century. Industrialisation took hold quite
early in the Zwickau-Chemnitz economic zone and the area used to be referred to as the Manchester of Germany
(Behr and Geissler, 2005). The once major manufacturing industries of textile manufacturing, metal working,
mechanical and automotive engineering grew naturally out of the trades and crafts historically practised in
Chemnitz, and today still constitute its comparative advantage as shown below.
In 1990, Volkswagen exploited the regional knowledge and capital resources of the automotive industry by
establishing a new production plant in Zwickau. Later on, the region succeeded in attracting firms specialising in
new technologies, electronics and electrical engineering. Besides the skill demand emanating from these
knowledge-intensive industries there is also a large variety of higher education institutions such as the technical
universities of Chemnitz and Freiberg as well as several applied universities contributing to the high skill
intensity of the regional employment: correspondingly, the share of employees holding a tertiary degree amounts
to more than twice the national average (28.7 % vs. 13 %) (Statistisches Bundesamt, 2015).
Selected Industries
International Trade
Because of the two major Volkswagen production plants located in the region, it is not surprising that Chemnitz
reveals a strong international trade performance in the automotive industry (i.e. NACE Rev. 1.1: 34). As Figure
4.4 depicts, about a quarter of regional exports stems from the automotive industry (26.3 %) compared to the
German average of about one fifth (19.9 %) in 2011. Moreover, the high specialisation indicators (RXA and
RCA) further increased between 2000 and 2011. Besides, the region also shows above-average trade
specialisation in the machinery industry (i.e. manufacturing of machinery and equipment, NACE Rev. 1.1: 29),
and the textile industry (17). Whereas the positive trade specialisation in the automotive and machinery
industries corresponds to the national German average, the positive trade specialisation in the textile industry is a
specific regional characteric.
While Chemnitz’ export share in textile products (6.3 %) was markedly higher than the German average (1.4 %)
in 2011, the regional export share of 14.5 % in the machinery industry was slightly below the German average
(16.1 %). However, in comparison to the EU average, Chemnitz’ machinery exports are still above-average.
Together, the export market shares of the three industries indicate that in terms of international trade
performance, the region still profits from its traditionally strong regional industries. Thus, the previously
prosperous industries are still relevant today. Merely 6.3 % of all regional exports of the manufacturing sector
are attributed to the textile industry in 2011 (Figure 4.4). Yet the regional exports in the textile industry are far
above the German average of 1.4 % in 2011.
Employment and Patent Intensity
The outstanding export performance of the automotive industry in Chemnitz (Figure 4.4) is also reflected in
terms of employment. The industry’s about 32,000 workers account for 4.6 % of total regional employment. This
share has even doubled since 2000, which is also expressed by an annual growth rate of 5.3 %. Patent intensity
in the automotive industry amounts to 6.7 per 10,000 employees, which is, however, slightly lower than in 2000
(8.5) and significantly lower than the regional manufacturing average (16.7 per 10,000 employees) (Table 4.9).
This may be partly attributed to the fact, that the regional automotive industry is mainly assigned to
manufacturing activities, whereas R&D and thus also patenting is concentrated in group company enterprises in
other regions. Furthermore, the large automotive plants are focused on the production of vehicle engines. In this
context, R&D and innovation is often conducted by mechanical engineering suppliers, statistically found in the
machinery industry.
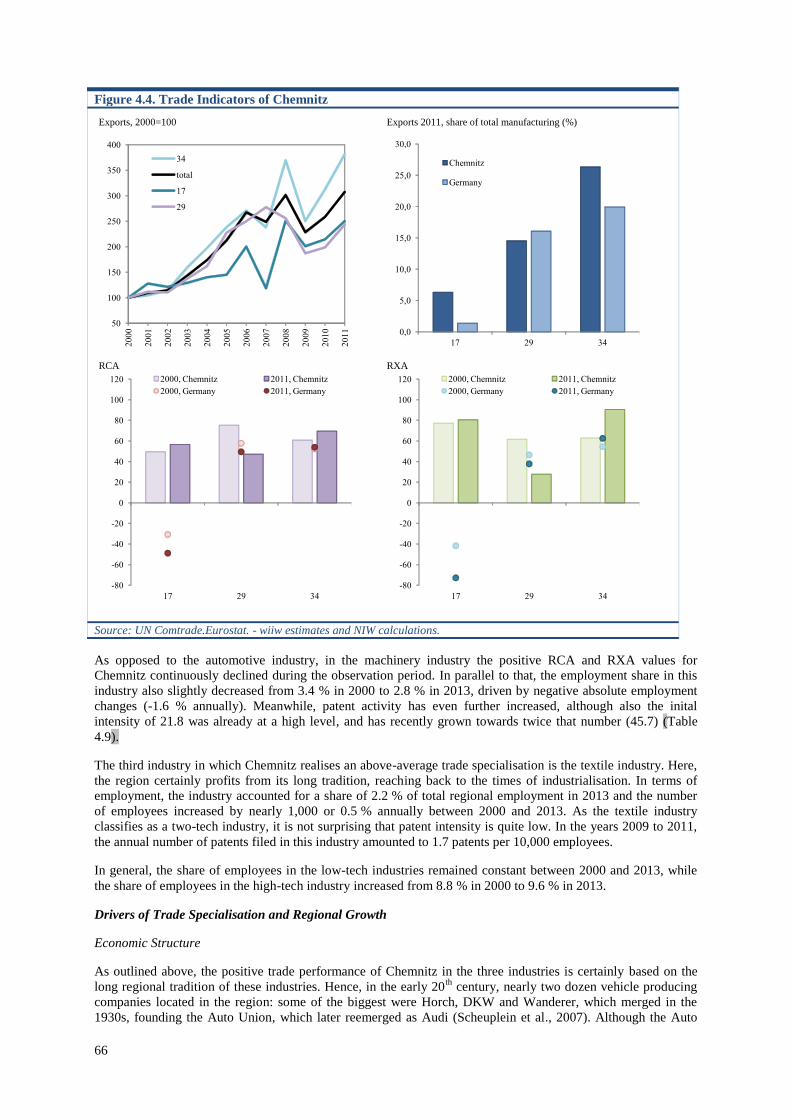
66
Figure 4.4. Trade Indicators of Chemnitz
Source: UN Comtrade.Eurostat. - wiiw estimates and NIW calculations.
As opposed to the automotive industry, in the machinery industry the positive RCA and RXA values for
Chemnitz continuously declined during the observation period. In parallel to that, the employment share in this
industry also slightly decreased from 3.4 % in 2000 to 2.8 % in 2013, driven by negative absolute employment
changes (-1.6 % annually). Meanwhile, patent activity has even further increased, although also the inital
intensity of 21.8 was already at a high level, and has recently grown towards twice that number (45.7) (Table
4.9).
The third industry in which Chemnitz realises an above-average trade specialisation is the textile industry. Here,
the region certainly profits from its long tradition, reaching back to the times of industrialisation. In terms of
employment, the industry accounted for a share of 2.2 % of total regional employment in 2013 and the number
of employees increased by nearly 1,000 or 0.5 % annually between 2000 and 2013. As the textile industry
classifies as a two-tech industry, it is not surprising that patent intensity is quite low. In the years 2009 to 2011,
the annual number of patents filed in this industry amounted to 1.7 patents per 10,000 employees.
In general, the share of employees in the low-tech industries remained constant between 2000 and 2013, while
the share of employees in the high-tech industry increased from 8.8 % in 2000 to 9.6 % in 2013.
Drivers of Trade Specialisation and Regional Growth
Economic Structure
As outlined above, the positive trade performance of Chemnitz in the three industries is certainly based on the
long regional tradition of these industries. Hence, in the early 20th
century, nearly two dozen vehicle producing
companies located in the region: some of the biggest were Horch, DKW and Wanderer, which merged in the
1930s, founding the Auto Union, which later reemerged as Audi (Scheuplein et al., 2007). Although the Auto
Exports, 2000=100 Exports 2011, share of total manufacturing (%)
RCA RXA
50
100
150
200
250
300
350
400
20
00
20
01
20
02
20
03
20
04
20
05
20
06
20
07
20
08
20
09
20
10
20
11
34
total
17
29
0,0
5,0
10,0
15,0
20,0
25,0
30,0
17 29 34
Chemnitz
Germany
-80
-60
-40
-20
0
20
40
60
80
100
120
17 29 34
2000, Chemnitz 2011, Chemnitz
2000, Germany 2011, Germany
-80
-60
-40
-20
0
20
40
60
80
100
120
17 29 34
2000, Chemnitz 2011, Chemnitz
2000, Germany 2011, Germany
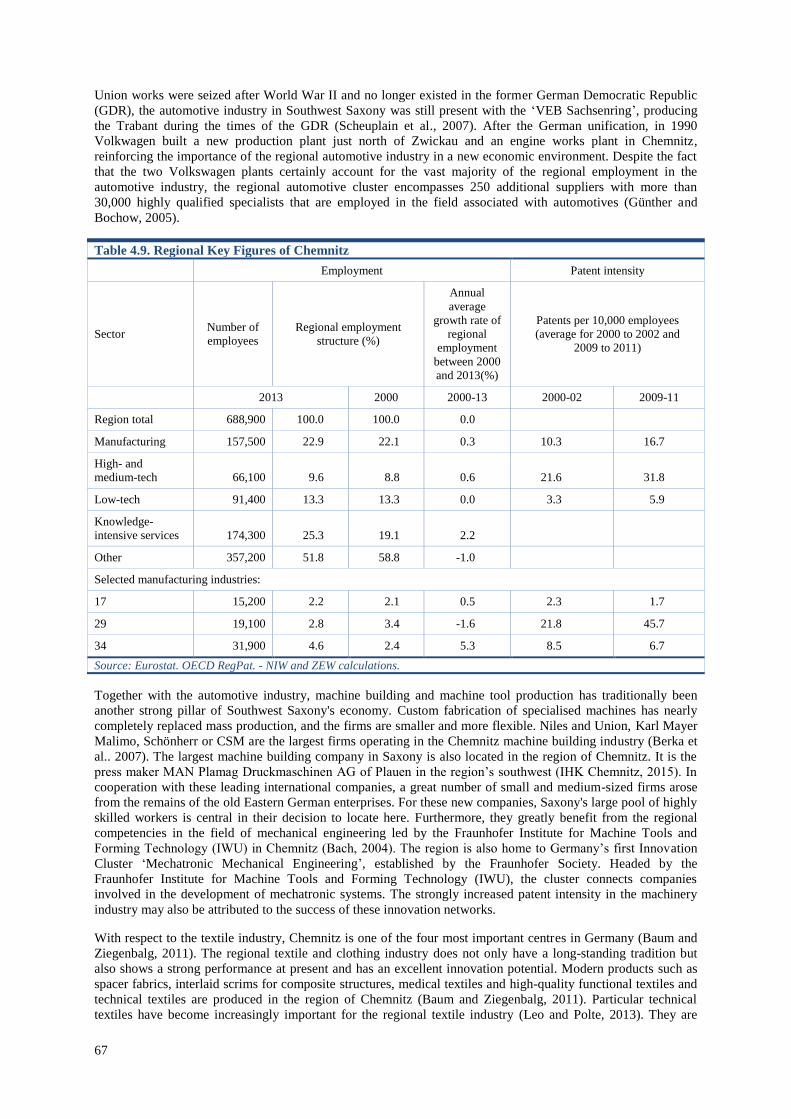
67
Union works were seized after World War II and no longer existed in the former German Democratic Republic
(GDR), the automotive industry in Southwest Saxony was still present with the ‘VEB Sachsenring’, producing
the Trabant during the times of the GDR (Scheuplain et al., 2007). After the German unification, in 1990
Volkwagen built a new production plant just north of Zwickau and an engine works plant in Chemnitz,
reinforcing the importance of the regional automotive industry in a new economic environment. Despite the fact
that the two Volkswagen plants certainly account for the vast majority of the regional employment in the
automotive industry, the regional automotive cluster encompasses 250 additional suppliers with more than
30,000 highly qualified specialists that are employed in the field associated with automotives (Günther and
Bochow, 2005).
Table 4.9. Regional Key Figures of Chemnitz
Employment Patent intensity
Sector Number of
employees
Regional employment
structure (%)
Annual
average
growth rate of
regional
employment
between 2000
and 2013(%)
Patents per 10,000 employees
(average for 2000 to 2002 and
2009 to 2011)
2013 2000 2000-13 2000-02 2009-11
Region total 688,900 100.0 100.0 0.0
Manufacturing 157,500 22.9 22.1 0.3 10.3 16.7
High- and
medium-tech 66,100 9.6 8.8 0.6 21.6 31.8
Low-tech 91,400 13.3 13.3 0.0 3.3 5.9
Knowledge-
intensive services 174,300 25.3 19.1 2.2
Other 357,200 51.8 58.8 -1.0
Selected manufacturing industries:
17 15,200 2.2 2.1 0.5 2.3 1.7
29 19,100 2.8 3.4 -1.6 21.8 45.7
34 31,900 4.6 2.4 5.3 8.5 6.7
Source: Eurostat. OECD RegPat. - NIW and ZEW calculations.
Together with the automotive industry, machine building and machine tool production has traditionally been
another strong pillar of Southwest Saxony's economy. Custom fabrication of specialised machines has nearly
completely replaced mass production, and the firms are smaller and more flexible. Niles and Union, Karl Mayer
Malimo, Schönherr or CSM are the largest firms operating in the Chemnitz machine building industry (Berka et
al.. 2007). The largest machine building company in Saxony is also located in the region of Chemnitz. It is the
press maker MAN Plamag Druckmaschinen AG of Plauen in the region’s southwest (IHK Chemnitz, 2015). In
cooperation with these leading international companies, a great number of small and medium-sized firms arose
from the remains of the old Eastern German enterprises. For these new companies, Saxony's large pool of highly
skilled workers is central in their decision to locate here. Furthermore, they greatly benefit from the regional
competencies in the field of mechanical engineering led by the Fraunhofer Institute for Machine Tools and
Forming Technology (IWU) in Chemnitz (Bach, 2004). The region is also home to Germany’s first Innovation
Cluster ‘Mechatronic Mechanical Engineering’, established by the Fraunhofer Society. Headed by the
Fraunhofer Institute for Machine Tools and Forming Technology (IWU), the cluster connects companies
involved in the development of mechatronic systems. The strongly increased patent intensity in the machinery
industry may also be attributed to the success of these innovation networks.
With respect to the textile industry, Chemnitz is one of the four most important centres in Germany (Baum and
Ziegenbalg, 2011). The regional textile and clothing industry does not only have a long-standing tradition but
also shows a strong performance at present and has an excellent innovation potential. Modern products such as
spacer fabrics, interlaid scrims for composite structures, medical textiles and high-quality functional textiles and
technical textiles are produced in the region of Chemnitz (Baum and Ziegenbalg, 2011). Particular technical
textiles have become increasingly important for the regional textile industry (Leo and Polte, 2013). They are
68
important components for innovative products. The range of applications of these technical textiles reaches from
airbags for cars, textile sealing and filters, fibre composites for sport equipment or aircrafts, to textile concrete in
buildings and textile implants in medicine. The term technical textiles, thus, covers all those textile materials not
belonging to clothing and home textiles in the classical sense (Leo and Polte, 2013). Technical textiles are
mainly developed, produced and applied under the aspect of functionality. Given the existence of a substantial
cluster (i.e. Sachsen!Textil), which was funded as an initiative for the regional textile industry, the preconditions
for a sustained and extended the strong performance of the textile industry in the region are given.
Moreover, knowledge-intensive services play an increasingly important role for the development of the regional
economy. The share of KIS (as defined by Legler and Frietsch, 2007) inceased from 19.1 % in 2000 to 25.3 % in
2013. The annual growth rate amounted to 2.2 % (Table 4.9).
Regional Innovation System
Science and business have traditionally been closely linked in Chemnitz. The region is characterised by four
institutions of higher education, three universities of applied education, seven technology and start-up centres
(e.g. the Technology Centre Chemnitz, TCC), about 20 non-university research facilities, and more than 1,000
technology companies. The region’s largest university is Chemnitz University of Technology, where about
10,000 students are enrolled. Being a technical university, the institute has a strong focus on engineering and
natural sciences. Other university-level institutions in the region include the technical university of Freiberg, the
colleges of higher education in Zwickau and Mittweida as well as the three universities of cooperative education
in Glauchau, Breitenbrunn and Plauen, which focus on application-oriented research and close cooperation with
companies. Several initiatives promote university-industry linkages in R&D. The Smart Systems campus on the
site of the Chemnitz University of Technology is a prime example combining short, direct routes to scientific-
technical facilities emphasising promotion of start-ups and entrepreneurship. Thus, the region is endowed with
qualified human resources (Bach, 2004).
The regional attempts to establish Chemnitz as an innovation hub are also reflected by growing regional patent
activities. In spite of the relatively low patenting performance of the automotive industry, the number of patents
per 10,000 employees rose from 21.6 to 31.8 in the high- and medium-high-tech manufacturing sector and from
3.3 to 5.9 in the low-tech sector. Still, in general, the regional innovation system seems to succeed in supporting
the knowledge transfer between research institutions and the industry and in gererating a dynamic innovation
process for companies in the region. But, while Chemnitz’ expenditures on Higher Education Research and
Development (HERD) as a percentage of regional GDP accounted for 0.56% in 2011, thus being higher than the
EU average of 0.46 %, the respective share of business R&D expenditures (BERD) (1.02 %) was still signifi-
cantly lower than the EU average of 1.24 %.
Political Context and Regional Growth Policies
In the German political system, the federal states (Länder) are the most important political entities regarding
competencies in regional policy. Each federal state in Germany applies its own operational programme for the
EU structural funds. In the case of Chemitz, the region is one of three NUTS 2 regions of the German federal
state of Saxony (NUTS 1).
Like other regions in the East of Germany (former GDR), Chemnitz benefited from generous national support
programmes aiming to support the transition of the new federal states to a market economy after the German re-
unication in 1990. The main priority of these support programmes, many still in place today, has been the
endowment with physical infrastructure and the relocation of business to foster regional employment and
economic growth (Bach and Ziegenbalg, 2011). However, it was also the commitment of individual firms that
played an important role for the development of the region after the fall of the iron curtain. The Volkswagen
group, for instance, did not only open two major plants in the region, but also, together with the Fraunhofer
society, founded a centre of excellence for automotive production, a VW research factory on the site of the
Fraunhofer institute for machine tools and forming technology.
Chemnitz also benefited from its classification as an Objective 1 region in the preceding EU funding period. In
the funding period 2007-2013, large amounts have been devoted to improvements in the regional infrastructure
(40 %) as well as research, innovation and technology (35 %) (Sächsisches Staatsministerium für Wirtschaft,
Arbeit und Verkehr, 2014). In the current funding period (2014-2010), the focus on research, innovation and
technology has been extended (40 %) and also the strengening of the competitiveness of SMEs (Sächsische
Staatskanzlei, 2014).
69
Conclusion
The case study of Chemnitz has shown that even though the region does not belong to the advanced European
regions in terms of GDP per capita, it still reveals a strong trade specialisation in two high/medium-high-
technology industries (automotive and machinery industries), and one low-technology industry (textile industry).
The region clearly profits from its industrial tradition, which was already the regional economic backbone in
times of the GDR. After German reunification in 1990, the region succeeded in re-vitalising these industries with
the support of regional policies aimed at attracting firms to these tradtionally strong regional industries. The
positive regional economic development in recent years can also be attributed to the fact that firms operating in
medium-high- and low-technology industries successfully implemented technological changes. Textile firms, for
example, increasingly specialise on higher-quality industrial textiles that are more knowledge-intensive than the
traditional clothing industry. The sufficently large pool of qualified workers as well as the well-developed
regional innovation system have been important preconditions for the positive regional development in recent
years. The large number of regional universities and university-level institutions are important pull factors for
attracting young people to the region. However, the demographic change and the decline in population constitute
future challenges for the region.
Comparisons with the regression results are difficult since similarities of the estimates between the three
industries are rare. The most unambiguous result concerning Chemnitz is the presence of industrial clusters
which clearly promote comparative advantages. This production orientation – rather than a functional
specialisation on headquarter functions – is also expressed by the lower importance of non-technological (e.g.
distributional or organisational) innovations by SMEs. Another point questioning the future perspectives of the
location and its comparative advantages is represented by low dependency on skilled labour supply. Since also
Chemnitz suffers from a remarkable population decline, human capital will hardly serve as a positive location
factor in the medium term. However, policy issues prove to be relatively beneficial for the region as is also the
case for population density, although the latter is not a decisive factor in the model. A further characteristic of
Chemnitz which also fits the econometric results is the importance of a public research infrastructure as
indicated by HERD. Given these favourable preconditions it will be necessary to maintain further infrastructure
in times of demographic change.
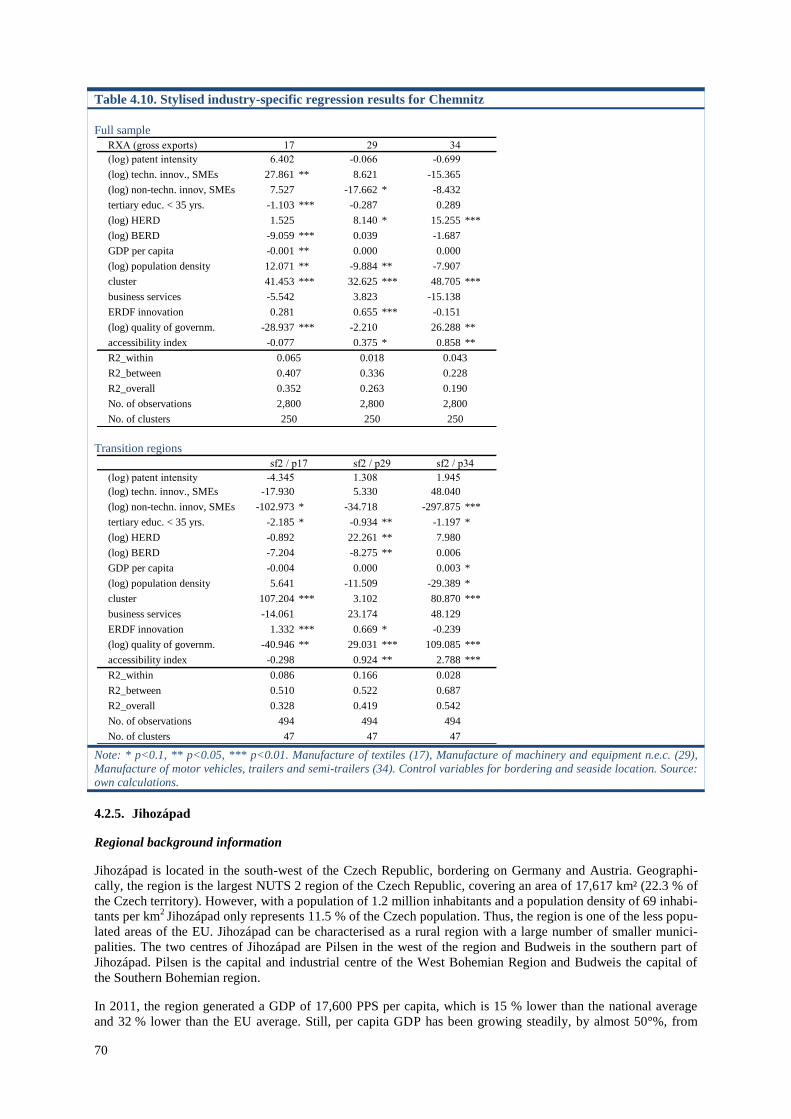
70
Table 4.10. Stylised industry-specific regression results for Chemnitz
Full sample
Transition regions
Note: * p<0.1, ** p<0.05, *** p<0.01. Manufacture of textiles (17), Manufacture of machinery and equipment n.e.c. (29),
Manufacture of motor vehicles, trailers and semi-trailers (34). Control variables for bordering and seaside location. Source:
own calculations.
4.2.5. Jihozápad
Regional background information
Jihozápad is located in the south-west of the Czech Republic, bordering on Germany and Austria. Geographi-
cally, the region is the largest NUTS 2 region of the Czech Republic, covering an area of 17,617 km² (22.3 % of
the Czech territory). However, with a population of 1.2 million inhabitants and a population density of 69 inhabi-
tants per km2
Jihozápad only represents 11.5 % of the Czech population. Thus, the region is one of the less popu-
lated areas of the EU. Jihozápad can be characterised as a rural region with a large number of smaller munici-
palities. The two centres of Jihozápad are Pilsen in the west of the region and Budweis in the southern part of
Jihozápad. Pilsen is the capital and industrial centre of the West Bohemian Region and Budweis the capital of
the Southern Bohemian region.
In 2011, the region generated a GDP of 17,600 PPS per capita, which is 15 % lower than the national average
and 32 % lower than the EU average. Still, per capita GDP has been growing steadily, by almost 50°%, from
RXA (gross exports) 17 29 34
(log) patent intensity 6.402 -0.066 -0.699
(log) techn. innov., SMEs 27.861 ** 8.621 -15.365
(log) non-techn. innov, SMEs 7.527 -17.662 * -8.432
tertiary educ. < 35 yrs. -1.103 *** -0.287 0.289
(log) HERD 1.525 8.140 * 15.255 ***
(log) BERD -9.059 *** 0.039 -1.687
GDP per capita -0.001 ** 0.000 0.000
(log) population density 12.071 ** -9.884 ** -7.907
cluster 41.453 *** 32.625 *** 48.705 ***
business services -5.542 3.823 -15.138
ERDF innovation 0.281 0.655 *** -0.151
(log) quality of governm. -28.937 *** -2.210 26.288 **
accessibility index -0.077 0.375 * 0.858 **
R2_within 0.065 0.018 0.043
R2_between 0.407 0.336 0.228
R2_overall 0.352 0.263 0.190
No. of observations 2,800 2,800 2,800
No. of clusters 250 250 250
sf2 / p17 sf2 / p29 sf2 / p34 sf2 / p35
(log) patent intensity -4.345 1.308 1.945
(log) techn. innov., SMEs -17.930 5.330 48.040
(log) non-techn. innov, SMEs -102.973 * -34.718 -297.875 ***
tertiary educ. < 35 yrs. -2.185 * -0.934 ** -1.197 *
(log) HERD -0.892 22.261 ** 7.980
(log) BERD -7.204 -8.275 ** 0.006
GDP per capita -0.004 0.000 0.003 *
(log) population density 5.641 -11.509 -29.389 *
cluster 107.204 *** 3.102 80.870 ***
business services -14.061 23.174 48.129
ERDF innovation 1.332 *** 0.669 * -0.239
(log) quality of governm. -40.946 ** 29.031 *** 109.085 ***
accessibility index -0.298 0.924 ** 2.788 ***
R2_within 0.086 0.166 0.028
R2_between 0.510 0.522 0.687
R2_overall 0.328 0.419 0.542
No. of observations 494 494 494
No. of clusters 47 47 47
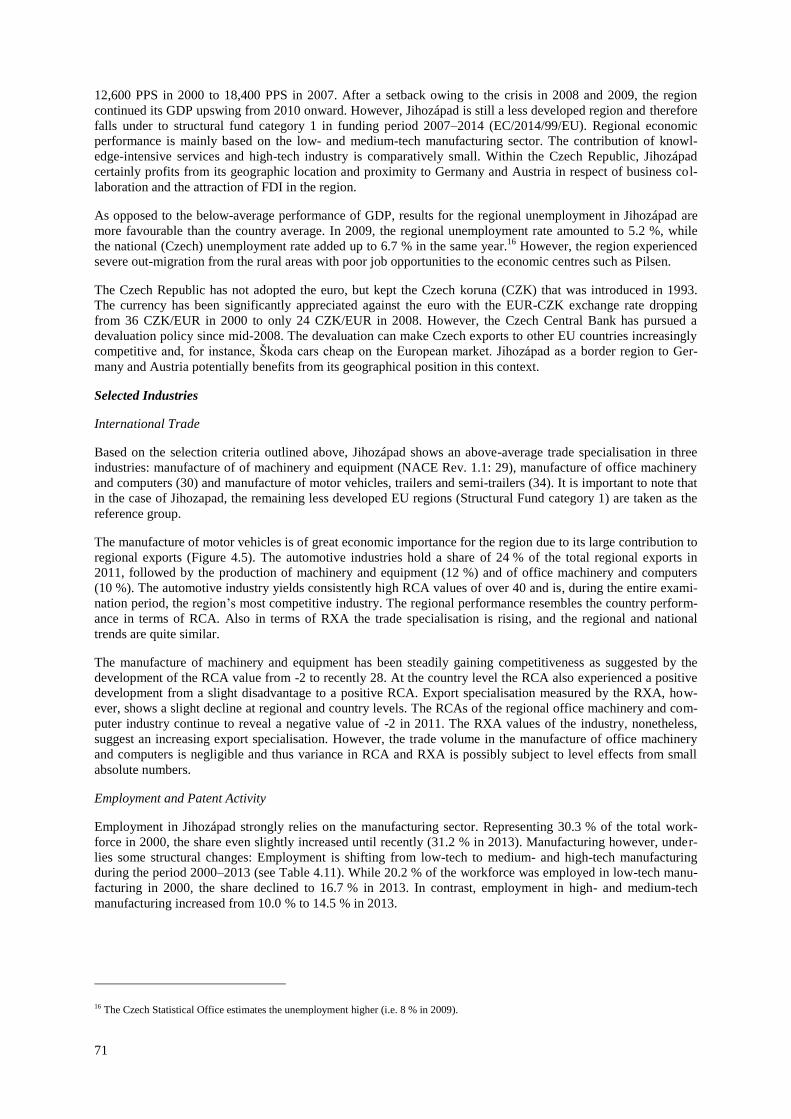
71
12,600 PPS in 2000 to 18,400 PPS in 2007. After a setback owing to the crisis in 2008 and 2009, the region
continued its GDP upswing from 2010 onward. However, Jihozápad is still a less developed region and therefore
falls under to structural fund category 1 in funding period 2007–2014 (EC/2014/99/EU). Regional economic
performance is mainly based on the low- and medium-tech manufacturing sector. The contribution of knowl-
edge-intensive services and high-tech industry is comparatively small. Within the Czech Republic, Jihozápad
certainly profits from its geographic location and proximity to Germany and Austria in respect of business col-
laboration and the attraction of FDI in the region.
As opposed to the below-average performance of GDP, results for the regional unemployment in Jihozápad are
more favourable than the country average. In 2009, the regional unemployment rate amounted to 5.2 %, while
the national (Czech) unemployment rate added up to 6.7 % in the same year.16
However, the region experienced
severe out-migration from the rural areas with poor job opportunities to the economic centres such as Pilsen.
The Czech Republic has not adopted the euro, but kept the Czech koruna (CZK) that was introduced in 1993.
The currency has been significantly appreciated against the euro with the EUR-CZK exchange rate dropping
from 36 CZK/EUR in 2000 to only 24 CZK/EUR in 2008. However, the Czech Central Bank has pursued a
devaluation policy since mid-2008. The devaluation can make Czech exports to other EU countries increasingly
competitive and, for instance, Škoda cars cheap on the European market. Jihozápad as a border region to Ger-
many and Austria potentially benefits from its geographical position in this context.
Selected Industries
International Trade
Based on the selection criteria outlined above, Jihozápad shows an above-average trade specialisation in three
industries: manufacture of of machinery and equipment (NACE Rev. 1.1: 29), manufacture of office machinery
and computers (30) and manufacture of motor vehicles, trailers and semi-trailers (34). It is important to note that
in the case of Jihozapad, the remaining less developed EU regions (Structural Fund category 1) are taken as the
reference group.
The manufacture of motor vehicles is of great economic importance for the region due to its large contribution to
regional exports (Figure 4.5). The automotive industries hold a share of 24 % of the total regional exports in
2011, followed by the production of machinery and equipment (12 %) and of office machinery and computers
(10 %). The automotive industry yields consistently high RCA values of over 40 and is, during the entire exami-
nation period, the region’s most competitive industry. The regional performance resembles the country perform-
ance in terms of RCA. Also in terms of RXA the trade specialisation is rising, and the regional and national
trends are quite similar.
The manufacture of machinery and equipment has been steadily gaining competitiveness as suggested by the
development of the RCA value from -2 to recently 28. At the country level the RCA also experienced a positive
development from a slight disadvantage to a positive RCA. Export specialisation measured by the RXA, how-
ever, shows a slight decline at regional and country levels. The RCAs of the regional office machinery and com-
puter industry continue to reveal a negative value of -2 in 2011. The RXA values of the industry, nonetheless,
suggest an increasing export specialisation. However, the trade volume in the manufacture of office machinery
and computers is negligible and thus variance in RCA and RXA is possibly subject to level effects from small
absolute numbers.
Employment and Patent Activity
Employment in Jihozápad strongly relies on the manufacturing sector. Representing 30.3 % of the total work-
force in 2000, the share even slightly increased until recently (31.2 % in 2013). Manufacturing however, under-
lies some structural changes: Employment is shifting from low-tech to medium- and high-tech manufacturing
during the period 2000–2013 (see Table 4.11). While 20.2 % of the workforce was employed in low-tech manu-
facturing in 2000, the share declined to 16.7 % in 2013. In contrast, employment in high- and medium-tech
manufacturing increased from 10.0 % to 14.5 % in 2013.
16 The Czech Statistical Office estimates the unemployment higher (i.e. 8 % in 2009).
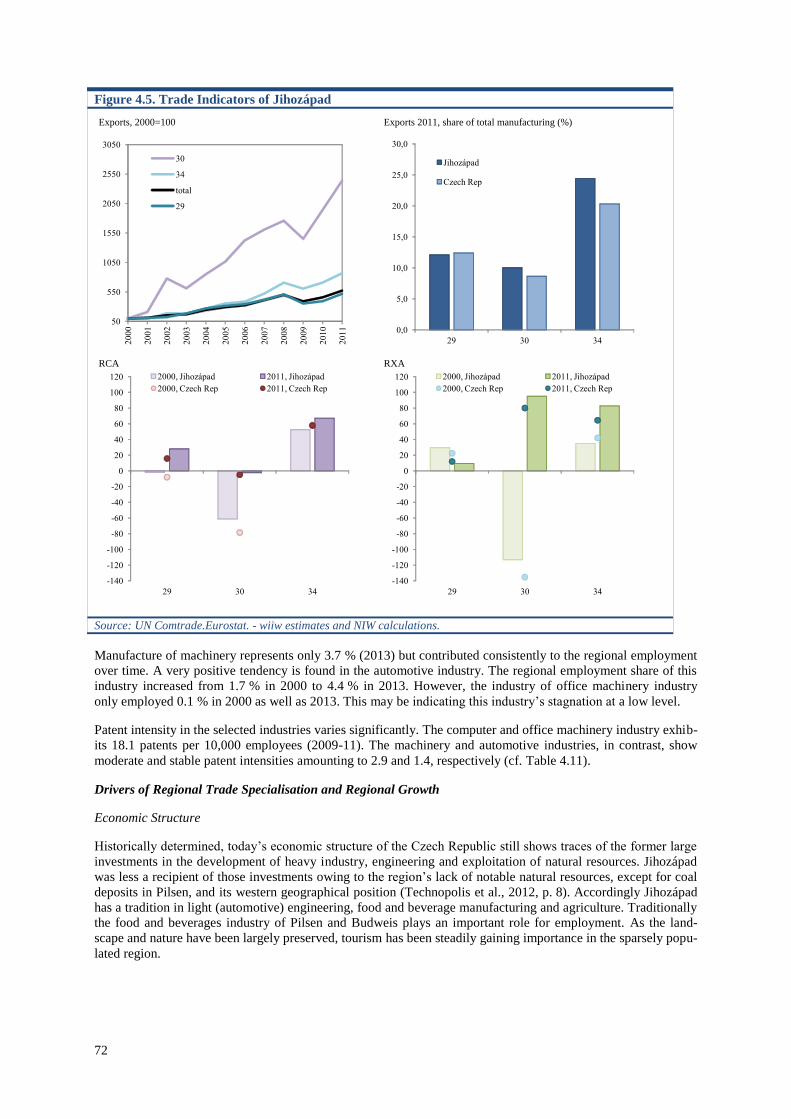
72
Figure 4.5. Trade Indicators of Jihozápad
Source: UN Comtrade.Eurostat. - wiiw estimates and NIW calculations.
Manufacture of machinery represents only 3.7 % (2013) but contributed consistently to the regional employment
over time. A very positive tendency is found in the automotive industry. The regional employment share of this
industry increased from 1.7 % in 2000 to 4.4 % in 2013. However, the industry of office machinery industry
only employed 0.1 % in 2000 as well as 2013. This may be indicating this industry’s stagnation at a low level.
Patent intensity in the selected industries varies significantly. The computer and office machinery industry exhib-
its 18.1 patents per 10,000 employees (2009-11). The machinery and automotive industries, in contrast, show
moderate and stable patent intensities amounting to 2.9 and 1.4, respectively (cf. Table 4.11).
Drivers of Regional Trade Specialisation and Regional Growth
Economic Structure
Historically determined, today’s economic structure of the Czech Republic still shows traces of the former large
investments in the development of heavy industry, engineering and exploitation of natural resources. Jihozápad
was less a recipient of those investments owing to the region’s lack of notable natural resources, except for coal
deposits in Pilsen, and its western geographical position (Technopolis et al., 2012, p. 8). Accordingly Jihozápad
has a tradition in light (automotive) engineering, food and beverage manufacturing and agriculture. Traditionally
the food and beverages industry of Pilsen and Budweis plays an important role for employment. As the land-
scape and nature have been largely preserved, tourism has been steadily gaining importance in the sparsely popu-
lated region.
Exports, 2000=100 Exports 2011, share of total manufacturing (%)
RCA RXA
50
550
1050
1550
2050
2550
3050
20
00
20
01
20
02
20
03
20
04
20
05
20
06
20
07
20
08
20
09
20
10
20
11
30
34
total
29
0,0
5,0
10,0
15,0
20,0
25,0
30,0
29 30 34
Jihozápad
Czech Rep
-140
-120
-100
-80
-60
-40
-20
0
20
40
60
80
100
120
29 30 34
2000, Jihozápad 2011, Jihozápad
2000, Czech Rep 2011, Czech Rep
-140
-120
-100
-80
-60
-40
-20
0
20
40
60
80
100
120
29 30 34
2000, Jihozápad 2011, Jihozápad
2000, Czech Rep 2011, Czech Rep
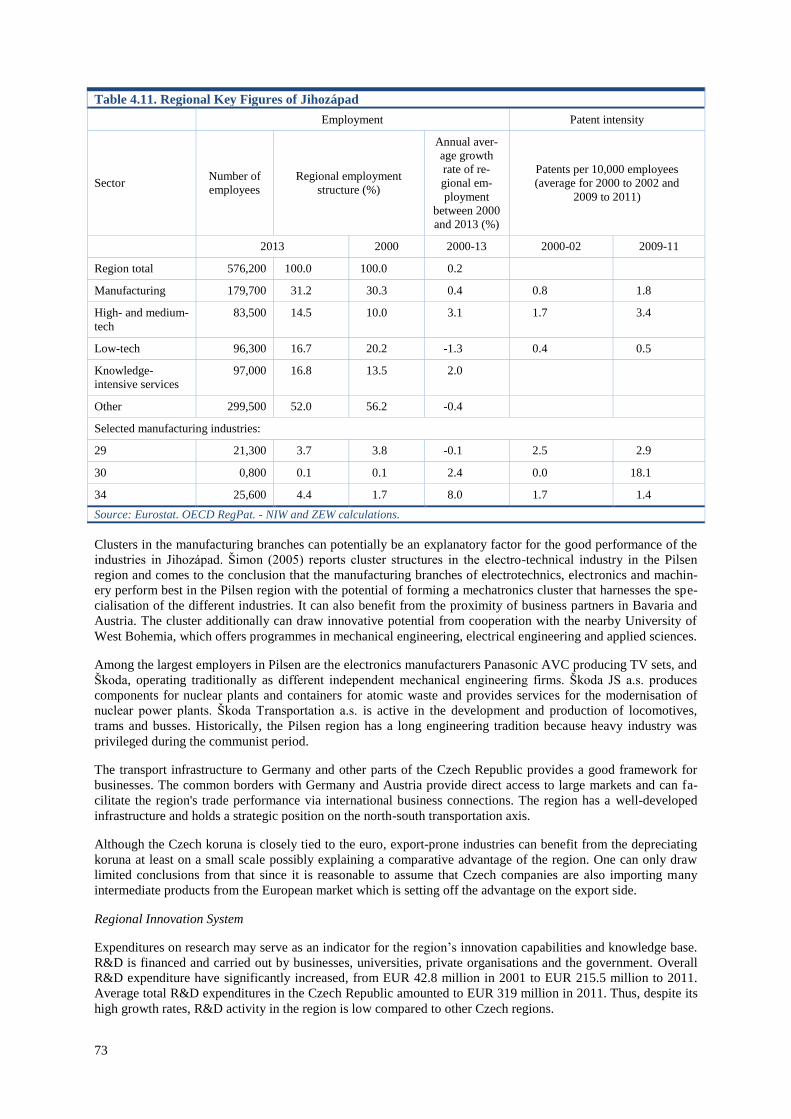
73
Table 4.11. Regional Key Figures of Jihozápad
Employment Patent intensity
Sector Number of
employees
Regional employment
structure (%)
Annual aver-
age growth
rate of re-
gional em-
ployment
between 2000
and 2013 (%)
Patents per 10,000 employees
(average for 2000 to 2002 and
2009 to 2011)
2013 2000 2000-13 2000-02 2009-11
Region total 576,200 100.0 100.0 0.2
Manufacturing 179,700 31.2 30.3 0.4 0.8 1.8
High- and medium-
tech
83,500 14.5 10.0 3.1 1.7 3.4
Low-tech 96,300 16.7 20.2 -1.3 0.4 0.5
Knowledge-
intensive services
97,000 16.8 13.5 2.0
Other 299,500 52.0 56.2 -0.4
Selected manufacturing industries:
29 21,300 3.7 3.8 -0.1 2.5 2.9
30 0,800 0.1 0.1 2.4 0.0 18.1
34 25,600 4.4 1.7 8.0 1.7 1.4
Source: Eurostat. OECD RegPat. - NIW and ZEW calculations.
Clusters in the manufacturing branches can potentially be an explanatory factor for the good performance of the
industries in Jihozápad. Šimon (2005) reports cluster structures in the electro-technical industry in the Pilsen
region and comes to the conclusion that the manufacturing branches of electrotechnics, electronics and machin-
ery perform best in the Pilsen region with the potential of forming a mechatronics cluster that harnesses the spe-
cialisation of the different industries. It can also benefit from the proximity of business partners in Bavaria and
Austria. The cluster additionally can draw innovative potential from cooperation with the nearby University of
West Bohemia, which offers programmes in mechanical engineering, electrical engineering and applied sciences.
Among the largest employers in Pilsen are the electronics manufacturers Panasonic AVC producing TV sets, and
Škoda, operating traditionally as different independent mechanical engineering firms. Škoda JS a.s. produces
components for nuclear plants and containers for atomic waste and provides services for the modernisation of
nuclear power plants. Škoda Transportation a.s. is active in the development and production of locomotives,
trams and busses. Historically, the Pilsen region has a long engineering tradition because heavy industry was
privileged during the communist period.
The transport infrastructure to Germany and other parts of the Czech Republic provides a good framework for
businesses. The common borders with Germany and Austria provide direct access to large markets and can fa-
cilitate the region's trade performance via international business connections. The region has a well-developed
infrastructure and holds a strategic position on the north-south transportation axis.
Although the Czech koruna is closely tied to the euro, export-prone industries can benefit from the depreciating
koruna at least on a small scale possibly explaining a comparative advantage of the region. One can only draw
limited conclusions from that since it is reasonable to assume that Czech companies are also importing many
intermediate products from the European market which is setting off the advantage on the export side.
Regional Innovation System
Expenditures on research may serve as an indicator for the region’s innovation capabilities and knowledge base.
R&D is financed and carried out by businesses, universities, private organisations and the government. Overall
R&D expenditure have significantly increased, from EUR 42.8 million in 2001 to EUR 215.5 million to 2011.
Average total R&D expenditures in the Czech Republic amounted to EUR 319 million in 2011. Thus, despite its
high growth rates, R&D activity in the region is low compared to other Czech regions.
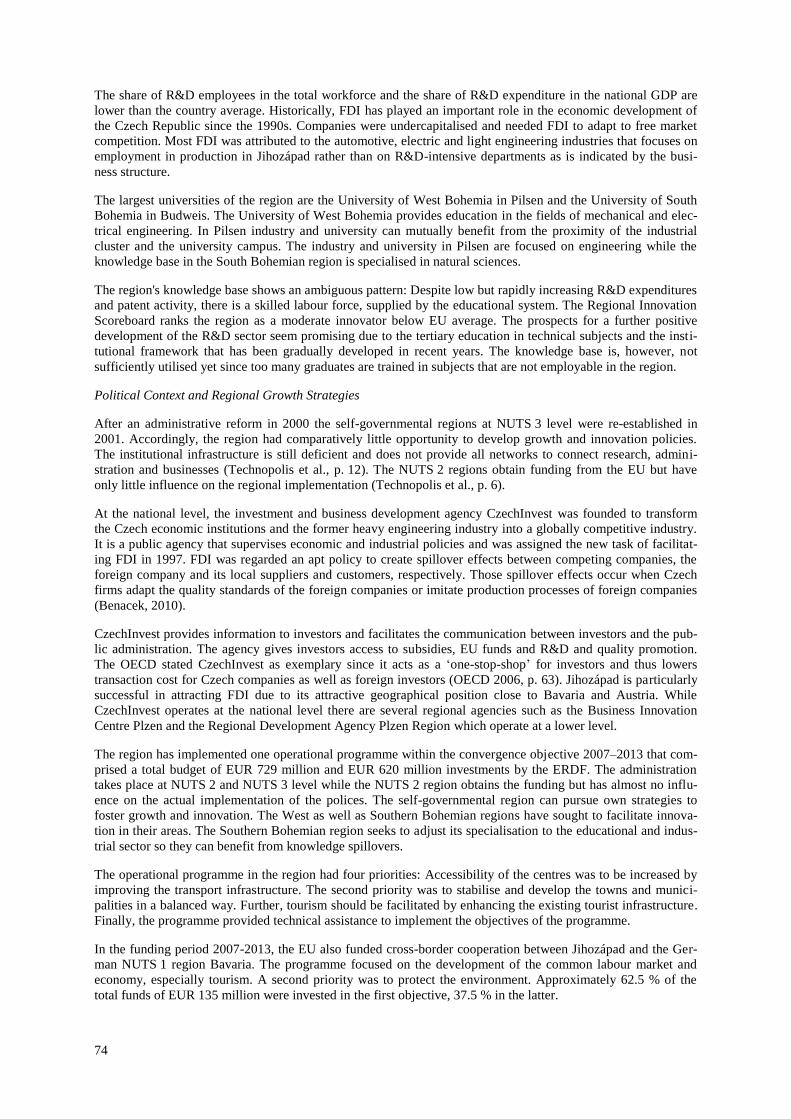
74
The share of R&D employees in the total workforce and the share of R&D expenditure in the national GDP are
lower than the country average. Historically, FDI has played an important role in the economic development of
the Czech Republic since the 1990s. Companies were undercapitalised and needed FDI to adapt to free market
competition. Most FDI was attributed to the automotive, electric and light engineering industries that focuses on
employment in production in Jihozápad rather than on R&D-intensive departments as is indicated by the busi-
ness structure.
The largest universities of the region are the University of West Bohemia in Pilsen and the University of South
Bohemia in Budweis. The University of West Bohemia provides education in the fields of mechanical and elec-
trical engineering. In Pilsen industry and university can mutually benefit from the proximity of the industrial
cluster and the university campus. The industry and university in Pilsen are focused on engineering while the
knowledge base in the South Bohemian region is specialised in natural sciences.
The region's knowledge base shows an ambiguous pattern: Despite low but rapidly increasing R&D expenditures
and patent activity, there is a skilled labour force, supplied by the educational system. The Regional Innovation
Scoreboard ranks the region as a moderate innovator below EU average. The prospects for a further positive
development of the R&D sector seem promising due to the tertiary education in technical subjects and the insti-
tutional framework that has been gradually developed in recent years. The knowledge base is, however, not
sufficiently utilised yet since too many graduates are trained in subjects that are not employable in the region.
Political Context and Regional Growth Strategies
After an administrative reform in 2000 the self-governmental regions at NUTS 3 level were re-established in
2001. Accordingly, the region had comparatively little opportunity to develop growth and innovation policies.
The institutional infrastructure is still deficient and does not provide all networks to connect research, admini-
stration and businesses (Technopolis et al., p. 12). The NUTS 2 regions obtain funding from the EU but have
only little influence on the regional implementation (Technopolis et al., p. 6).
At the national level, the investment and business development agency CzechInvest was founded to transform
the Czech economic institutions and the former heavy engineering industry into a globally competitive industry.
It is a public agency that supervises economic and industrial policies and was assigned the new task of facilitat-
ing FDI in 1997. FDI was regarded an apt policy to create spillover effects between competing companies, the
foreign company and its local suppliers and customers, respectively. Those spillover effects occur when Czech
firms adapt the quality standards of the foreign companies or imitate production processes of foreign companies
(Benacek, 2010).
CzechInvest provides information to investors and facilitates the communication between investors and the pub-
lic administration. The agency gives investors access to subsidies, EU funds and R&D and quality promotion.
The OECD stated CzechInvest as exemplary since it acts as a ‘one-stop-shop’ for investors and thus lowers
transaction cost for Czech companies as well as foreign investors (OECD 2006, p. 63). Jihozápad is particularly
successful in attracting FDI due to its attractive geographical position close to Bavaria and Austria. While
CzechInvest operates at the national level there are several regional agencies such as the Business Innovation
Centre Plzen and the Regional Development Agency Plzen Region which operate at a lower level.
The region has implemented one operational programme within the convergence objective 2007–2013 that com-
prised a total budget of EUR 729 million and EUR 620 million investments by the ERDF. The administration
takes place at NUTS 2 and NUTS 3 level while the NUTS 2 region obtains the funding but has almost no influ-
ence on the actual implementation of the polices. The self-governmental region can pursue own strategies to
foster growth and innovation. The West as well as Southern Bohemian regions have sought to facilitate innova-
tion in their areas. The Southern Bohemian region seeks to adjust its specialisation to the educational and indus-
trial sector so they can benefit from knowledge spillovers.
The operational programme in the region had four priorities: Accessibility of the centres was to be increased by
improving the transport infrastructure. The second priority was to stabilise and develop the towns and munici-
palities in a balanced way. Further, tourism should be facilitated by enhancing the existing tourist infrastructure.
Finally, the programme provided technical assistance to implement the objectives of the programme.
In the funding period 2007-2013, the EU also funded cross-border cooperation between Jihozápad and the Ger-
man NUTS 1 region Bavaria. The programme focused on the development of the common labour market and
economy, especially tourism. A second priority was to protect the environment. Approximately 62.5 % of the
total funds of EUR 135 million were invested in the first objective, 37.5 % in the latter.
75
Conclusion
The case study has shown that in terms of trade Jihozápad is one of the highly specialised Eastern European and
less developed regions, respectively. The three medium-high- and high-tech industries in question are manufac-
ture of machinery and equipment, manufacture of office machinery and computers, and manufacture of motor
vehicles, trailers and semi-trailers. In the automotive industry in particular, the region has experienced a dynamic
development in terms of exports and employment during the last decade. This can mainly be attributed to the fact
that the largest Czech automotive manufacturer, Škoda, is located in the region. Furthermore, the region com-
mands a dense supply industry. Here, the region certainly benefits from its engineering tradition and its favour-
able location on the border to Germany and Austria. Hence, after 1990, the region could attract large foreign
direct investments, especially from Germany. The export-prone regional industries also benefit from the depreci-
ating Czech koruna. The regional industry, thus, relies to a large extend on foreign direct investments. The re-
gional innovation system is quite underdeveloped, as indicated by comparatively low regional R&D expendi-
tures as well as an underdeveloped innovation infrastructure.
As the empirical results suggest, locations providing cluster structures, strong R&D engagement of HEIs and
favourable policy conditions are the most relevant features correlating with trade specialisation in these indus-
tries. The structures found in Jihozápad meet these requirements only to some extent. On the one hand, there is a
clear policy commitment towards FDI-based growth. The grewn up clusters are the most important consequence
resulting from this policy. On the other hand, impulses from HEIs are not that pronounced as the empirical
model suggests. Furthermore, the dependency on decisions made in the headquarters of the multinational com-
panies in these industries needs to be overcome. Since these industries are equally present in more developed
regions but under very different conditions, their part in the value chains is a less sustainable one than the tech-
nology level of the industries suggests. This is reflected, e.g., by the lower importance of innovation output (pat-
ents) and a broad firm base (innovation participation of SMEs). Therefore, the development of endogenous po-
tentials stemming from complementary universities and a more dynamic business demography should be the
next step of the restructuring process.
76
Table 4.12. Stylised industry-specific regression results for Jihozápad
Full sample
Less developed regions
Note: * p<0.1, ** p<0.05, *** p<0.01. Manufacture of machinery and equipment n.e.c. (29), Manufacture of office machin-
ery and computers (30), Manufacture of motor vehicles, trailers and semi-trailers (34). Control variables for bordering and
seaside location. Source: own calculations.
4.2.6. Middle Franconia
Regional Background Information
Middle Franconia is located in the west of Bavaria, and is known as a prosperous Bavarian region. Comprising
the cities of Nuremberg, Erlangen and Fürth, Middle Franconia is one of the ten strongest technology regions in
Germany (Regierung Mittelfranken, 2014). The regional population amounts to 1.7 million inhabitants (2011),
representing 2.1 % of Germany’s population. The high poulation density (326 inhabitants per km²) corresponds
to the region’s classification as an agglomeration region (BBRS). The largest regional city is Nuremberg with a
population of 498,900 inhabitants. The regional GDP per capita in Middle Franconia is markedly higher than the
EU average (EUR 33,000 vs. EUR 27,300) but similar to the national reference value (Germany: EUR 32,600).
In the EU funding period 2014-2012 the regions counts among the advanced regions. Following the unification
of Germany and the expansion of the European Union to the East, Middle Franconia is now located in the centre
of the European single market. Given its geographic location close to the border to the East European Member
RXA (gross exports) 29 30 34
(log) patent intensity -0.066 1.376 *** -0.699
(log) techn. innov., SMEs 8.621 -23.853 -15.365
(log) non-techn. innov, SMEs -17.662 * -20.984 -8.432
tertiary educ. < 35 yrs. -0.287 -0.282 0.289
(log) HERD 8.140 * 17.693 *** 15.255 ***
(log) BERD 0.039 2.867 -1.687
GDP per capita 0.000 0.000 0.000
(log) population density -9.884 ** 1.827 -7.907
cluster 32.625 *** 9.338 48.705 ***
business services 3.823 2.460 -15.138
ERDF innovation 0.655 *** -0.210 -0.151
(log) quality of governm. -2.210 44.922 *** 26.288 **
accessibility index 0.375 * 0.646 * 0.858 **
R2_within 0.018 0.039 0.043
R2_between 0.336 0.302 0.228
R2_overall 0.263 0.234 0.190
No. of observations 2,800 2,800 2,800
No. of clusters 250 250 250
sf1 / p29 sf1 / p30 sf1 / p34 sf1 / p35
(log) patent intensity -6.529 -7.422 -2.797
(log) techn. innov., SMEs -1.394 -72.390 *** -93.561 ***
(log) non-techn. innov, SMEs -16.861 17.252 62.605 ***
tertiary educ. < 35 yrs. -0.613 3.614 *** -0.060
(log) HERD 1.526 9.549 * 11.409
(log) BERD 6.562 * -1.286 -5.718
GDP per capita 0.003 0.014 *** 0.009 ***
(log) population density 27.259 * 6.804 67.462 **
cluster 9.906 158.860 *** 26.238 ***
business services 27.412 -5.243 19.094
ERDF innovation 1.774 *** 3.134 ** -1.199
(log) quality of governm. -8.348 31.487 87.463 ***
accessibility index -0.677 ** 1.686 ** 1.284
R2_within 0.037 0.397 0.239
R2_between 0.454 0.441 0.547
R2_overall 0.351 0.414 0.479
No. of observations 674 674 674
No. of clusters 60 60 60
77
States, in 2005, the conference of ministers for regional planning therefore decided to admit the Greater
Nuremberg area to the group of European metropolitan regions in Germany (Nehm and Veres-Homm, 2012).
Middle Franconia is still largely dominated by its traditionally strong industrial sector, although the employment
share of the industrial sector has declined from 32.2 % in 2000 to 23.5 % in 2013. The region’s traditional
industries such as electrical technology and machinery manufacturing, are still of high importance. Based upon
initial strengths in electrical and mechanical engineering after World War II , the development in the last decade
carved the way to a knowledge-based region (Heidenreich and Miljak, 2004). Other competitive industries
include transportation and automation technology, medical technology, chemical, plastics processing, printing,
sports equipment and food processing industry. Due to its central distribution location in Southern Germany and
as a gateway to Southeast Europe, also the logistics industry in Middle Franconia has started to flourish in recent
years. The historically grown business landscape is characterised by several large enterprises and units of
German multinationals such as Siemens, Schaeffler, Bosch, AEG, MAN and Diehl. Hence, more than 30 % of
the regional employees work in firms with more than 1000 employees.
The region’s main university is the Friedrich-Alexander University with its two campuses in Nuremberg and
Erlangen. With approximately 40,000 students, it is the tenth largest university in Germany. The Friedrich-
Alexander University is known for its strong focus in natural sciences, engineering, and medicine.
Selected Industries
International Trade
The region reveals above-average trade specialisation indicators (RXA and RCA) in four manufacturing
industries: namely the rubber and plastic production industry (NACE Rev. 1.1 25), manufacturing of machinery
and equipment (29), manufacturing of electrical machinery and apparatus (31), and manufacturing of medical
precision and optical instruments, watches and clocks (33). In these industries, Middle Franconia does not only
reveal export advantages compared to the EU but also compared to the German average (Figure 4.6).
Furthermore, in all four industries, the region has continuously realised export volumes above the EU average in
the period 2000 to 2011. Particularly the regional medical industry shows an especially strong trade performance
in both the regional RCA and RXA values (Figure 4.6). In this industry, the RCA of 91 in Middle Franconia in
2011 exceeds by far the national and EU reference values (20 and 5, respectively). The region’s electrical
machinery industry also reveals comparatively high indicator values that continuously increased during the
period 2000 to 2011: from 39 to 67 (RCA), and from 70 to 107 in the case of the RXA. Thus, in terms of RXA,
the machinery industry even exceeded the medical industry in 2011.
In contrast to the electrical machinery industry, the machinery industry shows a moderate downward trend in
terms of trade specialisation. Both the regional RCA and RXA values decreased between 2000 and 2011 but still
exceeded the reference values and thresholds selected for the case study (see Figure 4.6). While the RCA
decreased from a value of 58 in 2000 to a value of 49 in 2011, the RXA decreased from 46 to 39 in the same
years. The machinery industry in Middle Franconia, thus, has lost some ground compared to its competitors.
The fourth industry in which the region of Middle Franconia shows an above-average trade specialisation is the
rubber and plastic producing industry. Here, the region certainly benfits from its formerly strong regional
performance. However, similar to the machinery industry, the regional RCA and RXA declined during the years
2000 to 2011 (Figure 4.6).
Employment and Patent Intensity
The downward trend in trade specialisation in both the regional rubber and plastic producing industry and the
machinery industry is also reflected in declining employment in both industries (Table 4.13). Employment shares
also decreased in the electronical machinery industry from 5.4 % in 2000 to 2.9 % in 2013, in the machinery
industry from 2.2 % in 2000 to a share of 1.3 % in 2013.
In contrast, in the medical industry, employment shares increased from 2000 to 2013 (Table 4.13). The strong
position of this industry in Middle Franconia is reflected in the comparatively high number of 130 patents per
10,000 employees. Yet, this figure is lower than 10 years before. This nominal decrease in patent intensity since
2000-02 (198) should, however, not be overinterpreted since the number of patents during that time nearly
doubled and employment just increased at a higher rate than patents. In the remaining three industries of interest
patent intensity significantly increased between 2000 and 2011 while employment was reduced. This may
indicate a structural shift towards tasks and functions of higher strategic importance (such as R&D and
headquarter functions responsible for market exploitation). This becomes especially visible in the machinery
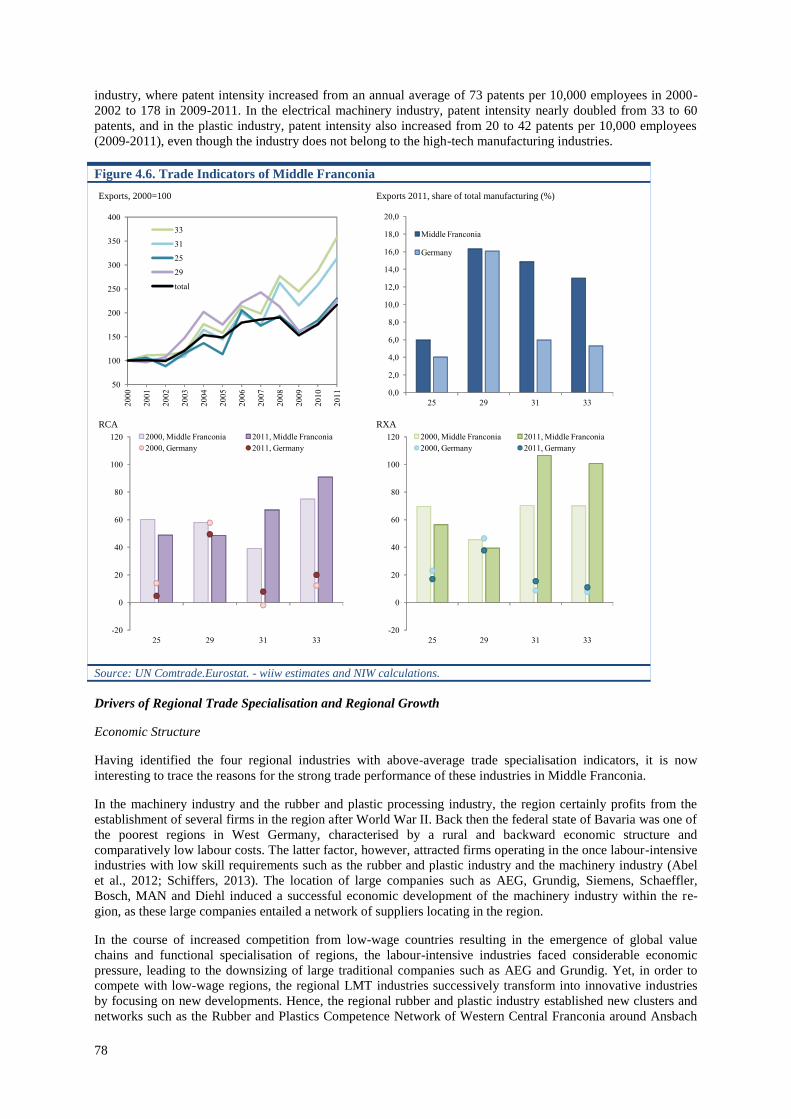
78
industry, where patent intensity increased from an annual average of 73 patents per 10,000 employees in 2000-
2002 to 178 in 2009-2011. In the electrical machinery industry, patent intensity nearly doubled from 33 to 60
patents, and in the plastic industry, patent intensity also increased from 20 to 42 patents per 10,000 employees
(2009-2011), even though the industry does not belong to the high-tech manufacturing industries.
Figure 4.6. Trade Indicators of Middle Franconia
Source: UN Comtrade.Eurostat. - wiiw estimates and NIW calculations.
Drivers of Regional Trade Specialisation and Regional Growth
Economic Structure
Having identified the four regional industries with above-average trade specialisation indicators, it is now
interesting to trace the reasons for the strong trade performance of these industries in Middle Franconia.
In the machinery industry and the rubber and plastic processing industry, the region certainly profits from the
establishment of several firms in the region after World War II. Back then the federal state of Bavaria was one of
the poorest regions in West Germany, characterised by a rural and backward economic structure and
comparatively low labour costs. The latter factor, however, attracted firms operating in the once labour-intensive
industries with low skill requirements such as the rubber and plastic industry and the machinery industry (Abel
et al., 2012; Schiffers, 2013). The location of large companies such as AEG, Grundig, Siemens, Schaeffler,
Bosch, MAN and Diehl induced a successful economic development of the machinery industry within the re-
gion, as these large companies entailed a network of suppliers locating in the region.
In the course of increased competition from low-wage countries resulting in the emergence of global value
chains and functional specialisation of regions, the labour-intensive industries faced considerable economic
pressure, leading to the downsizing of large traditional companies such as AEG and Grundig. Yet, in order to
compete with low-wage regions, the regional LMT industries successively transform into innovative industries
by focusing on new developments. Hence, the regional rubber and plastic industry established new clusters and
networks such as the Rubber and Plastics Competence Network of Western Central Franconia around Ansbach
Exports, 2000=100 Exports 2011, share of total manufacturing (%)
RCA RXA
50
100
150
200
250
300
350
400
20
00
20
01
20
02
20
03
20
04
20
05
20
06
20
07
20
08
20
09
20
10
20
11
33
31
25
29
total
0,0
2,0
4,0
6,0
8,0
10,0
12,0
14,0
16,0
18,0
20,0
25 29 31 33
Middle Franconia
Germany
-20
0
20
40
60
80
100
120
25 29 31 33
2000, Middle Franconia 2011, Middle Franconia
2000, Germany 2011, Germany
-20
0
20
40
60
80
100
120
25 29 31 33
2000, Middle Franconia 2011, Middle Franconia
2000, Germany 2011, Germany
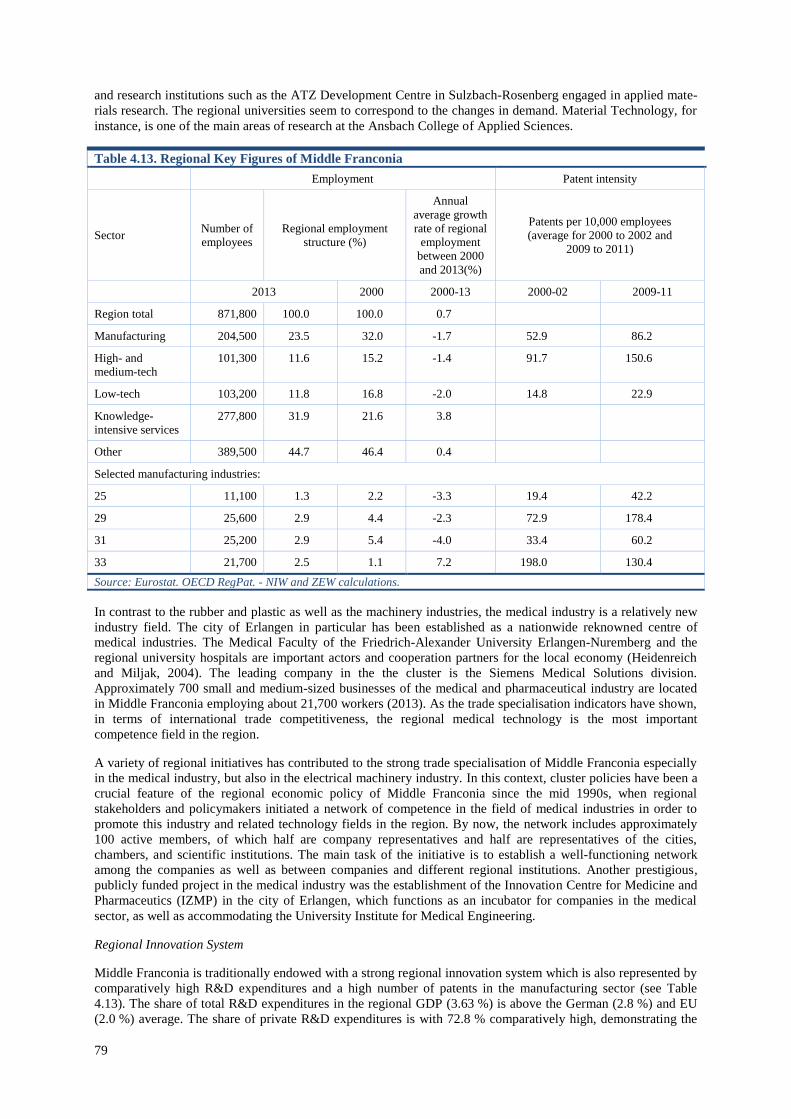
79
and research institutions such as the ATZ Development Centre in Sulzbach-Rosenberg engaged in applied mate-
rials research. The regional universities seem to correspond to the changes in demand. Material Technology, for
instance, is one of the main areas of research at the Ansbach College of Applied Sciences.
Table 4.13. Regional Key Figures of Middle Franconia
Employment Patent intensity
Sector Number of
employees
Regional employment
structure (%)
Annual
average growth
rate of regional
employment
between 2000
and 2013(%)
Patents per 10,000 employees
(average for 2000 to 2002 and
2009 to 2011)
2013 2000 2000-13 2000-02 2009-11
Region total 871,800 100.0 100.0 0.7
Manufacturing 204,500 23.5 32.0 -1.7 52.9 86.2
High- and
medium-tech
101,300 11.6 15.2 -1.4 91.7 150.6
Low-tech 103,200 11.8 16.8 -2.0 14.8 22.9
Knowledge-
intensive services
277,800 31.9 21.6 3.8
Other 389,500 44.7 46.4 0.4
Selected manufacturing industries:
25 11,100 1.3 2.2 -3.3 19.4 42.2
29 25,600 2.9 4.4 -2.3 72.9 178.4
31 25,200 2.9 5.4 -4.0 33.4 60.2
33 21,700 2.5 1.1 7.2 198.0 130.4
Source: Eurostat. OECD RegPat. - NIW and ZEW calculations.
In contrast to the rubber and plastic as well as the machinery industries, the medical industry is a relatively new
industry field. The city of Erlangen in particular has been established as a nationwide reknowned centre of
medical industries. The Medical Faculty of the Friedrich-Alexander University Erlangen-Nuremberg and the
regional university hospitals are important actors and cooperation partners for the local economy (Heidenreich
and Miljak, 2004). The leading company in the the cluster is the Siemens Medical Solutions division.
Approximately 700 small and medium-sized businesses of the medical and pharmaceutical industry are located
in Middle Franconia employing about 21,700 workers (2013). As the trade specialisation indicators have shown,
in terms of international trade competitiveness, the regional medical technology is the most important
competence field in the region.
A variety of regional initiatives has contributed to the strong trade specialisation of Middle Franconia especially
in the medical industry, but also in the electrical machinery industry. In this context, cluster policies have been a
crucial feature of the regional economic policy of Middle Franconia since the mid 1990s, when regional
stakeholders and policymakers initiated a network of competence in the field of medical industries in order to
promote this industry and related technology fields in the region. By now, the network includes approximately
100 active members, of which half are company representatives and half are representatives of the cities,
chambers, and scientific institutions. The main task of the initiative is to establish a well-functioning network
among the companies as well as between companies and different regional institutions. Another prestigious,
publicly funded project in the medical industry was the establishment of the Innovation Centre for Medicine and
Pharmaceutics (IZMP) in the city of Erlangen, which functions as an incubator for companies in the medical
sector, as well as accommodating the University Institute for Medical Engineering.
Regional Innovation System
Middle Franconia is traditionally endowed with a strong regional innovation system which is also represented by
comparatively high R&D expenditures and a high number of patents in the manufacturing sector (see Table
4.13). The share of total R&D expenditures in the regional GDP (3.63 %) is above the German (2.8 %) and EU
(2.0 %) average. The share of private R&D expenditures is with 72.8 % comparatively high, demonstrating the
80
innovativeness of regional firms. Another 17.6 % of regional R&D expenditures are attributed to the regional
universities, whereas the share of public R&D expenditures accounts for 9.4 %.
The region’s main university is the Friedrich-Alexander University Erlangen-Nuremberg with its two campuses
in Nuremberg and Erlangen. Other regional university-level institutions include the University of Applied
Sciences in Ansbach, the University of Applied Sciences in Nuremberg and the University of Applied Science in
Weihenstephan-Triesdorf. Especially the Ansbach University of Applied Sciences with its strong engeneering
department has been heavily funded by the Bavarian government. Its research focus is based on the current
market demand for highly qualified engineers, especially in the machinery and electrical machinery industry.
With the Medical Faculty of the Friedrich-Alexander University already being a very important research and
teaching centre and the growing importance of the electrometric division of Siemens, numerous smaller
companies have developed in the field over the past decade. Together, the regional universities provide a strong
pool of highly qualified human capital that match the demands of the regional industries.
The strong regional knowledge base is also visible in terms of the skilled employment share. In 2013, nearly
280,000 people were employeed in knowledge-intensive services (KIS), representing one third of total regional
employment. Compared to 2000, KIS employment rose by 10 percentage points. The regional share of human
resources with tertiary education is 26.8 %, twice as high as the German average (13 %). Yet, the share of human
resources with a tertiary education among the 30- to 34-year-old population amounts to 30.6 %, which is still
lower than in other German regions.
Political Context and Regional Growth Policies
In the case of Middle Franconia, the federal state of Bavaria is the relevant federal level for regional policy. The
federal state is responsible for setting up regional growth strategies and the operational programme for the EU
structural funds. In the last decade, the federal state of Bavaria has established a variety of regional growth
policies aiming to foster innovation and establish technological competence. The region of Middle Franconia has
been massively addressed by these measures, especially the ‘High-Tech-Offensive’ established by the Bavarian
government in 2000. This initiative, which was cross-financed by revenues from privatisation, aimed at
sustainable investments and innovations in order to improve the competitiveness of the Bavarian economy.
Investments included research and technology projects, promoting educational participation at the regional level
as well as start-up initiatives, and measures to exploit new markets. The Bavaria Cluster Offensive is another
policy imitative that supports cooperation between universities, research institutes and business.
Given the strong regional support programmes, the European Structural funds only play a subordinate role in
Middle Franconis. Yet when looking at the allocation of the European Regional Development Fund (ERDF) by
thematic priority, it becomes evident that in the funding period 2007-2013, the vast majority of funds were
allocated to research and development, technological progress, and regional innovativeness. Hence, the region
focuses its resources on very sustainable, and future-oriented objectives, following the motto ‘strengthen the
strengths’.
Conclusion
The case study has shown that Middle Franconia is an advanced European region with a strong regional
knowledge base, not at least reflected by high levels of R&D expenditures, several universities and research
institutes and a high share of high-skilled human ressources. All these factors contribute to the comparatively
strong economic performance of Middle Franconia. In terms of trade specialisation, the regional RCAs and
RXAs have shown that the region is specialised in both traditionally labour-intensive low-technology industries
(i.e. rubber and plastic industry) as well as in high-technology industries such as the machinery, electrical and
medical industries. In the traditional industries, the region seems to succeed in engaging in new growth paths
characterised by flexibility and innovation, rather than large-scale production. In the relatively new medical
industry, the region has clearly benefited from public support programmes aiming to establish this industry
within the region. Furthermore, the large and prestigious medical department of the Friedrich-Alexander-
University Erlangen-Nuremberg has certainly acted as a pull-factor for firms operating in the medical industry to
locate in the region.
According to the locational requirements for specialisation in the selected industries which are derived from the
econometric analysis, R&D efforts and clustering structures are also in the case study found to play a decisive
role. The supportive function of the business services sector contributes to the international trade performance of
Middle Franconia in the manufacture of medical instruments and machinery and equipment. Skill supply and
SMEs’ innovation behaviour do not show any relevant effects on RXA in the model. However, policy
requirements (innovation focus, governmental quality) of some industries are also met in Middle Franconia.
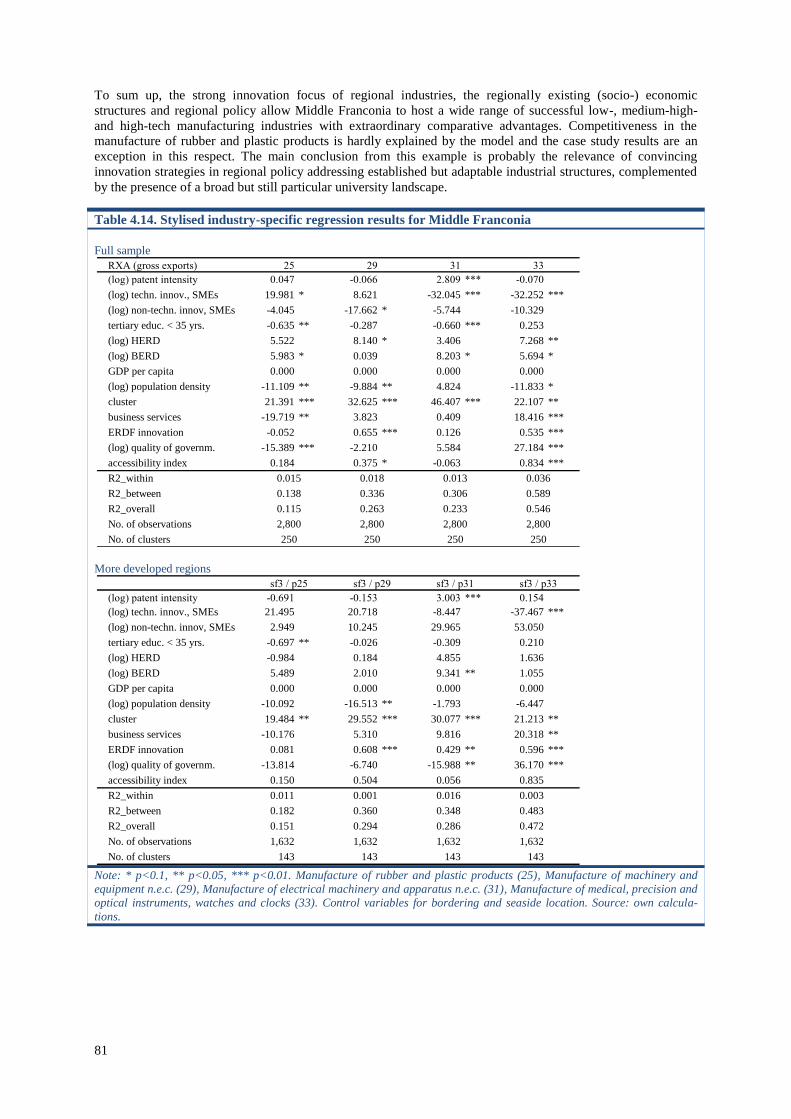
81
To sum up, the strong innovation focus of regional industries, the regionally existing (socio-) economic
structures and regional policy allow Middle Franconia to host a wide range of successful low-, medium-high-
and high-tech manufacturing industries with extraordinary comparative advantages. Competitiveness in the
manufacture of rubber and plastic products is hardly explained by the model and the case study results are an
exception in this respect. The main conclusion from this example is probably the relevance of convincing
innovation strategies in regional policy addressing established but adaptable industrial structures, complemented
by the presence of a broad but still particular university landscape.
Table 4.14. Stylised industry-specific regression results for Middle Franconia
Full sample
More developed regions
Note: * p<0.1, ** p<0.05, *** p<0.01. Manufacture of rubber and plastic products (25), Manufacture of machinery and
equipment n.e.c. (29), Manufacture of electrical machinery and apparatus n.e.c. (31), Manufacture of medical, precision and
optical instruments, watches and clocks (33). Control variables for bordering and seaside location. Source: own calcula-
tions.
RXA (gross exports) 25 29 31 33
(log) patent intensity 0.047 -0.066 2.809 *** -0.070
(log) techn. innov., SMEs 19.981 * 8.621 -32.045 *** -32.252 ***
(log) non-techn. innov, SMEs -4.045 -17.662 * -5.744 -10.329
tertiary educ. < 35 yrs. -0.635 ** -0.287 -0.660 *** 0.253
(log) HERD 5.522 8.140 * 3.406 7.268 **
(log) BERD 5.983 * 0.039 8.203 * 5.694 *
GDP per capita 0.000 0.000 0.000 0.000
(log) population density -11.109 ** -9.884 ** 4.824 -11.833 *
cluster 21.391 *** 32.625 *** 46.407 *** 22.107 **
business services -19.719 ** 3.823 0.409 18.416 ***
ERDF innovation -0.052 0.655 *** 0.126 0.535 ***
(log) quality of governm. -15.389 *** -2.210 5.584 27.184 ***
accessibility index 0.184 0.375 * -0.063 0.834 ***
R2_within 0.015 0.018 0.013 0.036
R2_between 0.138 0.336 0.306 0.589
R2_overall 0.115 0.263 0.233 0.546
No. of observations 2,800 2,800 2,800 2,800
No. of clusters 250 250 250 250
sf3 / p25 sf3 / p29 sf3 / p31 sf3 / p33 sf3 / p34
(log) patent intensity -0.691 -0.153 3.003 *** 0.154
(log) techn. innov., SMEs 21.495 20.718 -8.447 -37.467 ***
(log) non-techn. innov, SMEs 2.949 10.245 29.965 53.050
tertiary educ. < 35 yrs. -0.697 ** -0.026 -0.309 0.210
(log) HERD -0.984 0.184 4.855 1.636
(log) BERD 5.489 2.010 9.341 ** 1.055
GDP per capita 0.000 0.000 0.000 0.000
(log) population density -10.092 -16.513 ** -1.793 -6.447
cluster 19.484 ** 29.552 *** 30.077 *** 21.213 **
business services -10.176 5.310 9.816 20.318 **
ERDF innovation 0.081 0.608 *** 0.429 ** 0.596 ***
(log) quality of governm. -13.814 -6.740 -15.988 ** 36.170 ***
accessibility index 0.150 0.504 0.056 0.835
R2_within 0.011 0.001 0.016 0.003
R2_between 0.182 0.360 0.348 0.483
R2_overall 0.151 0.294 0.286 0.472
No. of observations 1,632 1,632 1,632 1,632
No. of clusters 143 143 143 143
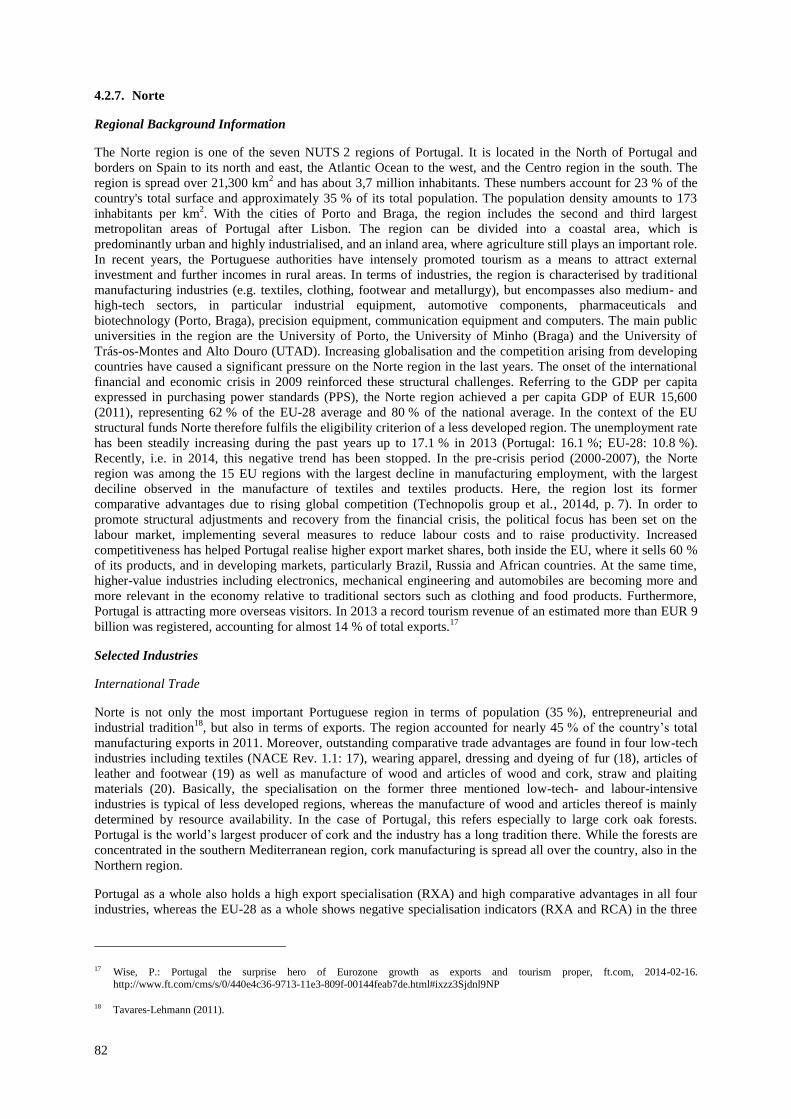
82
4.2.7. Norte
Regional Background Information
The Norte region is one of the seven NUTS 2 regions of Portugal. It is located in the North of Portugal and
borders on Spain to its north and east, the Atlantic Ocean to the west, and the Centro region in the south. The
region is spread over 21,300 km2 and has about 3,7 million inhabitants. These numbers account for 23 % of the
country's total surface and approximately 35 % of its total population. The population density amounts to 173
inhabitants per km2. With the cities of Porto and Braga, the region includes the second and third largest
metropolitan areas of Portugal after Lisbon. The region can be divided into a coastal area, which is
predominantly urban and highly industrialised, and an inland area, where agriculture still plays an important role.
In recent years, the Portuguese authorities have intensely promoted tourism as a means to attract external
investment and further incomes in rural areas. In terms of industries, the region is characterised by traditional
manufacturing industries (e.g. textiles, clothing, footwear and metallurgy), but encompasses also medium- and
high-tech sectors, in particular industrial equipment, automotive components, pharmaceuticals and
biotechnology (Porto, Braga), precision equipment, communication equipment and computers. The main public
universities in the region are the University of Porto, the University of Minho (Braga) and the University of
Trás-os-Montes and Alto Douro (UTAD). Increasing globalisation and the competition arising from developing
countries have caused a significant pressure on the Norte region in the last years. The onset of the international
financial and economic crisis in 2009 reinforced these structural challenges. Referring to the GDP per capita
expressed in purchasing power standards (PPS), the Norte region achieved a per capita GDP of EUR 15,600
(2011), representing 62 % of the EU-28 average and 80 % of the national average. In the context of the EU
structural funds Norte therefore fulfils the eligibility criterion of a less developed region. The unemployment rate
has been steadily increasing during the past years up to 17.1 % in 2013 (Portugal: 16.1 %; EU-28: 10.8 %).
Recently, i.e. in 2014, this negative trend has been stopped. In the pre-crisis period (2000-2007), the Norte
region was among the 15 EU regions with the largest decline in manufacturing employment, with the largest
deciline observed in the manufacture of textiles and textiles products. Here, the region lost its former
comparative advantages due to rising global competition (Technopolis group et al., 2014d, p. 7). In order to
promote structural adjustments and recovery from the financial crisis, the political focus has been set on the
labour market, implementing several measures to reduce labour costs and to raise productivity. Increased
competitiveness has helped Portugal realise higher export market shares, both inside the EU, where it sells 60 %
of its products, and in developing markets, particularly Brazil, Russia and African countries. At the same time,
higher-value industries including electronics, mechanical engineering and automobiles are becoming more and
more relevant in the economy relative to traditional sectors such as clothing and food products. Furthermore,
Portugal is attracting more overseas visitors. In 2013 a record tourism revenue of an estimated more than EUR 9
billion was registered, accounting for almost 14 % of total exports.17
Selected Industries
International Trade
Norte is not only the most important Portuguese region in terms of population (35 %), entrepreneurial and
industrial tradition18
, but also in terms of exports. The region accounted for nearly 45 % of the country’s total
manufacturing exports in 2011. Moreover, outstanding comparative trade advantages are found in four low-tech
industries including textiles (NACE Rev. 1.1: 17), wearing apparel, dressing and dyeing of fur (18), articles of
leather and footwear (19) as well as manufacture of wood and articles of wood and cork, straw and plaiting
materials (20). Basically, the specialisation on the former three mentioned low-tech- and labour-intensive
industries is typical of less developed regions, whereas the manufacture of wood and articles thereof is mainly
determined by resource availability. In the case of Portugal, this refers especially to large cork oak forests.
Portugal is the world’s largest producer of cork and the industry has a long tradition there. While the forests are
concentrated in the southern Mediterranean region, cork manufacturing is spread all over the country, also in the
Northern region.
Portugal as a whole also holds a high export specialisation (RXA) and high comparative advantages in all four
industries, whereas the EU-28 as a whole shows negative specialisation indicators (RXA and RCA) in the three
17 Wise, P.: Portugal the surprise hero of Eurozone growth as exports and tourism proper, ft.com, 2014-02-16.
http://www.ft.com/cms/s/0/440e4c36-9713-11e3-809f-00144feab7de.html#ixzz3Sjdnl9NP
18 Tavares-Lehmann (2011).
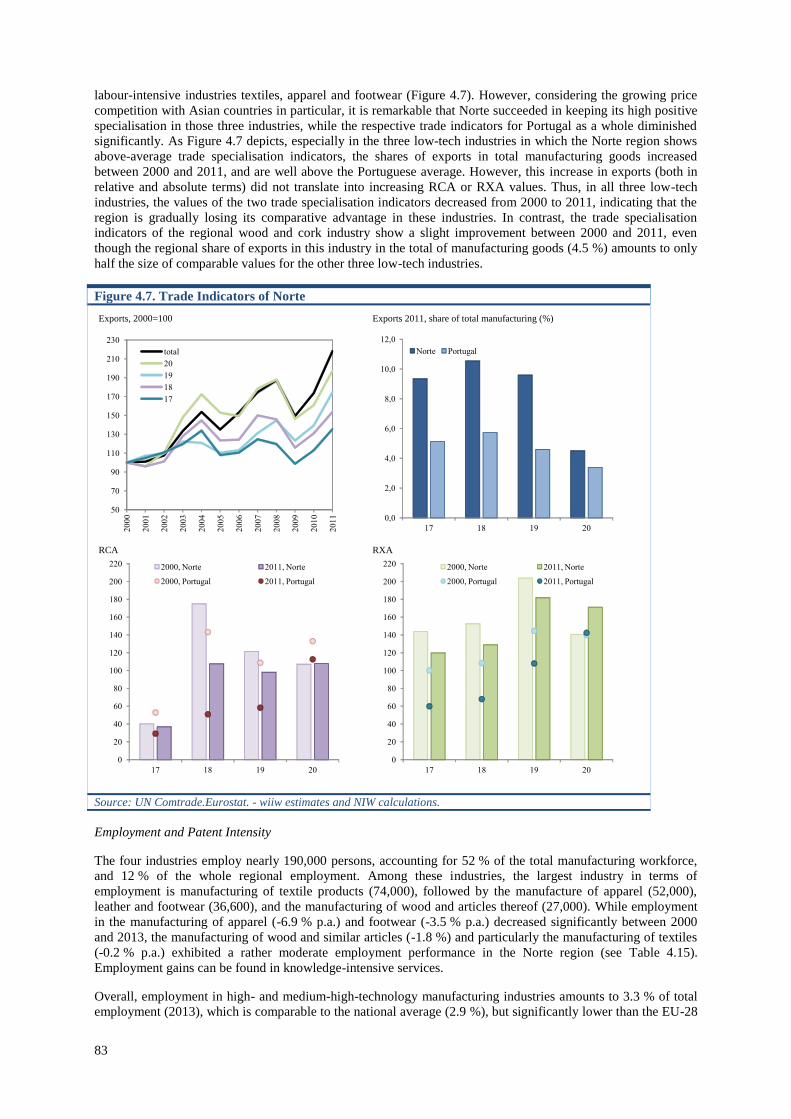
83
labour-intensive industries textiles, apparel and footwear (Figure 4.7). However, considering the growing price
competition with Asian countries in particular, it is remarkable that Norte succeeded in keeping its high positive
specialisation in those three industries, while the respective trade indicators for Portugal as a whole diminished
significantly. As Figure 4.7 depicts, especially in the three low-tech industries in which the Norte region shows
above-average trade specialisation indicators, the shares of exports in total manufacturing goods increased
between 2000 and 2011, and are well above the Portuguese average. However, this increase in exports (both in
relative and absolute terms) did not translate into increasing RCA or RXA values. Thus, in all three low-tech
industries, the values of the two trade specialisation indicators decreased from 2000 to 2011, indicating that the
region is gradually losing its comparative advantage in these industries. In contrast, the trade specialisation
indicators of the regional wood and cork industry show a slight improvement between 2000 and 2011, even
though the regional share of exports in this industry in the total of manufacturing goods (4.5 %) amounts to only
half the size of comparable values for the other three low-tech industries.
Figure 4.7. Trade Indicators of Norte
Source: UN Comtrade.Eurostat. - wiiw estimates and NIW calculations.
Employment and Patent Intensity
The four industries employ nearly 190,000 persons, accounting for 52 % of the total manufacturing workforce,
and 12 % of the whole regional employment. Among these industries, the largest industry in terms of
employment is manufacturing of textile products (74,000), followed by the manufacture of apparel (52,000),
leather and footwear (36,600), and the manufacturing of wood and articles thereof (27,000). While employment
in the manufacturing of apparel (-6.9 % p.a.) and footwear (-3.5 % p.a.) decreased significantly between 2000
and 2013, the manufacturing of wood and similar articles (-1.8 %) and particularly the manufacturing of textiles
(-0.2 % p.a.) exhibited a rather moderate employment performance in the Norte region (see Table 4.15).
Employment gains can be found in knowledge-intensive services.
Overall, employment in high- and medium-high-technology manufacturing industries amounts to 3.3 % of total
employment (2013), which is comparable to the national average (2.9 %), but significantly lower than the EU-28
Exports, 2000=100 Exports 2011, share of total manufacturing (%)
RCA RXA
50
70
90
110
130
150
170
190
210
230
20
00
20
01
20
02
20
03
20
04
20
05
20
06
20
07
20
08
20
09
20
10
20
11
total
20
19
18
17
0,0
2,0
4,0
6,0
8,0
10,0
12,0
17 18 19 20
Norte Portugal
0
20
40
60
80
100
120
140
160
180
200
220
17 18 19 20
2000, Norte 2011, Norte
2000, Portugal 2011, Portugal
0
20
40
60
80
100
120
140
160
180
200
220
17 18 19 20
2000, Norte 2011, Norte
2000, Portugal 2011, Portugal
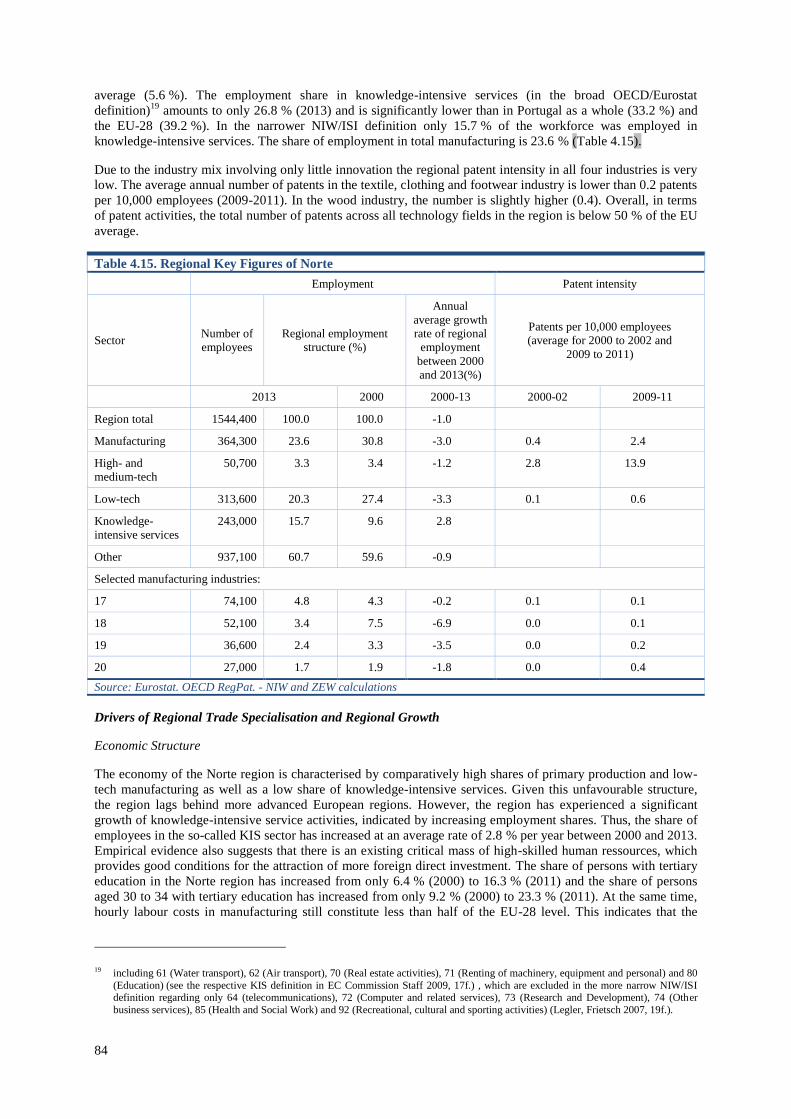
84
average (5.6 %). The employment share in knowledge-intensive services (in the broad OECD/Eurostat
definition)19
amounts to only 26.8 % (2013) and is significantly lower than in Portugal as a whole (33.2 %) and
the EU-28 (39.2 %). In the narrower NIW/ISI definition only 15.7 % of the workforce was employed in
knowledge-intensive services. The share of employment in total manufacturing is 23.6 % (Table 4.15).
Due to the industry mix involving only little innovation the regional patent intensity in all four industries is very
low. The average annual number of patents in the textile, clothing and footwear industry is lower than 0.2 patents
per 10,000 employees (2009-2011). In the wood industry, the number is slightly higher (0.4). Overall, in terms
of patent activities, the total number of patents across all technology fields in the region is below 50 % of the EU
average.
Table 4.15. Regional Key Figures of Norte
Employment Patent intensity
Sector Number of
employees
Regional employment
structure (%)
Annual
average growth
rate of regional
employment
between 2000
and 2013(%)
Patents per 10,000 employees
(average for 2000 to 2002 and
2009 to 2011)
2013 2000 2000-13 2000-02 2009-11
Region total 1544,400 100.0 100.0 -1.0
Manufacturing 364,300 23.6 30.8 -3.0 0.4 2.4
High- and
medium-tech
50,700 3.3 3.4 -1.2 2.8 13.9
Low-tech 313,600 20.3 27.4 -3.3 0.1 0.6
Knowledge-
intensive services
243,000 15.7 9.6 2.8
Other 937,100 60.7 59.6 -0.9
Selected manufacturing industries:
17 74,100 4.8 4.3 -0.2 0.1 0.1
18 52,100 3.4 7.5 -6.9 0.0 0.1
19 36,600 2.4 3.3 -3.5 0.0 0.2
20 27,000 1.7 1.9 -1.8 0.0 0.4
Source: Eurostat. OECD RegPat. - NIW and ZEW calculations
Drivers of Regional Trade Specialisation and Regional Growth
Economic Structure
The economy of the Norte region is characterised by comparatively high shares of primary production and low-
tech manufacturing as well as a low share of knowledge-intensive services. Given this unfavourable structure,
the region lags behind more advanced European regions. However, the region has experienced a significant
growth of knowledge-intensive service activities, indicated by increasing employment shares. Thus, the share of
employees in the so-called KIS sector has increased at an average rate of 2.8 % per year between 2000 and 2013.
Empirical evidence also suggests that there is an existing critical mass of high-skilled human ressources, which
provides good conditions for the attraction of more foreign direct investment. The share of persons with tertiary
education in the Norte region has increased from only 6.4 % (2000) to 16.3 % (2011) and the share of persons
aged 30 to 34 with tertiary education has increased from only 9.2 % (2000) to 23.3 % (2011). At the same time,
hourly labour costs in manufacturing still constitute less than half of the EU-28 level. This indicates that the
19 including 61 (Water transport), 62 (Air transport), 70 (Real estate activities), 71 (Renting of machinery, equipment and personal) and 80
(Education) (see the respective KIS definition in EC Commission Staff 2009, 17f.) , which are excluded in the more narrow NIW/ISI definition regarding only 64 (telecommunications), 72 (Computer and related services), 73 (Research and Development), 74 (Other
business services), 85 (Health and Social Work) and 92 (Recreational, cultural and sporting activities) (Legler, Frietsch 2007, 19f.).
85
regional industries are still exposed to price and wage competition, presumably with Asian countries. In order to
overcome the limitations in revenue and growth prespectives in these markets, the Portuguese companies in the
textile industry have increasingly transformed themselves by investing in design, technology and branding. In
the world of shoes, ‘Made in Portugal’ is now second only to ‘Made in Italy’ in terms of international prestige
and the factory prices they command.20
The comparatively strong regional trade performance of the textile
industry is also reflected in the cluster activities in this industry. Here, especially the regional footwear and
fashion clusters stand out. Furthermore, the country’s leading Textile and Clothing Technology Centre
(CITEVE) as well as the Footwear Technology Centre (CTC) are located in the Norte region.
In the wood and cork industry, the regional industry certainly profits from the long tradition of the industry in
Portugal in general, and the Norte region in particular. Nowadays the regional cork producers intensely employ
advanced technologies, including lasers, robotics and computer-assisted automation exploiting economies of
scale which were barely imaginable just a decade ago. The cork companies have also reversed their sector's
decline during the first decade of the new century by moving into new markets, such as the emerging economies
of China, Russia and Brazil. They have also diversified from cork stoppers, which suffer from the increasing
application of synthetic bottle closures, into new uses that include home furnishings and construction, footwear
and fashion accessories, and mopping up oil spills with cork grains.21
These innovation strategies are also
reflected in slightly growing patent intensities (patents per 10,000 employees) in this industry (Table 4.15).
Regional Innovation System
Even though the Regional Innovation System is less developed than the RIS in the highly innovative North
European regions, from a Portuguese perspective, Norte ranks second (after the capital region of Lisbon) among
the seven Portuguese regions with respect to its regional R&D expenditures. In 2011, the regional expenditure on
R&D (as a percentage of regional GDP) amounted to 1.5 %, which is equal to the national average, but still
significantly lower than the EU-28 average (2.0 %). Yet, the regional patent intensity in manufacturing is still
extremely low (Table 4.15).
40.6 % of the regional R&D expenditure is accounted for by university-level institutions, another 9.3 % by
private non-profit institutions, and merely 6.2 % by the national government (2011). Norte hosts three main
public universities (University of Porto, University of Minho, and University of Trás-os-Montes e Alto Douro),
several private universities and four public polytechnic institutes. It has also renowned research centres not only
in the traditional low-tech industries such as textile and wood, but also in high- and medium-tech fields such as
nanotechnologies, information and communication technologies, new materials engineering, and the automotive
sector. Another positive recent trend is related to the growing attractiveness of the region in terms of world-class
research and technological development (RTD) units and institutes. Two relevant examples here are the INL –
International Iberian Nanotechnology Laboratory (in Braga), is a joint investment of the Portuguese and Spanish
governments envisaging 200 PhD researchers within a few years, and the European Excellence Institute for
Tissue Engineering and Regenerative Medicine Research (in Guimaraes). The Fraunhofer Institute also
established its first venture outside of Germany in Norte. A recent example of the rationalisation of the network
of RTD institutions was the merger of three RTD institutes (IBMC, INEB and IPATIMUP) to the newly
established Institute for Health Research and Innovation (I3S) in Porto, comprising about 600 researchers.
According to the RIS 2014 report, further positive indicators of the Norte region are the comparatively high
share of SMEs introducing product or process innovations, or in-house innovation activities, each representing
90-120 % of the EU average. In contrast, the cooperation intensity among regional SMEs is quite low.22
Political Context and Regional Growth Policies
Since Portugal is a centralised country (except for the autonomous regions of the Azores and Madeira), the Norte
region is only a territorial administrative subdivision of the country without any relevant political competencies.
Regional development policies are implemented only by representatives of the central government. Furthermore,
the Regional Coordination and Development Committees (CCDR), representing decentralised bodies of the
central government with administrative and financial autonomy, are entitled to implement their own operational
programmes (ROPs) in line with key national policies. The Norte Regional Coordination and Development
20 Wise (2014).
21 Associated Press (2011).
22 Technolopolis et al. (2014a) and European Commission (2015k).
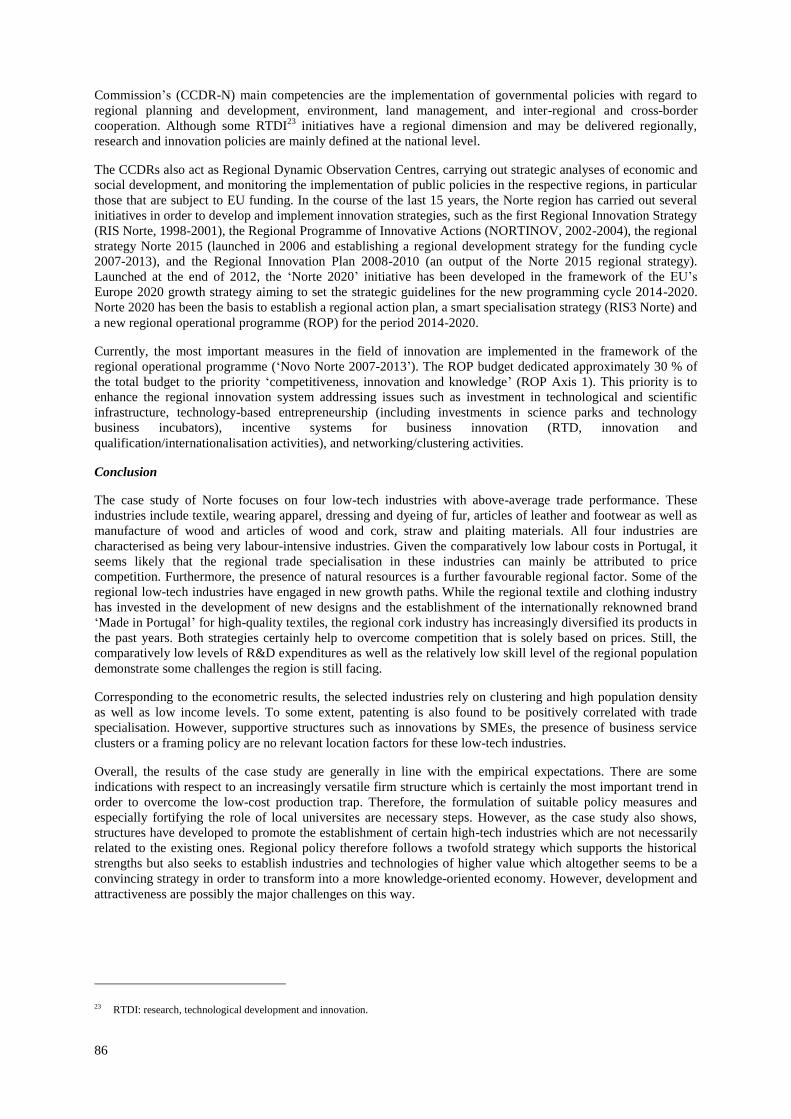
86
Commission’s (CCDR-N) main competencies are the implementation of governmental policies with regard to
regional planning and development, environment, land management, and inter-regional and cross-border
cooperation. Although some RTDI23
initiatives have a regional dimension and may be delivered regionally,
research and innovation policies are mainly defined at the national level.
The CCDRs also act as Regional Dynamic Observation Centres, carrying out strategic analyses of economic and
social development, and monitoring the implementation of public policies in the respective regions, in particular
those that are subject to EU funding. In the course of the last 15 years, the Norte region has carried out several
initiatives in order to develop and implement innovation strategies, such as the first Regional Innovation Strategy
(RIS Norte, 1998-2001), the Regional Programme of Innovative Actions (NORTINOV, 2002-2004), the regional
strategy Norte 2015 (launched in 2006 and establishing a regional development strategy for the funding cycle
2007-2013), and the Regional Innovation Plan 2008-2010 (an output of the Norte 2015 regional strategy).
Launched at the end of 2012, the ‘Norte 2020’ initiative has been developed in the framework of the EU’s
Europe 2020 growth strategy aiming to set the strategic guidelines for the new programming cycle 2014-2020.
Norte 2020 has been the basis to establish a regional action plan, a smart specialisation strategy (RIS3 Norte) and
a new regional operational programme (ROP) for the period 2014-2020.
Currently, the most important measures in the field of innovation are implemented in the framework of the
regional operational programme (‘Novo Norte 2007-2013’). The ROP budget dedicated approximately 30 % of
the total budget to the priority ‘competitiveness, innovation and knowledge’ (ROP Axis 1). This priority is to
enhance the regional innovation system addressing issues such as investment in technological and scientific
infrastructure, technology-based entrepreneurship (including investments in science parks and technology
business incubators), incentive systems for business innovation (RTD, innovation and
qualification/internationalisation activities), and networking/clustering activities.
Conclusion
The case study of Norte focuses on four low-tech industries with above-average trade performance. These
industries include textile, wearing apparel, dressing and dyeing of fur, articles of leather and footwear as well as
manufacture of wood and articles of wood and cork, straw and plaiting materials. All four industries are
characterised as being very labour-intensive industries. Given the comparatively low labour costs in Portugal, it
seems likely that the regional trade specialisation in these industries can mainly be attributed to price
competition. Furthermore, the presence of natural resources is a further favourable regional factor. Some of the
regional low-tech industries have engaged in new growth paths. While the regional textile and clothing industry
has invested in the development of new designs and the establishment of the internationally reknowned brand
‘Made in Portugal’ for high-quality textiles, the regional cork industry has increasingly diversified its products in
the past years. Both strategies certainly help to overcome competition that is solely based on prices. Still, the
comparatively low levels of R&D expenditures as well as the relatively low skill level of the regional population
demonstrate some challenges the region is still facing.
Corresponding to the econometric results, the selected industries rely on clustering and high population density
as well as low income levels. To some extent, patenting is also found to be positively correlated with trade
specialisation. However, supportive structures such as innovations by SMEs, the presence of business service
clusters or a framing policy are no relevant location factors for these low-tech industries.
Overall, the results of the case study are generally in line with the empirical expectations. There are some
indications with respect to an increasingly versatile firm structure which is certainly the most important trend in
order to overcome the low-cost production trap. Therefore, the formulation of suitable policy measures and
especially fortifying the role of local universites are necessary steps. However, as the case study also shows,
structures have developed to promote the establishment of certain high-tech industries which are not necessarily
related to the existing ones. Regional policy therefore follows a twofold strategy which supports the historical
strengths but also seeks to establish industries and technologies of higher value which altogether seems to be a
convincing strategy in order to transform into a more knowledge-oriented economy. However, development and
attractiveness are possibly the major challenges on this way.
23 RTDI: research, technological development and innovation.
87
Table 4.16. Stylised industry-specific regression results for Norte
Full sample
Less developed regions
Note: * p<0.1, ** p<0.05, *** p<0.01. Manufacture of textiles (17), Manufacture of wearing apparel; dressing and dyeing
of fur (18), Tanning and dressing of leather; manufacture of luggage, handbags, saddlery, harness and footwear (19), Manu-
facture of wood and of products of wood and cork, except furniture; manufacture of articles of straw and plaiting materials
(20). Control variables for bordering and seaside location. Source: own calculations.
4.2.8. Overijissel
Regional Background Information
The Dutch region of Overijssel is located in the eastern part of the Netherlands and consists of three regions:
Kop van Overijssel in the northwest, Salland in the centre of the province, and Twente in the east. The largest
cities are the regional capital Zwolle (northwest) and the cities of Almelo, Deventer, Enschede and Hengelo.
Overijssel shares a border with Germany in the east and the Dutch province Gelderland in the South.
With an area of 3,421 km2, Overijssel is the fourth largest province of the Netherlands (8.2 % of total surface).
With about 1.14 million inhabitants (6.7 % of the total Dutch population in 2014), the regional population
density is comparatively high (324 inhabitants per km²).
RXA (gross exports) 17 18 19 20
(log) patent intensity 6.402 9.556 27.153 20.384 *
(log) techn. innov., SMEs 27.861 ** 6.287 -25.277 6.271
(log) non-techn. innov, SMEs 7.527 13.836 19.697 23.315
tertiary educ. < 35 yrs. -1.103 *** 0.049 0.308 -0.590
(log) HERD 1.525 -9.127 * -7.710 5.343 *
(log) BERD -9.059 *** -9.683 * 5.711 -4.404
GDP per capita -0.001 ** -0.001 -0.006 *** 0.000
(log) population density 12.071 ** 33.280 *** -0.596 -33.800 ***
cluster 41.453 *** 77.373 *** 138.388 *** 46.975 ***
business services -5.542 -11.197 0.804 -33.984 **
ERDF innovation 0.281 0.209 0.683 -0.530 *
(log) quality of governm. -28.937 *** -19.340 ** -34.600 ** -2.776
accessibility index -0.077 -0.614 ** 0.893 * -0.163
R2_within 0.065 0.029 0.026 0.004
R2_between 0.407 0.417 0.299 0.532
R2_overall 0.352 0.353 0.240 0.454
No. of observations 2,800 2,800 2,763 2,800
No. of clusters 250 250 250 250
sf1 / p17 sf1 / p18 sf1 / p19 sf1 / p20 sf1 / p21
(log) patent intensity 1.399 312.266 *** 252.980 27.752
(log) techn. innov., SMEs 41.239 *** 53.507 *** -19.350 19.321
(log) non-techn. innov, SMEs -15.798 -26.100 -11.298 -2.604
tertiary educ. < 35 yrs. -0.931 -1.438 * -1.739 -1.394 *
(log) HERD 5.926 4.201 -7.463 4.414
(log) BERD -12.390 *** -12.815 ** -9.180 1.981
GDP per capita -0.005 *** -0.012 *** -0.008 *** -0.002 *
(log) population density 8.845 -1.464 86.210 *** -19.218
cluster 29.797 *** 62.739 *** 122.296 *** 47.767 ***
business services -31.208 -3.994 95.635 -84.878
ERDF innovation 1.643 ** -0.034 1.566 -1.855
(log) quality of governm. -43.495 *** -52.076 *** -24.352 -7.063
accessibility index -0.320 -0.826 * -0.634 -0.059
R2_within 0.298 0.425 0.126 0.090
R2_between 0.537 0.742 0.698 0.564
R2_overall 0.483 0.665 0.570 0.519
No. of observations 674 674 673 674
No. of clusters 60 60 60 60
88
In terms of GDP per capita expressed in purchasing power standards (PPS), Overijssel achieved EUR 28,400 in
2011, representing 113 % of the EU-28 average and 87 % of the national average. Thus, the region is
characterised as an advanced developed region in the EU context. Unemployment (6.7 % in 2013) equals the
national average which is still significantly lower than the EU-28 average (2013: 10.8 %), yet the unemployment
rate has more than doubled since the pre-crisis year 2008 (2.6 %, Netherlands total: 2.8 %).
SMEs play an important role in Overijssel's economy, as 25 % of the workforce are employed in companies with
less than 10 employees and 60 % in companies with less than 100 employees. Trade, healthcare, industry and
construction are the leading economic sectors. The employment share of the manufacturing sector amounted to
14.4 % in 2013. In the same year, the employment share in high- and medium-high-technology manufacturing
industries was 4.3 % of total employment and, thus, significantly higher than the country average (2.8 %), but
also lower than the EU-28 average (5.6 %). In contrast, Overijssel’s employment share in knowledge-intensive
services (in the broad OECD/Eurostat definition)24
amounted to 44.2 % in 2013. Thus, it was lower than the
Dutch average (46.7 %) but significantly higher than the EU-28 average (39.2 %). Following the narrower
NIW/ISI definition 35 % of the workforce was employed in knowledge-intensive services.
Selected Industries
International Trade
Overijssel was selected because it exhibits outstanding comparative trade advantages in three industries, namely
the manufacturing of textiles (NACE Rev. 1.1: 17), the manufacturing of rubber and plastic products (25), and
the manufacturing of office machinery and computers (30). While the first two industries are low-tech industries,
the latter one qualifies as a high-tech industry. In all three industries, the region achieves above-average exports
shares that exceed the national (Dutch) average (Figure 4.8).
Out of the three industries, the highest export share is found for the office machinery and computer industry
(8.1 % in 2011), while the national (Dutch) share was moderately lower (7.4 %). While the regional RXA,
indicating a region’s export specialisation in a certain industry, remained relatively stable between 2000 and
2011, the regional RCA in the office machinery and computer industry decreased from a slightly positive value
in 2000 to a slightly negative value in 2011, indicating that the region no longer holds a comparative advantage
in this industry.
The regional rubber and plastic production industry accounts for a share of 5.3 % in all regional exports of
manufacturing goods, significantly exceeding the Dutch average (3.0 %). When looking at the trade
specialisation indicators, however, it becomes obvious that the region performs below the national average.
Thus, both the regional RCA and the regional RXA in the rubber and plastic industry are below the national
average in 2011. Still, both indicators exhibit positive values, showing that Overijssel is positively specialised in
this industry and realises a comparative advantage in trade.
The textile industry, the third industry where Overijssel shows an above-average trade specialisation, made up
4 % of the regional exports of manufacturing goods. This share is well above the national average of 1.5 %.
When looking at the dynamics, is becomes evident that both trade specialisation indicators (RXA and RCA)
increased between 2000 and 2011, showing positive values. In contrast, the national RXA and RCA values are
negative. This indicates that, as opposed to Overijssel, the Netherlands as a whole is negatively specialised in the
textile industry and holds a comparative disadvantage.
Employment and Patent Intensity
Regarding their employment weight, the three selected industries together employ 9,100 workers, representing
11 % of the total manufacturing workforce, but only 1,6 % of regional employment. More than half of those
(5,000) are employed in the manufacturing of rubber and plastics products, 3,500 in manufacture of textiles, and
only 500 in the manufacturing of office machinery and computers (see Table 4.17).
24 including 61 (Water transport), 62 (Air transport), 70 (Real estate activities), 71 (Renting of machinery, equipment and personal) and 80
(Education) (see the respective KIS definition in EC Commission Staff 2009, 17f.) , which are excluded in the more narrow NIW/ISI
definition regarding only 64 (telecommunications), 72 (Computer and related services), 73 (Research and Development), 74 (Other business services), 85 (Health and Social Work) and 92 (Recreational, cultural and sporting activities) (Legler and Frietsch, 2007, pp.
19f.).
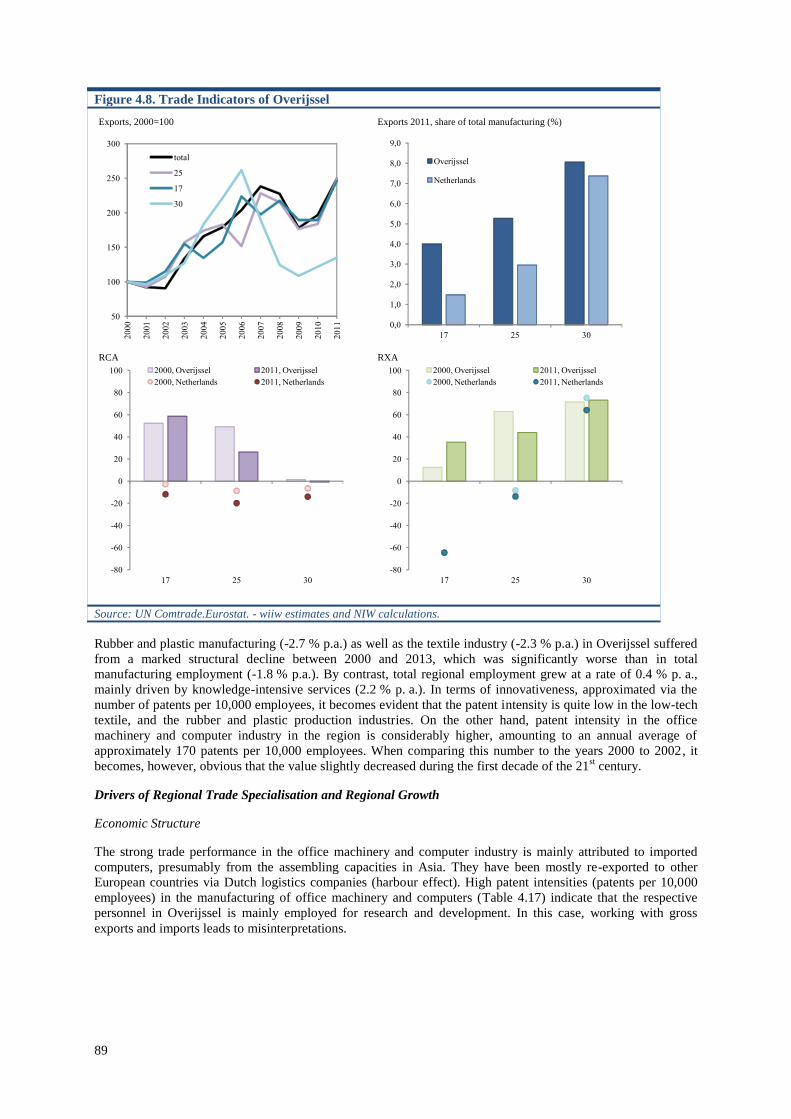
89
Figure 4.8. Trade Indicators of Overijssel
Source: UN Comtrade.Eurostat. - wiiw estimates and NIW calculations.
Rubber and plastic manufacturing (-2.7 % p.a.) as well as the textile industry (-2.3 % p.a.) in Overijssel suffered
from a marked structural decline between 2000 and 2013, which was significantly worse than in total
manufacturing employment (-1.8 % p.a.). By contrast, total regional employment grew at a rate of 0.4 % p. a.,
mainly driven by knowledge-intensive services (2.2 % p. a.). In terms of innovativeness, approximated via the
number of patents per 10,000 employees, it becomes evident that the patent intensity is quite low in the low-tech
textile, and the rubber and plastic production industries. On the other hand, patent intensity in the office
machinery and computer industry in the region is considerably higher, amounting to an annual average of
approximately 170 patents per 10,000 employees. When comparing this number to the years 2000 to 2002, it
becomes, however, obvious that the value slightly decreased during the first decade of the 21st century.
Drivers of Regional Trade Specialisation and Regional Growth
Economic Structure
The strong trade performance in the office machinery and computer industry is mainly attributed to imported
computers, presumably from the assembling capacities in Asia. They have been mostly re-exported to other
European countries via Dutch logistics companies (harbour effect). High patent intensities (patents per 10,000
employees) in the manufacturing of office machinery and computers (Table 4.17) indicate that the respective
personnel in Overijssel is mainly employed for research and development. In this case, working with gross
exports and imports leads to misinterpretations.
Exports, 2000=100 Exports 2011, share of total manufacturing (%)
RCA RXA
50
100
150
200
250
300
20
00
20
01
20
02
20
03
20
04
20
05
20
06
20
07
20
08
20
09
20
10
20
11
total
25
17
30
0,0
1,0
2,0
3,0
4,0
5,0
6,0
7,0
8,0
9,0
17 25 30
Overijssel
Netherlands
-80
-60
-40
-20
0
20
40
60
80
100
17 25 30
2000, Overijssel 2011, Overijssel
2000, Netherlands 2011, Netherlands
-80
-60
-40
-20
0
20
40
60
80
100
17 25 30
2000, Overijssel 2011, Overijssel
2000, Netherlands 2011, Netherlands
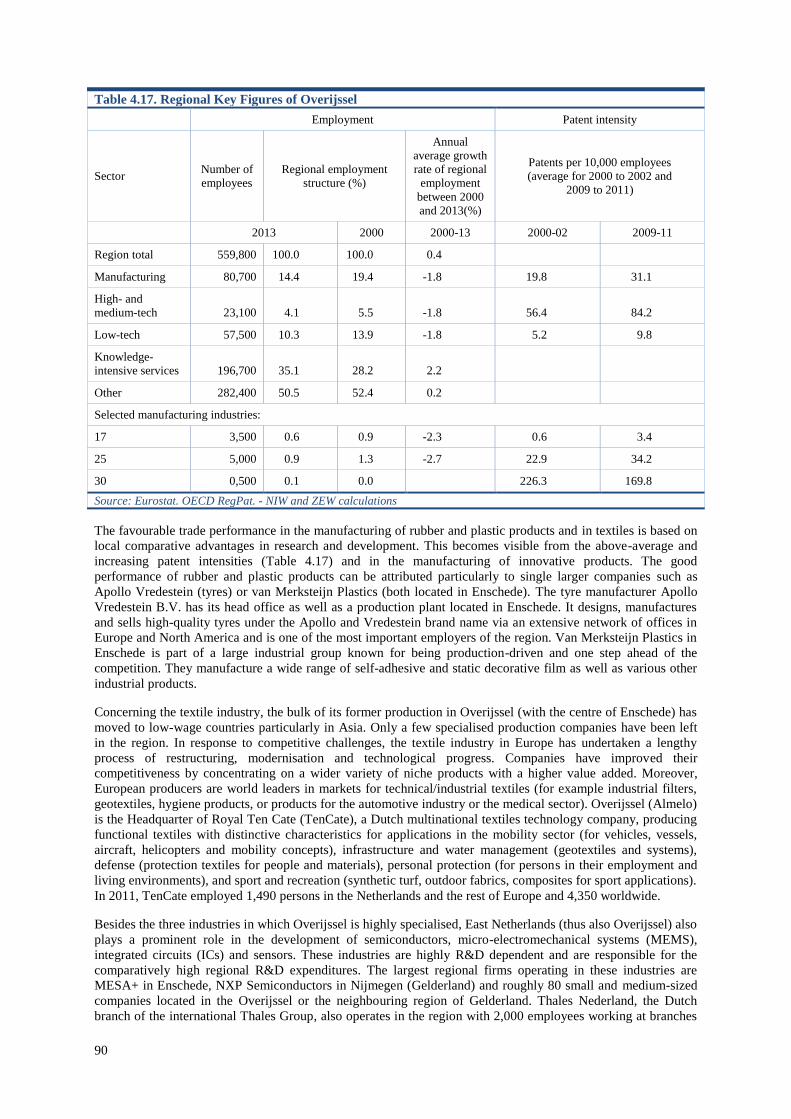
90
Table 4.17. Regional Key Figures of Overijssel
Employment Patent intensity
Sector Number of
employees
Regional employment
structure (%)
Annual
average growth
rate of regional
employment
between 2000
and 2013(%)
Patents per 10,000 employees
(average for 2000 to 2002 and
2009 to 2011)
2013 2000 2000-13 2000-02 2009-11
Region total 559,800 100.0 100.0 0.4
Manufacturing 80,700 14.4 19.4 -1.8 19.8 31.1
High- and
medium-tech 23,100 4.1 5.5 -1.8 56.4 84.2
Low-tech 57,500 10.3 13.9 -1.8 5.2 9.8
Knowledge-
intensive services 196,700 35.1 28.2 2.2
Other 282,400 50.5 52.4 0.2
Selected manufacturing industries:
17 3,500 0.6 0.9 -2.3 0.6 3.4
25 5,000 0.9 1.3 -2.7 22.9 34.2
30 0,500 0.1 0.0 226.3 169.8
Source: Eurostat. OECD RegPat. - NIW and ZEW calculations
The favourable trade performance in the manufacturing of rubber and plastic products and in textiles is based on
local comparative advantages in research and development. This becomes visible from the above-average and
increasing patent intensities (Table 4.17) and in the manufacturing of innovative products. The good
performance of rubber and plastic products can be attributed particularly to single larger companies such as
Apollo Vredestein (tyres) or van Merksteijn Plastics (both located in Enschede). The tyre manufacturer Apollo
Vredestein B.V. has its head office as well as a production plant located in Enschede. It designs, manufactures
and sells high-quality tyres under the Apollo and Vredestein brand name via an extensive network of offices in
Europe and North America and is one of the most important employers of the region. Van Merksteijn Plastics in
Enschede is part of a large industrial group known for being production-driven and one step ahead of the
competition. They manufacture a wide range of self-adhesive and static decorative film as well as various other
industrial products.
Concerning the textile industry, the bulk of its former production in Overijssel (with the centre of Enschede) has
moved to low-wage countries particularly in Asia. Only a few specialised production companies have been left
in the region. In response to competitive challenges, the textile industry in Europe has undertaken a lengthy
process of restructuring, modernisation and technological progress. Companies have improved their
competitiveness by concentrating on a wider variety of niche products with a higher value added. Moreover,
European producers are world leaders in markets for technical/industrial textiles (for example industrial filters,
geotextiles, hygiene products, or products for the automotive industry or the medical sector). Overijssel (Almelo)
is the Headquarter of Royal Ten Cate (TenCate), a Dutch multinational textiles technology company, producing
functional textiles with distinctive characteristics for applications in the mobility sector (for vehicles, vessels,
aircraft, helicopters and mobility concepts), infrastructure and water management (geotextiles and systems),
defense (protection textiles for people and materials), personal protection (for persons in their employment and
living environments), and sport and recreation (synthetic turf, outdoor fabrics, composites for sport applications).
In 2011, TenCate employed 1,490 persons in the Netherlands and the rest of Europe and 4,350 worldwide.
Besides the three industries in which Overijssel is highly specialised, East Netherlands (thus also Overijssel) also
plays a prominent role in the development of semiconductors, micro-electromechanical systems (MEMS),
integrated circuits (ICs) and sensors. These industries are highly R&D dependent and are responsible for the
comparatively high regional R&D expenditures. The largest regional firms operating in these industries are
MESA+ in Enschede, NXP Semiconductors in Nijmegen (Gelderland) and roughly 80 small and medium-sized
companies located in the Overijssel or the neighbouring region of Gelderland. Thales Nederland, the Dutch
branch of the international Thales Group, also operates in the region with 2,000 employees working at branches
91
in Hengelo (HQ), Huizen, Delft, Enschede and Eindhoven. Thales Nederland specialises in designing and
producing professional electronics for defence and security applications, such as radar and communication
systems. It has become the second largest naval radar producer in the world.
Regional Innovation System
Overijssel is endowed with a number of outstanding universities and university-level institutions. The largest
regional university is the University of Twente, which ranks 212 in the QS World University Ranking 2014/15.
The University of Twente is specialised in technology and has an outstanding nanotechnology laboratory in the
MESA+ institute. Together with the City of Enschede, the Region of Twente, the Province of Overijssel and the
Saxion University of Applied Sciences, the university has initiated the Knowledge Park (Kennispark). It is the
largest innovation campus in the Netherlands, with about 400 companies. The campus is second largest in terms
of commercial jobs: 6,300 people work at Kennispark in Enschede, excluding 3,000 scientific positions at the
University of Twente. The initiative supports businesses in all phases of development, startups as well as well-
established companies. It aims at developing new activities at the campus of the Twente University and the
adjacent Business and Science Park. Another initative linked to the University of Twente is the High Tech
Factory, located on the campus of the University of Twente, and accommodating many companies engaged in
high-quality development and production. The production facility is located near the new NanoLab of MESA+,
one of the world’s largest research institutes in the field of nanotechnology. The NanoLab is open to the
companies established in the High Tech Factory. Here researchers work on revelatory ideas, developing
prototypes and even producing small-scale series.
Besides the University of Twente, there are several universities of applied sciences (Hogescholen). Saxion,
located in Enschede, Deventer and Apeldoorn (Gelderland) is one of the largest universities of applied sciences
in the Netherlands. Windesheim (Zwolle en Almerre, in Flevoland) focuses on the domains Education & Sports,
Business, Media & Law, Health & Wellbeing, and Technology.
In terms of R&D expenditures (gross expenditures as a percentage of the regional GDP) Overijseel recorded a
share of 2.3 % in 2011. Thus, the regional share was slightly higher than the Dutch average of 2 %. Private R&D
expenditures accounted for 1.7 % in Overijssel, while the Dutch average was 1.1 % in 2011. The comparatively
high R&D expenditures are mainly attributed to the presence of a technical university and related activities in
engineering and industry.
The Regional Innovation Scoreboard has consistently ranked Overijssel as an innovation follower, i.e. Overijssel
is performing between 90 % and 120 % of the EU average on various innovation indicators. Especially the
indicators for R&D expenditures (business as well as government) are in the lower range, which is remarkable
for a province with a technical university, and policy that focuses on intensifying ties between academy and
industry. According to the Regional Innovation Report (Technopolis group et al., 2012), Overijssel is
characterised as a ‘region with a strong focus on industrial employment, business and/or public R&D’. The score
for SME's introducing product or process innovation is somewhat higher but does not stand out from the national
scores. One has to bear in mind that these scores are based on 2010 data: This means that Overijssel's most
recent innovation policy could not have had an effect on these scores. It does show however that the innovative
capacity of the region is limited and that specific policy attention is justified.
Political Context and Regional Growth Policies
Overall, the Netherlands has a prosperous and open economy, which depends heavily on foreign trade. The
economy is known for stable industrial relations, fairly low unemployment and inflation, a sizeable current
account surplus, and an important role as a European transportation hub. The country is one of the leading
European nations for attracting foreign direct investment because of its favourable fiscal climate (low business
tax rate). A lot of foreign, also non-European, companies have located their European headquarters here.
Another reason for the attractiveness to foreign companies is the highly educated (40 % possess a college or
university degree) and multilingual (80 % speak English) workforce and the internationally-oriented society.
Thus, the Netherlands is also particularly attractive to foreign workers and immigrants from other European and
non-European countries, and experienced a higher population growth (5.0 %) than the EU-28 (3.7 %) from 2000
to 2011. In Overijssel, the population increased at a rate of 5.3 % during this period. Together Amsterdam
(airport), Rotterdam (seaport) and Eindhoven (brainport) form the foundation of the Dutch economy. A further
advantage is the outstanding IT infrastructure. In the Digital Economy Ranking (IBM, The Economist 2010), the
Netherlands is classified as one of the most ‘wired’ countries in the world.
Like all Dutch provincial authorities, the province of Overijssel is an administration at intermediate level that
focuses on regional development and keeps track of coherent spatial and economic planning, thereby assisting or
92
steering the municipalities that fall under its jurisdiction. It invests in large, innovative projects of regional scale
and maintains infrastructure (both physical and organisational) to foster the local economy.25
Regarding
innovation policies, most competencies falls under national policy, but specific regional policy exists to either
fill in blind spots of national policy or foster and develop regional competencies. Overijssel does so with
innovation vouchers for SMEs, networking initiatives around the technical university and participating in the
regional development agency. Further regional strategies to foster regional growth include the Innovation Fund,
which Overijssel launched in May 2013. The fund contained EUR 10 million initially, which were part of a total
amount of EUR 42 million that the Province of Overijssel had made available for innovation in Overijssel. The
focus of the fund is on entrepreneurs and joint initiatives in the sectors High Tech Systems, plastics and
chemistry, life sciences and health and cross-overs. Furthermore, Overijssel cooperates with Gelderland on
innovation programmes on Food and Health. The technical university and the East Netherlands Development
Agency also bind Gelderland and Overijssel. As Overijssel hosts one of the Netherlands three technical
unversities, Overijssel's innovation policy is geared towards including this institution in its regional economy
and innovation policy mix. In addition, combinations with the province's historical expertise are sought for
which Open Innovation Centres exist. SME's re explicitly involved in the regional innovation ecosystem.
Furthermore, there are several initiatives that support advanced manufacturing independent of the regional
government:
The Polymer Science Park is an initiative promoting public-private partnerships for the development
and production of advanced polymers, composites, engineering plastics, coatings and biopolymers.
Facilities offered are supportive of product and process innovations, testing facilities for mechanical-
and chemical stress testing, knowledge, courses, coaching and project management. Facility sharing is
also offered for participants, among which several large firms from the Province and the Netherlands at
large. Financial support for projects and enterprises is given through already existing innovation support
measures, such as innovation vouchers.
The Open Innovation Centre for Advanced Materials is an independent foundation that aims to
reinforce the innovative performance of enterprises. To support enterprises in their innovation efforts,
the OICAM connects enterprises with students from the Twente Technical University and various
universities of applied sciences in the region. The main topics that are addressed are high-performance
materials, design and (production) technology.
The Thermoplastic Composite Research Centre (TPRC) was founded by Boeing, Fokker, TenCate and
the technical university. It is located in the proximity of the university and invites parties from different
value chains in the thermoplastic composites sector (material suppliers, engineering and design bureaus,
production organisations, machine suppliers, education and research institutes) to perform collaborative
research. This research ranges from fundamental to applied, dealing with the topic of applying high-tech
materials in the aerospace and automotive industries.
Conclusion
The case study of Overijssel describes an advanced European region with an above-average trade specialisation
in the textile industry, the rubber and plastic production industry, and the office machinery and computer
industry. Hence, the region is specialised in both, low-technology industries (textile industry and rubber and
plastic production industry) and high-technology industries (office machinery and computer industry). In all
three industries, the region exhibits comparatively high patent intensities, indicating that regional firms, even
those that operate in the low-technology sector, compete based on their innovative strengths and niche products
with a higher value added. In this context, regional firms clearly benefit from the well-developed regional
innovation system that is characterised by high levels of R&D expenditures and a high-skilled labour force.
Furthermore, many regional clusters provide the ground for industry-university linkages. The regional
endowment with highly-qualified human resources and the emphasis of regional universities and research
institutes on natural sciences and engeneering has also attracted firms specialised in the development of
semiconductors, micro-electromechanical systems (MEMS), integrated circuits (ICs) and sensors. These
industries are highly R&D dependent and are responsible for the comparatively high regional R&D expenditures.
Furthermore, these industries may provide high-paid jobs for workers and are important for ensuring future
growth in the region.
25 European Commission (2015h).
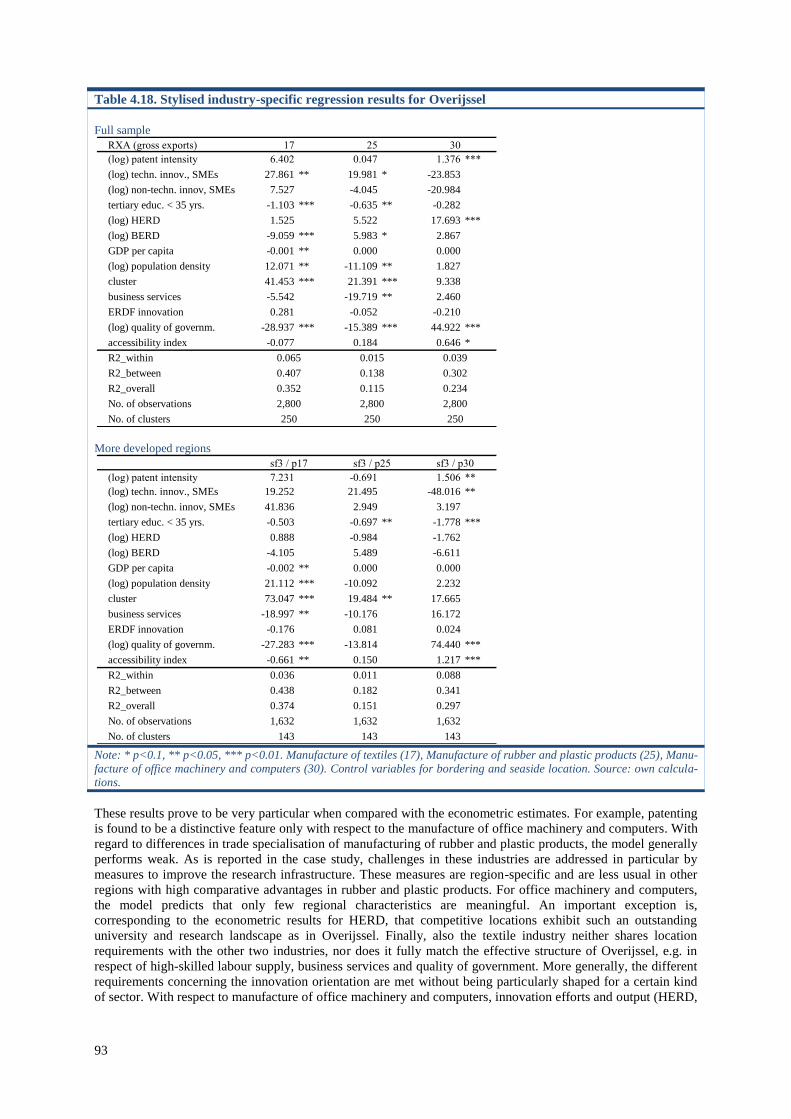
93
Table 4.18. Stylised industry-specific regression results for Overijssel
Full sample
More developed regions
Note: * p<0.1, ** p<0.05, *** p<0.01. Manufacture of textiles (17), Manufacture of rubber and plastic products (25), Manu-
facture of office machinery and computers (30). Control variables for bordering and seaside location. Source: own calcula-
tions.
These results prove to be very particular when compared with the econometric estimates. For example, patenting
is found to be a distinctive feature only with respect to the manufacture of office machinery and computers. With
regard to differences in trade specialisation of manufacturing of rubber and plastic products, the model generally
performs weak. As is reported in the case study, challenges in these industries are addressed in particular by
measures to improve the research infrastructure. These measures are region-specific and are less usual in other
regions with high comparative advantages in rubber and plastic products. For office machinery and computers,
the model predicts that only few regional characteristics are meaningful. An important exception is,
corresponding to the econometric results for HERD, that competitive locations exhibit such an outstanding
university and research landscape as in Overijssel. Finally, also the textile industry neither shares location
requirements with the other two industries, nor does it fully match the effective structure of Overijssel, e.g. in
respect of high-skilled labour supply, business services and quality of government. More generally, the different
requirements concerning the innovation orientation are met without being particularly shaped for a certain kind
of sector. With respect to manufacture of office machinery and computers, innovation efforts and output (HERD,
RXA (gross exports) 17 25 30
(log) patent intensity 6.402 0.047 1.376 ***
(log) techn. innov., SMEs 27.861 ** 19.981 * -23.853
(log) non-techn. innov, SMEs 7.527 -4.045 -20.984
tertiary educ. < 35 yrs. -1.103 *** -0.635 ** -0.282
(log) HERD 1.525 5.522 17.693 ***
(log) BERD -9.059 *** 5.983 * 2.867
GDP per capita -0.001 ** 0.000 0.000
(log) population density 12.071 ** -11.109 ** 1.827
cluster 41.453 *** 21.391 *** 9.338
business services -5.542 -19.719 ** 2.460
ERDF innovation 0.281 -0.052 -0.210
(log) quality of governm. -28.937 *** -15.389 *** 44.922 ***
accessibility index -0.077 0.184 0.646 *
R2_within 0.065 0.015 0.039
R2_between 0.407 0.138 0.302
R2_overall 0.352 0.115 0.234
No. of observations 2,800 2,800 2,800
No. of clusters 250 250 250
sf3 / p17 sf3 / p25 sf3 / p30 sf3 / p31
(log) patent intensity 7.231 -0.691 1.506 **
(log) techn. innov., SMEs 19.252 21.495 -48.016 **
(log) non-techn. innov, SMEs 41.836 2.949 3.197
tertiary educ. < 35 yrs. -0.503 -0.697 ** -1.778 ***
(log) HERD 0.888 -0.984 -1.762
(log) BERD -4.105 5.489 -6.611
GDP per capita -0.002 ** 0.000 0.000
(log) population density 21.112 *** -10.092 2.232
cluster 73.047 *** 19.484 ** 17.665
business services -18.997 ** -10.176 16.172
ERDF innovation -0.176 0.081 0.024
(log) quality of governm. -27.283 *** -13.814 74.440 ***
accessibility index -0.661 ** 0.150 1.217 ***
R2_within 0.036 0.011 0.088
R2_between 0.438 0.182 0.341
R2_overall 0.374 0.151 0.297
No. of observations 1,632 1,632 1,632
No. of clusters 143 143 143
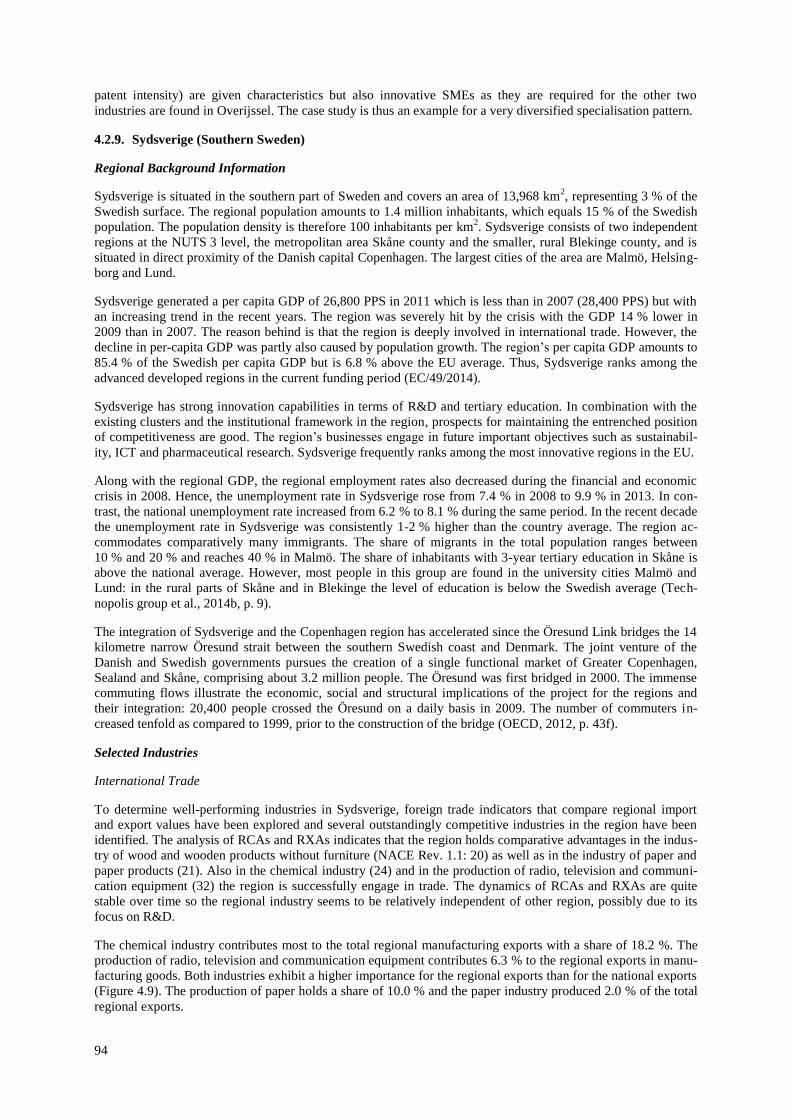
94
patent intensity) are given characteristics but also innovative SMEs as they are required for the other two
industries are found in Overijssel. The case study is thus an example for a very diversified specialisation pattern.
4.2.9. Sydsverige (Southern Sweden)
Regional Background Information
Sydsverige is situated in the southern part of Sweden and covers an area of 13,968 km2, representing 3 % of the
Swedish surface. The regional population amounts to 1.4 million inhabitants, which equals 15 % of the Swedish
population. The population density is therefore 100 inhabitants per km2. Sydsverige consists of two independent
regions at the NUTS 3 level, the metropolitan area Skåne county and the smaller, rural Blekinge county, and is
situated in direct proximity of the Danish capital Copenhagen. The largest cities of the area are Malmö, Helsing-
borg and Lund.
Sydsverige generated a per capita GDP of 26,800 PPS in 2011 which is less than in 2007 (28,400 PPS) but with
an increasing trend in the recent years. The region was severely hit by the crisis with the GDP 14 % lower in
2009 than in 2007. The reason behind is that the region is deeply involved in international trade. However, the
decline in per-capita GDP was partly also caused by population growth. The region’s per capita GDP amounts to
85.4 % of the Swedish per capita GDP but is 6.8 % above the EU average. Thus, Sydsverige ranks among the
advanced developed regions in the current funding period (EC/49/2014).
Sydsverige has strong innovation capabilities in terms of R&D and tertiary education. In combination with the
existing clusters and the institutional framework in the region, prospects for maintaining the entrenched position
of competitiveness are good. The region’s businesses engage in future important objectives such as sustainabil-
ity, ICT and pharmaceutical research. Sydsverige frequently ranks among the most innovative regions in the EU.
Along with the regional GDP, the regional employment rates also decreased during the financial and economic
crisis in 2008. Hence, the unemployment rate in Sydsverige rose from 7.4 % in 2008 to 9.9 % in 2013. In con-
trast, the national unemployment rate increased from 6.2 % to 8.1 % during the same period. In the recent decade
the unemployment rate in Sydsverige was consistently 1-2 % higher than the country average. The region ac-
commodates comparatively many immigrants. The share of migrants in the total population ranges between
10 % and 20 % and reaches 40 % in Malmö. The share of inhabitants with 3-year tertiary education in Skåne is
above the national average. However, most people in this group are found in the university cities Malmö and
Lund: in the rural parts of Skåne and in Blekinge the level of education is below the Swedish average (Tech-
nopolis group et al., 2014b, p. 9).
The integration of Sydsverige and the Copenhagen region has accelerated since the Öresund Link bridges the 14
kilometre narrow Öresund strait between the southern Swedish coast and Denmark. The joint venture of the
Danish and Swedish governments pursues the creation of a single functional market of Greater Copenhagen,
Sealand and Skåne, comprising about 3.2 million people. The Öresund was first bridged in 2000. The immense
commuting flows illustrate the economic, social and structural implications of the project for the regions and
their integration: 20,400 people crossed the Öresund on a daily basis in 2009. The number of commuters in-
creased tenfold as compared to 1999, prior to the construction of the bridge (OECD, 2012, p. 43f).
Selected Industries
International Trade
To determine well-performing industries in Sydsverige, foreign trade indicators that compare regional import
and export values have been explored and several outstandingly competitive industries in the region have been
identified. The analysis of RCAs and RXAs indicates that the region holds comparative advantages in the indus-
try of wood and wooden products without furniture (NACE Rev. 1.1: 20) as well as in the industry of paper and
paper products (21). Also in the chemical industry (24) and in the production of radio, television and communi-
cation equipment (32) the region is successfully engage in trade. The dynamics of RCAs and RXAs are quite
stable over time so the regional industry seems to be relatively independent of other region, possibly due to its
focus on R&D.
The chemical industry contributes most to the total regional manufacturing exports with a share of 18.2 %. The
production of radio, television and communication equipment contributes 6.3 % to the regional exports in manu-
facturing goods. Both industries exhibit a higher importance for the regional exports than for the national exports
(Figure 4.9). The production of paper holds a share of 10.0 % and the paper industry produced 2.0 % of the total
regional exports.
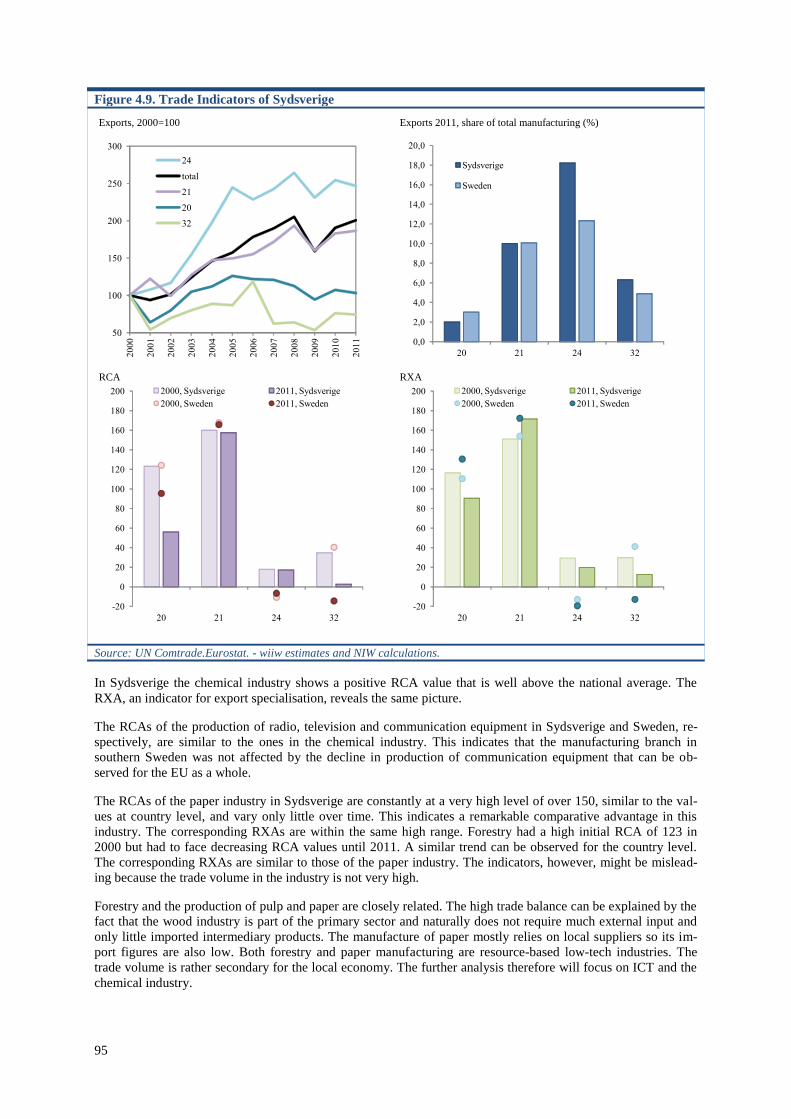
95
Figure 4.9. Trade Indicators of Sydsverige
Source: UN Comtrade.Eurostat. - wiiw estimates and NIW calculations.
In Sydsverige the chemical industry shows a positive RCA value that is well above the national average. The
RXA, an indicator for export specialisation, reveals the same picture.
The RCAs of the production of radio, television and communication equipment in Sydsverige and Sweden, re-
spectively, are similar to the ones in the chemical industry. This indicates that the manufacturing branch in
southern Sweden was not affected by the decline in production of communication equipment that can be ob-
served for the EU as a whole.
The RCAs of the paper industry in Sydsverige are constantly at a very high level of over 150, similar to the val-
ues at country level, and vary only little over time. This indicates a remarkable comparative advantage in this
industry. The corresponding RXAs are within the same high range. Forestry had a high initial RCA of 123 in
2000 but had to face decreasing RCA values until 2011. A similar trend can be observed for the country level.
The corresponding RXAs are similar to those of the paper industry. The indicators, however, might be mislead-
ing because the trade volume in the industry is not very high.
Forestry and the production of pulp and paper are closely related. The high trade balance can be explained by the
fact that the wood industry is part of the primary sector and naturally does not require much external input and
only little imported intermediary products. The manufacture of paper mostly relies on local suppliers so its im-
port figures are also low. Both forestry and paper manufacturing are resource-based low-tech industries. The
trade volume is rather secondary for the local economy. The further analysis therefore will focus on ICT and the
chemical industry.
Exports, 2000=100 Exports 2011, share of total manufacturing (%)
RCA RXA
50
100
150
200
250
300
20
00
20
01
20
02
20
03
20
04
20
05
20
06
20
07
20
08
20
09
20
10
20
11
24
total
21
20
32
0,0
2,0
4,0
6,0
8,0
10,0
12,0
14,0
16,0
18,0
20,0
20 21 24 32
Sydsverige
Sweden
-20
0
20
40
60
80
100
120
140
160
180
200
20 21 24 32
2000, Sydsverige 2011, Sydsverige
2000, Sweden 2011, Sweden
-20
0
20
40
60
80
100
120
140
160
180
200
20 21 24 32
2000, Sydsverige 2011, Sydsverige
2000, Sweden 2011, Sweden
96
These two industries achieve a positive trade balance and the region’s performance resembles the country trend.
In the television and communication equipment industry a falling trend is to be observed at country and EU
level. Sydsverige, however, has been able to maintain positive net exports in the sector – although the EU had a
steeply rising trade deficit. The regional ICT sector seems rather robust, since it was able to largely resist the
falling RCA, RXA and trade balance trends at the national and EU level. The trade volume of the chemical in-
dustry (NACE Rev. 1.1: 24) rapidly increased from EUR 2.4 billion in 2000 to EUR 6.3 billion in 2011 (Figure
4.9). The high trade volume of the chemical industry is largely generated by the pharmaceutical industry. It has
been able to keep its high RCAs in the regional industry and thus participated in the growing sales markets in
Asia and South America.
Employment and Patent Activity
In terms of employment the manufacturing sector has lost importance in Sydsverige. While in the year 2000,
18.5 % of the labour force were employed in the manufacturing sector, the share declined at an annual rate of
-1.6 % to 12.2 % in 2013. The remaining manufacturing sector shifted its focus more towards high- and me-
dium-tech industries. Employment in low-tech production decreased on average by 2.0 % annually, in medium-
and high-tech manufacturing only by 1.1 % (see Table 4.19).
The exceptional importance of the chemical industry, including biotech, pharmaceutical and medical businesses,
is also reflected in the employment figures of the industry. In 2013, 7,200 people (1.1 % of the region total) were
employed in this industry. Even though a decline can be observed between 2000 and 2013, in Sydsverige, em-
ployment declined less than in other manufacturing industries (Table 4.19). The industry of radio, television and
communication equipment faced a decreasing employment that declined from 0.5 % to 0.2 % between 2000 and
2013. The patent intensity, however, increased significantly from 555 patents per 10,000 employees on average
in 2000–2002 to 1718 patents in 2009–2011 indicating that the employment reduction mainly concerned produc-
tion capacities but not R&D. The chemical companies also showed a high patent intensity with an increasing
number of patents, from 139 patents per 10,000 to 163 patents.
Table 4.19 Regional Key Figures of Sydsverige
Employment Patent intensity
Sector Number of
employees
Regional employment structure
(%)
Annual average
growth rate of
regional em-
ployment be-
tween 2000 and
2013(%)
Patents per
10,000 employees
(average for 2000 to 2002
and 2009 to 2011)
2013 2000 2000-13 2000-02 2009-11
Region total 671,700 100.0 100.0 1.6
Manufacturing 82,100 12.2 18.5 -1.6 125.0
High- and medium-
tech
35,500 5.3 7.5 -1.1 166.9 246.1
Low-tech 46,600 6.9 11.0 -2.0 25.3 32.7
Knowledge-intensive
services
235,800 35.1 34.4 1.7
Other 353,800 52.7 47.0 2.4
Selected manufacturing industries:
20 3,100 0.5 1.0 -4.2 1.9 10.7
21 3,200 0.5 0.7 -1.9 21.1 12.3
24 7,200 1.1 1.4 -0.5 139.2 162.7
32 1,500 0.2 0.5 -4.9 555.0 1717.7
Source: Eurostat. OECD RegPat. - NIW and ZEW calculations
97
Drivers of Regional Trade Specialisation and Regional Growth
Economic Structure
In Sweden the cluster development is largely driven by governmental organisations and focuses on knowledge-
intensive sectors. The employment in knowledge-intensive services increased from 34.4 % in 2000 to 35.1 % in
2013 which reflects an annual growth rate of 1.7 %. Particularly in the pharmaceutical industry, the business
structure is characterised by many smaller businesses which are not involved in production, but in basic research
and which provide service to large manufacturers.
Clusters can be one factor for explaining the strong export performance of the selected industries, as spatial con-
centration of businesses and research facilities can create mutually conducive effects such as knowledge spill-
overs. There are several clusters to be found in the region that have been branded and developed in recent years.
Seven cluster organisations are located in Sydsverige, most prominently the pharmaceutical industry cluster
Medicon Valley in the Öresund region and the mobile communication clusters Mobile Heights in Skåne and
TelecomCity in Karlskrona, Blekinge. The Cluster Observatory finds a cluster in the IT sector with 3113 enter-
prises and also the pharmaceutical medical industry with 382 businesses in the region.
Along with the Danish-Swedish integration over the Öresund, the vision of turning the region into a hub for life
sciences emerged. Governmental institutions first initiated the Medicon Valley cluster project that now consists
of numerous biotech, pharmaceutical and medical companies. The cluster acknowledges the need to be visible
and attractive as a regional cluster in the highly competitive global medicine and biotechnological market with
only few centres worldwide. To promote the cluster the Medicon Valley Alliance (MVA), a member-financed
non-profit organisation that seeks to facilitate R&D spending in the region, was founded. Its members include all
important universities, healthcare organisations and most biotech and medical companies. The MVA has become
an institutionalised forum and unified information and marketing provider. The MVA is also important for at-
tracting investment in the cluster (Lundequist and Power, 2002, p. 693).
Currently the cluster includes 12 universities, 32 hospitals (many of which belong to universities) and over 300
life science companies. Among the major international companies that are active in R&D and maintain research
centres in Sydsverige are the pharmaceutical and medical company Novo Nordisk, Lundbeck, LEO Pharma,
Ferring Pharmaceuticals and AstraZeneca. The research intensity is also indicated by a very high number of
patents.
Another cluster of the region is TelecomCity, located in Karlskrona in Blekinge county. The cluster initially was
a project initiated by the governmental institutions when the region was facing decreasing population and em-
ployment (Lundequist and Power, 2002, p. 693). It had to be built from scratch since the region had not much
tradition in the ICT sector. Similar to Medicon Valley, early on the cluster branding was emphasised. The Mu-
nicipality of Karlskrona, the Blekinge Institute of Technology and the business network in Karlskrona agreed to
develop the ICT sector of the region as TelecomCity in 1993 and marketed it as such. Around 50 firms of differ-
ent size and specialisation are set in Karlskrona. Large firms in the city are Ericsson, Telenor, Fujistsu and CGI.
The ICT sector is also strong in Skåne with companies such as Sony Ericsson and Ericsson. The focus is on
mobile communication with Blackberry, Ericsson and Huawei as phone manufacturers. The Lund Institute of
Technology and the University of Malmö cooperate with the local industry in the ICT sector.
Although there are cluster tendencies in the wood industry as well, the sector is rather small. The number of
employees is decreasing slightly over time. Moreover, Skåne does not have much fellable woodland that could
be utilised in the sector (Henning et al., 2010, pp. 53f). The high trade balance stems only from small absolute
trade volumes.
Other industries in Sydsverige are the food industry, which forms a cluster in the region and the packaging sec-
tor, which is also of significance for the region with international companies such as Tetra Pak. The packaging
and the food industries are functionally linked (Henning et al., 2010, p. 56). The large packaging companies
Åkerlund&Rausing and Tetra Pak also contribute to the exports of the paper industry that exhibits high RCA-
values as described.
Regional Innovation System
Although the aforementioned industries perform well in the region of Sydsverige, they are not capable of raising
employment and regional growth over the country average. The OECD (2012, p. 110) names the globalisation of
value chains, insufficient entrepreneurship and weak SME innovation as explanations for the lacking ability to
translate research and innovation into employment and income adequately. The challenge in Sydsverige, thus, is
98
to move from a research and technology hub towards an inherently innovative region. Another factor that may
lead to higher unemployment is represented by difficulties in integrating the above-average number of immi-
grants into the labour market.
The regional R&D expenditure of businesses in Sydsverige of 3.3 % of the GDP is higher than in Sweden as a
whole (2.3 %) in 2011. Also the total expenditure on R&D is higher in Sydsverige (4.5 % of the GDP) than the
Swedish average (3.4 %). Business accounted for 73 % of the total R&D expenditures of EUR 2.2 billion in
Sydsverige in 2011. Higher education institutions contributed 24 %. The high level of R&D investment by busi-
nesses and universities and the respective strong academic research certainly constitute regional strengths. How-
ever, the overwhelming part of development is carried out by a small number of multinationals.
There are deficits in publicly funded industrial research (2.8 % of total R&D) and research institutes that cannot
compete with the massive capital endowment of the large companies. Also smaller firms are not able to match
the capital endowment required to gain market share and consequently remain small.
Particularly Skåne is dependent on external decisions of big research companies. For instance, the pharmaceuti-
cal manufacturer AstraZeneca closed its research facility in Lund, Skåne, in 2010 which caused the immediate
loss of 900 jobs and their income in the region. The Skåne Research and Innovation Council in cooperation with
the local Lund University turned the facility into the Medicon Village. Its concept is to encompass the entire
value chain of research, innovation and business which makes it less vulnerable.
In the Sydsverige region the most important universities are the Lund University with its a research focus on life
sciences such as medicine and pharmacology, the Blekinge Institute of Technology, which has strengths in IT
and telecommunication or the Malmö University. The universities’ focus is well-matched with the respective
local clusters, for instance the Blekinge Institute for Technology in Karlskrona, which is closely related to the
telecom cluster. The focus of the universities in life sciences, namely the Lund University, fits the specialisation
of the pharmaceutical cluster.
Besides the good endowment with higher education institutions, the region is currently in the process of launch-
ing two new research centres, the MAX IV and the European Spallation Source, planned to be put into operation
in 2015 and 2019, respectively. The two facilities will provide infrastructure for physics and materials research
(OECD, 2012, p. 103).
The regional growth strategy in Sydsverige is centred on knowledge-intensive sectors, which can be a possible
explanation for the robustness of the industry against the decreasing trade balance at EU level especially in the
ICT sector. The Regional Innovation Scoreboard has ranked Sydsverige as a regional innovation leader.
Political Context and Regional Growth Policies
There are several institutions that intend to facilitate innovation and entrepreneurial activity and to support the
establishment of start-up ventures. There are development policies at the national and regional level imple-
mented by different governmental institutions (Technopolis group et al., 2014b).
The Agency for Innovation Systems VINNOVA is a governmental agency in charge of the administration of
state funding. It finances research and innovation projects. VINNOVA also maintains an SME support network.
The agency fosters collaboration of the public sector with universities and businesses and disposes of an annual
budget to the equivalent of about EUR 300 million. Another important institution is the Swedish Agency for
Economic and Regional Growth Tillväxtverket that operates under the Ministry of Enterprise and seeks to pro-
mote business activity. It also implements the structural funds programmes of the EU. From 2007 to 2013 there
was one Regional Operational Programme for Skåne-Blekinge managed by Tillväxtverket and funded by EU and
Swedish governmental institutions that each contributed EUR 70.7 million. Its objectives were to further
strengthen the knowledge-based industries and particularly the ICT sector. The former Swedish Business Devel-
opment Agency NUTEK, a partnership of private and public actors, was joined to Tillväxtverket and partly the
Agency for Rural Development in 2009. NUTEK’s objective was to build a partnership between regional and
national policy-makers to improve the learning process in the network (Lundequist and Power, 2002, p. 690).To
name one more, the agency ALMI was founded to foster entrepreneurial activity and is owned by the Swedish
government as well. ALMI provides advisory services, loans and venture capital to start-up companies. It funds
firms in an early stage to provide them with start-up capital. However, the loans have higher interest rates than
market rates to avoid competition with banks. ALMI invests in companies when they still bear much risk and
their access to capital would be rather limited otherwise. Another objective of ALMI is to offers consultancy for
instance in mentor programmes, growth and innovation advice or seminars for entrepreneurs.
99
Conclusion
The case study has shown that even though the regional performance indicators of Sydsverige (GDP p. c., em-
ployment rate) are below the national average, the region still reveals above-average trade specialisation in two
low-tech industries (i.e. the wood and paper industries) and two high-tech industries (chemical industry and
manufacture of radio, television and communication equipment). Particularly in the latter two high-technology
industries, Sydsverige benefits from its relatively well-developed regional innovation system, with the Lund
University being a central actor. The university – with its strong focus on life sciences and its traditional role as a
transfer agent – acts as a pull-factor for chemical and biotechnological firms locating in the region. Given the
proximity to the Danish capital city of Copenhagen, regional firms also profit from business cooperation and
knowledge exchange with Danish firms, particularly within cross-border cluster initiatives. Since the region has
increasingly specialised in skill-intensive sectors, a future regional challenge is the integration of people with
only low skills in the regional labour market. Here, education and qualification strategies should be expanded.
Despite their differences in terms of products and technological intensity, the results from the regression model
have shown that in all four industries, clusters are positively related with a region’s trade specialisation in that
industry. Besides that, also HERD and governmental quality play a significant role, at least in three of the
selected industries. Moreover, the requirement of high-skilled labour supply is relevant for such different
industries as the manufacture of pulp, paper and paper products as well as the manufacture of chemicals and
chemical products. More interestingly, non-technological innovations of SMEs are quite important for the low-
technology-intensive industries while they play less of a role, especially concerning technological innovations,
for the two high-technology industries. Similarly mixed are the results for HERD and BERD. There is thus no
comprehensive explanation possible relying only on the econometric results. However, it can be concluded that
specialisation in the two low-technology industries is based upon the natural forest resources and the structural
preconditions that favour functional specialisation on headquarter functions.Against this background, compara-
tive advantages in Sydsverige rely upon on an ideal combination of several location factors which have been
steadily further developed. The mix itself, however, can hardly be explained empirically but rather from a quali-
tative long-term perspective.
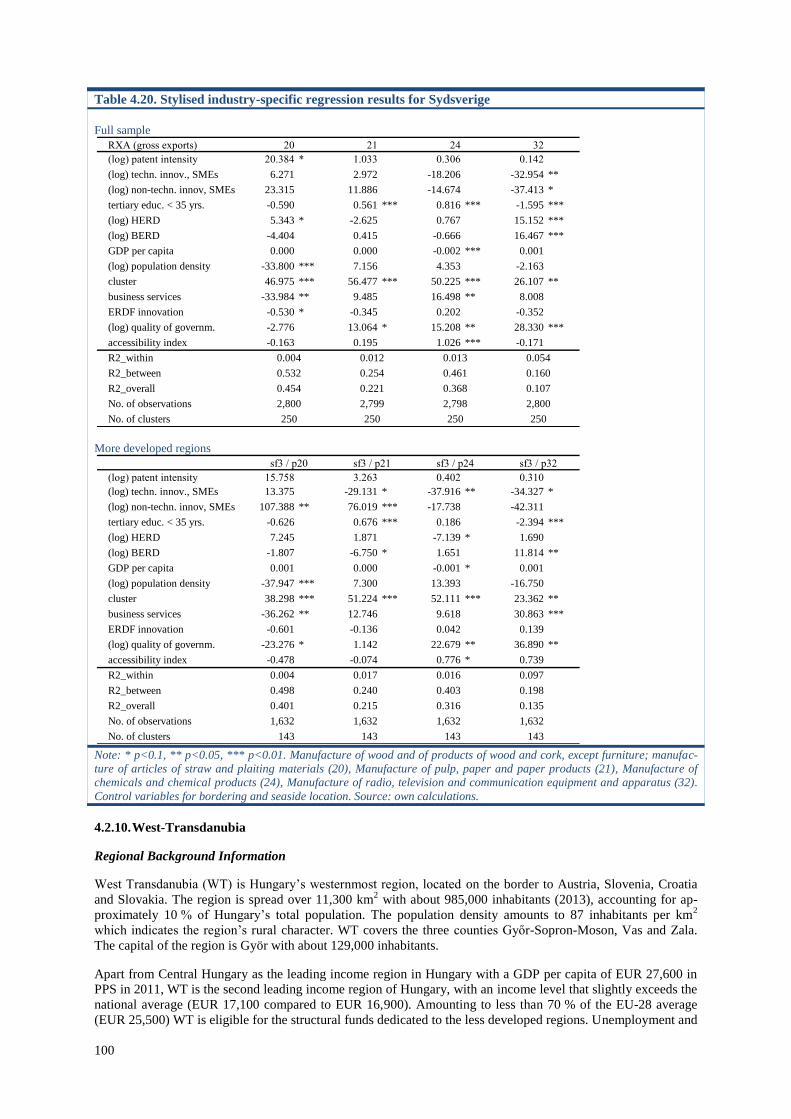
100
Table 4.20. Stylised industry-specific regression results for Sydsverige
Full sample
More developed regions
Note: * p<0.1, ** p<0.05, *** p<0.01. Manufacture of wood and of products of wood and cork, except furniture; manufac-
ture of articles of straw and plaiting materials (20), Manufacture of pulp, paper and paper products (21), Manufacture of
chemicals and chemical products (24), Manufacture of radio, television and communication equipment and apparatus (32).
Control variables for bordering and seaside location. Source: own calculations.
4.2.10. West-Transdanubia
Regional Background Information
West Transdanubia (WT) is Hungary’s westernmost region, located on the border to Austria, Slovenia, Croatia
and Slovakia. The region is spread over 11,300 km2 with about 985,000 inhabitants (2013), accounting for ap-
proximately 10 % of Hungary’s total population. The population density amounts to 87 inhabitants per km2
which indicates the region’s rural character. WT covers the three counties Győr-Sopron-Moson, Vas and Zala.
The capital of the region is Györ with about 129,000 inhabitants.
Apart from Central Hungary as the leading income region in Hungary with a GDP per capita of EUR 27,600 in
PPS in 2011, WT is the second leading income region of Hungary, with an income level that slightly exceeds the
national average (EUR 17,100 compared to EUR 16,900). Amounting to less than 70 % of the EU-28 average
(EUR 25,500) WT is eligible for the structural funds dedicated to the less developed regions. Unemployment and
RXA (gross exports) 20 21 24 32
(log) patent intensity 20.384 * 1.033 0.306 0.142
(log) techn. innov., SMEs 6.271 2.972 -18.206 -32.954 **
(log) non-techn. innov, SMEs 23.315 11.886 -14.674 -37.413 *
tertiary educ. < 35 yrs. -0.590 0.561 *** 0.816 *** -1.595 ***
(log) HERD 5.343 * -2.625 0.767 15.152 ***
(log) BERD -4.404 0.415 -0.666 16.467 ***
GDP per capita 0.000 0.000 -0.002 *** 0.001
(log) population density -33.800 *** 7.156 4.353 -2.163
cluster 46.975 *** 56.477 *** 50.225 *** 26.107 **
business services -33.984 ** 9.485 16.498 ** 8.008
ERDF innovation -0.530 * -0.345 0.202 -0.352
(log) quality of governm. -2.776 13.064 * 15.208 ** 28.330 ***
accessibility index -0.163 0.195 1.026 *** -0.171
R2_within 0.004 0.012 0.013 0.054
R2_between 0.532 0.254 0.461 0.160
R2_overall 0.454 0.221 0.368 0.107
No. of observations 2,800 2,799 2,798 2,800
No. of clusters 250 250 250 250
sf3 / p20 sf3 / p21 sf3 / p24 sf3 / p32 sf3 / p33
(log) patent intensity 15.758 3.263 0.402 0.310
(log) techn. innov., SMEs 13.375 -29.131 * -37.916 ** -34.327 *
(log) non-techn. innov, SMEs 107.388 ** 76.019 *** -17.738 -42.311
tertiary educ. < 35 yrs. -0.626 0.676 *** 0.186 -2.394 ***
(log) HERD 7.245 1.871 -7.139 * 1.690
(log) BERD -1.807 -6.750 * 1.651 11.814 **
GDP per capita 0.001 0.000 -0.001 * 0.001
(log) population density -37.947 *** 7.300 13.393 -16.750
cluster 38.298 *** 51.224 *** 52.111 *** 23.362 **
business services -36.262 ** 12.746 9.618 30.863 ***
ERDF innovation -0.601 -0.136 0.042 0.139
(log) quality of governm. -23.276 * 1.142 22.679 ** 36.890 **
accessibility index -0.478 -0.074 0.776 * 0.739
R2_within 0.004 0.017 0.016 0.097
R2_between 0.498 0.240 0.403 0.198
R2_overall 0.401 0.215 0.316 0.135
No. of observations 1,632 1,632 1,632 1,632
No. of clusters 143 143 143 143
101
activity rates exhibit marginally more favourable values than the Hungarian average (7.8 % and 59.4 % com-
pared to 10.2 % and 57.5 % in 2013).
WT is particularly specialised in the manufacturing of automotive, electronics and machinery and equipment
especially induced by foreign direct investment. Other important manufacturing sectors are the wood and furni-
ture industries and agriculture and food industries, both related to the region’s natural resources, as well as re-
newable energy and related technologies. Due to the strong export orientation of the foreign subsidiaries located
in the region, WT was particularly exposed to the financial and economic crisis. GDP per capita declined from
EUR 15,300 in 2008 to EUR 14,300 in 2009, while unemployment nearly doubled within two years (from 4.9 %
in 2007 to 9.2 % in 2009). Yet WT succeeded in recovering faster than other Hungarian or European regions. In
2013, regional unemployment amounted to merely 7.8 %, and was significantly lower than the national average
(10.2 %).
Typically of the Hungarian business structure, 4 % (2,700 units) of registered businesses in WT are foreign-
owned. For reasons of size and productivity, however, their contribution to revenues and employment is much
higher. According to the Hungarian labour office MNH, foreign businesses accounted for more than 50 % of
total revenues and 25 % of Hungary’s active employees in 2011. Furthermore, foreign-owned companies carried
out nearly half of all investments in Hungary.26
The regional employment in the service sector is driven by the tourism industry. Due to its favourable geo-
graphical characteristics, especially thermal tourism makes it to one of the most important sectors in WT, just
behind the Central Hungarian region.
Selected Industries
International Trade
The four industries in which West Transdanubia (WT) holds a comparative advantage (when taking the average
of the less developed EU regions as a reference point), are all classified as high- and medium-tech ones. These
are the manufacture of office machinery and computers (NACE Rev. 1.1: 30), manufacture of radio, television
and communication equipment and apparatus (32), manufacturing of medical, precision and optical instruments,
watches and clocks (33), as well as the manufacture of motor vehicles, trailers and semi-trailers (34). In all these
industries, the region achieves higher comparative advantages (RCA) and a more favourable trade specialisation
(RXA) than the EU-28 or the Hungarian average. Nevertheless, the respective export shares of total manufactur-
ing of these four industries are quite similar to the national average and account for more than half of total manu-
facturing exports (Figure 4.10). 28 % of WT’s exports in 2011 are attributed to motor vehicles, trailers and semi-
trailers (34) and 19 % to radio, television and communication equipment and apparatus (34). The favourable
trade performance for office machinery and computers as well as for motor vehicle had already existed in 2000.
On the other hand, the region achieved outstanding export growth for consumer electronics and communication
equipment (32) and instruments (33) from 2000 to 2011, and significantly improving its trade performance
(RXA and RCA) in these industries. In contrast to this, the formerly highly positive trade specialisation for of-
fice machinery and computers has significantly decreased over time due to a substantial decline in exports since
2009. Compared to this, the positive trade specialisation for motor vehicles remained rather stable (Figure 4.10).
WT basically exhibits a similar trade performance as Hungary as a whole in terms of those four selected indus-
tries, although the indicator values (RCA, RXA) for the national average are quite lower, as a rule. Hence, both
differ significantly from the EU-28 average according to the three electronic-based industries. Here, the EU-28
exhibits a highly negative and further deteriorating trade performance for office machinery and computers (30)
as well as for consumer electronics and communication equipment (32) and a stable negative export specialisa-
tion for instruments (33).
Employment and Patent Intensity
Altogether, employment in the four selected industries amounts to 32,300 workers, representing 27 % of total
manufacturing (2013) and 8 % of total regional employment. The automotive industry (34) accounts for more
than the half (17,900), followed by consumer electronics and communication equipment (32) (13,500) while the
size of the other two industries is negligible.
26 http://www.xpatloop.com/news/foreign_companies_employ_25_in_hungary
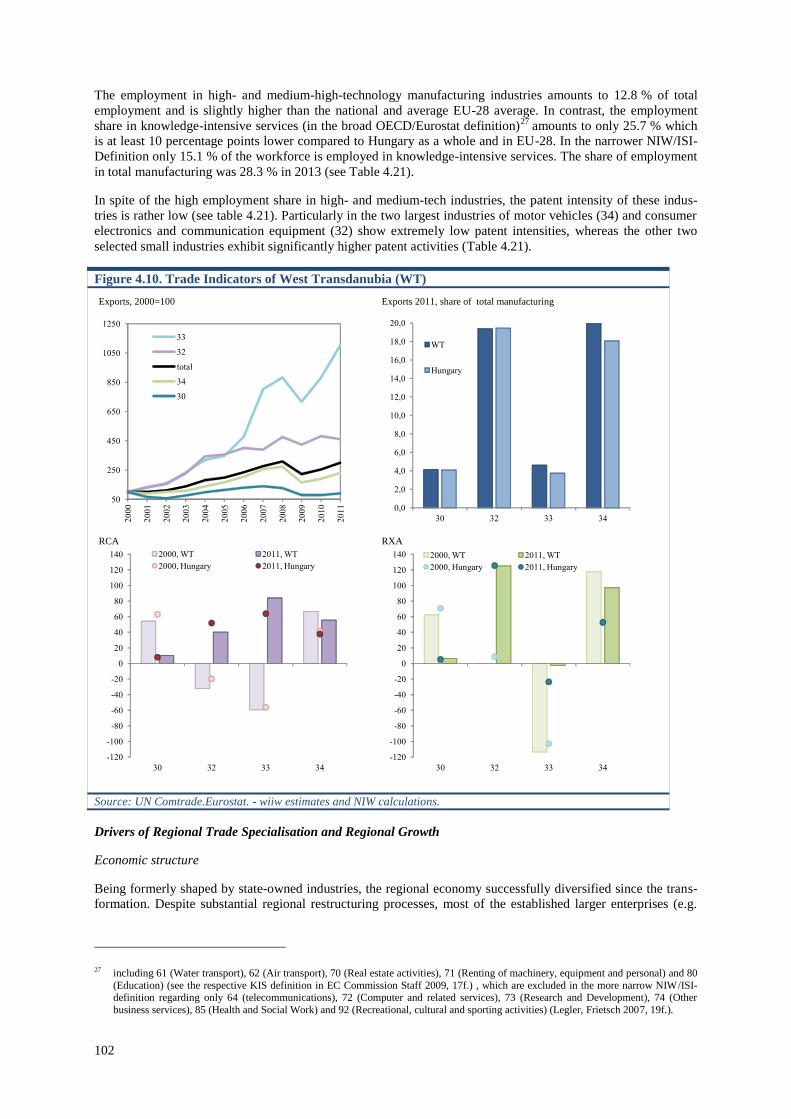
102
The employment in high- and medium-high-technology manufacturing industries amounts to 12.8 % of total
employment and is slightly higher than the national and average EU-28 average. In contrast, the employment
share in knowledge-intensive services (in the broad OECD/Eurostat definition)27
amounts to only 25.7 % which
is at least 10 percentage points lower compared to Hungary as a whole and in EU-28. In the narrower NIW/ISI-
Definition only 15.1 % of the workforce is employed in knowledge-intensive services. The share of employment
in total manufacturing was 28.3 % in 2013 (see Table 4.21).
In spite of the high employment share in high- and medium-tech industries, the patent intensity of these indus-
tries is rather low (see table 4.21). Particularly in the two largest industries of motor vehicles (34) and consumer
electronics and communication equipment (32) show extremely low patent intensities, whereas the other two
selected small industries exhibit significantly higher patent activities (Table 4.21).
Figure 4.10. Trade Indicators of West Transdanubia (WT)
Source: UN Comtrade.Eurostat. - wiiw estimates and NIW calculations.
Drivers of Regional Trade Specialisation and Regional Growth
Economic structure
Being formerly shaped by state-owned industries, the regional economy successfully diversified since the trans-
formation. Despite substantial regional restructuring processes, most of the established larger enterprises (e.g.
27 including 61 (Water transport), 62 (Air transport), 70 (Real estate activities), 71 (Renting of machinery, equipment and personal) and 80
(Education) (see the respective KIS definition in EC Commission Staff 2009, 17f.) , which are excluded in the more narrow NIW/ISI-definition regarding only 64 (telecommunications), 72 (Computer and related services), 73 (Research and Development), 74 (Other
business services), 85 (Health and Social Work) and 92 (Recreational, cultural and sporting activities) (Legler, Frietsch 2007, 19f.).
Exports, 2000=100 Exports 2011, share of total manufacturing
RCA RXA
50
250
450
650
850
1050
1250
20
00
20
01
20
02
20
03
20
04
20
05
20
06
20
07
20
08
20
09
20
10
20
11
33
32
total
34
30
0,0
2,0
4,0
6,0
8,0
10,0
12,0
14,0
16,0
18,0
20,0
30 32 33 34
WT
Hungary
-120
-100
-80
-60
-40
-20
0
20
40
60
80
100
120
140
30 32 33 34
2000, WT 2011, WT
2000, Hungary 2011, Hungary
-120
-100
-80
-60
-40
-20
0
20
40
60
80
100
120
140
30 32 33 34
2000, WT 2011, WT
2000, Hungary 2011, Hungary
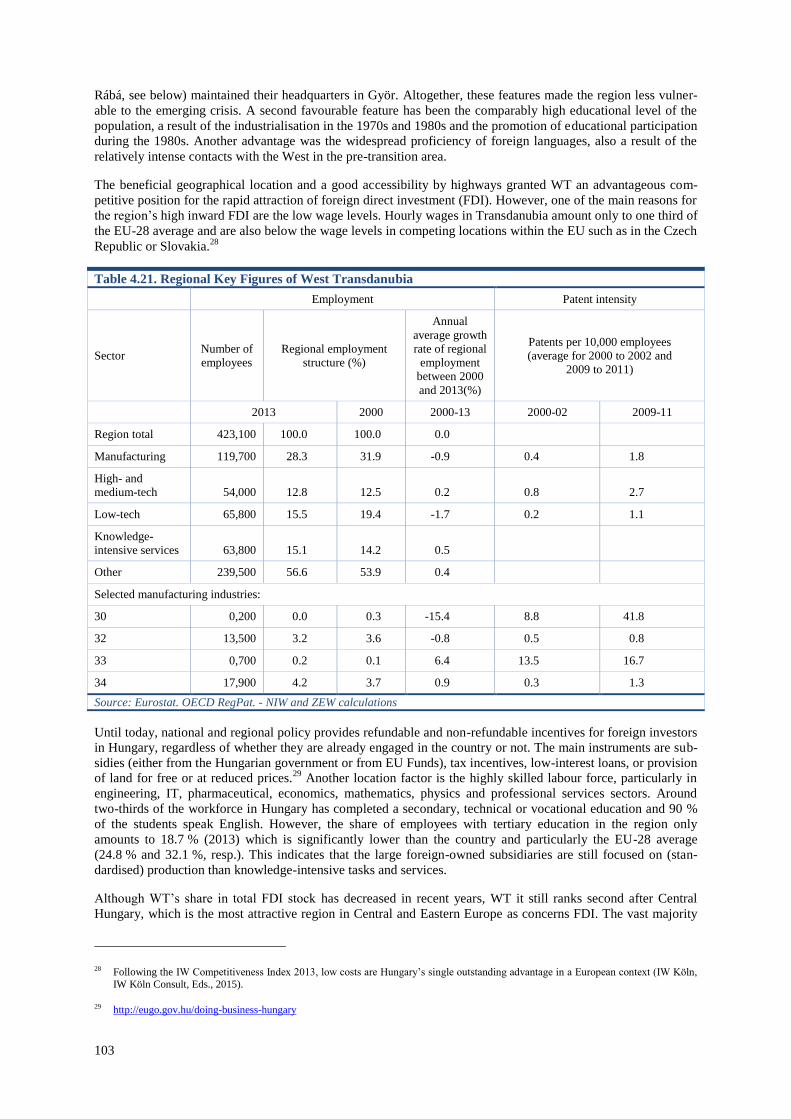
103
Rábá, see below) maintained their headquarters in Györ. Altogether, these features made the region less vulner-
able to the emerging crisis. A second favourable feature has been the comparably high educational level of the
population, a result of the industrialisation in the 1970s and 1980s and the promotion of educational participation
during the 1980s. Another advantage was the widespread proficiency of foreign languages, also a result of the
relatively intense contacts with the West in the pre-transition area.
The beneficial geographical location and a good accessibility by highways granted WT an advantageous com-
petitive position for the rapid attraction of foreign direct investment (FDI). However, one of the main reasons for
the region’s high inward FDI are the low wage levels. Hourly wages in Transdanubia amount only to one third of
the EU-28 average and are also below the wage levels in competing locations within the EU such as in the Czech
Republic or Slovakia.28
Table 4.21. Regional Key Figures of West Transdanubia
Employment Patent intensity
Sector Number of
employees
Regional employment
structure (%)
Annual
average growth
rate of regional
employment
between 2000
and 2013(%)
Patents per 10,000 employees
(average for 2000 to 2002 and
2009 to 2011)
2013 2000 2000-13 2000-02 2009-11
Region total 423,100 100.0 100.0 0.0
Manufacturing 119,700 28.3 31.9 -0.9 0.4 1.8
High- and
medium-tech 54,000 12.8 12.5 0.2 0.8 2.7
Low-tech 65,800 15.5 19.4 -1.7 0.2 1.1
Knowledge-
intensive services 63,800 15.1 14.2 0.5
Other 239,500 56.6 53.9 0.4
Selected manufacturing industries:
30 0,200 0.0 0.3 -15.4 8.8 41.8
32 13,500 3.2 3.6 -0.8 0.5 0.8
33 0,700 0.2 0.1 6.4 13.5 16.7
34 17,900 4.2 3.7 0.9 0.3 1.3
Source: Eurostat. OECD RegPat. - NIW and ZEW calculations
Until today, national and regional policy provides refundable and non-refundable incentives for foreign investors
in Hungary, regardless of whether they are already engaged in the country or not. The main instruments are sub-
sidies (either from the Hungarian government or from EU Funds), tax incentives, low-interest loans, or provision
of land for free or at reduced prices.29
Another location factor is the highly skilled labour force, particularly in
engineering, IT, pharmaceutical, economics, mathematics, physics and professional services sectors. Around
two-thirds of the workforce in Hungary has completed a secondary, technical or vocational education and 90 %
of the students speak English. However, the share of employees with tertiary education in the region only
amounts to 18.7 % (2013) which is significantly lower than the country and particularly the EU-28 average
(24.8 % and 32.1 %, resp.). This indicates that the large foreign-owned subsidiaries are still focused on (stan-
dardised) production than knowledge-intensive tasks and services.
Although WT’s share in total FDI stock has decreased in recent years, WT it still ranks second after Central
Hungary, which is the most attractive region in Central and Eastern Europe as concerns FDI. The vast majority
28 Following the IW Competitiveness Index 2013, low costs are Hungary’s single outstanding advantage in a European context (IW Köln,
IW Köln Consult, Eds., 2015).
29 http://eugo.gov.hu/doing-business-hungary
104
of investments went into business services and processing industries such as automotive, computing, electronics,
optical products. More than 75 % of all FDI to Hungary originate from EU countries, nearly 25 % from Ger-
many.
There are three automotive OEMs operating in WT: two foreign-owned companies, Audi and Opel, and the Rábá
Automotive Holding Plc.:
Rába is a traditional Hungarian company with three strategic business units. It engineers, manufactures
and customises automotive components, specialty vehicles and axles for commercial vehicles, agri-
machinery and earth-movers. The company is headquartered in Györ and employs about 2,000 people
(2014). In the pre-transition era, Rábá has been the region’s traditionally largest employer, producing a
variety of industrial products including trucks and trucks components, train wagons and other engineer-
ing products. 30
Audi Hungaria Motor Kft. as a subsidy company of the German Audi AG has a large factory in Győr,
where different car types and many engines are built. The factory opened in 1993, at first only produc-
ing engines. Later production expanded to assembling. Over 90 % of Audi vehicle engines are made
here. The company has been expanding since 2008 and finally established the world’s second largest
engine plant, complemented by an own R&D centre. Employment grew by 1,800 ending up with 10,000
employed persons in Györ. Audi Hungaria thus counts to one of Hungary’s largest exporters.
Opel in Szentgotthárd (WT) was founded in 1990 as a joint venture between GM and Rábá (see above).
Since 1992, Opel is engaged in the production of middle segment petrol engines, employing 680 work-
ers. The plant is the sole producer of so called Family I (1.6 – 1.8 l) engine products for Opel’s Euro-
pean car assembly plants, but also supplies engines and manufactured engine parts for other GM brands
and produces the new generation of mid-size diesel and gasoline engines. .
The large-scale investments by OEMs attracted numerous equipment manufactures and other suppliers. Local
SMEs have also become stable and strategic partners of both locally based and Western car manufacturers and
Tier 1 suppliers. Several larger foreign subsidiaries from German automotive suppliers are located in the region,
for instance BOS Automotive, BPW-Hungary, Autoliv, LuK Savaria, Erbslöh or Rehau. Subsidiaries from other
countries are Renault Logistics (FR), IB Andresen (DK), Nemak (Mex), SMR (Ind), DANA and Jabil (USA).
Just like the automobile industry, WT’s electronics industry is also dominated by subsidiaries of foreign compa-
nies. The main foreign businesses are Shin-Etsu (J), Flextronics, GE and Delphi (USA), Provertha, Kromberg-
Schubert and Epcos (D). In contrast, larger domestic companies are mainly found in low-tech manufacturing
industries, such as mechanical engineering, timber, furniture, paper processing, textile, plastics, and food indus-
try.
The exploitation of endogenous regional potentials is facilitated by 22 industrial parks, innovation and technol-
ogy centres. Furthermore, local governments provide allowances related to the leasing and/or purchase of land,
expanding existing infrastructure capacities on industrial areas, professional help in solving legal and public
administration affairs or lobbying on regional and national political and economic levels in order to ease founda-
tion and establishment of new enterprises.31
Regional Innovation System
Albeit starting from a low basis in the mid-2000s, West Transdanubia exhibits the most favourable development
in terms of innovation performance among the Hungarian regions. Regional GERD still amounts to only 0.7 %
of regional GDP (compared to 1.2 % national average and 2.0 % in the EU-28 in 2011), but increased considera-
bly since 2006. Also business R&D (BERD) is half the size of Hungary total (0.4 % and 0.8 %, resp.). Corre-
spondingly, patent intensity (per 10,000 employees) in total manufacturing as well as in high- and medium-tech
manufacturing is still very low despite the extension of R&D activities in the course of the newly established
Audi R&D centre and its intensified collaborations with local universities since 2007.
30 Keune and Todt (2001).
31 http://hipa.hu/Region/Western Transdanubia/3
105
The Regional Innovation Monitor Plus characterises WT as a moderate R&D-intensive region, i.e. most of the
region’s innovation performance indicators are 50 to 90 % of the EU average. However, particularly those indi-
cators related to the performance of the business sector are comparatively low. As a matter of fact, companies in
WT innovate mostly by adopting technologies developed elsewhere.32
Industrial clustering effects on innovation
activities are concentrated on a small number of industries, although WT achieves high indicator scores concern-
ing industry mix and specialisation. Referring to the European Cluster Observatory, the region has only one
single so-called ‘accredited innovation cluster (ACI)’, the Pannon Wood and Furniture Industry Cluster
(PANFA), whereas there are 26 ACIs in Hungary altogether.33
However, only the automotive and electronics
clusters are highly classified.
Most of the region's research centres are university-based. The key universities are Széchenyi István University
in Győr and the University of West Hungary in Sopron and Mosonmagyaróvár. Industry-academia collabora-
tions are concentrated at Széchenyi University, which has several (automotive industry related) knowledge cen-
tres, and the University of West Hungary (wood- and eco-industry-related centres). Other relevant institutions of
higher education are the Pannon University in Keszthely (focus Agriculture) and the Berzsenyi Dániel College in
Szombathely (W4T, 2012).
The key drivers of regional innovation performance as regional universities and businesses are co-financed by
the EU structural funds and foreign direct investment.34
The subsidiaries for foreign multinational companies,
local enterprises and WT’s universities altogether have been addressed by EU funding. Foreign investors’ com-
mitment to engage in local R&D activities and to collaborate with universities has also been supported, and uni-
versities’ research infrastructure was renewed and extended. Furthermore, EU support was used to increase the
number of innovation intermediaries and other bridging institutions. However, R&D activities in WT still show
an extensive concentration on single firms and sectors. Furthermore, foreign-owned firms mostly rely on R&D
conducted outside Hungary (‘imported innovation’) and the intensity of innovation cooperation between foreign
and local firms is still low.
In summary, despite significant convergence to the Hungarian average in terms of the key innovation perform-
ance indicators, and despite an unprecedented volume of investment in new technology and research infrastruc-
ture, innovation is still mainly driven by foreign enterprises’ activity. Furthermore, the region struggles with a
mismatch between labour supply and demand (W4T, 2012).
Political Context and Regional Growth Policies
The Hungarian regional policy context is characterised by a ‘façade regionalism’35
strategy design that is charac-
terised by policy formulation at the regional level, but policy implementation at the central level. Following the
parliamentary elections in 2010, conceptualisation and decision-making about the allocation on EU Structural
Funds is centralised under the lead of the National Development Steering Committee (NDSC), constituted by the
Prime Minister and its ministers for national development and economy, respectively and the minister of the
state. Though as of 2014, NUTS 2 regions are no longer considered as the adequate basic unit of territorial de-
velopment and are no longer in charge of preparing their own development plans and RIS3 strategies. Instead,
the former managing authorities of Operational Programs (OP) became devoid of authorities, funding sources
and responsibilities and are subordinated to NDSC. This restrains the RIS3 target of smart specialisation at the
regional level implying that policy-making should be evolutionary and adaptive necessitating partnerships
among representatives of different administrative levels (Szalavetz, 2014, p. 3).
During the restructuring process, none of the former key actors and managing institutions kept its authorities or
status. The West Transdanubain Regional Development Agency (Westpa), originally owned by the WT Regional
Development Council, became first state-owned (2012) and two years later changed into the ownership of the
three NUTS 3 counties. These institutional changes which have been associated with a loss of practical knowl-
32 Technopolis group et al. (2014c).
33 According to a tender of the Hungarian Economic Development Centre (MAG), following the strategic and economic guidelines of the
New Széchenyi Plan, existing clusters in Hungary can become ‘accredited innovation clusters’ (AICs) if their submitted description of
innovation-related activities and collaborations, together with a proposal how these activities and collaborations will be developed, are
accepted. MAG (2014), Introduction of the Hungarian cluster aggregation scheme.
34 Technopolis group et al. (2014c).
35 Szalavetz (2014).
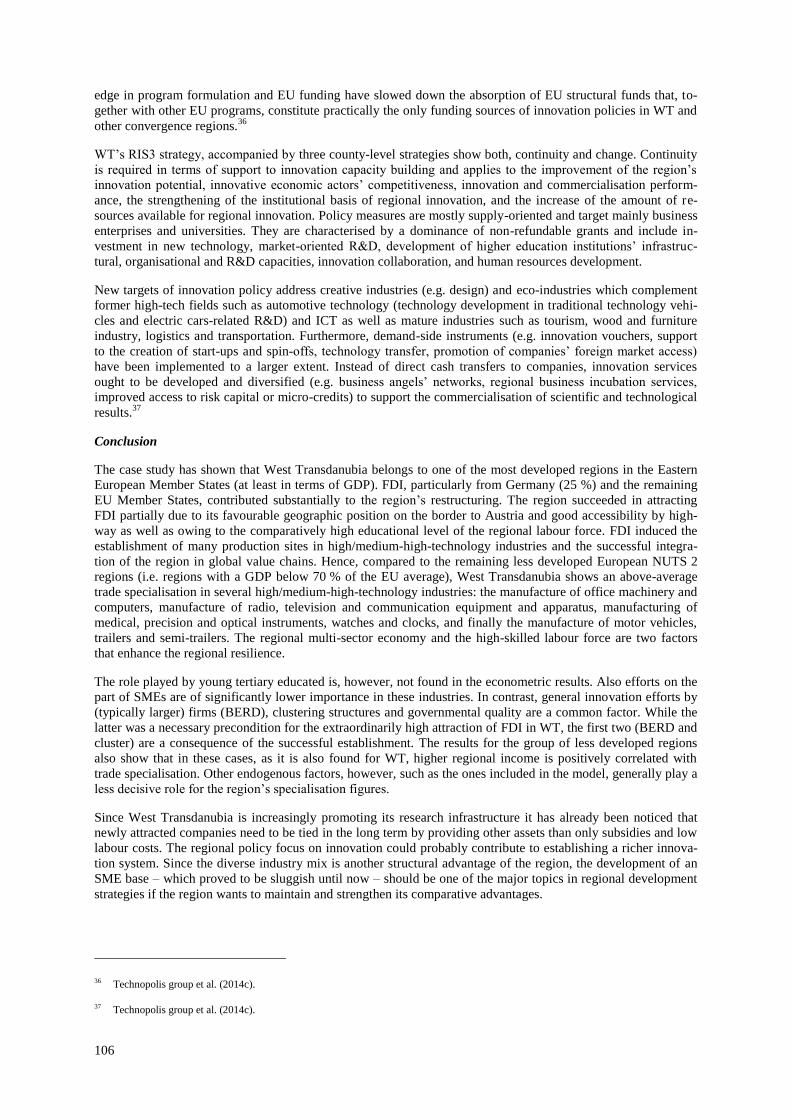
106
edge in program formulation and EU funding have slowed down the absorption of EU structural funds that, to-
gether with other EU programs, constitute practically the only funding sources of innovation policies in WT and
other convergence regions.36
WT’s RIS3 strategy, accompanied by three county-level strategies show both, continuity and change. Continuity
is required in terms of support to innovation capacity building and applies to the improvement of the region’s
innovation potential, innovative economic actors’ competitiveness, innovation and commercialisation perform-
ance, the strengthening of the institutional basis of regional innovation, and the increase of the amount of re-
sources available for regional innovation. Policy measures are mostly supply-oriented and target mainly business
enterprises and universities. They are characterised by a dominance of non-refundable grants and include in-
vestment in new technology, market-oriented R&D, development of higher education institutions’ infrastruc-
tural, organisational and R&D capacities, innovation collaboration, and human resources development.
New targets of innovation policy address creative industries (e.g. design) and eco-industries which complement
former high-tech fields such as automotive technology (technology development in traditional technology vehi-
cles and electric cars-related R&D) and ICT as well as mature industries such as tourism, wood and furniture
industry, logistics and transportation. Furthermore, demand-side instruments (e.g. innovation vouchers, support
to the creation of start-ups and spin-offs, technology transfer, promotion of companies’ foreign market access)
have been implemented to a larger extent. Instead of direct cash transfers to companies, innovation services
ought to be developed and diversified (e.g. business angels’ networks, regional business incubation services,
improved access to risk capital or micro-credits) to support the commercialisation of scientific and technological
results.37
Conclusion
The case study has shown that West Transdanubia belongs to one of the most developed regions in the Eastern
European Member States (at least in terms of GDP). FDI, particularly from Germany (25 %) and the remaining
EU Member States, contributed substantially to the region’s restructuring. The region succeeded in attracting
FDI partially due to its favourable geographic position on the border to Austria and good accessibility by high-
way as well as owing to the comparatively high educational level of the regional labour force. FDI induced the
establishment of many production sites in high/medium-high-technology industries and the successful integra-
tion of the region in global value chains. Hence, compared to the remaining less developed European NUTS 2
regions (i.e. regions with a GDP below 70 % of the EU average), West Transdanubia shows an above-average
trade specialisation in several high/medium-high-technology industries: the manufacture of office machinery and
computers, manufacture of radio, television and communication equipment and apparatus, manufacturing of
medical, precision and optical instruments, watches and clocks, and finally the manufacture of motor vehicles,
trailers and semi-trailers. The regional multi-sector economy and the high-skilled labour force are two factors
that enhance the regional resilience.
The role played by young tertiary educated is, however, not found in the econometric results. Also efforts on the
part of SMEs are of significantly lower importance in these industries. In contrast, general innovation efforts by
(typically larger) firms (BERD), clustering structures and governmental quality are a common factor. While the
latter was a necessary precondition for the extraordinarily high attraction of FDI in WT, the first two (BERD and
cluster) are a consequence of the successful establishment. The results for the group of less developed regions
also show that in these cases, as it is also found for WT, higher regional income is positively correlated with
trade specialisation. Other endogenous factors, however, such as the ones included in the model, generally play a
less decisive role for the region’s specialisation figures.
Since West Transdanubia is increasingly promoting its research infrastructure it has already been noticed that
newly attracted companies need to be tied in the long term by providing other assets than only subsidies and low
labour costs. The regional policy focus on innovation could probably contribute to establishing a richer innova-
tion system. Since the diverse industry mix is another structural advantage of the region, the development of an
SME base – which proved to be sluggish until now – should be one of the major topics in regional development
strategies if the region wants to maintain and strengthen its comparative advantages.
36 Technopolis group et al. (2014c).
37 Technopolis group et al. (2014c).
107
Table 4.22. Stylised industry-specific regression results for Transdanubia
Full sample
Less developed regions
Note: * p<0.1, ** p<0.05, *** p<0.01. Manufacture of office machinery and computers (30), Manufacture of radio, televi-
sion and communication equipment and apparatus (32), Manufacture of medical, precision and optical instruments, watches
and clocks (33), Manufacture of motor vehicles, trailers and semi-trailers (34). Control variables for bordering and seaside
location. Source: own calculations.
4.3. MAIN RESULTS OF THE CASE STUDIES
In this chapter, ten European regions have been selected for an in-depth analysis of regional factors potentially
enhancing the regional trade specialisation in certain industries. All ten case studies focus on regions that reveal
above-average export volumes and above-average revealed comparative advantages in at least three industries
over the years 2000 to 2011. Yet those industries vary considerably across regions, and trade advantages in some
industries do not unconditionally translate into economic growth and prosperity. This is especially the case for
regions that realise trade advantages in low-tech industries such as textiles, clothes, furniture or wood. As these
industries, mainly competing on price, are currently shrinking in the EU, a trade advantage does not lead to a
better economic performance. In contrast, it is mostly linked with above-average (high) employment reduction.
Regarding the specific trade specialisation patterns, the results of the case studies confirm the findings of the
descriptive analysis. Hence, they show that the economically advanced European regions (i.e. regions with an
RXA (gross exports) 30 32 33 34
(log) patent intensity 1.376 *** 0.142 -0.070 -0.699
(log) techn. innov., SMEs -23.853 -32.954 ** -32.252 *** -15.365
(log) non-techn. innov, SMEs -20.984 -37.413 * -10.329 -8.432
tertiary educ. < 35 yrs. -0.282 -1.595 *** 0.253 0.289
(log) HERD 17.693 *** 15.152 *** 7.268 ** 15.255 ***
(log) BERD 2.867 16.467 *** 5.694 * -1.687
GDP per capita 0.000 0.001 0.000 0.000
(log) population density 1.827 -2.163 -11.833 * -7.907
cluster 9.338 26.107 ** 22.107 ** 48.705 ***
business services 2.460 8.008 18.416 *** -15.138
ERDF innovation -0.210 -0.352 0.535 *** -0.151
(log) quality of governm. 44.922 *** 28.330 *** 27.184 *** 26.288 **
accessibility index 0.646 * -0.171 0.834 *** 0.858 **
R2_within 0.039 0.054 0.036 0.043
R2_between 0.302 0.160 0.589 0.228
R2_overall 0.234 0.107 0.546 0.190
No. of observations 2,800 2,800 2,800 2,800
No. of clusters 250 250 250 250
sf1 / p30 sf1 / p32 sf1 / p33 sf1 / p34 sf1 / p35
(log) patent intensity -7.422 47.256 * 0.473 -2.797
(log) techn. innov., SMEs -72.390 *** -89.440 *** -46.467 *** -93.561 ***
(log) non-techn. innov, SMEs 17.252 19.009 -29.109 *** 62.605 ***
tertiary educ. < 35 yrs. 3.614 *** 0.917 -0.506 -0.060
(log) HERD 9.549 * 11.418 *** 7.985 ** 11.409
(log) BERD -1.286 1.868 1.847 -5.718
GDP per capita 0.014 *** 0.011 *** 0.006 *** 0.009 ***
(log) population density 6.804 28.835 -2.811 67.462 **
cluster 158.860 *** 133.967 *** 42.903 26.238 ***
business services -5.243 -96.333 43.990 19.094
ERDF innovation 3.134 ** 0.211 2.642 *** -1.199
(log) quality of governm. 31.487 53.660 *** 13.888 87.463 ***
accessibility index 1.686 ** 0.605 1.003 ** 1.284
R2_within 0.397 0.273 0.134 0.239
R2_between 0.441 0.528 0.637 0.547
R2_overall 0.414 0.446 0.534 0.479
No. of observations 674 674 674 674
No. of clusters 60 60 60 60
108
above-average GDP) are frequently specialised in high-tech industries, whereas the less developed EU regions
are frequently specialised in labour-intensive, low-tech industries. Furthermore, results suggest that trade spe-
cialisation patterns are highly path-dependent and do not significantly change over time. More specifically, the
results of the case studies show that the industrial history is a decisive factor and greatly determines the current
trade specialisation patterns of European regions.
With respect to the region and industry-specific factors that potentially enhance regional trade, the results of the
case studies show that it is not possible to identify single factors explaining the above-average trade specialisa-
tion across all regions and all industries. Instead, the extent to which a regional characteristic constitutes a rele-
vant factor for explaining differences in RXAs across regions and industries largely depends on the regional
economic performance, and on the industries in which a region realises an export advantage. Thus, the findings
of the case studies are in line with the results of the descriptive and multivariate analysis outlined in Chapters 3
and 4, while being also more focused on the individual region type. They clearly show that the trade perform-
ance is region- and industry-specific. Whether a regional factor such as the regional R&D expenditures or the
share of innovating SMEs affects the international competitiveness depends on the industry a particular region is
specialised in, as well as on the level of regional economic development. More precisely, the in-depth analysis of
selected regions has shown that in more advanced EU regions focusing on high-tech industries, the regional
endowment with private R&D expenditures, high-skilled human capital and advanced universities and research
institutes plays a more important role than in regions specialised in low-tech industries, where low labour costs
and natural resources are relevant factors, fostering trade specialisation.
Drawing on these findings, the case studies identify three groups of regions that share similar characteristics with
respect to both the industries in which they reveal an above-average trade specialisation, and the regional charac-
teristics potentially affecting the trade specialisation patterns:
1. Advanced developed regions (such as Berkshire, Buckinghamshire, Oxfordshire; Middle Franconia;
Overijssel; Sydsverige) that are predominantly specialised in high-tech industries. In these regions, uni-
versities are key actors, and dense business services clusters are present and seem to be decisive factors
for regional growth. Furthermore, the regions are characterised by geographical proximity to metropoli-
tan centres, further enhancing the regional economic performance. Some of these regions which are
primarily specialised in high-tech industries (e.g. Middle Franconia or Sydsversige) also reveal trade
specialisation in low-tech industries. The latter, however, are of decreasing importance or have under-
gone a transformation specialising on the most innovative edges on these low-tech industries. The tex-
tile industry in Overijssel, for instance, increasingly specialises on technological textiles. (Regional)
policies in these regions should – and do – primarily focus on further developing the regional research
infrastructure and on strengthening its agile SMEs. Leading companies are identified to some extent but
regional economies and innovations systems do not substantially depend on them. In contrast, they in-
creasingly benefit from the local innovation potential and knowledge-oriented structural change. Future
perspectives in these regions are thus positive.
2. Less developed and transition regions (such as Castile–La Mancha, Norte, Puglia) that are locked in
their specialisation on labour-intensive, low-tech industries such as the textile and clothing industry,
leather industry or furniture industry. Existing comparative advantages in these regions rely on long in-
dustrial traditions. However, the growing price competition on international markets arising from newly
developing countries is a permanent challenge. Thus, the regions under consideration would probably
benefit from refining their industrial composition in favour of business services and functional speciali-
sation on higher-value activities such as design, marketing and management. Approaches aiming at di-
versifying the industry structures suffer from low critical masses of regional R&D activities – in busi-
nesses as well as in public institutions – and a lack of attractiveness for FDI. Furthermore, the regions
seem to suffer from a brain-drain of the young and high-skilled.
3. Old-industrial regions from the former Eastern bloc, including East Germany (Chemnitz, Jihozápad,
West Transdanubia) that are specialised in high-tech industries as well as in medium- and low-tech in-
dustries. In contrast to the less developed regions of the EU-15, these regions succeeded in attracting
significant FDI and establishing large production clusters with several multinational leading companies.
Especially Chemnitz succeeded in restructuring its outdated industries and production sites and created
conditions for increasing integration into a rich regional innovation system. Skilled labour supply, how-
ever, is a crucial factor which might impede further development unless successfully tackled. The two
Eastern European regions in the Czech Republic and Hungary, respectively, face the challenge of trans-
forming their initial cost and fiscal advantages into knowledge-based foundations for the regional econ-
omy.

109
Translated into the political context, the results reveal that it is not possible to proclaim a one-size-fits-all re-
gional growth strategy. Instead, policy recommendations should (and do) vary considerably across regions.
While the economically advanced regions should focus on further developing the regional research infrastructure
and on strengthening agile SMEs, the less developed regions in both the old EU-15 and in Eastern Europe should
concentrate primarily on the expansion of the skill level of the regional labour force and the endogenous poten-
tial for the foundation of new innovative firms. Furthermore, they should focus on the establishment of business
services in order to increase the ties of the regional companies and foster cooperation among regional actors.

111
Chapter 5. CONCLUSIONS AND POLICY IMPLICATIONS
This study has introduced a suitable method to break down national trade data to the regional level. This allows
to produce trade indicators at the regional level, in particular revealed export advantages (RXAs) and revealed
comparative advantages (RCAs). Identifying the industries in which a region realises a strong trade
specialisation plays a twofold role in industrial and regional policy-making. Firstly, identifying successful
structures at the industry-region level helps to improve the understanding of micro- and meso-foundations of
competitiveness and the scope and cases for policy intervention. Secondly, infromation on the spatial distribution
of competititve industries and required location factors is necessary for gaining differentiated perspectives on
future economic development and the choice of policy instruments.
Patterns of Regional Export Specialisation
Descriptive results have shown that high and low-income regions exhibit different trade specialisation patterns.
While high-income regions on average tend to be specialised in high-technology-intensive goods, but are less
competitive in less technology-intensive goods, low-income regions are specialised in medium-low- and low-
technology-intensive goods trade, but show some deficits in the high-technology trade. The medium-income
regions are somewhere in between, having slight disadvantages in the high-technology trade, and a more or less
balanced specialisation in the medium-low- and low-technology goods trade. Accordingly, the geographic distri-
bution of export advantages in the ‘high/medium-high-technology-intensive’ goods trade follows a more or less
distinct core-periphery pattern in the EU.
When looking at the dynamics, results suggest that large changes in the regions’ specialisation patterns over time
are relatively rare events. Although the size of revealed export advantages may increase or decrease over time, a
complete shift of the revealed specialisation structure, i.e. moving from being specialised in exporting low-
technology-intensive goods to being specialised in exporting high- and medium-high-technology goods, is quite
unlikely. This implies that the development of specialisation patterns is path-dependent. This is important to
know for the development of smart specialisation strategies, because it suggests that their reference point should
be the existing strengths of the regions. It also confirms the important role scientific, technological and economic
specialisation plays for the development of comparative advantage and regional economic growth as it is also
one distinct area for conceptual and policy implications of smart specialisation (OECD, 2013).
Regional Determinants
Along with the descriptive analysis, the study also investigated in a multivariate approach which region and
industry-specific factors are related to success on international markets. As far as the cross-sectional analysis is
interpreted, shifting from competitive low-technology to competitive high-technology exports would also require
fundamental changes in other regional characteristics, in particular those concerning the innovation system.
Although innovation (measured by patents as a throughput indicator) significantly increases competitiveness in
nearly every industry, it becomes clear that the structures of regional innovation systems vary between
industries. Competitiveness in low- and medium-low-technology industries is linked to innovative SMEs,
althoughit is not necessarily linked to firm-specific R&D. Instead, non-technological innovations without sig-
nificant R&D efforts or impulses from other actors, such as HEIs, seem to be similarly important. This illustrates
the high relevance of successful cooperation and knowledge transfer between local firms and higher education
institutions particularly in those low- and medium-low-technology industries. High-technology industries, in
contrast, are often located in larger and diverse regions and their innovation outcomes rely more heavily on the
innovation performance of larger firms.
Regional industrial legacies are especially strong in some high-technology industries. The same is true for
competitive low-technology industries which are also heavily bound to existing regional characteristics.
Conversely, the fewest regional dependencies are found for the manufacture of motor vehicles and other
transport equipment as well as for some medium-low-technology industries. However, although competitiveness
in these industries is only to a small extent explained by regional characteristics, it is well known that large
multinational companies, whose site location is mainly determined by the advantages of the international
division of labour, market access conditions and favourable financial conditions (for FDI), are also responsible
for regional competitiveness in several cases.
The regional endowment with HEIs is possibly one of the most directly susceptible regional characteristics when
it comes to policy implications. However, in order to promote competitiveness in medium-high/high-technology
112
industries, guaranteeing quality of government is likewise important; it probably requires fewer fiscal resources
and enables the economy to evolve unaffected by industrial and related planning strategies. Also several other
studies conclude that the regions with good governance are generally those which are less likely to require policy
assistance (McCann and Ortega-Argilés, 2013; Ederveen et al., 2006). Clustering effects are still visible, which
underlines the structural embeddedness of highly competitive industries. However, cluster policies need to
provide perspectives on future technological developments, especially in bordering industries, in order to meet
the requirements of smart specialisation strategies (S3). In regions with lower political capacities (governmental
quality, cluster management) it is suggested first to build up social capital and opportunities for entrepreneurial
discovery as a necessary precondition before initiating bottom-up processes such as S3 (European Commission,
2013).
In summary, the results of the multivariate regression analysis show that the impact of both region- and industry-
specific factors is not homogeneous across industries and regions. It varies considerably between less developed
and advanced regions, as well as between low- and high-tech industries. Any policy implication is therefore a
case for place-based approaches.
Case studies
The findings of the case studies are in line with the results of the descriptive and multivariate analysis. The in-
depth analysis of selected regions has shown that less developed regions are predominantly specialised in low-
tech industries, while the more advanced European regions exhibit above-average export shares in high-tech
industries such as the chemical and pharmaceutical or medical industries.
Conclusions are derived for the three types of regions which are represented in the case studies. The advanced
developed regions (Berkshire, Buckinghamshire, Oxfordshire; Middle Franconia; Overijssel; Sydsverige) alto-
gether show several distinctive features. Universities are key actors, accompanied by sufficiently present busi-
ness services and ‘borrowed size’ from proximate metropolitan centres. They host not only high-tech industries
but also low-tech industries with high comparative advantages. The latter, however, are of decreasing importance
or have successfully transformed themselves and now focus on innovation in niche products. (Regional) policy is
further developing the research infrastructure and clearly addresses its agile SMEs. Leading companies are iden-
tified to some extent, but regions’ economies and innovation systems do not substantially depend on them. In
contrast, they increasingly benefit from the local innovation potential and knowledge-oriented structural change.
Future perspectives are thus positive.
Concerning the less developed and transition regions, those considered from the EU-15 (Castile–La Mancha,
Norte, Puglia) are somewhat caught in their specialisation. Approaches aiming at diversifying the industry struc-
tures suffer from low critical masses and a lack of attractiveness for FDI. Universities have not played a crucial
role thus far. Existing comparative advantages rely on long industrial traditions and are found to be driven
mainly by innovative SMEs in the region. Price competition on international markets, however, is a permanent
challenge, and the regions under consideration would probably benefit from refining their industrial composition
in favour of business services and functional specialisation on higher-value activities such as design, marketing
and management. This goal is challenged by the problem of competing for skilled labour supply with more cen-
tral locations.
The transition and less developed regions of Central and Eastern Europe (Chemnitz, Jihozápad, West Transda-
nubia), in contrast, attracted significant FDI and established large production clusters with several multinational
leading companies. Chemnitz in particular succeeded in restructuring its outdated industries and production sites
and created conditions for increasing integration into a rich regional innovation system. Skilled labour supply,
however, is a crucial factor which might impede further development unless successfully tackled. The two East-
ern European regions face the challenge of transforming their initial cost and fiscal advantages into knowledge-
based foundations for the regional economy. Besides the development of a strong human capital base, new firm
formation and building up coherent regional innovation systems are important pillars for transforming their pro-
duction orientation into a functional specialisation on highly skilled tasks carried out at the other end of the
(global) value chain. Focusing on these goals in order to raise income levels and sustain or expand their indus-
trial competencies in and around the city centres, in the intermediate term, (medium-) skilled workers are the
backbone of most manufacturing industries. Therefore, it is necessary to monitor the education system as to
whether it provides further opportunities to develop this human capital base on the way to an even more knowl-
edge-intensive production technology. The cases of the two Eastern European regions provide evidence that not
just the accumulation of capital, but also structural change, is a driver of economic growth.
Considering this and the above-mentioned result that a radical change in regional specialisation patterns is very
rare, it is recommended to strengthen the endogenous potential of regions by encouraging the transformation of
113
economic activities from a structural perspective instead of aiming at radical changes in the industrial structure.
In most cases this implies modernising existing industries or enabling lagging sectors to improve their
competitiveness, for example through the adoption of General Purpose Technologies (GPT) such as ICT and the
specialisation in specific functions or activities along the supply chain (e.g. design, R&D, procurement,
operations, marketing, and customer services) (OECD, 2013). Innovation policy measures should thus not only
focus on technological projects and capabilities but also on business strategies of a non-technological character.
This is particularly relevant for innovative SMEs that play an important role for revealed export specialisation
advantages in low- and medium-low-technology industries. Furthermore, HEIs are potentially crucial actors for
providing access to GPT applications and organisational strategies, both via collaboration as well as developing
the local highly skilled labour supply. If they succeed in creating not just geographical but also cognitive and
technological proximity, HEIs are important vehicles for implementing place-based approaches in different
transmission channels (European Commission, 2014).
General policy conclusions
Regional strategies should focus on industries or clusters which have growth and innovation potential. The
selection of priorities should be made on the basis of already existing strengths or expertise within the region that
provide suitable reference points for diversifying regional activities into areas of related expertise. Hence,
strategies that help to cross boundaries of related industries, technology fields and activities may help regional
economies to diversify into complementary fields. Here, experienced entrepreneurship is a key mechanism
through which regional economies can diversify successfully into new industries (spinoffs) (Boschma and
Gianelle 2014). To improve growth opportunities, innovation strategies should also place emphasis on the
development of inter-regional cooperation and support firms engaged in inter-regional and international
knowledge networks (Charles et al., 2012). Policies promoting labour mobility between related industries may
also enhance the recombination potential of regions and increase regional competitiveness and growth. It might
also be crucial to stimulate the inflow of skilled labour from other regions and countries, because that brings new
ideas and knowledge to the regions (Saxenian, 2006, Boschma and Gianelle, 2014). Existing clusters in
particular are challenged to promote these dynamics instead of being evaluated only by static success indicators
(European Commission, 2013).
An important point to keep in mind when developing such policies is the geographical or administrative level at
which these policies should be conducted. Is it going to be at the European, national or regional level? EU struc-
tural and regional policy is peculiar in this respect: as it is designed at the European level, yet is flexible enough
to be tailored to the regions’ needs. S3, being part of EU regional policy, is much more specific as it explicitly
targets regional R&D and innovation. It is thus less flexible than general EU regional policy, raising the question
of whether it, too, can be tailored to the needs of the ‘less developed regions’ in particular. The analysis has
shown that these regions are mostly specialised in the export of low- and medium-low-technology-intensive
products. At the same time, it was found that one source of being successful and competitive in these types of
exports is represented by innovative SMEs. These facts provide a direct link to S3. However, one question in this
respect is whether S3, by supporting R&D and innovation of SMEs, will pick only the regions’ champions, i.e.
those firms being able to absorb the funds dedicated to S3, or whether it will also promote the emergence of new
firms. The number of eligible firms might be too small, especially in ‘less developed regions’, to exhibit signifi-
cant regional economic effects, despite perhaps spillover and trickle-down effects to other firms in the regions. If
the number of such capable leading firms is limited, S3 may also be connected with a clustering strategy. In this
respect, and as S3 focuses on R&D, such clustering may not necessarily be defined in terms of geographical
proximity, but rather by technological proximity in the sense of creating regional R&D value added chains.
S3 specifically and regional policies in general are also suited to linking up local firms with existing HEIs by
encouraging and fostering the exchange of knowledge or joint research efforts. However, these policies might be
less suited to promoting non-technical innovations, especially those referring to issues of promotion and market-
ing, the adoption of new forms of work organisation or even the adoption of existing technologies, which could
be a major issue for many firms in ‘less developed regions’. This would be the role of business services. Yet the
case study analysis as well as the regression analysis for this type of regions have shown that, firstly, these ser-
vices are generally less developed in the EU’s peripheral regions and, secondly, only contribute to trade speciali-
sation in high-technology industries. Here, national strategies to develop these services may, for a number of
countries, be more appropriate than explicit regional strategies, firstly because it is a country-wide issue, but also
because it may require changes in the educational and institutional system which are unlikely to be carried out at
the regional level. However, setting up business services firms in economically less developed regions is not the
first step in developing a region’s economic structure, but rather an accompanying one if demanding manufactur-
ing firms have successfully been attracted. National strategies are also to be preferred when it comes to raising
the educational level of the workforce or the general improvement of HEIs. This is because educational matters
are most likely to be subject to national and not regional policy matters.
114
Trade specialisation patterns are highly path-dependent and do not significantly change over time. More specifi-
cally, the results of the case studies show that the industrial history is a decisive factor and greatly determines the
current trade specialisation patterns of European regions. Despite these path-dependencies it is found that tech-
nological progress spurred the reinvention of traditional industries rooted in the regions. The industries have
evolved and adopted new technologies, although these processes were not necessarily induced by policy meas-
ures. Although policy can provide the ground for entrepreneurial discovery, as suggested by smart specialisation
strategies, there is no broad evidence that similar policies were once responsible for the success stories that are
reported in the case studies. The basis of these developments, at least in the CEE regions, was rather high levels
of physical investment, mostly conducted by foreign multi-national enterprises. S3 or other regional policies are,
because of a lack of funds, unlikely to deliver this. Investing in new areas of production and thus breaking the
current pattern of specialisation requires great financial and organisational effort. EU-wide policies (such as the
Juncker Plan) or national policies via state involvement in firms, support schemes and institutional arrangements
to encourage and increase the level of investment could be much more promising in this respect than S3. How-
ever, S3 at least induces politicians to focus their economic and especially innovation-related measures on eco-
nomic activities that can cut across traditional boundaries. It is their task to provide an environment for firms and
HEIs to seek technological and business opportunities. This also requires permanent evaluation of the measures
initiated and the formulation of exit strategies in order to avoid adverse (political) lock-in effects (European
Commission, 2013).
Some final remarks concern the analytic potential of the data generated. This study provides descriptive evidence
for major sectors, multivariate analysis of disaggregated industries and case studies for selected regional configu-
rations. However, these analyses are only a first step in exploring the ways in which the data allow to investigate
regional structures and dynamics, thus enabling the drawing of conclusions with respect to policy implications.
Depending on industries and regions of interest as well as the availability of more suitable (industry-specific)
supplementary information, many more insights can be drawn from the dataset which is expected to be devel-
oped and assessed further by the European Commission. Together with the recently published ‘S3 Inter-regional
Trade and Competition Tool’ (http://s3platform.jrc.ec.europa.eu/s3-trade-tool), which aims to identify competi-
tors at the regional level, the EC then provides a profound empirical basis to critically reflect the diverse smart
specialisation strategies submitted by European regions in the course of the EU Cohesion policy funding period
2014-2020.
115
Chapter 6. REFERENCES
Abel, J., Ittermann, P., Hirsch-Kreinsen, H. (2012), Einfacharbeit in der Gummi- und Kunststoffindustrie.
Soziologisches Arbeitspapier, p. 30.
Agrimi, A., Zonno, A. M. (2012), Puglia Region: The path towards a RIS3 strategy. Presentation at Smart
Specialisation Platform, 03.05.2012.
Asheim, B., Gertler M. (2005), The Geography of Innovation: Regional Innovation Systems. The Oxford
Handbook of Innovation, pp. 291–317.
Associated Press (2011), Portugal’s cork industry fights modern challenges. ctv news, 31.07.2011,
http://www.ctvnews.ca/portugal-s-cork-industry-fights-modern-challengers-1.677594 ,last accessed on
16.03.2015.
Bach, E. (2004), Forschung für die Automobilindustrie in der Hochschullandschaft Sachsen. VDI-Bericht, no.
1851, pp. 83–90.
Balassa, B. (1965), Trade Liberalisation and Revealed Comparative Advantage. The Manchester School, no.
33(2), pp. 99–123.
Balassa, B., Noland, M. (1989), “Revealed” Comparative Advantage in Japan and the United States. Journal of
International Economic Integration, 4(2), pp. 8–22.
Baum, K., Ziegenbalg, B. (2011), Industrielle (Weiße) Biotechnologie in Sachsen. ifo Dresden berichtet, 18(2),
pp. 7–15.
Behr, M., Geissler, U. (2005), Entwicklung des Fachkräftebedarfs in ausgewählten Branchen und regionalen
Clustern in der Wirtschaftsregion Chemnitz-Zwickau. ifo Dresden berichtet, 6(5), pp. 15–24.
Bellais, R. (Ed.) (2014), The Evolving Boundaries of Defence: An Assessment of Recent Shifts in Defence Activi-
ties. (23), Emerald Group Publishing.
Benacek, V. (2010), Is the Czech economy a success story?: The case of CzechInvest, the strategic promotion
agency in Czech industrial restructuring. United Nations, Division of International Trade and Integration.
Berka, M., Hennersdorf, J., Holst, G., Krippendorf, W., Richter, U. (2007), Die Struktur des Maschinenbaus in
Ostdeutschland. Ansatzpunkte einer arbeitsorientierten Branchenstrategie. OBS-Arbeitsheft, 47.
Blind, K., Edler, J., Frietsch, R., Schmoch, U. (2006), Motives to patent: empirical evidence from Germany.
Research Policy, 35 (5), pp. 655–672.
Blind, K., Cremers, K., Mueller, E. (2009), The influence of strategic patenting on company patent portfolios.
Research Policy, 38 (2), pp. 428–436.
Bloom, N., Van Reenen, J. (2007), Measuring and Explaining Management Practices Across Firms and
Countries. Quarterly Journal of Economics, 122 (4), pp. 1351–1408.
Bloom, N., Sadun, R., Van Reenen, J. (2012), The Organisation of Firms across Countries. The Quarterly
Journal of Economics, 127(4), pp. 1663–1705.
Boschma, R., Gianelle, C. (2014), Regional Branching and Smart Specialisation Policy. JRC Technical Reports,
S3 Policy Brief Series No. 06/2014.
Bröcker, J., Korzhenevych, A., Schürmann, C. (2010), Assessing Spatial Equity and Efficiency Impacts of
transportation Infrastructure Projects. Transportation Research B, 44, pp. 795–811.
Brühlhart, M., Crozet, M., Koenig, P. (2004), Enlargement in the EU Periphery: The Impact of Changing
Market Potential. The World Economy, 27(6), pp. 853–875.
116
Carlin, W., Schaffer, M., Seabright, P. (2004), A Minimum of Rivalry: Evidence from Transition Economies on
the Importance of Competition for Innovation and Growth. The B.E. Journal of Economic Analysis & Policy,
3(1).
Carney, S. (2014), Czech Central Bank to Keep Koruna Weak Until 2016. The Wallstreet Journal,
http://www.wsj.com/articles/czech-central-bank-to-keep-koruna-weak-until-2016-1406815275 , last accessed on
16.03.2015.
Casalino, P., Agrimi, A. (n.d.), Smart Puglia 2020. Presentation, Region Puglia.
Charles, D., Gross, F., Bachtler, J. (2012), Smart Specialisation and Cohiseion Policy – A Strategy for all
Regions?. IQ-Net Thematic Paper No. 30(2) presented at the 32nd
IQ-Net Conference in Tampere, Finland, 18-
20 June 2012.
Charron, N., Lapuente, V., Dijkstra, L. (2014), Regional Governance Matters: A Study on Regional Variation in
Quality of Government within the EU. Regional studies, 48(1), pp. 68–90.
Cooke, P. (2001), Regional Innovation Systems, Clusters, and the Knowledge Economy. Industrial and Corporate
Change, 10(4), pp. 945–974.
Crespo-Cuaresma, J., Doppelhofer, G., Feldkircher, M. (2014), The Determinants of Economic Growth in
European Regions. Regional Studies, 48(1), pp. 44–67.
Curritidores Espanoles, (2015), La Industria Espanola del Cuidos. http://www.leather-spain.com/sector.asp?m=2
Czarnitzki, D., Lopes-Bento, C. (2013), Value for Money? New Microeconometric Evidence on Public R&D
Grants in Flanders. Research Policy, pp. 76–89.
Delgado, M., Ketels, C., Porter M.E., Stern, S. (2012), The Determinants of National Competitiveness. NBER
Working Paper Series, N° 18249.
Dinescu, M. (2010), Case Study Jihozápad. In: Quality of Government Institute. University of Gothenburg,
Measuring the Quality of Government and Subnational Variation, pp. 95–109.
Duranton, G., Puga, D. (2004), Micro-Foundations of Urban Agglomeration Economies. Handbook of Regional
and Urban Economics, pp. 2063–2117.
Ederveen, S., de Groot, H., Nahuis, R. (2002), Fertile soil for structural funds? A panel data analysis of the
conditional effectiveness of European cohesion policy. CPB Discussion Paper 10, CPB Netherlands Bureau for
Economic Policy Analysis.
EUGO Hungary (2013), Doing business in Hungary. http://eugo.gov.hu/doing-business-hungary, last accessed
on 16.03.2015.
EURES (2014), Labour Market Information.
https://ec.europa.eu/eures/main.jsp?catId=442&acro=lmi&lang=en&countryId=ES®ionId=ES4&nuts2Code=
ES42&nuts3Code=null®ionName=Castilla-La%20Mancha , last accessed on 16.03.2015.
European Commission (2009), Challenge for EU support to innovation in services – Fostering new markets and
jobs through innovation. Commission Staff Working Document SEC(2009)1195 final, Commission of the
European Communities.
European Commission (2013), The Role of Clusters in Smart Specialisation Strategies. Luxembourg.
European Commission (2014a), Investment for jobs and growth. Promoting development and good governance
in EU regions and cities. Sixth report on economic, social and territorial cohesion.
European Commission (2014b), The role of Universities and Research Organisations as drivers for Smart
Specialisation at regional level. Luxembourg.
European Commission (2015a), Puglia, Regional Innovation Monitor Plus. https://ec.europa.eu/growth/tools-
databases/regional-innovation-monitor/base-profile/puglia, last accessed on 16.03.2015.
117
European Commission (2015b), South East, Regional Innovation Monitor Plus.
https://ec.europa.eu/growth/tools-databases/regional-innovation-monitor/base-profile/south-east, last accessed on
16.03.2015.
European Commission (2015c), Castilla La Mancha: Baseline Profile, Regional Innovation Monitor Plus.
https://ec.europa.eu/growth/tools-databases/regional-innovation-monitor/base-profile/castilla-la-manchabaseline-
profile , last accessed on 16.03.2015.
European Commission (2015d), Saxony, Regional Innovation Monitor Plus. https://ec.europa.eu/growth/tools-
databases/regional-innovation-monitor/base-profile/saxony, last accessed on 16.03.2015.
European Commission (2015e), Southwest Region, Regional Innovation Monitor Plus.
https://ec.europa.eu/growth/tools-databases/regional-innovation-monitor/base-profile/southwest-region , last
accessed on 16.03.2015.
European Commission (2015f), Bavaria , Regional Innovation Monitor Plus. https://ec.europa.eu/growth/tools-
databases/regional-innovation-monitor/base-profile/bavaria, last accessed on 16.03.2015.
European Commission (2015g), North Region of Portugal, Regional Innovation Monitor Plus.
https://ec.europa.eu/growth/tools-databases/regional-innovation-monitor/base-profile/north-region-portugal, last
accessed on 16.03.2015.
European Commission (2015h), Overijssel. https://ec.europa.eu/growth/tools-databases/regional-innovation-
monitor/base-profile/overijssel, last accessed on 16.03.2015.
European Commission (2015i), South Sweden. https://ec.europa.eu/growth/tools-databases/regional-innovation-
monitor/base-profile/south-sweden, last accessed on 16.03.2015.
European Commission (2015j), West-Transnubia. https://ec.europa.eu/growth/tools-databases/regional-
innovation-monitor/base-profile/west-transdanubia , last accessed on 16.03.2015.
European Commission (2015k), Regional innovation policy trends in the Norte Region, Portugal.
https://ec.europa.eu/growth/tools-databases/regional-innovation-monitor/news/regional-innovation-policy-
trends-norte-region-portugal, last accessed on 16.03.2015.
Fagerberg, J. (1988), International Competitiveness. Economic Journal, 98(391), pp. 355–374.
Fertő, I., Hubbard, L. J. (2001), Regional comparative advantage and competitiveness in Hungarian agri-food
sectors. Paper presented at the 77th
EAAE Seminar /NJF Seminar No. 325, August 17–18, Helsinki.
Florio, M., Pellegrin, J., Sirtori, E. (2014), Research Intensive Clusters and Regional Innovation Systems: A
Case Study of Mechatronics in Apulia. Working paper N° 03/2014, Centre for Industrial Studies.
Frietsch, R., Schmoch, U., van Looy, B., Walsh, J.P., Devroede, R., Du Plessis, M., Jung, T., Meng, Y.,
Neuhäusler, P., Peters, B., Schubert, T. (2010), The Value and Indicator Function of Patents. Studien zum
deutschen Innovationssystem, N° 15/2010, Berlin, EFI.
Gehle, Dechant, S., Steinfelder, J., Wirsing, M. (2010), Export, Import, Globalisierung. Deutscher Außenhandel
und Welthandel, 2000 bis 2008. Statistisches Bundesamt (ed.), Wiesbaden.
Greenaway, D., Milner, C. (1993), Trade and Industrial Policy in Developing Countries: A Manual of Policy
Analysis. Houndmills, The Macmillan Press.
Günther, J., Bochow, A. (2005), Die Automobilindustrie in den neuen Bundesländern (Studie im Auftrag des
Verbands der Automobilindustrie (VDA)). Institut für Wirtschaftsforschung Halle, Max-Planck-Institut zur
Erforschung von Wirtschaftssystemen Jena.
Head, K., Mayer, T. (2004), The Empirics of Agglomeration and Trade. In: Handbook of Regional and Urban
Economics (Vol. 4) Elsevier.
Heidenreich, M., Miljak, V. (2004), The Economic Region of Central Franconia. Bamberg.
Henderson, J. V. (1974), The sizes and types of cities. The American Economic Review, 64(4), pp. 640–656.
118
Henderson, J. V. (1982), Systems of cities in closed and open economies. Regional Science & Urban Economics,
12(3), pp. 325–350.
Henning, M., Moodysson, J., Nilsson, M. (2010), Innovation and regional transformation: from clusters to new
combinations. Region Skåne.
Hungarian Investment Promotion Agency (2015), Western Transdanubia. Business Information.
http://hipa.hu/Region/Western%20Transdanubia/3, last accessed on 16.03.2015.
Iapadre, P. L. (2001), Measuring International Specialisation. International Advances in Economics Research,
7(2), pp. 173–183.
Industrie- und Handelskammer Chemnitz (2014), Automotive Industry.
http://www.chemnitz.ihk24.de/servicemarken/ueber_uns/Welcome_to_our_English_Service_Center/Industry/27
92220/Automotive_Industry.html
Institut der deutschen Wirtschaft Köln, Institut der deutschen Wirtschaft Köln Consult (Eds.) (2015),
Manufacturing in Europe. A growth engine in the global economy.
IPEX International Trade and Investment (2015), Castilla-La Mancha welcomes you.
Keune, M., Tóth, A. (2001), Case Study of Area Responses to Globalisation: Foreign Direct Investment, Local
Suppliers and Employment in Györ, Hungary. International Labour Office.
Krugman, P. (1991), Geography and trade. Leuven University Press, Leuven.
Krugman, P., Venables, A. (1990), Integration and the competitiveness of peripheral industry. Unity with
Diversity in the European Community, pp. 56–77.
Krugman, P., Venables, A. (1993), Integration, specialisation, and the adjustment. N° w4559, National Bureau
of Economic Research.
Lawton-Smith, H. (2004), The biotechnology industry in Oxfordshire: enterprise and innovation. European
planning studies, 12(7), pp. 985–1001.
Lawton-Smith, H. (2009), The high-tech cluster of Oxfordshire, United Kingdom. In: OECD: Clusters,
Innovation and Entrepreneurship, OECD Publishing, Paris, pp. 73–102.
Legler, H., Frietsch, R. (2007), Neuabgrenzung der Wissenswirtschaft – forschungsintensive Industrien und
wissensintensive Dienstleistungen (NIW/ISI-Listen 2006). Studien zum deutschen Innovationssystem Nr. 22-
2007, Hannover/Karlsruhe.
Legler, H., Licht, G., Egeln, J. (2000), Germany’s Technological Performance. Summary Report 1999, Federal
Ministry of Education and Research, Bonn.
Legler, H., Frietsch, R. (2006), Neuabgrenzung der Wissenswirtschaft: forschungsintensive Industrien und
wissensintensive Dienstleistungen (NIW/ISI-Listen 2006). ISI, Fraunhofer Institut System-und
Innovationsforschung.
Leo, K., Polte, A. (2013), Hocheffiziente Organische Bauelemente, neue Entwicklungen aus Sachsen. Acatech
Diskussion, pp 123-135.
Lucas, R. E. (1988), On the Mechanics of Economic Development. Journal of Monetary Economics, 22(1), pp.
3–42.
Lundequist, P., Power, D. (2002), Putting Porter into practice? Practices of regional cluster building: evidence
from Sweden. European Planning Studies, 10(6), pp. 685–704.
MAG (Hungarian Economic Development Centre) (2014), Introduction of the Hungarian cluster aggregation
scheme. https://www.google.de/search?q=MAG+Introduction+to+the+Hungarian+cluster&ie=utf-8&oe=utf-
8&gws_rd=cr&ei=ql8aVd_NFsTyPPzHgYgM#
119
McCann, P., Ortega-Argilés, R. (2013), Transforming European regional policy: a results-driven Agenda and
smart specialisation. Oxford Review of Economics Policy, Vol. 29, No. 2, pp.405-431.
Mrak, M., Richter, S., Szemlér, T. (2015), Cohesion Policy as a Function of the EU Budget. Wiiw Research
Report 400, May 2015.
Nehm, Veres-Homm, (2012), Logistikstandort Nürnberg. Frauenhofer ISI.
OECD (2006), Progress in Policy Reforms to Improve the Investment Climate in South East Europe. OECD
Investment Reform Index, Paris.
OECD (2012), OECD Territorial Reviews: Skåne, Sweden 2012. OECD Publishing.
OECD (2013), Innovation-driven Growth in Regions: The Role of Smart Specialisation. Paris, OECD
Publishing.
Pike, A., Marlow, D., McCarthy, A., O’Brien, P., Tomaney, J. (2015), Local institutions and local economic
development: the Local Enterprise Partnerships in England, 2010–. Cambridge Journal of Regions, Economy
and Society.
Porter, M. E. (1990), The Competitive Advantage of Nations. New York, The Free Press.
Porter, M. E. (1998), Measuring the Microeconomic Foundations of Economic Development. The Global
Competitiveness Report 1998, Geneva, World Economic Forum.
Porter, M.E., Sakakibara, M. (2004), Competition in Japan. Journal of Economic Perspectives, 18(1), pp. 27–50.
Regierung Mittelfranken (2014), Wirtschaftsstandort Mittelfranken.
https://www.regierung.mittelfranken.bayern.de/mittelfr/mfr200st.htm
Rodriguez, V. (2014), Castilla-La Mancha. Encyclopeadia Britannica
http://www.britannica.com/EBchecked/topic/98577/Castile-La-Mancha
Rodriguez-Pose, A. (2013), Do Institutions Matter for Regional Development?. Regional Studies, 47(7), pp.
1034–1047.
Romer, P. (1986), Increasing Returns and Long-Run Growth. Journal of Political Economy, 94(5), pp. 1002–
1037.
Rosenthal, S., Strange, W. (2004), Evidence on the Nature and Source of Agglomeration Economics. In:
Handbook of Regional and Urban Economics (Vol. 4) Elsevier.
Sachs, J. (2005), The End of Poverty. New York City, NY, Penguin.
Sächsische Staatskanzlei (2014), Sachsens Zukunft gestalten.
http://www.medienservice.sachsen.de/medien/news/195617
Sächsisches Staatsministerium für Wirtschaft, Arbeit und Verkehr (2014), Strukturfonds in Sachsen.
http://www.strukturfonds.sachsen.de/256.html
Sarti, F. M., Lasagna, E., Panella, F., Lebboroni, G., Renieri, C. (2010), Wool quality in Gentile di Puglia sheep
breed as measure of genetic integrity. Italian Journal of Animal Science, 5(4), pp. 371-376.
Saxenian, A. L. (2006), The new argonauts. Regional advantage in a global economy. Cambridge MA: Harvard
University Press.
Scheuplein, C., Jürgens, U., Meißner, H.R., Hüner, A. (2007), Im Windschatten beschleunigt: Die
Automobilindustrie in Ostdeutschland 1995-2006. OBS-Arbeitsheft 49.
Schiffers, M. (2013), Politik und Regierung in Bayern. Springer Wiesbaden.
Schmoch, U., LaVille, F., Patel, P., Frietsch, R. (2003), Linking Technology Areas to Industrial Sectors. Final
Report to the European Commission, DG Research.
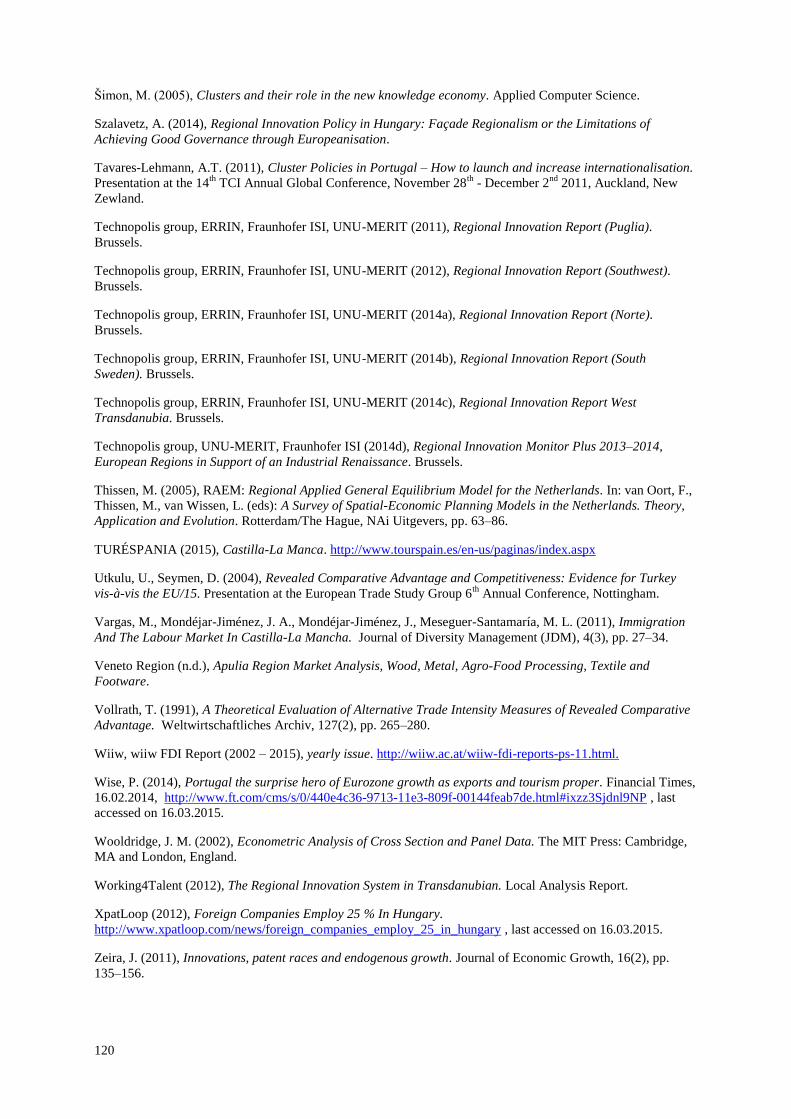
120
Šimon, M. (2005), Clusters and their role in the new knowledge economy. Applied Computer Science.
Szalavetz, A. (2014), Regional Innovation Policy in Hungary: Façade Regionalism or the Limitations of
Achieving Good Governance through Europeanisation.
Tavares-Lehmann, A.T. (2011), Cluster Policies in Portugal – How to launch and increase internationalisation.
Presentation at the 14th
TCI Annual Global Conference, November 28th
- December 2nd
2011, Auckland, New
Zewland.
Technopolis group, ERRIN, Fraunhofer ISI, UNU-MERIT (2011), Regional Innovation Report (Puglia).
Brussels.
Technopolis group, ERRIN, Fraunhofer ISI, UNU-MERIT (2012), Regional Innovation Report (Southwest).
Brussels.
Technopolis group, ERRIN, Fraunhofer ISI, UNU-MERIT (2014a), Regional Innovation Report (Norte).
Brussels.
Technopolis group, ERRIN, Fraunhofer ISI, UNU-MERIT (2014b), Regional Innovation Report (South
Sweden). Brussels.
Technopolis group, ERRIN, Fraunhofer ISI, UNU-MERIT (2014c), Regional Innovation Report West
Transdanubia. Brussels.
Technopolis group, UNU-MERIT, Fraunhofer ISI (2014d), Regional Innovation Monitor Plus 2013–2014,
European Regions in Support of an Industrial Renaissance. Brussels.
Thissen, M. (2005), RAEM: Regional Applied General Equilibrium Model for the Netherlands. In: van Oort, F.,
Thissen, M., van Wissen, L. (eds): A Survey of Spatial-Economic Planning Models in the Netherlands. Theory,
Application and Evolution. Rotterdam/The Hague, NAi Uitgevers, pp. 63–86.
TURÉSPANIA (2015), Castilla-La Manca. http://www.tourspain.es/en-us/paginas/index.aspx
Utkulu, U., Seymen, D. (2004), Revealed Comparative Advantage and Competitiveness: Evidence for Turkey
vis-à-vis the EU/15. Presentation at the European Trade Study Group 6th
Annual Conference, Nottingham.
Vargas, M., Mondéjar-Jiménez, J. A., Mondéjar-Jiménez, J., Meseguer-Santamaría, M. L. (2011), Immigration
And The Labour Market In Castilla-La Mancha. Journal of Diversity Management (JDM), 4(3), pp. 27–34.
Veneto Region (n.d.), Apulia Region Market Analysis, Wood, Metal, Agro-Food Processing, Textile and
Footware.
Vollrath, T. (1991), A Theoretical Evaluation of Alternative Trade Intensity Measures of Revealed Comparative
Advantage. Weltwirtschaftliches Archiv, 127(2), pp. 265–280.
Wiiw, wiiw FDI Report (2002 – 2015), yearly issue. http://wiiw.ac.at/wiiw-fdi-reports-ps-11.html.
Wise, P. (2014), Portugal the surprise hero of Eurozone growth as exports and tourism proper. Financial Times,
16.02.2014, http://www.ft.com/cms/s/0/440e4c36-9713-11e3-809f-00144feab7de.html#ixzz3Sjdnl9NP , last
accessed on 16.03.2015.
Wooldridge, J. M. (2002), Econometric Analysis of Cross Section and Panel Data. The MIT Press: Cambridge,
MA and London, England.
Working4Talent (2012), The Regional Innovation System in Transdanubian. Local Analysis Report.
XpatLoop (2012), Foreign Companies Employ 25 % In Hungary.
http://www.xpatloop.com/news/foreign_companies_employ_25_in_hungary , last accessed on 16.03.2015.
Zeira, J. (2011), Innovations, patent races and endogenous growth. Journal of Economic Growth, 16(2), pp.
135–156.
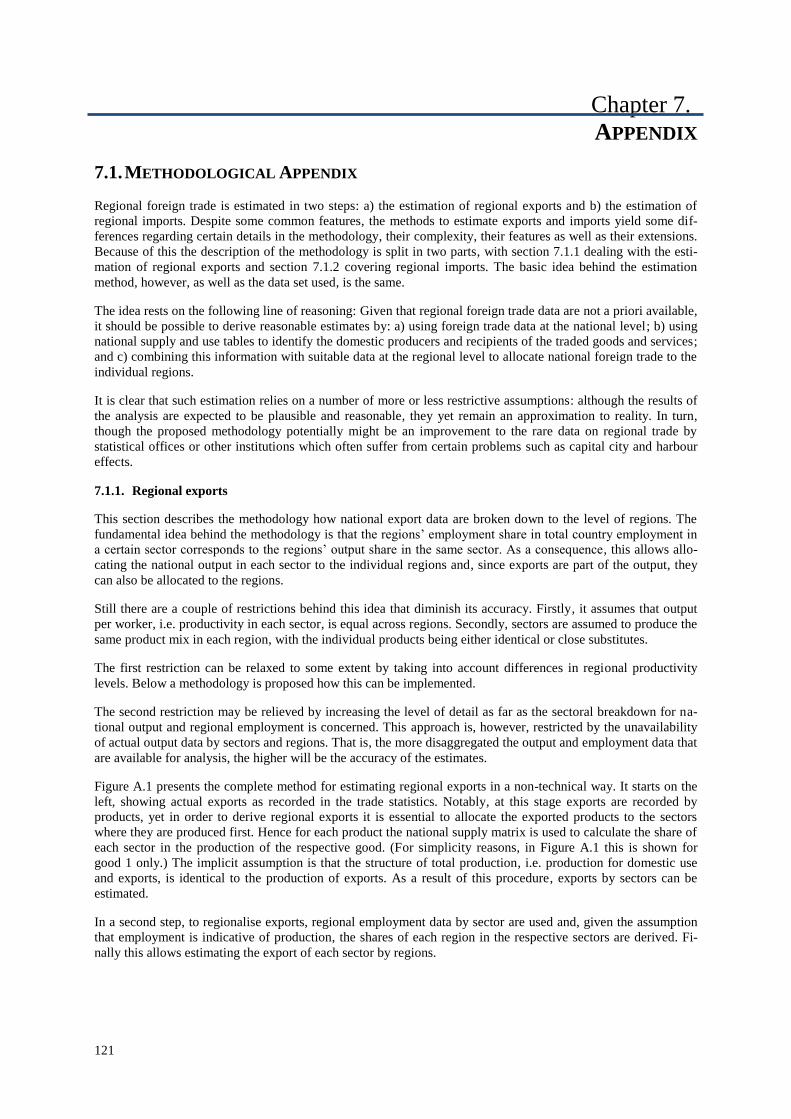
121
Chapter 7. APPENDIX
7.1. METHODOLOGICAL APPENDIX
Regional foreign trade is estimated in two steps: a) the estimation of regional exports and b) the estimation of
regional imports. Despite some common features, the methods to estimate exports and imports yield some dif-
ferences regarding certain details in the methodology, their complexity, their features as well as their extensions.
Because of this the description of the methodology is split in two parts, with section 7.1.1 dealing with the esti-
mation of regional exports and section 7.1.2 covering regional imports. The basic idea behind the estimation
method, however, as well as the data set used, is the same.
The idea rests on the following line of reasoning: Given that regional foreign trade data are not a priori available,
it should be possible to derive reasonable estimates by: a) using foreign trade data at the national level; b) using
national supply and use tables to identify the domestic producers and recipients of the traded goods and services;
and c) combining this information with suitable data at the regional level to allocate national foreign trade to the
individual regions.
It is clear that such estimation relies on a number of more or less restrictive assumptions: although the results of
the analysis are expected to be plausible and reasonable, they yet remain an approximation to reality. In turn,
though the proposed methodology potentially might be an improvement to the rare data on regional trade by
statistical offices or other institutions which often suffer from certain problems such as capital city and harbour
effects.
7.1.1. Regional exports
This section describes the methodology how national export data are broken down to the level of regions. The
fundamental idea behind the methodology is that the regions’ employment share in total country employment in
a certain sector corresponds to the regions’ output share in the same sector. As a consequence, this allows allo-
cating the national output in each sector to the individual regions and, since exports are part of the output, they
can also be allocated to the regions.
Still there are a couple of restrictions behind this idea that diminish its accuracy. Firstly, it assumes that output
per worker, i.e. productivity in each sector, is equal across regions. Secondly, sectors are assumed to produce the
same product mix in each region, with the individual products being either identical or close substitutes.
The first restriction can be relaxed to some extent by taking into account differences in regional productivity
levels. Below a methodology is proposed how this can be implemented.
The second restriction may be relieved by increasing the level of detail as far as the sectoral breakdown for na-
tional output and regional employment is concerned. This approach is, however, restricted by the unavailability
of actual output data by sectors and regions. That is, the more disaggregated the output and employment data that
are available for analysis, the higher will be the accuracy of the estimates.
Figure A.1 presents the complete method for estimating regional exports in a non-technical way. It starts on the
left, showing actual exports as recorded in the trade statistics. Notably, at this stage exports are recorded by
products, yet in order to derive regional exports it is essential to allocate the exported products to the sectors
where they are produced first. Hence for each product the national supply matrix is used to calculate the share of
each sector in the production of the respective good. (For simplicity reasons, in Figure A.1 this is shown for
good 1 only.) The implicit assumption is that the structure of total production, i.e. production for domestic use
and exports, is identical to the production of exports. As a result of this procedure, exports by sectors can be
estimated.
In a second step, to regionalise exports, regional employment data by sector are used and, given the assumption
that employment is indicative of production, the shares of each region in the respective sectors are derived. Fi-
nally this allows estimating the export of each sector by regions.
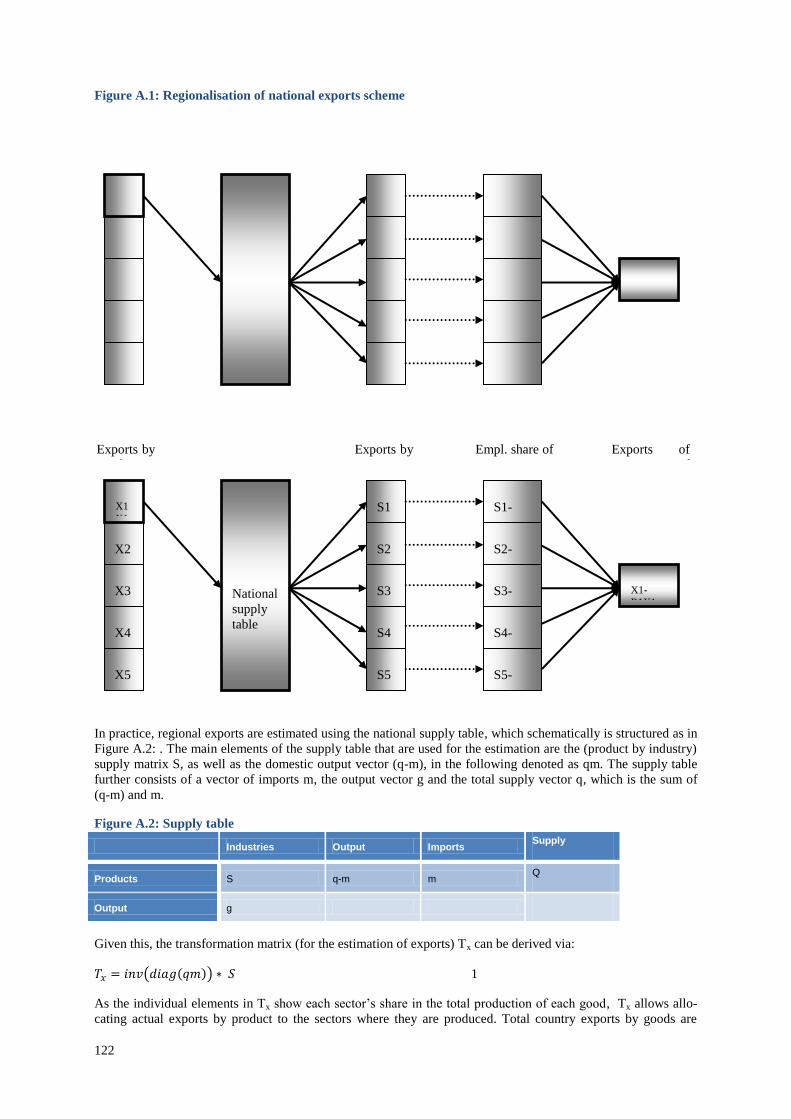
122
Figure A.1: Regionalisation of national exports scheme
In practice, regional exports are estimated using the national supply table, which schematically is structured as in
Figure A.2: . The main elements of the supply table that are used for the estimation are the (product by industry)
supply matrix S, as well as the domestic output vector (q-m), in the following denoted as qm. The supply table
further consists of a vector of imports m, the output vector g and the total supply vector q, which is the sum of
(q-m) and m.
Figure A.2: Supply table
Industries Output Imports Supply
Products S q-m m Q
Output g
Given this, the transformation matrix (for the estimation of exports) Tx can be derived via:
1
As the individual elements in Tx show each sector’s share in the total production of each good, Tx allows allo-
cating actual exports by product to the sectors where they are produced. Total country exports by goods are
X2
X2
X3
X3
X5
X5
X4
X4
X1
X1
S2
S2
S3
S3
S5
S5
S4
S4
S1
S1
National
supply
table
National
supply
table
X1-
R1X1-
R1
S1-
R1S1-
R1 S2-
R1S2-
R1 S3-
R1S3-
R1 S4-
R1S4-
R1 S5-
R1S5-
R1
Exports by
goods 1 -
5Exports
by goods 1
-5
Exports by
sector 1 -
5Exports
by sector 1
-5
Empl. share of
R1 in sector 1
-5Empl. share
of R1 in sec-
tor 1 -5
Exports of
R1Exports of
R1
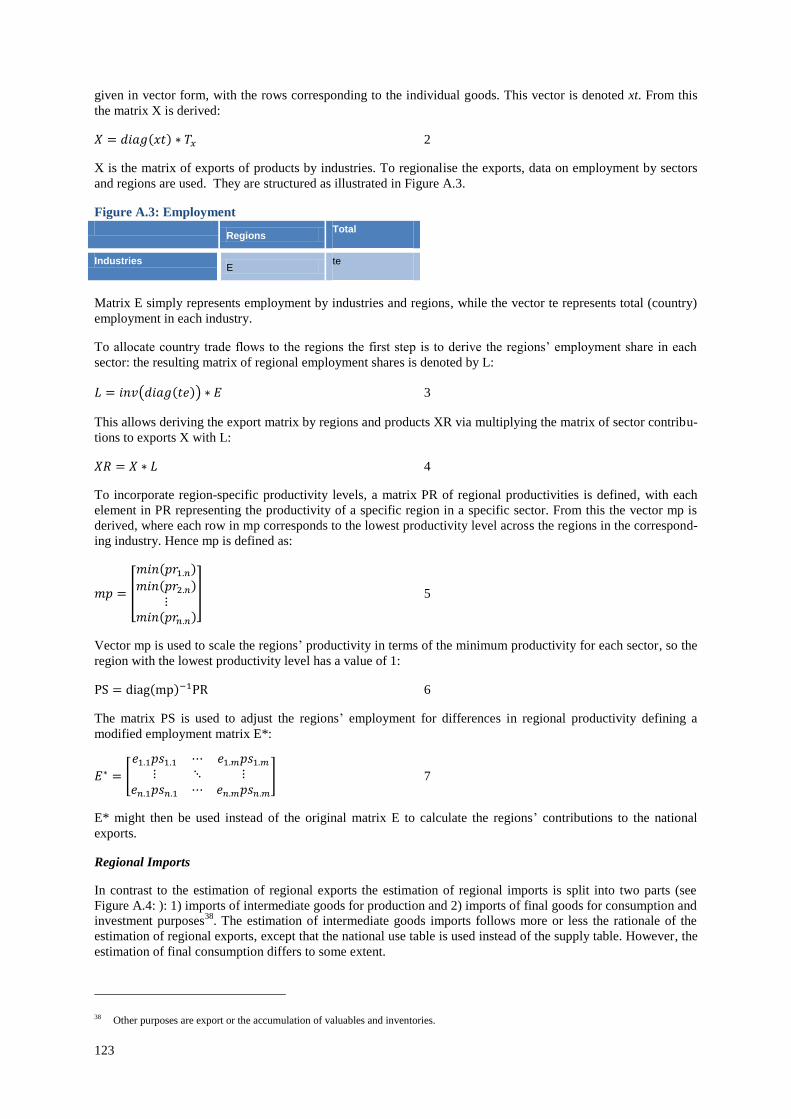
123
given in vector form, with the rows corresponding to the individual goods. This vector is denoted xt. From this
the matrix X is derived:
2
X is the matrix of exports of products by industries. To regionalise the exports, data on employment by sectors
and regions are used. They are structured as illustrated in Figure A.3.
Figure A.3: Employment
Regions
Total
Industries E
te
Matrix E simply represents employment by industries and regions, while the vector te represents total (country)
employment in each industry.
To allocate country trade flows to the regions the first step is to derive the regions’ employment share in each
sector: the resulting matrix of regional employment shares is denoted by L:
3
This allows deriving the export matrix by regions and products XR via multiplying the matrix of sector contribu-
tions to exports X with L:
4
To incorporate region-specific productivity levels, a matrix PR of regional productivities is defined, with each
element in PR representing the productivity of a specific region in a specific sector. From this the vector mp is
derived, where each row in mp corresponds to the lowest productivity level across the regions in the correspond-
ing industry. Hence mp is defined as:
5
Vector mp is used to scale the regions’ productivity in terms of the minimum productivity for each sector, so the
region with the lowest productivity level has a value of 1:
6
The matrix PS is used to adjust the regions’ employment for differences in regional productivity defining a
modified employment matrix E*:
7
E* might then be used instead of the original matrix E to calculate the regions’ contributions to the national
exports.
Regional Imports
In contrast to the estimation of regional exports the estimation of regional imports is split into two parts (see
Figure A.4: ): 1) imports of intermediate goods for production and 2) imports of final goods for consumption and
investment purposes38
. The estimation of intermediate goods imports follows more or less the rationale of the
estimation of regional exports, except that the national use table is used instead of the supply table. However, the
estimation of final consumption differs to some extent.
38 Other purposes are export or the accumulation of valuables and inventories.
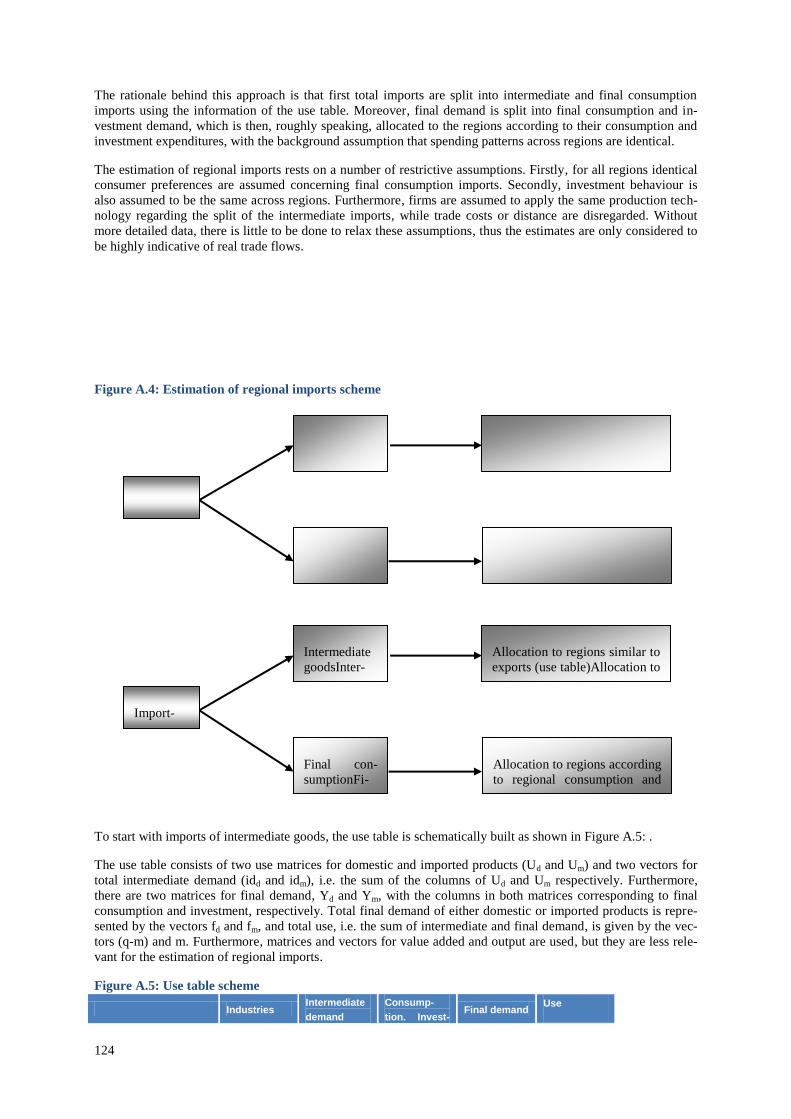
124
The rationale behind this approach is that first total imports are split into intermediate and final consumption
imports using the information of the use table. Moreover, final demand is split into final consumption and in-
vestment demand, which is then, roughly speaking, allocated to the regions according to their consumption and
investment expenditures, with the background assumption that spending patterns across regions are identical.
The estimation of regional imports rests on a number of restrictive assumptions. Firstly, for all regions identical
consumer preferences are assumed concerning final consumption imports. Secondly, investment behaviour is
also assumed to be the same across regions. Furthermore, firms are assumed to apply the same production tech-
nology regarding the split of the intermediate imports, while trade costs or distance are disregarded. Without
more detailed data, there is little to be done to relax these assumptions, thus the estimates are only considered to
be highly indicative of real trade flows.
Figure A.4: Estimation of regional imports scheme
To start with imports of intermediate goods, the use table is schematically built as shown in Figure A.5: .
The use table consists of two use matrices for domestic and imported products (Ud and Um) and two vectors for
total intermediate demand (idd and idm), i.e. the sum of the columns of Ud and Um respectively. Furthermore,
there are two matrices for final demand, Yd and Ym, with the columns in both matrices corresponding to final
consumption and investment, respectively. Total final demand of either domestic or imported products is repre-
sented by the vectors fd and fm, and total use, i.e. the sum of intermediate and final demand, is given by the vec-
tors (q-m) and m. Furthermore, matrices and vectors for value added and output are used, but they are less rele-
vant for the estimation of regional imports.
Figure A.5: Use table scheme
Industries Intermediate
demand
Consump-
tion. Invest-Final demand
Use
Import-
sImports
Final con-
sumptionFi-
nal consump-
tion
Intermediate
goodsInter-
mediate
goods
Allocation to regions similar to
exports (use table)Allocation to
regions similar to exports (use
table)
Allocation to regions according
to regional consumption and
investment
expenditureAllocation to re-
gions according to regional
consumption and investment
expenditure
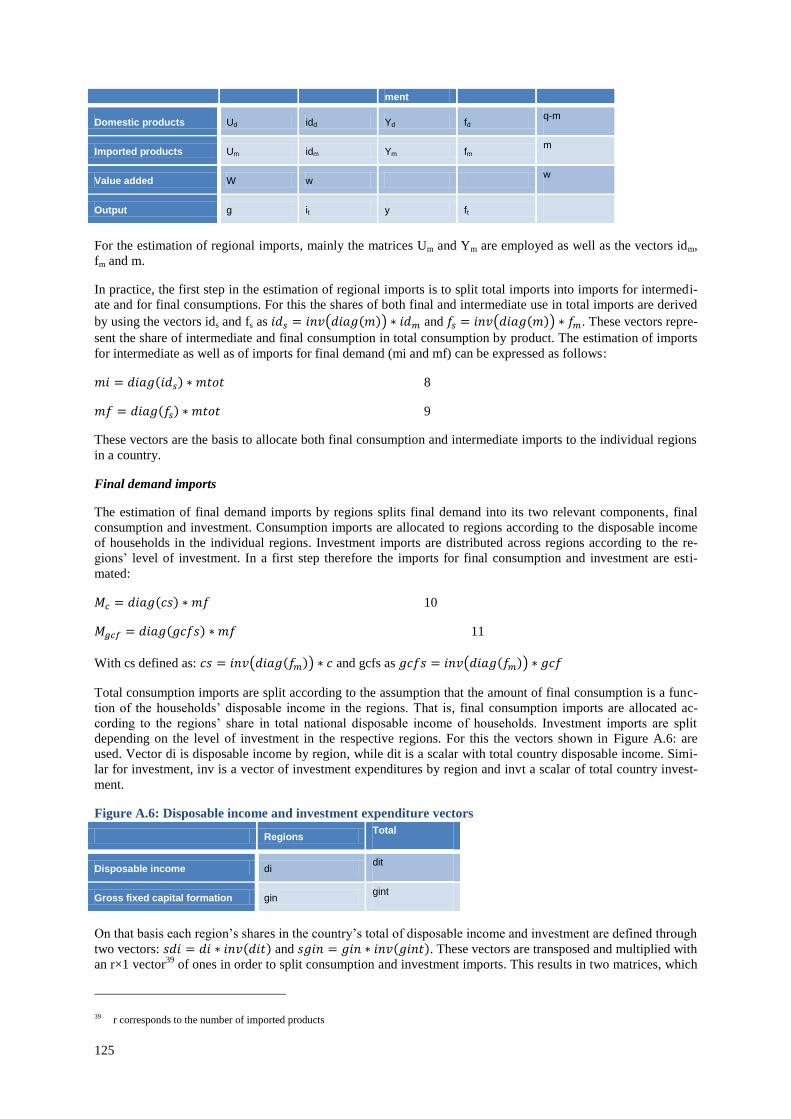
125
ment
Domestic products Ud idd Yd fd q-m
Imported products Um idm Ym fm m
Value added W w w
Output g it y ft
For the estimation of regional imports, mainly the matrices Um and Ym are employed as well as the vectors idm,
fm and m.
In practice, the first step in the estimation of regional imports is to split total imports into imports for intermedi-
ate and for final consumptions. For this the shares of both final and intermediate use in total imports are derived
by using the vectors ids and fs as and . These vectors repre-
sent the share of intermediate and final consumption in total consumption by product. The estimation of imports
for intermediate as well as of imports for final demand (mi and mf) can be expressed as follows:
8
9
These vectors are the basis to allocate both final consumption and intermediate imports to the individual regions
in a country.
Final demand imports
The estimation of final demand imports by regions splits final demand into its two relevant components, final
consumption and investment. Consumption imports are allocated to regions according to the disposable income
of households in the individual regions. Investment imports are distributed across regions according to the re-
gions’ level of investment. In a first step therefore the imports for final consumption and investment are esti-
mated:
10
11
With cs defined as: and gcfs as
Total consumption imports are split according to the assumption that the amount of final consumption is a func-
tion of the households’ disposable income in the regions. That is, final consumption imports are allocated ac-
cording to the regions’ share in total national disposable income of households. Investment imports are split
depending on the level of investment in the respective regions. For this the vectors shown in Figure A.6: are
used. Vector di is disposable income by region, while dit is a scalar with total country disposable income. Simi-
lar for investment, inv is a vector of investment expenditures by region and invt a scalar of total country invest-
ment.
Figure A.6: Disposable income and investment expenditure vectors
Regions Total
Disposable income di dit
Gross fixed capital formation gin gint
On that basis each region’s shares in the country’s total of disposable income and investment are defined through
two vectors: and . These vectors are transposed and multiplied with
an r×1 vector39
of ones in order to split consumption and investment imports. This results in two matrices, which
39 r corresponds to the number of imported products
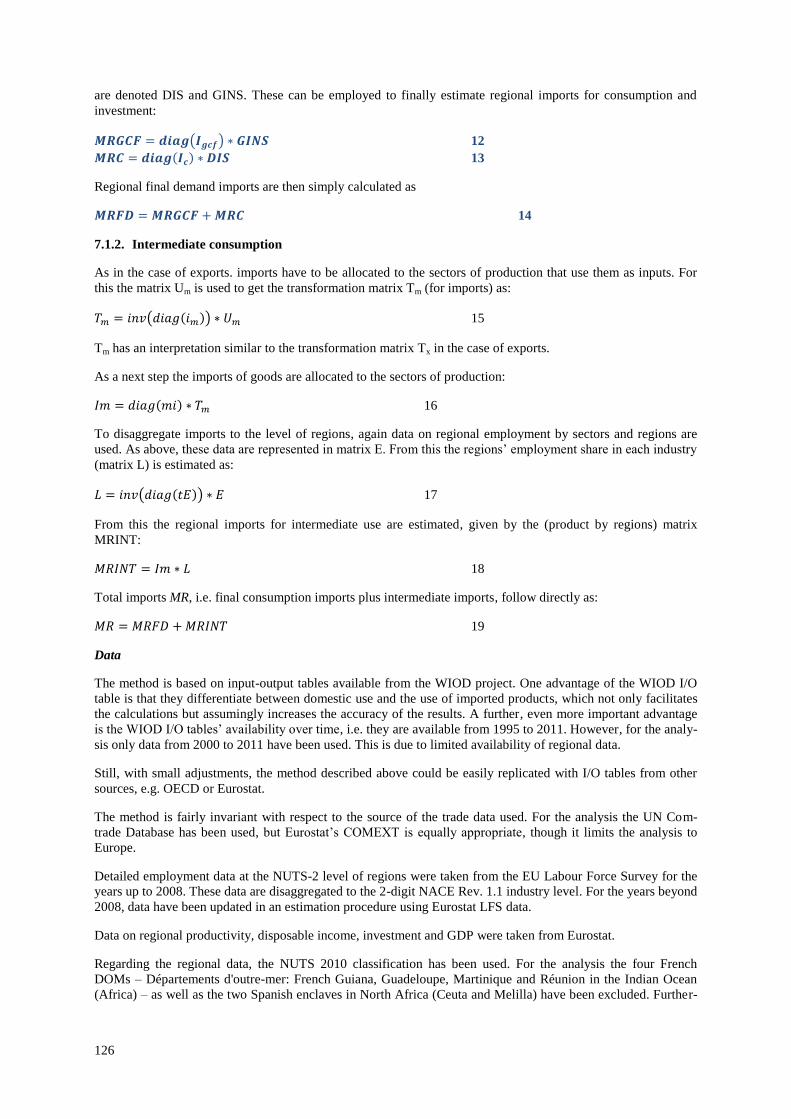
126
are denoted DIS and GINS. These can be employed to finally estimate regional imports for consumption and
investment:
12
13
Regional final demand imports are then simply calculated as
14
7.1.2. Intermediate consumption
As in the case of exports. imports have to be allocated to the sectors of production that use them as inputs. For
this the matrix Um is used to get the transformation matrix Tm (for imports) as:
15
Tm has an interpretation similar to the transformation matrix Tx in the case of exports.
As a next step the imports of goods are allocated to the sectors of production:
16
To disaggregate imports to the level of regions, again data on regional employment by sectors and regions are
used. As above, these data are represented in matrix E. From this the regions’ employment share in each industry
(matrix L) is estimated as:
17
From this the regional imports for intermediate use are estimated, given by the (product by regions) matrix
MRINT:
18
Total imports MR, i.e. final consumption imports plus intermediate imports, follow directly as:
19
Data
The method is based on input-output tables available from the WIOD project. One advantage of the WIOD I/O
table is that they differentiate between domestic use and the use of imported products, which not only facilitates
the calculations but assumingly increases the accuracy of the results. A further, even more important advantage
is the WIOD I/O tables’ availability over time, i.e. they are available from 1995 to 2011. However, for the analy-
sis only data from 2000 to 2011 have been used. This is due to limited availability of regional data.
Still, with small adjustments, the method described above could be easily replicated with I/O tables from other
sources, e.g. OECD or Eurostat.
The method is fairly invariant with respect to the source of the trade data used. For the analysis the UN Com-
trade Database has been used, but Eurostat’s COMEXT is equally appropriate, though it limits the analysis to
Europe.
Detailed employment data at the NUTS-2 level of regions were taken from the EU Labour Force Survey for the
years up to 2008. These data are disaggregated to the 2-digit NACE Rev. 1.1 industry level. For the years beyond
2008, data have been updated in an estimation procedure using Eurostat LFS data.
Data on regional productivity, disposable income, investment and GDP were taken from Eurostat.
Regarding the regional data, the NUTS 2010 classification has been used. For the analysis the four French
DOMs – Départements d'outre-mer: French Guiana, Guadeloupe, Martinique and Réunion in the Indian Ocean
(Africa) – as well as the two Spanish enclaves in North Africa (Ceuta and Melilla) have been excluded. Further-
127
more, because of breaks in the regional division the two Finnish regions Helsinki-Uusimaa and Etelä-Suomi
have been aggregated to one region.
Regional trade data were estimated from 2000 to 2011. The whole estimation procedure is programmed in
STATA, and the basic data as well as the do files will be made available.
7.2. ESTIMATING REGIONAL TRADE IN VALUE ADDED
This section describes the method of estimating regional value added exports that is used in this report. Impor-
tantly, regional value added exports, in contrast to regional foreign trade flows, do not refer to the trade in goods
(and services) as recorded in the foreign trade statistics. Rather, regional value added exports measure how much
of the value added produced in a domestic region is directly or indirectly contained in the final consumption of a
foreign country. Thus, data on regional foreign trade only take into account the value of goods that flow from a
domestic region to a foreign country, but they cannot measure how much of this value is actually produced in the
respective region. If a region’s exports are to a large extent made of imported intermediate imports, the actual
value added produced in the region might be quite low. Still, this region may record high exports, on the basis of
foreign trade statistics. Arguably, this induces a certain bias concerning the true extent of regional trade speciali-
sation. Regional value added exports are supposed to correct for this bias.
In contrast to regional foreign trade data, regional value added exports are not based on foreign trade statistics.
Rather, because it is about value added, their fundament is global input-output tables (such as the WIOD I/O
tables). That is also why, in contrast to regional foreign trade data, regional value added exports are not in terms
of goods or products but rather in terms of industries. This reduces the comparability of the two datasets.
The procedure to estimate regional value added exports involves two steps. Firstly, value added exports are esti-
mated at the country level. This step is methodologically well developed, so that the estimation of country value
added exports follows with only small modifications the method of Stehrer (Stehrer, 2012). In a second step,
country value added exports are broken down to the regional level using detailed regional employment data. The
method to regionalise the data is rather straightforward and similar to the regionalisation method applied in the
estimation of regional foreign trade data.
Regarding the first step, as the estimation of value added trade is based solely on input-output data, the funda-
mental relationship to start with is
Here, y is a gross output vector of the dimension , with n being the number of countries, i.e. in the case of
the WIOD I/O tables 41 countries including the Rest of the World, and i being the number of industries, i.e. in
the case of WIOD 35 industries. Hence in the estimation y is a vector. A is a , hence a matrix of technical input-output coefficients, with each element denoting the input used in a particular
industry in a country per unit of gross output. Furthermore, f is an , i.e. a final demand vector.
The right-hand term of the equation is the traditional rearrangement of the output relationship using the Leontief
inverse and the final demand vector.
Following Stehrer, in a three-country example the equation can be written as (using partitioned matrices):
Here (c = r,s,t) is the gross output vector of country c, is an submatrix of the Leontief inverse
and is an vector of final demand of country d in country c. Here, it is important to distinguish between
final demand products produced in e.g. country r which include exports and the actual final demand of county r
(which is produced in country r or imported from other countries). In the first case, the total final demand prod-
ucts produced in country r are given by the vector . In the second case, the final
demand of country r is given by the vector .
Pre-multiplying this equation with an diagonal matrix V of value added coefficients, i.e. value added per
unit of gross output by industries, results in value added. This will be used to estimate trade in value added
terms.
128
In this example, value added exports of country r to all other countries are the sum of the value added created in r
to satisfy the final demand in the countries s and t. Accordingly, the equation looks as follows:
Here is an of value added exports of country r by industries and countries s and t. To produce value
added exports of country r, the elements and are set to zero, just as the final demand of country r, i.e.
. By this, re-imports of country r value added are excluded, which do not count as value added exports.
Moreover, this equation also captures the valued added exports of country r to satisfy country s domestic demand
and the demand via imports from country t. As these imports also use intermediate inputs from country r they
embody value added created in country r and thus count as country r’s value added exports.
Notably, so far value added exports are at the country level. To regionalise them in a second step it is important
to remember that the vector for country r contains valued added exports by 35 industries and 40 trading
partners. Since the focus is on global value added exports, i.e. valued added exports aggregated over the trade
partners (but keeping the industry detail), the vector is manipulated accordingly, i.e. its elements are ag-
gregated by industries over countries. Hence the vector is aggregated to the vector.
To regionalise this vector the same procedure as in the case of regional foreign trade (described above) is used.
That means country value added exports are allocated to the regions by the regions’ employment shares in the
respective regions. For this matrix , representing employment by industries and regions as well as the vector
te, i.total country employment by industries, are used to estimate the matrix of regional employment as
From this, regional value added exports are simply estimated as:
Alternatively to matrix E also the productivity adjusted variant may be used (and actually is used for the
analysis).

129
7.3. APPENDIX OF TABLES
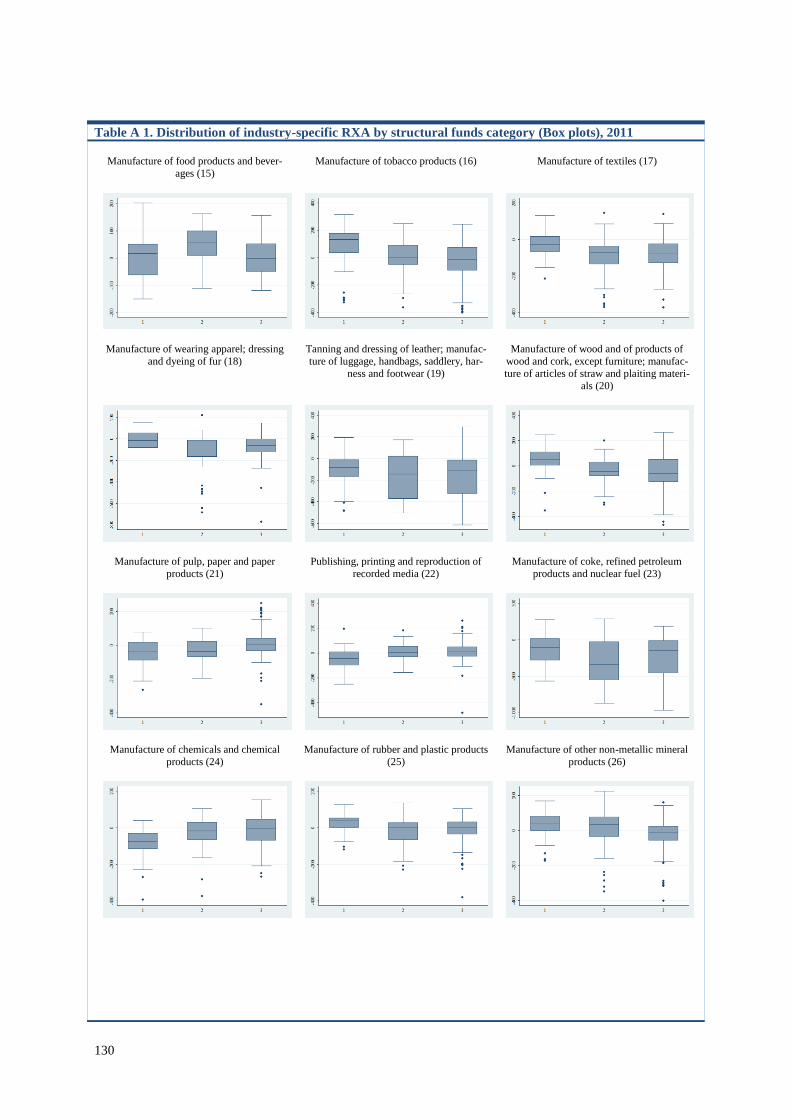
130
Table A 1. Distribution of industry-specific RXA by structural funds category (Box plots), 2011
Manufacture of food products and bever-
ages (15)
Manufacture of tobacco products (16) Manufacture of textiles (17)
Manufacture of wearing apparel; dressing
and dyeing of fur (18)
Tanning and dressing of leather; manufac-
ture of luggage, handbags, saddlery, har-
ness and footwear (19)
Manufacture of wood and of products of
wood and cork, except furniture; manufac-
ture of articles of straw and plaiting materi-
als (20)
Manufacture of pulp, paper and paper
products (21)
Publishing, printing and reproduction of
recorded media (22)
Manufacture of coke, refined petroleum
products and nuclear fuel (23)
Manufacture of chemicals and chemical
products (24)
Manufacture of rubber and plastic products
(25)
Manufacture of other non-metallic mineral
products (26)
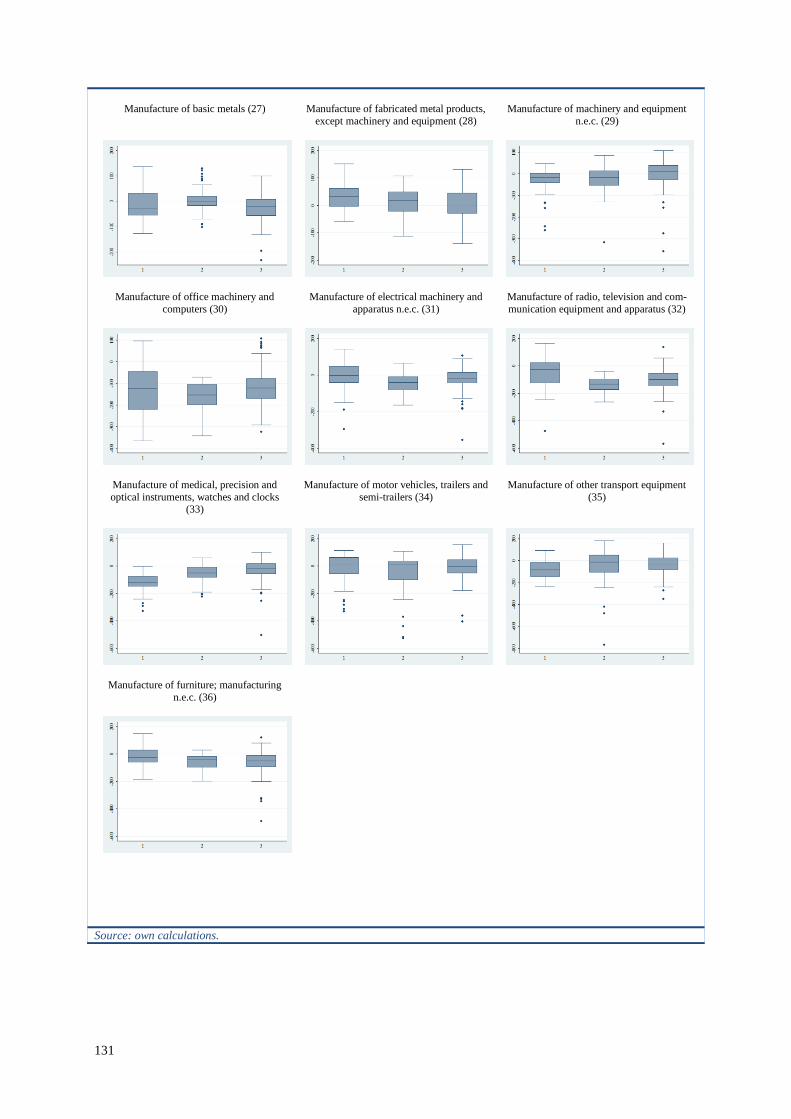
131
Manufacture of basic metals (27) Manufacture of fabricated metal products,
except machinery and equipment (28)
Manufacture of machinery and equipment
n.e.c. (29)
Manufacture of office machinery and
computers (30)
Manufacture of electrical machinery and
apparatus n.e.c. (31)
Manufacture of radio, television and com-
munication equipment and apparatus (32)
Manufacture of medical, precision and
optical instruments, watches and clocks (33)
Manufacture of motor vehicles, trailers and
semi-trailers (34)
Manufacture of other transport equipment
(35)
Manufacture of furniture; manufacturing
n.e.c. (36)
Source: own calculations.
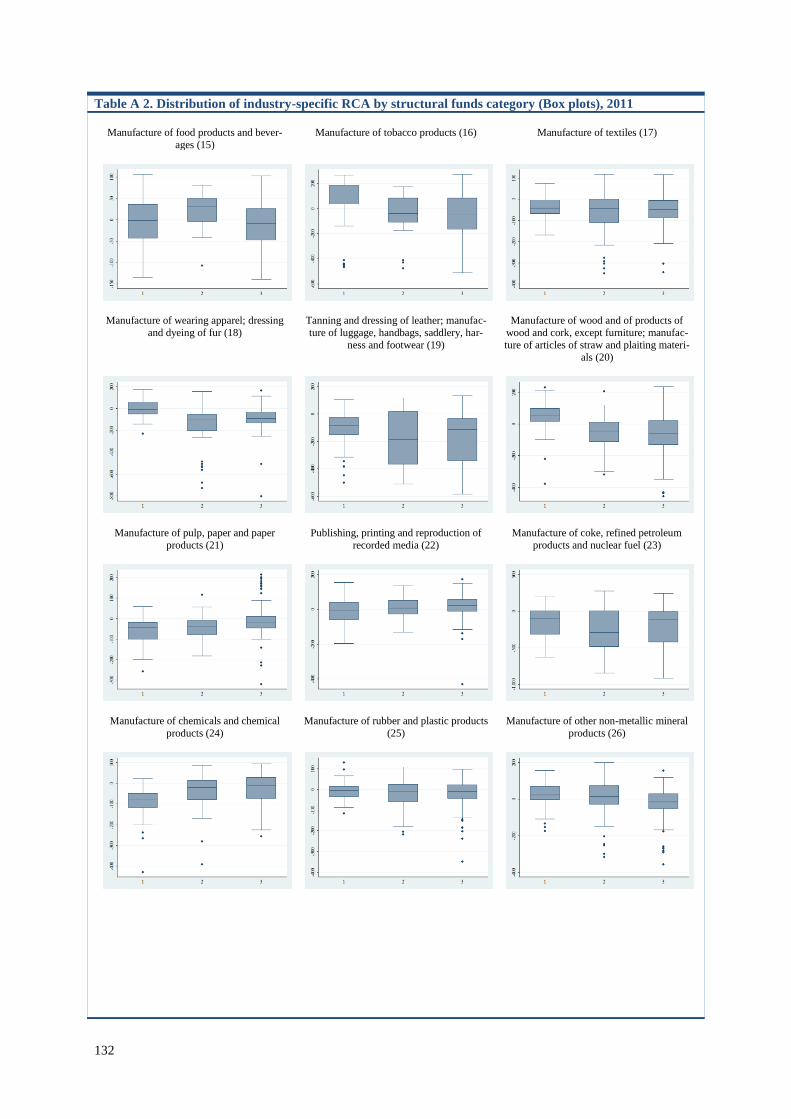
132
Table A 2. Distribution of industry-specific RCA by structural funds category (Box plots), 2011
Manufacture of food products and bever-
ages (15)
Manufacture of tobacco products (16) Manufacture of textiles (17)
Manufacture of wearing apparel; dressing
and dyeing of fur (18)
Tanning and dressing of leather; manufac-
ture of luggage, handbags, saddlery, har-
ness and footwear (19)
Manufacture of wood and of products of
wood and cork, except furniture; manufac-
ture of articles of straw and plaiting materi-
als (20)
Manufacture of pulp, paper and paper
products (21)
Publishing, printing and reproduction of
recorded media (22)
Manufacture of coke, refined petroleum
products and nuclear fuel (23)
Manufacture of chemicals and chemical
products (24)
Manufacture of rubber and plastic products
(25)
Manufacture of other non-metallic mineral
products (26)
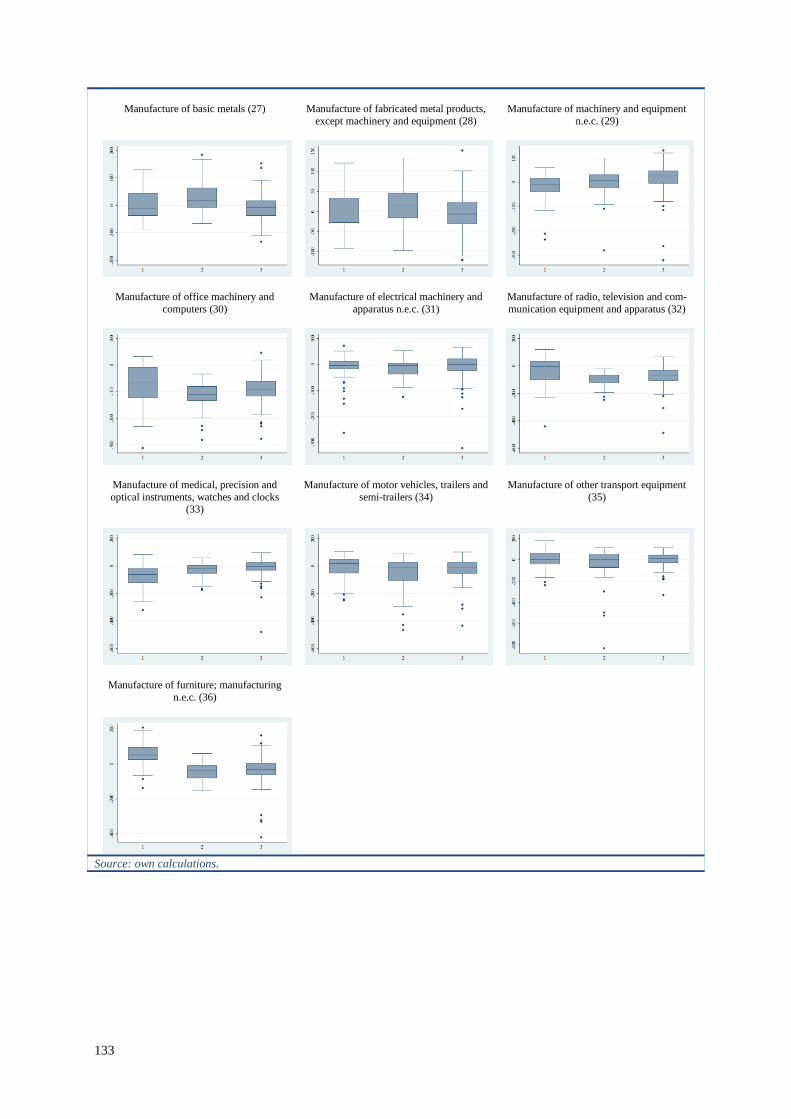
133
Manufacture of basic metals (27) Manufacture of fabricated metal products,
except machinery and equipment (28)
Manufacture of machinery and equipment
n.e.c. (29)
Manufacture of office machinery and
computers (30)
Manufacture of electrical machinery and
apparatus n.e.c. (31)
Manufacture of radio, television and com-
munication equipment and apparatus (32)
Manufacture of medical, precision and
optical instruments, watches and clocks (33)
Manufacture of motor vehicles, trailers and
semi-trailers (34)
Manufacture of other transport equipment
(35)
Manufacture of furniture; manufacturing
n.e.c. (36)
Source: own calculations.
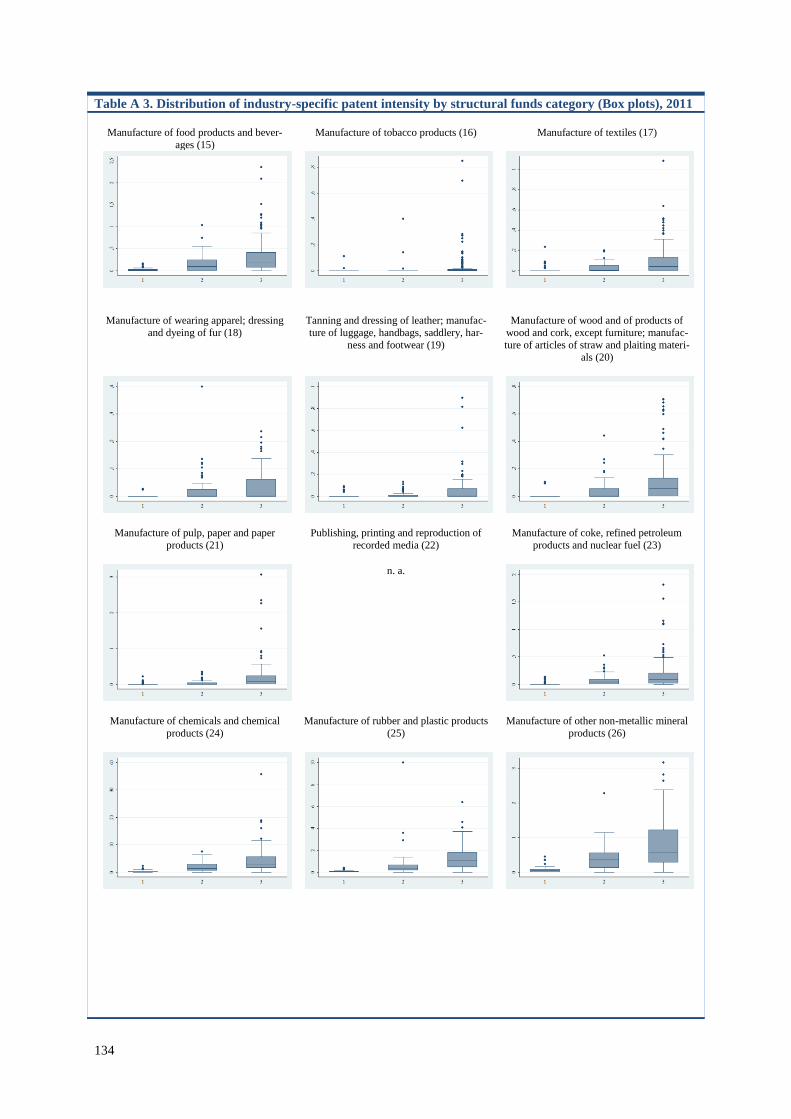
134
Table A 3. Distribution of industry-specific patent intensity by structural funds category (Box plots), 2011
Manufacture of food products and bever-
ages (15)
Manufacture of tobacco products (16) Manufacture of textiles (17)
Manufacture of wearing apparel; dressing
and dyeing of fur (18)
Tanning and dressing of leather; manufac-
ture of luggage, handbags, saddlery, har-
ness and footwear (19)
Manufacture of wood and of products of
wood and cork, except furniture; manufac-
ture of articles of straw and plaiting materi-
als (20)
Manufacture of pulp, paper and paper
products (21)
Publishing, printing and reproduction of
recorded media (22)
Manufacture of coke, refined petroleum
products and nuclear fuel (23)
n. a.
Manufacture of chemicals and chemical
products (24)
Manufacture of rubber and plastic products
(25)
Manufacture of other non-metallic mineral
products (26)
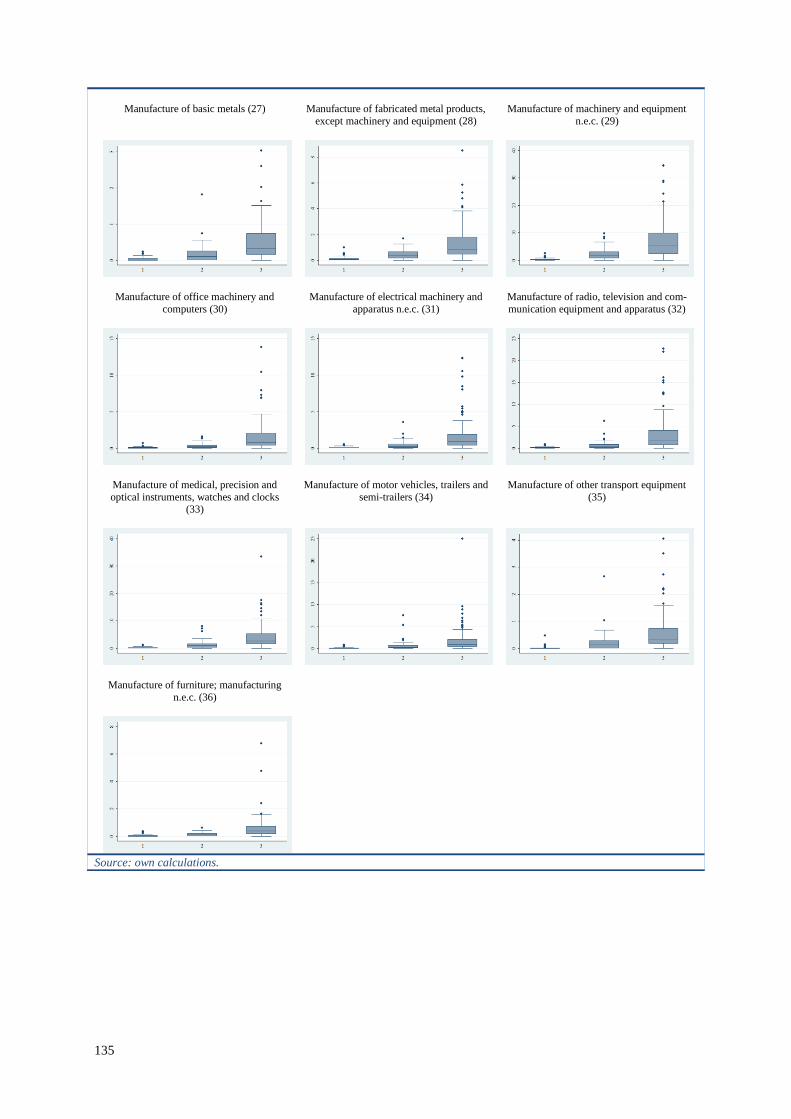
135
Manufacture of basic metals (27) Manufacture of fabricated metal products,
except machinery and equipment (28)
Manufacture of machinery and equipment
n.e.c. (29)
Manufacture of office machinery and
computers (30)
Manufacture of electrical machinery and
apparatus n.e.c. (31)
Manufacture of radio, television and com-
munication equipment and apparatus (32)
Manufacture of medical, precision and
optical instruments, watches and clocks (33)
Manufacture of motor vehicles, trailers and
semi-trailers (34)
Manufacture of other transport equipment
(35)
Manufacture of furniture; manufacturing
n.e.c. (36)
Source: own calculations.
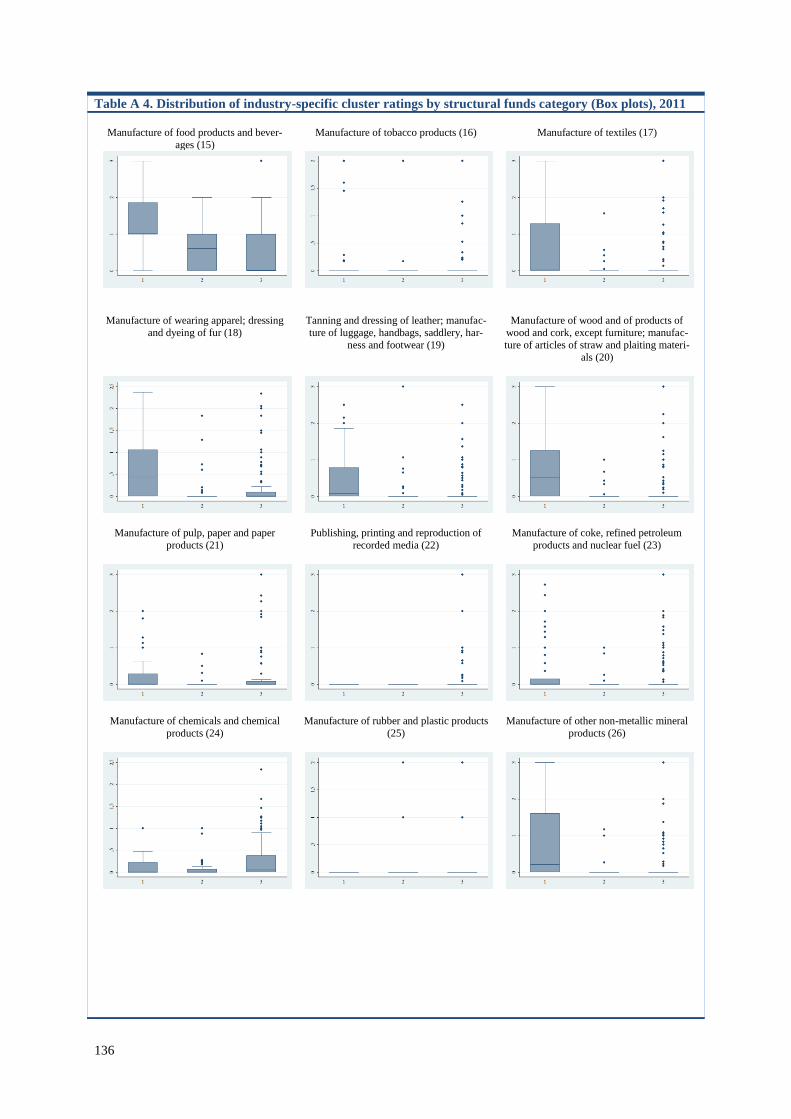
136
Table A 4. Distribution of industry-specific cluster ratings by structural funds category (Box plots), 2011
Manufacture of food products and bever-
ages (15)
Manufacture of tobacco products (16) Manufacture of textiles (17)
Manufacture of wearing apparel; dressing
and dyeing of fur (18)
Tanning and dressing of leather; manufac-
ture of luggage, handbags, saddlery, har-
ness and footwear (19)
Manufacture of wood and of products of
wood and cork, except furniture; manufac-
ture of articles of straw and plaiting materi-
als (20)
Manufacture of pulp, paper and paper
products (21)
Publishing, printing and reproduction of
recorded media (22)
Manufacture of coke, refined petroleum
products and nuclear fuel (23)
Manufacture of chemicals and chemical
products (24)
Manufacture of rubber and plastic products
(25)
Manufacture of other non-metallic mineral
products (26)
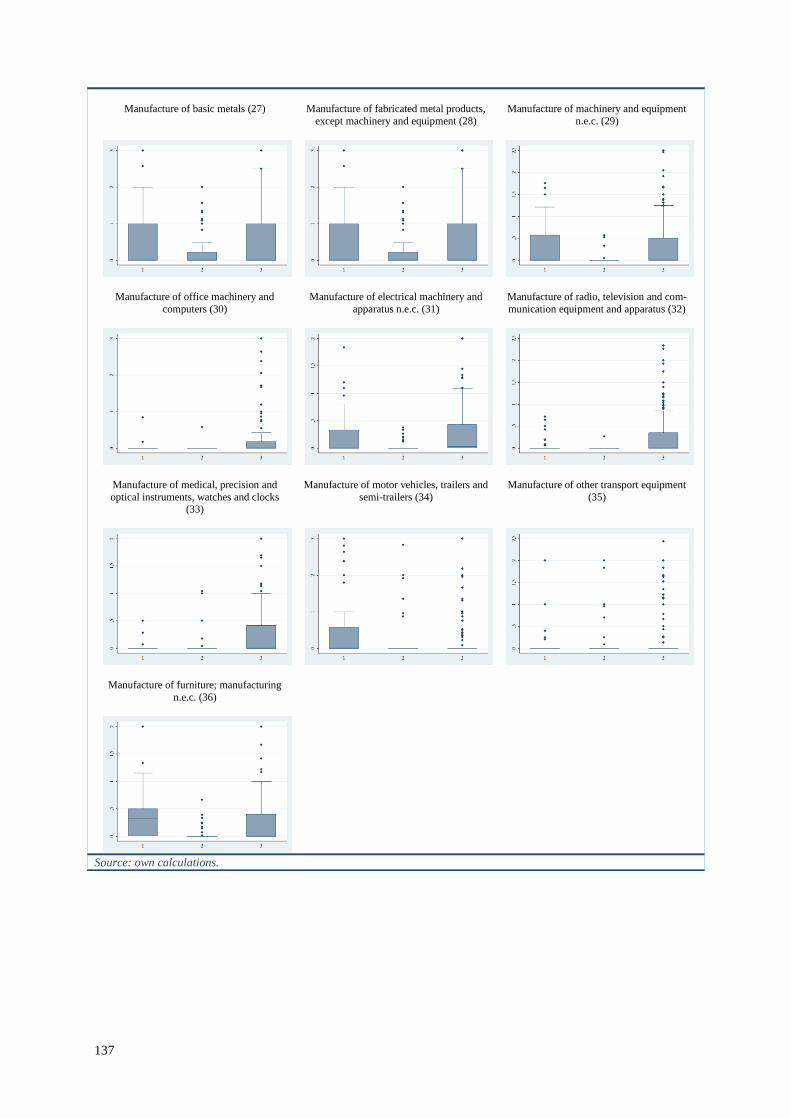
137
Manufacture of basic metals (27) Manufacture of fabricated metal products,
except machinery and equipment (28)
Manufacture of machinery and equipment
n.e.c. (29)
Manufacture of office machinery and
computers (30)
Manufacture of electrical machinery and
apparatus n.e.c. (31)
Manufacture of radio, television and com-
munication equipment and apparatus (32)
Manufacture of medical, precision and
optical instruments, watches and clocks (33)
Manufacture of motor vehicles, trailers and
semi-trailers (34)
Manufacture of other transport equipment
(35)
Manufacture of furniture; manufacturing
n.e.c. (36)
Source: own calculations.
Related Documents