University of Nebraska - Lincoln DigitalCommons@University of Nebraska - Lincoln Sociology Department, Faculty Publications Sociology, Department of 2014 Identifying predictors of survey mode preference Jolene D. Smyth University of Nebraska-Lincoln, [email protected] Kristen Olson University of Nebraska-Lincoln, [email protected] Morgan Millar Westminster College, Salt Lake City, UT, [email protected] Follow this and additional works at: hp://digitalcommons.unl.edu/sociologyfacpub Part of the Other Sociology Commons , and the Quantitative, Qualitative, Comparative, and Historical Methodologies Commons is Article is brought to you for free and open access by the Sociology, Department of at DigitalCommons@University of Nebraska - Lincoln. It has been accepted for inclusion in Sociology Department, Faculty Publications by an authorized administrator of DigitalCommons@University of Nebraska - Lincoln. Smyth, Jolene D.; Olson, Kristen; and Millar, Morgan, "Identifying predictors of survey mode preference" (2014). Sociology Department, Faculty Publications. Paper 252. hp://digitalcommons.unl.edu/sociologyfacpub/252

Welcome message from author
This document is posted to help you gain knowledge. Please leave a comment to let me know what you think about it! Share it to your friends and learn new things together.
Transcript
University of Nebraska - LincolnDigitalCommons@University of Nebraska - Lincoln
Sociology Department, Faculty Publications Sociology, Department of
2014
Identifying predictors of survey mode preferenceJolene D. SmythUniversity of Nebraska-Lincoln, [email protected]
Kristen OlsonUniversity of Nebraska-Lincoln, [email protected]
Morgan MillarWestminster College, Salt Lake City, UT, [email protected]
Follow this and additional works at: http://digitalcommons.unl.edu/sociologyfacpub
Part of the Other Sociology Commons, and the Quantitative, Qualitative, Comparative, andHistorical Methodologies Commons
This Article is brought to you for free and open access by the Sociology, Department of at DigitalCommons@University of Nebraska - Lincoln. It hasbeen accepted for inclusion in Sociology Department, Faculty Publications by an authorized administrator of DigitalCommons@University ofNebraska - Lincoln.
Smyth, Jolene D.; Olson, Kristen; and Millar, Morgan, "Identifying predictors of survey mode preference" (2014). SociologyDepartment, Faculty Publications. Paper 252.http://digitalcommons.unl.edu/sociologyfacpub/252
Published in Social Science Research 48 (2014), pp. 135–144; doi: 10.1016/j.ssresearch.2014.06.002Copyright © 2014 Elsevier Inc. Used by permission.Submitted June 18, 2013; revised April 28, 2014; accepted June 15, 2014; published online June 21, 2014.
Identifying predictors of survey mode preference
Jolene D. Smyth,1 Kristen Olson,2 and Morgan M. Millar 3
1. Department of Sociology, University of Nebraska-Lincoln, 724 Oldfather Hall, Lincoln, NE 68588-03242. Department of Sociology, University of Nebraska-Lincoln, 703 Oldfather Hall, Lincoln, NE 68588-03243. Sociology Program, Westminster College, 1840 South 1300 East, Foster Hall, Salt Lake City, UT 84105
Corresponding author – J. D. Smyth, email [email protected]
AbstractTo increase the likelihood of response, many survey organizations attempt to provide sample members with a mode they are thought to prefer. Mode assignment is typically based on conventional wisdom or results from mode choice studies that presented only limited options. In this paper we draw heavily on research and the-ory from the mode effects and the survey participation literatures to develop a framework for understanding what characteristics should predict mode preferences. We then test these characteristics using data from two different surveys. We find that measures of familiarity with and access to a mode are the strongest predictors of mode preference and measures of safety concerns, physical abilities, and normative concerns are unexpect-edly weak predictors. Our findings suggest that variables that may exist on sample frames can be used to in-form the assignment of “preferred” modes to sample members.
Keywords: Mode preference, Mixed-mode, Web survey, Mail survey, Telephone survey
1. Introduction
The public is increasingly choosing not to respond to surveys (Curtin et al., 2005; de Leeuw and de Heer, 2002). In the face of this challenge, some survey organizations are trying to increase response rates by providing sample members with the mode they prefer. Giving respondents their preferred mode is thought to generate goodwill and positive attitudes to-ward the survey (Dillman et al., 2009; Dillman and Tarnai, 1988; Groves and Kahn, 1979; Schaefer and Dillman, 1998; Shih and Fan, 2007). One recent study lent some support to this belief, finding that respondents who prefer the internet or the telephone mode are more likely to respond to internet and phone surveys than those who do not prefer these modes (Ol-son et al., 2012). However, most survey researchers do not have a measure of sample members’ mode preferences prior to conducting their surveys, making assignment of a ‘preferred mode’ difficult. Instead, survey organizations draw on con-ventional wisdom about which demographic groups prefer particular modes (e.g., young people will prefer web), some-times using studies that look at which groups choose which mode when offered a choice between two modes as guidance (e.g., Denniston et al., 2000; Dillman et al., 1994; Dillman et al., 2009; Diment and Garrett-Jones, 2007; Shih and Fan, 2007).
Surveyors who want to cater to sample members’ mode preferences need empirical evidence about what modes differ-ent types of sample members are likely to prefer. The objective of this paper is to provide that evidence by answering the question, “What respondent characteristics predict mode preferences?” We draw heavily on research and theory from the mode effects and survey participation literatures to develop a framework for understanding what characteristics should predict mode preferences. We then test these characteristics using data from two different surveys.
135
digitalcommons.unl.edu
136 S m y t h , O l S O n , & m i l l a r i n S o c i a l S c i e n c e R e S e a R c h 48 (2014)
2. Background
Several researchers have pointed out that different survey modes vary in the features that affect how respondents pro-ceed through the stages of the response process (de Leeuw, 1992; de Leeuw, 2005; Schwarz et al., 1991). We developed a four-category classification system in which each category represents a factor that would impact one’s ability and comfort using a particular survey mode. Mode features are classified by whether they affect each of these factors, which include (1) familiarity with and access to the equipment needed to provide a response, (2) physical and cognitive requirements of com-pleting the survey, (3) normative concerns that may be invoked in any given mode and (4) personal safety concerns that may arise in a mode. We hypothesize that respondents will prefer modes that they have at their disposal and that have features that minimize the physical and cognitive burden of responding as well as normative and personal safety concerns.
2.1. Mode features related to the logistics of responding
2.1.1. Familiarity with and access to mediaRespondents are expected to prefer survey modes that use familiar and comfortable technologies. Familiarity with
and access to the technologies underlying survey modes vary across demographic groups. For example, internet penetra-tion rates are higher in suburban and urban areas than rural areas (Rainie, 2010). In addition, young people, those with high household incomes, and those with higher educational attainment are more likely to use computers (Couper and Rowe, 1996) and the internet (Pew Internet and American Life Project, 2013a; Rainie, 2010). Moreover, whereas women spend more time than men processing email (U.S. Bureau of Labor Statistics, 2010), men spend more time in a wide vari-ety of other internet activities (Pew Internet and American Life Project, 2013b). Thus, we expect those from urban areas, the young, those with high incomes and education, and men to be more likely than their counterparts to prefer the inter-net over other modes.
Cell phone ownership also varies over demographic groups. Nonwhites, the highly educated, parents, those from sub-urban and urban areas, and Internet users report higher ownership and usage of cell phones than their counterparts (Len-hart, 2010). Our data do not allow us to test firm hypotheses about persons who prefer a cell phone survey, but we do expect those groups who are more likely to live in cell-phone only households, such as young people, those with lower income, those renting their home or living with unrelated roommates, men, Hispanics, and non-Hispanic black adults (Blumberg and Luke, 2013) to be less likely than their counterparts to prefer landline telephone surveys.
2.1.2. External distractionsSome people may prefer survey modes that minimize distractions that may make responding less comfortable and
more difficult. Schwarz et al. (1991) argued that external distractions may be less likely in interviewer-administered sur-veys because they are governed by general rules of politeness (e.g., interruptions are considered rude). As such, we might expect sample members who are likely to be interrupted (i.e., those with children, spouses, and employment) to prefer in-terviewer-administered modes. On the other hand, if being interrupted is unavoidable, we might expect sample members to prefer self-administered modes because these modes permit inattention and/or multitasking. These competing hy-potheses will be tested in this paper.
2.2. Mode features related to the physical and cognitive demands of responding
2.2.1. Visual versus aural presentationAny factor that affects respondents’ ability to process visual or aural communication should also affect their preferences
for a visual or aural survey mode. For example, we expect those with hearing loss to prefer a visual mode as it has been shown that hearing loss leads to difficulties with everyday conversational tasks, including talking on the telephone (Dalton et al., 2003). Similarly, we expect those with vision loss to prefer an aural mode. Other age-related physical impairments like shaky or arthritic hands may also make it difficult for respondents to meet the physical demands of completing a survey by certain modes (e.g., writing by hand or operating a mouse and keyboard) thus impacting mode preference.
2.2.2. Presence versus absence of interviewers: cognitive demandsWhether or not an interviewer is present also differs across survey modes (Schwarz et al., 1991; de Leeuw, 1992) and
therefore may affect mode preferences. For example, interviewers read the survey questions, enter responses, provide clari-fication, and answer respondent inquiries (Fowler and Mangione, 1990; Tourangeau et al., 2000), all of which may be desir-able for those with low literacy, low levels of education, or cognitive limitations. Yet, self-administered modes may also re-duce cognitive demands in other ways by allowing respondents to set the pace, giving them more control over question order (de Leeuw, 1992), and imposing fewer demands on working memory (Tourangeau et al., 2000). In sum, we anticipate that the relationship between the cognitive demands of a mode and mode preference is complex. For example, we expect those with low literacy to prefer interviewer-administered modes and those with poor working memory to prefer self-ad-ministered modes.
i d e n t i f y i n g p r e d i c t O r S O f S u r v e y m O d e p r e f e r e n c e 137
2.3. Mode features related to respondents’ normative concerns
2.3.1. Presence versus absence of interviewers: self-presentation effectsInterviewers can invoke concerns about self-presentation during a survey interview (Aquilino, 1994; Tourangeau and
Smith, 1996). Compared to face-to-face surveys, telephone, web and especially mail surveys afford respondents more personal space and increased feelings of anonymity, thus presenting fewer self-presentation problems (de Leeuw, 1992; Tourangeau and Smith, 1996). As such, we expect respondents who are strongly concerned with their self-presentation to prefer self-ad-ministered survey modes over interviewer-administered modes. This includes respondents who engage in sensitive behav-iors (Tourangeau and Smith, 1996). It also includes respondents who are depressed, lonely, or have low self-esteem; previous research has shown that these individuals tend to perceive online communication as safer than in-person communication be-cause they can more easily control their presentation of self (Caplan, 2003; McKenna et al., 2002; Segrin, 2000).
2.4. Mode features related to respondents’ personal safety concerns
2.4.1. Legitimacy of the survey requestAnother characteristic that differs across survey modes is the ability to convey sincerity of purpose or legitimacy (de
Leeuw, 1992). Respondents are likely to prefer modes that allow them to more easily differentiate between legitimate and illegitimate survey requests (e.g., sales calls, fundraising, phishing, and attempts at spreading computer viruses can all be disguised as surveys). The authority or legitimacy of the request can be communicated through advance letters in face-to-face, mail and some web surveys, or by an interviewer’s identification badge or through study materials left with the sampled household in face-to-face surveys (Dillman, 1978; Groves and Couper, 1998). In contrast, in many telephone sur-veys, calls come without notice and interviewers have few ways to demonstrate their legitimacy (Groves, 1990). As such, we expect those who are likely to be concerned with the legitimacy of the survey request, such as those who are con-cerned with crime and those who strongly dislike sales calls, to prefer modes other than telephone.
2.4.2. Privacy and perceived confidentialitySurvey modes also differ in their ability to maintain privacy and perceived confidentiality. The presence of interviewers
in face-to-face and telephone surveys reduces the privacy of responses compared to self-administered surveys. However, the interviewer can also make sure the interview takes place in private, increasing privacy vis-à-vis other household mem-bers (Schwarz et al., 1991). Thus, whether respondents prefer an interviewer or self-administered mode for privacy reasons may depend on who they want to keep their answers from, which is likely dependent upon the topic of the questions asked.
Sample members may also be concerned about the confidentiality and security of their data after the survey is com-pleted. These concerns are often heightened for electronic data. As such, we expect those who are concerned about crime, online scams, and especially identity theft to prefer modes other than the Internet.
In sum, we expect variables that are related to familiarity and access to media, external distractions, the physical and cognitive demands of responding, respondents’ normative concerns, and respondents’ personal safety concerns to influ-ence sample members’ mode preferences. We now evaluate whether proxies for these constructs predict mode preference.
3. Data and methods
The data for this paper come from two sources. The first is the Lewiston-Clarkston Quality of Life Survey (LCQOL), conducted in 2007 in the adjacent cities of Lewiston, Idaho and Clarkston, Washington. This survey was conducted by both mail and web, and the question order, layouts and the overall visual design were as similar as possible across modes, as were the recruitment materials. The survey included questions about community satisfaction, issues facing the com-munity, cell phone and internet use, mode preference, and demographic characteristics. A random selection of 2800 res-idential addresses from the United States Postal Service’s Delivery Sequence File (DSF) in the Lewiston-Clarkston area was randomly assigned to one of six experimental treatment groups that varied by mode (web, mail) and/or implemen-tation procedures1; two treatments are excluded due to suspected delivery problems. Our analyses focus on the four re-maining treatment groups (n = 1800). The adult with the most recent birthday from each household was asked to com-plete the questionnaire, and 1041 responded for a response rate of 57.8% (AAPOR RR2, AAPOR, 2011). Sixty respondents did not answer the mode preference question, leaving 981 respondents with data on the dependent variable. In this pa-per, we combine the four treatment groups but include a variable for response mode in regression models.
The second source of data is the 2008 Nebraska Annual Social Indicators Survey (NASIS), conducted by telephone be-tween February and August 2008 by the Bureau of Sociological Research at the University of Nebraska-Lincoln. The NA-SIS used a random digit dial sample of 4,743 listed landline telephone numbers, with 1811 completed interviews (AAPOR RR3 = 38%). Of these, 81 respondents did not answer the mode preference questions, reducing the analytic data set to 1730 respondents. The NASIS is an annual omnibus survey, with content ranging from demographic information, percep-tions of crime, fishing activity, satisfaction with roads in the state, economics, health and mental health, technology use, sex offender registry use, religious activity, and mode preference.
1. More information can be found in Millar et al. (2009) or Smyth et al. (2010).
138 S m y t h , O l S O n , & m i l l a r i n S o c i a l S c i e n c e R e S e a R c h 48 (2014)
3.1. Dependent variable: mode preference
Both the LCQOL and the NASIS included a question about a respondent’s preferred mode with slightly different re-sponse options. The question wording in the LCQOL is:
If you could choose how to answer surveys like this, which one of the following ways of answering would you prefer?
Filling out a paper questionnaire sent by mailFilling out a questionnaire on the InternetAnswering questions over the telephone
In the NASIS, the mode preference question asked:
If you received a request to do another survey like this one, which of the following types would you be most likely to agree to participate in?
An in-person interview at your homeAn interview on your home phoneAn interview on your cell phoneA paper survey sent by mailOr a survey on the internet?
Very few people in the LCQOL reported a telephone preference (n = 12) and have been dropped from the analysis. In the NASIS, the interviewer-administered modes of in-person interview, home phone interview, and cell phone interview have been combined to an overall “interviewer-administered mode” category as few respondents selected in-person in-terview or cell phone interview.
3.2. Available proxy variables
The LCQOL and the NASIS collected proxies for many, although not all, of the relevant concepts discussed above. Sex, age, income, race, internet access and cell phone access were all measured in both surveys and are included in our models as proxies for media familiarity and access. Marital status, presence of children at home, and employment status are also available in both surveys and are included in the models as proxies for external distractions. Unfortunately, we do not have separate measures of cognitive ability, literacy, and working memory so, consistent with previous research (Couper and Rowe, 1996; Kirsch et al., 1993; Krosnick and Alwin, 1987); we include education as a general proxy for cognitive abil-ities. Descriptive statistics for these variables in both surveys are shown in Table 1.
In addition to the ten variables that are available in both surveys, we utilize several variables that are unique to either the LCQOL or NASIS. In the LCQOL, we include additional variables that proxy for media familiarity and access, includ-ing being a heavy internet user, having internet at home, having a landline, completing a large number of mail, web and phone surveys per year, needing help using the web, and choosing the web to do tasks rather than some other way. In the NASIS, we include having poor computer ability, and living in the country or city as opposed to living on a farm as prox-ies for media familiarity and access. We also include additional proxies for cognitive and physical abilities, including hav-ing poor hearing and poor health as well as a proxy for potential normative concerns—having a high number of depres-sive symptoms, as measured using the Center for Epidemiologic Studies Depression Scale (CES-D) (Radloff, 1977). We examine safety concerns using the proxies of having a fear of computer viruses and fear of online scams in the LCQOL, and always or often fearing identity theft and crime in general in the NASIS.
We use logistic regression and multinomial logistic regression models to predict mode preference. We begin with lo-gistic regression models that predict web versus mail preference with variables that are common across surveys. This al-lows us to compare the results for consistency and robustness of findings across the two surveys. We then look at each survey individually, extending the models to include variables that are unique to one or the other survey. In these anal-yses, we trade our ability to draw direct comparisons across the two surveys for the ability to examine additional predic-tors of mode preference. In the NASIS, we also examine multinomial logistic regression models that compare mail and web preference to preference for interviewer-administered surveys; there were too few persons reporting preference for these surveys in the LCQOL to include these cases in the LCQOL models (dropping those who preferred telephone re-duced our LCQOL analytic sample to 969).
In the LCQOL and the NASIS, IVEWARE (Raghunathan et al., 2001) was used to impute item missing data five times. All analyses are conducted using the mi estimate command in STATA. Weights accounting for unequal probabilities of selection, coverage, and unit nonresponse are used for all of the NASIS analyses. Weights are not available in the LCQOL.
4. Findings
We start by looking at overall reports of mode preference in the two surveys. The majority of respondents to the LCQOL, which was conducted by mail and web, preferred mail surveys (64.1%) while the majority of respondents to
i d e n t i f y i n g p r e d i c t O r S O f S u r v e y m O d e p r e f e r e n c e 139
the NASIS, a telephone survey, preferred interviewer-administered surveys (53.7%). This is consistent with previous re-search that finds that mode preference reports are impacted by the mode in which the preference question is adminis-tered (Groves and Kahn, 1979). Since there were two possible completion modes in the LCQOL, we control for mode of completion in multivariate models for this survey (29% completed via web).
The results of logistic and multinomial logistic regression models predicting mode preference are shown in Table 2 for the LCQOL data set and Table 3 for the NASIS data set. In both tables Model 1 reports odds ratios predicting preference for internet versus mail surveys using the common predictors identified above. The results in these models are quite simi-lar. Both indicate that as age increases, the odds of preferring the internet relative to mail is decreased (LCQOL OR = 0.97, t = −3.79, p < .0001; NASIS OR = 0.98, t = −2.65, p < .008). Additionally, those who use the internet are much more likely to prefer internet over mail modes compared to those who do not use the internet (LCQOL OR = 10.55, t = 2.47, p < .014; NASIS OR = 30.39, t = 4.04, p < .0001). Both of these findings are consistent with the hypothesis that people’s mode prefer-ences are affected by their familiarity and access to the needed media. However, other indicators of familiarity and access such as gender, income, race and having a cell phone are not significant predictors of mode preference.
Only one of the variables serving as a proxy for external distractions has a significant effect on mode preferences. Em-ployed persons are more likely than the unemployed to prefer the internet relative to the mail mode. However, this effect only reaches significance in the NASIS model (LCQOL OR = 1.20, t = 0.67, p < .505; NASIS OR = 1.96, t = 2.38, p < .017). Con-trary to our expectations, whether respondents were married or had children was not associated with their mode preference.
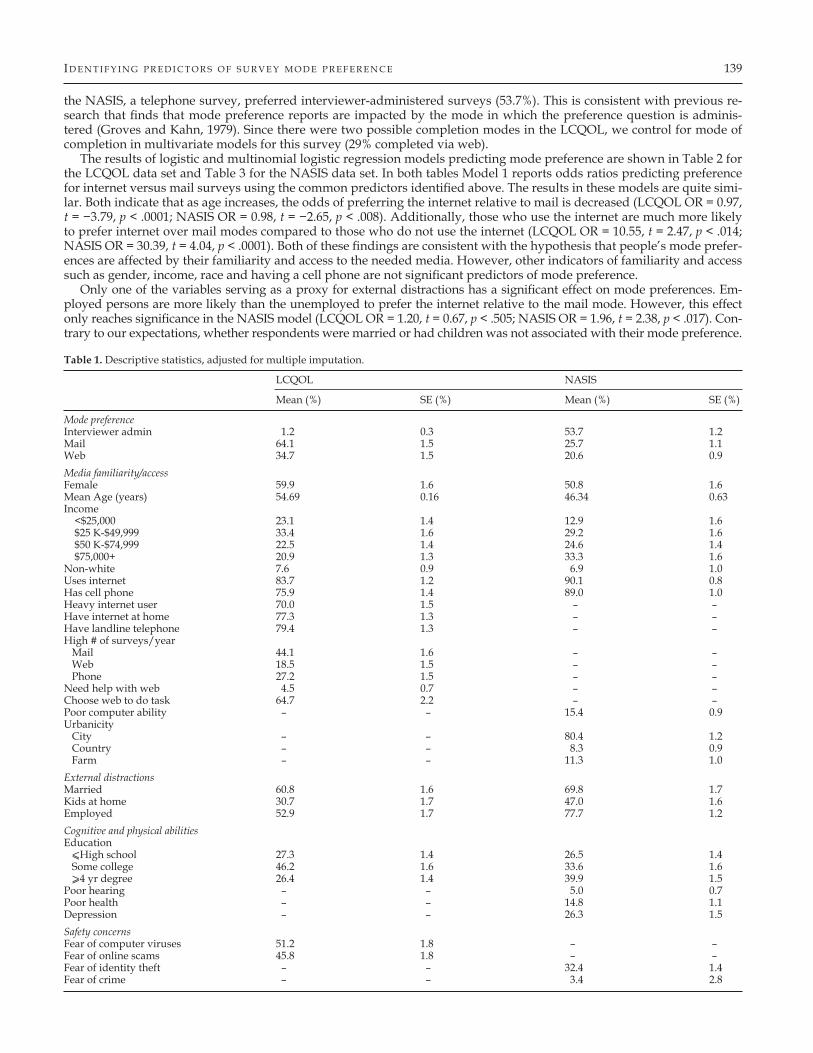
Table 1. Descriptive statistics, adjusted for multiple imputation.
LCQOL NASIS
Mean (%) SE (%) Mean (%) SE (%)
Mode preferenceInterviewer admin 1.2 0.3 53.7 1.2Mail 64.1 1.5 25.7 1.1Web 34.7 1.5 20.6 0.9Media familiarity/accessFemale 59.9 1.6 50.8 1.6Mean Age (years) 54.69 0.16 46.34 0.63Income <$25,000 23.1 1.4 12.9 1.6 $25 K-$49,999 33.4 1.6 29.2 1.6 $50 K-$74,999 22.5 1.4 24.6 1.4 $75,000+ 20.9 1.3 33.3 1.6Non-white 7.6 0.9 6.9 1.0Uses internet 83.7 1.2 90.1 0.8Has cell phone 75.9 1.4 89.0 1.0Heavy internet user 70.0 1.5 – –Have internet at home 77.3 1.3 – –Have landline telephone 79.4 1.3 – –High # of surveys/year Mail 44.1 1.6 – – Web 18.5 1.5 – – Phone 27.2 1.5 – –Need help with web 4.5 0.7 – –Choose web to do task 64.7 2.2 – –Poor computer ability – – 15.4 0.9Urbanicity City – – 80.4 1.2 Country – – 8.3 0.9 Farm – – 11.3 1.0External distractionsMarried 60.8 1.6 69.8 1.7Kids at home 30.7 1.7 47.0 1.6Employed 52.9 1.7 77.7 1.2Cognitive and physical abilitiesEducation ⩽High school 27.3 1.4 26.5 1.4 Some college 46.2 1.6 33.6 1.6 ⩾4 yr degree 26.4 1.4 39.9 1.5Poor hearing – – 5.0 0.7Poor health – – 14.8 1.1Depression – – 26.3 1.5Safety concernsFear of computer viruses 51.2 1.8 – –Fear of online scams 45.8 1.8 – –Fear of identity theft – – 32.4 1.4Fear of crime – – 3.4 2.8
140 S m y t h , O l S O n , & m i l l a r i n S o c i a l S c i e n c e R e S e a R c h 48 (2014)
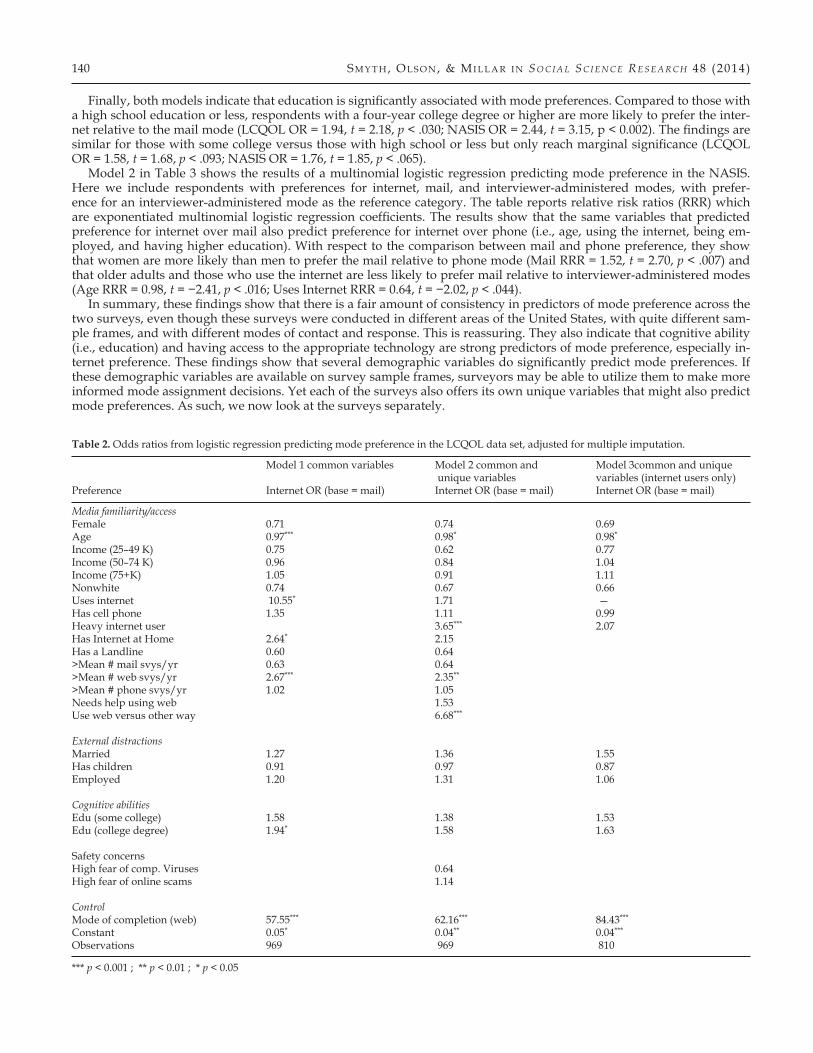
Finally, both models indicate that education is significantly associated with mode preferences. Compared to those with a high school education or less, respondents with a four-year college degree or higher are more likely to prefer the inter-net relative to the mail mode (LCQOL OR = 1.94, t = 2.18, p < .030; NASIS OR = 2.44, t = 3.15, p < 0.002). The findings are similar for those with some college versus those with high school or less but only reach marginal significance (LCQOL OR = 1.58, t = 1.68, p < .093; NASIS OR = 1.76, t = 1.85, p < .065).
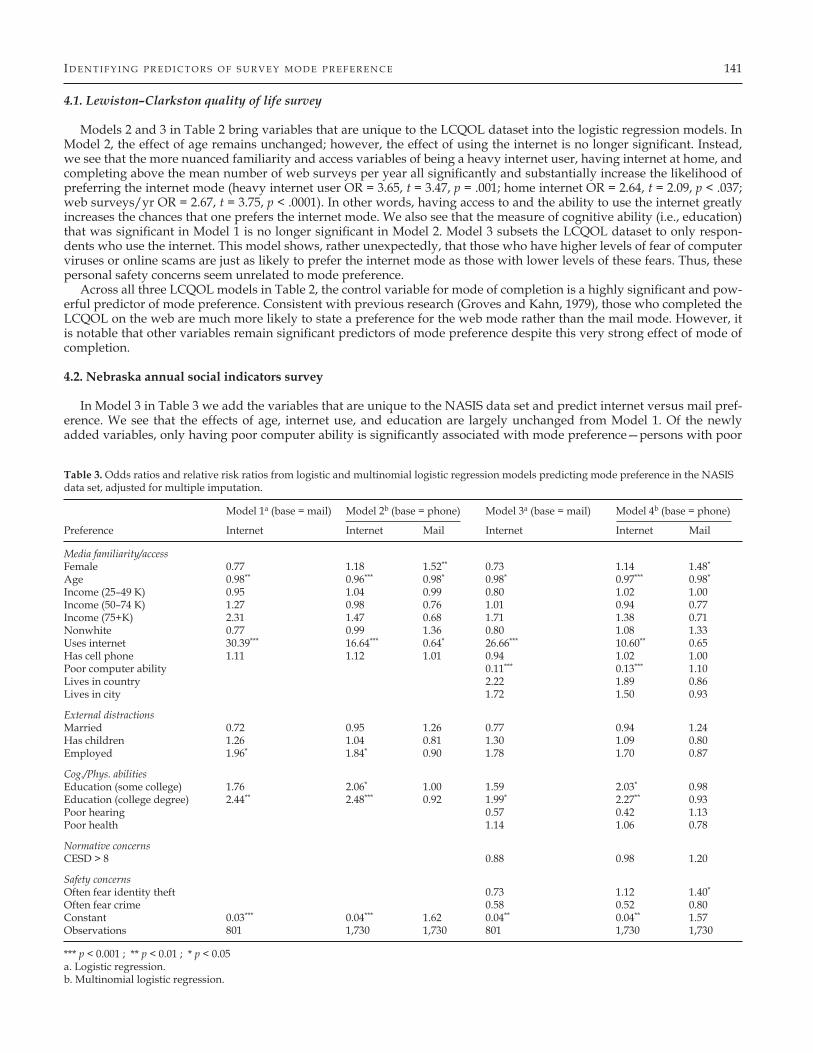
Model 2 in Table 3 shows the results of a multinomial logistic regression predicting mode preference in the NASIS. Here we include respondents with preferences for internet, mail, and interviewer-administered modes, with prefer-ence for an interviewer-administered mode as the reference category. The table reports relative risk ratios (RRR) which are exponentiated multinomial logistic regression coefficients. The results show that the same variables that predicted preference for internet over mail also predict preference for internet over phone (i.e., age, using the internet, being em-ployed, and having higher education). With respect to the comparison between mail and phone preference, they show that women are more likely than men to prefer the mail relative to phone mode (Mail RRR = 1.52, t = 2.70, p < .007) and that older adults and those who use the internet are less likely to prefer mail relative to interviewer-administered modes (Age RRR = 0.98, t = −2.41, p < .016; Uses Internet RRR = 0.64, t = −2.02, p < .044).
In summary, these findings show that there is a fair amount of consistency in predictors of mode preference across the two surveys, even though these surveys were conducted in different areas of the United States, with quite different sam-ple frames, and with different modes of contact and response. This is reassuring. They also indicate that cognitive ability (i.e., education) and having access to the appropriate technology are strong predictors of mode preference, especially in-ternet preference. These findings show that several demographic variables do significantly predict mode preferences. If these demographic variables are available on survey sample frames, surveyors may be able to utilize them to make more informed mode assignment decisions. Yet each of the surveys also offers its own unique variables that might also predict mode preferences. As such, we now look at the surveys separately.
Table 2. Odds ratios from logistic regression predicting mode preference in the LCQOL data set, adjusted for multiple imputation.
Model 1 common variables Model 2 common and Model 3common and unique unique variables variables (internet users only)Preference Internet OR (base = mail) Internet OR (base = mail) Internet OR (base = mail)
Media familiarity/accessFemale 0.71 0.74 0.69Age 0.97*** 0.98* 0.98*
Income (25–49 K) 0.75 0.62 0.77Income (50–74 K) 0.96 0.84 1.04Income (75+K) 1.05 0.91 1.11Nonwhite 0.74 0.67 0.66Uses internet 10.55* 1.71 —Has cell phone 1.35 1.11 0.99Heavy internet user 3.65*** 2.07Has Internet at Home 2.64* 2.15Has a Landline 0.60 0.64>Mean # mail svys/yr 0.63 0.64>Mean # web svys/yr 2.67*** 2.35**
>Mean # phone svys/yr 1.02 1.05Needs help using web 1.53Use web versus other way 6.68***
External distractionsMarried 1.27 1.36 1.55Has children 0.91 0.97 0.87Employed 1.20 1.31 1.06
Cognitive abilitiesEdu (some college) 1.58 1.38 1.53Edu (college degree) 1.94* 1.58 1.63
Safety concernsHigh fear of comp. Viruses 0.64High fear of online scams 1.14
ControlMode of completion (web) 57.55*** 62.16*** 84.43***
Constant 0.05* 0.04** 0.04***
Observations 969 969 810
*** p < 0.001 ; ** p < 0.01 ; * p < 0.05
i d e n t i f y i n g p r e d i c t O r S O f S u r v e y m O d e p r e f e r e n c e 141
4.1. Lewiston–Clarkston quality of life survey
Models 2 and 3 in Table 2 bring variables that are unique to the LCQOL dataset into the logistic regression models. In Model 2, the effect of age remains unchanged; however, the effect of using the internet is no longer significant. Instead, we see that the more nuanced familiarity and access variables of being a heavy internet user, having internet at home, and completing above the mean number of web surveys per year all significantly and substantially increase the likelihood of preferring the internet mode (heavy internet user OR = 3.65, t = 3.47, p = .001; home internet OR = 2.64, t = 2.09, p < .037; web surveys/yr OR = 2.67, t = 3.75, p < .0001). In other words, having access to and the ability to use the internet greatly increases the chances that one prefers the internet mode. We also see that the measure of cognitive ability (i.e., education) that was significant in Model 1 is no longer significant in Model 2. Model 3 subsets the LCQOL dataset to only respon-dents who use the internet. This model shows, rather unexpectedly, that those who have higher levels of fear of computer viruses or online scams are just as likely to prefer the internet mode as those with lower levels of these fears. Thus, these personal safety concerns seem unrelated to mode preference.
Across all three LCQOL models in Table 2, the control variable for mode of completion is a highly significant and pow-erful predictor of mode preference. Consistent with previous research (Groves and Kahn, 1979), those who completed the LCQOL on the web are much more likely to state a preference for the web mode rather than the mail mode. However, it is notable that other variables remain significant predictors of mode preference despite this very strong effect of mode of completion.
4.2. Nebraska annual social indicators survey
In Model 3 in Table 3 we add the variables that are unique to the NASIS data set and predict internet versus mail pref-erence. We see that the effects of age, internet use, and education are largely unchanged from Model 1. Of the newly added variables, only having poor computer ability is significantly associated with mode preference—persons with poor
Table 3. Odds ratios and relative risk ratios from logistic and multinomial logistic regression models predicting mode preference in the NASIS data set, adjusted for multiple imputation.
Model 1a (base = mail) Model 2b (base = phone) Model 3a (base = mail) Model 4b (base = phone)
Preference Internet Internet Mail Internet Internet Mail
Media familiarity/accessFemale 0.77 1.18 1.52** 0.73 1.14 1.48*
Age 0.98** 0.96*** 0.98* 0.98* 0.97*** 0.98*
Income (25–49 K) 0.95 1.04 0.99 0.80 1.02 1.00Income (50–74 K) 1.27 0.98 0.76 1.01 0.94 0.77Income (75+K) 2.31 1.47 0.68 1.71 1.38 0.71Nonwhite 0.77 0.99 1.36 0.80 1.08 1.33Uses internet 30.39*** 16.64*** 0.64* 26.66*** 10.60** 0.65Has cell phone 1.11 1.12 1.01 0.94 1.02 1.00Poor computer ability 0.11*** 0.13*** 1.10Lives in country 2.22 1.89 0.86Lives in city 1.72 1.50 0.93
External distractionsMarried 0.72 0.95 1.26 0.77 0.94 1.24Has children 1.26 1.04 0.81 1.30 1.09 0.80Employed 1.96* 1.84* 0.90 1.78 1.70 0.87
Cog./Phys. abilitiesEducation (some college) 1.76 2.06* 1.00 1.59 2.03* 0.98Education (college degree) 2.44** 2.48*** 0.92 1.99* 2.27** 0.93Poor hearing 0.57 0.42 1.13Poor health 1.14 1.06 0.78
Normative concernsCESD > 8 0.88 0.98 1.20
Safety concernsOften fear identity theft 0.73 1.12 1.40*
Often fear crime 0.58 0.52 0.80Constant 0.03*** 0.04*** 1.62 0.04** 0.04** 1.57Observations 801 1,730 1,730 801 1,730 1,730
*** p < 0.001 ; ** p < 0.01 ; * p < 0.05 a. Logistic regression.b. Multinomial logistic regression.
142 S m y t h , O l S O n , & m i l l a r i n S o c i a l S c i e n c e R e S e a R c h 48 (2014)
computer abilities are much less likely to prefer web surveys than mail surveys (OR = 0.11, t = -4.08, p < .0001). Urbanic-ity, poor hearing, poor health, a high CESD score, and fear of identity theft or crime are not significantly associated with web or mail preferences.
Results in Model 4, the multinomial logistic regression predicting internet or mail preference compared to preference for interviewer-administered surveys, are largely unchanged from Model 2. While those with poor computer abilities are less likely to prefer the internet relative to an interviewer-administered mode (RRR = 0.13, t = -4.24, p < .0001), none of the other added variables (poor hearing, poor health, a high CESD score, fear of identity theft, or fear of crime) significantly predict an internet preference.
The results for a mail preference are also quite similar before and after the unique variables are added with the excep-tion that the previously significant effect of being an internet user is no longer significant. None of the added measures capturing hearing, health, depression or fear of crime are significant predictors of a mail preference relative to an inter-viewer-administered preference, but we do find that those who often fear identity theft are more likely to prefer mail than an interviewer-administered mode (RRR = 1.40, t = 2.12, p = .034).
4.3. Summary
Variables related to media familiarity and access were the primary predictors across both surveys. This is also where we had the widest assortment of covariates available. As a proxy for cognitive and physical abilities, education level also predicts mode preference in both surveys. Both of these findings were expected.
However, our findings have also identified a wide range of theoretically motivated variables that are not associated with mode preferences. Surprisingly, there is only weak evidence that safety concerns are related to mode preference (only in the NASIS), and no evidence that external distractions or normative concerns are associated with mode prefer-ence once accounting for a fuller range of covariates. That is, individuals do not appear to select a mode because it is the simplest to complete with multiple competing demands (e.g., job, children). Additionally, respondents are not select-ing modes because they are concerned about self-presentation issues. Nor are they selecting modes because they are con-cerned about scams or identity theft – this may be already accounted for in whether the respondent has internet access at all. Also surprising is that persons who are hard of hearing are not more likely to prefer a self-administered mode to an interviewer-administered mode. Given the theoretical expectations about the relevance of these concepts, the consistent lack of association found across the two surveys for these constructs is just as important as the consistent significant re-sults for media familiarity and access.
5. Discussion and conclusions
This paper starts with the observation that many surveyors believe that one possible way to increase response rates is to cater to sample members’ mode preferences, and some research has suggested that this strategy can be beneficial in certain circumstances (Olson et al., 2012). However, aside from conventional wisdom, survey researchers have very lit-tle information to use in trying to determine what a sample member’s mode preference might be, especially the first time a sample member is surveyed. Thus, the purpose of this paper was to develop reasoned predictions about what factors should be related to mode preference and then to empirically evaluate these predictions.
Our empirical findings suggest that, aside from mode of completion in the LCQOL, being familiar with and having ac-cess to the required media are the strongest predictors of mode preference. Findings from both data sets show that, con-sistent with conventional wisdom, the young really do prefer the web mode, as do those who use the internet. Findings from the LCQOL suggest that the more nuanced access and familiarity variables of being a heavy internet user, having in-ternet access at home and completing many web surveys in a year are even more predictive of an internet preference than simply being an internet user. Other significant predictors of an internet preference are being highly educated (i.e., cogni-tive ability) and employed, both variables related to one’s ability to use the internet. The findings also reveal that older in-dividuals are more likely to prefer interviewer-administered modes over the self-administered modes of mail and web. Moreover, in the NASIS, women tended to prefer mail over interviewer-administered modes.
Surprisingly, our measures of safety concerns were not strong predictors of mode preference. Being afraid of computer viruses or online scams was not a predictor of mode preference, and being afraid of identity theft decreased preference for interviewer-administered modes, but not web surveys. We thought that fear of identity theft would drive respondents away from an internet preference and toward modes where the survey request could be more easily legitimated by inter-viewers. In hindsight, however, this finding might reflect that telephone survey calls often come out of the blue, are quite scripted, and happen very quickly, leaving respondents few opportunities to politely request information they can use to verify the source of the call.
None of the measures of physical ability and normative concerns were significant predictors of mode preference. We suspect that we did not have the right proxies. Additional research should examine a wider array of these measures, espe-cially those related to normative concerns.
One positive implication of our findings is that some sample frames will contain information related to media fa-miliarity and access such as age, allowing surveyors to make informed decisions about what mode to assign to sample
i d e n t i f y i n g p r e d i c t O r S O f S u r v e y m O d e p r e f e r e n c e 143
members. This is especially likely to be true in more specialized populations such as students, employees, and members of an organization. In other cases, such as in address-based samples of the general public, no such information is avail-able, but we may be able to use geographic information on the frame (e.g., zip codes in the Delivery Sequence File) to ap-pend relevant zip-code level information from the Census such as the age distribution of residents.
Of course, this paper is not without its limits. Our confidence in the findings is increased because we were able to rep-licate our analyses on two very different data sets. Yet we recognize that we are identifying significant predictors of mode preference for people who are already survey respondents. Whether or not these same predictors are effective for peo-ple who did not respond to either of these surveys is still an open question, and unfortunately one that is unlikely to be answered by survey research alone. Additionally, the category of ‘interviewer-administered mode’ reflects primar-ily landline telephone surveys. Given cost constraints, face-to-face interviews are usually not an option provided to re-spondents in mixed mode surveys, whereas telephone, web and mail are often combined. Finally, it is possible that some of our proxies reflect more than one underlying reason for preferring a specific mode. For example, we categorized em-ployment as an external distraction because it takes people’s time away from home where telephone calls and postal mail are generally processed. However, it is also possible that people access certain technologies like the internet and cell phones through their employment, making it an access and familiarity issue (with a competing directional relationship with mode preference). However, this limitation should not take away from the more practical finding that there are con-sistent systematic differences in mode preference for different subgroups. This consistency suggests that mode preference is not simply derived from an on-the-spot evaluation of the mode in which the respondent is interviewed. In spite of the strong effect of mode of completion, other factors can be useful for helping surveyors decide which mode to offer and tai-lor survey designs to their respondents.This is the first empirical investigation of predictors of mode preference. We have replicated our findings about the im-portance of media familiarity and access across two very different studies. Yet each study had weak proxies for the other constructs of interest, and we could not fully evaluate the role of completion mode on reported mode preference. The ideal study would randomly assign individuals to one of the four main modes – in person, telephone, mail and web – and assess both mode preference and multiple indicators of media familiarity and access, cognitive and physical abili-ties, safety and normative concerns, and external distractions to fully test the theoretical model proposed here. Addition-ally, cognitive interviews on how people actually think about and answer mode preference questions would be useful. As a first empirical study of its kind, this research shows the importance of this kind of future research to fully understand mode preference and its implications for survey research.
Acknowledgments –The authors wish to thank Don Dillman for access to the Lewiston and Clarkston Quality of Life data and two reviewers for very helpful comments.
Funding — The Lewiston and Clarkston Quality of Life survey was supported under Cooperative Agreement 43-3AEU-5-80039 between Washington State University and the USDA-NASS (Division of National Agricultural Statistics), with support from the National Center for Science and engineering Statistics of the National Science Foundation (Don A. Dillman PI). The Quality of Life in a Changing Nebraska Survey was supported by a University of Nebraska-Lincoln Office of Research Layman Award to Kristen Olson (PI). These funding sources had no involvement in the study designs, analysis, or reporting of final results.
References
American Association for Public Opinion Research, 2011. Standard Definitions: Final Dispositions of Case Codes and Outcome Rates for Surveys. < http://www.aapor.org/For_Researchers/5850.htm > (retrieved 03.06.13).
Aquilino, William, 1994. Interview mode effects in surveys of drug and alcohol use. Public Opin. Quart. 58, 210–240.Blumberg, Stephen J., Luke, Julian V., 2013. Wireless Substitution: Early Release of Estimates From the National Health Inter-
view Survey, January–June 2013. National Center for Health Statistics. < http://www.cdc.gov/nchs/data/nhis/earlyre-lease/wireless201312.pdf > (retrieved 25.04.14).
Caplan, Scott E., 2003. Preference for online social interaction: a theory of problematic internet use and psychosocial well-being. Commun. Res. 30 (6), 625–648.
Couper, Mick P., Rowe, Benjamin, 1996. Evaluation of a computer-assisted self-interview component in a computer-assisted personal interview survey. Public Opin. Quart. 60, 89–105.
Curtin, Richard, Presser, Stanley, Singer, Eleanor, 2005. Changes in telephone survey nonresponse over the past quarter cen-tury. Public Opin. Quart. 69 (1), 87–98.
Dalton, Dayna S., Cruickshanks, Karen J., Klein, Barbara E.K., Klein, Ronald, Wiley, Terry L., Nondahl, David N., 2003. The im-pact of hearing loss on quality of life in older adults. The Gerontologist 43 (5), 661–668.
de Leeuw, Edith D., 1992. Data Quality in Mail, Telephone, and Face to Face Surveys. TT-Publikaties, Amsterdam.de Leeuw, Edith D., 2005. To mix or not to mix data collection modes in surveys. J. Official Stat. 25 (2), 233–255.de Leeuw, Edith D., de Heer, Wim, 2002. Trends in household survey nonresponse: a longitudinal and international compari-
son. In: Groves, R.M., Dillman, D.A., Eltinge, J.L., Little, R.J.A. (Eds.), Survey Nonresponse. Wiley, New York, pp. 41–54.
144 S m y t h , O l S O n , & m i l l a r i n S o c i a l S c i e n c e R e S e a R c h 48 (2014)
Denniston, Maxine, Stein, Kevin, Baker, Frank, Brogan, Donna, West, Michele, Roche, Lisa, 2000. An experiment in data collec-tion mode preference of long-term cancer survivors. Proc. Surv. Res. Methods Sect. Am. Stat. Assoc., 411–416.
Dillman, Don A., 1978. Mail and Telephone Surveys: The Total Design Method. Wiley-Interscience, New York. Dillman, Don A., Tarnai, John, 1988. Administrative issues in mixed mode surveys. In: Groves, R.M., Biemer, P.P., Lyberg, L.E.,
Massey, J.T., Nicholls, W.L., II, Wakesberg, J. (Eds.), Telephone Survey Methodology. Wiley, New York, pp. 509–528.Dillman, Don A., West, Kirsten K., Clark, Jon R., 1994. Influence of an invitation to answer by telephone on response to census
questionnaires. Public Opin Quart. 58, 557–568.Dillman, Don A., Smyth, Jolene D., Christian, Leah Melani, 2009. Internet, Mail, and Mixed Mode Surveys: The Tailored Design
Method, third ed. John Wiley & Sons, Hoboken, NJ.Diment, Kieren, Garrett-Jones, Sam, 2007. How demographic characteristics affect mode preference in a postal/web mixed-
mode survey of Australian researchers. Social Sci. Comput. Rev. 25, 410–417.Fowler Jr., Floyd J., Mangione, Thomas W., 1990. Standardized Survey Interviewing: Minimizing Interviewer-Related Error. Ap-
plied Social Research Methods Series, vol. 18. Sage, Newbury Park, CA.Groves, Robert M., 1990. Theories and Methods of Telephone Surveys. Ann. Rev. Sociol. 16, 221–240.Groves, Robert M., Couper, Mick, 1998. Nonresponse in Household Interview Surveys. John Wiley, New York.Groves, Robert M., Kahn, Robert L., 1979. Surveys by Telephone: A National Comparison with Personal Interviews. Academic
Press Inc., New York, NY.Kirsch, Irwin S., Jungeblut, Ann, Jenkins, Lynn, Kolstad, Andrew, 1993. Adult Literacy in America: A First Look at the Results
of the National Adult Literacy Survey. Office of Educational Research and Improvement, US Dept. of Education, Washing-ton, DC.
Krosnick, Jon A., Alwin, Duane F., 1987. An evaluation of a cognitive theory of response-order effects in survey measurement. Public Opin. Quart. 51 (2), 201–219.
Lenhart, Amanda, 2010. Cell Phones and American Adults: They Make Just as Many Calls, but Text Less Often than Teens. < http://pewinternet.org/~/media//Files/Reports/2010/PIP_Adults_Cellphones_Report_2010.pdf > (retrieved 09.09.10).
McKenna, Katelyn Y.A., Green, Amie S., Gleason, Marci E.J., 2002. Relationship formation on the internet: what’s the big attrac-tion? J. Social Issues 58 (1), 9–31.
Millar, Morgan M., O’Neill, Allison C., Dillman, Don A., 2009. Are Mode Preferences Real? Technical Report 09-003. Social and Economic Sciences Research Center, Washington State University. Pullman, WA.
Olson, Kristen, Smyth, Jolene D., Wood, Heather M., 2012. Does giving people their preferred survey mode actually increase survey participation rates? An experimental examination. Public Opin. Quart. 76 (4), 611–635.
Pew Internet & American Life Project, 2013a. Demographics of Internet Users. Pew Internet Post-Election Survey, November 14–December 09, 2012. < http://www.pewinternet.org/Static-Pages/Trend-Data-%28Adults%29/Whos-Online.aspx > (re-trieved 30.04.13).
Pew Internet & American Life Project. 2013b. ’Usage Over Time’ Spreadsheet. < http://www.pewinternet.org/Static-Pages/Trend-Data-%28Adults%29/Usage-Over-Time.aspx > (retrieved 16.04.13).
Radloff, Lenore Sawyer, 1977. The CES-D scale: a self-report depression scale for research in the general population. Appl. Psy-chol. Meas. 1 (3), 385–401.
Raghunathan, Trivellore E., Lepkowski, James M., Van Hoewyk, John, Solenberger, Peter, 2001. A multivariate technique for multiply imputing missing values using a sequence of regression models. Surv. Methodol. 27, 85–95.
Rainie, Lee, 2010. Internet, Broadband, and Cell Phone Statistics. Pew Internet & American Life Project. < http://www.pewin-ternet.org/~/media//Files/Reports/2010/PIP_December09_update.pdf > (retrieved 09.09.10).
Schaefer, David R., Dillman, Don A., 1998. Development of a standard e-mail methodology: results of an experiment. Public Opin. Quart. 62 (3), 378–397.
Schwarz, Norbert, Strack, Fritz, Hippler, Hans-J., Bishop, George, 1991. The impact of administration mode on response effects in survey measurement. Appl. Cognit. Psychol. 5, 193–212.
Segrin, C., 2000. Social skills deficits associated with depression. Clin. Psychol. Rev. 20 (3), 379–403.Shih, Tse-Hua, Fan, Xitao, 2007. Response rates and mode preferences in web-mail mixed-mode surveys: a meta-analysis. Int. J.
Internet Sci. 2 (1), 59–82.Smyth, Jolene D., Dillman, Don A., Christian, Leah Melani, O’Neill, Allison, 2010. Using the internet to survey small towns and
communities: limitations and possibilities in the early 21st century. Am. Behav. Sci. 53, 1423–1448.Tourangeau, Roger, Smith, Tom W., 1996. Asking sensitive questions: the impact of data collection mode, question format, and
question context. Public Opin. Quart. 60 (2), 275–304.Tourangeau, Roger, Rips, Lance J., Rasinski, Kenneth, 2000. The Psychology of Survey Response. Cambridge University Press,
New York.U.S. Bureau of Labor Statistics, 2010. American Time Use Survey: Telephone Calls, Mail, and E-Mail Done by Men and Women
in 2009. < http://www.bls.gov/tus/current/telephone.htm > (retrieved 08.09.10).
Related Documents