Identifying Multiplicative Interactions Between Temporal Scales of Human Movement Variability ESPEN A. F. IHLEN 1 and BEATRIX VEREIJKEN 2 1 Department of Neuroscience, Norwegian University of Science and Technology, Trondheim, Norway; and 2 Department of Human Movement Science, Norwegian University of Science and Technology, 7491 Trondheim, Norway (Received 9 July 2012; accepted 8 December 2012; published online 18 December 2012) Associate Editor Nicholas Stergiou oversaw the review of this article. Abstract—Conventional scaling analyses of human move- ment variability such as detrended fluctuation analyses assume that the movement variable can be decomposed into scale-dependent variation. However, these conventional scal- ing analyses are insensitive to multiplicative interactions within the movement variable. Multiplicative interactions refer to couplings between the scale-dependent variations across multiple scales that generate intermittent changes in the human movement variable. The mathematical concept for intermittent variability generated by multiplicative inter- actions is called multifractal variability. Multifractal vari- ability is numerically defined by a spectrum of scaling exponents (i.e., a multifractal spectrum) that can be an important feature of coordinated movements and, conse- quently, relevant when aiming to identify movement disor- ders. In the current study, a new method is introduced based on detrended fluctuation analysis that can identify the multifractal spectrum from the temporal variation of local scaling exponents. The influence of multiplicative interac- tions on the local scaling exponents is tested by a Monte Carlo surrogate test. The methods are validated on multipli- cative cascading processes with known multiplicative inter- actions. The application of the new methods is subsequently illustrated on an example of centre of pressure variations during quiet and relaxed standing. The results show that multiplicative interactions are present during periods with large movements of the center of gravity, where the move- ments of the centre of gravity and centre of pressure couple into coordinative structures. Further application and inter- pretation of the developed method for the study of human movement variability are discussed. Keywords—Multifractal, Detrended fluctuation analysis, 1/f-noise, Scaling exponents. INTRODUCTION Variability in human movement has been a central focus of interdisciplinary fields of research throughout the last decades. 34 Movement patterns like walking, running, and standing possess a substantial amount of variability. This variability is realized in time contin- uous variables such as position, velocity, acceleration of single segments and joints, as well as ground reac- tion force, center of pressure (CoP), and center of gravity (CoG). Furthermore, the variability is also realized in time discrete variables such as stride time, length, and width in cyclical movements like walking and running. 15 Even though variability seems to be omnipresent in human movement, there is little con- sensus on how to best quantify variability. 34 Conven- tional measures of variability such as standard deviation, root mean square, and coefficient of varia- tion parameterize the average magnitude of variability around the nominal trajectory of the movement vari- able. However, variability is both dependent on intrinsic properties of the movement system and the extrinsic properties of the context of the movement. Thus, the magnitude of variability cannot be equated to low quality movement or a movement disorder because it might reflect the system’s ability to adapt to a heterogeneous movement context. Human movement variability, like stride time vari- ation of human gait and CoP variation in human stance, has been shown to be fractal. 10,15 The fractal variation in human movements indicates that the movement evolves over short time periods of a single time unit as well as over long time periods of hundreds (or even thousands) of time units. Most importantly, the fractality of human movement variability refers to the scale-invariant structure of the human movement variable across these multiple time periods (i.e., scales). Address correspondence to Beatrix Vereijken, Department of Human Movement Science, Norwegian University of Science and Technology, 7491 Trondheim, Norway. Electronic mail: beatrix. [email protected] Annals of Biomedical Engineering, Vol. 41, No. 8, August 2013 (Ó 2012) pp. 1635–1645 DOI: 10.1007/s10439-012-0724-z 0090-6964/13/0800-1635/0 Ó 2012 Biomedical Engineering Society 1635

Welcome message from author
This document is posted to help you gain knowledge. Please leave a comment to let me know what you think about it! Share it to your friends and learn new things together.
Transcript

Identifying Multiplicative Interactions Between Temporal Scales
of Human Movement Variability
ESPEN A. F. IHLEN1 and BEATRIX VEREIJKEN
2
1Department of Neuroscience, Norwegian University of Science and Technology, Trondheim, Norway; and 2Departmentof Human Movement Science, Norwegian University of Science and Technology, 7491 Trondheim, Norway
(Received 9 July 2012; accepted 8 December 2012; published online 18 December 2012)
Associate Editor Nicholas Stergiou oversaw the review of this article.
Abstract—Conventional scaling analyses of human move-ment variability such as detrended fluctuation analysesassume that the movement variable can be decomposed intoscale-dependent variation. However, these conventional scal-ing analyses are insensitive to multiplicative interactionswithin the movement variable. Multiplicative interactionsrefer to couplings between the scale-dependent variationsacross multiple scales that generate intermittent changes inthe human movement variable. The mathematical conceptfor intermittent variability generated by multiplicative inter-actions is called multifractal variability. Multifractal vari-ability is numerically defined by a spectrum of scalingexponents (i.e., a multifractal spectrum) that can be animportant feature of coordinated movements and, conse-quently, relevant when aiming to identify movement disor-ders. In the current study, a new method is introduced basedon detrended fluctuation analysis that can identify themultifractal spectrum from the temporal variation of localscaling exponents. The influence of multiplicative interac-tions on the local scaling exponents is tested by a MonteCarlo surrogate test. The methods are validated on multipli-cative cascading processes with known multiplicative inter-actions. The application of the new methods is subsequentlyillustrated on an example of centre of pressure variationsduring quiet and relaxed standing. The results show thatmultiplicative interactions are present during periods withlarge movements of the center of gravity, where the move-ments of the centre of gravity and centre of pressure coupleinto coordinative structures. Further application and inter-pretation of the developed method for the study of humanmovement variability are discussed.
Keywords—Multifractal, Detrended fluctuation analysis,
1/f-noise, Scaling exponents.
INTRODUCTION
Variability in human movement has been a centralfocus of interdisciplinary fields of research throughoutthe last decades.34 Movement patterns like walking,running, and standing possess a substantial amount ofvariability. This variability is realized in time contin-uous variables such as position, velocity, accelerationof single segments and joints, as well as ground reac-tion force, center of pressure (CoP), and center ofgravity (CoG). Furthermore, the variability is alsorealized in time discrete variables such as stride time,length, and width in cyclical movements like walkingand running.15 Even though variability seems to beomnipresent in human movement, there is little con-sensus on how to best quantify variability.34 Conven-tional measures of variability such as standarddeviation, root mean square, and coefficient of varia-tion parameterize the average magnitude of variabilityaround the nominal trajectory of the movement vari-able. However, variability is both dependent onintrinsic properties of the movement system and theextrinsic properties of the context of the movement.Thus, the magnitude of variability cannot be equatedto low quality movement or a movement disorderbecause it might reflect the system’s ability to adapt toa heterogeneous movement context.
Human movement variability, like stride time vari-ation of human gait and CoP variation in humanstance, has been shown to be fractal.10,15 The fractalvariation in human movements indicates that themovement evolves over short time periods of a singletime unit as well as over long time periods of hundreds(or even thousands) of time units. Most importantly,the fractality of human movement variability refers tothe scale-invariant structure of the human movementvariable across these multiple time periods (i.e., scales).
Address correspondence to Beatrix Vereijken, Department
of Human Movement Science, Norwegian University of Science and
Technology, 7491 Trondheim, Norway. Electronic mail: beatrix.
Annals of Biomedical Engineering, Vol. 41, No. 8, August 2013 (� 2012) pp. 1635–1645
DOI: 10.1007/s10439-012-0724-z
0090-6964/13/0800-1635/0 � 2012 Biomedical Engineering Society
1635

Fractal analyses derive measures that parameterizethe average scale-invariant structure of variabilityrather than the average magnitude of variability.Human movement variability evolves on multiplescales and can be decomposed by fractal analyses toinvestigate the magnitude of variation at each scale.11
Fractal analyses such as detrended fluctuation anal-ysis,26 scaled window variance analysis,3 and disper-sion analysis2 indicate that the movement variablex(t) has a scale-invariant structure where its inte-grated profile y(t) has a power law relationyðctÞ / c
�hyðtÞ. The scaling exponent �h numericallydefines the scale-invariant structure of the movementvariable x(t). Values of the scaling exponent �h in therange 0–0.5 reflect an anti-persistent and more irreg-ular structure of the movement variable x(t). This canbe found in the presence of challenging movementcontexts demanding more active adjustment of themovement variable, advanced age, or neurodegener-ative diseases such as Huntington’s disease.16 Valuesof the scaling exponent �h in the range 0.5–1 reflectpersistent and regular structure of the movementvariables in healthy coordinated movement patternsthat are adaptable to external perturbations in themovement context. Values of the scaling exponent �habove 1 indicate that the movement variable x(t) hasa non-stationary and random walk-like structure. Anon-stationary random walk is obtained by integrat-ing stationary noise. Thus, the persistent and anti-persistent classification of the non-stationary randomwalk-like variable remains by substituting the inte-grated profile y(t) with x(t) above, or by substracting1 from the obtained �h.
The conventional monofractal analyses of move-ment variables assume that the scale-invariant struc-ture can be summarized in a single scaling exponent �h.However, temporal variation in the persistent structureof x(t) can reflect temporal changes in the movementcontext or changes in the control of the movementvariable x(t) due to internal perturbations such asinsufficient joint torque generation. The variation inthe persistent structure can be summarized in a mul-tifractal spectrum of scaling exponents. To date, mul-tifractal analyses have rarely been employed in studiesof human movement,19 though frequently in neuro-physiologic studies and studies of heart rate variabil-ity.20,35 These studies showed that the multifractalspectrum was able to differentiate between patientswith ventricular tachycardia, ventricular fibrillation,and congestive heart failure, which was not possible byusing single monofractal exponents or by parametersof other nonlinear analyses.20,35 Furthermore, themultifractal spectrum of endogenous brain dynamicsand response times was shown to be more sensitiveto the influence of age and cognitive performance
compared to single monofractal exponents.19,31 Themultifractal structure of variability has therefore beensuggested to be an important feature of the healthyregulation of heart rate and other neurophysiologicprocesses.14
Multifractal analyses also have the ability tonumerically define multiplicative interactions betweentemporal scales. One of few ways to formally define therelationship between multiplicative interactions andmultifractal spectrum is by multiplicative cascadingprocesses.1,4,25 Multiplicative cascades are stochasticprocesses with multiplicative interactions betweentemporal scales. The multiplicative interactionsbetween temporal scales are defined by the cumulativeproduct of random multipliers across temporal scales.The width and shape of the distribution of randommultipliers are directly reflected by the width and shapeof the multifractal spectrum. The intermittent periodsof large variation are defined as a cumulative productof large random multipliers whereas intermittent peri-ods of small variation are defined as a cumulativeproduct of small multipliers. Figure 1 illustrates thatthese intermittent periods of small and large variationdefine scaling exponents in the right (red arrow) andleft tail (blue arrow) of the multifractal spectrum.Thus, the intermittent variation with large amplitudehas a more irregular structure (i.e., small scalingexponents) compared to the variation with smallamplitude (i.e., large exponents). Furthermore, thedifferences in magnitude of variation in the intermit-tent periods increase with the multifractal spectrumwidth (compare light and dark red traces and spectrumarcs in Fig. 1). Monofractal variation has no multi-plicative interactions between temporal scales and,consequently, no intermittent periods of small regularand large irregular variability (see the bottom light redtrace in Fig. 1). Studies of postural sway in patientswith neurodegenerative diseases have indicated thatCoP variability with less multifractal structure (i.e., asmall multifractal spectrum width) indicates lessinteractions between the temporal scales of the CoP inthese patients.24,29 Thus, multifractal analyses and theanalysis of multiplicative interactions between tempo-ral scales can provide a new and important perspectiveon changes in human movement variability with ageand disease.
The aim of the present study is to introduce amethod to numerically define the multifractal spectrumand the influence of multiplicative interactions betweentemporal scales in human movement variability. A newmultifractal extension of the detrended fluctuationanalysis will be introduced in the method section andsubsequently applied to an example of CoP variabilityin two different conditions of human standing. Thepaper ends with a discussion of further application and
E. A. F. IHLEN AND B. VEREIJKEN1636

interpretation of multifractal analyses in humanmovement variability.
IDENTIFYING MULTIPLICATIVE
INTERACTIONS BETWEEN TEMPORAL
SCALES
Detrended fluctuation analysis (DFA) is one of themost frequently employed methods to numericallydefine the scale-invariant structure in movement vari-ability, such as the inter-stride time variability in gait,17
CoP variation,10 and bimanual coordination.32 DFA isalso found to be more robust compared to otherscaling analyses.6 DFA identifies the scaling exponent�h as the following power-law relation between the root-mean-square variation of the scale dependent measureFðt0; nÞ and the temporal scale n (the following equa-tion is a modified version suggested by Kantelhardtet al.21):
ffiffiffiffiffiffiffiffiffiffiffiffiffiffiffiffiffiffiffiffiffiffiffiffiffiffiffiffiffiffiffiffiffiffiffiffiffiffiffi
1
N
XN
t0¼1Fðt0; nÞ½ �2
r
/ n�h ð1Þ
The scale-dependent measure Fðt0; nÞ in the conven-tional DFA is defined within non-overlapping timeintervals of the random walk profile yðkÞ ¼
Pkt¼1
xðtÞ � �x of the movement variable x(t). However, thelocal deviation from the average scaling exponent �hcan be defined by Fðt0; nÞ in the floating time intervals[t0 2 n/2, t0 + n/2] instead. Fðt0; nÞ is defined by theroot-mean-square variation around a fitted polynomialtrend ym(k) within the floating time interval [t0 2 n/2,t0 + n/2]:18
Fðt0; nÞ ¼ffiffiffiffiffiffiffiffiffiffiffiffiffiffiffiffiffiffiffiffiffiffiffiffiffiffiffiffiffiffiffiffiffiffiffiffiffiffiffiffiffiffiffiffiffiffiffiffiffiffiffiffiffiffiffiffiffi
1
n
Xt0þn=2k¼t0�n=2
yðkÞ � ymðkÞ½ �2r
ð2Þ
However, the root mean square of Fðt0; nÞ in Eq. (1)assumes that Fðt0; nÞ is homogeneously distributed inboth time and scale. This assumption is violated inhuman movement variability where the local scale-invariant structure can change over time. The localscale-invariant structure can be numerically defined asa power law relation between the scale-dependentmeasurement Fðt0; nÞ and the temporal scales n:33
Fðt0; nÞ / nhðt0Þ ð3Þ
The local scaling exponent h(t0) can be estimated as thelocal linear regression slope of log(Fðt0; nÞ) vs. log(n).However, this procedure induces large estimationerrors as indicated by the conventional DFA whenperformed within the floating time window of smallsample sizes.6 An alternative method is to assume that
0 100 200 300 400 500 600 700 800 900 1000
0
0.2
0.4
0.6
0.8
1.0
1.2h m
ax(t
) -
h min(t
)
t (sample #)0.5 1 1.5
0
0.1
0.2
0.3
0.4
0.5
0.6
0.7
0.8
0.9
1
D(h
)
Multifractal spectrum D(h)
h(t)
Period of large and irregular variability Period of small and regular variability
hmax(t) - hmin(t)
Small h(t) in the left tail of D(h) Large h(t) in the right tail of D(h)
FIGURE 1. Variability created by multiplicative cascading processes with increasing multifractal spectrum width hmax(t) 2 hmin(t)(traces from light to dark red) where hmax and hmin are the maximum and the minimum local scaling exponents. The differencebetween periods with small and large variability increases with the multifractal spectrum width hmax(t) 2 hmin(t). The periods withlarge and irregular variability are associated with small h(t) in the left tail of the multifractal spectrum D(h) whereas those with smalland regular variability are associated with large h(t) in the right tail of D(h).
Multiplicative Interactions 1637
human movement variability is similar to a multipli-cative cascading process and defined by local scalingexponents in both time and scale by the followingequation:18,30
hðt0; nÞ ¼log Fðt0; nÞð Þ � �h logðnÞ þ C
� �
logðnÞ � logðnNÞþ �h ð4Þ
where �h logðnÞ þ C is the regression line at scale n usedto estimate the average scaling exponent �h by theconventional DFA in Eq. (1). Thus, the local scalingexponent hðt0; nÞ identifies the large deviations fromthe average �h which is not possible in the conventionalDFA. The multifractal spectrum D(h) is directlyrelated to the distribution p(h) of the local scalingexponents in the scale limit n fi 0 and numericallydefined by the following equation:27
DðhÞ ¼ log pðhÞ=pmaxðhÞð Þ� log eð Þ þ 1 ð5Þ
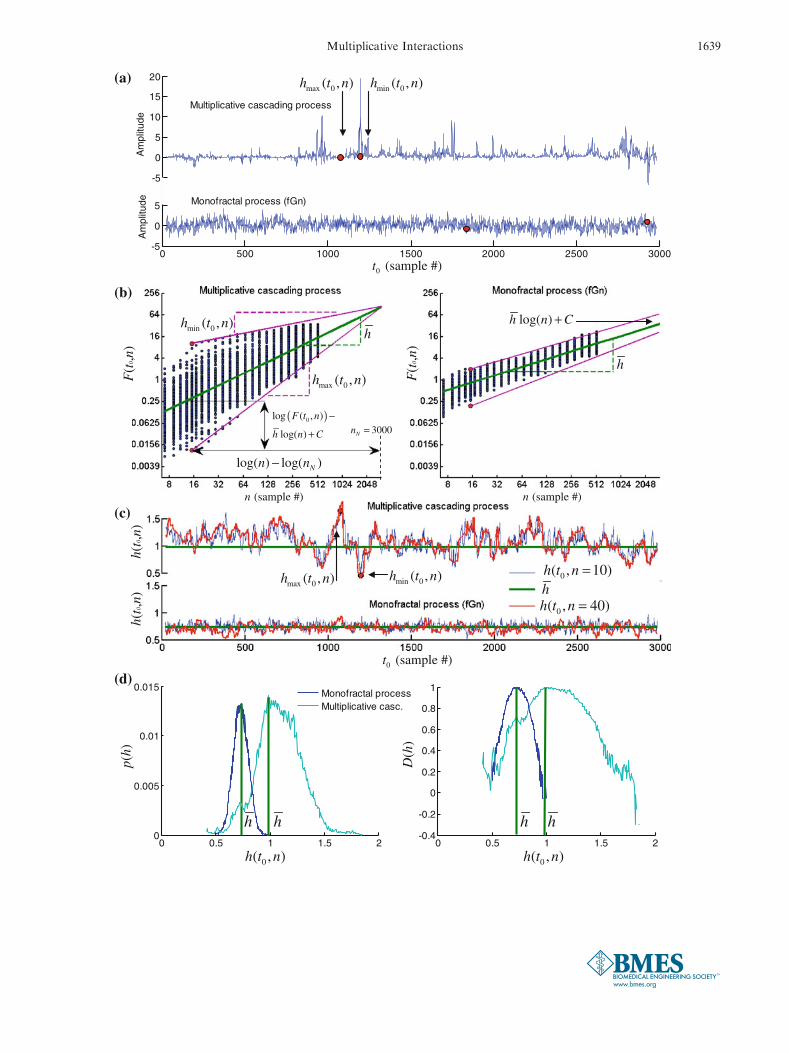
where pmaxðhÞ is the maximum probability (i.e., mode)of the distribution p(h) and where e is the bin size of thehistogram used to estimate the distribution p(h). Thewidth of the multifractal spectrum D(h) increases withthe width of the distribution p(h) of local scalingexponents. Figure 2 summarizes the procedure for thecomputation of the local scaling exponent hðt0; nÞ, itsdistribution p(h), and the multifractal spectrum D(h).
The next step in the multifractal analysis is to testwhether the large deviations of the local scalingexponents hðt0; nÞ from the average �h are influenced bymultiplicative interactions between temporal scales.This can be tested by a Monte Carlo surrogate testwhere an ensemble of surrogates from each humanmovement variable is generated. These surrogates havethe same power spectral density and probability dis-tribution of the original variable, but the multiplicativeinteractions (i.e., phase couplings) between the tem-poral scales are eliminated.28 If the local scalingexponents of the original variable are influenced bymultiplicative interactions between temporal scales,they will be significantly different from the local scalingexponents of the ensemble of surrogate series. Thesignificant difference between the local exponent of theoriginal variable and the ensemble of surrogates istested by the following two-tailed statistical test:
pþ ¼ NþN
and p� ¼ N�N
ð6Þ
where N+ and N2 are the number of surrogates withlocal scaling exponents hðt0; nÞ that are larger orsmaller, respectively, than hðt0; nÞ of the original vari-able. The number of surrogates should be in the order1000–10,000 to provide a robust estimation of the pvalue.5 The application of the surrogate test in the
present paper used 2500 surrogates that yielded aprecision of the estimated p value to the second deci-mal.5 The local scaling exponents hðt0; nÞ of the origi-nal variable are significantly influenced bymultiplicative interactions when p< 0.025 (i.e., two-tailed test), in other words, when <2.5% of hðt0; nÞ ofthe surrogates are larger or smaller than hðt0; nÞ of theoriginal variable. Furthermore, when these local scal-ing exponents align across multiple scales rather thanbeing randomly distributed in time and scale, then thescale-invariant structure of the original variable issignificantly influenced by multiplicative interactionsbetween the temporal scales. Figure 3 illustrates themultifractal analysis and the Monte Carlo test per-formed on a multiplicative cascading process. The redand blue dots indicate that the large deviations of thelocal scaling exponents from the average exponent aresignificantly influenced by multiplicative interactionsand that these interactions generate the intermittentperiods of large irregular variations and intermittentperiods of small regular variation.
EXAMPLE OF MULTIPLICATIVE
INTERACTIONS IN COP IN HUMAN STANDING
The multifractal analysis and Monte Carlo test wasapplied to CoP variations during 1 min quiet and1 min relaxed standing. The participant in this exam-ple, a young, healthy adult (height 1.80 m, body mass
FIGURE 2. Illustration of the multifractal analyses in Eqs.(1)–(5). (a) A multifractal (upper panel) and monofractal (lowerpanel) variable where the largest hmaxðt0;nÞ and smallesthminðt0;nÞ scaling exponents coincide with the time periods ofsmall regular variability and large irregular variability,respectively; (b) The scaling plots of the scale dependentmeasure F ðt0;nÞ in Eq. (2) vs. scale n (in log–log coordinates)for the multifractal (left panel) and the monofractal (rightpanel) variables. The blue dots indicate F ðt0;nÞ for each timeinstant t0. The local scaling exponent F ðt0;nÞ is defined by Eq.(4) as the difference between log F ðt0;nÞð Þ and the regressionline �h logðnÞ þ C of the conventional DFA (green line) for eachsample t0 divided by the difference between the scale n ofF ðt0;nÞ and the maximum scale nN 5 3000. The averagescaling exponent �h computed by the conventional DFA (i.e.,Eq. 1) is then added to the variation around the regressionline �h logðnÞ þ C. The purple lines in the left panel illustratethe local slope of hmaxðt0;nÞ and hminðt0;nÞ for the multifractalvariable; (c) The time evolution of the local scaling exponenthðt0;nÞ for scale n 5 10 (blue trace) and n 5 40 (red trace) forthe multifractal (upper panel) and the monofractal (lowerpanel) variables. The arrows indicate hmaxðt0;nÞ and hminðt0;nÞdefined by the purple lines in (b). The green lines indicate theaverage scaling exponent �h computed by the conventionalDFA; (d) (left panel) The probability distribution p(h) of thelocal scaling exponents hðt0;nÞ for the multifractal (light bluetrace) and the monofractal (dark blue trace) variables. (rightpanel) The multifractal spectrum D(h) computed by Eq. (5) forthe multifractal (light blue trace) and the monofractal (darkblue trace) variables. The green lines indicate the averagescaling exponent �h computed by the conventional DFA.
c
E. A. F. IHLEN AND B. VEREIJKEN1638
0 0.5 1 1.5 20
0.005
0.01
0.015
0 0.5 1 1.5 2-0.4
-0.2
0
0.2
0.4
0.6
0.8
1Monofractal processMultiplicative casc.
-5
0
5
10
15
20
Am
plitu
de
0 500 1000 1500 2000 2500 3000-5
0
5
Am
plitu
de
Multiplicative cascading process
Monofractal process (fGn)
0( , )h t n
p(h)
D(h
)
0( , )h t n
0 (sample #)t
h(t0 ,
n)h(
t0,n)
0( , 10)h t n =
0( , 40)h t n =h
min 0( , )h t n
max 0( , )h t n
h
log( ) log( )Nn n−
3000Nn =( )0log ( , )
log( )
F t n
h n C
−
+
h
log( )h n C+
0 (sample #)t
(sample #)n
min 0( , )h t nmax 0( , )h t n
max 0( , )h t n min 0( , )h t n
h h h h
(a)
(b)
(c)
(d)
F(t
0,n)
F(t
0,n)
(sample #)n
Multiplicative Interactions 1639

79.4 kg, age 20 years), stood as still as possible duringthe quiet standing condition, and relaxed and com-fortably during the relaxed standing condition in whichmovements were allowed. The CoP was measured with50 Hz sampling frequency by a Kistler force plate(Type 9286A, Kistler Group Switzerland) and theprojection line of the CoG was estimated by a modifiedversion of the algorithm introduced by King andZatsiorsky.23 The multifractal analysis of Eqs. (2)–(6)was conducted on the CoP profiles in both anterior-posterior and mediolateral directions, each containing3000 samples. The Regional Committee for Medicaland Health Research Ethics approved the study, andthe participant gave written informed consent beforedata collection started. The research conformed to theDeclaration of Helsinki.
Figure 4 illustrates that multiple periods with localscaling exponents that were significantly influenced bymultiplicative interactions were present in the relaxedstanding condition but not in the quiet standing con-dition. These local scaling exponents hðt0; nÞ weresmaller than the average �h computed by the conven-tional DFA (see green lines in the right panels of(a)–(d) in Fig. 4) and also significantly smaller thanthe ensemble of surrogate series. Furthermore, thesmall hðt0; nÞ that were significantly influenced by
multiplicative interactions were aligned across multiplescales, indicating that the interactions are scale-invariant. The periods with small hðt0; nÞ in the relaxedstanding condition coincided with periods with largemovements of CoG. These small hðt0; nÞ generated bymultiplicative interactions indicate that the coordina-tion of variation in CoP on multiple scales reflectsperiods of irregular structure where the CoP is counteradjusted in accordance with the large movements ofCoG. Furthermore, the presence of small scalingexponents during the periods with large CoG move-ments results in a larger left tail of the multifractalspectrum D(h) compared to the D(h) of the quietstanding condition. Consequently, the larger left tailgenerated by multiplicative interactions between tem-poral scales was also reflected in a larger multifractalspectrum width in the relaxed standing condition.
Even though the temporal changes in the localscaling exponents hðt0; nÞ and the presence of multi-plicative interactions coincide with large changes in theCoP due to movements in the CoG, the present anal-ysis has a main benefit compared to a mere visualinspection of the CoP and CoG traces. The localscaling exponent hðt0; nÞ defines the local structure ofCoP rather than the absolute local magnitude or thedirection of change in CoP. Thus, different magnitudes
FIGURE 3. The local scaling exponents hðt0;nÞ of a multiplicative cascading process. The red and blue dots mark the times t andscales n where the hðt0;nÞ are significantly larger and smaller (i.e., p2 < 0.025 and p+ < 0.025 in Eq. 6), respectively, than theensemble surrogates. The red and blue dots appear in the periods with large irregular and small regular variability (i.e., small andlarge hðt0;nÞ) that represent the tails of the multifractal spectrum D(h) as illustrated in Fig. 1.
E. A. F. IHLEN AND B. VEREIJKEN1640

and directional changes in CoP can yield the samehðt0; nÞ, making it difficult to predict hðt0; nÞ fromvisual inspection of the CoP trace. Furthermore, pre-vious studies of CoP variation have found that themultifractal spectrum width decreases in patients withParkinson’s disease24 and persons with balance disor-ders,29 whereas the magnitude of the CoP variationincreases. These results might reflect an impairedcoupling between the movements of the CoP and themovements of the CoG. Furthermore, the impairedcoupling between the temporal scales might reflectimpaired modulation of CoP movement controlaccording to the CoG movements and, thus, increasedrisk of falling when CoP approaches the boundary ofthe base of support. This suggestion is confirmed inother studies of quiet and relaxed standing in olderadults where the CoP variation is larger in quietstanding but smaller during relaxed standing due toless CoG movement, compared to younger adults.9,12
Summarized, analyses of multifractal variations andmultiplicative interactions between temporal scalesreveal new properties of human postural control andcan thereby provide a new perspective on the impair-ment of postural control with age and disease.
DISCUSSION
The purpose of the present study was to introduce anew multifractal analysis that can identify time periodsof multiplicative interactions in a movement variable.The analysis of multifractal variation and multiplica-tive interactions between temporal scales has severalpotential applications in human movement science.First, human movement dynamics are characterized bycoupling of joints and segments with a high number ofdegrees of freedom into low dimensional synergies.22
However, adaptive movement control likely utilizesexisting degrees of freedom by coupling and decou-pling of the synergies in time. This phase couplingacross temporal scales indicates temporal transitions inthe active control of the movement that are notassessed by monofractal analyses like the conventionalDFA. Recently, Dingwell and Cusumano8 suggested areinterpretation of the average scaling exponent �hestimated by the conventional DFA that supports ourinterpretation. They suggested that anti-persistentvariation indicated by a scaling exponent �h< 0.5 inhuman movement variables, such as gait speed, indi-cates that these variables are more actively controlledthan variables with persistent variation �h> 0.5. Fig-ure 4 illustrates that the active control of the CoPduring human stance changes with the temporalchanges in the CoG. In periods of large changes inCoG during relaxed standing, the degrees of freedom
coupled into low dimensional synergies (i.e., activecontrol) that resulted in smaller local scaling exponentshðt0; nÞ contained in the left tail of the multifractalspectrum D(h). However, the synergies are decoupledinto many degrees of freedom (i.e., absence of activecontrol) in quiet standing conditions with small chan-ges in the CoG and, consequently, the CoP has locallya more persistent structure indicated by larger localscaling exponents hðt0; nÞ. Recent findings of a decreasein multifractal spectrum width of the CoP of patientswith Parkinson’s disease24 and balance disorders29
suggest decoupling (i.e., less interactions) between thetemporal scales of the movement variable that can beindicative of an impairment in the temporal modula-tion of postural control in these patient groups. Thus,the analysis of temporal changes in hðt0; nÞ of themovement variable introduced here likely extendsthe theory of Dingwell and Cusumano to contain thetemporal modulation of active control of the move-ment variable.
Multifractal analyses are developed from multipli-cative cascading processes that are stochastic models ofinteractions across multiple time scales. Even thoughmultiplicative cascading processes do not suggestunderlying biological mechanisms for hðt0; nÞ of themovement variable, they are the only models that candefine the width and shape of the multifractal spectrumof the variable. The multiplicative cascade defines themultifractal spectrum by the width and shape of thedistribution of interaction multipliers and, conse-quently, a formal relationship exists between the localvariation of scaling exponents hðt0; nÞ and the multi-plicative interactions between temporal scales.19 If thetemporal changes in hðt0; nÞ indicate temporal modu-lation of active control, then the modulation can begenerated by multiplicative interactions (i.e., phasecouplings) between the temporal scales of the move-ment variable. Nevertheless, the multifractal spectrumof a movement variable can be created by randomextreme events rather than temporal modulation ofactive control. In movement variability with randomextreme events, the shape and width of the multifractalspectrum will be dependent on the distribution of thevariability. In these cases, the surrogates of themovement variable will replicate the distribution ofthe movement variable and, consequently, replicate themultifractal spectrum. It is therefore important toperform a surrogate test to confirm that the multi-fractal spectrum is generated by multiplicative inter-actions and not simply by the distribution of themovement variable. In addition, the surrogates seriesused in the present study also replicate the powerspectral density of the movement variable and, conse-quently, the average scaling exponent �h. This explainswhy only the large deviations of hðt0; nÞ from the
Multiplicative Interactions 1641

E. A. F. IHLEN AND B. VEREIJKEN1642

average �h are found to be influenced by multiplicativeinteractions.
The temporal modulation of active control can beassessed by the modulation of the local scalingexponent hðt0; nÞ that is a complementary metric tothe average scaling exponents �h defined by the
conventional DFA. The definition of hðt0; nÞ also opensup for the possibility of correlations between temporalmodulations of active control of two co-sampledmovement variables. Two movement variables that arenot correlated in their magnitude of variability never-theless might share the same temporal modulation ofhðt0; nÞ by multiplicative interactions across temporalscales. Furthermore, these two movement variables canalso be different in their average persistent structuredefined by differences in �h computed by the conven-tional DFA. Consequently, the uncorrelated movementvariables with different average structure �h can stillhave a high correlation in the variation of the localscaling exponents hðt0; nÞ (see Fig. 5). Thus, the multi-fractal analysis introduced in the present study canidentify the common temporal modulation of activecontrol by multiplicative interactions between temporalscales and whether these interactions are common formultiple movement variables. Summarized, the metrichðt0; nÞ provides a possible numerical definition oftemporal modulation of active control that is notnumerically defined by �h estimated by conventionalmonofractal analyses like DFA.
The multifractal analysis introduced in the presentpaper has certain limitations when employed to human
-5
0
5
-5
0
5
Am
plit
ude
-20 -10 0 10-15
-10
-5
0
5
10
X: amplitude
Y: a
mp
litu
de
0 200 400 600 800 10000
0.5
1
1.5
2
t0 (sample #)
h(t 0
,n)
0 0.5 1 1.50.5
1
1.5
2
X: h(t0,n)
Y: h
(t 0,n)
Multip. cascade X
Multip. cascade Y
n = 10
R = 0.8
R = 0.1
(b) (d)
(c)(a)
FIGURE 5. (a) Two series of multiplicative cascading processes (X: blue trace and Y: green trace) generated by interactionmultipliers with perfect correlation (R 5 1); (b) the corresponding local scaling exponents hðt0;nÞ for X (blue trace) and Y (greentrace) for the finest scale n 5 2 and n 5 10 (red traces); (c) the scatter plot of amplitude X vs. amplitude Y. Note that X and Y areconstructed from perfectly correlated interaction multipliers but have no significant cross-correlation; (d) the high cross-corre-lation between hðt0;nÞ reflects the correlation between the interaction multipliers.
FIGURE 4. Multiplicative interactions between temporalscales (i.e., contour plot) of the CoP movements (upper trace)in AP (a, b) and ML (c, d) directions for both quiet (a, c) andrelaxed (b, d) standing. The temporal variations in hðt0;nÞ areillustrated in a contour plot for multiple temporal scales nwhere the periods with red colours reflect large hðt0;nÞ (i.e.,regular structure of CoP) whereas blue colours illustrate smallhðt0;nÞ (i.e., irregular structure of CoP). The vertical alignmentof blue and red dots illustrates the time instants t0 wherehðt0;nÞ are significantly larger or smaller (i.e., p2 < 0.025 andp+ < 0.025 in Eq. 6) than the ensemble of surrogates and,consequently, the scale-invariant structure is significantlyinfluenced by multiplicative interactions between the tempo-ral scales. hðt0;nÞ is significantly influenced by multiplicativeinteractions between the temporal scales in periods with largeCoG movements, particularly in the relaxed standing condi-tion. The significantly smaller hðt0;nÞ contribute to a longerleft tail of the multifractal spectrum D(h) for relaxed standing,illustrated by the larger blue sub-spectra in the right panels of(b) and (d) compared to the blue sub-spectra for quietstanding (right panels of a and c). Note that the green lines inthe multifractal spectra D(h) in (a) to (d) indicate the averagescaling exponent �h computed by the conventional DFA (i.e.,Eq. 1).
b
Multiplicative Interactions 1643
movement variability. First, also monofractal variationcan produce a multifractal spectrum with non-zerowidth. This phenomenon can be termed multifractalnoise and the magnitude of the multifractal noise can beidentified by running the multifractal analyses onmonofractal variables of equal average scaling expo-nent �h and sample size as the movement variable.Furthermore, indirect estimation of the movementvariable, like the estimation of CoG from the groundreaction force in the present study, might contain esti-mation errors dependent on the magnitude of move-ment. These errors might alter the variation of the localscaling exponent hðt0; nÞ and, consequently, the tails ofthe multifractal spectrumD(h). Second, the multifractalanalysis assumes a power law relationship in Eq. (3) forthe statistical measure derived from Eq. (2). Thisassumption does not necessarily hold for all movementvariables and should be explicitly checked. As anexample, variability in the CoP position is found tohave a scale-invariant structure whereas the variabilityin CoP velocity has not.7 Thus, the present methodshould be modified to fit movement variables that donot have a scale-invariant structure or conductedwithin sub-ranges of temporal scales where theassumptions of scale invariance are satisfied.13 Third,the present method indicates that human movementvariability might be equal to a multiplicative cascadingprocess. However, multiplicative cascades are stochas-tic processes based on random number generators.Therefore, multiplicative cascades do not suggest spe-cific underlying mechanisms of human movement var-iability as a phenomenon. The comparison of thetemporal variation in the local scaling exponents withchanges in other variables such as the CoG in theexample in Fig. 4, are important to identify underlyingmechanisms for the multiplicative interactions that arespecific for the movement pattern and the movementcontext. These comparisons also link the statisticalfeatures of the multifractal spectrum with the biome-chanical features of the movement pattern (i.e., thecoupling of variability across multiple time scales dur-ing weight transfer in human standing) and will be abasis for further development of models that incorpo-rate the movement pattern and the movement context.
CONCLUSION
The present study introduced a new multifractalanalysis that can identify multiplicative interactionsbetween the temporal scales of human movement vari-ability. The analyses are based on the theory of multi-plicative cascades, but do not directly identify themechanisms behind multiplicative interactions in move-ment variability. Themultifractal analysis is useful in the
investigation of variability in recurrence time of cyclicalmovements such as human gait, bimanual coordinationof multiple limbs, segments or joints, and variability inthe performance parameter of a movement task.
ACKNOWLEDGMENTS
The authors thank Nina Skjæret and XiangchunTan for their help with data collection. The authorsdeclare that there are no conflicts of interests. Theinfinitely divisible cascades were synthesised by Matlabfunctions available at http://www.isima.fr/~pchainai/PUB/software.html. The Matlab functions for themultifractal analysis are available at http://www.ntnu.edu/inm/geri/software.
CONFLICT OF INTEREST
No benefits in any form have been or will bereceived from a commercial party related directly orindirectly to the subject of this manuscript.
REFERENCES
1Barral, J., and B. B. Mandelbrot. Multiplicative productsof cylindrical pulses. Probab. Theory Rel. 124:409–430,2002.2Caccia, D. C., D. B. Percival, M. J. Cannon, G. M. Ray-mond, and J. B. Bassingthwaighte. Analyzing exact fractaltime series: evaluating dispersional analysis and rescaledrange methods. Phys. A 246:609–632, 1997.3Cannon, M. J., D. B. Percival, D. C. Caccia, G. M. Ray-mond, and J. B. Bassingthwaighte. Evaluating scaledwindowed variance methods for estimating the Hurstcoefficient of time series. Phys. A 241:606–626, 1997.4Chainais, P., R. Riedi, and P. Abry. On non-scale-invari-ant infinitely divisible cascades. IEEE T. Inform. Theory51:1063–1083, 2005.5Clauset, A., C. R. Shalizi, and M. E. J. Newman. Power-law distributions in empirical data. arXiv:0706.1062v1,(http://arxiv.org/abs/0706.1062), 2007.6Delignieres, D., S. Ramdani, L. Lemoine, K. Torre, M.Fortes, and G. Ninot. Fractal analysis for short time series:a reassessment of classical methods. J. Math. Psychol.50:525–544, 2006.7Delignieres, D., K. Torre, and P.-L. Bernard. Transitionfrom persistent to anti-persistent correlations in posturalsway indicates velocity-based control. PLoS Comput. Biol.7:e1001089, 2011.8Dingwell, J. B., and J. P. Cusumano. Re-interpretingdetrended fluctuation analyses of stride-to-stride variabilityin human walking. Gait Posture 32(3):348–353, 2010.9Duarte, M., and D. Sternad. Complexity of human pos-tural control in young and older adults during prolongedstanding. Exp. Brain Res. 191:265–276, 2008.
10Duarte, M., and V. M. Zatsiorsky. On the fractal propertiesof natural human standing. Neurosci. Lett. 283:173–176,1999.
E. A. F. IHLEN AND B. VEREIJKEN1644
11Eke, A., P. Hermann, L. Kocsis, and L. R. Kozak. Fractalcharacterization of complexity in temporal physiologicalsignals. Physiol. Meas. 23:R1–R38, 2002.
12Freitas, M. S. F., S. A. Wieczorek, P. H. Marchetti, andM. Duarte. Age-related changes in human postural controlof prolonged standing. Gait Posture 22:322–330, 2005.
13Gao, J. B., J. Hu, W.-W. Tung, Y. H. Cao, N. Sarshar, andV. P. Roychowdhury. Assessment of long range correlationin time series: how to avoid pitfalls. Phys. Rev. EV73:016117, 2006.
14Goldberger, A. L., L. A. N. Amaral, J. M. Hausdorff, P.Ch. Ivanov, C.-K. Peng, and H. E. Stanley. Fractaldynamics in physiology: alterations with disease and aging.PNAS 99:2466–2472, 2002.
15Hausdorff, J. M. Gait dynamics, fractals and falls: findingmeaning in the stride-to-stride fluctuations of humanwalking. Hum. Mov. Sci. 26:555–589, 2007.
16Hausdorff, J. M., S. L. Mitchell, R. Firtion, C. K. Peng,M. E. Cudkowicz, J. Y. Wei, et al. Altered fractal dynamicsof gait: reduced stride-interval correlations with aging andHuntington’s disease. J. Appl. Physiol. 82:262–269, 1997.
17Hausdorff, J. M., P. L. Purdon, C. K. Peng, Z. Ladin, J. Y.Wei, and A. L. Goldberger. Fractal dynamics of humangait: stability of long-range correlations in stride intervalfluctuations. J. Appl. Physiol. 80(5):1448–1457, 1996.
18Ihlen, E. A. F. Introduction to multifractal detrendedfluctuation analyses in Matlab. Front. Physiol. FractalPhysiol. 3:1–12, 2012.
19Ihlen, E. A. F., and B. Vereijken. Interaction-dominantdynamics in human cognition: beyond 1/fa fluctuations. J.Exp. Psychol. Gen. 139:436–463, 2010.
20Ivanov, P. C., L. A. N. Amaral, A. L. Goldberger, S.Havlin, M. G. Rosenblum, Z. Struzik, and H. Stanley.Multifractality in human heartbeat dynamics. Nature399:461–465, 1999.
21Kantelhardt, J. W., E. Koscielny-Bunde, H. H. A. Rego, S.Havelin, and A. Bunde. Detecting long-range correlationwith detrended fluctuation analysis. Phys. A 295:441–454,2001.
22Kelso, J. A. S. Dynamic Patterns: The Self-Organization ofBrain and Behavior. Cambridge, MA: MIT Press, 1995.
23King, D. L., and V. M. Zatsiorsky. Extracting gravity linedisplacement from stabilographic recordings. Gait Posture6:27–38, 1997.
24Morales, C., and E. Kolaczyk. Wavelet-based multifractalanalysis of human balance. Annu. Rev. Biomed. Eng.30:588–597, 2002.
25Muzy, J. F., and E. Bacry. Multifractal stationaryrandom measures and multifractal random walks with log-infinitely divisible scaling laws. Phys. Rev. E 66:056121,2002.
26Peng, C. K., S. Havelin, H. E. Stanley, and A. L. Gold-berger. Quantification of scaling exponents and crossoverphenomena in nonstationary time series. Chaos 5:82–89,1995.
27Scafetta, N., L. Griffin, and B. J. West. Holder exponentspectra for human gait. Phys. A 328:561–583, 2003.
28Schreiber, T., and A. Schmitz. Improved surrogate data fornonlinearity tests. Phys. Rev. Lett. 77:635–638, 1996.
29Shimizu, Y., and S. Thurner. Multifractal spectra as ameasure of complexity in human posture. Fractals 10:103–116, 2001.
30Struzik, Z. R. Determining local singularity strengths andtheir spectra with the wavelet transform. Fractals 8:163–179, 2000.
31Suckling, J., A. M. Wink, F. A. Bernard, A. Barnes, and E.Bullmore. Endogenous multifractal brain dynamics aremodulated by age, cholinergic blockade and cognitiveperformance. J. Neurosci. Methods 174:292–300, 2008.
32Torre, K., D. Delignieres, and L. Lemoine. 1/fb fluctuationsin bimanual coordination: an additional challenge formodeling. Exp. Brain Res. 183:225–234, 2007.
33Turiel, A., C. J. Perez-Vicente, and J. Grazzini. Numericalmethods for the estimation of multifractal singularityspectra on sampled data: a comparative study. J. Comput.Phys. 216:362–390, 2006.
34Vereijken, B. The complexity of childhood development:variability in perspective. Phys. Ther. 90:1850–1859,2010.
35Wang, G., H. Huang, H. Xie, Z. Wang, and X. Hu. Mul-tifractal analysis of ventricular fibrillation and ventriculartachycardia. Med. Eng. Phys. 29:375–379, 2007.
Multiplicative Interactions 1645
Related Documents