Identifying management objectives hierarchies and weightings for four key fisheries in South Eastern Australia Sarah Jennings, Sean Pascoe, Ana Norman-Lopez, Bastien Le Bouhellec, Sophie Hall- Aspland, Andrew Sullivan and Gretta Pecl FRDC Project No 2009/073

Welcome message from author
This document is posted to help you gain knowledge. Please leave a comment to let me know what you think about it! Share it to your friends and learn new things together.
Transcript
Identifying management objectives hierarchies and weightings for
four key fisheries in South Eastern Australia
Sarah Jennings, Sean Pascoe, Ana Norman-Lopez, Bastien Le Bouhellec, Sophie Hall-
Aspland, Andrew Sullivan and Gretta Pecl
FRDC Project No 2009/073
Page 2
Copyright Fisheries Research and Development Corporation and the University of Tasmania
2013.
This work is copyright. Except as permitted under the Copyright Act 1968 (Cth), no part of
this publication may be reproduced by any process, electronic or otherwise, without the
specific written permission of the copyright owners. Information may not be stored
electronically in any form whatsoever without such permission.
Disclaimer
The authors do not warrant that the information in this document is free from errors or
omissions. The authors do not accept any form of liability, be it contractual, tortious, or
otherwise, for the contents of this document or for any consequences arising from its use or
any reliance placed upon it. The information, opinions and advice contained in this document
may not relate, or be relevant, to a readers particular circumstances. Opinions expressed by
the authors are the individual opinions expressed by those persons and are not necessarily
those of the publisher, research provider or the FRDC.
The Fisheries Research and Development Corporation plans, invests in and manages fisheries
research and development throughout Australia. It is a statutory authority within the portfolio
of the federal Minister for Agriculture, Fisheries and Forestry, jointly funded by the
Australian Government and the fishing industry.
Statement of contributions
PRINCIPAL INVESTIGATOR: Dr Sarah Jennings,
ADDRESS: School of Economics and Finance
Private Bag 85 Hobart, TAS 7001
Phone: 03 62262828 Fax: 03 62267587
University of Tasmania
Dr Sarah Jennings led the project and contributed to all stages of the work. Bastien Le
Bouhellec contributed to the development of the survey instrument, data analysis and report
writing. Dr Sophie Hall-Aspland contributed to general project management, workshop
facilitation, report writing and data analysis. Dr Gretta Pecl provided a link between this
project and the Preparing fisheries for climate change: identifying adaptation options for
four key fisheries in South Eastern Australia project thereby facilitating access to species
level Industry and Management Committees, Scientific Working Groups and case study
leaders.
CSIRO Marine and Atmospheric Research (CMAR)
Dr Ana Norman-Lopez contributed to report writing, workshop facilitation, development of
the survey instrument and data analysis. Dr Sean Pascoe provided overall expert guidance
with respect to the implementation of the methodology, survey design and data analysis. He
also contributed to workshop facilitation, data analysis and report writing.
Andrew Sullivan (Fish Focus Consulting) assisted with the administration of the survey and
final report preparation.
This Project was funded through the El Nemo by the Victorian Department of Primary Industries, Primary Industries Industry and Investment New South Wales, Tasmanian Department of Primary Industries, Parks, Water Environment, Australian Fisheries Management Authority, Fisheries Research and Development Corporation, CSIRO, South Australiaand Fisheries Institute, Commonwealth Department of Agriculture, Fisheries and Forestry and is also supported through funding from the Australian Government’s Climate Change Research Program
his Project was funded through the El Nemo – South Eastern Australia Program. This Program is supported by the Victorian Department of Primary Industries, Primary Industries and Resources South Australia,
Investment New South Wales, Tasmanian Department of Primary Industries, Parks, Water Environment, Australian Fisheries Management Authority, Fisheries Research and Development Corporation, CSIRO, South Australia Research and Development Institute and the Tasmanian Aquaculture
Fisheries Institute, Commonwealth Department of Agriculture, Fisheries and Forestry and is also supported through funding from the Australian Government’s Climate Change Research Program
Page 3
This Program is supported Resources South Australia,
Investment New South Wales, Tasmanian Department of Primary Industries, Parks, Water and Environment, Australian Fisheries Management Authority, Fisheries Research and Development
Research and Development Institute and the Tasmanian Aquaculture Fisheries Institute, Commonwealth Department of Agriculture, Fisheries and Forestry and is also
supported through funding from the Australian Government’s Climate Change Research Program.

Page 4
Contents
Non Technical Summary proforma ........................................................................................... 5
Acknowledgments ................................................................................................................... 9
Background .......................................................................................................................... 10
Need ..................................................................................................................................... 11
Objectives ............................................................................................................................. 11
Introduction.......................................................................................................................... 12
Methods ................................................................................................................................ 14
Development of objective hierarchy ................................................................................ 14
Weighting of management objectives .............................................................................. 15
Group Coherence ............................................................................................................. 18
Results .................................................................................................................................. 19
Objective Hierarchy for SEAP Adaptation Case Study Fisheries ................................... 19
Discussion ............................................................................................................................ 28
Planned outcomes and benefits ............................................................................................ 30
Further development ............................................................................................................ 31
References ............................................................................................................................ 32
Appendix 1: Intellectual Property ........................................................................................ 35
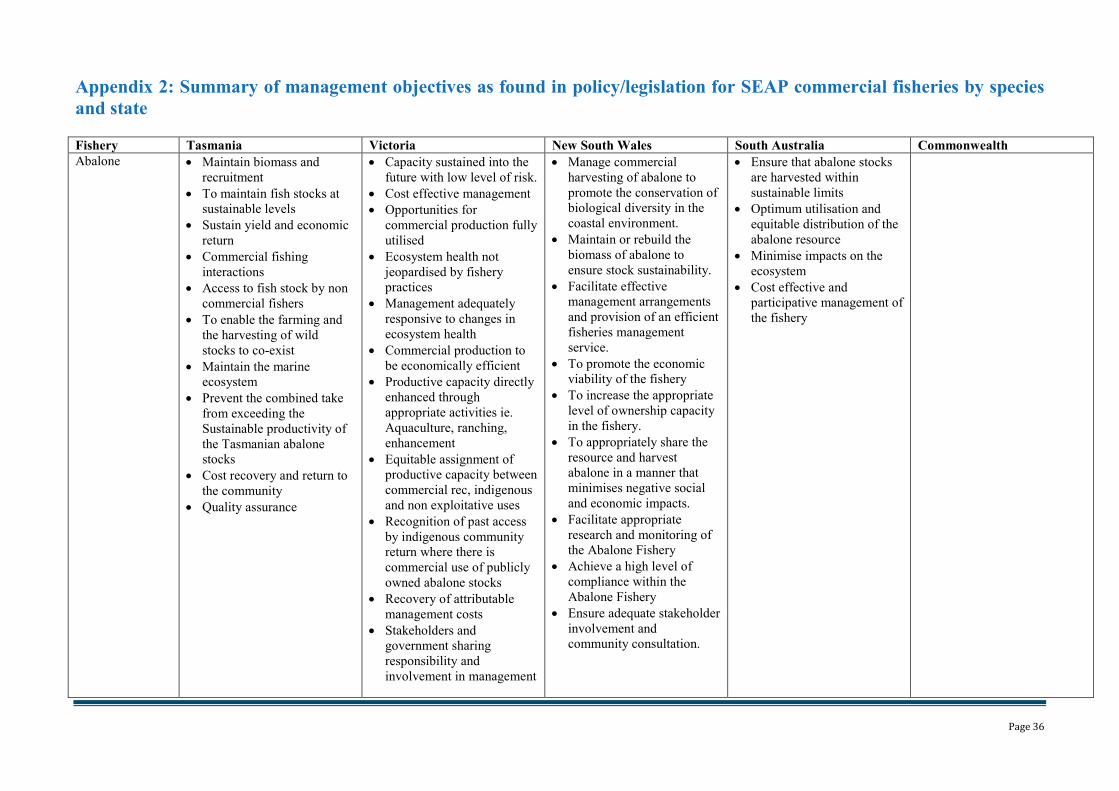
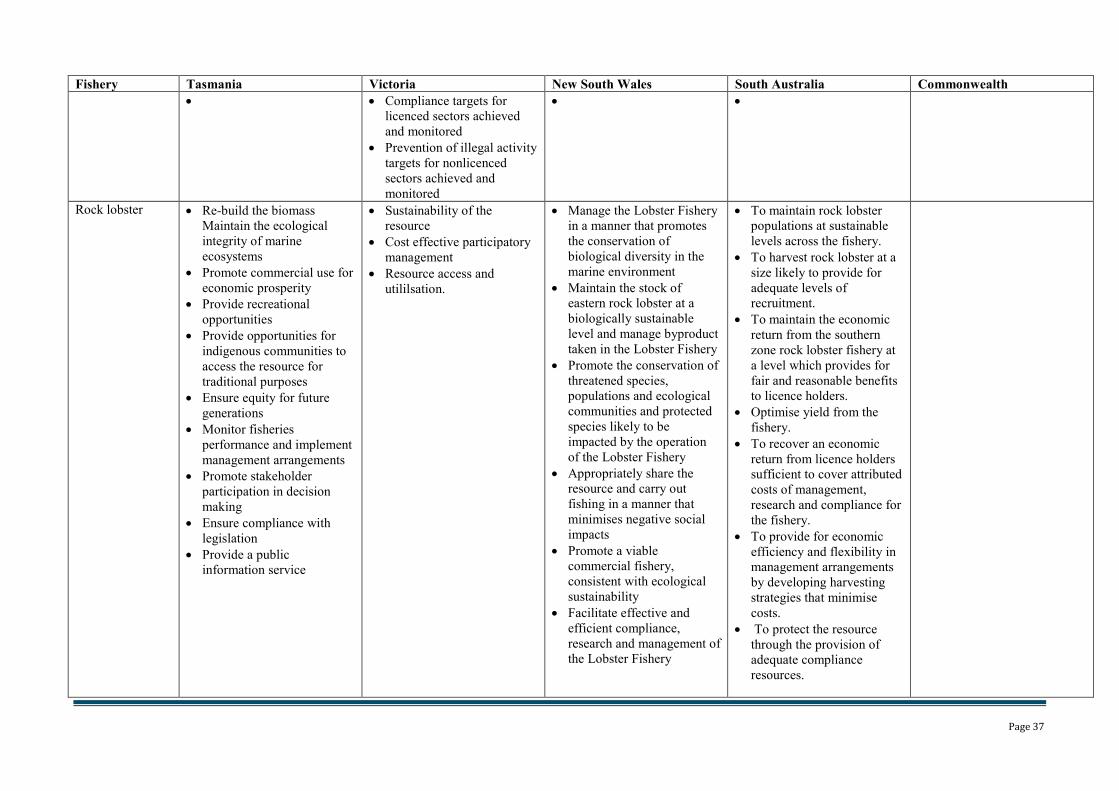
Appendix 2: Summary of management objectives as found in policy/legislation for SEAP
commercial fisheries by species and state ........................................................................... 36
Appendix 3: Management objectives list ............................................................................. 42
Appendix 5: Definition of Objectives ................................................................................... 45

Page 5
NON TECHNICAL SUMMARY
2009/073 Identifying management objectives hierarchies and weightings for four
key fisheries in South Eastern Australia
PRINCIPAL INVESTIGATOR: Dr S. Jennings
ADDRESS: University of Tasmania
School of Economics and Finance
Private Bag 85
Hobart TAS 7001
Telephone: 03 6226 2828 Fax: 03 6226 6655
OBJECTIVES:
To provide a clear articulation of management objectives in each of four South Eastern
Australian fisheries (abalone, blue grenadier, snapper and southern rock lobster) for use in
evaluating alternative management arrangements, by
a. developing a management objective hierarchy and
b. eliciting a set of management objective weights for each fishery.
Non Technical Summary:
Changes to fisheries management and governance arrangements will form an important part
of climate change adaptation responses in the South East Australian region and will impact
on various aspects of fishery systems and on their associated values. The ability to
comprehensively evaluate management changes requires clear definition of a framework of
objectives and of the relative importance of these often competing objectives. This
framework is often missing from climate change adaptation evaluation, and adaptation
priorities and plans are often developed without reference to either adaptation goals or to the
general aims of fisheries management.
The aim of this project was to develop a transparent and clearly articulated framework of
weighted objectives, against which the performance of selected management adaptations can
be assessed as part of DCC/FRDC Project 2011/039 Preparing fisheries for climate change:
identifying adaptation options for four key fisheries in South Eastern Australia. The method
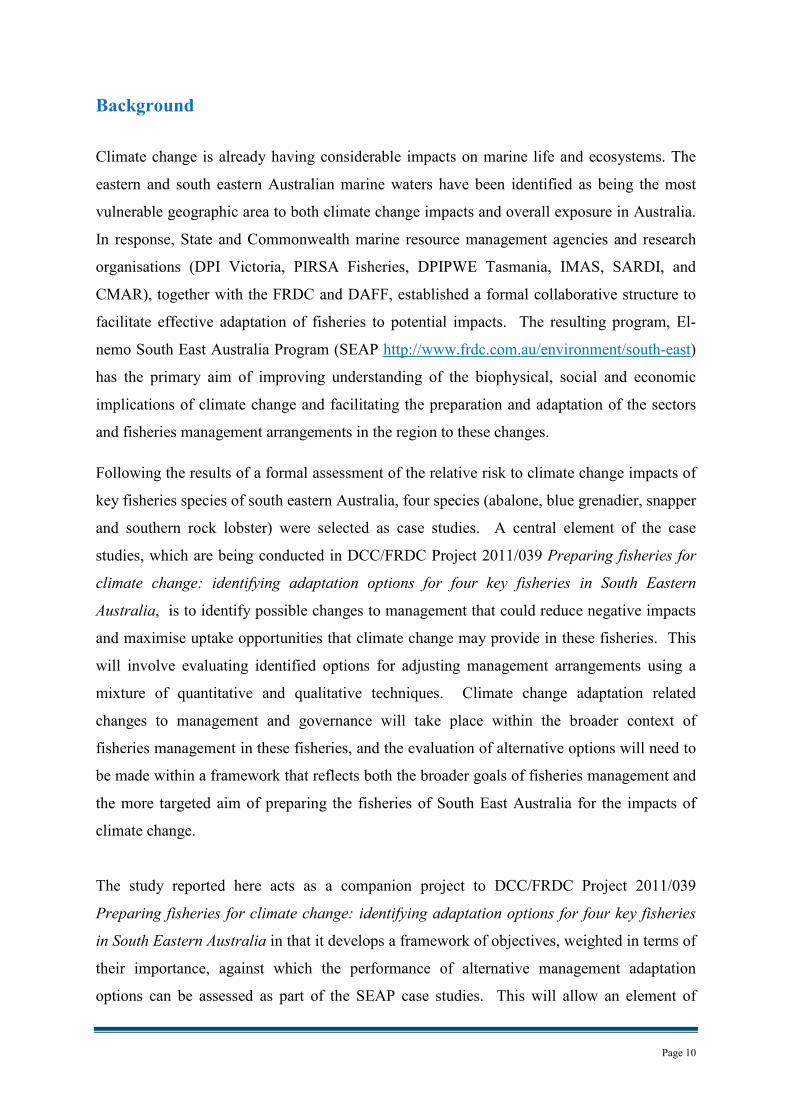
used was the Analytical Hierarchy Process (AHP) and comprised two stages. The first stage
involved developing an overarching, generalised hierarchy of objectives (Figure 1).
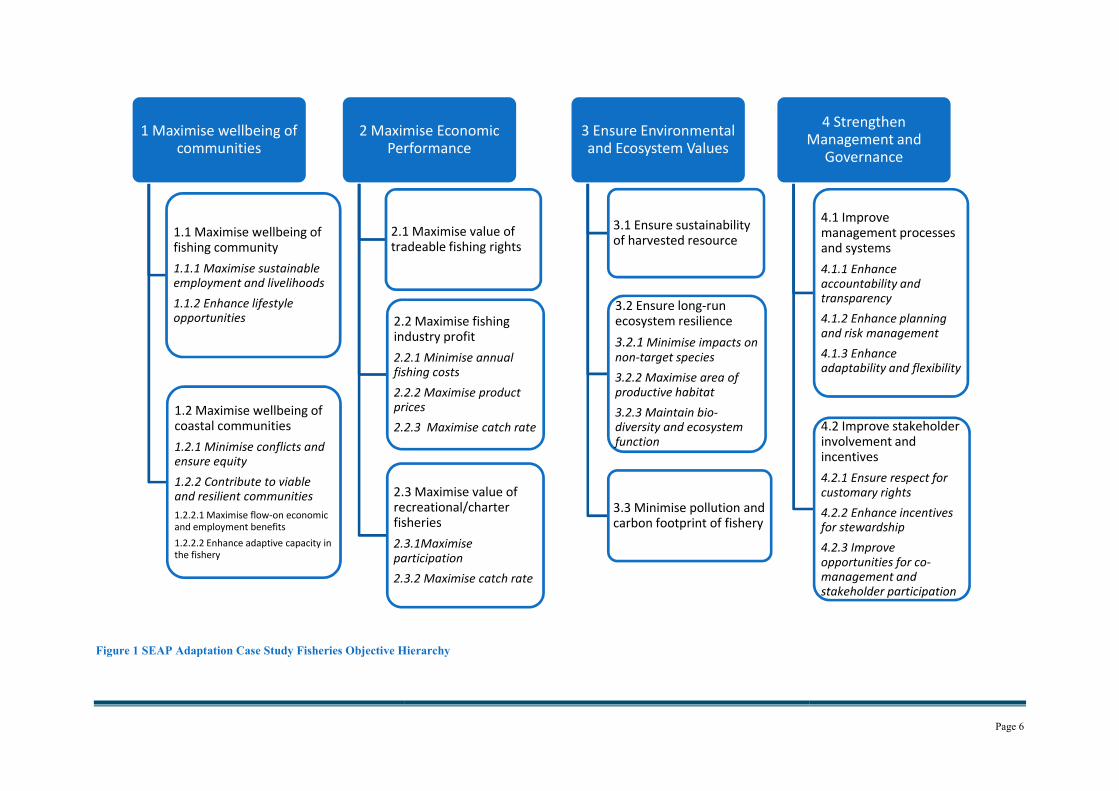
Figure 1 SEAP Adaptation Case Study Fisheries Objective Hierarchy
1 Maximise wellbeing of communities
1.1 Maximise wellbeing of fishing community
1.1.1 Maximise sustainable
employment and livelihoods
1.1.2 Enhance lifestyle
opportunities
1.2 Maximise wellbeing of coastal communities
1.2.1 Minimise conflicts and
ensure equity
1.2.2 Contribute to viable
and resilient communities
1.2.2.1 Maximise flow-on economic and employment benefits
1.2.2.2 Enhance adaptive capacity in the fishery
2 Maximise Economic Performance
2.1 Maximise value of tradeable fishing rights
2.2 Maximise fishing industry profit
2.2.1 Minimise annual
fishing costs
2.2.2 Maximise product
prices
2.2.3 Maximise catch rate
2.3 Maximise value of recreational/charter fisheries
2.3.1Maximise
participation
2.3.2 Maximise catch rate
SEAP Adaptation Case Study Fisheries Objective Hierarchy
2 Maximise Economic Performance
2.1 Maximise value of tradeable fishing rights
2.2 Maximise fishing industry profit
2.2.1 Minimise annual
fishing costs
2.2.2 Maximise product
prices
2.2.3 Maximise catch rate
2.3 Maximise value of recreational/charter fisheries
2.3.1Maximise
participation
2.3.2 Maximise catch rate
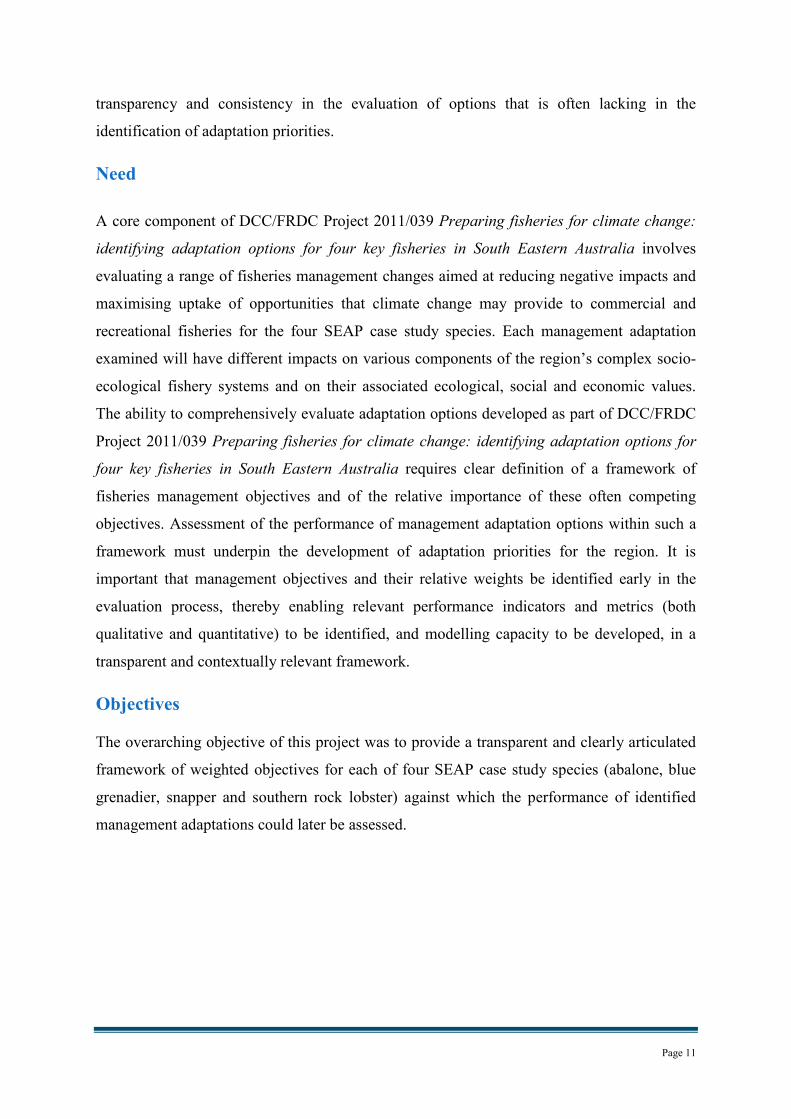
3 Ensure Environmental and Ecosystem Values
3.1 Ensure sustainability of harvested resource
3.2 Ensure long-run ecosystem resilience
3.2.1 Minimise impacts on
non-target species
3.2.2 Maximise area of
productive habitat
3.2.3 Maintain bio-
diversity and ecosystem
function
3.3 Minimise pollution and carbon footprint of fishery
Management and
Page 6
4 Strengthen Management and
Governance
4.1 Improve management processes and systems
4.1.1 Enhance
accountability and
transparency
4.1.2 Enhance planning
and risk management
4.1.3 Enhance
adaptability and flexibility
4.2 Improve stakeholder involvement and incentives
4.2.1 Ensure respect for
customary rights
4.2.2 Enhance incentives
for stewardship
4.2.3 Improve
opportunities for co-
management and
stakeholder participation
Page 7
The hierarchy developed comprised four general, or high-level, objectives, three of which
mapped broadly to the triple bottom-line objectives of environmental, economic and social
performance. The hierarchy also included the objective of strengthening management and
governance as a high-level objective as a way of capturing the importance of these aspects of
fisheries systems to effectively respond to pressures arising from climate change and other
stressors. Lower level objectives reflected more detailed or specific objectives related to each
of the general objectives.
In the second stage, an interactive, Excel-based AHP survey was designed to measure
individual preferences across the range of high and lower-level objectives detailed above.
The AHP survey required respondents to make a series of pair-wise objective importance
comparisons and provided a relatively simple yet powerful means of deriving individual level
objective preference structures or weightings.
A letter of invitation to participate in the survey was sent to 131 individuals, 50 of whom
were members of SEAP Industry and Management Committees and Scientific Working
Groups. A total of 64 useable surveys were returned for the four fisheries and for a group
who had responded generally, or for no particular fishery.
Average weightings attributed to various objectives were quite consistent across the different
fisheries groups, with a very strong preference shown in all fisheries for ensuring that
adaptations sustain environmental and ecological values, particularly through sustaining the
harvested population. This may reflect a general belief that the environmental component of
the ‘triple bottom line’ is a pre-requisite for ensuring sustainable economic and social
outcomes and, in the face of climate change, that adaptations that contribute to this objective
should be given priority. While there was some variation in the average ranking of other high
level objectives there was a high degree of coherency across all respondents when
considering the broad objectives, suggesting that a single high level assessment framework
across the region might be acceptable.
Our results indicated a strong level of agreement about the relative importance of the high
level objectives within each fishery group, but revealed strong differences between
individuals’ preferences about the relative importance of lower level objectives, particularly
in the abalone, blue grenadier and southern rock lobster fisheries. Over all groups, there is
Page 8
stronger agreement about relative weights for lower level objectives in the areas of
community wellbeing and management and governance, with less agreement on detailed
objectives for environmental and economic objectives.
OUTCOMES ACHIEVED TO DATE
• This project provides weighted fisheries management objectives frameworks for each
of four key fisheries species in South Eastern Australia (abalone, blue grenadier,
snapper and southern rock lobster) and for a general fishery group.
• Providing these frameworks will enable selected management adaptation options
identified in DCC/FRDC Project 2011/039 Preparing fisheries for climate change:
identifying adaptation options for four key fisheries in South Eastern Australia, and in
other studies, to be assessed consistently and transparently against weighted
objectives, averaged across individuals involved in each fishery.
• The frameworks will also assist in the identification of areas of potential conflict that
might act as barriers to adoption of management changes across diverse fisheries.
• The exercise of developing objective hierarchies and of participating in the objective
weighting survey has also served as a capacity building process as individuals
involved are forced to consider the trade-offs between often competing
environmental, social and economic objectives as is required in fisheries management.
KEYWORDS: fisheries management objectives, analytic hierarchy process, climate change
adaptation, South Eastern Australian Program
Page 9
Acknowledgments
Our thanks to the many members of the industry and management committees, scientific
groups and case study leaders for the four SEAP fisheries who participated in the workshop
discussion of species level objectives. Thanks also to everyone who gave willingly of their
time to complete the interactive, online objectives weighting survey.
Special thanks to Eriko Hoshino who assisted in the facilitation of the workshop discussions.
This project was undertaken under the guidance of the El-nemo SEAP Project Management
Committee. Particular thanks to Dallas D’Silva for coordinating and overseeing the direction
of the program.
Page 10
Background
Climate change is already having considerable impacts on marine life and ecosystems. The
eastern and south eastern Australian marine waters have been identified as being the most
vulnerable geographic area to both climate change impacts and overall exposure in Australia.
In response, State and Commonwealth marine resource management agencies and research
organisations (DPI Victoria, PIRSA Fisheries, DPIPWE Tasmania, IMAS, SARDI, and
CMAR), together with the FRDC and DAFF, established a formal collaborative structure to
facilitate effective adaptation of fisheries to potential impacts. The resulting program, El-
nemo South East Australia Program (SEAP http://www.frdc.com.au/environment/south-east)
has the primary aim of improving understanding of the biophysical, social and economic
implications of climate change and facilitating the preparation and adaptation of the sectors
and fisheries management arrangements in the region to these changes.
Following the results of a formal assessment of the relative risk to climate change impacts of
key fisheries species of south eastern Australia, four species (abalone, blue grenadier, snapper
and southern rock lobster) were selected as case studies. A central element of the case
studies, which are being conducted in DCC/FRDC Project 2011/039 Preparing fisheries for
climate change: identifying adaptation options for four key fisheries in South Eastern
Australia, is to identify possible changes to management that could reduce negative impacts
and maximise uptake opportunities that climate change may provide in these fisheries. This
will involve evaluating identified options for adjusting management arrangements using a
mixture of quantitative and qualitative techniques. Climate change adaptation related
changes to management and governance will take place within the broader context of
fisheries management in these fisheries, and the evaluation of alternative options will need to
be made within a framework that reflects both the broader goals of fisheries management and
the more targeted aim of preparing the fisheries of South East Australia for the impacts of
climate change.
The study reported here acts as a companion project to DCC/FRDC Project 2011/039
Preparing fisheries for climate change: identifying adaptation options for four key fisheries
in South Eastern Australia in that it develops a framework of objectives, weighted in terms of
their importance, against which the performance of alternative management adaptation
options can be assessed as part of the SEAP case studies. This will allow an element of
Page 11
transparency and consistency in the evaluation of options that is often lacking in the
identification of adaptation priorities.
Need
A core component of DCC/FRDC Project 2011/039 Preparing fisheries for climate change:
identifying adaptation options for four key fisheries in South Eastern Australia involves
evaluating a range of fisheries management changes aimed at reducing negative impacts and
maximising uptake of opportunities that climate change may provide to commercial and
recreational fisheries for the four SEAP case study species. Each management adaptation
examined will have different impacts on various components of the region’s complex socio-
ecological fishery systems and on their associated ecological, social and economic values.
The ability to comprehensively evaluate adaptation options developed as part of DCC/FRDC
Project 2011/039 Preparing fisheries for climate change: identifying adaptation options for
four key fisheries in South Eastern Australia requires clear definition of a framework of
fisheries management objectives and of the relative importance of these often competing
objectives. Assessment of the performance of management adaptation options within such a
framework must underpin the development of adaptation priorities for the region. It is
important that management objectives and their relative weights be identified early in the
evaluation process, thereby enabling relevant performance indicators and metrics (both
qualitative and quantitative) to be identified, and modelling capacity to be developed, in a
transparent and contextually relevant framework.
Objectives
The overarching objective of this project was to provide a transparent and clearly articulated
framework of weighted objectives for each of four SEAP case study species (abalone, blue
grenadier, snapper and southern rock lobster) against which the performance of identified
management adaptations could later be assessed.
Page 12
Introduction
Climate change has emerged as a major threat to the ecological, biophysical and human
components of fisheries systems worldwide. This is particularly evident in South Eastern
Australia where climate drivers, such as temperature, ocean currents and wind patterns, are
all contributing to changes in the productivity, distribution and life cycle events of marine
species. The marine environment in the South Eastern Australian region underpins a wide
range of ecological, economic and social values, and supports important commercial and
recreational fisheries. The threats and opportunities posed by climate change to these
activities and to their associated values necessitate the development of clear adaptation
pathways to prepare governments and industry for the changes ahead.
The commercial and recreational fisheries of South Eastern Australia are managed by State
and Commonwealth governments, and are subject to a wide range of governance and
management arrangements. These include a variety of controls on inputs (such as season and
gear restrictions), outputs (such as catch limits and quota management systems) and spatial
management arrangements. Ensuring that the fisheries of South Eastern Australia adapt
effectively to climate change will require changes to existing management systems to ensure
that fishers and managers can respond to mitigate negative, and seize positive, opportunities.
While some changes to existing management and governance systems may involve the
adoption of already proven management arrangements, others may require more
transformational change to accommodate climate change impacts and allow for greater
flexibility in fisher behaviour. Regardless of the nature of change proposed, however, sound
management adaptation planning requires that the performance of adaptation options be
evaluated against the broad objectives of fisheries management.
Pascoe et al. (2009a) describe a staged approach in which a set of alternative management
strategies can be assessed against a set of management objectives. The approach involves
firstly eliciting a set of management objectives and their relative weightings. The next step is
to develop possible changes to the management system and to assess the relative impact of
each of these against each management objective. The final step involves applying the
objective weights to determine which of the proposed alternatives best meets the objectives.
Two important strengths of this approach lie in the high level of stakeholder engagement
involved and the ability to combine the results of quantitative modelling (such as stock
assessment and bioeconomic modelling) with qualitative assessments based on the opinions
Page 13
of experts within a transparent multiple objective framework. This approach is subsequently
illustrated in Dichmont et al. (2012) where a series of governance straw men (or management
strategies) for the Queensland trawl fishery were assessed by a group of experts against an
agreed set of weighted objectives. Innes and Pascoe (2010) also illustrate this approach
where the relative importance of the environmental impact of fishing using different gears
was quantified by different stakeholder groups (ecologists, biologists, economists, gear
technologists, fishers and fisheries managers) through a qualitative, multi-criteria survey
process.
In this project we conduct the first stage of the process described by Pascoe (2009a). More
particularly, we elicit a set of objectives and their relative importance weights for each of four
key commercial species in south eastern Australia for which the subsequent stages of the
assessment process will be conducted for selected climate change related management
adaptation options.
A strong common theme in fisheries management policy and legislation across many
countries is concern with the triple bottom line of economic, social and environmental
objectives (Pascoe et al. 2012). Nevertheless, the definition of these high-level objectives is
often unclear and the way in which sometimes conflicting objectives are to be weighted
remains undefined. In this project we use the Analytic Hierarchy Process (AHP) to develop
weighted objective hierarchies for each of the four SEAP fisheries. This method has found a
number of applications in the management and planning of fisheries and aquaculture
(DiNardo, Levy and Golden 1989; Leung, Muraoka, Nakamoto and Pooley 1998; Mardle and
Pascoe 1999; Mardle et al. 2002, Mardle and Pascoe 2003; Soma 2003; Mardle, Pascoe and
Herrero 2004; Nielsen and Mathiesen 2006; Whitmarsh and Wattage 2006; Himes 2007;
Lane 2007; Utne 2008; Halide, Stigebrandt, Rehbein and McKinnon 2009; Pascoe,
Bustamante, Wilcox and Gibbs 2009; Pascoe, Proctor, Wilcox, Innes, Rochester and Dowling
2009; Whitmarsh and Palmieri 2009, Dichmont et al. 2012, Pascoe et al. 2012). In addition it
has been used to assess recreational site choice (Kangas 1995; Ramos, Santos, Whitmarsh
and Monteiro 2006) and fish product quality (Setala, Saarni and Honkanen 2000; Saarni,
Setala and Honkanen 2001).
We provide a specific climate change adaptation context to the objective hierarchies
developed in this project through the inclusion of a number of objectives shown to have been
important to effective climate change adaptation. We also include the objective of
Page 14
strengthening management and governance as a high level objective as a way of capturing the
importance of these aspects of fisheries systems to effectively respond to pressures arising
from climate change and other stressors.
Methods
The method used in this study comprises two stages. The first stage involves development of
a generalised, overarching objective hierarchy; the second stage uses the Analytic Hierarchy
process (AHP) to derive the set of individual objective weights specific to each of the four
SEAP fisheries.
Development of objective hierarchy
The objective hierarchy developed was informed by the following:
• A comprehensive literature review of natural resource management objectives as
conducted by Pascoe et al. (2012).
• A review of management objectives as stated in a range of management and policy
documents for each of the four SEAP species by jurisdiction (Appendix 2).
• Consideration of fisheries management objectives already identified at the
Commonwealth (Pascoe et al. 2009b) and Queensland State (Pascoe et al. 2012)
levels.
• Draft species-level objective hierarchies developed by Industry and Management
Committees at the SEAP Fisheries Adaptation Workshop March 15/16th
2012.
Workshop participants were initially presented in a plenary session with a ‘strawman’
hierarchy (based on hierarchies developed in comparable studies of other Australian
fisheries) and had the aims of the project and workshop exercise explained to them.
Project team members then led breakout sessions with each SEAP species
Management and Industry Committee, during which draft species specific hierarchies
were developed. A compilation of all objectives from all four groups is given in
Appendix 3.
Page 15
• A consideration of the need to include objectives that may be linked to supporting
effective climate change adaptation and to building adaptive capacity and enhance
resilience in fisheries.
Weighting of management objectives
The Analytic Hierarchy Process (AHP) is a method that allows individual preferences to be
measured and converted into ratio-scale weights (Forman and Gass 2001). It is one of several
multi-criteria decision making techniques (MCDM) available and provides a relatively simple
yet powerful means of deriving individuals’ preferences for one attribute over another (pair-
wise comparison of options). AHP has been widely used in fisheries where studies have
largely determined the relative importance of different management objectives (e.g. (Mardle
et al. 2004; Nielsen and Mathiesen 2006)) or preferences for different management options
(e.g. Leung et al. 1998; Soma 2003). It has been used to compare the sustainability of
alternative fishing fleets (Utne 2008) and to quantify the relative importance of the
environmental impacts of demersal gears to different stakeholder groups (Innes and Pascoe,
2010). In their study, Innes and Pascoe analyse the responses of 48 individuals representing 6
different stakeholder groups (biologists, ecologists, economists, gear technologists, fishers,
and fisheries managers).
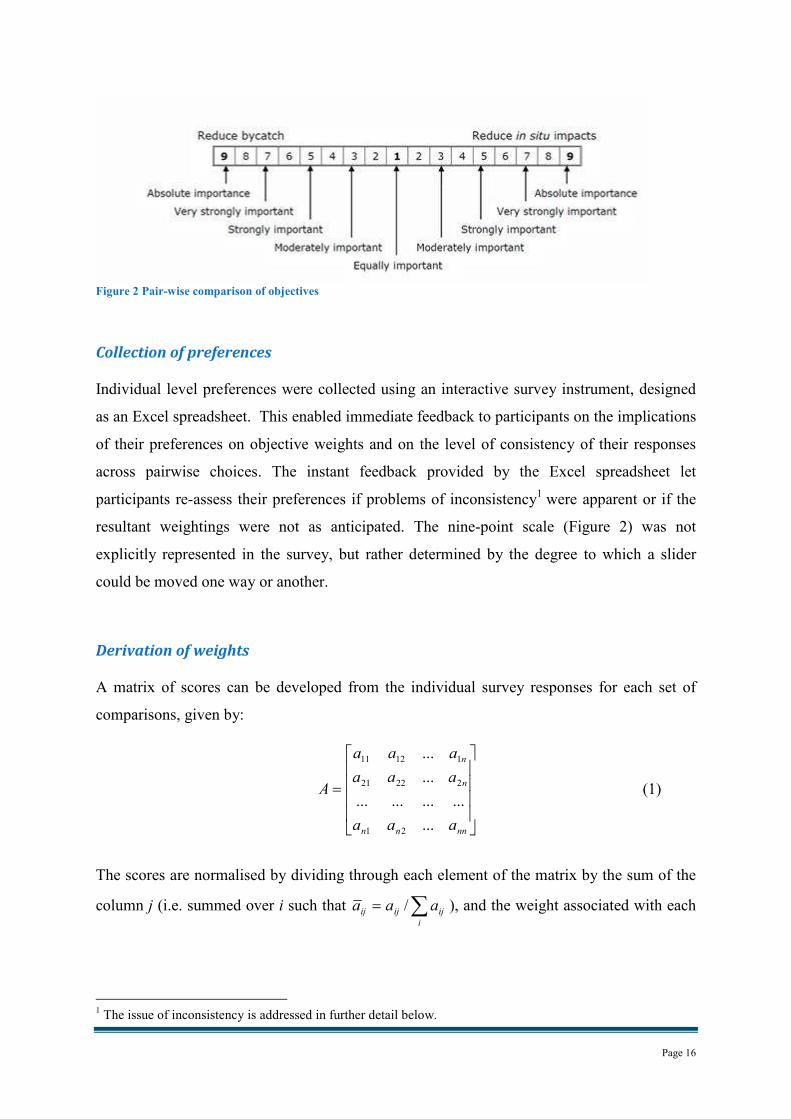
One of the advantages of the pairwise comparison used in AHP is that it makes the process of
assigning weights much easier for participants. This is because only two elements or
objectives are being compared at any one time rather than all objectives having to be
compared with each other simultaneously. The following figure represents one of the
pairwise comparison questions in Innes and Pascoe’s (Innes and Pascoe 2010) questionnaire.
Their questionnaire used the most common (and generally recommended) means of eliciting
preference structures for AHP studies by using a nine-point “Intensity of Importance” scale.
The scale is based on psychological experiments and is designed to allow for, as closely as
possible, a reflection of a person’s true feelings in making comparisons between two items
whilst minimising any confusions or difficulties involved (Saaty, 1980b).
Page 16
Figure 2 Pair-wise comparison of objectives
Collection of preferences
Individual level preferences were collected using an interactive survey instrument, designed
as an Excel spreadsheet. This enabled immediate feedback to participants on the implications
of their preferences on objective weights and on the level of consistency of their responses
across pairwise choices. The instant feedback provided by the Excel spreadsheet let
participants re-assess their preferences if problems of inconsistency1 were apparent or if the
resultant weightings were not as anticipated. The nine-point scale (Figure 2) was not
explicitly represented in the survey, but rather determined by the degree to which a slider
could be moved one way or another.
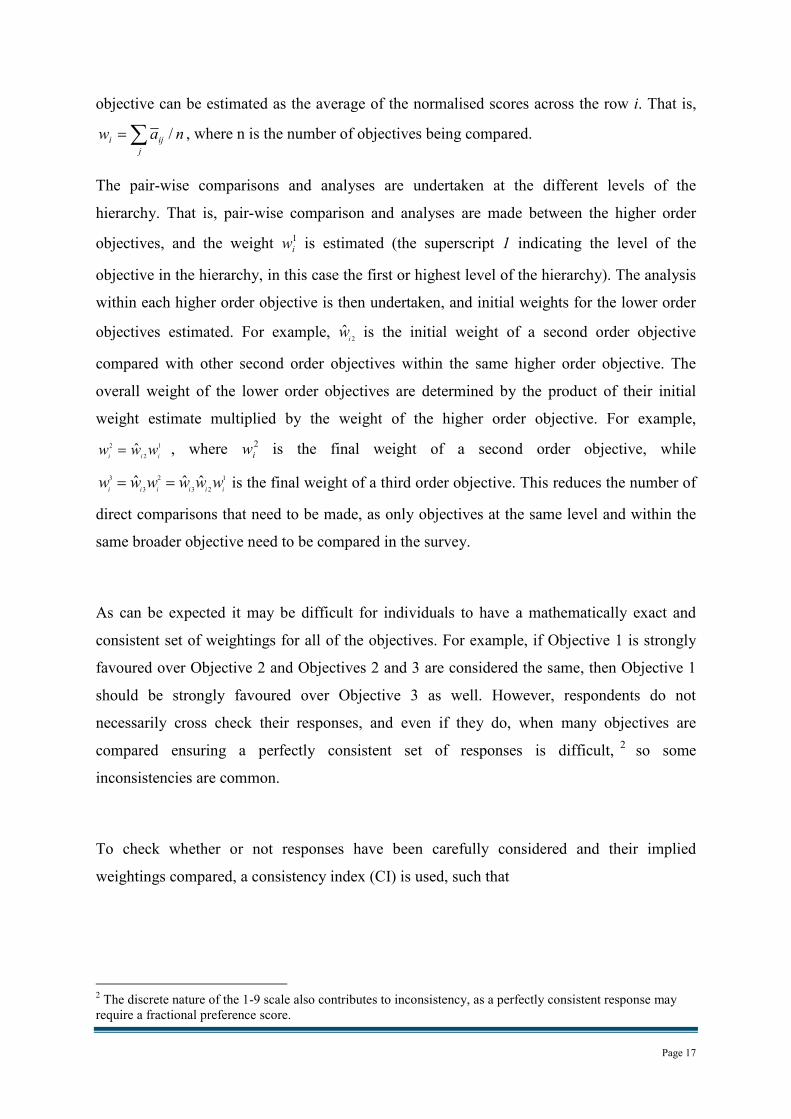
Derivation of weights
A matrix of scores can be developed from the individual survey responses for each set of
comparisons, given by:
=
nnnn
n
n
aaa
aaa
aaa
A
...
............
...
...
21
22221
11211
(1)
The scores are normalised by dividing through each element of the matrix by the sum of the
column j (i.e. summed over i such that ∑=i
ijijij aaa / ), and the weight associated with each
1 The issue of inconsistency is addressed in further detail below.
Page 17
objective can be estimated as the average of the normalised scores across the row i. That is,
nawj
iji /∑= , where n is the number of objectives being compared.
The pair-wise comparisons and analyses are undertaken at the different levels of the
hierarchy. That is, pair-wise comparison and analyses are made between the higher order
objectives, and the weight 1
iw is estimated (the superscript 1 indicating the level of the
objective in the hierarchy, in this case the first or highest level of the hierarchy). The analysis
within each higher order objective is then undertaken, and initial weights for the lower order
objectives estimated. For example, 2
ˆiw is the initial weight of a second order objective
compared with other second order objectives within the same higher order objective. The
overall weight of the lower order objectives are determined by the product of their initial
weight estimate multiplied by the weight of the higher order objective. For example,
2 1
2ˆ
i i iw w w= , where 2
iw is the final weight of a second order objective, while
3 2 1
3 3 2ˆ ˆ ˆ
i i i i i iw w w w w w= = is the final weight of a third order objective. This reduces the number of
direct comparisons that need to be made, as only objectives at the same level and within the
same broader objective need to be compared in the survey.
As can be expected it may be difficult for individuals to have a mathematically exact and
consistent set of weightings for all of the objectives. For example, if Objective 1 is strongly
favoured over Objective 2 and Objectives 2 and 3 are considered the same, then Objective 1
should be strongly favoured over Objective 3 as well. However, respondents do not
necessarily cross check their responses, and even if they do, when many objectives are
compared ensuring a perfectly consistent set of responses is difficult,2
so some
inconsistencies are common.
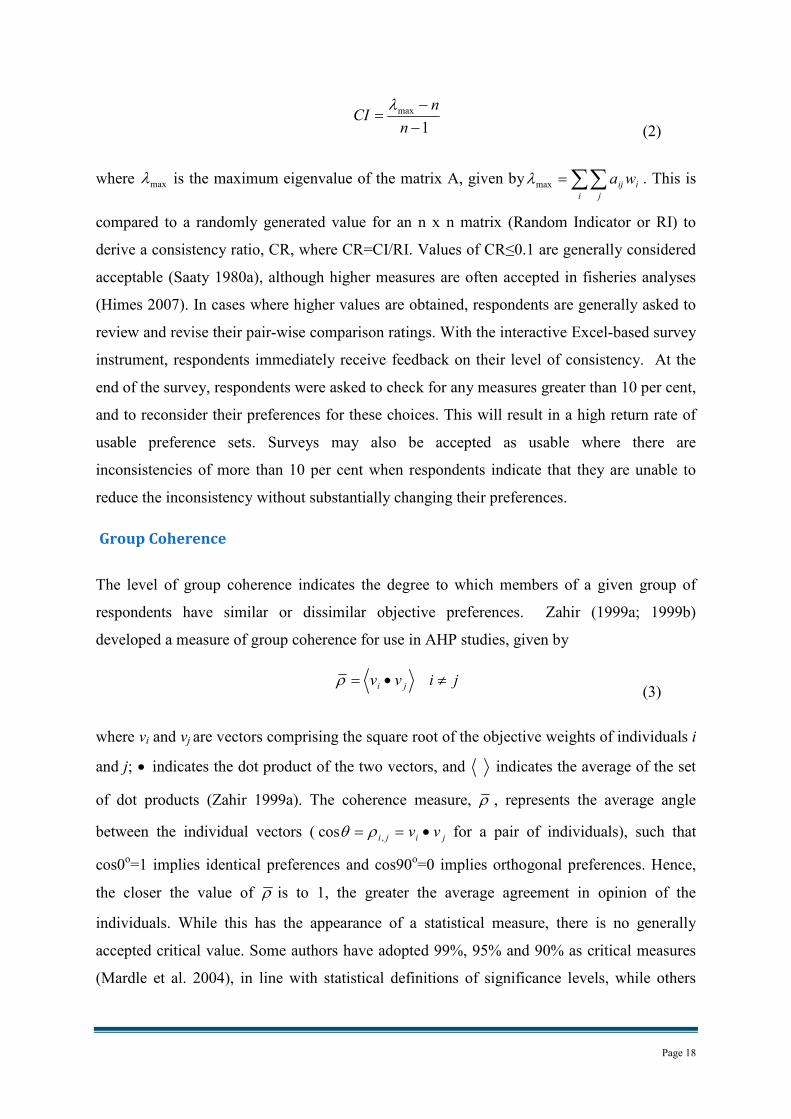
To check whether or not responses have been carefully considered and their implied
weightings compared, a consistency index (CI) is used, such that
2 The discrete nature of the 1-9 scale also contributes to inconsistency, as a perfectly consistent response may
require a fractional preference score.
Page 18
1
max
−
−=
n
nCI
λ
(2)
where maxλ is the maximum eigenvalue of the matrix A, given by ∑∑=i j
iijwamaxλ . This is
compared to a randomly generated value for an n x n matrix (Random Indicator or RI) to
derive a consistency ratio, CR, where CR=CI/RI. Values of CR≤0.1 are generally considered
acceptable (Saaty 1980a), although higher measures are often accepted in fisheries analyses
(Himes 2007). In cases where higher values are obtained, respondents are generally asked to
review and revise their pair-wise comparison ratings. With the interactive Excel-based survey
instrument, respondents immediately receive feedback on their level of consistency. At the
end of the survey, respondents were asked to check for any measures greater than 10 per cent,
and to reconsider their preferences for these choices. This will result in a high return rate of
usable preference sets. Surveys may also be accepted as usable where there are
inconsistencies of more than 10 per cent when respondents indicate that they are unable to
reduce the inconsistency without substantially changing their preferences.
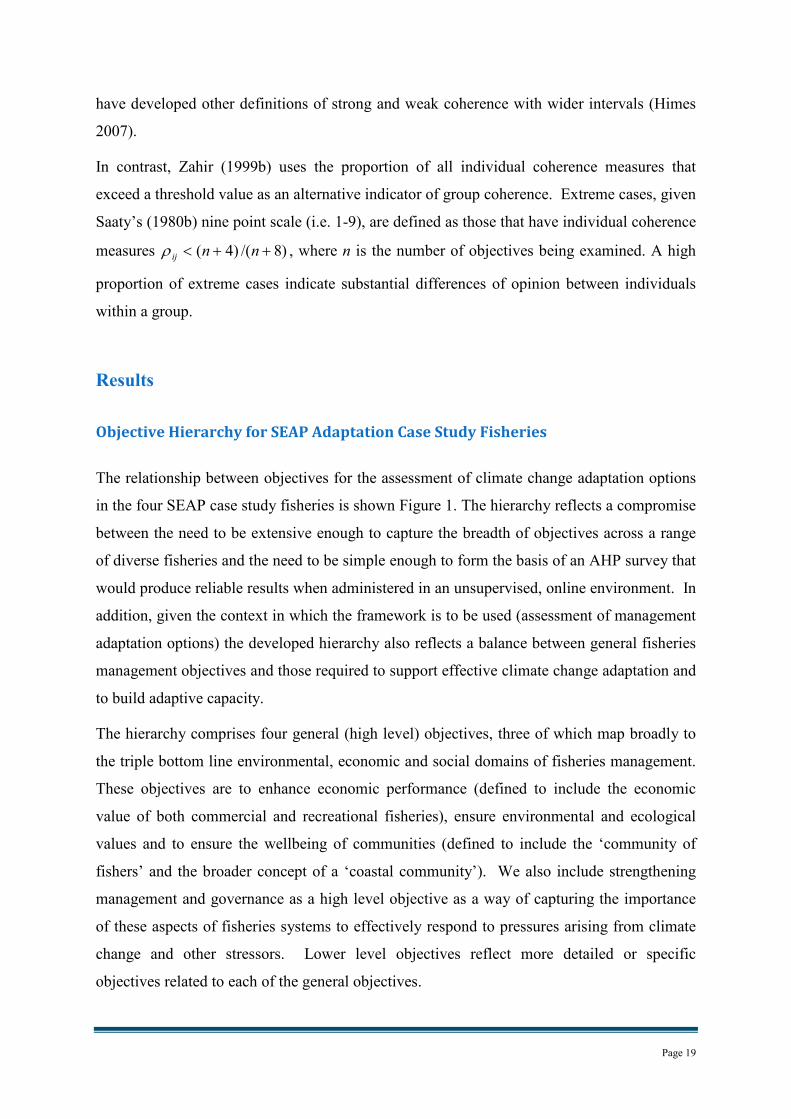
Group Coherence
The level of group coherence indicates the degree to which members of a given group of
respondents have similar or dissimilar objective preferences. Zahir (1999a; 1999b)
developed a measure of group coherence for use in AHP studies, given by
jivv ji ≠•=ρ (3)
where vi and vj are vectors comprising the square root of the objective weights of individuals i
and j; • indicates the dot product of the two vectors, and indicates the average of the set
of dot products (Zahir 1999a). The coherence measure, ρ , represents the average angle
between the individual vectors ( jiji vv •== ,cos ρθ for a pair of individuals), such that
cos0o=1 implies identical preferences and cos90
o=0 implies orthogonal preferences. Hence,
the closer the value of ρ is to 1, the greater the average agreement in opinion of the
individuals. While this has the appearance of a statistical measure, there is no generally
accepted critical value. Some authors have adopted 99%, 95% and 90% as critical measures
(Mardle et al. 2004), in line with statistical definitions of significance levels, while others
Page 19
have developed other definitions of strong and weak coherence with wider intervals (Himes
2007).
In contrast, Zahir (1999b) uses the proportion of all individual coherence measures that
exceed a threshold value as an alternative indicator of group coherence. Extreme cases, given
Saaty’s (1980b) nine point scale (i.e. 1-9), are defined as those that have individual coherence
measures )8/()4( ++< nnijρ , where n is the number of objectives being examined. A high
proportion of extreme cases indicate substantial differences of opinion between individuals
within a group.
Results
Objective Hierarchy for SEAP Adaptation Case Study Fisheries
The relationship between objectives for the assessment of climate change adaptation options
in the four SEAP case study fisheries is shown Figure 1. The hierarchy reflects a compromise
between the need to be extensive enough to capture the breadth of objectives across a range
of diverse fisheries and the need to be simple enough to form the basis of an AHP survey that
would produce reliable results when administered in an unsupervised, online environment. In
addition, given the context in which the framework is to be used (assessment of management
adaptation options) the developed hierarchy also reflects a balance between general fisheries
management objectives and those required to support effective climate change adaptation and
to build adaptive capacity.
The hierarchy comprises four general (high level) objectives, three of which map broadly to
the triple bottom line environmental, economic and social domains of fisheries management.
These objectives are to enhance economic performance (defined to include the economic
value of both commercial and recreational fisheries), ensure environmental and ecological
values and to ensure the wellbeing of communities (defined to include the ‘community of
fishers’ and the broader concept of a ‘coastal community’). We also include strengthening
management and governance as a high level objective as a way of capturing the importance
of these aspects of fisheries systems to effectively respond to pressures arising from climate
change and other stressors. Lower level objectives reflect more detailed or specific
objectives related to each of the general objectives.
Page 20
Importantly, given the generalized nature of the hierarchy, not all objectives are relevant to
all four fisheries. For example, the blue grenadier fishery does not include a significant
recreational component. Similarly, the snapper fishery is not currently subject to a tradable
quota. While the applicability of particular objectives to any one of the four fisheries will be
reflected in the assigned weights, individuals were also given the opportunity within the
survey to indicate any objective that they considered to be irrelevant3.
Survey Sample and Administration
The interactive survey was trialled initially by several individuals who had either general
fisheries experience or were familiar with the AHP method. Several modifications were
made to both the objective hierarchy and the survey instrument based on their feedback. The
final survey was emailed to a total of 50 SEAP species Industry and Management Committee
and Scientific Working Group members, including case study and project leaders, as well as
81 other industry members (recreational and commercial) suggested by the participants at the
SEAP Fisheries Adaptation Workshop (March 15/16th
2012). A letter explaining the purpose
of the survey; including key instructions, a project Information Sheet and the list of objective
definitions were also provided.
In total, 64 usable responses were obtained, with an additional two surveys being unusable
due to the presence of unacceptably high inconsistency scores. The distribution of the
returned surveys by fishery and respondent category is summarised in Table 1. The greatest
number of responses was returned from researchers, representing almost 35% of the total
responses, and reflecting the dominance of researchers in the original contact list (i.e. the
Industry and Management Committee and Scientific Working Groups). Fishers (commercial
and recreational) comprised around 40% of the responses and the remainder were fisheries
managers. A significant proportion (almost 30%) of respondents preferred to respond
generally rather than for a specific fishery. The generalists were quite evenly distributed
among each of the four respondent groups.
3 Three respondents identified one or more objectives as irrelevant to the fishery for which they nominated objective preferences. Since the
minimum weighting attributable to any objective in the survey instrument was X%, these weightings were set to zero, and other objectives in the relevant objective set adjusted accordingly.
Page 21
Several respondents commented positively about the survey, indicating that they had found
the process of considering tradeoffs interesting and indicated an interest in the results. Two
commercial fishers declined to participate citing frustration and disappointment with fisheries
research and management processes, in particular Government decision making in regard to
marine parks. Two respondents queried the reasonableness of particular pairwise choices and
one individual indicated that they had difficulty making tradeoffs between objectives that
they felt they had no direct control over. Two respondents queried the rationale for the
consistency score linking the intensity of preferences across pairwise choices.
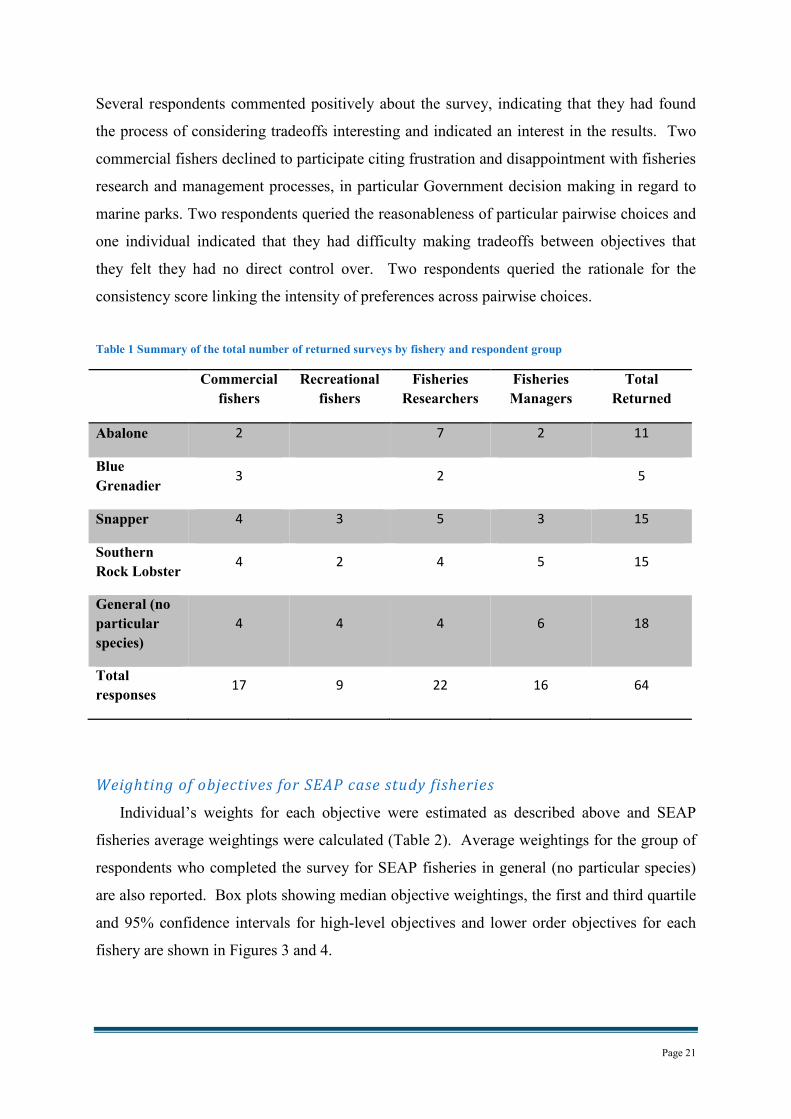
Table 1 Summary of the total number of returned surveys by fishery and respondent group
Commercial
fishers
Recreational
fishers
Fisheries
Researchers
Fisheries
Managers
Total
Returned
Abalone 2 7 2 11
Blue
Grenadier 3 2 5
Snapper 4 3 5 3 15
Southern
Rock Lobster 4 2 4 5 15
General (no
particular
species)
4 4 4 6 18
Total
responses 17 9 22 16 64
Weighting of objectives for SEAP case study fisheries
Individual’s weights for each objective were estimated as described above and SEAP
fisheries average weightings were calculated (Table 2). Average weightings for the group of
respondents who completed the survey for SEAP fisheries in general (no particular species)
are also reported. Box plots showing median objective weightings, the first and third quartile
and 95% confidence intervals for high-level objectives and lower order objectives for each
fishery are shown in Figures 3 and 4.

Page 22
Table 2 Average objective weights and coefficients of variation for SEAP fisheries (expressed as percentages)
Objective Abalone Blue Grenadier Snapper Southern Rock
Lobster
General (no
particular species)
Mean CV Mean CV Mean CV Mean CV Mean CV
Maximise wellbeing of communities
8.8% 69.3% 20.4% 35.3% 14.3% 60.1% 15.4% 102.6% 17.8% 57.3% Maximise sustainable employment and
livelihoods 2.9% 69.0% 4.9% 24.5% 3.5% 51.4% 3.6% 69.4% 4.5% 64.4% Enhance lifestyle opportunities
1.5% 113.3% 3.6% 61.1% 3.0% 93.3% 2.0% 105.0% 3.6% 75.0% Minimise conflicts and ensure equity
2.3% 87.0% 5.8% 69.0% 4.1% 90.2% 3.3% 87.9% 3.9% 92.3% Maximise flow-on economic and employment
benefits 0.9% 88.9% 2.0% 55.0% 1.4% 71.4% 2.8% 228.6% 2.7% 92.6% Enhance adaptive capacity in the fishery
1.3% 69.2% 4.0% 70.0% 2.3% 108.7% 3.5% 185.7% 3.1% 71.0%
Maximise Economic Performance
24.5% 50.6% 28.1% 79.0% 23.4% 76.1% 22.9% 51.5% 19.8% 73.7% Maximise value of tradeable fishing rights
10.9% 72.5% 10.1% 98.0% 5.5% 85.5% 8.2% 54.9% 7.9% 143.0% Minimise annual fishing costs in fishing industry
3.7% 73.0% 5.9% 94.9% 2.9% 120.7% 3.3% 97.0% 1.5% 73.3% Maximise product prices in fishing industry
4.0% 70.0% 5.2% 94.2% 4.3% 160.5% 3.0% 146.7% 2.6% 88.5% Maximise (commercial) catch rates
2.6% 126.9% 3.9% 143.6% 2.3% 139.1% 4.8% 85.4% 2.1% 109.5% Maximise(recreational/charter) participation
2.2% 77.3% 1.6% 43.8% 5.1% 135.3% 1.9% 57.9% 3.8% 73.7% Maximise (recreational/charter) catch rates
1.0% 80.0% 1.4% 114.3% 3.3% 109.1% 1.8% 66.7% 1.9% 57.9%
Page 23
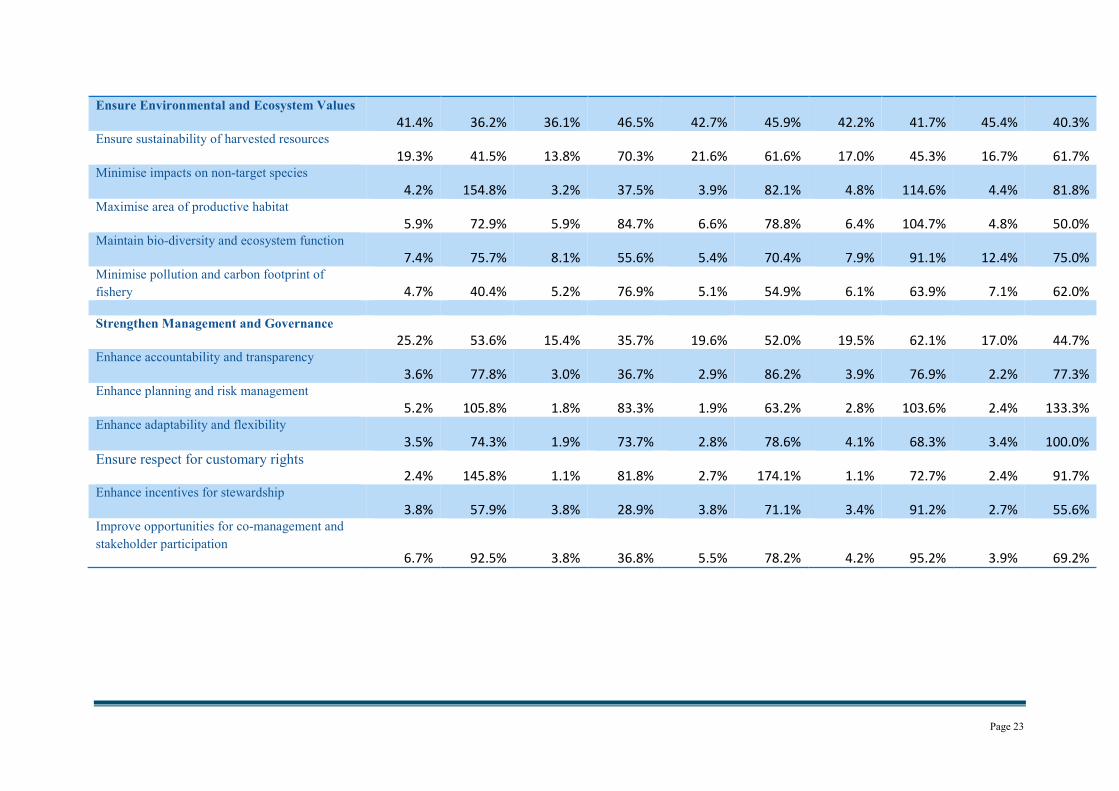
Ensure Environmental and Ecosystem Values
41.4% 36.2% 36.1% 46.5% 42.7% 45.9% 42.2% 41.7% 45.4% 40.3% Ensure sustainability of harvested resources
19.3% 41.5% 13.8% 70.3% 21.6% 61.6% 17.0% 45.3% 16.7% 61.7% Minimise impacts on non-target species
4.2% 154.8% 3.2% 37.5% 3.9% 82.1% 4.8% 114.6% 4.4% 81.8% Maximise area of productive habitat
5.9% 72.9% 5.9% 84.7% 6.6% 78.8% 6.4% 104.7% 4.8% 50.0% Maintain bio-diversity and ecosystem function
7.4% 75.7% 8.1% 55.6% 5.4% 70.4% 7.9% 91.1% 12.4% 75.0% Minimise pollution and carbon footprint of
fishery 4.7% 40.4% 5.2% 76.9% 5.1% 54.9% 6.1% 63.9% 7.1% 62.0%
Strengthen Management and Governance
25.2% 53.6% 15.4% 35.7% 19.6% 52.0% 19.5% 62.1% 17.0% 44.7% Enhance accountability and transparency
3.6% 77.8% 3.0% 36.7% 2.9% 86.2% 3.9% 76.9% 2.2% 77.3% Enhance planning and risk management
5.2% 105.8% 1.8% 83.3% 1.9% 63.2% 2.8% 103.6% 2.4% 133.3% Enhance adaptability and flexibility
3.5% 74.3% 1.9% 73.7% 2.8% 78.6% 4.1% 68.3% 3.4% 100.0%
Ensure respect for customary rights 2.4% 145.8% 1.1% 81.8% 2.7% 174.1% 1.1% 72.7% 2.4% 91.7%
Enhance incentives for stewardship
3.8% 57.9% 3.8% 28.9% 3.8% 71.1% 3.4% 91.2% 2.7% 55.6% Improve opportunities for co-management and
stakeholder participation 6.7% 92.5% 3.8% 36.8% 5.5% 78.2% 4.2% 95.2% 3.9% 69.2%
Page 24
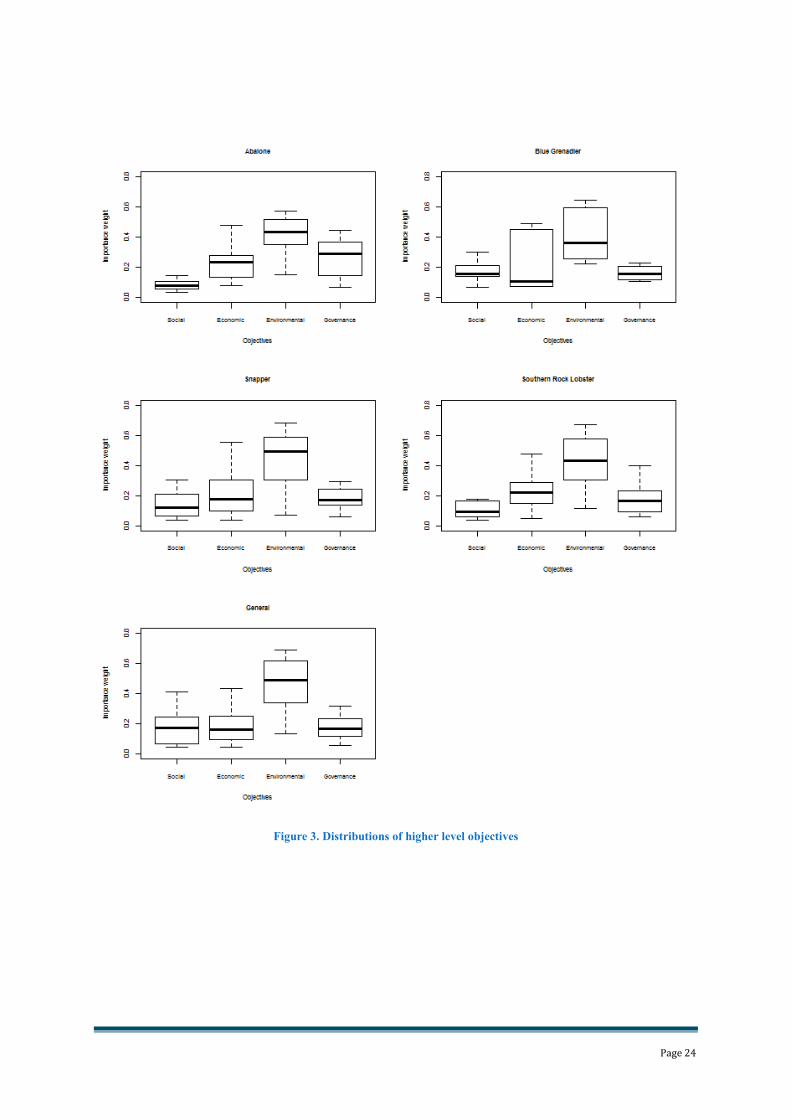
Figure 3. Distributions of higher level objectives
Page 25
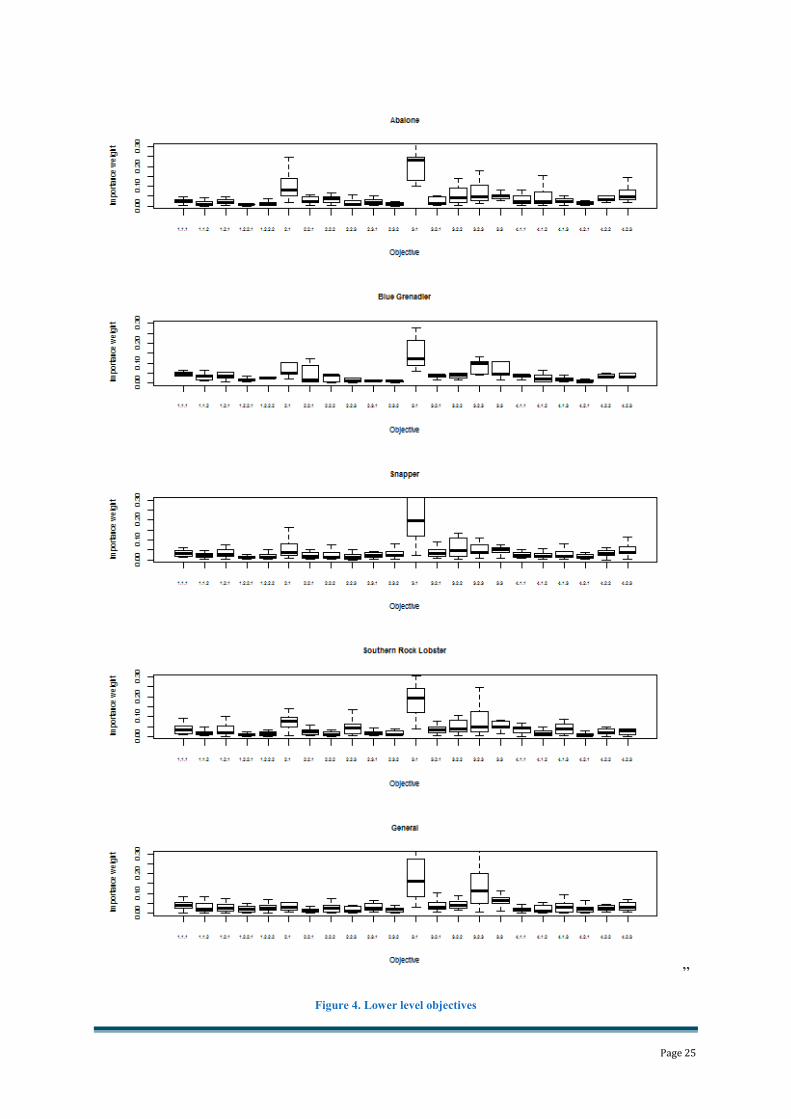
”
Figure 4. Lower level objectives
Page 26
The objective of ensuring environmental and ecosystems values received the highest
weighting for all fisheries, with generalists and the snapper fishery giving this objective the
highest relative weight (Table 2, Figure 3). Maximising economic performance was the
second most heavily weighted objective in the abalone, blue grenadier and southern rock
lobster fisheries, while adaptations that strengthen management and governance were given
higher priority than both social and economic objectives in the adaptation evaluation
framework in the snapper fishery and by those who responded generally.
A strong preference for assessing adaptations against objectives that ensure the
sustainability of the target resource was evident across all fishery groups, with the relative
weighting given to this lower order objective exceeding one or more of the high-level
objective weightings in all fisheries other than blue grenadier. In the case of the group who
responded generally, the lower order objective of maintaining biodiversity and ecosystem
function was also weighted more heavily than any of the high-level community, economic or
management and governance objectives. On average, preferences were generally uniform
across the various lower order community wellbeing and economic performance objectives
(Table 2), although this masks’ differences in individuals’ preferences for these lower level
objectives which average out over the set (Figure 4). A weighting of over 9% given to the
objective of maximising the value of tradable fishing rights for abalone and blue grenadier
fisheries was an exception. Lower order objectives related to strengthening management and
governance were also fairly uniformly weighted within each fishery group.
Group Coherence
The average coherence of responses for each of the fisheries and the proportion of extreme
comparisons are given in Table 3. When considering only the four high level objectives the
average coherence exceeded 0.914 for all fishery groups, suggesting high levels of agreement
about how they should be weighted in assessing adaptation options. For all fishery groups
the overall level of agreement about the relative importance of lower level objectives is
weaker. This result is similar to that found in other Australian studies (Pascoe et al. 2013,
Pascoe et al. 2009), where greater agreement at a higher level has been observed across and
within stakeholder groups, but generally low levels of agreement at the more detailed
objective level.
Page 27
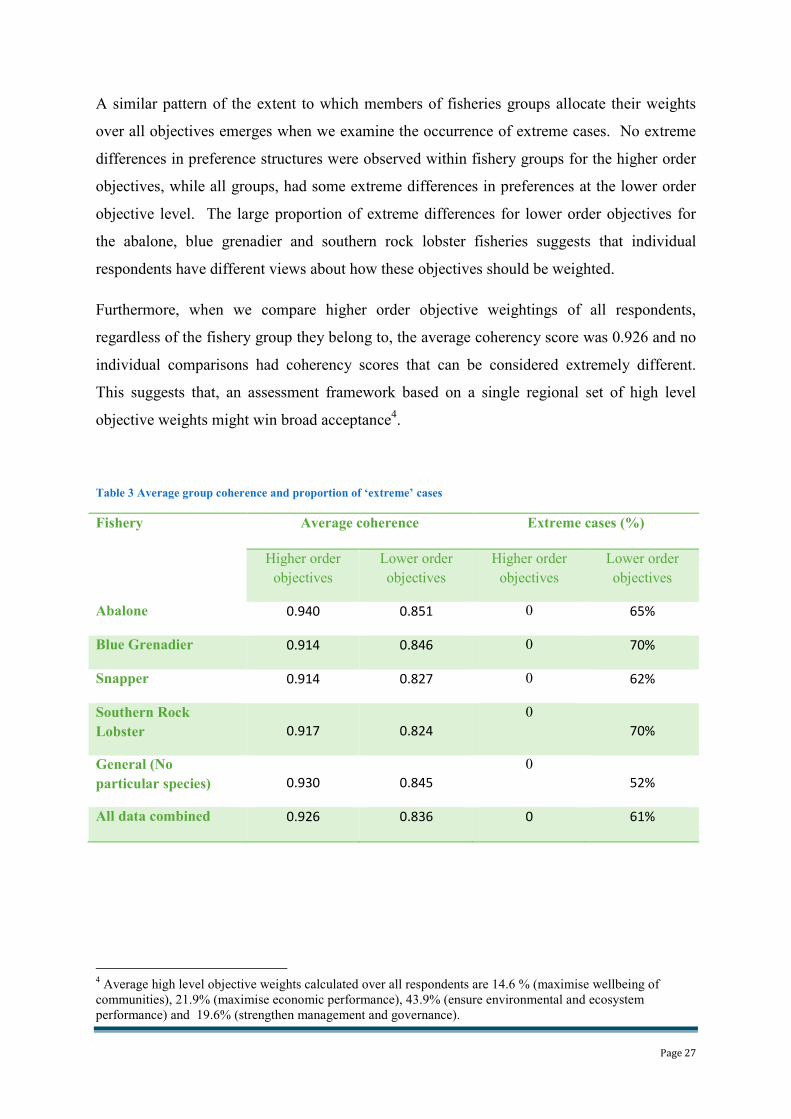
A similar pattern of the extent to which members of fisheries groups allocate their weights
over all objectives emerges when we examine the occurrence of extreme cases. No extreme
differences in preference structures were observed within fishery groups for the higher order
objectives, while all groups, had some extreme differences in preferences at the lower order
objective level. The large proportion of extreme differences for lower order objectives for
the abalone, blue grenadier and southern rock lobster fisheries suggests that individual
respondents have different views about how these objectives should be weighted.
Furthermore, when we compare higher order objective weightings of all respondents,
regardless of the fishery group they belong to, the average coherency score was 0.926 and no
individual comparisons had coherency scores that can be considered extremely different.
This suggests that, an assessment framework based on a single regional set of high level
objective weights might win broad acceptance4.
Table 3 Average group coherence and proportion of ‘extreme’ cases
Fishery Average coherence Extreme cases (%)
Higher order
objectives
Lower order
objectives
Higher order
objectives
Lower order
objectives
Abalone 0.940 0.851 0 65%
Blue Grenadier 0.914 0.846 0 70%
Snapper 0.914 0.827 0 62%
Southern Rock
Lobster 0.917 0.824
0
70%
General (No
particular species) 0.930 0.845
0
52%
All data combined 0.926 0.836 0 61%
4 Average high level objective weights calculated over all respondents are 14.6 % (maximise wellbeing of
communities), 21.9% (maximise economic performance), 43.9% (ensure environmental and ecosystem
performance) and 19.6% (strengthen management and governance).

Page 28
Discussion
Changes to fisheries management and governance arrangements will form an important part
of climate change adaptation responses for fisheries in South Eastern Australia where
climate-related changes in key bio-physical variables have already been observed and where
further impacts are predicted. Adaptations may include changes to fisheries assessment,
monitoring and management that are aimed at improving fisheries performance under likely
climate change scenarios, but may also include changes to management and governance that
are expected to better equip these fisheries to make the incremental and transformational
changes required to reduce negative impacts and to seize opportunities that climate change
may present. If adopted, such adaptations will themselves impact on various aspects of
fishery systems and on their associated values. The ability to comprehensively and
consistently assess proposed management adaptation options requires clear definition of a
multi-criteria evaluation framework which incorporates information about the relative
importance of these often competing criteria, or objectives. Such a framework is often
missing from climate change adaptation evaluation, and adaptation priorities and plans are
often developed without direct reference to the general aims of management.
The AHP has now been used a number of times in Australian fisheries (Pascoe et. al., 2009a;
Pascoe et. al., 2012; Pascoe et. al., 2009b) as a way of elucidating fisheries management
objectives and of deriving relative weights. This has been done as a way of exploring
differences between the preference structures of various stakeholder groups, but has also been
used to establish the framework for qualitative management strategy evaluation (Dichmont et.
al., 2012; Pascoe et. al., 2009a). In this project we have used the AHP to develop a weighted
objective framework for each of the four key SEAP fisheries to be used subsequently to
evaluate climate change adaptations in these fisheries. Differences between fisheries were
captured by comparing the average preferences for individuals whose expertise and
experience relates to each of the four fisheries separately, but using a common, generalised
objective hierarchy. The hierarchy included general fisheries management objectives as
routinely articulated in various policy and management documents. It also included
objectives that may underpin effective adaptation and adaptation planning, are likely to
contribute to the ongoing adaptive capacity and resilience of fisheries and their associated
communities.
Page 29
Overall, the average weightings attributed to various objectives were quite consistent across
the different fisheries groups (abalone, blue grenadier, snapper, southern rock lobster and a
general SEAP fishery group); with a very strong preference shown in all fisheries for
ensuring that adaptations sustain environmental and ecological values, particularly through
sustaining the harvested population. This emphasis on these aspects of fisheries management
is consistent with the results of other Australian studies (Pascoe et. al., 2012; Pascoe et. al.,
2009b) and with the emphasis that ESD is given in fisheries management policies and
legislation. It may also reflect a general belief that the environmental component of the
‘triple bottom line’ is a pre-requisite for ensuring sustainable economic and social outcomes
in the face of climate change, and that adaptations that contribute to this objective should be
given priority. While there was some variation in the average ranking of other high level
objectives (for example economic performance was given a slightly higher relative weighting
for the abalone, blue grenadier and southern rock lobster fisheries; greater relative emphasis
was placed on the objective of maximising the wellbeing of communities for the blue
grenadier and southern rock lobster fisheries; and the relative weighting on strengthening
management and governance was higher for the abalone and snapper groups) there was a
high level of coherency across all respondents when considering the broad objectives,
suggesting that a single high level assessment framework across the region might be
acceptable.
Our observations about the level of variation in individual preferences within fisheries group
is similar to that reported in other studies in fisheries (Leung et. al., 1998; Mardle et. al.,
2004; Raakjær Nielsen and Mathiesen, 2006; Soma, 2003). Strong coherence at the level of
broad objectives masks strong differences between individuals about the relative importance
of lower level objectives, particularly in the abalone, blue grenadier and southern rock lobster
fisheries. Over all groups, there is stronger agreement about relative weights for lower level
objectives in the areas of community wellbeing and management and governance, with less
agreement on detailed objectives for environmental and economic objectives. It is important
to note that differences within fisheries groups may reflect variations in the preferences of
stakeholder groups or inter-jurisdictional differences. It is possible that the emphasis of this
report on key fisheries or species frameworks might take focus from possibly more important
source of heterogeneity, namely preference differences across stakeholder groups.
Page 30
Planned outcomes and benefits
The project comprises a small component of a suite of projects that will contribute to the
outcomes of the SEAP plan:
• Effective incorporation of fisheries in marine ecosystem based management
arrangements
• Fisheries and aquaculture management that is responsive to climate change
• A community that is supportive of fisheries management arrangements
• A fishing and aquaculture industry that is adapting to climate change
The project is closely aligned to DCC/FRDC Project 2011/039 Preparing fisheries for
climate change: identifying adaptation options for four key fisheries in South Eastern
Australia, in that the objective hierarchies developed here for each of the four key SEAP
fisheries will provide a framework within which to assess the performance of identified
management adaptations that are to be proposed in response to the predicted effects of
climate change in the South Eastern Australian region. The key outcome of developing this
objectives framework and associated objective weights for each of the four species is that it
will enable the consistent and transparent assessment of alternative management changes,
help identify potential areas of stakeholder conflict that might present barriers to adoption,
and improve the quality of management adaptation responses and potentially increase the
speed at which adaptation responses will be implemented.
The benefits of having developed the assessment frameworks will also spill over beyond their
immediate use in DCC/FRDC Project 2011/039 Preparing fisheries for climate change:
identifying adaptation options for four key fisheries in South Eastern Australia, as they can
also be used to assess the performance against objectives of a wider range of proposed
management changes in these fisheries.
In addition, participation in the process of developing objective hierarchies and weighting can
build awareness of individual stakeholders as to the complexity of the trade-offs between
objectives that are inherent in the fisheries management evaluation process and of the
challenges associated with effective climate change adaptation planning.

Page 31
Further development
The process of developing the generalised, overarching objective hierarchy used in this
project involved drawing on four draft species-specific hierarchies which were developed by
Industry and Management Committees at the SEAP Fisheries Adaptation Workshop March
15/16th
2012. These draft hierarchies are available for further development, either at the
species or individual fisheries level.
The management adaptation assessments conducted as part of DCC/FRDC Project 2011/039
Preparing fisheries for climate change: identifying adaptation options for four key fisheries
in South Eastern Australia are not scheduled to take place until 2013. The opportunity
therefore exists for the results of this study to be supplemented and extended through the
inclusion of further survey responses and for specific groups of stakeholders to complete the
survey in a supported workshop environment. This would enable us to further explore the
possibility that differences between objective weightings are better explained by stakeholder
group than they are by fishery group.
Page 32
References
Dichmont, C.M., Pascoe, S., Jebreen, E., Pears, R., Brooks, K. and Perez, P. (2012) Choosing
a fishery’s governance structure using data poor methods, Marine Policy 36.
Di Nardo, G., Levy, D., Golden, B. (1989) Using decision analysis to manage Maryland’s
river herring fishery: an application of AHP. Journal of Environmental Management.29,
pp. 193-213
Forman, E.H., Gass, S.I. (2001) The Analytic Hierarchy Process - An Exposition. Operations
Research 49, 469-486
Halide H., Stigebrandt A., Rehbein M. and McKinnon A.D. (2009) Developing a decision-
support system for sustainable cage aquaculture. Environmental Modelling and Software 24,
pp. 694-702
Himes, A.H. (2007) Performance indicator importance in MPA management using a multi
criteria approach, Coastal Management 35, 601-618
Innes, J.P., Pascoe, S. (2010) A multi-criteria assessment of fishing gear impacts in demersal
fisheries. Journal of Environmental Management 91, 932-939
Kangas J. (1995) Supporting the choice of the sports fishing site. Journal of Environmental
Management 43, pp219-231
Lane D.E. (2007) Planning in fisheries-related systems. In: Handbook of Operations
Research in Natural Resources (ed. by A. Weintraub, C. Romero, T. Bjorndal and R.
Epstein), pp. 237-271. Springer Science and Business Media, New-York, NY, USA
Leung P.S, Muraoka J., Nakamoto S.T. and Pooley S. (1998) Evaluating fisheries
management options in Hawaii using analytic hierarchy process (AHP). Fisheries Research
36. pp. 171-183
Mardle S. and Pascoe S. (1999) A review of applications of multiple criteria decision making
techniques to fisheries. Marine Resource Fisheries 14. pp.41-63
Mardle S. and Pascoe S. (eds.) (2003) Multiple objectives in the management of EU fisheries:
preference elicitation. CEMARE Report 64, University of Portsmouth, UK.
Mardle, S., Pascoe, S., Boncoeur, J., Le Gallic, B., Garcia-Hoyo, J.J., Herrero, N., Jimenez-
Toribio, R., Cortes, C., Padilla, N., Nielsen, J.R. and Mathiesen, C. (2002) Objectives of
fisheries management: case studies from the UK, France, Spain and Denmark, Marine Policy
26, 415-428.
Mardle S., Pascoe, S., Herrero, I. (2004) Management objective importance in fisheries: an
evaluation using the analytical hierarchy process (AHP). Environmental Management 33, 1-
11
Page 33
Nielsen, J.R., Mathiesen, C. (2006) Stakeholder preferences for Danish fisheries
management. Fisheries Research77, 92-101
Pascoe, S., Bustarnante, R., Wilcox, C. and Gibbs, M. (2009a) Spatial fisheries management:
A framework for multi-objective qualitative assessment, Ocean and Coastal Management 52,
130-138.
Pascoe, S., Proctor, W., Wilcox, C., Innes, J., Rochester, W. and Dowling, N. (2009b)
Stakeholder objective preferences in Australian Commonwealth managed fisheries, Marine
Policy 33, 750-758.
Pascoe, S., Dichmont, C.M., Brooks, K., Pears, R. and Jebreen, E. (2012) Management
objectives of Queensland fisheries: putting the horse before the cart, Marine Policy.
Ramos, J., Santos, M.N., Whitmarsh, D and Monteiro, C. (2006) The usefulness of the
analytic hierarchy process to understand reef diving choices: a case study. Bulletin of Marine
Science 78, pp. 213-219
Raakjær, J.N, and Mathiesen, C. (2006) Stakeholder preferences for Danish fisheries
management of sand eel and Norway pout, Fisheries Research, 77(1), pp 92-101.
Saarn,i K., Setala, J and Honkanen, A. (2001) An application of AHP to strategic planning
Improvement of quality fish products. Paper presented at the XIIIth Conference of the
European Association of Fisheries Economists (EAFE), Salerno, Italy, April 18-20
Saaty, T.L. (1980a) The Analytic Hierarchy Process McGraw-Hill, New York.
Saaty, T.L. (1980b) The Analytic Hierarchy Process. McGraw-Hill, New York.
Setala, J., Saarni, K. and Honkanen, A (2000) The quality perceptions of rainbow trout
defined by different fish market sectors. Paper presented at the Tenth Biennial Conference of
the International Institute of Fisheries Economics and Trade (IIFET), Corvallis, Oregon, July
10-15.
Soma, K. (2003) How to involve stakeholders in fisheries management – a country case study
in Trinidad and Tobago. Marine Policy 27, pp 47-58
Utne, I.B. (2008) Are the smallest fishing vessels the most sustainable? trade-off analysis of
sustainability attributes. Marine Policy 32, 465-474
Whitmarsh, D and Palmieri, M,G. (2009) Social acceptability of marine aquaculture: the use
of survey-based methods for eliciting public and stakeholder preferences. Marine Policy 33,
pp. 452-457
Whitmarsh, D and Wattage, P. (2006) Public attitudes towards the environmental impact of
salmon aquaculture in Scotland. European Environment 16, pp. 108-121
Zahir, S. (1999a) Clusters in a group: Decision making in the vector space formulation of the
analytic hierarchy process. European Journal of Operational Research 112, 620-634.

Page 34
Zahir, S. (1999b) Geometry of decision making and the vector space formulation of the
analytic hierarchy process. European Journal of Operational Research 112, 373-396.
Page 35
Appendix 1: Intellectual Property
This is not applicable to this project.
Page 36
Appendix 2: Summary of management objectives as found in policy/legislation for SEAP commercial fisheries by species
and state Fishery Tasmania Victoria New South Wales South Australia Commonwealth
Abalone • Maintain biomass and
recruitment
• To maintain fish stocks at
sustainable levels
• Sustain yield and economic
return
• Commercial fishing
interactions
• Access to fish stock by non
commercial fishers
• To enable the farming and
the harvesting of wild
stocks to co-exist
• Maintain the marine
ecosystem
• Prevent the combined take
from exceeding the
Sustainable productivity of
the Tasmanian abalone
stocks
• Cost recovery and return to
the community
• Quality assurance
• Capacity sustained into the
future with low level of risk.
• Cost effective management
• Opportunities for
commercial production fully
utilised
• Ecosystem health not
jeopardised by fishery
practices
• Management adequately
responsive to changes in
ecosystem health
• Commercial production to
be economically efficient
• Productive capacity directly
enhanced through
appropriate activities ie.
Aquaculture, ranching,
enhancement
• Equitable assignment of
productive capacity between
commercial rec, indigenous
and non exploitative uses
• Recognition of past access
by indigenous community
return where there is
commercial use of publicly
owned abalone stocks
• Recovery of attributable
management costs
• Stakeholders and
government sharing
responsibility and
involvement in management
• Manage commercial
harvesting of abalone to
promote the conservation of
biological diversity in the
coastal environment.
• Maintain or rebuild the
biomass of abalone to
ensure stock sustainability.
• Facilitate effective
management arrangements
and provision of an efficient
fisheries management
service.
• To promote the economic
viability of the fishery
• To increase the appropriate
level of ownership capacity
in the fishery.
• To appropriately share the
resource and harvest
abalone in a manner that
minimises negative social
and economic impacts.
• Facilitate appropriate
research and monitoring of
the Abalone Fishery
• Achieve a high level of
compliance within the
Abalone Fishery
• Ensure adequate stakeholder
involvement and
community consultation.
• Ensure that abalone stocks
are harvested within
sustainable limits
• Optimum utilisation and
equitable distribution of the
abalone resource
• Minimise impacts on the
ecosystem
• Cost effective and
participative management of
the fishery
Page 37
Fishery Tasmania Victoria New South Wales South Australia Commonwealth
• • Compliance targets for
licenced sectors achieved
and monitored
• Prevention of illegal activity
targets for nonlicenced
sectors achieved and
monitored
• •
Rock lobster • Re-build the biomass
Maintain the ecological
integrity of marine
ecosystems
• Promote commercial use for
economic prosperity
• Provide recreational
opportunities
• Provide opportunities for
indigenous communities to
access the resource for
traditional purposes
• Ensure equity for future
generations
• Monitor fisheries
performance and implement
management arrangements
• Promote stakeholder
participation in decision
making
• Ensure compliance with
legislation
• Provide a public
information service
• Sustainability of the
resource
• Cost effective participatory
management
• Resource access and
utililsation.
• Manage the Lobster Fishery
in a manner that promotes
the conservation of
biological diversity in the
marine environment
• Maintain the stock of
eastern rock lobster at a
biologically sustainable
level and manage byproduct
taken in the Lobster Fishery
• Promote the conservation of
threatened species,
populations and ecological
communities and protected
species likely to be
impacted by the operation
of the Lobster Fishery
• Appropriately share the
resource and carry out
fishing in a manner that
minimises negative social
impacts
• Promote a viable
commercial fishery,
consistent with ecological
sustainability
• Facilitate effective and
efficient compliance,
research and management of
the Lobster Fishery
• To maintain rock lobster
populations at sustainable
levels across the fishery.
• To harvest rock lobster at a
size likely to provide for
adequate levels of
recruitment.
• To maintain the economic
return from the southern
zone rock lobster fishery at
a level which provides for
fair and reasonable benefits
to licence holders.
• Optimise yield from the
fishery.
• To recover an economic
return from licence holders
sufficient to cover attributed
costs of management,
research and compliance for
the fishery.
• To provide for economic
efficiency and flexibility in
management arrangements
by developing harvesting
strategies that minimise
costs.
• To protect the resource
through the provision of
adequate compliance
resources.
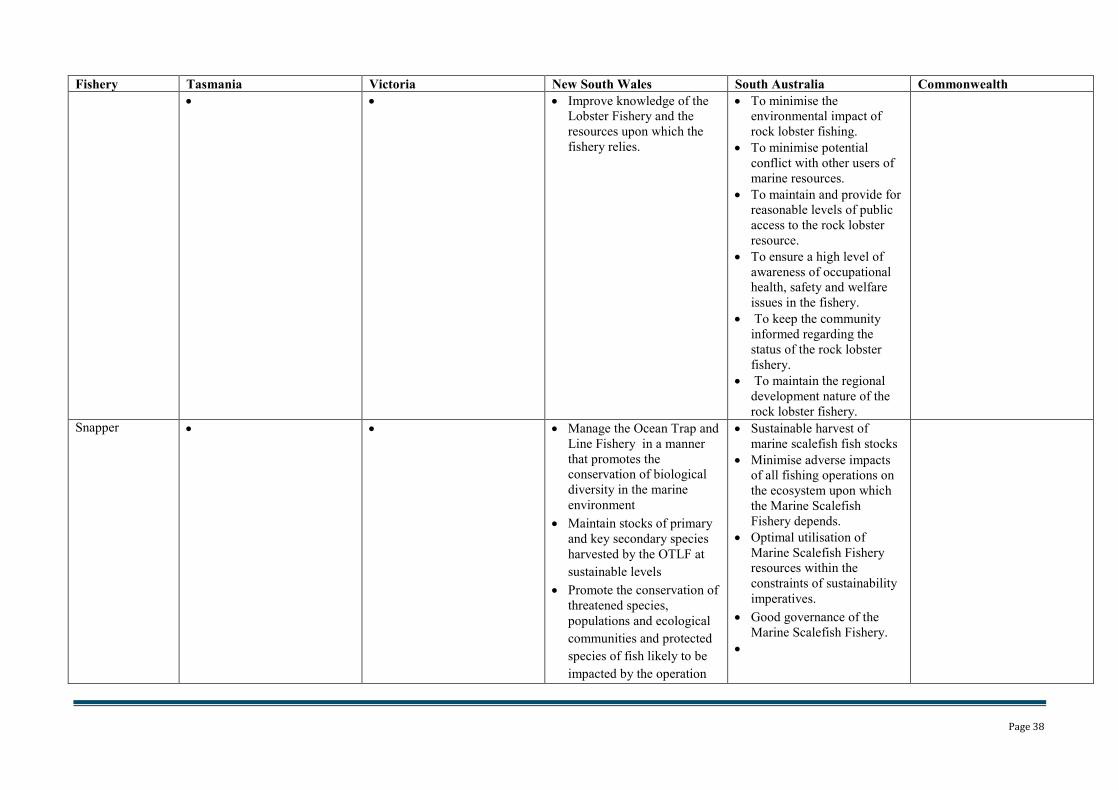
Page 38
Fishery Tasmania Victoria New South Wales South Australia Commonwealth
• • • Improve knowledge of the
Lobster Fishery and the
resources upon which the
fishery relies.
• To minimise the
environmental impact of
rock lobster fishing.
• To minimise potential
conflict with other users of
marine resources.
• To maintain and provide for
reasonable levels of public
access to the rock lobster
resource.
• To ensure a high level of
awareness of occupational
health, safety and welfare
issues in the fishery.
• To keep the community
informed regarding the
status of the rock lobster
fishery.
• To maintain the regional
development nature of the
rock lobster fishery.
Snapper • • • Manage the Ocean Trap and
Line Fishery in a manner
that promotes the
conservation of biological
diversity in the marine
environment
• Maintain stocks of primary
and key secondary species
harvested by the OTLF at
sustainable levels
• Promote the conservation of
threatened species,
populations and ecological
communities and protected
species of fish likely to be
impacted by the operation
• Sustainable harvest of
marine scalefish fish stocks
• Minimise adverse impacts
of all fishing operations on
the ecosystem upon which
the Marine Scalefish
Fishery depends.
• Optimal utilisation of
Marine Scalefish Fishery
resources within the
constraints of sustainability
imperatives.
• Good governance of the
Marine Scalefish Fishery.
•
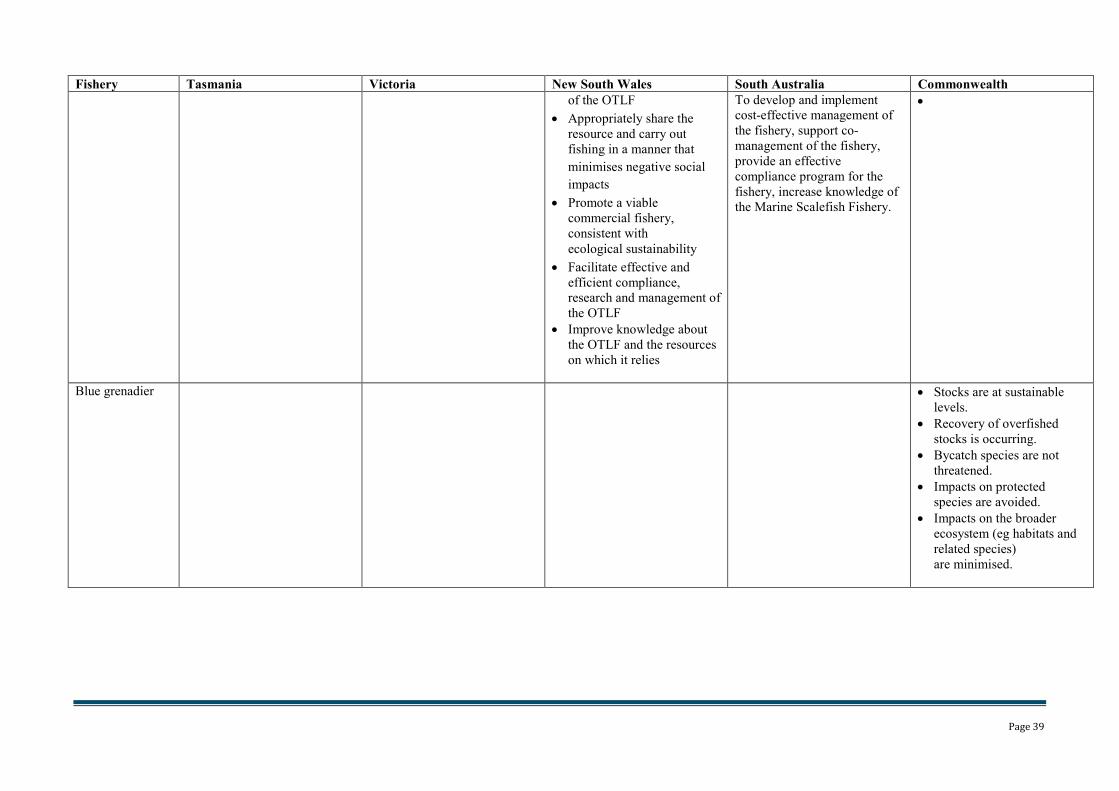
Page 39
Fishery Tasmania Victoria New South Wales South Australia Commonwealth
of the OTLF
• Appropriately share the
resource and carry out
fishing in a manner that
minimises negative social
impacts
• Promote a viable
commercial fishery,
consistent with
ecological sustainability
• Facilitate effective and
efficient compliance,
research and management of
the OTLF
• Improve knowledge about
the OTLF and the resources
on which it relies
To develop and implement
cost-effective management of
the fishery, support co-
management of the fishery,
provide an effective
compliance program for the
fishery, increase knowledge of
the Marine Scalefish Fishery.
•
Blue grenadier • Stocks are at sustainable
levels.
• Recovery of overfished
stocks is occurring.
• Bycatch species are not
threatened.
• Impacts on protected
species are avoided.
• Impacts on the broader
ecosystem (eg habitats and
related species)
are minimised.
Page 40
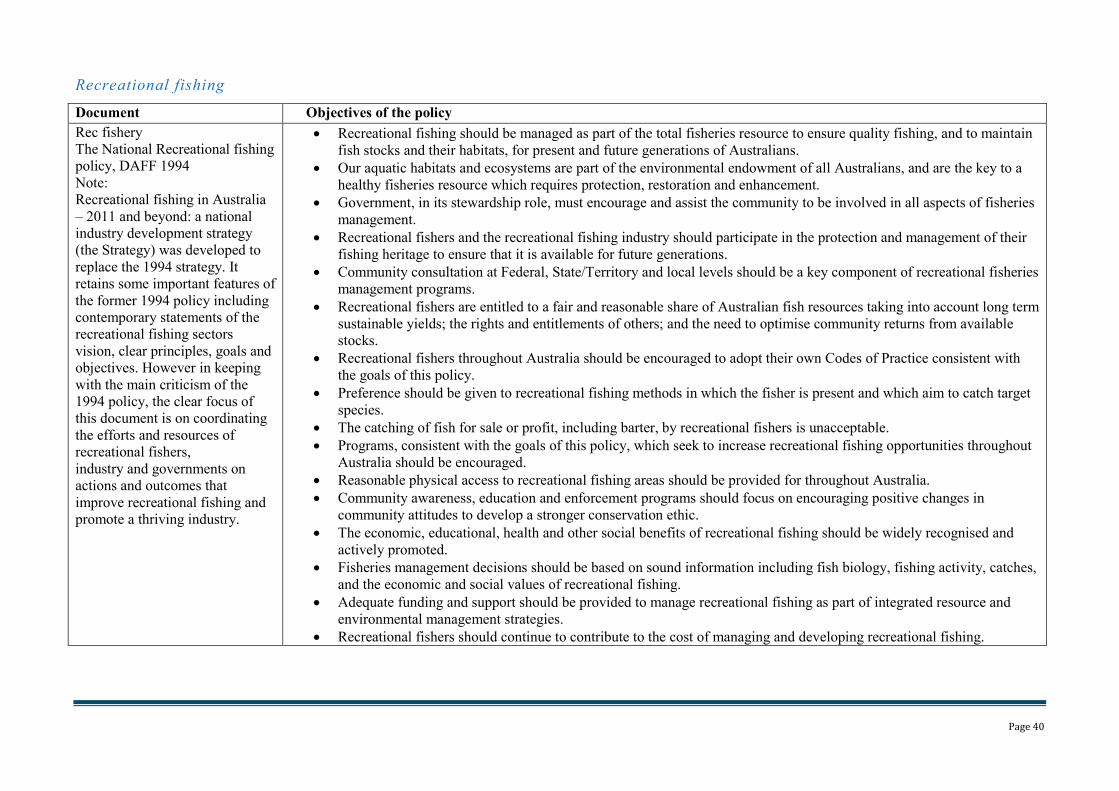
Recreational fishing
Document Objectives of the policy
Rec fishery
The National Recreational fishing
policy, DAFF 1994
Note:
Recreational fishing in Australia
– 2011 and beyond: a national
industry development strategy
(the Strategy) was developed to
replace the 1994 strategy. It
retains some important features of
the former 1994 policy including
contemporary statements of the
recreational fishing sectors
vision, clear principles, goals and
objectives. However in keeping
with the main criticism of the
1994 policy, the clear focus of
this document is on coordinating
the efforts and resources of
recreational fishers,
industry and governments on
actions and outcomes that
improve recreational fishing and
promote a thriving industry.
• Recreational fishing should be managed as part of the total fisheries resource to ensure quality fishing, and to maintain
fish stocks and their habitats, for present and future generations of Australians.
• Our aquatic habitats and ecosystems are part of the environmental endowment of all Australians, and are the key to a
healthy fisheries resource which requires protection, restoration and enhancement.
• Government, in its stewardship role, must encourage and assist the community to be involved in all aspects of fisheries
management.
• Recreational fishers and the recreational fishing industry should participate in the protection and management of their
fishing heritage to ensure that it is available for future generations.
• Community consultation at Federal, State/Territory and local levels should be a key component of recreational fisheries
management programs.
• Recreational fishers are entitled to a fair and reasonable share of Australian fish resources taking into account long term
sustainable yields; the rights and entitlements of others; and the need to optimise community returns from available
stocks.
• Recreational fishers throughout Australia should be encouraged to adopt their own Codes of Practice consistent with
the goals of this policy.
• Preference should be given to recreational fishing methods in which the fisher is present and which aim to catch target
species.
• The catching of fish for sale or profit, including barter, by recreational fishers is unacceptable.
• Programs, consistent with the goals of this policy, which seek to increase recreational fishing opportunities throughout
Australia should be encouraged.
• Reasonable physical access to recreational fishing areas should be provided for throughout Australia.
• Community awareness, education and enforcement programs should focus on encouraging positive changes in
community attitudes to develop a stronger conservation ethic.
• The economic, educational, health and other social benefits of recreational fishing should be widely recognised and
actively promoted.
• Fisheries management decisions should be based on sound information including fish biology, fishing activity, catches,
and the economic and social values of recreational fishing.
• Adequate funding and support should be provided to manage recreational fishing as part of integrated resource and
environmental management strategies.
• Recreational fishers should continue to contribute to the cost of managing and developing recreational fishing.
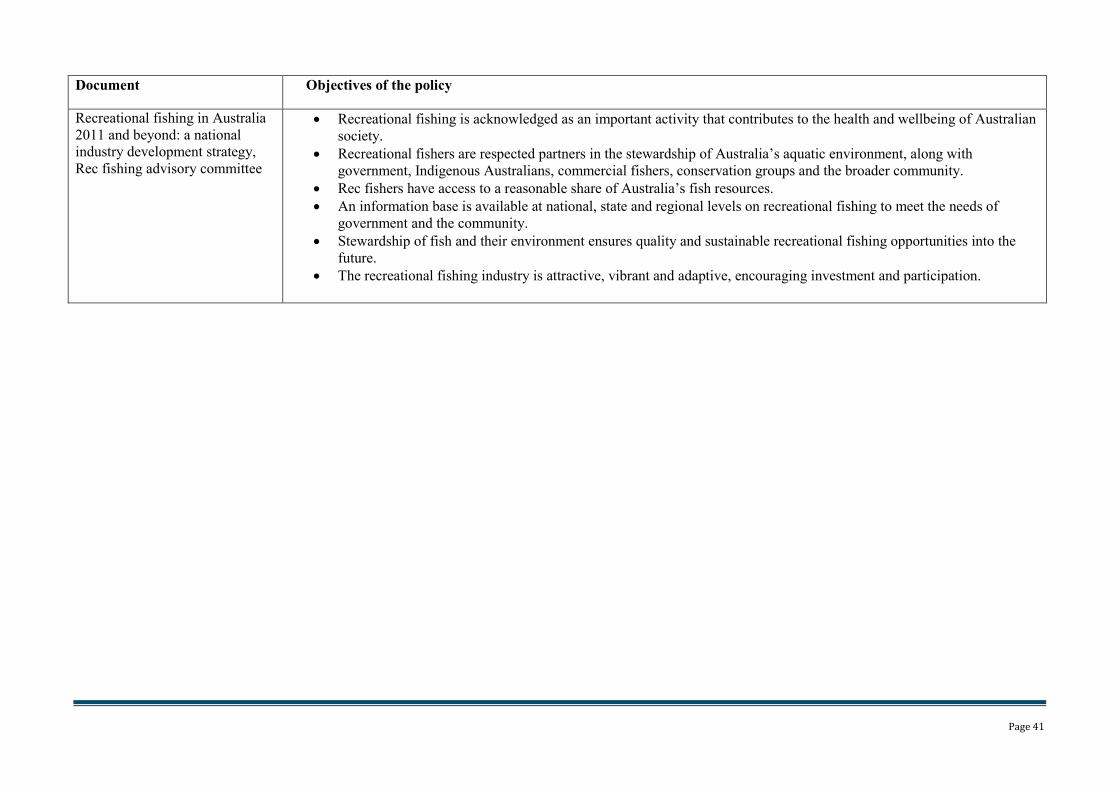
Page 41
Document Objectives of the policy
Recreational fishing in Australia
2011 and beyond: a national
industry development strategy,
Rec fishing advisory committee
• Recreational fishing is acknowledged as an important activity that contributes to the health and wellbeing of Australian
society.
• Recreational fishers are respected partners in the stewardship of Australia’s aquatic environment, along with
government, Indigenous Australians, commercial fishers, conservation groups and the broader community.
• Rec fishers have access to a reasonable share of Australia’s fish resources.
• An information base is available at national, state and regional levels on recreational fishing to meet the needs of
government and the community.
• Stewardship of fish and their environment ensures quality and sustainable recreational fishing opportunities into the
future.
• The recreational fishing industry is attractive, vibrant and adaptive, encouraging investment and participation.
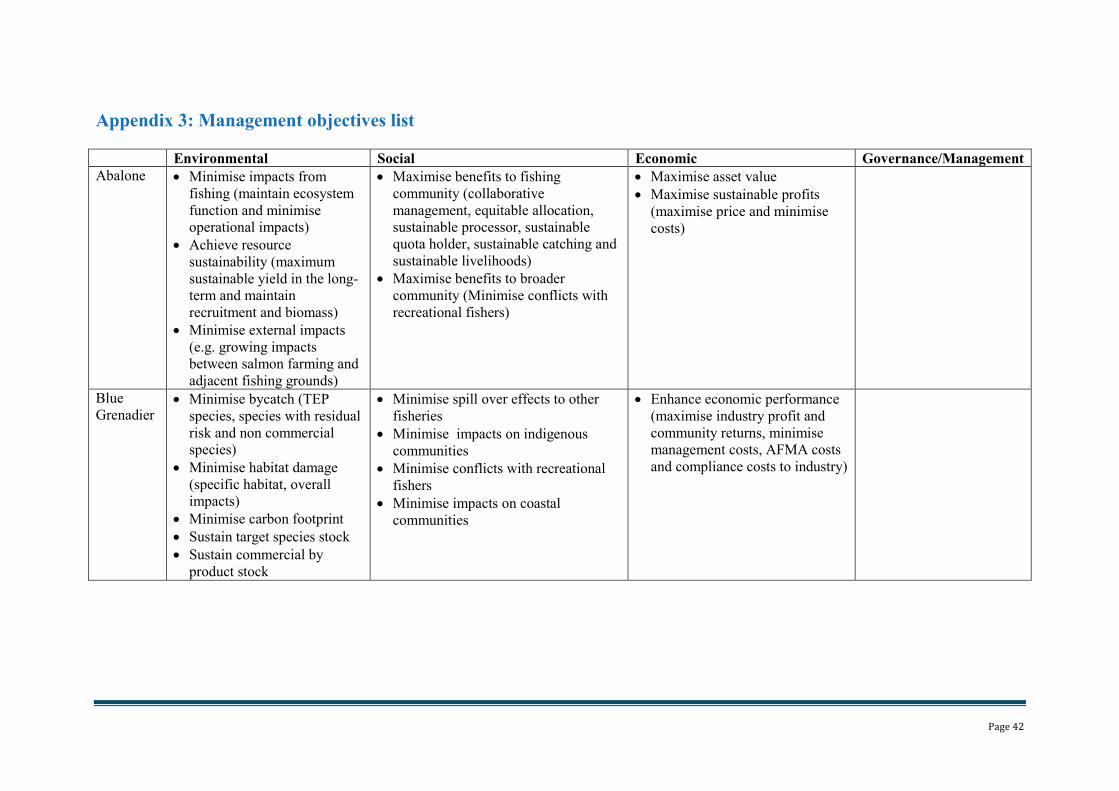
Page 42
Appendix 3: Management objectives list
Environmental Social Economic Governance/Management
Abalone • Minimise impacts from
fishing (maintain ecosystem
function and minimise
operational impacts)
• Achieve resource
sustainability (maximum
sustainable yield in the long-
term and maintain
recruitment and biomass)
• Minimise external impacts
(e.g. growing impacts
between salmon farming and
adjacent fishing grounds)
• Maximise benefits to fishing
community (collaborative
management, equitable allocation,
sustainable processor, sustainable
quota holder, sustainable catching and
sustainable livelihoods)
• Maximise benefits to broader
community (Minimise conflicts with
recreational fishers)
• Maximise asset value
• Maximise sustainable profits
(maximise price and minimise
costs)
Blue
Grenadier • Minimise bycatch (TEP
species, species with residual
risk and non commercial
species)
• Minimise habitat damage
(specific habitat, overall
impacts)
• Minimise carbon footprint
• Sustain target species stock
• Sustain commercial by
product stock
• Minimise spill over effects to other
fisheries
• Minimise impacts on indigenous
communities
• Minimise conflicts with recreational
fishers
• Minimise impacts on coastal
communities
• Enhance economic performance
(maximise industry profit and
community returns, minimise
management costs, AFMA costs
and compliance costs to industry)
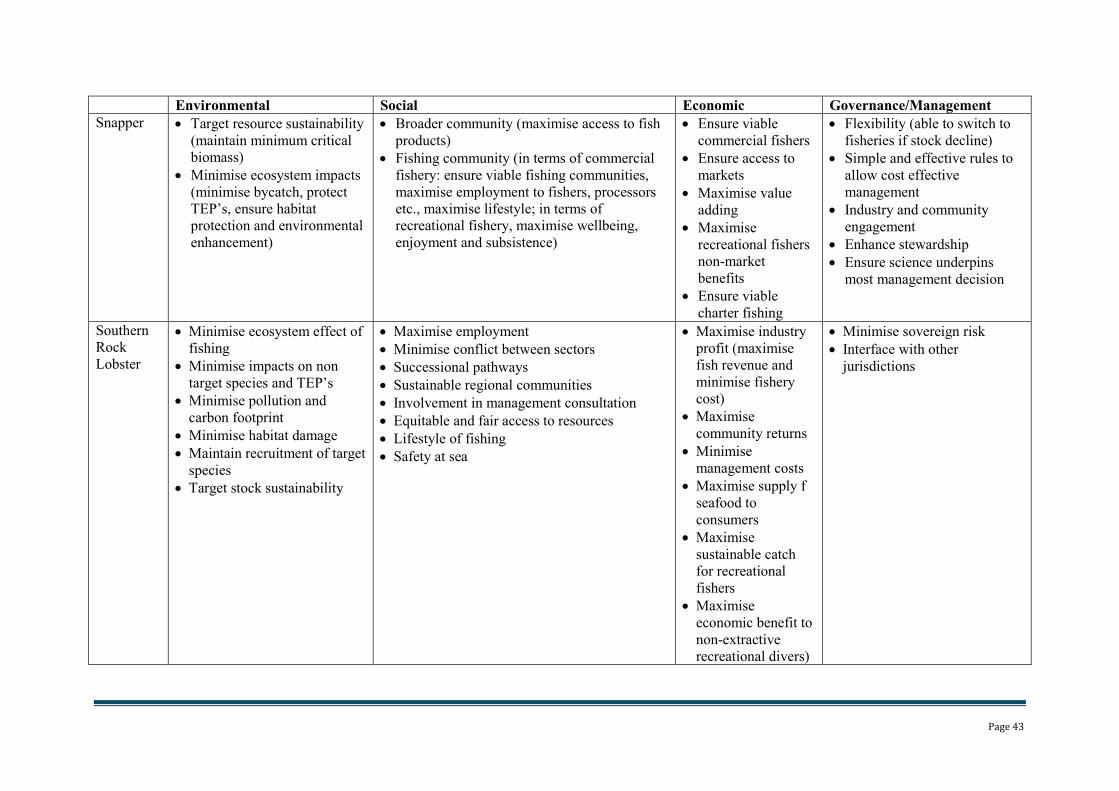
Page 43
Environmental Social Economic Governance/Management
Snapper • Target resource sustainability
(maintain minimum critical
biomass)
• Minimise ecosystem impacts
(minimise bycatch, protect
TEP’s, ensure habitat
protection and environmental
enhancement)
• Broader community (maximise access to fish
products)
• Fishing community (in terms of commercial
fishery: ensure viable fishing communities,
maximise employment to fishers, processors
etc., maximise lifestyle; in terms of
recreational fishery, maximise wellbeing,
enjoyment and subsistence)
• Ensure viable
commercial fishers
• Ensure access to
markets
• Maximise value
adding
• Maximise
recreational fishers
non-market
benefits
• Ensure viable
charter fishing
• Flexibility (able to switch to
fisheries if stock decline)
• Simple and effective rules to
allow cost effective
management
• Industry and community
engagement
• Enhance stewardship
• Ensure science underpins
most management decision
Southern
Rock
Lobster
• Minimise ecosystem effect of
fishing
• Minimise impacts on non
target species and TEP’s
• Minimise pollution and
carbon footprint
• Minimise habitat damage
• Maintain recruitment of target
species
• Target stock sustainability
• Maximise employment
• Minimise conflict between sectors
• Successional pathways
• Sustainable regional communities
• Involvement in management consultation
• Equitable and fair access to resources
• Lifestyle of fishing
• Safety at sea
• Maximise industry
profit (maximise
fish revenue and
minimise fishery
cost)
• Maximise
community returns
• Minimise
management costs
• Maximise supply f
seafood to
consumers
• Maximise
sustainable catch
for recreational
fishers
• Maximise
economic benefit to
non-extractive
recreational divers)
• Minimise sovereign risk
• Interface with other
jurisdictions
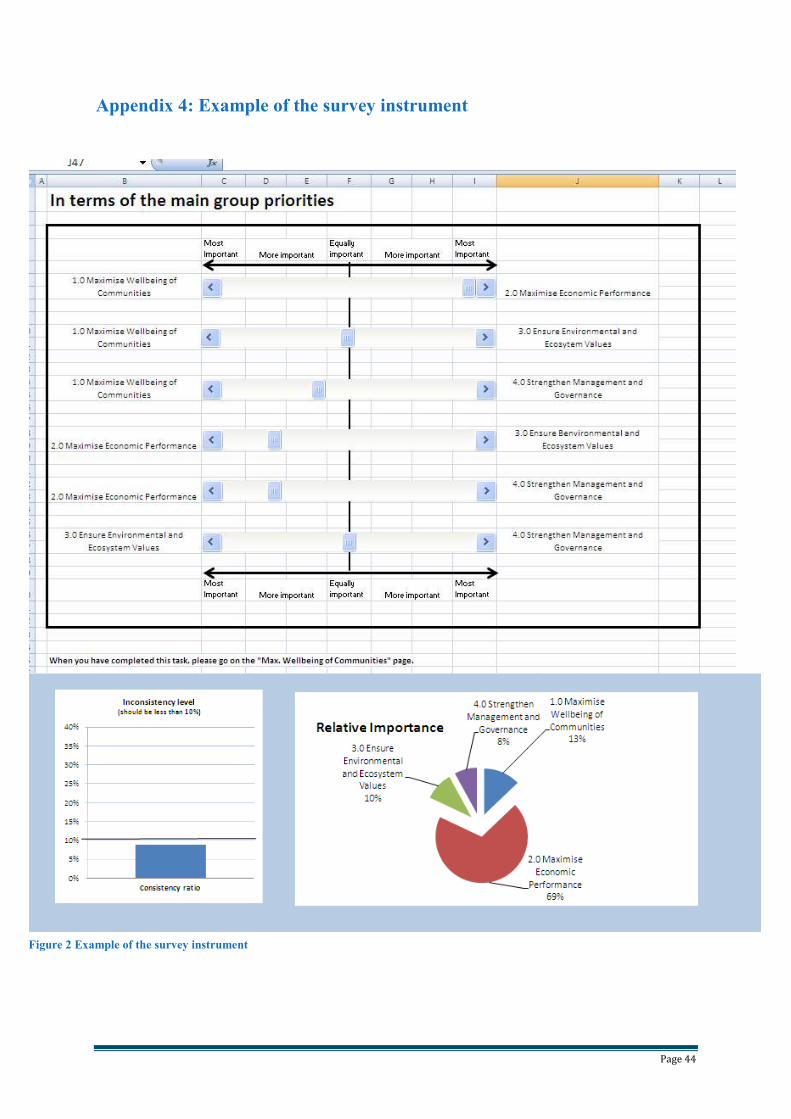
Page 44
Appendix 4: Example of the survey instrument
Figure 2 Example of the survey instrument
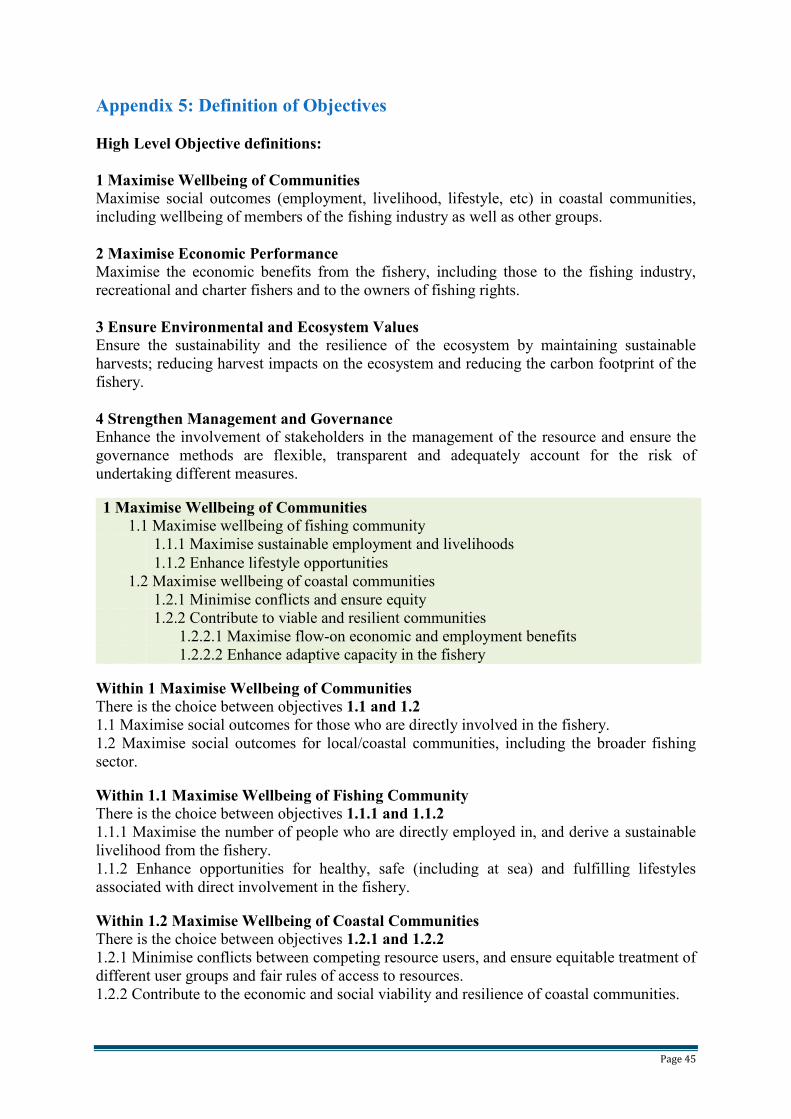
Page 45
Appendix 5: Definition of Objectives
High Level Objective definitions:
1 Maximise Wellbeing of Communities Maximise social outcomes (employment, livelihood, lifestyle, etc) in coastal communities,
including wellbeing of members of the fishing industry as well as other groups.
2 Maximise Economic Performance
Maximise the economic benefits from the fishery, including those to the fishing industry,
recreational and charter fishers and to the owners of fishing rights.
3 Ensure Environmental and Ecosystem Values Ensure the sustainability and the resilience of the ecosystem by maintaining sustainable
harvests; reducing harvest impacts on the ecosystem and reducing the carbon footprint of the
fishery.
4 Strengthen Management and Governance
Enhance the involvement of stakeholders in the management of the resource and ensure the
governance methods are flexible, transparent and adequately account for the risk of
undertaking different measures.
1 Maximise Wellbeing of Communities
1.1 Maximise wellbeing of fishing community
1.1.1 Maximise sustainable employment and livelihoods
1.1.2 Enhance lifestyle opportunities
1.2 Maximise wellbeing of coastal communities
1.2.1 Minimise conflicts and ensure equity
1.2.2 Contribute to viable and resilient communities
1.2.2.1 Maximise flow-on economic and employment benefits
1.2.2.2 Enhance adaptive capacity in the fishery
Within 1 Maximise Wellbeing of Communities
There is the choice between objectives 1.1 and 1.2
1.1 Maximise social outcomes for those who are directly involved in the fishery.
1.2 Maximise social outcomes for local/coastal communities, including the broader fishing
sector.
Within 1.1 Maximise Wellbeing of Fishing Community
There is the choice between objectives 1.1.1 and 1.1.2
1.1.1 Maximise the number of people who are directly employed in, and derive a sustainable
livelihood from the fishery.
1.1.2 Enhance opportunities for healthy, safe (including at sea) and fulfilling lifestyles
associated with direct involvement in the fishery.
Within 1.2 Maximise Wellbeing of Coastal Communities
There is the choice between objectives 1.2.1 and 1.2.2
1.2.1 Minimise conflicts between competing resource users, and ensure equitable treatment of
different user groups and fair rules of access to resources.
1.2.2 Contribute to the economic and social viability and resilience of coastal communities.
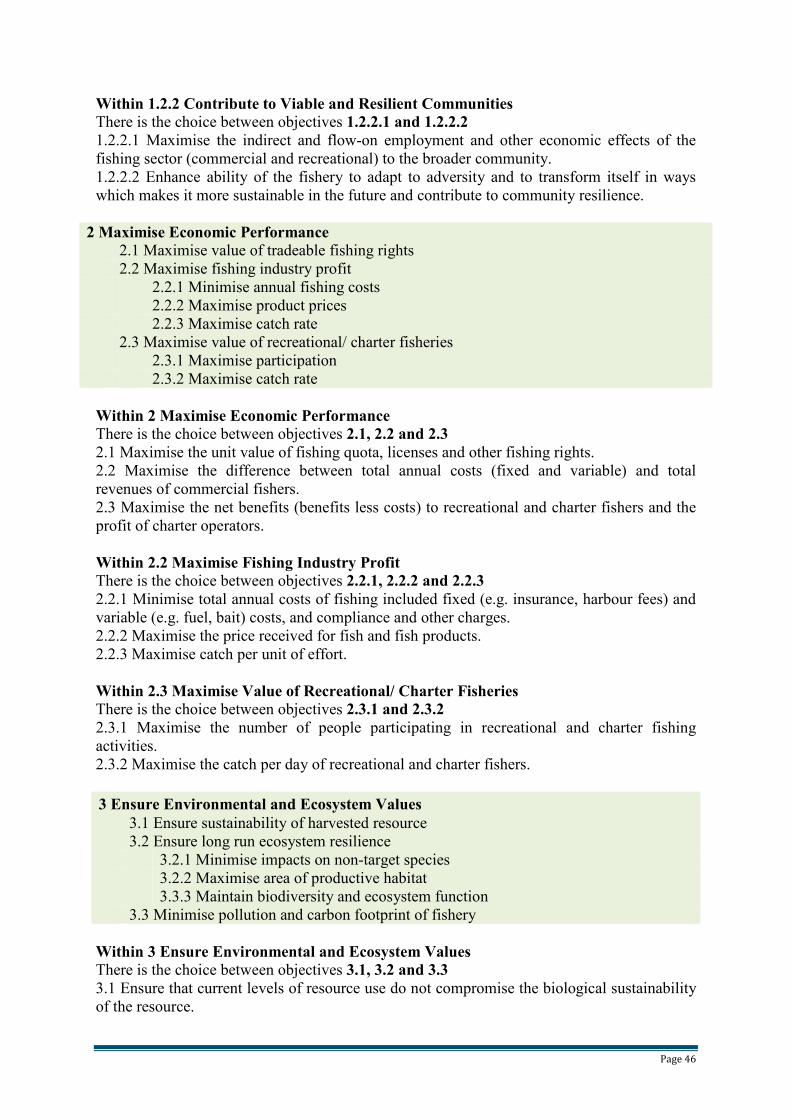
Page 46
Within 1.2.2 Contribute to Viable and Resilient Communities
There is the choice between objectives 1.2.2.1 and 1.2.2.2
1.2.2.1 Maximise the indirect and flow-on employment and other economic effects of the
fishing sector (commercial and recreational) to the broader community.
1.2.2.2 Enhance ability of the fishery to adapt to adversity and to transform itself in ways
which makes it more sustainable in the future and contribute to community resilience.
2 Maximise Economic Performance
2.1 Maximise value of tradeable fishing rights
2.2 Maximise fishing industry profit
2.2.1 Minimise annual fishing costs
2.2.2 Maximise product prices
2.2.3 Maximise catch rate
2.3 Maximise value of recreational/ charter fisheries
2.3.1 Maximise participation
2.3.2 Maximise catch rate
Within 2 Maximise Economic Performance
There is the choice between objectives 2.1, 2.2 and 2.3
2.1 Maximise the unit value of fishing quota, licenses and other fishing rights.
2.2 Maximise the difference between total annual costs (fixed and variable) and total
revenues of commercial fishers.
2.3 Maximise the net benefits (benefits less costs) to recreational and charter fishers and the
profit of charter operators.
Within 2.2 Maximise Fishing Industry Profit There is the choice between objectives 2.2.1, 2.2.2 and 2.2.3
2.2.1 Minimise total annual costs of fishing included fixed (e.g. insurance, harbour fees) and
variable (e.g. fuel, bait) costs, and compliance and other charges.
2.2.2 Maximise the price received for fish and fish products.
2.2.3 Maximise catch per unit of effort.
Within 2.3 Maximise Value of Recreational/ Charter Fisheries
There is the choice between objectives 2.3.1 and 2.3.2
2.3.1 Maximise the number of people participating in recreational and charter fishing
activities.
2.3.2 Maximise the catch per day of recreational and charter fishers.
3 Ensure Environmental and Ecosystem Values
3.1 Ensure sustainability of harvested resource
3.2 Ensure long run ecosystem resilience
3.2.1 Minimise impacts on non-target species
3.2.2 Maximise area of productive habitat
3.3.3 Maintain biodiversity and ecosystem function
3.3 Minimise pollution and carbon footprint of fishery
Within 3 Ensure Environmental and Ecosystem Values
There is the choice between objectives 3.1, 3.2 and 3.3
3.1 Ensure that current levels of resource use do not compromise the biological sustainability
of the resource.
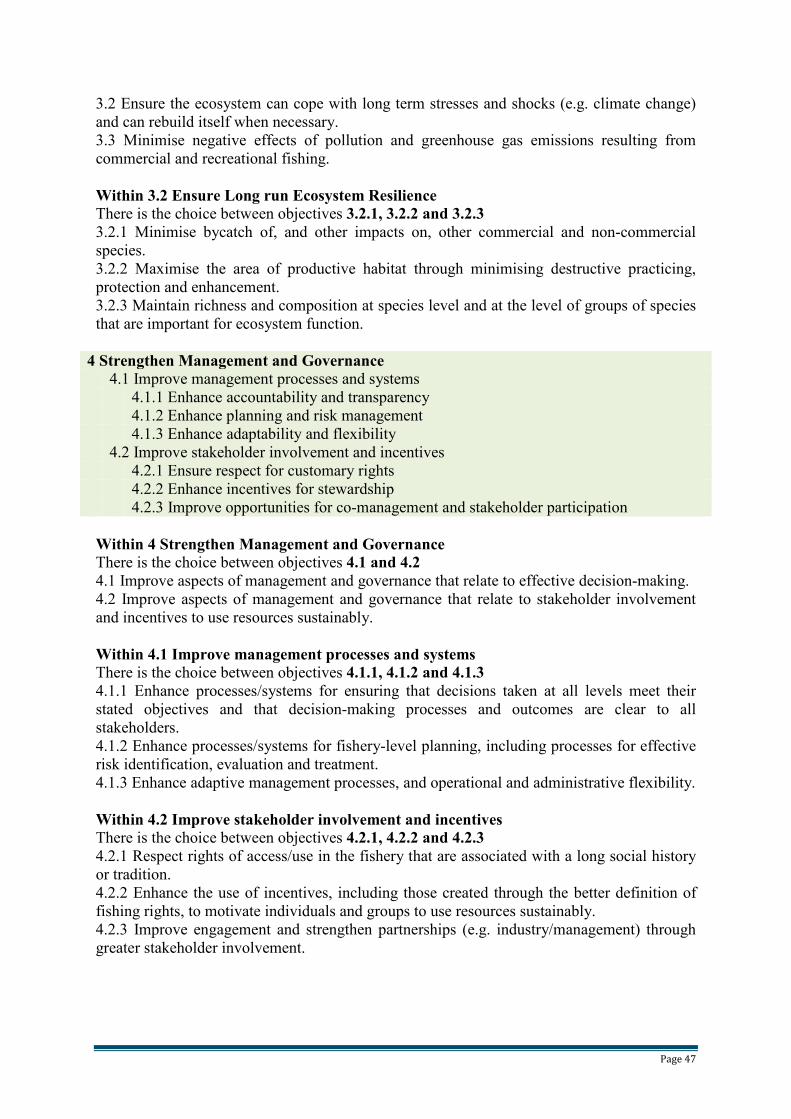
Page 47
3.2 Ensure the ecosystem can cope with long term stresses and shocks (e.g. climate change)
and can rebuild itself when necessary.
3.3 Minimise negative effects of pollution and greenhouse gas emissions resulting from
commercial and recreational fishing.
Within 3.2 Ensure Long run Ecosystem Resilience
There is the choice between objectives 3.2.1, 3.2.2 and 3.2.3
3.2.1 Minimise bycatch of, and other impacts on, other commercial and non-commercial
species.
3.2.2 Maximise the area of productive habitat through minimising destructive practicing,
protection and enhancement.
3.2.3 Maintain richness and composition at species level and at the level of groups of species
that are important for ecosystem function.
4 Strengthen Management and Governance
4.1 Improve management processes and systems
4.1.1 Enhance accountability and transparency
4.1.2 Enhance planning and risk management
4.1.3 Enhance adaptability and flexibility
4.2 Improve stakeholder involvement and incentives
4.2.1 Ensure respect for customary rights
4.2.2 Enhance incentives for stewardship
4.2.3 Improve opportunities for co-management and stakeholder participation
Within 4 Strengthen Management and Governance
There is the choice between objectives 4.1 and 4.2
4.1 Improve aspects of management and governance that relate to effective decision-making.
4.2 Improve aspects of management and governance that relate to stakeholder involvement
and incentives to use resources sustainably.
Within 4.1 Improve management processes and systems
There is the choice between objectives 4.1.1, 4.1.2 and 4.1.3
4.1.1 Enhance processes/systems for ensuring that decisions taken at all levels meet their
stated objectives and that decision-making processes and outcomes are clear to all
stakeholders.
4.1.2 Enhance processes/systems for fishery-level planning, including processes for effective
risk identification, evaluation and treatment.
4.1.3 Enhance adaptive management processes, and operational and administrative flexibility.
Within 4.2 Improve stakeholder involvement and incentives
There is the choice between objectives 4.2.1, 4.2.2 and 4.2.3
4.2.1 Respect rights of access/use in the fishery that are associated with a long social history
or tradition.
4.2.2 Enhance the use of incentives, including those created through the better definition of
fishing rights, to motivate individuals and groups to use resources sustainably.
4.2.3 Improve engagement and strengthen partnerships (e.g. industry/management) through
greater stakeholder involvement.
Related Documents