Identifying Customer Needs from User‐Generated Content by Artem Timoshenko and John R. Hauser June 2018 Forthcoming, Marketing Science Artem Timoshenko is a PhD student at the MIT Sloan School of Management, Massachusetts Institute of Technology, E62‐584, 77 Massachusetts Avenue, Cambridge, MA 02139, (617) 803‐5630, [email protected]. John R. Hauser is the Kirin Professor of Marketing, MIT Sloan School of Management, Massachusetts Institute of Technology, E62‐538, 77 Massachusetts Avenue, Cambridge, MA 02139, (617) 253‐2929, [email protected]. We thank John Mitchell, Steven Gaskin, Carmel Dibner, Andrea Ruttenberg, Patti Yanes, Kristyn Corrigan and Meaghan Foley for their help and support. We thank Regina Barzilay, Clarence Lee, Daria Dzyabura, Dean Eckles, Duncan Simester, Evgeny Pavlov, Guilherme Liberali, Theodoros Evgeniou, and Hema Yoganarasimhan for helpful comments and discussions. We thank Ken Deal and Ewa Nowakowska for suggestions on earlier versions of this paper. This paper has benefited from presentations at the 2016 Sawtooth Software Conference in Park City Utah, the MIT Marketing Group Seminar, the 39th ISMS Marketing Science Conference, and presentations at Applied Marketing Science, Inc. and Cornerstone Research, Inc. The applications in §6 were completed by Applied Marketing Science, Inc. Finally, we thank the anonymous reviewers and Associate Editor for constructive comments that enabled us to improve our research.

Welcome message from author
This document is posted to help you gain knowledge. Please leave a comment to let me know what you think about it! Share it to your friends and learn new things together.
Transcript

Identifying Customer Needs from User‐Generated Content
by
Artem Timoshenko
and
John R. Hauser
June 2018
Forthcoming, Marketing Science
Artem Timoshenko is a PhD student at the MIT Sloan School of Management, Massachusetts Institute of
Technology, E62‐584, 77 Massachusetts Avenue, Cambridge, MA 02139, (617) 803‐5630,
John R. Hauser is the Kirin Professor of Marketing, MIT Sloan School of Management, Massachusetts
Institute of Technology, E62‐538, 77 Massachusetts Avenue, Cambridge, MA 02139, (617) 253‐2929,
We thank John Mitchell, Steven Gaskin, Carmel Dibner, Andrea Ruttenberg, Patti Yanes, Kristyn Corrigan
and Meaghan Foley for their help and support. We thank Regina Barzilay, Clarence Lee, Daria Dzyabura,
Dean Eckles, Duncan Simester, Evgeny Pavlov, Guilherme Liberali, Theodoros Evgeniou, and Hema
Yoganarasimhan for helpful comments and discussions. We thank Ken Deal and Ewa Nowakowska for
suggestions on earlier versions of this paper. This paper has benefited from presentations at the 2016
Sawtooth Software Conference in Park City Utah, the MIT Marketing Group Seminar, the 39th ISMS
Marketing Science Conference, and presentations at Applied Marketing Science, Inc. and Cornerstone
Research, Inc. The applications in §6 were completed by Applied Marketing Science, Inc. Finally, we
thank the anonymous reviewers and Associate Editor for constructive comments that enabled us to
improve our research.
1
Identifying Customer Needs from User‐Generated Content
Abstract
Firms traditionally rely on interviews and focus groups to identify customer needs for marketing
strategy and product development. User‐generated content (UGC) is a promising alternative source for
identifying customer needs. However, established methods are neither efficient nor effective for large
UGC corpora because much content is non‐informative or repetitive. We propose a machine‐learning
approach to facilitate qualitative analysis by selecting content for efficient review. We use a
convolutional neural network to filter out non‐informative content and cluster dense sentence
embeddings to avoid sampling repetitive content. We further address two key questions: Are UGC‐
based customer needs comparable to interview‐based customer needs? Do the machine‐learning
methods improve customer‐need identification? These comparisons are enabled by a custom dataset of
customer needs for oral care products identified by professional analysts using industry‐standard
experiential interviews. The analysts also coded 12,000 UGC sentences to identify which previously
identified customer needs and/or new customer needs were articulated in each sentence. We show that
(1) UGC is at least as valuable as a source of customer needs for product development, likely more‐
valuable, than conventional methods, and (2) machine‐learning methods improve efficiency of
identifying customer needs from UGC (unique customer needs per unit of professional services cost).
Keywords: Voice of the Customer; Machine Learning, User‐generated Content; Customer Needs; Online
Reviews; Market Research; Text Mining; Deep Learning; Natural Language Processing

2
1. Introduction
Marketing practice requires a deep understanding of customer needs. In marketing strategy,
customer needs help segment the market, identify strategic dimensions for differentiation, and make
efficient channel management decisions. For example, Park, Jaworski, and MacInnis (1986) describe
examples of strategic positioning based on fulfilling customer needs: “attire for the conservative
professional” (Brooks Brothers) or “a world apart—let it express your world” (Lenox China). In product
development, customer needs identify new product opportunities (Herrmann, Huber, and Braunstein
2000), improve the design of new products (Krishnan and Ulrich 2001; Sullivan 1986; Ulrich and
Eppinger 2004), help manage product portfolios (Stone, et al. 2008), and improve existing products and
services (Matzler and Hinterhuber 1998). In marketing research, customer needs help to identify the
attributes used in the conjoint analysis (Orme 2006).
Understanding of customer needs is particularly important for product development (Kano, et al.
1984; Mikulić and Prebežac 2011). For example, consider the breakthrough laundry detergent, “Attack,”
developed by the Kao Group in Japan. Before Kao’s innovation, firms such as Procter & Gamble
competed in fulfilling the (primary) customer needs of excellent cleaning, ready to wear after washing,
value (quality and quantity per price), ease of use, smell good, good for me and the environment, and
personal satisfaction. New products developed formulations to compete on these identified primary
customer needs, e.g., the products that would clean better, smell better, be gentle for delicate fabrics,
and not harm the environment. The market was highly competitive; perceived value played a major role
in marketing and detergents were sold in large “high‐value” boxes. Kao Group was first to recognize that
Japanese customers wanted “a detergent that is easy to transport home by foot or bicycle,” “in a
container that fits in limited apartment space,” but “gets my clothes fresh and clean.” Guided by this
insight, Kao launched a highly‐concentrated detergent in an easy‐to‐store and easy‐to‐carry package.

3
Despite a premium price, Attack quickly commanded almost 50% of the Japanese laundry market (Kao
Group 2016). American firms soon introduced their own concentrated detergents, but by being the first
to identify an unfulfilled and previously unrecognized customer need, Kao gained a competitive edge.
There is an important distinction between customer needs and product attributes. A customer
need is an abstract context‐dependent statement describing the benefits, in the customer’s own words,
that the customer seeks to obtain from a product or service (Brown and Eisenhardt 1995; Griffin, et al.,
2009). Product attributes are the means to satisfying the customer needs. For example, when describing
their experience with mouthwashes, a customer might express the need “to know easily the amount of
mouthwash to use.” This customer need can be satisfied by various product attributes (solutions),
including ticks on the cap and textual or visual descriptions on the bottle.
To effectively capture rich information, customer needs are typically described with sentences or
phrases that describe in detail the benefits the customers wish to obtain from products. Complete
formulations communicate more precise messages compared to “bags of words,” such as developed by
latent Dirichlet allocation (LDA), word counts, or word co‐occurrence (e.g., Büschken and Allenby 2017;
Lee and Bradlow 2011; Netzer, et al. 2012; Schweidel and Moe 2014). For example, consider one “bag of
words” from Büschken and Allenby (2017):
“Real pizza:” pizza, crust, really, like, good, Chicago, Thin, Style, Best, One, Just, New, Pizzas, Great,
Italian, Little, York, Cheese, Place, Get, Know, Much, Beef, Lot, Sauce, Chain, Got, Flavor, Dish, Find
Word combinations give insight into dimensions of Italian restaurants—combinations that are
useful to generate attributes for conjoint analysis. However, for new product development, product‐
development teams want to know how the customers use these words in context. For example:
• Pizza arrives to the table at the right temperature (e.g., not too hot and not cold).
• Pizza that is cooked all the way through (i.e., not too doughy).
• Ingredients (e.g., sauce, cheese, etc.) are neither too light nor too heavy.
• Crust that is flavorful (e.g., sweet).

4
• Toppings stay on the pizza as I eat it.
Our paper focuses on the problem of identifying the customer needs. While relative importances
of customer needs are valuable to product‐development teams, methods such as conjoint analysis and
self‐explicated measures are well‐studied and in common use. We assume that preference measures are
used later in product development to decide among product concepts (Ulrich and Eppinger, 2016; Urban
and Hauser, 1993).
The identification of customer needs in context requires a deep understanding of a customer’s
experience. Traditional methods rely on human interactions with customers, such as experiential
interviews and focus groups. However, traditional methods are expensive and time‐consuming, often
resulting in delays in time to market. To avoid the expense and delays, some firms use heuristics, such as
managerial judgment or a review of web‐based product comparisons. However, such heuristic methods
often miss customer needs that are not fulfilled by any product that is now on the market.
User‐generated content (UGC), such as online reviews, social media, and blogs, provides extensive
rich textual data and is a promising source from which to identify customer needs more efficiently. UGC
is available quickly and at a low incremental cost to the firm. In many categories, UGC is extensive—for
example, there are over 300,000 reviews on health and personal care products on Amazon alone. If UGC
can be mined for customer needs, UGC has the potential to identify as many, or perhaps more,
customer needs than direct customer interviews and to do so more quickly with lower cost. UGC
provides additional advantages: (1) it is updated continuously enabling the firm to update its
understanding of customer needs and (2) unlike customer interviews, firms can return to UGC at low
cost to explore new insights further.
There are multiple concerns with identifying customer needs from UGC. First, the very scale of
UGC makes it difficult for human readers to process. We seek methods that scale well and, possibly,
make human readers more efficient. Second, much UGC is repetitive or not relevant. Sentences such as
5
“I highly recommend this product” do not express customer needs. Repetitive and irrelevant content
make a traditional manual analysis inefficient. Third, we expect, and our analysis confirms, that most of
UGC concentrates on a relatively few customer needs. Although such information might be useful, we
seek methods to efficiently search more broadly in order to obtain a reasonably complete set of
customer needs (within cost and feasibility constraints), including rarely mentioned customer needs.
Fourth, UGC data are unstructured and mostly text‐based. To identify abstract context‐dependent
customer needs, researchers need to understand rich meanings behind the words. Finally, unlike
traditional methods based on a representative sample of customers, customers self‐select to post UGC.
Self‐selection might cause analysts to miss important categories of customer needs.
Our primary goals in this paper are two‐fold. First, we examine whether a reasonable corpus of
UGC provides sufficient content to identify a reasonably complete set of customer needs. We construct
and analyze a custom dataset in which we persuaded a professional marketing consulting firm to
provide (a) customer needs identified from experiential interviews with a representative set of
customers and (b) a complete coding of a sample of sentences from Amazon reviews in the oral‐care
category. Second, we develop and evaluate a machine‐learning hybrid approach to identify customer
needs from UGC. We use machine learning to identify relevant content and remove redundancy from a
large UGC corpus, and then rely on human judgment to formulate customer needs from selected
content. We draw on recent research in deep learning, in particular, convolutional neural networks
(CNN; Collobert, et al. 2011; Kim 2014) and dense word and sentence embeddings (Mikolov, et al.
2013a; Socher, et al. 2013). The CNN filters out non‐informative content from a large UGC corpus. Dense
word and sentence embeddings embed semantic content in a real‐valued vector space. We use
sentence embeddings to sample a diverse set of non‐redundant sentences for manual review. Both the
CNN and word and sentence embeddings scale to large datasets. Manual review by professional analysts
remains necessary in the last step because of the context‐dependent nature of customer needs.

6
We evaluate UGC as a source of customer needs in terms of the number and variety of customer
needs identified in a feasible corpus. We then evaluate the efficiency improvements achieved by the
machine learning methods in terms of the expected number of unique customer needs identified per
unit of professional services costs. Professional services costs, or the billing rates of experienced
professionals, are the dominant costs in industry for identifying customer needs. Our comparisons
suggest that, if we limit costs to that required to review experiential interviews, then UGC provides a
comparable set of customer needs to those obtained from experiential interviews. Despite the potential
for self‐selection, UGC does at least as well (in the tested category) as traditional methods based on a
representative set of customers. When we relax the professional services constraint for reviewing
sentences, but maintain professional services costs to be less than would be required to interview and
review, then UGC is a better source of customer needs. We further demonstrate that machine learning
helps to eliminate irrelevant and redundant content and, hence, makes professional services
investments more efficient. By selecting a more‐efficient content for review, machine learning increases
a probability of identifying low‐frequency customer needs. UGC‐based analyses reduce research time
substantially avoiding delays in time‐to‐market.
2. Related Research
2.1. Traditional Methods to Identify Customer Needs (and Link Needs to Product Attributes)
Given a set of customer needs, product‐development teams use a variety of methods, such as
quality function deployment, to identify customer solutions or product attributes that address customer
needs (Akao 2004; Hauser and Clausing 1988; Sullivan 1986). For example, Chan and Wu (2002) review
650 research articles that develop, refine, and apply QFD to map customer needs to solutions. Zahay,
Griffin, and Fredericks (2004) review the use of customer needs in the “fuzzy front end,” product design,
product testing, and product launch. Customer needs can also be used to identify attributes for conjoint

7
analysis (Green and Srinivasan 1978; Orme 2006). Kim, et al. (2017) propose a benefit‐based conjoint‐
analysis model which maps product attributes to latent customer needs before estimation.
Researchers in marketing and engineering have developed and refined many methods to elicit
customer needs directly from customers. The most common methods rely on focus groups, experiential
interviews, or ethnography as input. Trained professional analysts then review the input, manually
identify customer needs, remove redundancy, and structure the customer needs (Alam and Perry 2002;
Goffin, et al. 2012; Kaulio 1998). Some researchers augment interviews with structured methods such as
repertory grids (Wu and Shich 2010).
Typically, customer‐need identification begins with 20‐30 qualitative experiential interviews.
Multiple analysts review transcripts, highlight customer needs, and remove redundancy (“winnowing”)
to produce a basic set of approximately 100 abstract context‐dependent customer‐need statements.
Affinity groups or clustered customer‐card sorts then provide structure for the customer needs, often in
the form of a hierarchy of primary, secondary, and tertiary customer needs (Griffin and Hauser 1993;
Jiao and Chen 2006). Together, identification and structuring of customer needs are often called voice‐
of‐the‐customer (VOC) methods. Recently, researchers have sought to explore new sources of customer
needs to supplement or replace common methods. For example, Schaffhausen and Kowalewski (2015;
2016) proposed using a web interface to ask customers to enter customer needs and stories directly.
They then rely on human judgment to structure the customer needs and remove redundancy.
2.2. UGC Text Analysis in Marketing and Product Development
Researchers in marketing have developed a variety of methods to mine unstructured textual data
to address managerial questions. See reviews in Büschken and Allenby (2016) and Fader and Winer
(2012). The research closest to our goals uses word co‐occurrences and variations of LDA to identify
word groupings in product discussions (Archak, Ghose, and Ipeirotis 2016; Büschken and Allenby 2006;
Lee and Bradlow 2011; Tirunillai and Tellis 2014; Netzer, et al. 2012). Some researchers analyze these
8
word groupings further by linking them to sales, sentiment, or movie ratings (Archak, Ghose and
Ipeirotis 2016; Schweidel and Moe 2014; Ying, Feinberg, and Wedel 2006). The latter two papers deal
explicitly with self‐selection or missing ratings by analyzing UGC from the same person over different
movies or from multiple sources such as different venues. We address the self‐selection concern by
comparing customer needs identified from UGC to the customer needs identified from the interviews
with a representative sample of customers. We assume that researchers can rely on standard methods
to map customer needs to the outcome measures such as preferences for product concepts in each
customer segment (Griffin and Hauser 1993; Orme 2006).
In engineering, the product attribute elicitation literature is closest to the goals of our paper,
although the focus is primarily on physical attributes rather than more‐abstract context‐dependent
customer needs. Jin, et al. (2015) and Peng, Sun, and Revankar (2012) propose automated methods to
identify engineering characteristics. These papers focus on particular parts of speech or manually
identified word combinations and use clustering techniques or LDA to identify product attributes and
levels to be considered in product development. Kuehl (2016) proposes identifying intangible attributes
together with physical product attributes with supervised classification techniques. Our methods
augment the literatures in both marketing and engineering by focusing on the more‐context‐dependent,
deeper‐semantic nature of customer needs.
2.3. Deep Learning for Natural Language Processing
We draw on two literatures from natural language processing (NLP): convolutional neural
networks (CNNs) and dense word and sentence representations. A CNN is a supervised prediction
technique which is particularly suited to computer vision and natural language processing tasks. A CNN
often contains multiple layers which transform numerical representations of sentences to create input
for a final logit‐based layer, which makes the final classification. CNNs demonstrate state‐of‐the‐art
performance with minimum tuning in such problems as relation extraction (Nguyen and Grishman
9
2015), named entity recognition (Chiu and Nichols 2016), and sentiment analysis (dos Santos and Gatti
2014). We demonstrate that, on our data, CNNs do at least as well as a support‐vector machine (SVM), a
multichannel CNN (Kim 2014), and a Recurrent Neural Network with Long Short‐Term Memory cells
(LSTM; Hochreiter and Schmidhuber 1997).
Dense word and sentence embeddings are real‐valued vector mappings (typically 20‐300
dimensions), which are trained such that vectors for similar words (or sentences) are close in the vector
space. The theory of dense embeddings is based on the Distributional Hypothesis, which states that
words that appear in a similar context share semantic meaning (Harris 1954). High‐quality word and
sentence embeddings can be used as an input for downstream NLP applications and models (Lample, et
al. 2016; Kim 2014). Somewhat unexpectedly, high‐quality word embeddings capture not only semantic
similarity, but also semantic relationships (Mikolov, et al. 2013b). Using the convention of bold type for
vectors, then if ′word is the word embedding for ‘word,’ Mikolov et al. (2013b) demonstrate that
word embeddings trained on the Google News Corpus have the following properties:
king man woman queen
walking swimming swam walked
Paris France Italy Rome
We train word embeddings using a large unlabeled corpus of online reviews. We then apply the trained
word embeddings (1) to enhance the performance of the CNN and (2) to avoid repetitiveness among the
sentences selected for manual review.
3. A Proposed Machine Learning Hybrid Method to Identify Customer Needs
We propose a method that uses machine learning to screen UGC for sentences rich in a diverse
set of context‐dependent customer needs. Identified sentences are then reviewed by professional
analysts to formulate customer needs. Machine‐human hybrids have proven effective in a broad set of

10
applications. For example, Qian, et al. (2001) combine machine learning and human judgment to locate
research when authors’ names are ambiguous (e.g., there are 117 authors with the name Lei Zhang).
Supervised learning identifies clusters of similar publications and human readers associate authors with
the clusters. The resulting hybrid is more accurate than machine learning alone and more efficient than
human classification. Colson (2016) describes Stitch Fix’s machine‐human hybrid in which machine
learning helps create a short list of apparel from vast catalogues, then human curators make the final
recommendations to consumers.
Figure 1 summarizes our approach. The proposed method consists of five stages:
1. Preprocess UGC. We harvest readily available UGC from either public sources or propriety
company databases. We split UGC into sentences, eliminate stop‐words, numbers, and
punctuation, and concatenate frequent combinations of words.
2. Train Word Embeddings. We train word embeddings using a skip‐gram model (§3.2) on
preprocessed UGC sentences, and use word embeddings as an input in the following stages.
3. Identify Informative Content. We label a small set of sentences into informative/non‐informative,
and then train and apply a CNN to filter out non‐informative sentences from the rest of the
corpus. Without the CNN, human readers would sample content randomly and likely review many
uninformative sentences.
4. Sample Diverse Content. We cluster sentence embeddings and sample sentences from different
clusters to select a set of sentences likely to represent diverse customer needs. This step is
designed to identify customer needs that are different from one another so that (1) the process is
more efficient and (2) hard‐to‐identify customer needs are less likely to be missed.
5. Manually Extract Customer Needs. Professional analysts review the diverse, informative
sentences to identify customer needs. The customer needs are then used to identify new
opportunities for product development.

11
Figure A1 in the Appendix illustrates each of the four steps with an example drawn for
one product review. Our architecture achieves the same goals as voice‐of‐the‐customer
approaches in industry (§2.1). The preprocessed UGC replaces experiential interviews, the
automated sampling of informative sentences is analogous to manual highlighting of
informative content, and the clustering of word embeddings is analogous to manual
winnowing to identify as many distinct customer needs as feasible. Methods to identify a
hierarchical structure of customer needs and/or methods to measure the tradeoffs
(preferences) among customer needs, if required, can be applied equally well to customer
needs generated from UGC or from experiential interviews.
Figure 1 System Architecture for Identifying Customer Needs from UGC
3.1. Stage 1: Preprocessing Raw UGC
Prior experience in the manual review of UGC by professional analysts suggests that sentences are
most likely to contain customer needs and are a natural unit by which analysts process experiential
Preprocess UGC
Sample Diverse Content
Identify Informative Content
Train Word Embeddings
1. Split UGC into sentences2. Remove stop‐words, punctuation, etc.3. Identify frequent combinations of words
1. Estimate word embeddings on a large UGC corpus (skip‐gram model)
1. Label a small sample of sentences into informative/non‐informative
2. Train a machine learning classifier (CNN)3. Identify informative content in the rest of the corpus
Manually Extract Customer Needs
1. Average word embeddings to create sentence embeddings
2. Cluster sentence embeddings using Ward’s algorithm3. Sample one sentence from each of Y clusters
1. Review the Y selected sentences and formulate customer needs

12
interviews and UGC. We preprocess raw UGC to transform the UGC corpus into a set of sentences using
an unsupervised sentence tokenizer from the natural language toolkit (Kiss and Strunk 2006). We
automatically eliminate stop‐words (e.g., ‘the’ and ‘and’) and non‐alphanumeric symbols (e.g., question
marks and apostrophes), and transform numbers into number signs and letters to lower case.
We join words that appear frequently together with the ‘_’ character. For example, in oral care,
the bigram ‘Oral B’ is treated as a combined word pair, ’oral_b.’ We join words ‘a’ and ‘b’ into a single
phrase if they appear together relatively often in the corpus. The specific criterion is:
,⋅
⋅
where is the total vocabulary size. The tuning parameter, , prevents concatenating very infrequent
words, and the tuning parameter, , is balanced so that the number of bigrams is not too few or too
many for the corpus. Both parameters are set by judgment. For our initial test, we set , 5,10 .
We drop sentences that are less than four words or longer than fourteen words after preprocessing. The
bounds are selected to drop approximately 10% of the shortest and 10% of the longest sentences. (Long
sentences are usually an artifact of missing punctuation. In our case, the dropped sentences were
subsequently verified to contain no customer needs that were not otherwise identified.)
As is typical in machine learning systems, our model has multiple tuning parameters. We indicate
which are set by judgment and which are set by cross‐validation. When we set tuning parameters by
judgment, we draw on the literature for suggestions and we choose parameters likely to work in many
categories. When there is sufficient data, these parameters can also be set by cross‐validation.
3.2. Stage 2: Training Word Embeddings with a Skip‐Gram Model
Word embeddings are the mappings of words onto a numerical vector space, which incorporate
contextual information about words and serve as an input to Stages 3 and 4 (Baroni, Dinu, and
Kruszewski, 2014). To account for product‐category and UGC‐source‐specific words, we train our word

13
embeddings on the preprocessed UGC corpus using a skip‐gram model (Mikolov, et al. 2013a). The skip‐
gram model is a predictive model which maximizes the average log‐likelihood of words appearing
together in a sequence of words. Specifically, if is the number of words in the corpus, is the set of
all feasible words in the vocabulary, and are d‐dimensional real‐vector word embeddings, we select
the to maximize:
1
∑ | |
To make calculations feasible, we use ten‐word negative sampling to approximate the denominator in
the conditional probability function. (See Mikolov, et al. 2013b for details on negative sampling.) For our
application, we use 20 and 5.
The trained word embeddings in our application capture semantic meaning in oral care. For
example, the three words closest to ‘toothbrush’ are ‘pulsonic’, ‘sonicare’ and ‘tb’, with the last being a
commonly‐used abbreviation for toothbrush. Similarly, variations in spelling such as ‘recommend’,
‘would_recommend’, ‘highly_recommend’, ‘reccommend’, and ‘recommed’ are close in the vector
space.
3.3. Stage 3: Identifying Informative Sentences with a Convolutional Neural Network (CNN)
Depending on the corpus, UGC can contain substantial amounts of content that does not
represent customer needs. Such non‐informative content includes evaluations, complaints, and non‐
informative lists of features such as “This product can be found at CVS.” or “It really does come down to
personal preference.” Informative content might include: “This product can make your teeth super‐
sensitive.” or “The product is too heavy and it is difficult to clean.” Machine learning improves the
efficiency of manual review by eliminating non‐informative content. For example, suppose that only
14
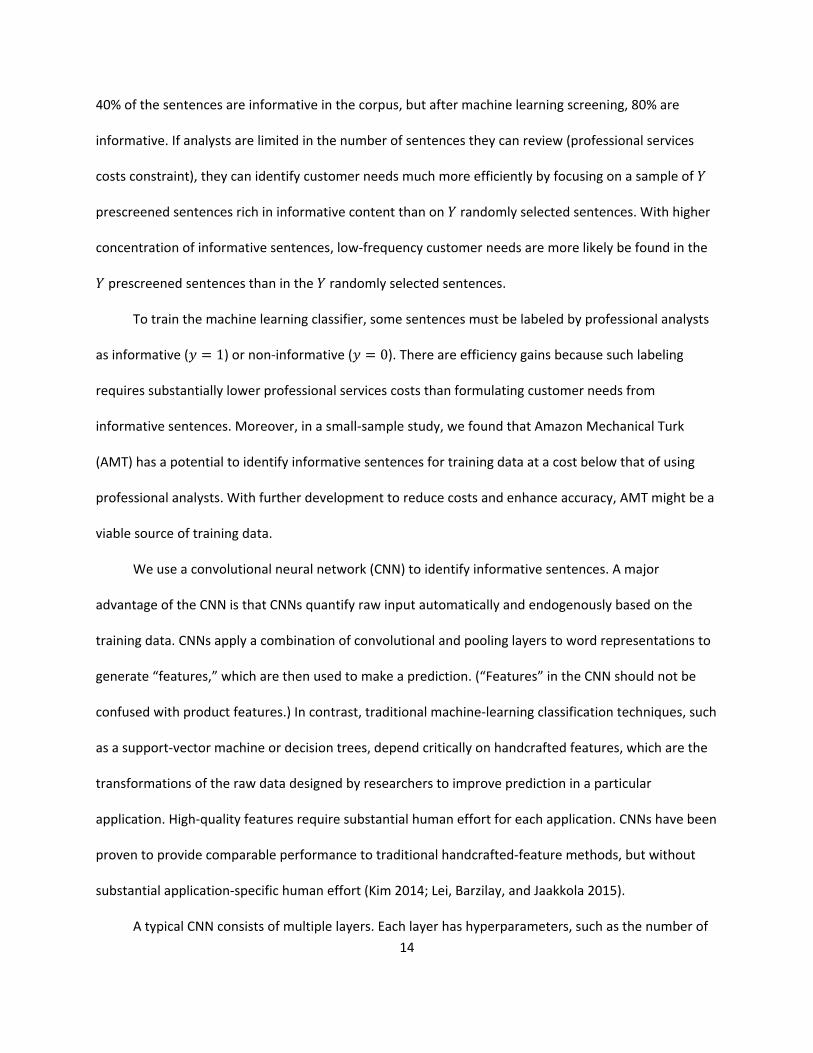
40% of the sentences are informative in the corpus, but after machine learning screening, 80% are
informative. If analysts are limited in the number of sentences they can review (professional services
costs constraint), they can identify customer needs much more efficiently by focusing on a sample of
prescreened sentences rich in informative content than on randomly selected sentences. With higher
concentration of informative sentences, low‐frequency customer needs are more likely be found in the
prescreened sentences than in the randomly selected sentences.
To train the machine learning classifier, some sentences must be labeled by professional analysts
as informative ( 1) or non‐informative ( 0). There are efficiency gains because such labeling
requires substantially lower professional services costs than formulating customer needs from
informative sentences. Moreover, in a small‐sample study, we found that Amazon Mechanical Turk
(AMT) has a potential to identify informative sentences for training data at a cost below that of using
professional analysts. With further development to reduce costs and enhance accuracy, AMT might be a
viable source of training data.
We use a convolutional neural network (CNN) to identify informative sentences. A major
advantage of the CNN is that CNNs quantify raw input automatically and endogenously based on the
training data. CNNs apply a combination of convolutional and pooling layers to word representations to
generate “features,” which are then used to make a prediction. (“Features” in the CNN should not be
confused with product features.) In contrast, traditional machine‐learning classification techniques, such
as a support‐vector machine or decision trees, depend critically on handcrafted features, which are the
transformations of the raw data designed by researchers to improve prediction in a particular
application. High‐quality features require substantial human effort for each application. CNNs have been
proven to provide comparable performance to traditional handcrafted‐feature methods, but without
substantial application‐specific human effort (Kim 2014; Lei, Barzilay, and Jaakkola 2015).
A typical CNN consists of multiple layers. Each layer has hyperparameters, such as the number of

15
filters and the size of the filters. We custom select these hyperparameters, and the number and type of
layers, by cross‐validation. Each layer also has numerical parameters, such as the parameters of the
filters used in the convolutional layers. These parameters are calibrated during training. We train the
CNN by selecting the parameter values that maximize the CNN’s ability to label sentences as informative
vs. non‐informative.
Figure 2 illustrates the architecture of the CNN in our application. We stack a convolutional layer,
a pooling layer, and a softmax layer. This specification modifies Kim’s (2014) architecture for sentence
classification task to account for the amount of training data available in customer‐need applications.
Figure 2 Convolutional Neural Network Architecture for Sentence Classification
3.3.1. Numerical Representations of Words for Use in the CNN
For every word in the text corpus, the CNN stores a numerical representation of the word.
Numerical representations of words are the real vector parameters of the model which are calibrated to
improve prediction. To facilitate training of the CNN, we initialize representations with word
embeddings from Stage 2. However, we allow the CNN to update the numerical representations to
enhance predictive ability (Lample, et al. 2016). In our application, this flexibility enhances out‐of‐
sample accuracy of prediction.
The CNN quantifies sentences by concatenating word embeddings. If is the word embedding
for the word in the sentence, then the sentence is represented by a vector

16
, … , ∈
where is the number of words in the sentence and 20 is the dimensionality of the word
embeddings.
3.3.2. Convolutional Layer
Convolutional layers create multiple feature maps by applying convolutional operations with
varying filters to the sentence representation. A filter is a real‐valued vector, ∈ , where is a
size of the filter. Filters are applied to different parts of the vector to create feature maps ( ):
, … ,
⋅ :
where indexes the feature maps, σ ⋅ is a non‐linear activation function where max 0, ,
∈ is an intercept, and : is a concatenation of representations of words to 1 in the
sentence:
: , … ,
We consider filters of the size ∈ 3, 4, 5 , and use three filters of each size. The number of
filters and their size are selected to maximize prediction on the validation set. The numerical values for
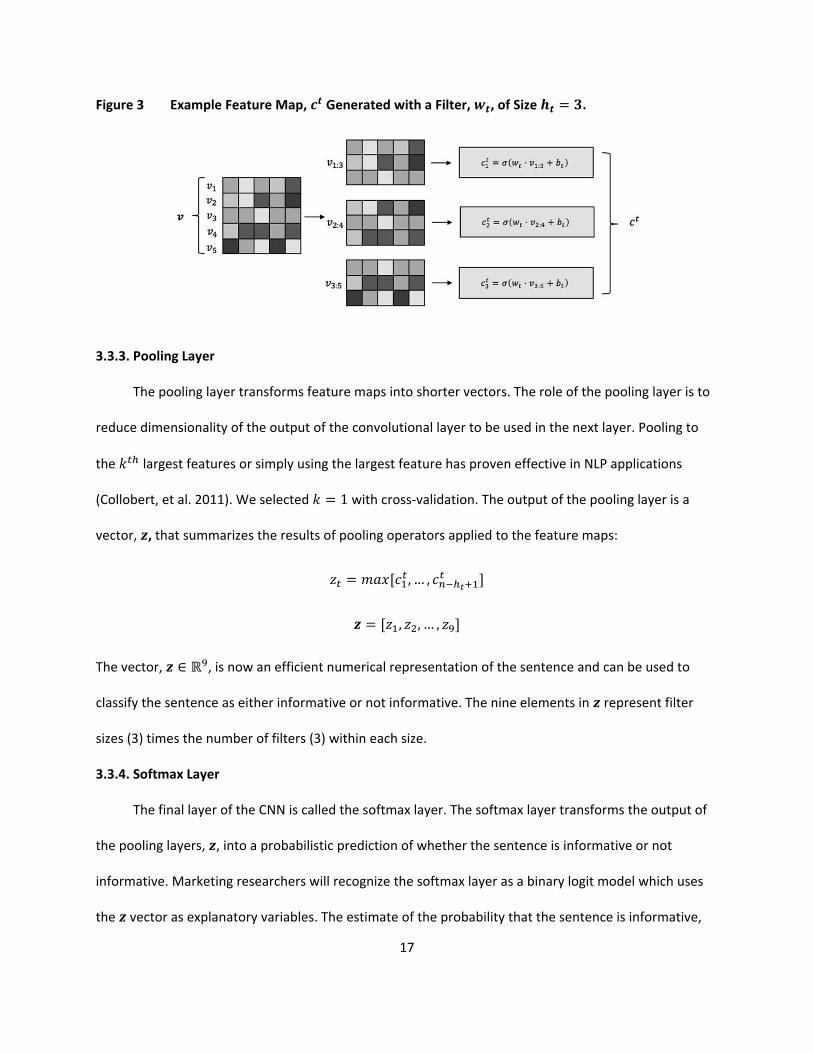
filters, , and intercepts, , are calibrated when the CNN is trained. As an illustration, Figure 3 shows
how a feature map is generated with a filter of size, 3. On the left is a sentence, , consisting of
five words. Each word is a 20‐dimenional vector (only 5 dimensions are shown). Sentence is split into
triplets of words as shown in the middle. Representations of word triplets are then transformed to the
real‐valued ’s in the next column. The feature map, , is the vector of these values. Processing
sentences in this way allows the CNN to interpret words that are next to one another in a sentence
together.
17
Figure 3 Example Feature Map, Generated with a Filter, , of Size .
3.3.3. Pooling Layer
The pooling layer transforms feature maps into shorter vectors. The role of the pooling layer is to
reduce dimensionality of the output of the convolutional layer to be used in the next layer. Pooling to
the largest features or simply using the largest feature has proven effective in NLP applications
(Collobert, et al. 2011). We selected 1 with cross‐validation. The output of the pooling layer is a
vector, , that summarizes the results of pooling operators applied to the feature maps:
, … ,
, , … ,
The vector, ∈ , is now an efficient numerical representation of the sentence and can be used to
classify the sentence as either informative or not informative. The nine elements in represent filter
sizes (3) times the number of filters (3) within each size.
3.3.4. Softmax Layer
The final layer of the CNN is called the softmax layer. The softmax layer transforms the output of
the pooling layers, , into a probabilistic prediction of whether the sentence is informative or not
informative. Marketing researchers will recognize the softmax layer as a binary logit model which uses
the vector as explanatory variables. The estimate of the probability that the sentence is informative,
18
1| , is given by:
1|1
1
The parameters of the logit model, , are determined when the CNN is trained. In our application, we
declare a sentence to be informative if 1| 0.5, although other criteria could be used and
tuned to a target tradeoff.
3.3.5. Calibration of the Parameters of the CNN
For our application, we calibrate the nine filters, ∈ , and the nine intercepts, , in the
convolutional layer, and the vector in the softmax layer. In addition, we fine tune the word
embeddings, , to enhance the ability of the CNN’s predictions (e.g., Kim 2014). We calibrate all
parameters simultaneously by minimizing the cross‐entropy error on the training set of professionally
labeled sentences ( is a concatenation of the ’s):
, , , , , , , , ,
, , , 1
1 1
is the size of the training set, are the manually assigned labels, and are the predictions of the
CNN. The parameter, , enables the user to weight false negatives more (or less), than false positives.
We initially set 1 so that identifying informative sentences and eliminating non‐informative
sentences are weighed equally, but we also examine asymmetric costs ( 1) in which we place more
weight on identifying informative sentences than eliminating uninformative sentences.
We solved the optimization problem iteratively with the RMSProp optimizer on mini‐batches of
size 32 and a drop rate of 0.3. Optimization terminated when the cross‐entropy error on the validation
set did not decrease over five consecutive iterations. See Tieleman and Hinton (2012) for details and
definitions of terms such as “drop rate.”
19
3.3.6. Evaluating the Performance of the CNN
We evaluate the quality of the CNN classifier using an score (Wilson, Wiebe, and Hoffmann
2005):
∙
whereprecision is the share of informative sentences among the sentences identified as informative
and recall is the share of informative sentences correctly identified by the classifier. Accuracy, when
reported, is the percent of classifications that were correct.
3.4. Stage 4: Clustering Sentence Embeddings and Sampling to Reduce Redundancy
UGC is repetitive and often focuses on a small set of customer needs. Consider the following
sentences:
“When I am done, my teeth do feel `squeaky clean.’"
“Every time I use the product, my teeth and gums feel professionally cleaned.”
“I am still shocked at how clean my teeth feel.”
These three sentences are different articulations of a customer need that could be summarized as
“My mouth feels clean.” Manual review of such repetitive content is inefficient. Moreover,
repetitiveness makes the manual review onerous and boring for professional analysts, causing analysts
to miss excitement customer needs that are mentioned rarely. If the analysts miss excitement customer
needs, then the firm misses valuable new product opportunities and/or strategic positionings. To avoid
repetitiveness, we seek to “span the set” of customer needs. We construct sentence embeddings which
encode semantic relationships between sentences, and use sentence embeddings to reduce redundancy
by sampling content for manual review from maximally different parts of the space of sentence
embeddings.
Researchers often create sentence embeddings by taking a simple average of word embeddings
corresponding to the words in the sentence (Iyyer et al., 2015), explicitly modeling semantic and
20
syntactic structure of the sentences with neural methods (Tai, Socher and Manning 2015), or training
sentence embeddings together with word embeddings (Le and Mikolov, 2014). Because averaging
demonstrates similar performance to other methods and is both scalable and transferable (Iyyer et al.,
2015), we use averaging in our application.
Being the average of word embeddings, sentence embeddings represent semantic similarity
among sentences. For example, the three similar sentences mentioned above have sentence
embeddings that are reasonably close to one another in the sentence‐embedding vector space. Using
this property, we group sentences into clusters. We choose Ward’s hierarchical clustering method
because it is commonly used in VOC studies (Griffin and Hauser 1993), and other areas of marketing
research (Dolnicar 2003). To identify Y sentences for professional analysts to review, we sample one
sentence randomly from each of Y clusters. If the clustering worked perfectly, sentences within each of
the clusters would articulate the same customer need, and each of the clusters would produce a
sentence that an analyst would recognize as a distinct customer need. In real data, redundancy remains,
but, hopefully less redundancy than that which would be present in randomly sampled sentences.
3.5. Stage 5: Manually Extracting Customer Needs
To achieve high relevancy in formulating abstract context‐dependent customer needs, the final
extraction of customer needs is best done by trained analysts. We evaluate in §5 whether manual
extraction becomes more efficient using informative, diverse sentences identified with the CNN and
sentence‐embedding clusters.
4. Evaluation of UGC’s Potential in the Oral‐Care Product Category
We use empirical data to examine two questions. (§4) Does UGC contain sufficient raw material
from which to identify a broad set of customer needs? And (§5) Do each of the machine‐learning steps
enhance efficiency? We address both questions with a custom dataset in the oral‐care category. We
selected oral care because oral‐care customer needs are sufficiently varied, but not so numerous as to

21
overcomplicate comparisons. As a proof‐of‐concept test, our analyses establish a key example. We
discuss applications in other categories in §6.
4.1. Baseline Comparison: Experiential Interviews in Oral Care
We obtained a detailed set of customer needs from an oral‐care voice‐of‐the‐customer (VOC)
analysis that was undertaken by a professional market research consulting firm. The firm has almost
thirty years of VOC experience spanning hundreds of successful product‐development applications
across a wide‐variety of industries. The oral‐care VOC provided valuable insights to the client and led to
successful new products. The VOC was based on standard methods: experiential interviews, with
transcripts highlighted by experienced analysts aided by the firm’s proprietary software. After
winnowing, customer needs were structured by a customer‐based affinity group. The output is 86
customer needs structured into six primary and 22 secondary need groups. An appendix lists the primary
and secondary need groups and provides an example of a tertiary need from each secondary‐need
group. Examples of customer needs include: “Oral care products that do not create any odd sensations
in my mouth while using them (e.g. tingling, burning, etc.)” or “My teeth feel smooth when I glide my
tongue over them.” Such customer needs are more than their component words; they describe a
desired outcome in the language that the customer uses to describe the desired outcome.
The underlying experiential interview transcripts were based on a representative sample of oral
care customers and were not subject to self‐selection biases. If UGC can identify a set of customer needs
that is comparable to the benchmark, then we have initial evidence in at least one product category that
UGC self‐selection does not undermine the basic goals of finding a reasonably complete set of customer
needs.
Professional analysts estimate that the professional‐service costs necessary to review, highlight,
and winnow customer needs from experiential‐interview transcripts is slightly more than the
professional services costs required to review 8,000 UGC sentences to identify customer needs. The

22
professional services costs required to review, highlight, and winnow customer needs is about 40%‐55%
of the professional services costs required to schedule and interview customers. At this rate,
professional analysts could review approximately 22,000 to 28,000 UGC sentences using the methods
and professional services costs involved in a typical VOC study.
4.2. Fully‐Coded UGC Data from the Oral‐Care Category
To compare UGC to experiential interviews and evaluate a proposed machine learning method,
we needed a fully‐coded sample of a UGC corpus. In particular, we needed to know and classify every
customer need in every sentence in the UGC sample. We received in‐kind support from professional
analysts to generate a custom dataset to evaluate UGC and the machine‐learning efficiencies. The in‐
kind support was approximately that which the firm would have allocated to a typical VOC study—a
substantial time‐and‐cost commitment from the firm.
From the 115,099 oral‐care reviews on Amazon spanning the period from 1996 to 2014, we
randomly sampled 12,000 sentences split into an initial set of 8,000 sentences and a second set of 4,000
sentences (McAuley, et. al. 2015). To maintain a common level of training and experience for reviewing
UGC and experiential interview transcripts, the sentences were reviewed by a group of three
experienced analysts from the same firm that provided the interview‐based VOC. These analysts were
not involved in the initial interview‐based VOC. Using a team of analysts is recommended by Griffin and
Hauser (1993, p. 11).
We chose 8,000 sentences for our primary evaluation because the professional services costs to
review 8,000 sentences are comparable, albeit slightly less than, the professional services costs to
review a typical set of experiential‐interview transcripts. For these sentences, the analysts fully coded
every sentence to determine whether it contained a customer need and, if so, whether the customer
need could be mapped to a customer need identified by the VOC, or whether the customer need was a

23
newly identified customer need. Matching needs from the UGC to the interview‐based needs is fuzzy.
For example, the three sentences that were mapped to “My mouth feels clean.” were judged by the
analysts to articulate that customer need even though the wording was not exact (§3.4).
In addition to the fully‐coded 8,000 sentences, we were able to persuade the analysts to examine
an additional 4,000 sentences to focus on any customer needs that were identified by the traditional
VOC, but not identified from the UGC. This second dataset enables us to address whether there exist
customer needs that are not in UGC per se, or whether the customer needs are sufficiently rare that
more than 8,000 sentences are required to identify them. Finally, to assess coding reliability, we asked
another analyst, blind to the prior coding, to recode 200 sentences using two different task descriptions.
4.3. Descriptive Statistics and Comparisons
Using Amazon reviews, the three human coders determined that 52% of the 8,000 sentences
contained at least one customer need and 9.2% of the sentences contained two or more customer
needs. However, the corpus was highly repetitive; 10% of the most frequent customer needs were
articulated in 54% of the informative sentences. On the other hand, 17 customer needs were articulated
no more than 5 times in the corpus of 8,000 sentences.
We consider first the 8,000 sentences—in this scenario analysts allocate at most as much time
coding UGC as they would have allocated to review experiential interview transcripts. This section
addresses the potential of the UGC corpus, hence, for this section, we do not yet exploit machine‐
learning efficiencies. From the 8,000 sentences, analysts identified 74 of the 86 tertiary experiential‐
interview‐based customer needs, but also identified an additional 8 needs.
We now consider the set of 4,000 sentences as a supplement to the fully‐coded 8,000
sentences—in this scenario analysts still allocate substantially less time than they would to interview
customers and review transcripts. From the second set of 4,000 sentences, the analysts identified 9 of
12 missing customer needs. With 12,000 sentences, that brings the total to 83 of the 86 experiential‐

24
interview‐based customer needs and 91 of the 94 total needs (97%). In the second set of 4,000
sentences, the analysts did not try to identify any customer needs other than the 12 missing needs. Had
we had the resources to do so, we would likely have increased the number of UGC‐based incremental
customer needs. Overall, analysts identified 91 customer needs from UGC and 86 customer needs from
experiential interviews. These results are summarized in Figure 4. At least in oral care, analyzing UGC
has the potential to identify at least as many, possibly more, customer needs at a lower overall cost of
professional services, even without machine‐learning efficiencies. Furthermore, because the
experiential‐interview benchmark is drawn from a representative sample of consumers, the potential for
self‐selection in UGC oral‐care postings does not seem to impair the breadth of customer needs
contained in UGC sentences. We cannot rule out self‐selection issues for other product categories.
When self‐selection is feared, we recommend analyses that build on multiple sources such as the
methods developed by Schweidel and Moe (2014).
Figure 4. Comparison of Customer Needs Obtained from Experiential Interviews with
Customer Needs Obtained from an Exhaustive Review of a UGC Sample
Whether or not customer needs are based on interviews or UGC, the final identification of customer
needs is based on imperfect human judgment. We asked an analyst, blind to the prior coding, to
evaluate 200 sentences using two different approaches. For the first evaluation, the analyst (1) explicitly
formulated customer needs from each sentence, (2) winnowed the customer needs to remove
duplicates, (3) matched the identified customer needs to the interview‐based hierarchy, (4) added new

25
needs to the hierarchy if necessary, and (5) mapped each of the 200 sentences to the customer needs.
For the second evaluation, the analyst followed the same procedures that produced Figure 4. These two
evaluations were conducted two weeks apart.
We compare the codes produced by the additional analyst versus the codes produced by the
three analysts. Inter‐task accuracy (first vs. second evaluation by the new analyst) was 80%, which is
better than the inter‐coder accuracy (new analyst vs. previous analysts) of 70%. The additional analyst
identified 71.4% of the customer needs that were previously identified by the three analysts. The
additional analyst’s hit rate compares favorably to Griffin and Hauser (1993, p. 8) who report that their
individual analysts identified 45‐68% of the needs, where the universe was all customer needs identified
by the seven analysts who coded their data. This evidence suggests that Figure 4 is a conservative
estimate of the potential of the UGC as a source of customer needs.
4.4. Prioritization of Customer Needs
To address whether the eight incremental UGC customer needs and/or the three incremental
experiential‐interview customer needs were important, we conducted a prioritization survey. We
randomly selected 197 customers from a professional panel (PureSpectrum), screened for interest in
oral care, and asked customers to rate the importance of each tertiary customer need on a 0‐to‐100
scale. Customers also rated whether they felt that their current oral‐care products performed well on
these customer needs on a 0‐to‐10 scale. Such measures are used commonly in VOC studies and have
proven to provide valuable insights for product development. (Review citations in §2.1.)
Table 1 summarizes the survey results. On average, the customer needs identified in both the
interviews and UGC are the most important customer needs. Those that are unique to UGC or unique to
experiential interviews are of lower importance and performance. We gain further insight by
categorizing the customer needs into quadrants via median splits. High‐importance‐low‐performance
customer needs are almost perfectly identified by both data sources. Such customer needs provide
insight for product improvement.

26
Table 1. Importance and Performance Scores for Customer Needs Identified from UGC and from Experiential Interviews (Imp = Importance, Per = Performance)
Quadrant (median splits)
Source of Customer Need
Count Average Imp
Average Per
High Imp
High Per High Imp Low Per
Low Imp High Per
Low Imp Low Per
Interviews 8,000 UGC a 74 65.5 7.85 29 11 11 23
Interviews 4,000 UGC b 9 63.9 7.97 6 0 0 3
UGC only 8 50.3 7.12 0 0 1 7
Interviews only 3 52.8 7.47 0 1 0 2
a Based on the first 8,000 UGC sentences that were fully‐coded b Based on the second 4,000 UGC sentences that were coded to test for interview‐identified customer needs
Focusing on highly important customer needs is tempting, but we cannot ignore low‐importance
customer needs. In new product development, identifying hidden opportunities for innovation often
leads to successful new products. Customers often evaluate needs below the medians on importance
and performance when they anticipate that no current product fulfills those customer needs (e.g.,
Corrigan 2013). If the new product satisfies the customer need, customers reconsider its importance,
and the innovator gains a valuable strategic advantage. Thus, we define low‐importance–low‐
performance customer needs as hidden opportunities. By this criterion, the UGC‐unique customer needs
identify 20% of the hidden opportunities and the interview‐unique needs identify 8% of the hidden
opportunities. For example, two UGC‐unique hidden opportunities are “An oral‐care product that does
not affect my sense of taste,” and “An oral care product that is quiet.” An interview‐based hidden
opportunity is “Oral care tools that can easily be used by left‐handed people.”
In summary, UGC identifies the vast majority of customer needs (97%), opportunities for product
improvement (92%), and hidden opportunities (92%). UGC‐unique needs identify at least seven hidden
opportunities while interview‐only needs identify two hidden opportunities. We have not been able to
identify any qualitative insights from the comparison of the customer needs between two sources
suggesting that there is nothing systematic that is missing in the UGC. Table A2 in the appendix lists all
eleven customer needs that are unique to either UGC or experiential interviews.
27
4.5. Tests of Non‐Machine‐Learning Prescreening of UGC Data
4.5.1. Helpfulness Ratings
Reviews are often rated by other users based on their helpfulness. In our data, 41% of the reviews
are rated on helpfulness. Because helpful reviews tend to be longer, this corresponds to 52% of the
sentences. We examine whether or not helpful reviews are particularly informative using the 8,000 fully‐
coded sentences. Fifty‐four percent (54%) of non‐rated reviews contain a customer need compared to
51% of rated reviews, 48% of reviews with rating above the median, and 48% of reviews with rating in
the upper quartile. Helpfulness is not correlated with informativeness ( 0.01, 0.56). When we
examine individual sentences, we see that a sentence can be rated as helpful, but not necessarily
describe a customer need (be informative). Two examples of helpful but uninformative sentences are: "I
finally got this toothbrush after I have seen a lot of people use them." or "I'm so happy I'm just about
beside myself with it!" Overall, helpfulness does not seem to imply informativeness.
4.5.2 Number of Times a Customer Need is Mentioned
For experiential interviews, the frequency with which a customer need is mentioned is not
correlated with the measured importance of the customer need (Griffin and Hauser 1993, p. 13).
However, in experiential interviews, the interviewer probes explicitly for new customer needs. The lack
of correlation may be due to endogeneity in the interviewing process. In UGC, customers decide
whether or not to post, hence frequency might be an indicator of the importance of a customer need.
For oral‐care, frequency of mention is marginally significantly correlated with importance ( 0.21,
0.06). Frequency of mention is not significantly correlated with performance ( 0.09, 0.44).
However, if we were to focus only on customer needs with frequency above the median of 7.9
mentions, we would miss 29% of the high‐importance customer needs, 44% of the high‐performance
customer needs, and 72% of the hidden opportunities. Thus, while frequency is related to importance, it
does not enhance the efficiency with which customer needs or new‐product ideas can be identified.
28
5. Oral Care: Evaluation of Machine‐Human Hybrid Method
5.1. CNN to Eliminate Non‐Informative Sentences
There is a tradeoff to be made when training a CNN. With a larger training sample, the CNN is
better at identifying informative content, but there is an opportunity cost to using analysts to classify
informative sentences. Fortunately, labeling sentences as informative or not is faster and easier than
identifying abstract context‐dependent customer needs from sentences. The ratio of time spent on
identifying informative sentences vs. formulating customer needs is approximately 20%. Furthermore,
as described earlier, exploratory research suggests that Amazon Mechanical Turk might be used as a
lower‐cost way to obtain a training sample.
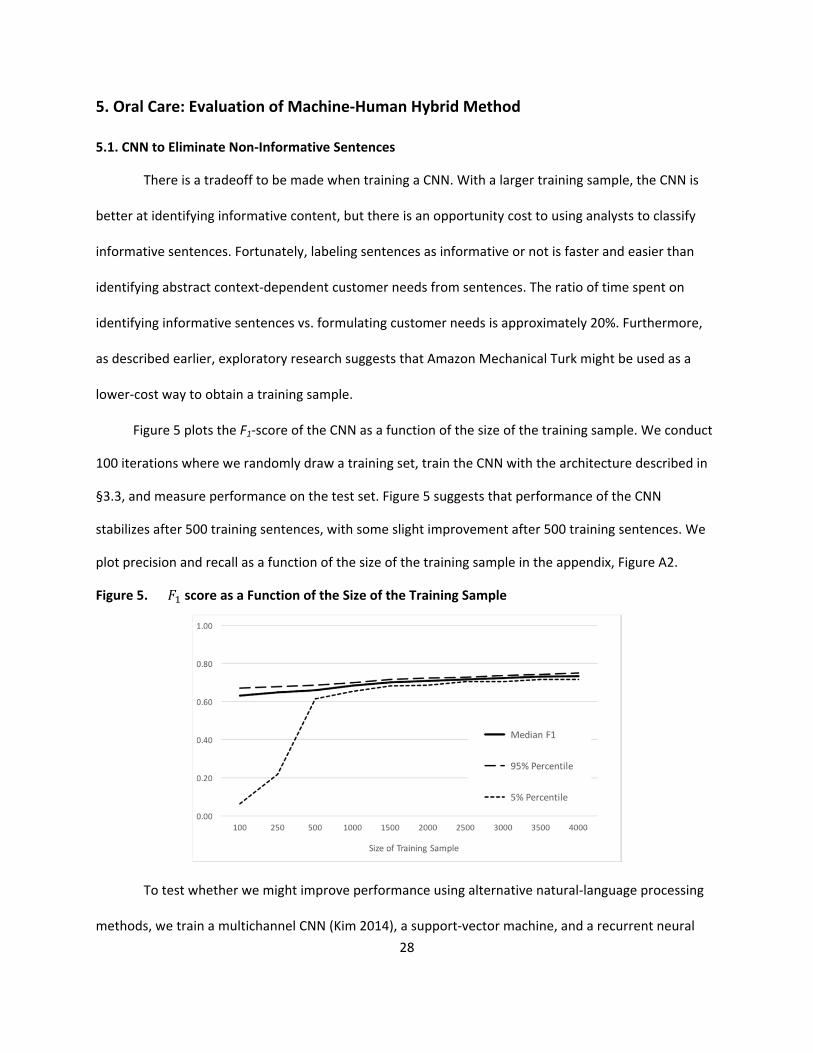
Figure 5 plots the F1‐score of the CNN as a function of the size of the training sample. We conduct
100 iterations where we randomly draw a training set, train the CNN with the architecture described in
§3.3, and measure performance on the test set. Figure 5 suggests that performance of the CNN
stabilizes after 500 training sentences, with some slight improvement after 500 training sentences. We
plot precision and recall as a function of the size of the training sample in the appendix, Figure A2.
Figure 5. score as a Function of the Size of the Training Sample
To test whether we might improve performance using alternative natural‐language processing
methods, we train a multichannel CNN (Kim 2014), a support‐vector machine, and a recurrent neural

29
network with long short‐term memory cells (LSTM, Hochreiter and Schmidhuber 1997). We also train a
CNN with a higher penalty for false positives ( = 3) to investigate the effect of asymmetric costs on the
performance of the model. The evaluation is based on the 6,700 of 8,000 fully‐coded sentences that
remain after we eliminated sentences that were too short and too long. From the 6,700 sentences, we
randomly select 3,700 sentences to train the methods and 3,000 to act as holdout sentences to test the
performance of the alternative methods. We summarize the results in Table 2.
Table 2. Alternative Machine‐Learning Methods to Identify Informative Sentences
Method Precision Recall Accuracy
Convolutional Neural Network (CNN) 74.4% 73.6% 74.2% 74.0%
CNN with Asymmetric Costs ( = 3) 65.2% 85.3% 70.0% 74.0%
Recurrent Neural Network‐LSTM 72.8% 74.0% 73.2% 73.4%
Multichannel CNN 70.5% 74.9% 71.8% 72.6%
Support Vector Machine 63.7% 67.9% 64.6% 65.7%
Focusing on F1, the CNN outperforms the other methods, although the other deep‐learning
methods do reasonably well. Conditioned on a given F1, we favor methods that miss fewer informative
sentences (higher recall, at the expense of a lower precision). Thus, in subsequent analyses, we use the
CNN with asymmetric costs.
The deep learning methods achieve accuracies in the range of 70‐74%, which is lower than that
achieved in some sentence‐classification tasks. For example, Kim (2014) reports accuracies in the range
of 45‐95% across seven datasets and eighteen methods (average 80%). A more‐relevant benchmark is
the capabilities of the human coders on which the deep‐learning models are trained. The deep‐learning
models achieve higher accuracy identifying informative sentences than the inter‐coder accuracy of 70%.
The abstract context‐dependent nature of the customer needs appears to make identifying informative
content more difficult than typical sentence‐classification tasks.
To be effective, the CNN should be able to correctly identify both sentences that contain
frequently mentioned customer needs and sentences that contain rarely mentioned customer needs.

30
We conduct iterations to evaluate this property. In each iteration, we randomly split the 6,700
preprocessed sentences into 3,700 training and 3,000 holdout sentences, and train the CNN using the
training set. We then compare the needs in the holdout sentences and the needs in the sentences
identified by the CNN as informative. On average over iterations, the CNN identified sentences with
100% of the frequently mentioned customer needs, 91% of the rarely mentioned customer needs, and
84% of the customer needs that were new to the holdout data. Because all customer needs were
identified in at least one iteration, we expect these percentages to approach 100% if it were feasible to
expand the holdout set from 3,000 sentences to a larger number of sentences, such as the 12,000
sentences used in Figure 4.
5.2. Clustering Sentence Embeddings to Reduce Redundancy
In Stage 4 of the proposed hybrid approach, we encode informative sentences into a 20‐
dimensional real‐valued vector space (sentence embeddings), group sentence embeddings into Y
clusters, and sample one sentence from each cluster. To visualize whether or not sentence embeddings
separate the customer needs, we use a principle components analysis to project the 20‐dimensional
sentence embeddings onto two dimensions. Information is lost when we project from 20 dimensions to
two dimensions, but the two‐dimensional plot enables us to visualize whether sentence embeddings
separate sentences articulating different customer needs. (We use principle components analysis purely
as a visualization tool to evaluate Stage 4. The dimensionality reduction is not a part of our approach.)
Figure 6 reports the projection for two primary needs. The axes correspond to the first two
principal components. The red dots are the projections of sentence embeddings that were coded (by
analysts) as belonging to the primary customer need: “strong teeth and gums.” The blue crosses are
sentence embeddings that were coded as “shopping/product choice.” (Review Table A1 in the
appendix.) The ovals represent the smallest ellipses inscribing 90% of the corresponding set. Figure 6

31
suggests that, while not perfect, the clusters of sentence embeddings achieved separation among
primary customer needs and, hence, are likely to reduce redundancy and enable analysts to identify a
diverse set of customer needs when they analyze Y sentences, each chosen from one of Y clusters.
Sampling diverse sentences likely increases the probability that low‐frequency customer needs are
contained in a sample of sentences.
Figure 6. Projections of 20‐Dimensional Embeddings of Sentences onto Two Dimensions (PCA).
Dots and Crosses Indicate Analyst‐Coded Primary Customer Needs.
5.3. Gains in Efficiency Due to Machine Learning
We seek to determine whether the proposed combination of machine‐learning methods
improves efficiency of identifying customer needs from UGC. Efficiency is important because the
reduced time and costs enable more firms to use advanced VOC methods to identify new product
opportunities. Efficiency is also important because it enhances the probability of identifying low‐
frequency needs given a constraint on the number of sentences that analysts can process.
In our approach, machine learning helps to identify content for review by professional analysts.

32
We compare content selection approaches in terms of the expected number of unique customer needs
identified in Y sentences. The baseline method for selecting sentences for review is current practice—a
random draw from the corpus. The second method uses the CNN to identify informative sentences, and
then randomly samples informative sentences for review. The third method uses the sentence‐
embedding‐clusters to reduce redundancy among sentences identified as informative by the CNN. For
each method, and for each value of Y, we (1) randomly split the 6,700 preprocessed sentences, which
are neither too short nor too long, into 3,700 training and 3,000 hold‐out samples, (2) train the CNN
using the training sample, and (3) draw Y sentences from the hold‐out sample for review. We count the
unique needs identified in the Y sentences and repeat the process 10,000 times. An upper bound for the
number of customer needs identified in the Y sentences is the number of customer needs contained in
3,000 hold‐out sentences—this is fewer customer needs than are contained in the entire corpus.
From 3,000 sentences in the holdout sample, the largest possible value of Y for which we can
evaluate the CNN is the number of sentences that the CNN classified as informative. The number of
sentences identified by the CNN as informative varies across iterations, and in our experiment the
minimum is 1,790 sentences. While it is tempting to consider Y in the full range from 0 to 1,790, it would
be misleading to do so. At Y = 1,790, there would be 1,790 clusters—the same number as if we sampled
all available informative sentences. To minimize this saturation effect on the oral‐care corpus, we
consider Y ={200, 300, …, 1200} to evaluate efficiency.
The blue dashed line in Figure 7 reports benchmark performance. The CNN improves efficiency
as indicated by the red dotted line. Using the CNN and clustering sentence embeddings increases
efficiency further as indicated by the solid black line. Over the range of Y, there are gains due to using
the CNN to eliminate non‐informative sentences and additional gains due to using sentence embeddings
to reduce redundancy within the corpus.
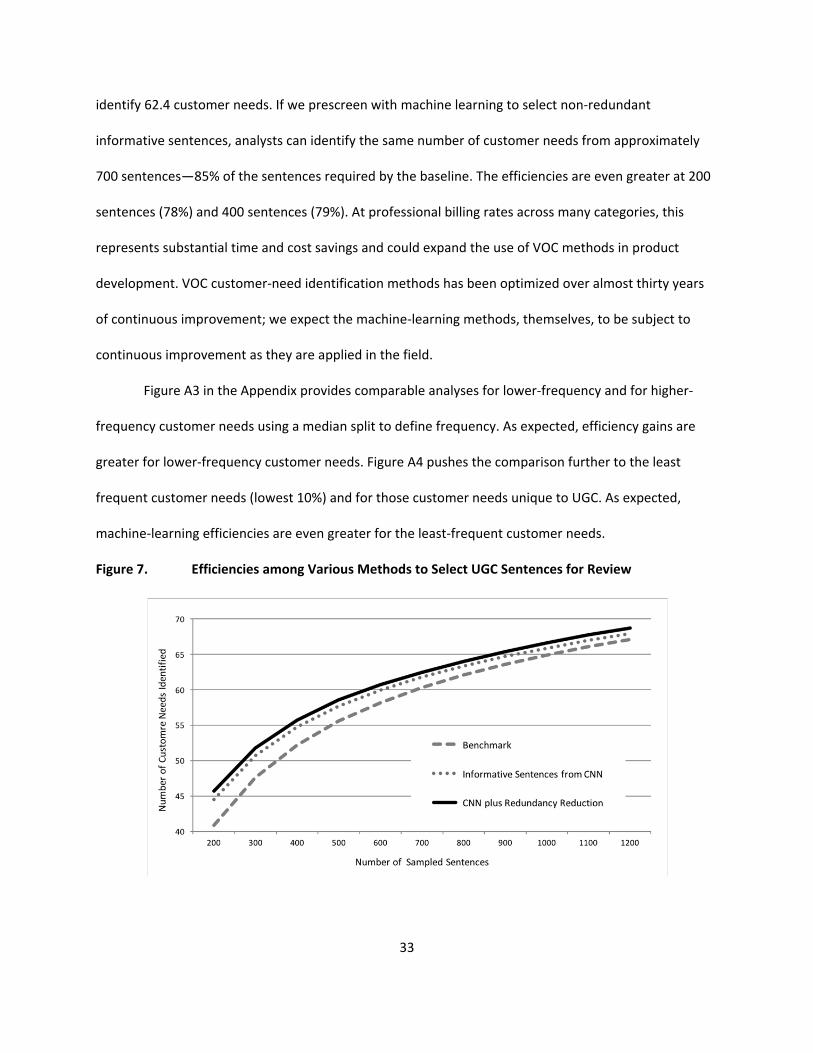
We also interpret Figure 7 horizontally. The benchmark requires, on average, 824.3 sentences to
33
identify 62.4 customer needs. If we prescreen with machine learning to select non‐redundant
informative sentences, analysts can identify the same number of customer needs from approximately
700 sentences—85% of the sentences required by the baseline. The efficiencies are even greater at 200
sentences (78%) and 400 sentences (79%). At professional billing rates across many categories, this
represents substantial time and cost savings and could expand the use of VOC methods in product
development. VOC customer‐need identification methods has been optimized over almost thirty years
of continuous improvement; we expect the machine‐learning methods, themselves, to be subject to
continuous improvement as they are applied in the field.
Figure A3 in the Appendix provides comparable analyses for lower‐frequency and for higher‐
frequency customer needs using a median split to define frequency. As expected, efficiency gains are
greater for lower‐frequency customer needs. Figure A4 pushes the comparison further to the least
frequent customer needs (lowest 10%) and for those customer needs unique to UGC. As expected,
machine‐learning efficiencies are even greater for the least‐frequent customer needs.
Figure 7. Efficiencies among Various Methods to Select UGC Sentences for Review

34
5.4. Scalability of the Machine‐Learning Methods
The proposed methods scale well. With a training sample size of 1,000‐4,000, the CNN typically
converges in 20‐30 epochs (stochastic gradient descent iterations) and does so in under a minute on a
standard MacBook Pro. We use the fastcluster package implementation of the Ward’s clustering
algorithm. The asymptotic worst‐case time complexity is .In our experiments, clustering of
500,000 informative sentences was completed in under 5 minutes. Once programmed, the methods are
relatively easy to apply as indicated by the applications in §6.
5.5. Efficiency Gains in terms of the Professional Services Costs
Professional services costs dominate the expenses in a typical VOC study. Analysts and managers
estimate that these costs are allocated about 40% to interviewing customers, 40‐55% to identifying and
winnowing customer‐needs from transcripts, and 5‐20% to organizing customer needs into a hierarchy
and preparing the final report (§4.1). UGC eliminates the first 40% (§4.2). The proposed machine‐
learning hybrid approach allows a 15‐22% reduction in the time allocated to identifying and winnowing
customer needs (§5.3). Applying our methods thus eliminates approximately 46%‐52% of the overall
professional services costs. These are the substantial savings to the firm and its clients, which can
facilitate market research for new product development. Furthermore, machine‐learning methods
enhance the probability that the lowest‐frequency customer needs are identified within a given cost
constraint. The lowest‐frequency customer needs may be the customer needs that lead to new product
success.
6. Additional Applications
The proposed human‐machine hybrid methods have been applied three more times for product
development. In all cases, the firm identified attractive new product ideas.
Kitchen appliances. During this application, the firm identified 7,000 online product reviews
35
containing more than 18,000 sentences. The firm wanted to evaluate the efficiency of the machine
learning method and devoted sufficient resources to manually review 4,000 sentences. From these,
2,000 sentences were selected randomly from the corpus and 2,000 were selected using machine‐
learning methods. The two sets of sentences were merged, processed to identify unique customer
needs (blind to source), and then re‐split by source. Ninety‐seven (97) customer needs were identified in
the machine‐learning corpus and 84 customer needs were identified in the random corpus. While 66
customer needs were in both corpora, more unique customer needs (31) were identified from the
machine‐learning corpus than from the random corpus (18). The firm found the combined customer
needs extremely helpful and will continue to use UGC in the future. In particular, insights obtained from
UGC tended to be closer to the customer’s moment of experience. Customers post when the experience
is fresh in their minds. These posts are more likely to describe malfunctions, difficulties in use or repair,
challenges with customer service, or unique surprises. Such customer needs are often among the most
useful customer needs for product development.
Skin treatment. This was a pure application in which the firm identified a relevant set of over
11,000 online reviews, used machine‐learning to select sentences for review, and then identified
customer needs from the selected sentences. The firm used a follow‐up quantitative study to assess the
importances of the customer needs. Important customer needs, that were previously unmet by any
competitor, provided the basis for the firm to optimize its product portfolio with new product
introductions. The firm feels that it has enhanced its ability to compete successfully in the market for
skin‐treatment.
Prepared foods. One of the largest prepared‐food firms in North America applied machine
learning to analyze a combined corpus of over 500,000 sentences extracted from its social‐listening tool
and over 10,000 sentences from product reviews. The social listening sources included forums, blogs,
micro‐blogs, and social media. The product reviews were obtained from five difference sources. In this

36
application, there were synergies between social‐listening UGC and product‐review UGC with about
two‐thirds of the customer needs coming from one or the other source. By combining the two UGC
corpora, the firm identified more than thirty categories of customer needs to provide valuable insight
for both new product development and marketing communications. As a result, the firm is now applying
the machine‐human hybrid method to adjacent categories.
7. Discussion, Summary, and Future Research
We addressed two questions: (1) Can UGC be used to identify abstract customer needs? And (2)
can machine learning enhance the process? The answer to both questions is yes. UGC is at least a
comparable source of customer needs to experiential interviews—likely a better source. The proposed
machine‐learning architecture successfully eliminates non‐informative content and reduces redundancy.
In our initial test, machine learning efficiency gains are 15‐22%, but such gains are likely to increase with
more research. Overall gains of analyzing UGC with our approach over the traditional interview‐based
VOC are 46‐52%.
Answering these questions is significant. Every year thousands of firms rely on voice‐of‐the‐
customer analyses to identify new opportunities for product development, to develop strategic
positioning strategies, and to select attributes for conjoint analysis. Typically, VOC studies, while
valuable, are expensive and time‐consuming. Time‐to‐market savings, such as those made possible with
machine learning applied to UGC, are extremely important to product development. In addition, UGC
seems to contain customer needs not identified in experiential interviews. New customer needs mean
new opportunities for product development and/or new strategic positioning.
While we are enthusiastic about UGC, we recognize that UGC is not a panacea. UGC is readily
available for oral care, but UGC might not be available for every product category. For example, consider
specialized medical devices or specialized equipment for oil exploration. The number of customers for
37
such products is small and such customers may not blog, tweet, or post reviews. On the other hand,
UGC is extensive for complex products such as automobiles or cellular phones. Machine‐learning
efficiencies in such categories may be necessary to make the review of UGC feasible.
Although our research focuses on developing and testing new methods, we are beginning to
affect industry. Further research will enhance our ability to identify abstract context‐dependent
customer needs with UGC. For example,
Deep neural networks and sentence embeddings are active areas of research in the NLP
community. We expect the performance of the proposed architecture to improve significantly
with new developments in machine learning.
UGC is updated continuously. Firms might develop procedures to monitor UGC continuously.
Sentence embeddings can be particularly valuable. For example, firms might concentrate on
customer needs that are distant from established needs in the 20‐dimenional vector space.
Future developments might automate the final step, or at least enhance the ability of analysts to
abstract customer needs from informative, non‐redundant content.
Other forms of UGC, such as blogs and Twitter feeds, may be examined for customer needs. We
expect blogs and Twitter feeds to contain more non‐informative content, which makes machine
learning filtering even more valuable.
Self‐selection to post UGC is a concern and an opportunity with UGC. For oral care, the
effectiveness of product reviews did not seem to be diminished by self‐selection, at least
compared to experiential interviews of a representative set of customers. In other categories,
such as the food category in §6, self‐selection and a non‐representative sample issues might have
a larger effect. Firms might examine multiple channels for a complete set of customer needs.
Field experiments might assess whether, and to what degree, abstract context‐dependent
customer needs provide more insights for product development than insights obtained from lists
of words.

38
Amazon Mechanical Turk is a promising means to replace analysts for labeling training sentences,
but further research is warranted.

39
References
Akao Y (2004) Quality Function Deployment (QFD): Integrating customer requirements into product
design, (New York, NY: Productivity Press).
Archak N, Ghose A, Ipeirotis PG (2016) Deriving the pricing power of product features by mining
consumer reviews, Management Science. 57(8): 1485‐1509.
Alam I., Perry C. (2002) A customer‐oriented new service development process. Journal of services
Marketing. 16(6):515‐534.
Baroni M, Dinu G, Kruszewski G (2014) Don't count, predict! A systematic comparison of context‐
counting vs. context‐predicting semantic vectors. Proceedings of the 52nd Annual Meeting of the
Association for Computational Linguistics. Baltimore, MD. 238‐247.
Brown SL, Eisenhardt KM (1995) Product development: Past research, present findings, and future
directions. The Academy of Management Review. 20(2):343‐378.
Büschken, J, Allenby GM (2016) Sentence‐based text analysis for consumer reviews. Marketing Science.
35(6):953‐975.
Chan L‐K, Wu M‐L (2002) Quality Function Deployment: A literature Review. European Journal of
Operational Research. 143:463‐497.
Chiu JP, Nichols E (2016). Named entity recognition with bidirectional LSTM‐CNNs. Transactions of the
Association for Computational Linguistics 4:357–370.
Collobert R, Weston J, Bottou L, Karlen M, Kavukcuoglu K, Pavel K (2011) Natural language processing
(almost) from scratch. Journal of Machine Learning Research. 12:2493‐2537.
Colson E (2016) Human machine algorithms: Interview with Eric Colson. http://blog.
fastforwardlabs.com/2016/05/25/human‐machine‐algorithms‐interview‐with‐eric.html.
Corrigan KD (2013) Wise choice: The six most common product development pitfalls and how to avoid
40
them. Marketing News. (September) 39‐44.
Dolnicar S (2003) Using cluster analysis for market segmentation – typical misconceptions, established
methodological weaknesses and some recommendation for improvement. Australasian Journal of
Market Research. 11(2):5‐12.
dos Santos CN, Gatti M (2014) Deep convolutional neural networks for sentiment analysis of short texts.
Proceedings the 25th International Conference on Computational Linguistics: Technical Papers.
Dublin, Ireland, 69–78,
Fader PS, Winer RS (2012) Introduction to the special issues on the emergence can impact of user‐
generated content. Marketing Science. 31(3):369‐371.
Goffin K, Varnes CJ, van der Hoven C, Koners U (2012) Beyond the voice of the customer: Ethnographic
market research. Research Technology Management. 55(4):45‐53.
Green PE, Srinivasan V (1978) Conjoint analysis in consumer research: issues and outlook. Journal of
Consumer Research 5(2):103‐123.
Griffin A., Hauser JR (1993) The voice of the customer. Marketing Science. 12(1):1‐27.
Griffin A, Price RL, Maloney MM, Vojak BA, Sim EW (2009) Voices from the field: how exceptional
electronic industrial innovators innovate. Journal of Product Innovation Management. 26:222‐240.
Harris, Z. S. (1954) Distributional structure. Word, 10(2‐3), 146‐162.
Hauser JR, Clausing D (1988) The house of quality. Harvard Business Review. 66(3):63‐73.
Herrmann A, Huber F, Braunstein C (2000) Market‐driven product and service design: Bridging the gap
between customer needs, quality management, and customer satisfaction. International Journal
of Production Economics. 66(1):77‐96.
Hochreiter S, Schmidhuber J (1997) Long short‐term memory. Neural Computation. 9(8):1735‐1780.
Iyyer M, Manjunatha V, Boyd‐Graber J, Daumé III H. (2015) Deep unordered composition rivals syntactic
41
methods for text classification. Proceedings of the 53rd Annual Meeting of the Association for
Computational Linguistics and the 7th International Joint Conference on Natural Language
Processing, Beijing, China. 1:1681‐1691.
Jiao J, Chen CH (2006) Customer requirement management in product development: a review of
research issues. Concurrent Engineering: Research and Applications. 14(3):173‐185.
Jin J, Hi P, Liu Y, and Lim SCJ (2015) Translating online customer opinions into engineering characteristics
in QFD: A probabilistic language analysis approach. Engineering Applications of Artificial
Intelligence. 41:115‐127.
Kano N, Seraku N, Takahashi F, Tsuji S (1984) Attractive quality and must‐be quality. The Japanese
Society for Quality Control 14(2):39‐48.
Kao Group (2016). http://www.company‐histories.com/Kao‐Corporation‐Company‐History.html.
Kaulio MA (1998) Customer, consumer and user involvement in product development: A framework and
a review of selected methods. Total Quality Management. 9(1):141‐149.
Kim Y (2014) Convolutional neural networks for sentence classification. arXiv preprint arXiv:1408.5882.
Kim DS, Bailey RA, Hardt N, Allenby A (2017) Benefit‐based conjoint analysis. Marketing Science,
36(1):54‐69.
Kiss T, Strunk J (2006) Unsupervised multilingual sentence boundary detection. Computational
Linguistics, 32(4):485‐525.
Krishnan V, Ulrich KT (2001) Product development decisions: A review of the literature. Management
Science. 47(1):1‐21.
Kuehl N (2016) Needmining: Towards analytical support for service design. International Exploring
Services Science. 247:187‐200.
Lample G, Ballesteros M, Subramanian S, Kawakami K, Dyer C (2016) Neural architectures for named

42
entity recognition. Proceedings of 2016 North American Chapter of the Association for
Computational Linguistics: Human Language Technologies. San Diego, CA:260‐270.
Le QV, Mikolov T (2014) Distributed representations of sentences and documents. Proceedings of the
31st International Conference on Machine Learning, Beijing, China, 32, 1188‐1196.
Lee TY, Bradlow ET (2011) Automated marketing research using online customer reviews. Journal of
Marketing Research. 48(5), 881‐894.
Lei T, Barzilay R, Jaakkola T (2015) Molding CNNs for text: non‐linear, non‐consecutive convolutions.
Proceedings of 2015 Conference on Empirical Methods in Natural Language Processing. Lisbon,
Portugal. 1565–1575.
Matzler K, Hinterhuber HH (1998) How to make product development projects more successful by
integrating Kano's model of customer satisfaction into quality function deployment. Technovation.
18(1):25‐38.
McAuley J, Pandey R, Leskovec J (2015) Inferring networks of substitutable and complementary
products. Proceedings of the 21th ACM SIGKDD International Conference on Knowledge Discovery
and Data Mining. ACM, 785‐794.
Mikolov T, Chen K, Corrado G, Dean J (2013a) Efficient estimation of word representations in vector
space. arXiv:1301.3781v3 [cs.CL]m Sept 7,1301.3781.
Mikolov T, Sutskever I, Chen K., Corrado GS, Dean J (2013b) Distributed representations of words and
phrases and their compositionality. Advances in Neural Information Processing Systems. 26, 3111–
3119.
Mikulić J, Prebežac D (2011). A critical review of techniques for classifying quality attributes in the Kano
model. Managing Service Quality. 21(1):46‐66.
Netzer O, Feldman R, Goldenberg J, Fresko M. (2012) Mine your own business: Market‐structure

43
surveillance through text mining. Marketing Science. 31(3), 521‐543.
Nguyen TH, Grishman R (2015) Relation extraction: Perspective from convolutional neural networks.
Proceedings of North American Chapter of the Association for Computational Linguistics: Human
Language Technologies. Denver, CO. 39‐48.
Orme BK (2006) Getting started with conjoint analysis: Strategies for product design and pricing
research, 2E. (Madison WI: Research Publishers LLC).
Park CW, Jaworski BJ, MacInnis DJ (1986) Strategic brand concept‐image management. Journal of
Marketing. 50:135‐145.
Peng W, Sun T, Revankar S (2012). Mining the `voice of the customer’ for business prioritization. ACM
Transactions on Intelligent Systems and Technology. 3 (2), 38:1‐38‐17.
Qian Y‐N, Hu Y, Cui J, Nie Z (2001) Combining machine learning and human judgment in author
disambiguation. Proceedings of the 20th ACM Conference on Information and Knowledge
Management. Glasgow, United Kingdom.
Schaffhausen CR, Kowalewski TM (2015). Large‐scale needfinding methods of increasing user‐generated
needs from large populations. Journal of Mechanical Design. 137(7): 071403.
Schaffhausen CR, Kowalewski TM (2016) Assessing quality of unmet user needs: effects of need
statement characteristics. Design Studies. 44:1‐27.
Schweidel DA, Moe WW (2014) Listening in on social media: A joint model of sentiment and venue
format choice. Journal of Marketing Research 51(August):387‐402.
Socher R, Perelygin A, Wu JY, Chuang J, Manning CD, Ng AY, Potts C (2013) Recursive deep models for
semantic compositionality over a sentiment treebank. Proceedings of the Conference on Empirical
Methods in Natural Language Processing (EMNLP). Stroudsburg PA. 1631‐1642.
Stone RB, Kurtadikar R, Villanueva N, Arnold CB (2008) A customer needs motivated conceptual design
44
methodology for product portfolio planning. Journal of Engineering Design.19(6):489‐514.
Sullivan LP (1986) Quality function deployment. Quality Progress. 19(6), 39‐50.
Tai KS, Socher R, Manning CD (2015) Improved semantic representations from tree‐structured long
short‐term memory networks. Proceedings of the 53st Annual Meeting on Association for
Computational Linguistics. Stroudsburg, PA. 1556‐1566.
Tirunillai S, Tellis GJ (2014) Mining marketing meaning from online chatter: Strategic brand analysis of
big data using Latent Dirichlet Allocation. Journal of Marketing Research. 51:463‐479.
Tieleman T, Hinton G (2012) Lecture 6.5‐rmsprop: Divide the gradient by a running average of its recent
magnitude. COURSERA: Neural Networks for Machine Learning, 4.
Ulrich KT, Eppinger SD (2016) Product design and development, 6E. (New York, NY: McGraw‐Hill).
Urban GL, Hauser JR (1993) Design and Marketing of New Products, 2E. (Englewood Cliffs, NJ: Prentice‐
Hall).
Wilson T, Wiebe J, Hoffmann P (2005) Recognizing contextual polarity in phrase‐level sentiment analysis.
Proceedings of the Conference On Human Language Technology and Empirical Methods in Natural
Language Processing. Vancouver BC. 347‐354.
Wu H‐H, Shich JI (2010) Applying repertory grids technique for knowledge elicitation in Quality Function
Deployment. Quality and Quantity. 44:1139‐1149.
Ying Y, Feinberg F, Wedel M (2006) Leveraging missing ratings to improve online recommendation
systems. Journal of Marketing Research 43(August):355‐365.
Zahay D, Griffin A, Fredericks E (2004) Sources, uses, and forms of data in the new product development
process. Industrial Marketing Management. 33:657‐666.

A1
Appendix
Table A1. Voice of the Customer for Oral Care as Obtained from Experiential Interviews (22 examples of the 86 tertiary customer needs
are shown—one for each secondary group. A full list of tertiary customer needs is available from the authors.)
Primary Group Secondary Group #Needs Examples of Tertiary Customer Needs (22 of 86 shown)
Feel Clean And Fresh (Sensory)
Clean Feeling in My Mouth 4 My mouth feels clean
Fresh Breath All Day Long 4 I wake up without feeling like I have morning breath
Pleasant Taste and Texture 3 Oral care liquids, gels, pastes, etc. are smooth (not gritty or chalky)
Strong Teeth And Gums
Prevent Gingivitis 5 Oral care products and procedures that minimize gum bleeding
Able to Protect My Teeth 5 Oral care products and procedures that prevent cavities
Whiter Teeth 4 Can avoid discoloration of my teeth
Product Efficacy
Effectively Clean Hard to Reach Areas 3 Able to easily get all particles, even the tiniest, out from between my teeth
Gentle Oral Care Products 4 Oral care items are gentle and don’t hurt my mouth
Oral Care Products that Last 3 It’s clear when I need to replace an oral care product (e.g. toothbrush, floss)
Tools are Easy to Maneuver and Manipulate 6 Easy to grasp any oral care tool—it won’t slip out of my hand
Knowledge And Confidence
Knowledge of Proper Techniques 5 I know the right amount of time to spend on each step of my oral care routine
Long Term Oral Care Health 4 I am aware of the best oral care routine for me
Motivation for Good Check‐Ups 4 I want to be motivated to be more involved with my oral care
Able to Differentiate Products 3 I know which products to use for any oral care issue I’m trying to address
Convenience
Efficient Oral Care Routine (Effective, Hassle‐Free and Quick)
7 Oral care tasks do not require much physical effort
Oral Care “Away From the Bathroom” 5 The oral care items I carry around are easy to keep clean
Shopping / Product Choice
Faith in the Products 5 Brands of oral care products that are well known and reliable
Provides a Good Deal 2 I know I’m getting the lowest price for the products I’m buying
Effective Storage 1 Easy to keep extra products on hand (e.g. packaged securely, doesn’t spoil)
Environmentally Friendly Products 1 Environmentally friendly products and packaging
Easy to Shop for Oral Care Items 3 Oral care items I want are available at the store where I shop
Product Aesthetics 5 Products that have a “cool” or interesting look
Note to Table A1. Each customer need is based on analysts’ fuzzy matching. For example, the customer need of “I want to be motivated to be more involved
with my oral care” is based on fourteen sentences in the UGC, including: “Saves money and time (and motivates me to floss more)...” “This floss was able to do
the impossible: get me to floss every day.” “Makes flossing much more enjoyable err...tolerable …” “…this tool is the lazy person's answer to flossing.”

A2
Figure A1. Demonstration of the Application of the Proposed Machine Learning Hybrid Approach to an Amazon Review

A3
Figure A2. Precision and Recall as a Function of the Size of the Training Sample
(a) Precision (b) Recall
Note to Figure A2. Below 500 sentences, the confidence bounds on recall are large in Figure A2. The effect on the confidence bounds on (Figure 5) is
asymmetric. is a compromise between precision and recall. When either precision or recall is low, is low. When recall is extremely high, precision is likely
to be low, hence will also be low. This explains why the lower confidence bound for 500 sentences in Figure 5 is extremely low, but the upper confidence
bound tracks the median well.
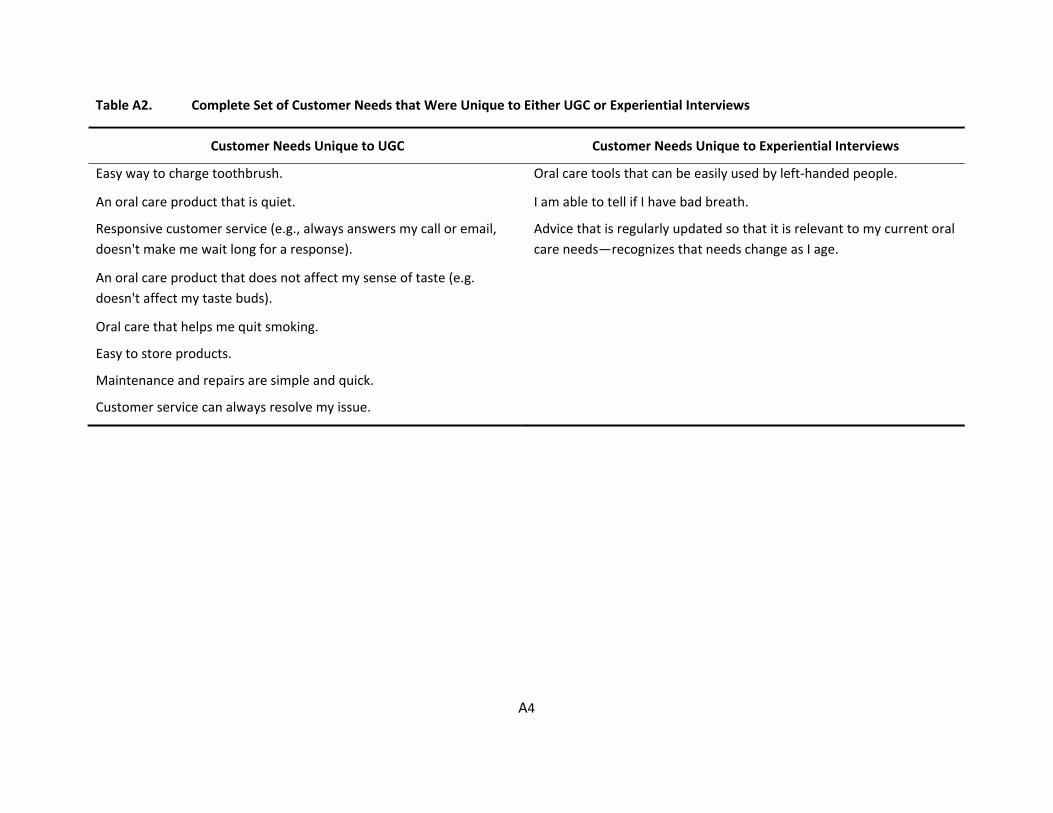
A4
Table A2. Complete Set of Customer Needs that Were Unique to Either UGC or Experiential Interviews
Customer Needs Unique to UGC Customer Needs Unique to Experiential Interviews
Easy way to charge toothbrush. Oral care tools that can be easily used by left‐handed people.
An oral care product that is quiet. I am able to tell if I have bad breath.
Responsive customer service (e.g., always answers my call or email,
doesn't make me wait long for a response).
Advice that is regularly updated so that it is relevant to my current oral
care needs—recognizes that needs change as I age.
An oral care product that does not affect my sense of taste (e.g.
doesn't affect my taste buds).
Oral care that helps me quit smoking.
Easy to store products.
Maintenance and repairs are simple and quick.
Customer service can always resolve my issue.

A5
Figure A3. Efficiencies among Various Methods to Select UGC Sentences for Review (Low‐ and High‐Frequency Customer Needs)
Figure A4. Machine Learning Hybrid Can Efficiently Identify the Least Frequent Customer Needs and Customer Needs Unique to UGC
Related Documents