© SPEX CertiPrep 2011 Vanaja Sivakumar, PhD Vice President, Manufacturing 10/27/2011 Identifying and Quantifying the Uncertainty Associated with Instrumental Analysis

Welcome message from author
This document is posted to help you gain knowledge. Please leave a comment to let me know what you think about it! Share it to your friends and learn new things together.
Transcript

© SPEX CertiPrep 2011
Vanaja Sivakumar, PhDVice President, Manufacturing
10/27/2011
Identifying and Quantifying the Uncertainty Associated with Instrumental Analysis

© SPEX CertiPrep 2011
Housekeeping
Everyone in attendance will receive a copy of the slides
The webinar is being recorded and will be available for everyone to view on demand
– The recording will be posted about one week after the event
Questions will be answered at the end of the presentation
– Type any questions you may have into the question box and we will answer them during the Q & A portion
Stay tuned after the Q&A session – we’re giving away a free gift!

© SPEX CertiPrep 2011
Topics Covered
Precision & AccuracyPrecision & Accuracy
Confidence LimitsConfidence Limits
Errors in MeasurementsErrors in Measurements
Uncertainty in MeasurementsUncertainty in Measurements

© SPEX CertiPrep 2011
True Value (TV)
MethodMethod
InstrumentInstrument
Skill of the OperatorSkill of the Operator

© SPEX CertiPrep 2011
Sources of Error (E)
Determinate (Systematic)
• Improper Calibration• Personal Errors• Error in Methods
Indeterminate (Random)
• Experimental Errors
Spurious
• Human Errors• Instrument Failures

© SPEX CertiPrep 2011
Central tendency
Not an absolute value
Estimate of true value
Average (0)
Sum of the results of each measurement
number of measurementsAverage (0) = 0 =
…
True value is described by average and standard deviation
or
Average is:

© SPEX CertiPrep 2011
Standard Deviation (s)
0 ± 1.96 s at 95% Confidence Interval
0 ± 2.94 s at 99% Confidence Interval
Standard Deviation (s)
You can narrow your estimate of True Value using standard deviation
Can also be described as sigma,
True Value can be expressed as:
0
1

© SPEX CertiPrep 2011
Confidence Intervals
The Average gives an estimate of the true value
The Confidence Interval can pinpoint the range within which the true value lies
– Also called Interval Estimate or Confidence Limit
Confidence Intervals are usually expressed at 90%, 95% or 99%
-3 -2 - 0 2 3

© SPEX CertiPrep 2011
Accuracy & Precision
PrecisionPrecision• Reproducibility of the method • Evaluated by Average Deviation,
Variance and Standard Deviation
AccuracyAccuracy• Correctness of the measurement
in relation to the true value• (TV=0 ± E) or Measured value ± E
True Value ( ) = 8.50
7
8
9
10
1 2 3 4 5 6 7 8
Valu
es
Measurement #
Good Accuracy (0 = 8.55)
7
8
9
10
1 2 3 4 5 6 7 8
Valu
es
Measurement #
Poor Accuracy (0 = 7.39)
7
8
9
10
1 2 3 4 5 6 7 8
Valu
es
Measurement #
Good Precision (0 = 8.55)
7
8
9
10
1 2 3 4 5 6 7 8
Valu
es
Measurement #
Bad Precision (0 = 8.55)

© SPEX CertiPrep 2011
Evaluation of Precision
Key Word Symbol Equation Description
Average Deviation
AD
The smaller the AD, the more precise the measurements
Not an accurate measure of precision
Variance V
Indicates the spread of measurements around the data
Better measure of precision
StandardDeviation s The amount of variation or
spread from the True Value
AD
s 0
1
0
0 2
1

© SPEX CertiPrep 2011
Glossary Review
Key Word Symbol Equation
Average 0
Standard Deviation s
0 …
s 0
1

© SPEX CertiPrep 2011
Uncertainty
Uncertainty is a parameter associated with the result of measurement, that characterizes the dispersion of the values that could be reasonably attributed to measured value
Error vs. Uncertainty:
– Error: Usually can’t be estimated
– Uncertainty: Can be estimated

© SPEX CertiPrep 2011
Uncertainty Estimation
Determine what is to be measuredDetermine what is to be measured
Outline the various processesOutline the various processes
Identify sources of uncertaintyIdentify sources of uncertainty
Estimate uncertainties from each sourceEstimate uncertainties from each source
Combine and expand all uncertaintyCombine and expand all uncertainty

© SPEX CertiPrep 2011
Types of Uncertainty
Type AType A• Usually associated with
repeated measurements• Type A uncertainty is
expressed as:
Type BType B• Based on scientific judgment
made from previous experience, manufactures’ specifications, etc.
• Three common models are:
Where s is standard deviation and n is the number of replicates
o Rectangularo Triangularo Normal

© SPEX CertiPrep 2011
Type B: Rectangular Distribution
Use this when a certificate or other specification gives limits without specifying a level of confidence
Normalizing factor for converting to Standard Uncertainty is
X
3
© SPEX CertiPrep 2011
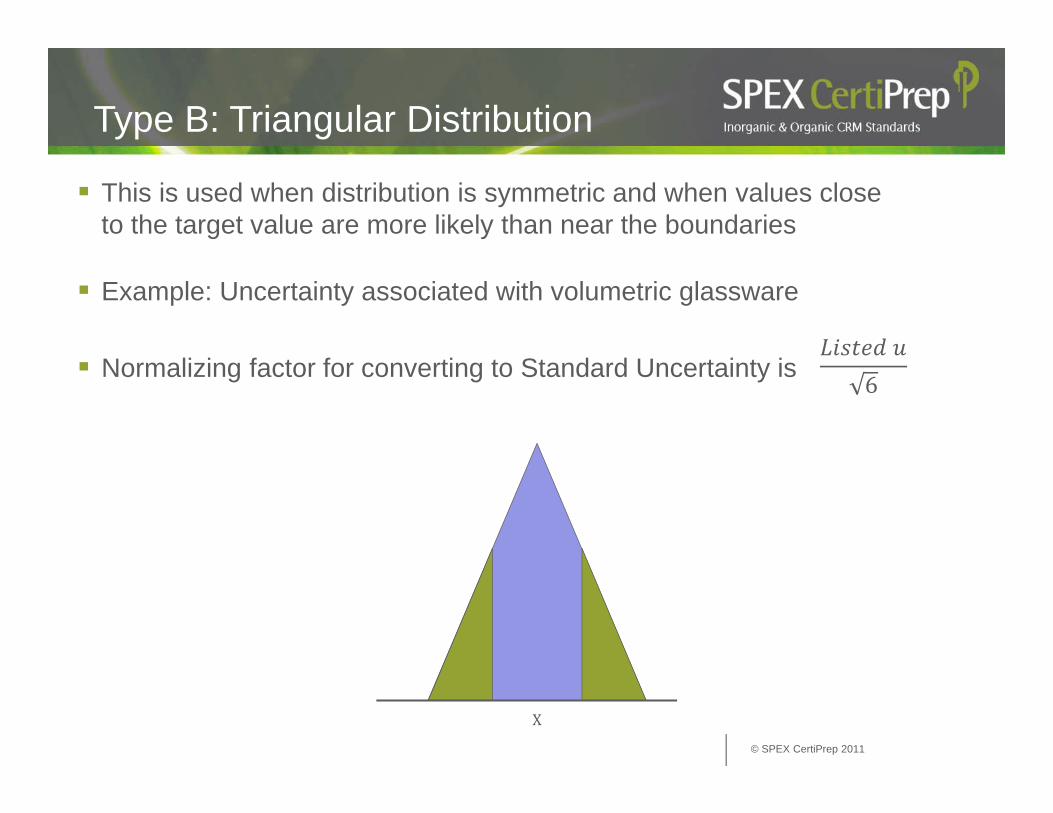
Type B: Triangular Distribution
This is used when distribution is symmetric and when values close to the target value are more likely than near the boundaries
Example: Uncertainty associated with volumetric glassware
Normalizing factor for converting to Standard Uncertainty is
6
X

© SPEX CertiPrep 2011
Type B: Normal Distribution
This is used when an estimate is made from repeated observations of a randomly varying process and an uncertainty is associated with a certain confidence interval.
Example: A calibration certificate with stated level of confidence.
Normalizing factor for converting to Standard Uncertainty is
X
2

© SPEX CertiPrep 2011
Combined Uncertainty (uc)
We will be using the following model to combine overall uncertainties from all of the processes:
We will use the following model for calculating interim uc within a process:

© SPEX CertiPrep 2011
Expanded Uncertainty (U)
The Expanded Uncertainty defines the interval within which lies the value of the measurand
U ku
To calculate, multiply the combined standard uncertainty with a Coverage Factor (k):
Coverage factor k depends on the level of confidence and the degree of freedom:
k= 2 for 95% confidence level
TrueValue X 0 U
m1

Slide 19
m1 should one of these be X bar?msnyder, 10/25/2011

© SPEX CertiPrep 2011
Glossary Review
Key Word Symbol Equation
Average 0
Standard Deviation s
Combined Uncertainty
Expanded Uncertainty
0 …
s 0
1
© SPEX CertiPrep 2011
Uncertainty in the measurement of a gold
solution, analyzed by ICP

© SPEX CertiPrep 2011
Review of the Steps
Determine what is to be measuredDetermine what is to be measured
Outline the various processesOutline the various processes
Identify sources of uncertaintyIdentify sources of uncertainty
Estimate uncertainties for each sourceEstimate uncertainties for each source
Combine all the components and expandCombine all the components and expand

© SPEX CertiPrep 2011
Process Outline for Analysis of Au
Components: Symbol Value
NIST SRM conc• Weighing• Flask• SRM value
Stdp 100.225 mg/L
Sample Dilution• Pipette• Flask
Crmf 100 fold
SRM Measured conc Stdm 100.985 mg/L
CRM Measured conc Crmm 100.797 mg/L

© SPEX CertiPrep 2011
Determination of concentration
C Crm Std Crm
Std
Where:
Cau = Concentration of Au in sample
Crmm = ICP measured concentration of sample
Crmf = Dilution factor for sample
Stdp = Prepared concentration of SRM
Stdm = ICP measured concentration of standard
C100.797 100.225 100
100.985
10,004mg/L
Component Symbol ValueNIST SRM conc
• Weighing• Flask• SRM value
Stdp 100.225mg/L
Sample Dilution• Pipette• Flask
Crmf 100 fold
SRM Measured conc StdM 100.985 mg/L
CRM Measured conc CrmM 100.797 mg/L

© SPEX CertiPrep 2011
ICP-Sample measurement (Crmm)
ICP-SRM measurement (Srmm)
Tolerance Temp
Vol
COA
Prep. SRM (Stdp)
Mass
Uncertainty Sources
The aim is to identify all major uncertainty sources and to understand their effect on the analyte and its uncertainty
Uc(Cau)
Pipette
Flask
Sample dil (Crmf)Tolerance Temp
Tolerance Temp

© SPEX CertiPrep 2011
Uncertainty from SRM - U(Stdp)
Weighing on the balanceWeighing on the balance
500 mL Flask
SRM Certification
Used NIST SRM 3121 for calibration
To prepare the SRM:
– Weighed 5.067 g
– Diluted to 500 mL in a volumetric flask
There are 3 uncertainties associated with this process:

© SPEX CertiPrep 2011
U(Stdp) – From the Balance
Weighing on the balanceWeighing on the balance 500 mL Flask SRM
Certification
1√3
Device Value (V) Standard u Combined u(uc)
Relative u( )
Balance 5.0670 g 8.165 x 10⁻⁵ 8.165 x 10⁻⁵ 1.611 x 10⁻⁵ 2.597 x 10⁻¹⁰
UncertaintyfrombalancecalibrationListed
NormalizationFactorforRectangularDistribution
0.00013
5.774 10
StandardUncertainty TareWeight GrossWeight
5.774 10 5.774 10
8.165 10
© SPEX CertiPrep 2011
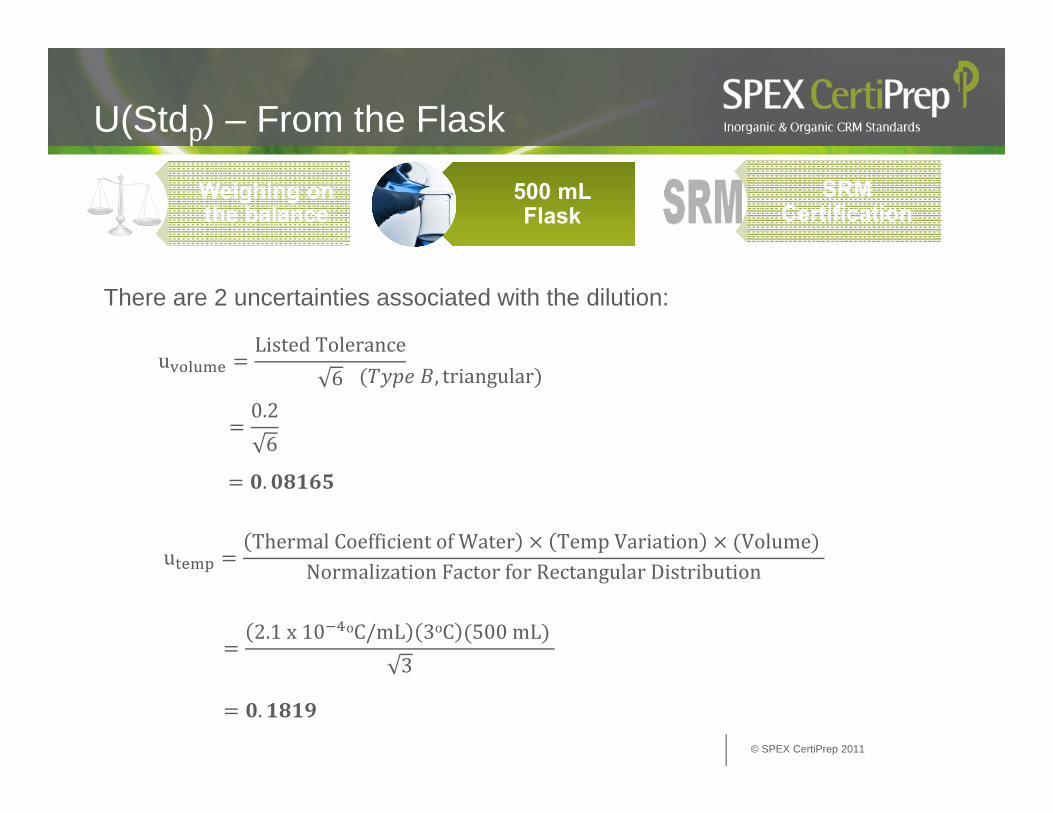
U(Stdp) – From the Flask
Weighing on the balanceWeighing on the balance
SRM Certification
500 mL Flask
There are 2 uncertainties associated with the dilution:
uListedTolerance
60.26
.
.
uThermalCoefficientofWater TempVariation Volume
NormalizationFactorforRectangularDistribution
2.1x10 oC/mL 3oC 500mL 3
, triangular

© SPEX CertiPrep 2011
U(Stdp) – From the Flask (cont.)
Device Value(V) uvolume utemp
Combined u(uc)
Relative u( )
Flask 500 mL 0.08165 0.1819 0.19935 0.0003987 1.5897 x 10⁻⁷
Weighing on the balanceWeighing on the balance
SRM Certification
500 mL Flask
CombinedUncertaintyu
0.08165 0.1819
0.19935 Relative
0.19935500
0.0003987
© SPEX CertiPrep 2011
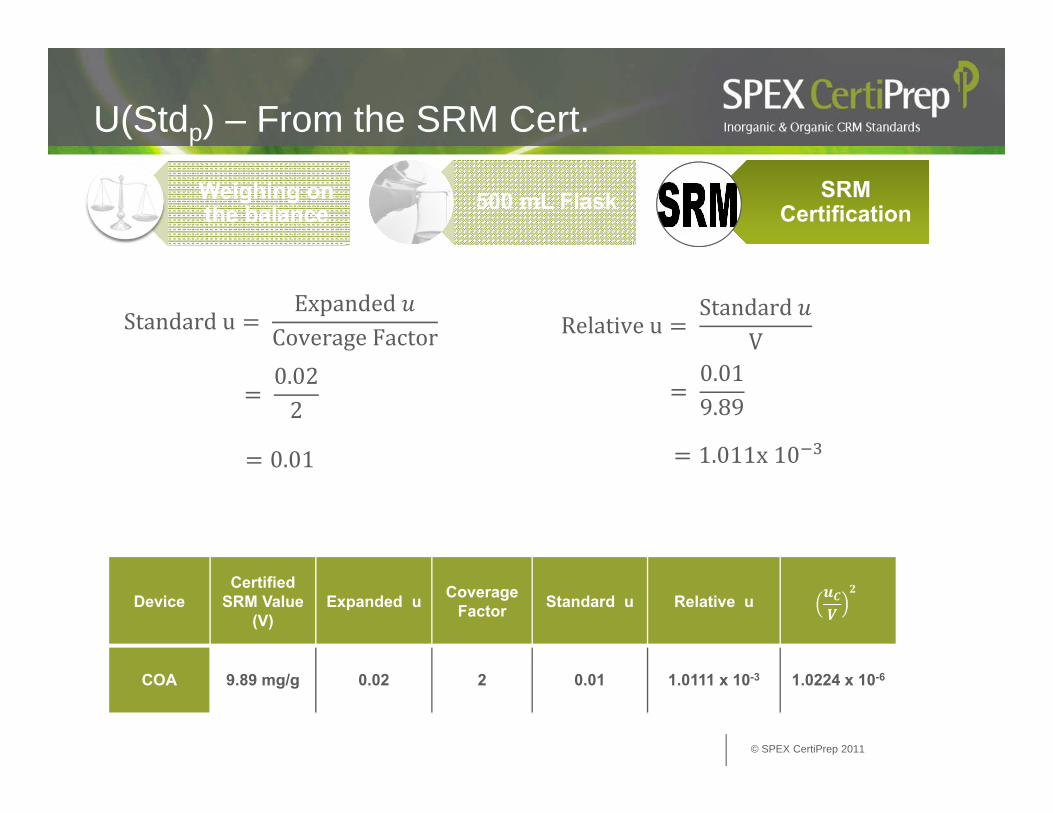
U(Stdp) – From the SRM Cert.
Weighing on the balanceWeighing on the balance 500 mL Flask
DeviceCertified
SRM Value(V)
Expanded u Coverage Factor Standard u Relative u
COA 9.89 mg/g 0.02 2 0.01 1.0111 x 10⁻³ 1.0224 x 10⁻⁶
SRM Certification
Standardu Expanded
CoverageFactor
0.022
0.01
Relativeu Standard
V
0.019.89
1.011x10

© SPEX CertiPrep 2011
Total Uncertainty Due to Stdp
Add each uncertainty component from the preparation of the standard…
Balance 1.61 x 10⁻⁵ 2.597 x 10⁻¹⁰
500 mL Flask 0.0003987 1.5897 x 10⁻⁷
SRM Certification 0.001011 1.0224 x 10⁻⁶
Total: 1.1816 x 10⁻⁶

© SPEX CertiPrep 2011
Uncertainty from Sample Dilution -U(Crmf)
500 mL FlaskPipette
To prepare the sample:
– A 5 mL of the sample was diluted to 500 mL
There are 2 uncertainties associated with Crmf:

© SPEX CertiPrep 2011
U(Crmf) – From the Pipette
uListedu
NormalizationFactorforTriangularDistribution
0.016
.
.
Pipette 500 mL Flask
uThermalCoefficientofWater TempVariation Volume
NormalizationFactorforRectangularDistribution
2.1x10 oC/mL 3oC 5mL 3

© SPEX CertiPrep 2011
Pipette 500 mL Flask
CombinedUncertainty
0.004082 0.1819x10
0.004469
RelativeuCombined
V
0.0044695
.
U(Crmf) – From the Pipette (cont.)

© SPEX CertiPrep 2011
Pipette
U(Crmf) – From the Flask
Flask
uListedu
NormalizationFactor
0.26
0.08165
.
ThermalCoefficientofWater TempVariation Volume NormalizationFactorforRectangularDistribution
2.1x10 oC/mL 3oC 500mL 3
TypeB, triangular

© SPEX CertiPrep 2011
U(Crmf) – From the Flask (cont.)
Pipette Flask
Value(V) utol utemp
Combined u(uc)
Relative u( )
Pipette 5 mL 0.004082 1.819 x 10⁻³ 0.004469 0.0008938 7.989 x 10⁻⁷
Flask 500 mL 0.08165 0.1819 0.19935 0.0003987 1.5896 x 10⁻⁷
Total 9.5793 x 10⁻⁷
CombinedUncertainty
0.08165 0.1819
0.19935
RelativeuuV
0.19935500
0.0003987

© SPEX CertiPrep 2011
ICP Measurement for standard-U(Stdm)
Measurement Stdm conc (mg/L)
1 101.260
2 100.853
3 100.985
4 101.542
5 100.914
6 100.685
7 101.251
8 100.720
9 100.654
0 100.985
s 0.29397
0
1s 0.29397mg/L
0… 100.985mg/L

© SPEX CertiPrep 2011
Standard Concentration Measurement-U(Stdm)
0.293979
0.09799
0.09799100.985
0.00097035
Value(V) sd # reps uc
Stdm 100.985 0.29397 9 0.09799 0.00097035 9.4158 x 10⁻⁷
© SPEX CertiPrep 2011
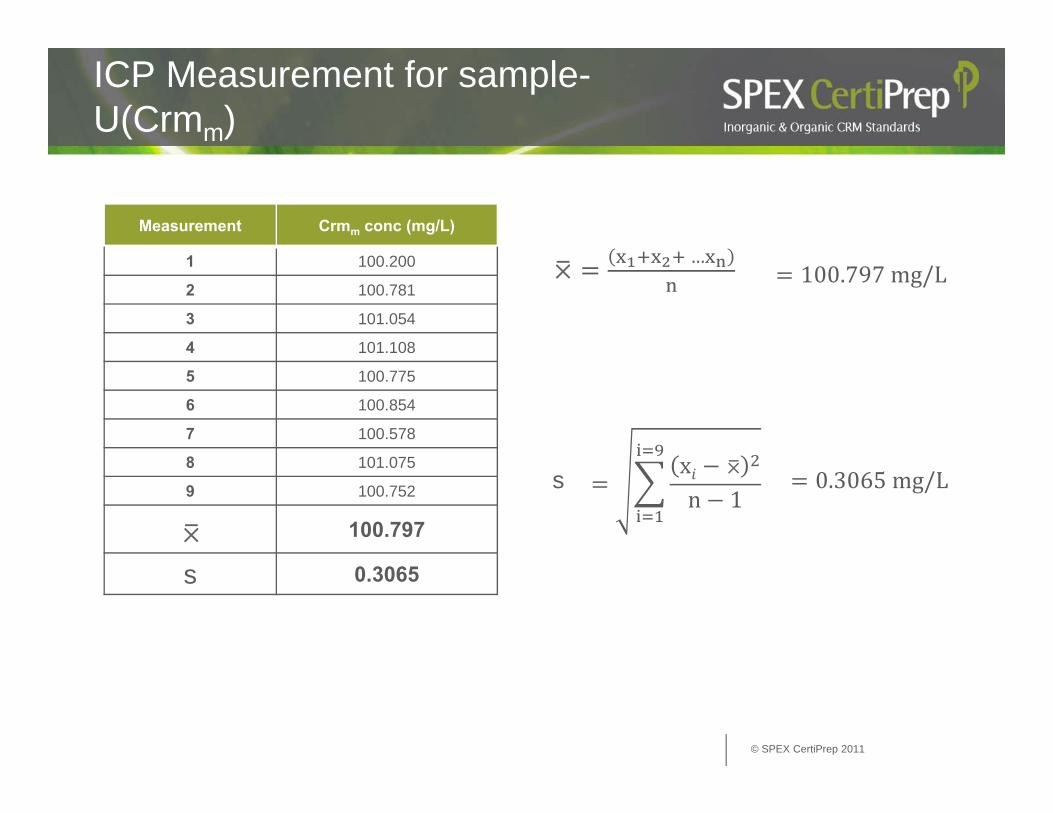
ICP Measurement for sample-U(Crmm)
Measurement Crmm conc (mg/L)
1 100.200
2 100.781
3 101.054
4 101.108
5 100.775
6 100.854
7 100.578
8 101.075
9 100.752
0 100.797
s 0.3065
0.3065mg/Lx 0
n 1s
0…
100.797mg/L

© SPEX CertiPrep 2011
Sample Concentration Measurement-U(Crmm)
Value(V) sd # reps Uc
Crmm 100.797 0.3065 9 0.102165 0.0010136 1.0273 x 10⁻⁶
usd9
0.30659
0.102165
RelativeuuV
0.102165 100.797
0.0010136

© SPEX CertiPrep 2011
Concentration And Uncertainty of Au Solution By ICP-OES
Symbol Input
Stdp Uncertainty SRM prep 1.1816 x 10⁻⁶
Crmf Uncertainty sample prep 9.5793 x 10⁻⁷
StdmUncertainty SRM
measurement 9.4158 x 10⁻⁷
CrmmUncertainty sample
measurement 1.0273 x 10⁻⁶
Total uc 4.10843 x 10⁻⁶
0.002026927
Uc (Cau) 0.002027 x (10004) 20.2771

© SPEX CertiPrep 2011
The Certified Value And The Expanded Uncertainty U for Gold Solution By ICP Analysis
The ICP value for Gold = 10,004 ± 41 mg/L
2 20.27740.554mg/L
CoverageFactorfor95%CI TotalCombinedUncertainty uc

© SPEX CertiPrep 2011
References
Kocherlakota, N, Obenauf, R, “A statistical approach to reporting uncertainty”
Quantifying Uncertainty Measurements, Eurachem/CETAC Guide
Kocherlakota, N, Obenauf, R, “Quantitative Calculation of Uncertainty Associated with Gold Reference Material,” To be published by NIST
British Standards 1797:1952

© SPEX CertiPrep 2011
Questions?

© SPEX CertiPrep 2011
New in 2011
Visit www.spexcertiprep.com for more information!
2011-2012 Catalog – Now available on CD!
New Consumer Safety standards kit for USP 232
(Part# USP-TXM1)

© SPEX CertiPrep 2011
Connect with us!
Come visit us on your favorite social networking site!
facebook.com/spexcertiprep
youtube.com/spexcertiprep@spexcertiprep

© SPEX CertiPrep 2011
Was This Presentation Informative?
We want to continue providing you with useful and informative webinars!
Complete the survey and tell us what you like, what we can improve, and what you would like to see in future webinars
Anyone who includes contact information will receive a token of our appreciation AND be entered into a drawing to receive a copy of The Elements!

© SPEX CertiPrep 2011
Free Drawing!
The Elements: A Visual Exploration of Every Known Atom in the Universe
By Theodore Gray

© SPEX CertiPrep 2011
Thank You!
Visit us online at www.spexcertiprep.com
Related Documents


![PPT MagneticNoise v3...requirement(PRM) requirement(SRM) Magnetic noise from IM(Intermediate Mass) magnets of PRM/SRM suspension system parameter value IMmass M IM [kg] 15.6 magnetic](https://static.cupdf.com/doc/110x72/5f140497d0f12214102c5b7f/ppt-magneticnoise-v3-requirementprm-requirementsrm-magnetic-noise-from-imintermediate.jpg)