Over the last few decades, a considerable amount of effort has been expended in understanding the or- ganizaon of poery producon among the Pre-Classic and Classic period Hohokam in the Phoenix Basin. This effort has incorporated mineralogical (Abbo 1994, 1995, 2000; Abbo et al. 2007a; Lack and Watkins 2010; Miksa 2001; Schaller 1994) and chemical tech- niques (Abbo 2001; Beck and Neff 2007; Cogswell et al. 2005; Darling et al. 2007) to idenfy several plain ware and red ware producon areas, and thereby gen- erate increasingly refined models of producon and consumpon of this poery over me. The greater ulity of these models is their ability to inform the larger quesons of Hohokam economic and social or- ganizaon. Despite the success of sourcing plain and red ware poery, red-on-buff poery producon and distribu- on is not well understood. Our understanding of buff ware producon and consumpon has lagged behind that of plain and red ware for two main reasons. First, prior to the last decade, our knowledge of middle Gila River mineralogy was inadequate. Second, buff ware poers typically added crushed schist and caliche to the sand component of their pots, thus complicang the task of the analyst in making confident assess- ments of where the temper fracon originated on the geologic landscape. More recently, the pioneering geological work by Elizabeth Miksa and colleagues (Miksa 2001; Miksa et al. 2004) has characterized and mapped mineralogical composion of sands across the Phoenix Basin, includ- ing the middle Gila River area. Miksa’s research allows ceramicists to idenfy buff ware producon locales by matching the sand temper in the poery to sands from specific areas. One of the major conclusions that has been drawn from this work over the past decade is that the middle Gila River Valley, and in parcular, the Snaketown area, was a major supplier of buff ware poery to selements in the lower Salt River Valley during the Sacaton phase (Abbo et al. 2007a). We present new evidence demonstrang that the Queen Creek area was also an important buff ware producon locale, though its relave importance seems to have varied considerably over me. While this area has been postulated as a possible source of buff ware vessels in the past (Lack et al. 2006), lile supporng data have been presented. The informaon we present in this paper is signifi- cant because it provides the data to assess the role of Queen Creek poers in the larger-scale Hohokam economy over me. Was buff ware produced in the Queen Creek area? If so, were buff wares exported out ABSTRACT Recent studies have idenfied intensive Hohokam Red-on-buff poery producon along the middle Gila River in the southern Phoenix Basin. We present new evidence demonstrang that villag- es in the vicinity of Queen Creek were also important producon locales. Ulizing ceramic petrography and low-powered opcal techniques, we present data confirming that 1) producon of buff ware did occur in the Queen Creek area, 2) producon occurred over several centuries, and 3) producon increased significantly in the late Sacaton/Soho phases, coinciding with the increased social fragmentaon that accompanied the collapse of the Hohokam ballcourt system. These results allow us to explore the connecon between the organizaon of poery producon and other socio- historical changes that occurred among the Hohokam. Andrew D. Lack Sophia E. Kelly David R. Abbo Joshua Was Pamela Cox IDENTIFYING AND CHARTING THE RISE OF SPECIALIZED RED-ON-BUFF POTTERY PRODUCTION ALONG QUEEN CREEK, PHOENIX BASIN Andrew D. Lack / / School of Human Evoluon and Social Change, Arizona State University / [email protected] Sophia E. Kelly / School of Human Evoluon and Social Change, Arizona State University / [email protected] David R. Abbo / School of Human Evoluon and Social Change, Arizona State University / [email protected] Joshua Was / School of Human Evoluon and Social Change, Arizona State University / [email protected] Pamela Cox / URS Corporaon, Phoenix / [email protected] Journal of Arizona Archaeology 2012, Volume 2, Number 1: 37-50 Copyright © 2012 by the Arizona Archaeological Council 37

Welcome message from author
This document is posted to help you gain knowledge. Please leave a comment to let me know what you think about it! Share it to your friends and learn new things together.
Transcript
Over the last few decades, a considerable amount of effort has been expended in understanding the or-ganization of pottery production among the Pre-Classic and Classic period Hohokam in the Phoenix Basin. This effort has incorporated mineralogical (Abbott 1994, 1995, 2000; Abbott et al. 2007a; Lack and Watkins 2010; Miksa 2001; Schaller 1994) and chemical tech-niques (Abbott 2001; Beck and Neff 2007; Cogswell et al. 2005; Darling et al. 2007) to identify several plain ware and red ware production areas, and thereby gen-erate increasingly refined models of production and consumption of this pottery over time. The greater utility of these models is their ability to inform the larger questions of Hohokam economic and social or-ganization.
Despite the success of sourcing plain and red ware pottery, red-on-buff pottery production and distribu-tion is not well understood. Our understanding of buff ware production and consumption has lagged behind
that of plain and red ware for two main reasons. First, prior to the last decade, our knowledge of middle Gila River mineralogy was inadequate. Second, buff ware potters typically added crushed schist and caliche to the sand component of their pots, thus complicating the task of the analyst in making confident assess-ments of where the temper fraction originated on the geologic landscape.
More recently, the pioneering geological work by Elizabeth Miksa and colleagues (Miksa 2001; Miksa et al. 2004) has characterized and mapped mineralogical composition of sands across the Phoenix Basin, includ-ing the middle Gila River area. Miksa’s research allows ceramicists to identify buff ware production locales by matching the sand temper in the pottery to sands from specific areas. One of the major conclusions that has been drawn from this work over the past decade is that the middle Gila River Valley, and in particular, the Snaketown area, was a major supplier of buff ware pottery to settlements in the lower Salt River Valley during the Sacaton phase (Abbott et al. 2007a).
We present new evidence demonstrating that the Queen Creek area was also an important buff ware production locale, though its relative importance seems to have varied considerably over time. While this area has been postulated as a possible source of buff ware vessels in the past (Lack et al. 2006), little supporting data have been presented.
The information we present in this paper is signifi-cant because it provides the data to assess the role of Queen Creek potters in the larger-scale Hohokam economy over time. Was buff ware produced in the Queen Creek area? If so, were buff wares exported out
ABSTRACT Recent studies have identified intensive Hohokam Red-on-buff
pottery production along the middle Gila River in the southern Phoenix Basin. We present new evidence demonstrating that villag-es in the vicinity of Queen Creek were also important production locales. Utilizing ceramic petrography and low-powered optical techniques, we present data confirming that 1) production of buff ware did occur in the Queen Creek area, 2) production occurred over several centuries, and 3) production increased significantly in the late Sacaton/Soho phases, coinciding with the increased social fragmentation that accompanied the collapse of the Hohokam ballcourt system. These results allow us to explore the connection between the organization of pottery production and other socio-historical changes that occurred among the Hohokam.
Andrew D. Lack Sophia E. Kelly David R. Abbott Joshua Watts Pamela Cox
IDENTIFYING AND CHARTING THE RISE OF
SPECIALIZED RED-ON-BUFF POTTERY
PRODUCTION ALONG QUEEN CREEK,
PHOENIX BASIN
Andrew D. Lack / / School of Human Evolution and Social Change, Arizona State University / [email protected] Sophia E. Kelly / School of Human Evolution and Social Change, Arizona State University / [email protected] David R. Abbott / School of Human Evolution and Social Change, Arizona State University / [email protected] Joshua Watts / School of Human Evolution and Social Change, Arizona State University / [email protected] Pamela Cox / URS Corporation, Phoenix / [email protected]
Journal of Arizona Archaeology 2012, Volume 2, Number 1: 37-50 Copyright © 2012 by the Arizona Archaeological Council
37
of the Queen Creek area? If so, does their percentage in assemblages change over time locally or in other areas?
RESEARCH STRATEGY
Samples were selected from sites within the
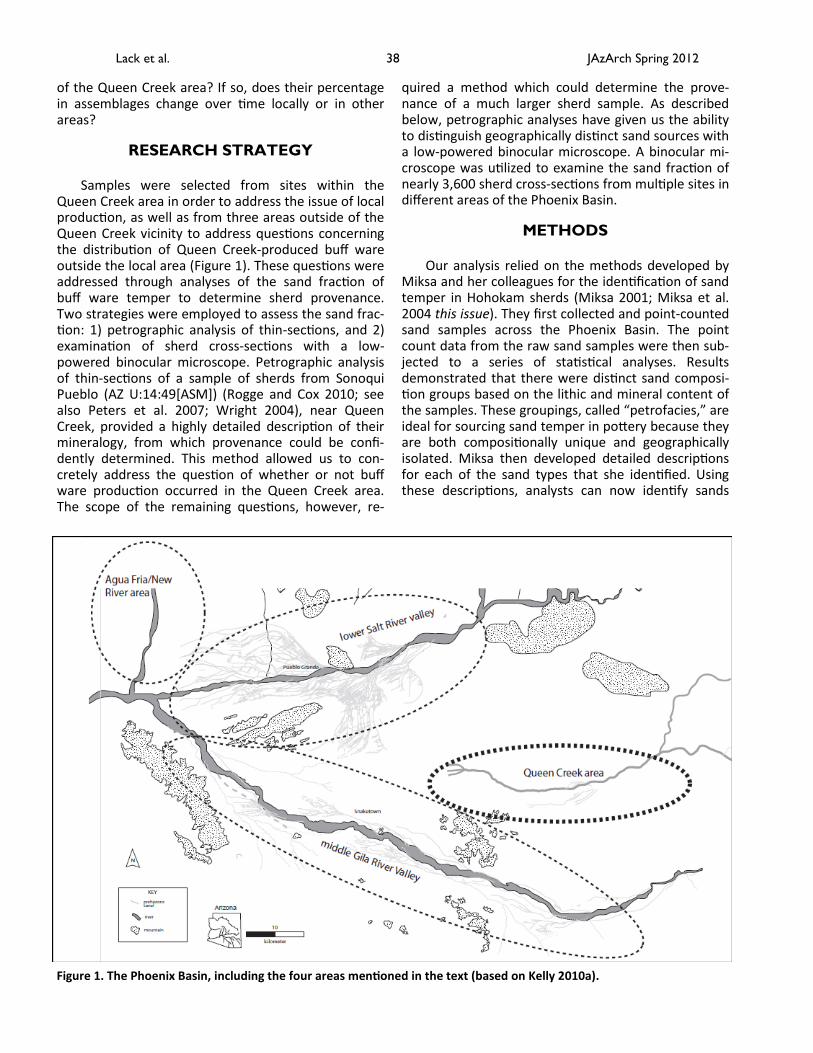
Queen Creek area in order to address the issue of local production, as well as from three areas outside of the Queen Creek vicinity to address questions concerning the distribution of Queen Creek-produced buff ware outside the local area (Figure 1). These questions were addressed through analyses of the sand fraction of buff ware temper to determine sherd provenance. Two strategies were employed to assess the sand frac-tion: 1) petrographic analysis of thin-sections, and 2) examination of sherd cross-sections with a low-powered binocular microscope. Petrographic analysis of thin-sections of a sample of sherds from Sonoqui Pueblo (AZ U:14:49[ASM]) (Rogge and Cox 2010; see also Peters et al. 2007; Wright 2004), near Queen Creek, provided a highly detailed description of their mineralogy, from which provenance could be confi-dently determined. This method allowed us to con-cretely address the question of whether or not buff ware production occurred in the Queen Creek area. The scope of the remaining questions, however, re-
quired a method which could determine the prove-nance of a much larger sherd sample. As described below, petrographic analyses have given us the ability to distinguish geographically distinct sand sources with a low-powered binocular microscope. A binocular mi-croscope was utilized to examine the sand fraction of nearly 3,600 sherd cross-sections from multiple sites in different areas of the Phoenix Basin.
METHODS
Our analysis relied on the methods developed by
Miksa and her colleagues for the identification of sand temper in Hohokam sherds (Miksa 2001; Miksa et al. 2004 this issue). They first collected and point-counted sand samples across the Phoenix Basin. The point count data from the raw sand samples were then sub-jected to a series of statistical analyses. Results demonstrated that there were distinct sand composi-tion groups based on the lithic and mineral content of the samples. These groupings, called “petrofacies,” are ideal for sourcing sand temper in pottery because they are both compositionally unique and geographically isolated. Miksa then developed detailed descriptions for each of the sand types that she identified. Using these descriptions, analysts can now identify sands
JAzArch Spring 2012 38 Lack et al.
Figure 1. The Phoenix Basin, including the four areas mentioned in the text (based on Kelly 2010a).
from different areas using a low-powered binocular microscope.
One complicating factor in this procedure, howev-er, is those buff ware sherds tempered exclusively with mica schist, which cannot be sourced to a geographic location with a binocular microscope. These sherds may represent one or multiple production areas, and at times account for nearly half of the buff ware as-semblages. The analyses presented below are neces-sarily biased towards those buff ware sherds whose temper contained a sand component. Chemical anal-yses of the schist and clay of these sherds, as recently approached by Darling and colleagues (2007; see also Cogswell et al. 2005), is the most promising avenue for addressing this vexing problem.
Thin-section Analysis
The 12 buff ware sherds thin-sectioned from Sonoqui Pueblo, near Queen Creek, had been previ-ously inspected with a low-powered binocular micro-scope by the authors to determine if they contained enough sand temper to match to a specific petrofa-cies. Sherds were thin-sectioned perpendicular to the vessel wall. Thin sections of several different areas of a sherd were then mounted on a single slide to increase the surface area available for identification. The sec-tions were cut to a standard 30 µ thick and were par-tially stained with potassium cobaltinitrite to aid the identification of potassium feldspars.1 The petrograph-ic point-counting methods employed in the analysis were based on the sourcing methodologies outlined by Miksa and her colleagues (Miksa and Castro-Reino 2001; Miksa et al. 2004). All sherds were point-counted using the Gazzi-Dickinson technique by pe-trographer Sophie Kelly (2010b). In this technique, sand-size minerals are counted to their individual phase irrespective of whether or not they are attached to other minerals in a rock fragment. Minerals that are smaller than sand-sized, but appear in a sand-sized rock fragment are counted as that lithic type. This technique reduces the effects of erosion and transpor-tation of mineral and lithic fragments from bedrock sources. Miksa (1999) has refined the Gazzi-Dickinson technique for analysis of coarse-foliated rocks such as schist. The parameters used for point counting are those published in the updated sand petrofacies mod-el for the Salt and Gila basins (Miksa et al. 2004).
Binocular Microscope Examination
The temper in a fresh cross-section of each sherd was examined with a binocular microscope. To aid in the petrofacies identification, raw sand samples col-lected from wash beds in each petrofacies were re-peatedly studied and referenced. In addition, each pet-rofacies had a corresponding small "grain box" that contained individually identified particles of rock and
mineral types along with other comparative samples.2
The estimated percentages for each rock and mineral type were then used to navigate through a detailed and comprehensive flow chart, used as a sand identifi-cation key (Miksa et al. 2004: Figure 2.12).
SAMPLING
The goal of the sampling procedure for this study
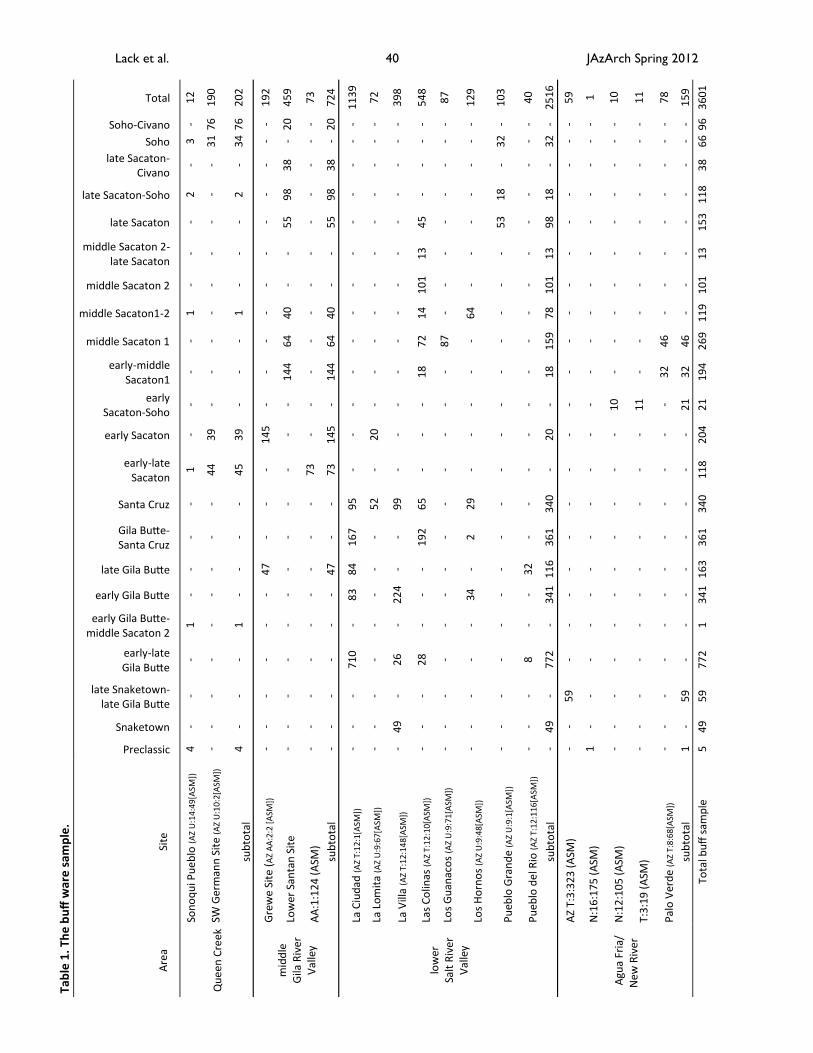
was to analyze buff ware sherds from both within and outside the Queen Creek area in order to answer ques-tions concerning both local production and non-local distribution (Table 1). Two sites were sampled from the Queen Creek area, in the Queen Creek petrofacies zone (Petrofacies D). Twelve sherds from Sonoqui Pueblo were analyzed under the binocular microscope and thin-sectioned, while 190 sherds from the South-west Germann site (AZ U:10:2[ASM]) were examined with a binocular microscope alone (see Lack et al. 2006 for previous ceramic analysis at AZ U:10:2[ASM]). Sherds from Sonoqui Pueblo were thin sectioned be-cause an existing contract with URS supplied funds for the analysis. Similar funds were not available for thin sectioning samples from the Southwest Germann site.
Local production at both sites was expected based on the criterion of abundance (Bishop et al. 1982; Rands and Bishop 1980). Sacaton and Soho phase con-texts contained unusually high percentages of buff wares. Other researchers have suggested that high proportions of buff ware in the site ceramic assem-blage may indicate local production (Bishop et al. 1982; Doyel 1981:58; Lack and Watkins 2010: Rafferty 1982:211; Rands and Bishop 1980; Walsh-Anduze 1993). Buff ware assemblages of Sacaton phase sites usually comprise approximately 20 percent of ceramic assemblages (Abbott 2009). In contrast, the percent-age of buff ware from Sacaton phase contexts at the Southwest Germann Site averaged 57 percent (Watts 2007). Buff ware in Soho phase contexts is expected to total 5-10 percent (Doyel 1974:52, 71, 95, 139). At both Sonoqui Pueblo and the Southwest Germann Site, buff ware accounted for more than 20 percent of the pottery from Soho phase contexts (Watts 2007)
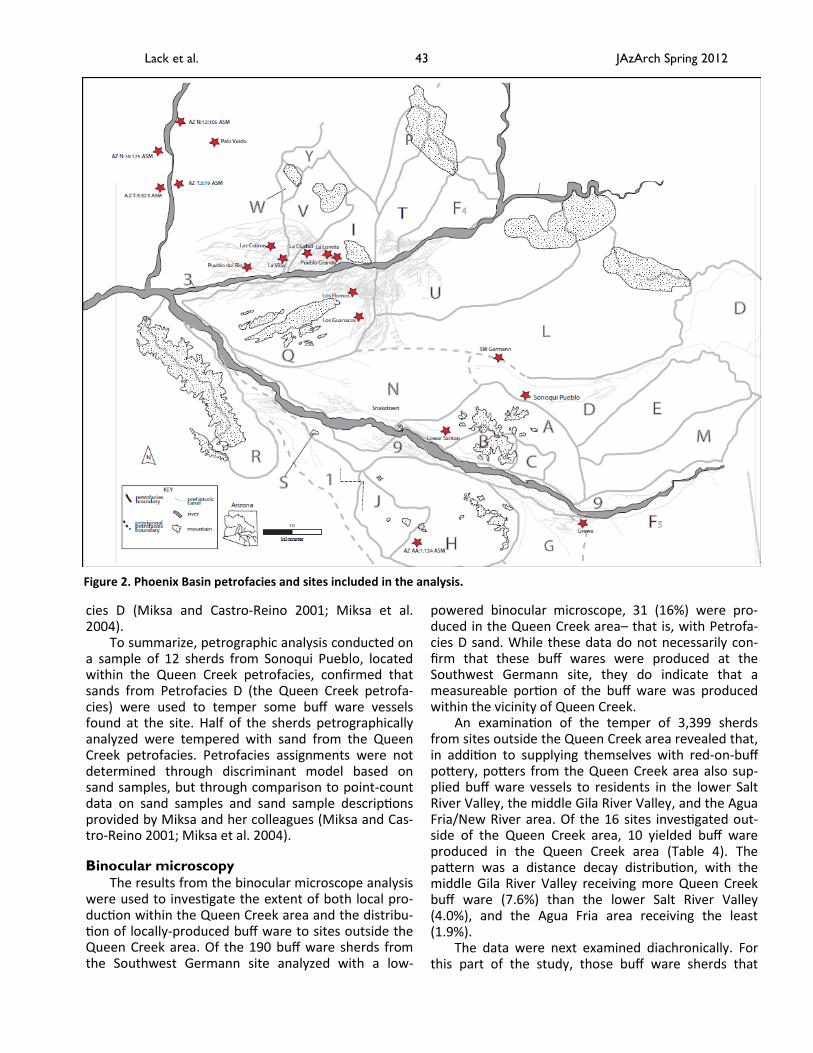
Red-on-buff samples were also selected from 16 sites outside of the Queen Creek area. These included three sites in the middle Gila River Valley, eight sites in the lower Salt River Valley, and five sites in the Agua Fria/New River areas (Figure 2). These sites ranged in age from the Snaketown to the Soho phase. In all cas-es, buff ware sherds were selected from contexts dat-ed by the typological identification of buff ware sherds according to Wallace’s refined seriation.
JAzArch Spring 2012 39 Lack et al.
JAzArch Spring 2012 40 Lack et al. Ta
ble
1. T
he
bu
ff w
are
sam
ple
.
Are
a Si
te
Preclassic
Snaketown
late Snaketown- late Gila Butte
early-late Gila Butte
early Gila Butte-middle Sacaton 2
early Gila Butte
late Gila Butte
Gila Butte- Santa Cruz
Santa Cruz
early-late Sacaton
early Sacaton
early Sacaton-Soho
early-middle Sacaton1
middle Sacaton 1
middle Sacaton1-2
middle Sacaton 2
middle Sacaton 2-late Sacaton
late Sacaton
late Sacaton-Soho
late Sacaton-Civano
Soho
Soho-Civano
Total
Qu
een
Cre
ek
Son
oq
ui P
ue
blo
(AZ
U:1
4:49
[ASM
])
4
- -
- 1
-
- -
- 1
-
- -
- 1
-
- -
2
- 3
-
12
SW G
erm
ann
Sit
e (A
Z U
:10:
2[A
SM])
-
- -
- -
- -
- -
44
3
9
- -
- -
- -
- -
- 3
1 7
6
19
0
sub
tota
l 4
-
- -
1
- -
- -
45
3
9
- -
- 1
-
- -
2
- 3
4 7
6
20
2
mid
dle
G
ila R
iver
V
alle
y
Gre
we
Site
(A
Z A
A:2
:2 [
ASM
])
- -
- -
- -
47
-
- -
14
5
- -
- -
- -
- -
- -
- 1
92
Low
er S
anta
n S
ite
-
- -
- -
- -
- -
- -
- 1
44
6
4
40
-
- 5
5
98
3
8
- 2
0
45
9
AA
:1:1
24
(A
SM)
- -
- -
- -
- -
- 7
3
- -
- -
- -
- -
- -
- -
73
sub
tota
l -
- -
- -
- 4
7
- -
73
1
45
-
14
4
64
4
0
- -
55
9
8
38
-
20
7
24
low
er
Salt
Riv
er
Val
ley
La C
iud
ad (A
Z T:
12:
1[A
SM])
-
- -
71
0
- 8
3
84
1
67
9
5
- -
- -
- -
- -
- -
- -
- 1
13
9
La L
om
ita
(AZ
U:9
:67
[ASM
])
- -
- -
- -
- -
52
-
20
-
- -
- -
- -
- -
- -
72
La V
illa
(AZ
T:12
:14
8[A
SM])
-
49
-
26
-
22
4
- -
99
-
- -
- -
- -
- -
- -
- -
39
8
Las
Co
linas
(AZ
T:12
:10[
ASM
])
- -
- 2
8
- -
- 1
92
6
5
- -
- 1
8
72
1
4
10
1
13
4
5
- -
- -
54
8
Los
Gu
anac
os
(AZ
U:9
:71[
ASM
])
- -
- -
- -
- -
- -
- -
- 8
7
- -
- -
- -
- -
87
Los
Ho
rno
s (A
Z U
:9:4
8[A
SM])
-
- -
- -
34
-
2
29
-
- -
- -
64
-
- -
- -
- -
12
9
Pu
eblo
Gra
nd
e (A
Z U
:9:1
[ASM
])
- -
- -
- -
- -
- -
- -
- -
- -
- 5
3
18
-
32
-
10
3
Pu
eblo
de
l Rio
(AZ
T:12
:116
[ASM
])
- -
- 8
-
- 3
2
- -
- -
- -
- -
- -
- -
- -
- 4
0
sub
tota
l -
49
-
77
2
- 3
41
1
16
3
61
3
40
-
20
-
18
1
59
7
8
10
1
13
9
8
18
-
32
-
25
16
AZ
T:3
:32
3 (
ASM
) -
- 5
9
- -
- -
- -
- -
- -
- -
- -
- -
- -
- 5
9
Agu
a Fr
ia/
New
Riv
er
N:1
6:1
75
(A
SM)
1
- -
- -
- -
- -
- -
- -
- -
- -
- -
- -
- 1
N:1
2:1
05
(A
SM)
- -
- -
- -
- -
- -
- 1
0
- -
- -
- -
- -
- -
10
T:3
:19
(A
SM)
- -
- -
- -
- -
- -
- 1
1
- -
- -
- -
- -
- -
11
Pal
o V
erd
e (A
Z T:
8:68
[ASM
])
- -
- -
- -
- -
- -
- -
32
4
6
- -
- -
- -
- -
78
sub
tota
l 1
-
59
-
- -
- -
- -
- 2
1
32
4
6
- -
- -
- -
- -
15
9
To
tal b
uff
sam
ple
5
4
9
59
7
72
1
3
41
1
63
3
61
3
40
1
18
2
04
2
1
19
4
26
9
11
9
10
1
13
1
53
1
18
3
8
66
96
3
60
1
RESULTS
Thin-section Petrofacies Determination
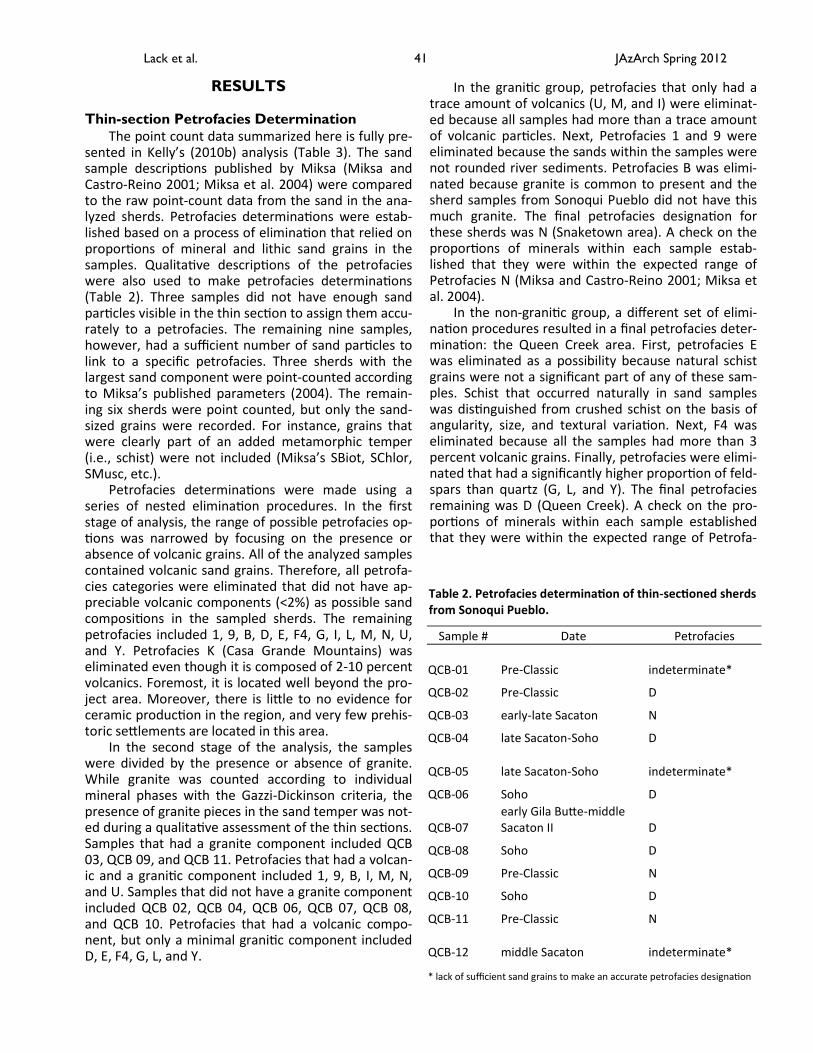
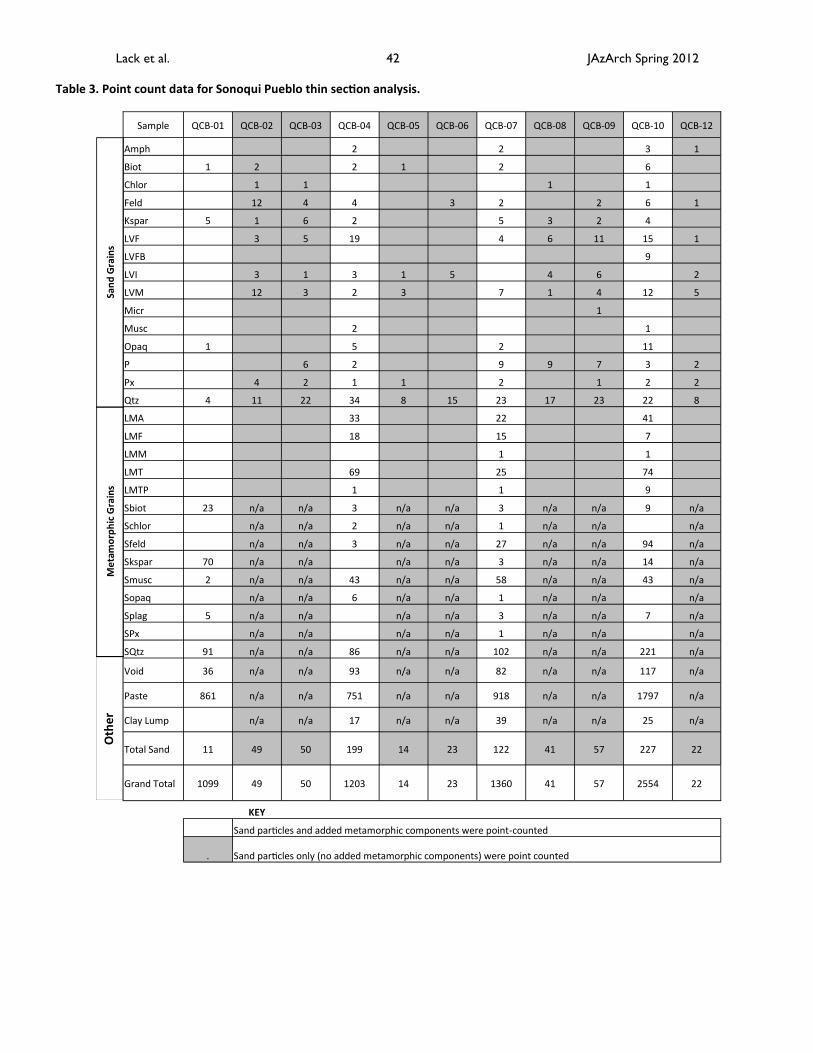
The point count data summarized here is fully pre-sented in Kelly’s (2010b) analysis (Table 3). The sand sample descriptions published by Miksa (Miksa and Castro-Reino 2001; Miksa et al. 2004) were compared to the raw point-count data from the sand in the ana-lyzed sherds. Petrofacies determinations were estab-lished based on a process of elimination that relied on proportions of mineral and lithic sand grains in the samples. Qualitative descriptions of the petrofacies were also used to make petrofacies determinations (Table 2). Three samples did not have enough sand particles visible in the thin section to assign them accu-rately to a petrofacies. The remaining nine samples, however, had a sufficient number of sand particles to link to a specific petrofacies. Three sherds with the largest sand component were point-counted according to Miksa’s published parameters (2004). The remain-ing six sherds were point counted, but only the sand-sized grains were recorded. For instance, grains that were clearly part of an added metamorphic temper (i.e., schist) were not included (Miksa’s SBiot, SChlor, SMusc, etc.).
Petrofacies determinations were made using a series of nested elimination procedures. In the first stage of analysis, the range of possible petrofacies op-tions was narrowed by focusing on the presence or absence of volcanic grains. All of the analyzed samples contained volcanic sand grains. Therefore, all petrofa-cies categories were eliminated that did not have ap-preciable volcanic components (<2%) as possible sand compositions in the sampled sherds. The remaining petrofacies included 1, 9, B, D, E, F4, G, I, L, M, N, U, and Y. Petrofacies K (Casa Grande Mountains) was eliminated even though it is composed of 2-10 percent volcanics. Foremost, it is located well beyond the pro-ject area. Moreover, there is little to no evidence for ceramic production in the region, and very few prehis-toric settlements are located in this area.
In the second stage of the analysis, the samples were divided by the presence or absence of granite. While granite was counted according to individual mineral phases with the Gazzi-Dickinson criteria, the presence of granite pieces in the sand temper was not-ed during a qualitative assessment of the thin sections. Samples that had a granite component included QCB 03, QCB 09, and QCB 11. Petrofacies that had a volcan-ic and a granitic component included 1, 9, B, I, M, N, and U. Samples that did not have a granite component included QCB 02, QCB 04, QCB 06, QCB 07, QCB 08, and QCB 10. Petrofacies that had a volcanic compo-nent, but only a minimal granitic component included D, E, F4, G, L, and Y.
In the granitic group, petrofacies that only had a trace amount of volcanics (U, M, and I) were eliminat-ed because all samples had more than a trace amount of volcanic particles. Next, Petrofacies 1 and 9 were eliminated because the sands within the samples were not rounded river sediments. Petrofacies B was elimi-nated because granite is common to present and the sherd samples from Sonoqui Pueblo did not have this much granite. The final petrofacies designation for these sherds was N (Snaketown area). A check on the proportions of minerals within each sample estab-lished that they were within the expected range of Petrofacies N (Miksa and Castro-Reino 2001; Miksa et al. 2004).
In the non-granitic group, a different set of elimi-nation procedures resulted in a final petrofacies deter-mination: the Queen Creek area. First, petrofacies E was eliminated as a possibility because natural schist grains were not a significant part of any of these sam-ples. Schist that occurred naturally in sand samples was distinguished from crushed schist on the basis of angularity, size, and textural variation. Next, F4 was eliminated because all the samples had more than 3 percent volcanic grains. Finally, petrofacies were elimi-nated that had a significantly higher proportion of feld-spars than quartz (G, L, and Y). The final petrofacies remaining was D (Queen Creek). A check on the pro-portions of minerals within each sample established that they were within the expected range of Petrofa-
JAzArch Spring 2012 41 Lack et al.
Sample # Date Petrofacies
QCB-01 Pre-Classic indeterminate*
QCB-02 Pre-Classic D
QCB-03 early-late Sacaton N
QCB-04 late Sacaton-Soho D
QCB-05 late Sacaton-Soho indeterminate*
QCB-06 Soho D
QCB-07 early Gila Butte-middle Sacaton II D
QCB-08 Soho D
QCB-09 Pre-Classic N
QCB-10 Soho D
QCB-11 Pre-Classic N
QCB-12 middle Sacaton indeterminate*
* lack of sufficient sand grains to make an accurate petrofacies designation
Table 2. Petrofacies determination of thin-sectioned sherds from Sonoqui Pueblo.
JAzArch Spring 2012 42 Lack et al.
Table 3. Point count data for Sonoqui Pueblo thin section analysis.
Sample QCB-01 QCB-02 QCB-03 QCB-04 QCB-05 QCB-06 QCB-07 QCB-08 QCB-09 QCB-10 QCB-12
Amph 2 2 3 1
Biot 1 2 2 1 2 6
Chlor 1 1 1 1
Feld 12 4 4 3 2 2 6 1
Kspar 5 1 6 2 5 3 2 4
LVF 3 5 19 4 6 11 15 1
LVFB 9
LVI 3 1 3 1 5 4 6 2
LVM 12 3 2 3 7 1 4 12 5
Micr 1
Musc 2 1
Opaq 1 5 2 11
P 6 2 9 9 7 3 2
Px 4 2 1 1 2 1 2 2
Qtz 4 11 22 34 8 15 23 17 23 22 8
LMA 33 22 41
LMF 18 15 7
LMM 1 1
LMT 69 25 74
LMTP 1 1 9
Sbiot 23 n/a n/a 3 n/a n/a 3 n/a n/a 9 n/a
Schlor n/a n/a 2 n/a n/a 1 n/a n/a n/a
Sfeld n/a n/a 3 n/a n/a 27 n/a n/a 94 n/a
Skspar 70 n/a n/a n/a n/a 3 n/a n/a 14 n/a
Smusc 2 n/a n/a 43 n/a n/a 58 n/a n/a 43 n/a
Sopaq n/a n/a 6 n/a n/a 1 n/a n/a n/a
Splag 5 n/a n/a n/a n/a 3 n/a n/a 7 n/a
SPx n/a n/a n/a n/a 1 n/a n/a n/a
SQtz 91 n/a n/a 86 n/a n/a 102 n/a n/a 221 n/a
Void 36 n/a n/a 93 n/a n/a 82 n/a n/a 117 n/a
Paste 861 n/a n/a 751 n/a n/a 918 n/a n/a 1797 n/a
Clay Lump n/a n/a 17 n/a n/a 39 n/a n/a 25 n/a
Total Sand 11 49 50 199 14 23 122 41 57 227 22
Grand Total 1099 49 50 1203 14 23 1360 41 57 2554 22
KEY
Sand particles and added metamorphic components were point-counted
. Sand particles only (no added metamorphic components) were point counted
San
d G
rain
s M
eta
mo
rph
ic G
rain
s O
the
r
cies D (Miksa and Castro-Reino 2001; Miksa et al. 2004).
To summarize, petrographic analysis conducted on a sample of 12 sherds from Sonoqui Pueblo, located within the Queen Creek petrofacies, confirmed that sands from Petrofacies D (the Queen Creek petrofa-cies) were used to temper some buff ware vessels found at the site. Half of the sherds petrographically analyzed were tempered with sand from the Queen Creek petrofacies. Petrofacies assignments were not determined through discriminant model based on sand samples, but through comparison to point-count data on sand samples and sand sample descriptions provided by Miksa and her colleagues (Miksa and Cas-tro-Reino 2001; Miksa et al. 2004).
Binocular microscopy
The results from the binocular microscope analysis were used to investigate the extent of both local pro-duction within the Queen Creek area and the distribu-tion of locally-produced buff ware to sites outside the Queen Creek area. Of the 190 buff ware sherds from the Southwest Germann site analyzed with a low-
powered binocular microscope, 31 (16%) were pro-duced in the Queen Creek area– that is, with Petrofa-cies D sand. While these data do not necessarily con-firm that these buff wares were produced at the Southwest Germann site, they do indicate that a measureable portion of the buff ware was produced within the vicinity of Queen Creek.
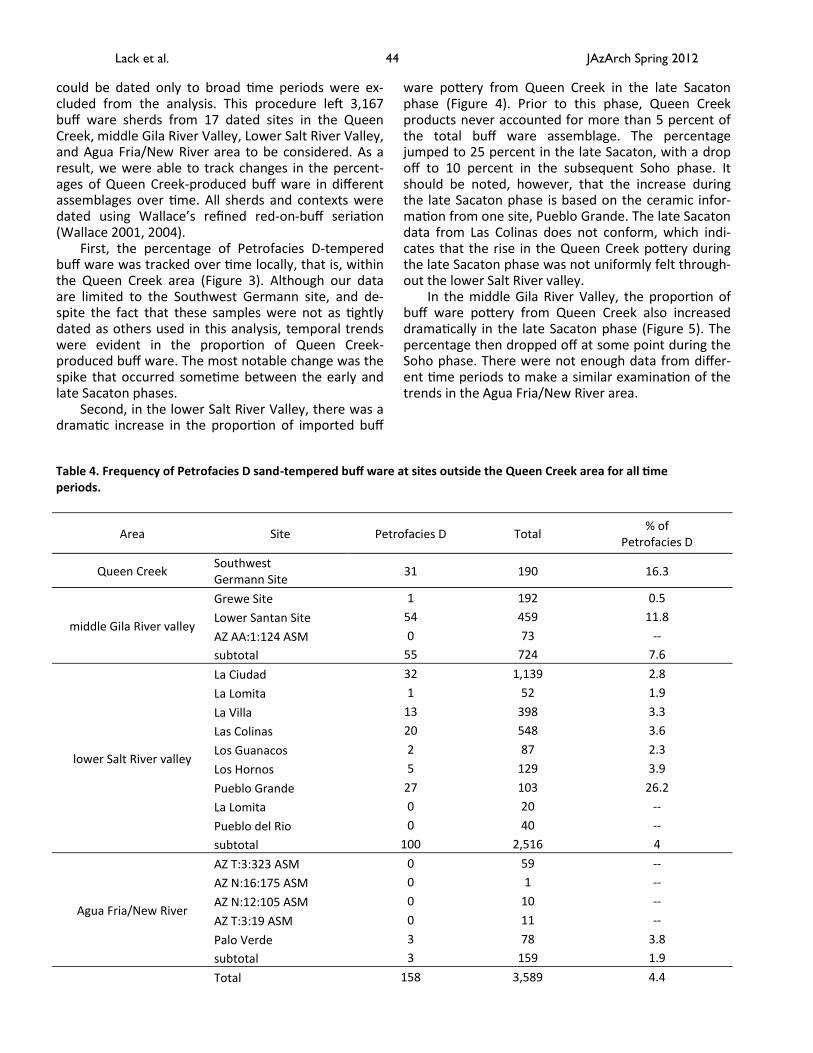
An examination of the temper of 3,399 sherds from sites outside the Queen Creek area revealed that, in addition to supplying themselves with red-on-buff pottery, potters from the Queen Creek area also sup-plied buff ware vessels to residents in the lower Salt River Valley, the middle Gila River Valley, and the Agua Fria/New River area. Of the 16 sites investigated out-side of the Queen Creek area, 10 yielded buff ware produced in the Queen Creek area (Table 4). The pattern was a distance decay distribution, with the middle Gila River Valley receiving more Queen Creek buff ware (7.6%) than the lower Salt River Valley (4.0%), and the Agua Fria area receiving the least (1.9%).
The data were next examined diachronically. For this part of the study, those buff ware sherds that
JAzArch Spring 2012 43 Lack et al.
Figure 2. Phoenix Basin petrofacies and sites included in the analysis.
could be dated only to broad time periods were ex-cluded from the analysis. This procedure left 3,167 buff ware sherds from 17 dated sites in the Queen Creek, middle Gila River Valley, Lower Salt River Valley, and Agua Fria/New River area to be considered. As a result, we were able to track changes in the percent-ages of Queen Creek-produced buff ware in different assemblages over time. All sherds and contexts were dated using Wallace’s refined red-on-buff seriation (Wallace 2001, 2004).
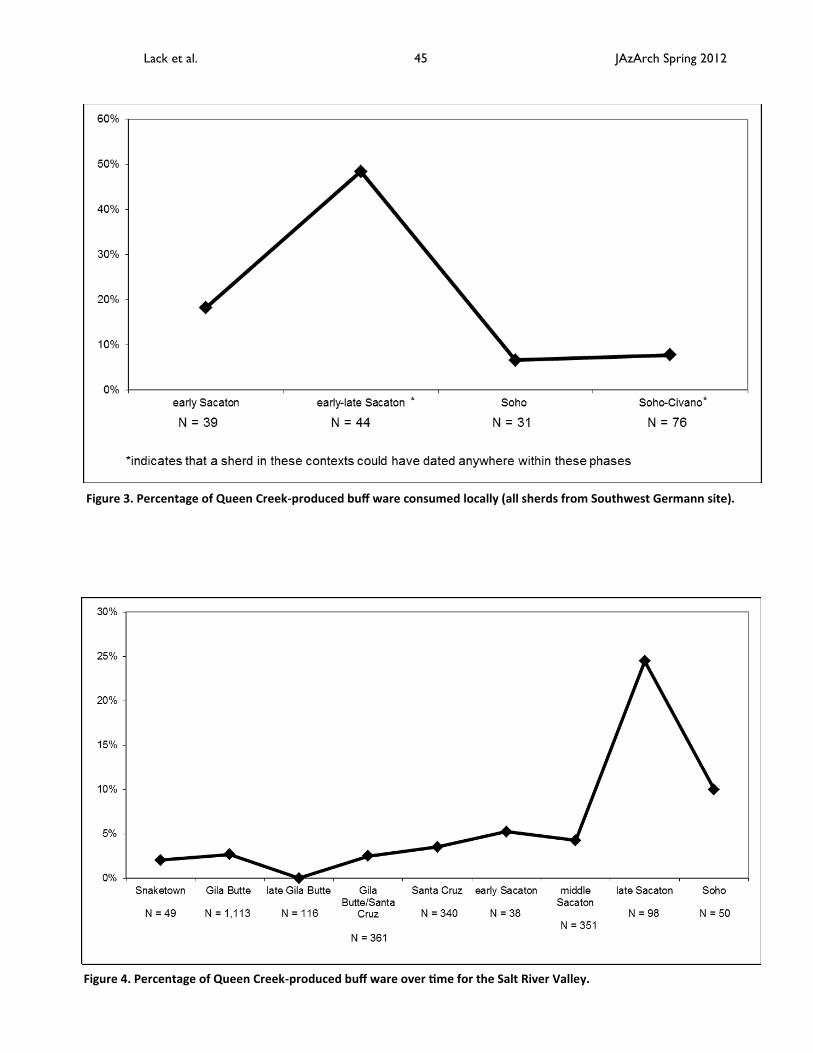
First, the percentage of Petrofacies D-tempered buff ware was tracked over time locally, that is, within the Queen Creek area (Figure 3). Although our data are limited to the Southwest Germann site, and de-spite the fact that these samples were not as tightly dated as others used in this analysis, temporal trends were evident in the proportion of Queen Creek-produced buff ware. The most notable change was the spike that occurred sometime between the early and late Sacaton phases.
Second, in the lower Salt River Valley, there was a dramatic increase in the proportion of imported buff
JAzArch Spring 2012 44 Lack et al.
Area Site Petrofacies D Total % of
Petrofacies D
Queen Creek Southwest Germann Site
31 190 16.3
middle Gila River valley
Grewe Site 1 192 0.5
Lower Santan Site 54 459 11.8
AZ AA:1:124 ASM 0 73 --
subtotal 55 724 7.6
lower Salt River valley
La Ciudad 32 1,139 2.8
La Lomita 1 52 1.9
La Villa 13 398 3.3
Las Colinas 20 548 3.6
Los Guanacos 2 87 2.3
Los Hornos 5 129 3.9
Pueblo Grande 27 103 26.2
La Lomita 0 20 --
Pueblo del Rio 0 40 --
subtotal 100 2,516 4
Agua Fria/New River
AZ T:3:323 ASM 0 59 --
AZ N:16:175 ASM 0 1 --
AZ N:12:105 ASM 0 10 --
AZ T:3:19 ASM 0 11 --
Palo Verde 3 78 3.8
subtotal 3 159 1.9
Total 158 3,589 4.4
Table 4. Frequency of Petrofacies D sand-tempered buff ware at sites outside the Queen Creek area for all time periods.
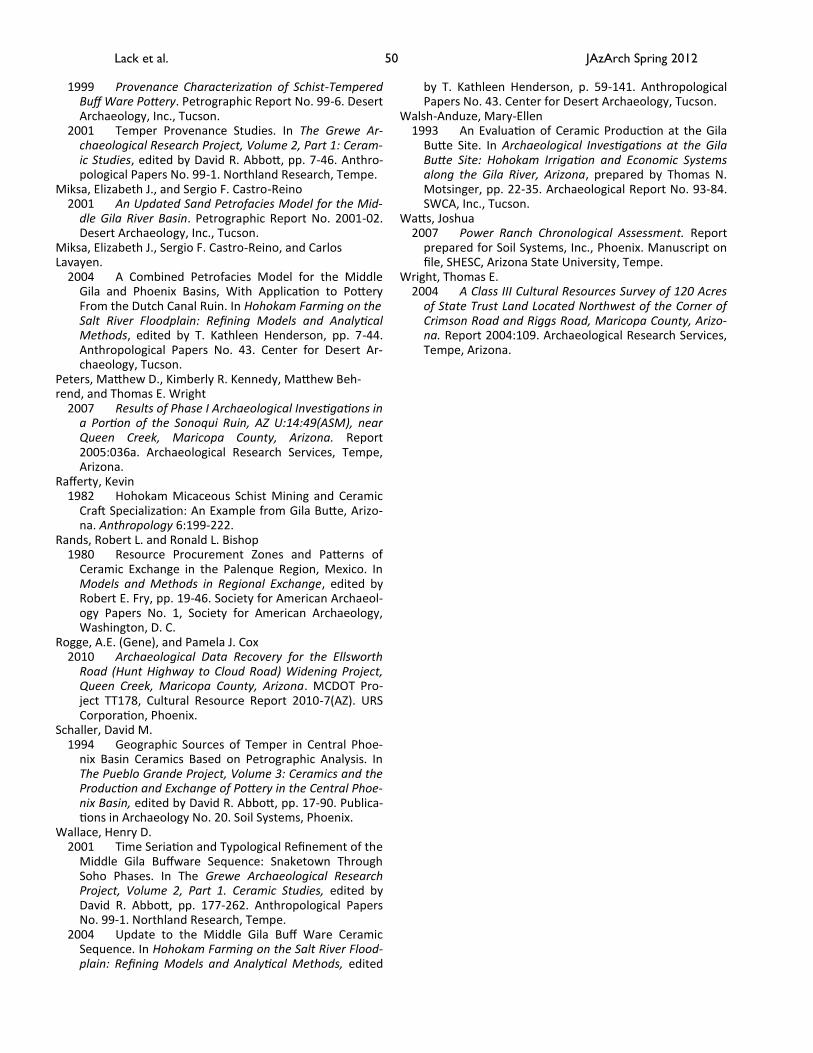
ware pottery from Queen Creek in the late Sacaton phase (Figure 4). Prior to this phase, Queen Creek products never accounted for more than 5 percent of the total buff ware assemblage. The percentage jumped to 25 percent in the late Sacaton, with a drop off to 10 percent in the subsequent Soho phase. It should be noted, however, that the increase during the late Sacaton phase is based on the ceramic infor-mation from one site, Pueblo Grande. The late Sacaton data from Las Colinas does not conform, which indi-cates that the rise in the Queen Creek pottery during the late Sacaton phase was not uniformly felt through-out the lower Salt River valley.
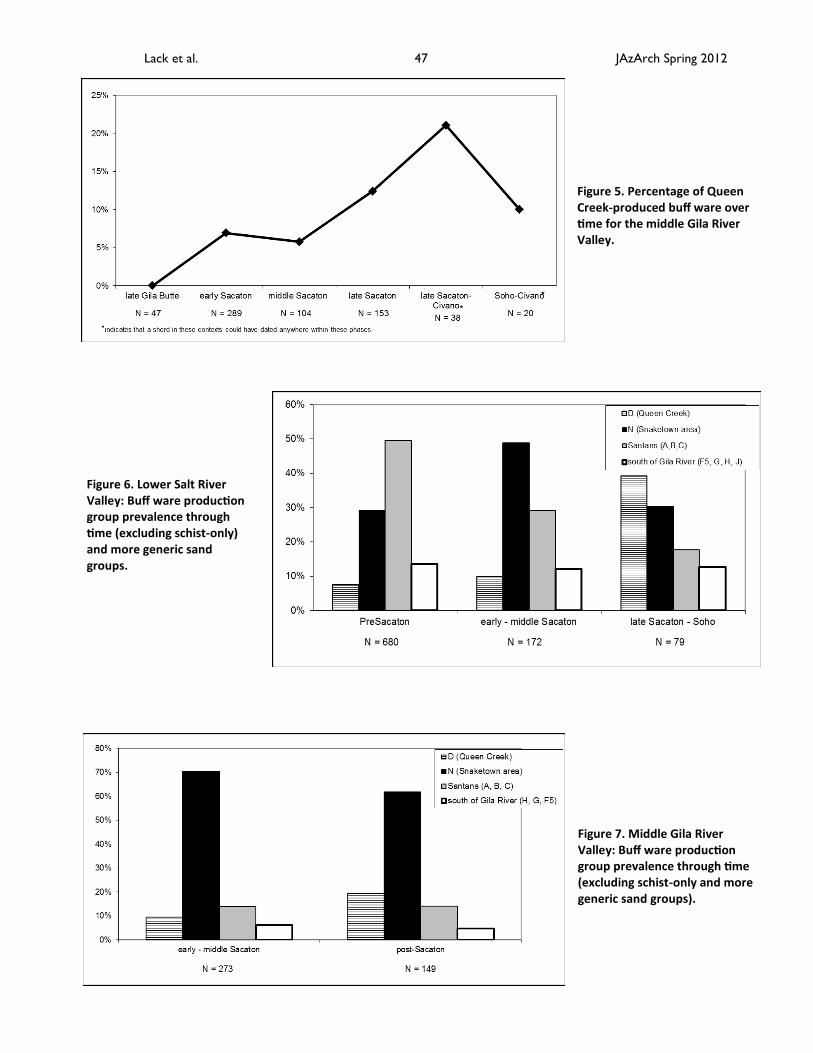
In the middle Gila River Valley, the proportion of buff ware pottery from Queen Creek also increased dramatically in the late Sacaton phase (Figure 5). The percentage then dropped off at some point during the Soho phase. There were not enough data from differ-ent time periods to make a similar examination of the trends in the Agua Fria/New River area.
JAzArch Spring 2012 45 Lack et al.
Figure 4. Percentage of Queen Creek-produced buff ware over time for the Salt River Valley.
Figure 3. Percentage of Queen Creek-produced buff ware consumed locally (all sherds from Southwest Germann site).
DISCUSSION The data from this study have demonstrated that
Queen Creek potters produced buff ware pottery. This pottery was manufactured for local use, as well as for exchange. The relative importance of Queen Creek potters as buff ware suppliers also changed in signifi-cant ways over time.
One dominant pattern stood out from all of the results: the relatively small amount of buff ware pottery exported from the Queen Creek area between the Snaketown and the middle Sacaton phase com-pared to the amount that circulated during the late Sacaton and subsequent phases. These results become especially interesting when placed in the larger con-text of buff ware production over time.
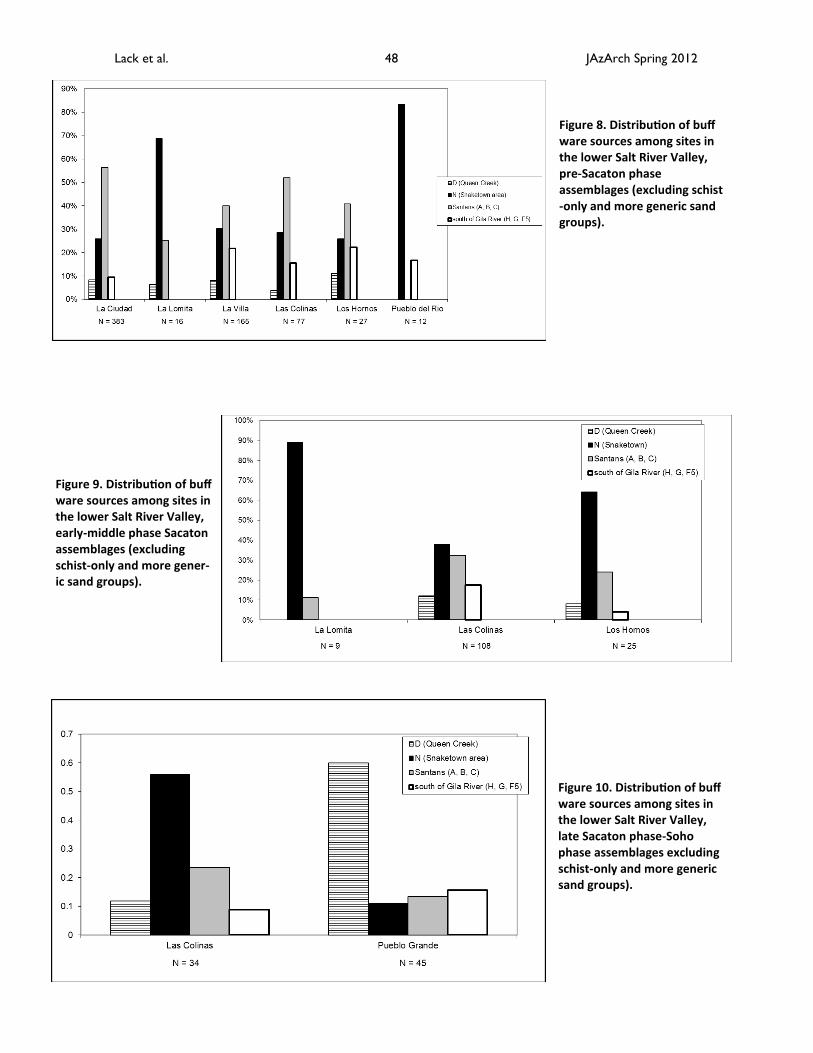
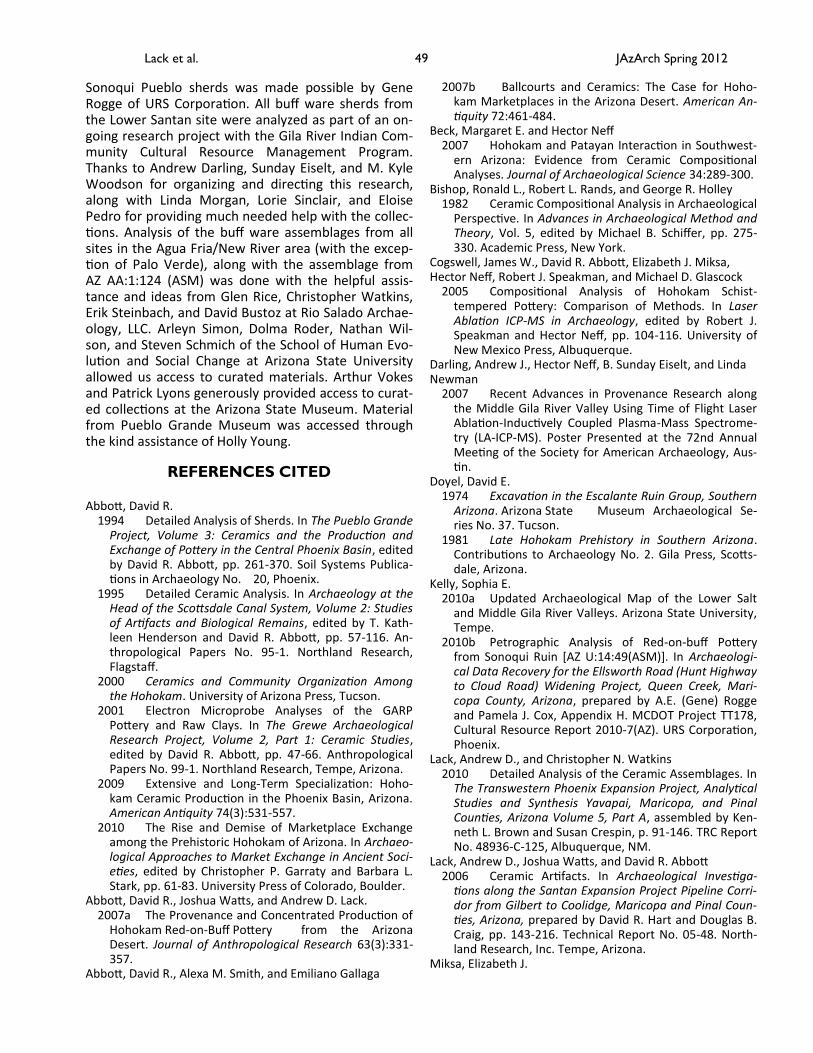
In the lower Salt River Valley, data from nine sites from each of these broad time spans reveal that prior to the Sacaton phase, the dominant area from which buff wares were obtained was the Santan Mountains area (Petrofacies A, B, or C) (Figure 6). In the early through middle Sacaton phases, the Snaketown area (Petrofacies N) clearly became dominant. Finally, in the late Sacaton Phase, the Queen Creek area became the most important supplier to the lower Salt River Valley communities (though not overwhelmingly domi-nant).
The pattern was less dramatic in the middle Gila River Valley, with the Snaketown area accounting for a large portion of red-on-buff production throughout the Sacaton through Soho phases (Figure 7). As mentioned earlier, the relative proportion of Queen Creek-produced buff ware did increase in the late Sacaton phase here as well, but it did not achieve the level of importance it did for the lower Salt River Valley villag-es. Unfortunately, we do not yet have enough data to examine the early time periods.
It must be noted, however, that these graphs do oversimplify the picture. First, these data do not in-clude the many buff ware sherds tempered exclusively with mica schist. The conclusions, therefore, may be significantly altered depending upon the production source or sources of the “schist-only” tempered buff ware.
The second factor complicating the picture was a lack of uniformity among sites during each time peri-od. For example, prior to the late Sacaton phase, a rel-atively high degree of uniformity existed in the ratios of different buff ware suppliers to the lower Salt River Valley (Figures 8 and 9). Although some variability ex-ists in the source locale for buffware pottery through time in each area through time, we do not consider this variability to be extreme. In contrast, the two as-semblages from the lower Salt River Valley that dated to the late Sacaton and Soho phases were remarkably different from one another (Figure 10).
JAzArch Spring 2012 46 Lack et al.
The data from this project conform well to current models of interaction networks in Hohokam society (Abbott 2009, 2010; Abbott et al. 2007a; Abbott et al. 2007b). These models suggest that Hohokam society was well integrated during the Pre-Classic era. Plain ware pottery was produced in a few concentrated lo-cales and was widely distributed across the Phoenix Basin. The need for a reliable mechanism of exchange to facilitate such a system has led some to hypothesize that a marketplace economy existed during the middle Sacaton phase (Abbott 2010; Abbott et al. 2007b). The-se marketplaces, it is suggested, were associated with periodic ballgame events which would draw people from different villages. The ballcourts, therefore, served to integrate the Hohokam both socially and economically.
A dramatic economic reorganization, however, occurred in the late Sacaton phase. The ballcourts, and presumably the marketplaces, were abandoned. The organization of plain ware production and distribution became much more localized as a symptom of the overall social fragmentation that characterized the Phoenix Basin at that time. Our research into the or-ganization of buff ware production and distribution followed the same trends. Although the details need to be more fully investigated, and more assemblages need to be sampled, it appears that the late Sacaton phase was a time of major changes for buff ware potters. Although changes in the social landscape dur-ing the late Sacaton phase seem to have restricted the exchange relationships of some potting communities, such as those in the Snaketown area, these same changes seem to have benefited Queen Creek potters in presenting them with the opportunity to build stronger relationships with exchange partners in the lower Salt and middle Gila River Valleys. Exactly how the potters of Queen Creek were able to expand such relationships, and why other potting communities may not have been as successful, are questions to be ad-dressed through further research.
Notes
1. The ceramic thin sections used by Miksa in her petrographic analyses were cut horizontally to the ves-sel wall. The orientation of platy minerals and rock fragments such as mica and schist may differ in com-parison between the thin sections used in this analysis and Miksa’s thin sections.
2. All sands, grain boxes, and initial training were generously provided by Elizabeth Miksa.
Acknowledgments. We owe a great deal of thanks to many people for the production of this paper. Eliza-beth Miksa provided the initial training on correlating sand samples with petrofacies through the use of a binocular microscope. Petrographic analysis for the
JAzArch Spring 2012 47 Lack et al.
Figure 5. Percentage of Queen Creek-produced buff ware over time for the middle Gila River Valley.
Figure 6. Lower Salt River Valley: Buff ware production group prevalence through time (excluding schist-only) and more generic sand groups.
Figure 7. Middle Gila River Valley: Buff ware production group prevalence through time (excluding schist-only and more generic sand groups).
JAzArch Spring 2012 48 Lack et al.
Figure 8. Distribution of buff ware sources among sites in the lower Salt River Valley, pre-Sacaton phase assemblages (excluding schist-only and more generic sand groups).
Figure 10. Distribution of buff ware sources among sites in the lower Salt River Valley, late Sacaton phase-Soho phase assemblages excluding schist-only and more generic sand groups).
Figure 9. Distribution of buff ware sources among sites in the lower Salt River Valley, early-middle phase Sacaton assemblages (excluding schist-only and more gener-ic sand groups).
Sonoqui Pueblo sherds was made possible by Gene Rogge of URS Corporation. All buff ware sherds from the Lower Santan site were analyzed as part of an on-going research project with the Gila River Indian Com-munity Cultural Resource Management Program. Thanks to Andrew Darling, Sunday Eiselt, and M. Kyle Woodson for organizing and directing this research, along with Linda Morgan, Lorie Sinclair, and Eloise Pedro for providing much needed help with the collec-tions. Analysis of the buff ware assemblages from all sites in the Agua Fria/New River area (with the excep-tion of Palo Verde), along with the assemblage from AZ AA:1:124 (ASM) was done with the helpful assis-tance and ideas from Glen Rice, Christopher Watkins, Erik Steinbach, and David Bustoz at Rio Salado Archae-ology, LLC. Arleyn Simon, Dolma Roder, Nathan Wil-son, and Steven Schmich of the School of Human Evo-lution and Social Change at Arizona State University allowed us access to curated materials. Arthur Vokes and Patrick Lyons generously provided access to curat-ed collections at the Arizona State Museum. Material from Pueblo Grande Museum was accessed through the kind assistance of Holly Young.
REFERENCES CITED
Abbott, David R. 1994 Detailed Analysis of Sherds. In The Pueblo Grande
Project, Volume 3: Ceramics and the Production and Exchange of Pottery in the Central Phoenix Basin, edited by David R. Abbott, pp. 261-370. Soil Systems Publica-tions in Archaeology No. 20, Phoenix.
1995 Detailed Ceramic Analysis. In Archaeology at the Head of the Scottsdale Canal System, Volume 2: Studies of Artifacts and Biological Remains, edited by T. Kath-leen Henderson and David R. Abbott, pp. 57-116. An-thropological Papers No. 95-1. Northland Research, Flagstaff.
2000 Ceramics and Community Organization Among the Hohokam. University of Arizona Press, Tucson.
2001 Electron Microprobe Analyses of the GARP Pottery and Raw Clays. In The Grewe Archaeological Research Project, Volume 2, Part 1: Ceramic Studies, edited by David R. Abbott, pp. 47-66. Anthropological Papers No. 99-1. Northland Research, Tempe, Arizona.
2009 Extensive and Long-Term Specialization: Hoho-kam Ceramic Production in the Phoenix Basin, Arizona. American Antiquity 74(3):531-557.
2010 The Rise and Demise of Marketplace Exchange among the Prehistoric Hohokam of Arizona. In Archaeo-logical Approaches to Market Exchange in Ancient Soci-eties, edited by Christopher P. Garraty and Barbara L. Stark, pp. 61-83. University Press of Colorado, Boulder.
Abbott, David R., Joshua Watts, and Andrew D. Lack. 2007a The Provenance and Concentrated Production of
Hohokam Red-on-Buff Pottery from the Arizona Desert. Journal of Anthropological Research 63(3):331-357.
Abbott, David R., Alexa M. Smith, and Emiliano Gallaga
JAzArch Spring 2012 49 Lack et al.
2007b Ballcourts and Ceramics: The Case for Hoho-kam Marketplaces in the Arizona Desert. American An-tiquity 72:461-484.
Beck, Margaret E. and Hector Neff 2007 Hohokam and Patayan Interaction in Southwest-
ern Arizona: Evidence from Ceramic Compositional Analyses. Journal of Archaeological Science 34:289-300.
Bishop, Ronald L., Robert L. Rands, and George R. Holley 1982 Ceramic Compositional Analysis in Archaeological
Perspective. In Advances in Archaeological Method and Theory, Vol. 5, edited by Michael B. Schiffer, pp. 275-330. Academic Press, New York.
Cogswell, James W., David R. Abbott, Elizabeth J. Miksa, Hector Neff, Robert J. Speakman, and Michael D. Glascock
2005 Compositional Analysis of Hohokam Schist-tempered Pottery: Comparison of Methods. In Laser Ablation ICP-MS in Archaeology, edited by Robert J. Speakman and Hector Neff, pp. 104-116. University of New Mexico Press, Albuquerque.
Darling, Andrew J., Hector Neff, B. Sunday Eiselt, and Linda Newman
2007 Recent Advances in Provenance Research along the Middle Gila River Valley Using Time of Flight Laser Ablation-Inductively Coupled Plasma-Mass Spectrome-try (LA-ICP-MS). Poster Presented at the 72nd Annual Meeting of the Society for American Archaeology, Aus-tin.
Doyel, David E. 1974 Excavation in the Escalante Ruin Group, Southern
Arizona. Arizona State Museum Archaeological Se-ries No. 37. Tucson.
1981 Late Hohokam Prehistory in Southern Arizona. Contributions to Archaeology No. 2. Gila Press, Scotts-dale, Arizona.
Kelly, Sophia E. 2010a Updated Archaeological Map of the Lower Salt
and Middle Gila River Valleys. Arizona State University, Tempe.
2010b Petrographic Analysis of Red-on-buff Pottery from Sonoqui Ruin [AZ U:14:49(ASM)]. In Archaeologi-cal Data Recovery for the Ellsworth Road (Hunt Highway to Cloud Road) Widening Project, Queen Creek, Mari-copa County, Arizona, prepared by A.E. (Gene) Rogge and Pamela J. Cox, Appendix H. MCDOT Project TT178, Cultural Resource Report 2010-7(AZ). URS Corporation, Phoenix.
Lack, Andrew D., and Christopher N. Watkins 2010 Detailed Analysis of the Ceramic Assemblages. In
The Transwestern Phoenix Expansion Project, Analytical Studies and Synthesis Yavapai, Maricopa, and Pinal Counties, Arizona Volume 5, Part A, assembled by Ken-neth L. Brown and Susan Crespin, p. 91-146. TRC Report No. 48936-C-125, Albuquerque, NM.
Lack, Andrew D., Joshua Watts, and David R. Abbott 2006 Ceramic Artifacts. In Archaeological Investiga-
tions along the Santan Expansion Project Pipeline Corri-dor from Gilbert to Coolidge, Maricopa and Pinal Coun-ties, Arizona, prepared by David R. Hart and Douglas B. Craig, pp. 143-216. Technical Report No. 05-48. North-land Research, Inc. Tempe, Arizona.
Miksa, Elizabeth J.
1999 Provenance Characterization of Schist-Tempered Buff Ware Pottery. Petrographic Report No. 99-6. Desert Archaeology, Inc., Tucson.
2001 Temper Provenance Studies. In The Grewe Ar-chaeological Research Project, Volume 2, Part 1: Ceram-ic Studies, edited by David R. Abbott, pp. 7-46. Anthro-pological Papers No. 99-1. Northland Research, Tempe.
Miksa, Elizabeth J., and Sergio F. Castro-Reino 2001 An Updated Sand Petrofacies Model for the Mid-
dle Gila River Basin. Petrographic Report No. 2001-02. Desert Archaeology, Inc., Tucson.
Miksa, Elizabeth J., Sergio F. Castro-Reino, and Carlos Lavayen.
2004 A Combined Petrofacies Model for the Middle Gila and Phoenix Basins, With Application to Pottery From the Dutch Canal Ruin. In Hohokam Farming on the
Salt River Floodplain: Refining Models and Analytical Methods, edited by T. Kathleen Henderson, pp. 7-44. Anthropological Papers No. 43. Center for Desert Ar-chaeology, Tucson.
Peters, Matthew D., Kimberly R. Kennedy, Matthew Beh-rend, and Thomas E. Wright
2007 Results of Phase I Archaeological Investigations in a Portion of the Sonoqui Ruin, AZ U:14:49(ASM), near Queen Creek, Maricopa County, Arizona. Report 2005:036a. Archaeological Research Services, Tempe, Arizona.
Rafferty, Kevin 1982 Hohokam Micaceous Schist Mining and Ceramic
Craft Specialization: An Example from Gila Butte, Arizo-na. Anthropology 6:199-222.
Rands, Robert L. and Ronald L. Bishop 1980 Resource Procurement Zones and Patterns of
Ceramic Exchange in the Palenque Region, Mexico. In Models and Methods in Regional Exchange, edited by Robert E. Fry, pp. 19-46. Society for American Archaeol-ogy Papers No. 1, Society for American Archaeology, Washington, D. C.
Rogge, A.E. (Gene), and Pamela J. Cox 2010 Archaeological Data Recovery for the Ellsworth
Road (Hunt Highway to Cloud Road) Widening Project, Queen Creek, Maricopa County, Arizona. MCDOT Pro-ject TT178, Cultural Resource Report 2010-7(AZ). URS Corporation, Phoenix.
Schaller, David M. 1994 Geographic Sources of Temper in Central Phoe-
nix Basin Ceramics Based on Petrographic Analysis. In The Pueblo Grande Project, Volume 3: Ceramics and the Production and Exchange of Pottery in the Central Phoe-nix Basin, edited by David R. Abbott, pp. 17-90. Publica-tions in Archaeology No. 20. Soil Systems, Phoenix.
Wallace, Henry D. 2001 Time Seriation and Typological Refinement of the
Middle Gila Buffware Sequence: Snaketown Through Soho Phases. In The Grewe Archaeological Research Project, Volume 2, Part 1. Ceramic Studies, edited by David R. Abbott, pp. 177-262. Anthropological Papers No. 99-1. Northland Research, Tempe.
2004 Update to the Middle Gila Buff Ware Ceramic Sequence. In Hohokam Farming on the Salt River Flood-plain: Refining Models and Analytical Methods, edited
JAzArch Spring 2012 50 Lack et al.
by T. Kathleen Henderson, p. 59-141. Anthropological Papers No. 43. Center for Desert Archaeology, Tucson.
Walsh-Anduze, Mary-Ellen 1993 An Evaluation of Ceramic Production at the Gila
Butte Site. In Archaeological Investigations at the Gila Butte Site: Hohokam Irrigation and Economic Systems along the Gila River, Arizona, prepared by Thomas N. Motsinger, pp. 22-35. Archaeological Report No. 93-84. SWCA, Inc., Tucson.
Watts, Joshua 2007 Power Ranch Chronological Assessment. Report
prepared for Soil Systems, Inc., Phoenix. Manuscript on file, SHESC, Arizona State University, Tempe.
Wright, Thomas E. 2004 A Class III Cultural Resources Survey of 120 Acres
of State Trust Land Located Northwest of the Corner of Crimson Road and Riggs Road, Maricopa County, Arizo-na. Report 2004:109. Archaeological Research Services, Tempe, Arizona.
Related Documents