Current Biology 24, 598–608, March 17, 2014 ª2014 The Authors http://dx.doi.org/10.1016/j.cub.2014.01.071 Article Identification of Transcriptional and Metabolic Programs Related to Mammalian Cell Size Teemu P. Miettinen, 1 Heli K.J. Pessa, 1 Matias J. Caldez, 2,3 Tobias Fuhrer, 4 M. Kasim Diril, 2 Uwe Sauer, 4 Philipp Kaldis, 2,3 and Mikael Bjo ¨ rklund 1, * 1 Division of Cell and Developmental Biology, College of Life Sciences, University of Dundee, Dundee DD1 5EH, UK 2 Institute of Molecular and Cell Biology, Agency for Science, Technology and Research, 61 Biopolis Drive, Proteos #03–09, Singapore 138673, Singapore 3 Department of Biochemistry, National University of Singapore, Singapore 117597, Singapore 4 Institute of Molecular Systems Biology, Eidgeno ¨ ssische Technische Hochschule Zu ¨ rich, Wolfgang-Pauli Strasse 16, 8093 Zu ¨ rich, Switzerland Summary Background: Regulation of cell size requires coordination of growth and proliferation. Conditional loss of cyclin-dependent kinase 1 in mice permits hepatocyte growth without cell divi- sion, allowing us to study cell size in vivo using transcriptomics and metabolomics. Results: Larger cells displayed increased expression of cyto- skeletal genes but unexpectedly repressed expression of many genes involved in mitochondrial functions. This effect appears to be cell autonomous because cultured Drosophila cells induced to increase cell size displayed a similar gene- expression pattern. Larger hepatocytes also displayed a reduction in the expression of lipogenic transcription factors, especially sterol-regulatory element binding proteins. Inhibi- tion of mitochondrial functions and lipid biosynthesis, which is dependent on mitochondrial metabolism, increased the cell size with reciprocal effects on cell proliferation in several cell lines. Conclusions: We uncover that large cell-size increase is accompanied by downregulation of mitochondrial gene expression, similar to that observed in diabetic individuals. Mitochondrial metabolism and lipid synthesis are used to couple cell size and cell proliferation. This regulatory mecha- nism may provide a possible mechanism for sensing metazoan cell size. Introduction Cell size can be increased by impeding with cell-cycle pro- gression, increasing the rate of biosynthesis, or both. In unicellular organisms, cell size and proliferation are mainly controlled by nutrient levels, whereas regulation through growth and mitogenic and survival signals is additionally important in metazoan cells [1]. Cell size increases with ploidy in many organisms, although the mechanism behind this is elusive [2, 3]. Saccharomyces cerevisiae has been the pre- dominant model used to study cell size [2, 4]. Genes affecting cell size have been identified through loss-of-function studies in yeast [5, 6] and Drosophila [7, 8], as well as through gene- expression studies of yeast cell-cycle mutants and strains with variable ploidy [9–11]. However, in mammals, practically all insights are derived from cultured cells with a focus in understanding whether there is an active cell-size control [12–14]. Mechanisms that affect cell size in vivo have received less attention, apart from the role of mTOR. Liver is a homogenous tissue mainly composed of hepato- cytes. Liver regenerates to its normal size after partial hepa- tectomy ([PH]; removal of w70% of the liver) through cell growth and division of the remaining cells. Interestingly, mouse liver with a cyclin-dependent kinase 1 (Cdk1) liver- specific knockout (Cdk1 Flox/Flox Albumin-Cre, hereafter named Cdk1 Liv2/2 ) can also regenerate. However, this occurs in the absence of cell divisions, resulting in enlarged hepatocytes [15]. Because Cdk1 is essential for cell-cycle progression, this model separates growth and proliferation effects, allowing us to analyze how mammalian cells respond to cell-size changes in vivo. We identify how gene-expression and metab- olite levels correlate with cell size and discover that both mito- chondrial metabolism and lipid biosynthesis are used to couple cell size and cell proliferation. Results Correlation of Gene Expression and Metabolite Levels with Cell Size In Vivo Liver samples from control (Cdk1 Flox/Flox ) and Cdk1 Liv2/2 ani- mals, before and after partial hepatectomy, form a series of samples with different nuclear sizes (Figure 1A). Hepatocytes from Cdk1 Liv2/2 mice after PH have 2–3 times larger radii than those from Cdk1 Flox/Flox mice ([15]; Figure 1B), with rela- tively uniform size increase because the variation is similar to controls (Figures 1A and 1B). We measured gene expression and relative metabolite levels in these four nearly isogenic sample types using nuclear radius as a proxy for cell size [2, 3]. We then correlated all gene expression and metabolite changes to cell size (Figures 1C and 1D; Figures S1A and S1B available online; Tables S1 and S2). Gene-expression data were validated by comparing samples before and after PH (Figure S1C) and by quantitative RT-PCR (Figures S1D and S1E). To our knowledge, there are no prior data regarding global gene expression and metabolic changes related to cell size from metazoan organisms in vivo. The metabolomics data contained semiquantitative ion in- tensities, which potentially account for >2,200 metabolites based on accurate mass annotation and covering a large frac- tion of the metabolome (Figure S1F). We observed many changes related to hepatectomy (Figures S1B and S1G), including known changes in levels of glycogen, glucose, taurine, betaine, and creatine [16]. We could also identify changes related to Cdk1 deletion and cell size (Figure S1B). By plotting the correlation of the nuclear radius and change in metabolite and gene-expression levels between the largest and the smallest cells, we observed that the strongest correla- tions with cell-size change are usually not associated with the largest fold changes (Figure S1G; Tables S1 and S2). *Correspondence: [email protected] This is an open access article under the CC BY license (http:// creativecommons.org/licenses/by/3.0/).

Welcome message from author
This document is posted to help you gain knowledge. Please leave a comment to let me know what you think about it! Share it to your friends and learn new things together.
Transcript

Identification of Transcriptio
Current Biology 24, 598–608, March 17, 2014 ª2014 The Authors http://dx.doi.org/10.1016/j.cub.2014.01.071
Articlenal
and Metabolic ProgramsRelated to Mammalian Cell Size
Teemu P. Miettinen,1 Heli K.J. Pessa,1 Matias J. Caldez,2,3
Tobias Fuhrer,4 M. Kasim Diril,2 Uwe Sauer,4
Philipp Kaldis,2,3 and Mikael Bjorklund1,*1Division of Cell and Developmental Biology, College of LifeSciences, University of Dundee, Dundee DD1 5EH, UK2Institute of Molecular and Cell Biology, Agency for Science,Technology and Research, 61 Biopolis Drive, Proteos #03–09,Singapore 138673, Singapore3Department of Biochemistry, National University ofSingapore, Singapore 117597, Singapore4Institute of Molecular Systems Biology, EidgenossischeTechnische Hochschule Zurich, Wolfgang-Pauli Strasse 16,8093 Zurich, Switzerland
Summary
Background: Regulation of cell size requires coordination ofgrowth and proliferation. Conditional loss of cyclin-dependentkinase 1 in mice permits hepatocyte growth without cell divi-sion, allowing us to study cell size in vivo using transcriptomicsand metabolomics.Results: Larger cells displayed increased expression of cyto-skeletal genes but unexpectedly repressed expression ofmany genes involved in mitochondrial functions. This effectappears to be cell autonomous because cultured Drosophilacells induced to increase cell size displayed a similar gene-expression pattern. Larger hepatocytes also displayed areduction in the expression of lipogenic transcription factors,especially sterol-regulatory element binding proteins. Inhibi-tion of mitochondrial functions and lipid biosynthesis, whichis dependent on mitochondrial metabolism, increased thecell size with reciprocal effects on cell proliferation in severalcell lines.Conclusions: We uncover that large cell-size increase isaccompanied by downregulation of mitochondrial geneexpression, similar to that observed in diabetic individuals.Mitochondrial metabolism and lipid synthesis are used tocouple cell size and cell proliferation. This regulatory mecha-nismmay provide a possiblemechanism for sensingmetazoancell size.
Introduction
Cell size can be increased by impeding with cell-cycle pro-gression, increasing the rate of biosynthesis, or both. Inunicellular organisms, cell size and proliferation are mainlycontrolled by nutrient levels, whereas regulation throughgrowth and mitogenic and survival signals is additionallyimportant in metazoan cells [1]. Cell size increases with ploidyin many organisms, although the mechanism behind this iselusive [2, 3]. Saccharomyces cerevisiae has been the pre-dominant model used to study cell size [2, 4]. Genes affecting
*Correspondence: [email protected]
This is an open access article under the CC BY license (http://
creativecommons.org/licenses/by/3.0/).
cell size have been identified through loss-of-function studiesin yeast [5, 6] and Drosophila [7, 8], as well as through gene-expression studies of yeast cell-cycle mutants and strainswith variable ploidy [9–11]. However, in mammals, practicallyall insights are derived from cultured cells with a focus inunderstanding whether there is an active cell-size control[12–14]. Mechanisms that affect cell size in vivo have receivedless attention, apart from the role of mTOR.Liver is a homogenous tissue mainly composed of hepato-
cytes. Liver regenerates to its normal size after partial hepa-tectomy ([PH]; removal of w70% of the liver) through cellgrowth and division of the remaining cells. Interestingly,mouse liver with a cyclin-dependent kinase 1 (Cdk1) liver-specific knockout (Cdk1Flox/Flox Albumin-Cre, hereafter namedCdk1Liv2/2) can also regenerate. However, this occurs in theabsence of cell divisions, resulting in enlarged hepatocytes[15]. Because Cdk1 is essential for cell-cycle progression,this model separates growth and proliferation effects, allowingus to analyze how mammalian cells respond to cell-sizechanges in vivo. We identify how gene-expression andmetab-olite levels correlate with cell size and discover that both mito-chondrial metabolism and lipid biosynthesis are used tocouple cell size and cell proliferation.
Results
Correlation of Gene Expression and Metabolite Levels with
Cell Size In VivoLiver samples from control (Cdk1Flox/Flox) and Cdk1Liv2/2 ani-mals, before and after partial hepatectomy, form a series ofsamples with different nuclear sizes (Figure 1A). Hepatocytesfrom Cdk1Liv2/2 mice after PH have 2–3 times larger radiithan those from Cdk1Flox/Flox mice ([15]; Figure 1B), with rela-tively uniform size increase because the variation is similar tocontrols (Figures 1A and 1B). We measured gene expressionand relative metabolite levels in these four nearly isogenicsample types using nuclear radius as a proxy for cell size[2, 3]. We then correlated all gene expression and metabolitechanges to cell size (Figures 1C and 1D; Figures S1A andS1B available online; Tables S1 and S2). Gene-expressiondata were validated by comparing samples before and afterPH (Figure S1C) and by quantitative RT-PCR (Figures S1Dand S1E). To our knowledge, there are no prior data regardingglobal gene expression and metabolic changes related to cellsize from metazoan organisms in vivo.The metabolomics data contained semiquantitative ion in-
tensities, which potentially account for >2,200 metabolitesbased on accurate mass annotation and covering a large frac-tion of the metabolome (Figure S1F). We observed manychanges related to hepatectomy (Figures S1B and S1G),including known changes in levels of glycogen, glucose,taurine, betaine, and creatine [16]. We could also identifychanges related to Cdk1 deletion and cell size (Figure S1B).By plotting the correlation of the nuclear radius and changein metabolite and gene-expression levels between the largestand the smallest cells, we observed that the strongest correla-tions with cell-size change are usually not associated with thelargest fold changes (Figure S1G; Tables S1 and S2).

Cdk1Flox/Flox
Pre-PHCdk1Flox/Flox
Post-PHCdk1Liv-/-
Post-PHA
Cell growth and division Cell growth
Cdk1Liv-/-
Pre-PH
0
1
2
3
4
Cdk1Flox/Flox Cdk1Liv-/-
PrePH PostPH
Rel
ativ
e nu
clea
r dia
met
er
PrePH PostPH
B C D
Gene expressionGene expression400
300
200
100
0 median-1 10
Num
ber o
f gen
esCorrelation with nuclear radius
Size analysis 60
01 2 3
Cd36
mR
NA
expr
essi
on le
vel
(uni
que
read
s/m
illio
n)
Ndufb10
Gm7290(RpL13-ps)
GM4953(Atp5h)
1 2 3
1 2 3 1 2 3
50
250
100
200
0
30
Relative nuclear radius
Figure 1. Correlation of Gene-Expression and Metabolite Levels with Cell Size in Mouse Liver
(A) Representative Feulgen-stained histological sections of Cdk1Flox/Flox and Cdk1Liv2/2 liver before and 96 hr after PH. The Cdk1Liv2/2 hepatocytes regen-
erate by growing in size because they are unable to divide, whereas the cell size in Cdk1Flox/Flox liver is not significantly changed. All images were taken with
the same magnification. Scale bar represents 20 mm.
(B) Quantification of the nuclear sizes in liver samples. The data shown indicate mean 6 SD of nuclear radius relative to control Cdk1Flox/Flox before PH
(n = 13–55 cells).
(C) Analysis of gene expression by RNA-seq. Four genes displaying strong correlation with nuclear radius are shown as examples with correlation,
and 690% confidence intervals are shown with solid and dotted line, respectively.
(D) A density plot of gene-expression correlations with nuclear radius for all genes. Median Pearson correlation (0.222) for all genes is indicated with the
dotted line.
See also Figure S1 and Tables S1 and S2.
Transcriptomic and Metabolic Effects of Cell Size599
At gene-expression level, the fatty acid transporterCd36dis-played almost perfect linear correlation (r = 0.968) with nuclearsize (Figure 1C). We also identified genes with strong negativecorrelation (for example,Ndufb10 [NADH dehydrogenase sub-unit, r = 20.947]) (Figure 1C), although these were less abun-dant (118geneswith correlation <20.8withnuclear size versus302 genes with correlation > 0.8 with nuclear size). Such acoordinated global gene expression with cell size is consistentwith yeast data [9, 10]. The distribution pattern of all gene andmetabolite correlations with cell size is in Figures 1D andS1A. The observed gene-expression pattern could resultfrom downregulation of a few highly expressed genes. How-ever, the most abundant genes are on average only slightlydownregulated, and the observed positive correlation is dueto increased expression of many genes with low expression(Figure S1H). Because many of these are regulatory proteins,these changes might be necessary to support cell growth.
In contrast to yeast, in which G1 cyclins are repressed withincreased cell size [9], the expression of many cell-cycle genes
correlated positively with nuclear size. Cyclins D1–D3, E1, E2,A2, B1, and B2 displayed a positive correlation with cell size(r = 0.344–0.761; Table S1), suggesting that repression ofcyclins is not universally required for cell-size increase.
Mitochondrial and Cytoskeletal Genes Strongly Correlatewith Cell Size
Rather than focusing on individual genes, wewanted to identifywhether expression of genes related to various subcellularcomponents is coordinated with cell size. Comparison of sizecorrelation distributions for various subcellular structuresbasedongeneontology (GO)classifications revealed twostruc-tures that deviated from thewhole-cell profile. These structureswere cytoskeleton andmitochondria, correlating positively andnegatively, respectively,with cell size (Figures2A, 2B, andS2A).Because the cytoskeleton is required to mechanically supportcells and is an integral part of various cellular transport mecha-nisms, the upregulation of cytoskeleton was not unexpectedand has been observed in yeast [9]. Analysis of protein

A
B
C D
E
Figure 2. Correlation of Gene Expression with Cell Size for Different Subcellular Components Identifies Downregulation of Mitochondrial Genes
(A)Mouse genes annotated to individual subcellular components using gene ontology (GO) analysis were identified, andmedian correlationwith nuclear size
was calculated. Dotted orange line indicates median cell correlation for all genes included in this analysis. We calculated p values using Kolmogorov-
Smirnov test.
(B) Expression correlations for genes annotated to mitochondria and cytoskeleton. Correlations were binned to obtain scaling profiles (bars) for each sub-
cellular component. For comparison, the whole-cell profile (only genes with annotation in any of the subcellular component analyses, as opposed to all
genes in Figure 1D, orange line) is overlaid on the bar chart. The number of genes in thewhole-cell profile was normalized to the number of genes in individual
subcellular components to simplify comparison.
(C) Connectivity of genes correlating negatively (adjusted p value < 0.05) with cell size, as identified using the STRING database. Groups of functionally in-
teracting genes are indicated with green circles and named. Note that one-carbon metabolism genes, such as adenosylhomocysteinase (Ahcy), are impor-
tant for glutathione synthesis, indicating possible coregulation.
(D) Drosophila genes annotated to individual subcellular components as for liver data. Dotted orange line indicates median of log2 fold change for all genes
included in this analysis.
(E) Histograms of mitochondrial and cytoskeletal gene expression compared to all genes (orange line) in Drosophila Kc167 cells.
See also Figure S2 and Tables S3 and S4.
Current Biology Vol 24 No 6600
complexes indicated that the Wave2 and Arp2/3 complexesresponsible for actinnucleationwereamong themostpositivelycorrelating complexes (Figure S2B). The negative correlationbetween mitochondrial gene expression and nuclear size wasunexpected because mitochondrial deletion mutants in yeastdisplay small cell size [5, 6], and mitochondrial content scaleswith cell size [17, 18]. The genes annotated in the inner mem-brane and matrix were the most negatively correlating genesets within mitochondria (Figures S2C and S2D).
Next, we analyzed the connectivity of the genes correlatingwith cell size by using a protein-association network database.The positively correlating network contained DNA replicationgenes, ribosomal protein-coding genes, Rho GTPase-relatedgenes, cytoskeleton and cell-adhesion-related genes, E2F-related, and Hippo pathway genes (Figure S2E), all of whichare likely to be involved in growth. The negatively correlatingnetwork contained a large cluster of mitochondrial genesand smaller clusters containing cholesterol biosynthesisgenes, apolipoprotein and serine protease inhibitors (serpin),and genes involved in glutathione, phenylalanine and tyrosine,and one-carbon metabolism (Figure 2C). These networks had2.3 and 8.1 times more connections per gene, respectively,than similarly sized random networks, indicating functional in-teractions (Figure S2E). Many of these findings were corrobo-rated by metabolomics data, which showed marked changesin glutathione, one-carbon, and DNA-replication-relatedmeta-bolism (Table S3). Because one of the major functions of mito-chondria is oxidative phosphorylation (OxPhos), we analyzed
the expression of OxPhos genes. These displayed strongnegative correlation with nuclear size (Figure S2F).The identified gene-expression patterns could potentially be
caused by Cdk1 deletion rather than by change in cell size.However, genes affected by Cdk1 deletion had very limitedoverlap with size-correlating genes. This overlap was only4% (22 of 526) of positively correlating genes and 6% (36 of569) of negatively correlating genes (Figure S2G), indicatingthat the observed effects are not Cdk1 dependent. Addition-ally, we used gene-expression data from cultured DrosophilaKc167 cells. Knockdown of Pop2 deadenylase, which causesdegradation of mRNA polyA tails, increases cell size w20%without major effects on cell cycle (Figures S2H and S2I).The CCR4-NOT complex, which contains a Pop2 ortholog,has one of the strongest cell-size effects in yeast [6]. Analysisof Drosophila RNA-expression data (Table S4) indicated thatmitochondrial genes were significantly downregulated andthat cytoskeletal genes were upregulated (Figures 2D and2E). The exception to liver data was that ribosomal geneexpression was repressed, and this may be a feedback mech-anism related to stabilization ofmRNAs. The similarity of gene-expression signatures in mouse and Drosophila cells impliesthat these gene-expression changes are cell-autonomouseffects related to cell size.
Aerobic Glycolysis Fuels Cell Size Increases
The negative correlation of mitochondrial gene expressionwith cell size suggested changes in energy metabolism. We

Transcriptomic and Metabolic Effects of Cell Size601
did not observe significant changes in mitochondrial number,size, or number of cristae, although the mitochondria in largercells tended to be smaller and slightly more abundant, withincreased electron density (Figures 3A and S3A). Furtheranalysis of the gene-expression levels of mitochondrial DNA-replication machinery (Figure S3B) and mitochondrial DNAamount relative to genomic DNA (Figure S3C) did not indicatedepletion of mitochondria.
Despite negative correlation, the absolute reduction ofmRNA and protein expression of OxPhos complexes inCdk1Liv2/2 post-PH samples compared to Cdk1Flox/Flox pre-PH samples was only w20% (Figure 3B), which could explainthe phenotypic difference of yeast deletion mutants [5, 6].Metabolomics data indicated no changes in ATP levels but areduction in AMP levels, which correlated with cell size (Fig-ure 3C). Consistently, analysis of the cellular energy sensorAMP-activated kinase (AMPK) indicated downregulation ofAMPK activity in Cdk1Liv2/2 cells (Figure 3B). Thus, ATP levelsare unlikely to be limiting in larger cells, and the lack of AMPKactivation could provide permissive conditions for the cell-sizeincrease. We conclude that the observed mitochondrial gene-expression correlation is due to moderate transcriptionaldownregulation.
Compensatory increases in glycolysis could maintain ATPlevels, and we indeed observed upregulation of genes relatedto three key regulatory steps (Figure 3D). Hexokinase expres-sion correlated well with cell size, whereas pyruvate kinasePkm2 displayed a mixed hepatectomy and cell-size effect.Additionally, lactate dehydrogenase (Ldha) correlated posi-tively and pyruvate dehydrogenase (Pdha) correlated nega-tively with cell size (Figure 3D). Analysis of the metabolitelevels indicated that, whereas changes in glucose levels incontrol and Cdk1Liv2/2 animals were roughly similar, changescaused by PH in pyruvate levels at the end of the glycolyticpathway were different (Figure S3D). For a summary of allglycolysis data, see Figures S3D and S3E.
We did not observe significant changes in tricarboxylic acid(TCA) cycle metabolites (Figure S3D), although we observedchanges in isocitrate dehydrogenases 1 and 2 (Idh1 andIdh2) as well as in mitochondrial glutaminase 2 (Gls2) andglutamate dehydrogenase 1 (Glud1), with concomitant in-crease in glutamate levels (Figure 3E). The glycolytic inhibi-tor 2-deoxyglucose (2-DG) and the glutamine antagonist6-Diazo-5-oxo-L-norleucine (DON) abolished the cell-size in-crease caused by respiratory inhibitor sodium azide in humanosteosarcoma cell line U2OS (Figure 3F). Altogether, thesedata suggest that glycolysis and glutaminolysis are requiredto fuel cell growth caused by mitochondrial inhibition (bysodium azide) in vitro and possibly in vivo.
Interestingly, although metabolic changes in early glycol-ysis displayed a clear hepatectomy effect, Cdk1Liv2/2 geno-type and cell size had more effect on metabolite levels atlater stages of glycolysis. For example, we observed thatCdk1Liv2/2 suppressed the increased pyruvate levels causedby hepatectomy in control animals (Figures S3D and S3E).Furthermore, hepatectomized Cdk1Liv2/2 knockout mice dis-played increased metabolite levels related to serine andglycerol synthesis. These metabolic changes and the positivecorrelation of pyruvate kinase Pkm2 expression with cell sizeare consistent with tumor-like metabolic phenotype [19].Overall, the observed cell-size-related metabolic and gene-expression changes are conceptually similar to the Warburgeffect, in which mitochondrial activity is reduced relative toglycolysis.
Mitochondria Regulate the Balance between Cell Size andCell Proliferation
To investigate this putative functional link between mitochon-dria and cell size, we screened a set of small molecules,including compounds that target mitochondria and glycolysis,glutaminolysis, and the pentose phosphate pathway (PPP).Mitochondria-targeting inhibitors frequently increased cellsize and reduced cell numbers, with a modest inverse correla-tion (R2 = 0.27) (Figure 4A). The mitochondria-targetingcompounds included uncoupling agents (FCCP and CCCP),ionophore (valinomycin), mitochondrial division inhibitor(Mdivi-1), translation inhibitors (minocycline and thiostrepton),and drugs with mitochondrial off-targets (tamoxifen).The reciprocal effects on cell size and proliferation are
illustrated with Mdivi-1, which targets the dynamin-relatedprotein 1 (Drp1), and sodium azide, an inhibitor of OxPhoscomplex IV (Figures 4B, S4A, and S4B). Increases in cell sizewere similarly detected by electrical current exclusion methodand by measurement of protein amount per cell, arguingagainst osmotic effects (Figures S4C and S4D). In contrast tomitochondrial inhibitors, phenylbutyrate, which enhancesthe metabolic flux from glycolysis to mitochondria, causedincreased proliferation and decreased cell size, although itslowed down proliferation at high concentrations (Figure 4C).Most nonmitochondria-targeted chemicals had little effecton cell size, although they reduced cell number and conse-quently displayed no correlation with cell size (R2 = 0.07) (Fig-ure 4A). These data, together with our RNAi screen inDrosophila [7] and recent yeast data [20], indicate that cellsize is, in most cases, not connected to effects in cell prolifer-ation (cell cycle) as commonly believed.Genetic means of targeting mitochondrial functions also
increased cell size. U2OSrho0 cells, which do not contain mito-chondrial DNA and thus are defective in many mitochondrialfunctions, were larger than wild-type cells (Figure S4E). Cellsize was also increased by RNAi of the transcriptional coacti-vator PGC-1a (Figures 4D and 4E), which has been implicatedas an integrator of metabolism and mitochondrial geneexpression by regulating OxPhos, TCA cycle, and lipid synthe-sis genes.Because two OxPhos complex inhibitors, antimycin A and
oligomycin, did not increase cell size (TableS5andFigureS4F),we examinedwhat othermitochondrial functions could explainthe cell-size phenotype. Mitochondrial metabolism is closelylinked to oxidative phosphorylation and proliferation [19, 21].A key function of mitochondria is to provide acetyl-coenzymeA (CoA) for histone acetylation as well as for mevalonate andcholesterol and fatty acid synthesis (Figure S4G). Mitochon-drial acetyl-CoA is exported to the cytoplasm as citrate.Although our metabolomic data cannot distinguish subcellularpools of metabolites, all enzymes involved in the citrate andacetyl-CoA transport process correlated negatively with cellsize in our gene-expression data (Figure S4G). Additionally,RNAi of the mitochondrial citrate transporter SLC25A1 in-creased the size of U2OS and HeLa cells (Figure S4H).In yeast, acetylation of histones binding to growth gene loci
is important for promoting transcription and inducing prolifer-ation [22]. We thus tested whether the cell-size effects in ourmodels are linked to histone acetylation. Histone acetylationwas reduced in larger Cdk1Liv2/2 cells in vivo (Figure S4I), aswell as in U2OS cells treated with rotenone, an OxPhos com-plex I inhibitor and a potent cell-size inducer (Figure S4J).However, although all of the histone acetyltransferase inhibi-tors that were tested reduced cell proliferation, none of these

A B
C D E
F
Figure 3. Glycolysis Increases with Cell Size
(A) Representative electron microscopy images of Cdk1Flox/Flox and Cdk1Liv2/2 liver before and after hepatectomy. Arrows and ‘‘M’’ indicate glycogen and
mitochondria, respectively. All scale bars represent 500 nm. For quantification, see Figure S3A.
(B) mRNA expression (red line) and protein levels (blue bars) of selected OxPhos proteins.Western blot shows themeasured OxPhos complex components,
phospho-Thr172-AMPK (pAMPK) levels, and GAPDH (loading control).
(C) Relative ATP and AMP levels in liver samples, as measured by mass spectrometry. Statistical significance was measured by ANOVA.
(D) Proportional expression of key glycolytic genes based on liver RNA-seq data.
(E) Glutamate metabolite levels (orange) and Idh expression levels (blue and gray) correlate with cell size.
(F) Inhibition of glycolysis and glutaminolysis by 2-DG and DON rescue U2OS cell size increase by 1 mM sodium azide (p < 0.001 in both; t test,
mean 6 SD, n = 3).
See also Figure S3.
Current Biology Vol 24 No 6602

A B
C
D E F
Figure 4. Inhibition of Mitochondrial Functions
Increases Cell Size in Cultured Cells
(A) Changes in cell size and cell number in U2OS
cells by small molecules. Compoundswith known
effects on mitochondria are displayed in red.
Glycolysis, glutaminolysis, and PPP compounds
are displayed in blue, and others are displayed
in green. Red and black solid lines display linear
regression for mitochondria targeting and for all
other compounds, respectively, with 90% confi-
dence intervals shown as dotted line. See Table
S5 for all compounds and concentrations used.
(B) U2OS cell number (red line) and cell size (blue
line) were analyzed as a function of Mdivi-1 con-
centration (n = 3, 48 hr).
(C) HeLa cell number (red line) and cell size (blue
line) as a function of phenylbutyrate concentra-
tion in delipidated FBS (n = 3, 48 hr).
(D) Representative cell-size profiles for PGC-1a
knockdown in U2OS and HeLa cells.
(E) Quantification of cell-size changes by two
PGC-1a targeting siRNAs (25 nM) compared to
control RNAi-treated cells (n = 3, 48 hr), with a
western blot showing the knockdown efficiency
in U2OS cells. All treatments except siRNA1 in
U2OS cells had p value < 0.01 (t test).
(F) Rescue of SLC25A1 RNAi (15 nM) by LipidMix
(50 ml/ml) (n = 3, 48 hr). Data shown indicate
mean 6 SD with t test (ns, not significant).
See also Figure S4 and Table S5.
Transcriptomic and Metabolic Effects of Cell Size603
inhibitors increased cell size (Figure S4K). Thus, histone acet-ylation levels are important for cell proliferation but do notexplain cell size increases.
Becausemitochondrially derived acetyl-CoA is also used forlipid biosynthesis, we attempted to rescue citrate transporterSLC25A1 RNAi by supplementing U2OS cells with a commer-cially available lipid mixture (LipidMix). This almost completelyrescued the cell-size increase caused by SLC25A1 RNAi (Fig-ure 4F). Interestingly, the effect of Mdivi-1 was also rescued byaddition of LipidMix (Figure S4L).
Repression of Lipid Biosynthesis Increases Cell SizeWe considered whether coupling of lipid synthesis and cellproliferation could explain our observations of mitochondriaand cell size. Gene expression related to de novo lipid biosyn-thesis negatively correlated with cell size (Figure 5A). Analysisof individual transcription factors identified the sterol-regula-tory element binding transcription factor 2 (SREBF2/SREBP2)as themost negatively correlating (Figure 5B). Analysis of tran-scription factor families identified E2F, ARID, and ETS factorscorrelating positively and STATs and PPARs correlating nega-tively with cell size (Figure S5A). Interestingly, 17 out of 55transcription factors with a negative size correlation of <20.3clustered based on network analysis (Figure S5B), and theseare involved in regulation of lipid metabolism either directly(SREBPs, PPAR-a, retinoic acid receptors, LXR/Nr1h2,ChREBP/Mlxipl, and HNF4A) or via inflammatory responses(STATs and IRFs). The coordinated downregulation of thisnetwork demonstrates the well-known crosstalk betweenmetabolic and inflammatory signals [23], which is clinicallyimportant in diabetes, obesity, and atherosclerosis.
SREBP1 preferentially activates fattyacid metabolism, whereas SREBP2 acti-vates cholesterol metabolism [24], andthe activities of SREBP1 and SREBP2
are regulated by phosphatidylcholine and cholesterol, respec-tively [24, 25]. Expression of genes involved in SREBPmatura-tion was also negatively correlated (Figure S5C). Becausecholesterol synthesis and one-carbon metabolism are SREBPtargets [25], this likely explains their negative correlation ofgene-expression andmetabolite levels with cell size (Figure 2Cand Table S3B).RNAi of both SREBP1 and SREBP2 increased cell size in
U2OS and hTERT-RPE cells (Figures 5C and S5D). The effectwas dose dependent (Figure S5E), and silencing of SREBP1and SREBP2 increased cell size more than either treatmentalone (Figure S5F). It has been reported that SREBP RNAi de-creases the size of RPE cells [26], but this observation may bedue to the combined effects of AKT and hydroxytamoxifen(note that tamoxifen potently increases cell size) or to morecomplete knockdown because SREBP knockout mice arelethal. Importantly, the SREBP1 and SREBP2 knockdown-induced cell-size increase in our experiments could be seenwith multiple small interfering RNAs (siRNAs) and could berescued with lipid mixture, making it unlikely that this is anoff-target effect (Figures 5C and 5D).Of all lipid classes, triacylglycerides displayed the best
correlation with cell size (Figure 5E and Table S3C), and thisaccumulation of lipids may explain the downregulation of thelipogenic transcription factors [24, 25]. Although accumulationof hepatic lipids may lead to fatty liver, Cdk1Liv2/2 mice do nothave fatty liver disease based on PPARg expression (FiguresS5G and S5I).Increased cell size should result in a decrease of the relative
surface area compared to volume. Metabolomics data indi-cated that the total levels of the detected phospholipids

A B C
D E F
G
Figure 5. SREBP-Mediated Lipid Biosynthesis Is Involved in Modulation of Cell Size
(A) Relative expression of genes in the mevalonate and cholesterol synthesis pathway and fatty acid synthesis pathway decreases with cell size in mouse
liver. The expression values were normalized to the highest expression for each gene.
(B) Histogram of individual transcription factor expression correlation with cell size in mouse liver. Median correlation of all transcription factors (r = 0.275) is
indicated with the dotted line.
(C) Quantification of U2OS cell-size changes by targeting SREBP1 and SREBP2 with nonoverlapping siRNAs (25 nM, n = 3, 60 hr). Knockdown of SREBP2
was validated by western blotting. b-actin was used as loading control. Compared to control, p value < 0.001 with all SREBP siRNAs (t test).
(D) Rescue of cell size by SREBP RNAi using LipidMix in U2OS cells. Significance was analyzed by t test (n = 3, 55 hr).
(E) Correlations (blue bars) and log2 fold changes (red line) for all lipid classes containing more than four metabolites, as classified in LIPID MAPS (http://
www.lipidmaps.org).
(F) Log2 fold changes between smallest and largest liver cells for individual glycerolipids and glycerophospholipids based on the metabolomics measure-
ment. Horizontal line indicates mean (t test).
(G) Measurement of total phospholipids using a colorimetric assay from liver extracts. Phospholipids were normalized to tissue weight. Expected cell-
surface area relative to volume is in red. The differences in phospholipid levels are significant (p < 0.01, ANOVA).
Data shown in (C), (D), and (G) indicate mean 6 SD (n = 3).
See also Figure S5.
Current Biology Vol 24 No 6604

A C E
B D F
G I
H
Figure 6. Lipids Modulate Cell Size and Proliferation Ratio
(A) Cell number (red line) and cell size (blue line) were measured after 48 hr (n = 3).
(B) Fatostatin (25 mM) effects on U2OS cell size were rescued by 50 ml/ml LipidMix (n = 3, 64 hr, t test).
(C) U2OS cell number (red line) and cell size (blue line) were analyzed as a function of simvastatin concentration (n = 3, 48 hr).
(D) Simvastatin (7.5 mM) effects on U2OS cell size and cell proliferation were rescued by 5 mM mevalonolactone (n = 3, 60 hr, t test).
(legend continued on next page)
Transcriptomic and Metabolic Effects of Cell Size605

Current Biology Vol 24 No 6606
(reflecting membrane synthesis) were not changed in largercells, whereas storage lipids (triglycerides) were clearlyincreased (Figures 5E and 5F). Direct measurement of totalphospholipids in liver samples displayed a minor increase(Figure 5G). We also reanalyzed a yeast lipidomics experiment[27] that used haploid and diploid cells. These data revealedthat two of the three most abundant phospholipids areincreased in larger cells. It appears that total phospholipids,which are present in both plasma membrane and internalmembranes, increase with cell size, and the change in phos-pholipid levels does not match the change in cell-surfacearea (Figure 5G).
To further investigate the relationship between lipids andcell size, we inhibited SREBP processing using fatostatin.Fatostatin increased cell size with a reduction in cellnumber in multiple cell lines (Figures 6A and S6A). Thiseffect was almost completely rescued by lipid addition(Figure 6B). Similar effects were obtained by inhibition ofcholesterol synthesis by simvastatin, which inhibits HMG-CoA reductase (Figure 6C). Specific rescue of simvastatinwas obtained by mevalonolactone, the end product of thereaction (Figures 6D and S6B). Opposite effects on cell prolif-eration and cell size could be seen by supplying HeLacells grown in lipid-depleted fetal bovine serum (FBS) withLipidMix. This treatment dose-dependently increased cellnumber and reduced cell size (Figure 6E). This was alsoobserved to a lesser extent with normal FBS, although higherconcentrations of lipids caused lipotoxicity (Figure S6C). Thelipids were not used as an energy source because inhibitionof beta-oxidation with etomoxir could not rescue this effect(Figure 6F). Hence, the lipids are either used as buildingblocks for membrane or for signaling to the cell-proliferationmachinery.
To further demonstrate that lipids regulate the balancebetween cell size and cell proliferation, we increased cellsize by blocking cell-cycle progression using Cdk inhibitorRO-3306 and DNA synthesis inhibitor gemcitabine (Figures6G and 6H). Although these treatments significantly in-creased cell size, cell size could not be rescued by LipidMix.Thus, cell-cycle arrest and mitochondria-mediated increasesin cell size are distinct, and LipidMix supplementation doesnot inhibit cell-size increase but acts by stimulating cellproliferation.
In diabetic and/or obese patients, excess lipids are associ-ated with both the decline in mitochondrial functions andthe decline in mitochondrial gene expression [28–30]. Weobserved that inhibition of SREBP function with fatostatinand SREBP RNAi resulted in increased mitochondrial mem-brane potential (Figures S6D and S6E), indicative of thewell-known feedback mechanism between lipids and mito-chondrial function. Altogether, our data validate a role formito-chondria and lipids in regulating the balance between cell sizeand cell proliferation.
(E) Dose dependence of increased HeLa cell proliferation by LipidMix in delipi
(F) Effect of etomoxir (50 mM) on LipidMix induced HeLa cell proliferation in 10
(G) Effect of LipidMix (50 ml/ml) on cell size in U2OS cells arrested with 7.5 mM
Data shown in (A)–(G) indicate mean 6 SD.
(H) Cell-cycle arrests in G2/M and early S phase by RO-3306 and Gemcitabine
(I) When cells proliferate, highmitochondrial metabolic activity and lipogenic tra
need for plasma membrane lipids decreases. Intracellularly accumulating lipid
lipid synthesis-related gene expression. Downregulated lipid biosynthesis, in tu
are inhibited, proliferation is reduced without directly inhibiting cell growth. SR
See also Figure S6.
Discussion
We have investigated how mouse liver cells respond toincreased cell size caused by Cdk1 inactivation and hepa-tectomy. Whereas cytoskeletal gene expression positivelycorrelates with cell size, unexpectedly, the expression of mito-chondrial and de novo lipid biosynthesis genes inversely cor-relates with cell size. Inhibition of mitochondrial functionsand lipid synthesis increases cell size in culture, suggestingcausality. Although decline in nutrient transport efficiencyand increase in time required for diffusion-limited processescould potentially limit cell size, Cdk1Liv2/2 cells grow withoutsigns of energy deprivation. The liver and Drosophila modelsindicate that the observed mitochondrial link is not Cdk1dependent or cell-cycle dependent and that it is a cell-auton-omous response related to cell size.A fundamental unresolved issue in cell biology is the
coupling of cell size and cell proliferation. We demonstratethat the balance between cell size and cell proliferation canbe changed by targeting mitochondria and/or lipid biosyn-thesis, providing one possible mechanism for this coupling.Many mitochondrial and lipid metabolism genes are downre-gulated in proliferating hepatocytes in vivo [31]. However,because most proliferating cells grow in size before cell divi-sion, the complete lack of proliferation in our model allowsseparation of growth effects. Neutral lipids, such as triglycer-ides, substantially increase after PH [32], and growth immedi-ately after hepatectomy occurs by cellular hypertrophy beforeinitiation of the cell division [33]. This physiological coinci-dence of growth with lipid accumulation before hepatocyteproliferation is consistent with our data.The mitochondrial and glycolytic changes observed in our
model bear similarities to theWarburg effect. Our data suggestthat the Warburg effect is primarily driving cell growth and notproliferation, as is often thought. Our findings are supported bya recent study in which the Warburg effect is not needed forT cell proliferation [34]. Furthermore, increased aerobic glycol-ysis decouples cell proliferation and biomass production inyeast [35], and PGC-1a expression correlates with prolifera-tion of melanoma cells [36]. It is possible that the change inglycolysis and mitochondrial activity related to cell size maybe more related to optimization of metabolic-precursor pro-duction than energy production.At first glance, our results conflict with mTOR effects. mTOR
activity increases cell size and activates lipid biosynthesis,which increases proliferation and, together with increasedprotein biosynthesis, results in increased biomass. In ourexperiments, cell size is increased at the cost of reduced pro-liferation with no increase in biomass production. We alsoshow that the opposite is true by supplying cells with lipids,which reduces cell size and increases proliferation. Our resultsare consistent with physical laws in which increased cell size isexpected to result in relative reduction of plasma membrane
dated FBS-containing medium (n = 3, 48 hr).
% lipid-free FBS (n = 3, 60 hr, t test).
RO-3306 or 1 mM Gemcitabine (n = 3, 34 hr).
, respectively, were verified by DNA staining.
nscription-factor levels aremaintained.When cell size increases, the relative
s repress the activity of lipogenic transcription factors and, consequently,
rn, reduces the need formitochondrial metabolism. Similarly, if mitochondria
EBP is shown as an example; SRE is sterol-regulatory element DNA motif.

Transcriptomic and Metabolic Effects of Cell Size607
production as volume grows faster than surface area (r3 versusr2, where r is radius) and generates a scaling problem for agrowing cell. The physical scaling problem assumes that lipidsare used for plasma membrane production and does not takeinternal membranes into account. Our analysis suggests thatthere is an increase in internal membranes, in membranecomposition, or in free phospholipids because total phospho-lipid levels are greater in larger cells. On the other hand,cholesterol is highly plasma membrane enriched, and themost affected transcription factor was SREBPF2, which isresponsible for cholesterol biosynthesis. To understand therole of lipids in the scaling problem, we will need to measurequantities and membrane selectivity of individual lipid speciesin detail.
In summary, increased cell size results in the relative reduc-tion of mitochondrial metabolism and lipid biosynthesis inmouse liver (Figure 6I). When proliferation is reduced, theneed for plasma membrane components is reduced, andexcess lipids, which are not incorporated into the plasmamembrane, accumulate and inhibit lipogenic transcription fac-tors. This reduces lipid biosynthesis and, consequently, theneed for mitochondrial metabolism. This negative feedbackthus matches the cell-size and cell-proliferation rate and mayprovide a solution for the scaling problem. Thus, lipids, whichare not incorporated into membranes, can potentially be partof a cell-size-sensing mechanism.
Experimental Procedures
The complete details of the experimental procedures are provided in the
Supplemental Experimental Procedures.
Cdk1 conditional knockout mice have been described previously [15]. All
the procedures performed were in accordance with institutional guidelines
at the Institute of Molecular and Cell Biology, A*STAR, Singapore. Livers
were collected before and 96 hr after partial (70%) hepatectomy. Nuclear
size was calculated from histological sections and normalized to
Cdk1Flox/Flox mice before hepatectomy. Pearson correlation coefficients
were calculated using all samples for each gene and metabolite.
Liver samples were analyzed by RNA sequencing (RNA-seq) and by mass
spectrometry for metabolomics. Cell-size and cell-number measurements
were conducted using flow cytometry. Small molecules were from Sigma-
Aldrich, Tocris, Santa-Cruz, or Calbiochem. RNAi was performed by
transfecting siRNAwith HiPerfect (QIAGEN). The siRNA and oligonucleotide
sequences are in Table S6. Antibodies were detected using infrared-dye
conjugated secondary antibodies and LICOR Odyssey detection system.
For electron microscopy, liver pieces were fixed and exposed to osmium
tetroxide and then embedded in Spurr’s resin.
Accession Numbers
The ArrayExpress Archive accession number for the liver gene-expression
data in this paper is E-MTAB-1297.
Supplemental Information
Supplemental Information includes Supplemental Experimental Proce-
dures, six figures, and six tables and can be found with this article online
at http://dx.doi.org/10.1016/j.cub.2014.01.071.
Acknowledgments
We thank C.J. Weijer for comments, A. McLeod for technical assistance,
N.V. Gounko and A. Boey of the IMB-IMCB Joint ElectronMicroscopy Suite,
the Agency for Science, Technology and Research (A*STAR), Singapore for
assistance in preparing and imaging specimens, and the GenePool facility
at the University of Edinburgh for Drosophila RNA-seq. This study was
funded by the Wellcome Trust Career Development Fellowship (089999)
and Scottish Universities Life Sciences Alliance (SULSA) to M.B. and by
the Biomedical Research Council of A*STAR, Singapore to P.K.
Received: October 29, 2013
Revised: December 20, 2013
Accepted: January 30, 2014
Published: March 6, 2014
References
1. Lloyd, A.C. (2013). The regulation of cell size. Cell 154, 1194–1205.
2. Jorgensen, P., and Tyers, M. (2004). How cells coordinate growth and
division. Curr. Biol. 14, R1014–R1027.
3. Marguerat, S., and Bahler, J. (2012). Coordinating genome expression
with cell size. Trends Genet. 28, 560–565.
4. Turner, J.J., Ewald, J.C., and Skotheim, J.M. (2012). Cell size control in
yeast. Curr. Biol. 22, R350–R359.
5. Jorgensen, P., Nishikawa, J.L., Breitkreutz, B.J., and Tyers, M. (2002).
Systematic identification of pathways that couple cell growth and divi-
sion in yeast. Science 297, 395–400.
6. Zhang, J., Schneider, C., Ottmers, L., Rodriguez, R., Day, A., Markwardt,
J., and Schneider, B.L. (2002). Genomic scale mutant hunt identifies cell
size homeostasis genes in S. cerevisiae. Curr. Biol. 12, 1992–2001.
7. Bjorklund, M., Taipale, M., Varjosalo, M., Saharinen, J., Lahdenpera, J.,
and Taipale, J. (2006). Identification of pathways regulating cell size and
cell-cycle progression by RNAi. Nature 439, 1009–1013.
8. Sims, D., Duchek, P., and Baum, B. (2009). PDGF/VEGF signaling con-
trols cell size in Drosophila. Genome Biol. 10, R20.
9. Galitski, T., Saldanha, A.J., Styles, C.A., Lander, E.S., and Fink, G.R.
(1999). Ploidy regulation of gene expression. Science 285, 251–254.
10. Wu, C.Y., Rolfe, P.A., Gifford, D.K., and Fink, G.R. (2010). Control of tran-
scription by cell size. PLoS Biol. 8, e1000523.
11. Zhurinsky, J., Leonhard, K., Watt, S., Marguerat, S., Bahler, J., and
Nurse, P. (2010). A coordinated global control over cellular transcription.
Curr. Biol. 20, 2010–2015.
12. Conlon, I., and Raff, M. (2003). Differences in the way a mammalian cell
and yeast cells coordinate cell growth and cell-cycle progression.
J. Biol. 2, 7.
13. Echave, P., Conlon, I.J., and Lloyd, A.C. (2007). Cell size regulation in
mammalian cells. Cell Cycle 6, 218–224.
14. Tzur, A., Kafri, R., LeBleu, V.S., Lahav, G., and Kirschner, M.W. (2009).
Cell growth and size homeostasis in proliferating animal cells. Science
325, 167–171.
15. Diril, M.K., Ratnacaram, C.K., Padmakumar, V.C., Du, T., Wasser, M.,
Coppola, V., Tessarollo, L., and Kaldis, P. (2012). Cyclin-dependent
kinase 1 (Cdk1) is essential for cell division and suppression of DNA
re-replication but not for liver regeneration. Proc. Natl. Acad. Sci. USA
109, 3826–3831.
16. Bollard, M.E., Contel, N.R., Ebbels, T.M., Smith, L., Beckonert, O.,
Cantor, G.H., Lehman-McKeeman, L., Holmes, E.C., Lindon, J.C.,
Nicholson, J.K., and Keun, H.C. (2010). NMR-based metabolic profiling
identifies biomarkers of liver regeneration following partial hepatectomy
in the rat. J. Proteome Res. 9, 59–69.
17. Posakony, J.W., England, J.M., and Attardi, G. (1977). Mitochondrial
growth and division during the cell cycle in HeLa cells. J. Cell Biol. 74,
468–491.
18. Rafelski, S.M., Viana, M.P., Zhang, Y., Chan, Y.H., Thorn, K.S., Yam, P.,
Fung, J.C., Li, H., Costa, Lda.F., and Marshall, W.F. (2012).
Mitochondrial network size scaling in budding yeast. Science 338,
822–824.
19. Wallace, D.C. (2012). Mitochondria and cancer. Nat. Rev. Cancer 12,
685–698.
20. Hoose, S.A., Rawlings, J.A., Kelly, M.M., Leitch, M.C., Ababneh, Q.O.,
Robles, J.P., Taylor, D., Hoover, E.M., Hailu, B., McEnery, K.A., et al.
(2012). A systematic analysis of cell cycle regulators in yeast reveals
that most factors act independently of cell size to control initiation of
division. PLoS Genet. 8, e1002590.
21. Nunnari, J., and Suomalainen, A. (2012). Mitochondria: in sickness and
in health. Cell 148, 1145–1159.
22. Cai, L., Sutter, B.M., Li, B., and Tu, B.P. (2011). Acetyl-CoA induces cell
growth and proliferation by promoting the acetylation of histones at
growth genes. Mol. Cell 42, 426–437.
23. Bensinger, S.J., and Tontonoz, P. (2008). Integration of metabolism and
inflammation by lipid-activated nuclear receptors. Nature 454, 470–477.
24. Osborne, T.F., and Espenshade, P.J. (2009). Evolutionary conservation
and adaptation in the mechanism that regulates SREBP action: what a
long, strange tRIP it’s been. Genes Dev. 23, 2578–2591.

Current Biology Vol 24 No 6608
25. Walker, A.K., Jacobs, R.L., Watts, J.L., Rottiers, V., Jiang, K., Finnegan,
D.M., Shioda, T., Hansen, M., Yang, F., Niebergall, L.J., et al. (2011). A
conserved SREBP-1/phosphatidylcholine feedback circuit regulates
lipogenesis in metazoans. Cell 147, 840–852.
26. Porstmann, T., Santos, C.R., Griffiths, B., Cully, M., Wu, M., Leevers, S.,
Griffiths, J.R., Chung, Y.L., and Schulze, A. (2008). SREBP activity is
regulated by mTORC1 and contributes to Akt-dependent cell growth.
Cell Metab. 8, 224–236.
27. Klose, C., Surma, M.A., Gerl, M.J., Meyenhofer, F., Shevchenko, A., and
Simons, K. (2012). Flexibility of a eukaryotic lipidome—insights from
yeast lipidomics. PLoS ONE 7, e35063.
28. Mootha, V.K., Lindgren, C.M., Eriksson, K.F., Subramanian, A., Sihag,
S., Lehar, J., Puigserver, P., Carlsson, E., Ridderstrale, M., Laurila, E.,
et al. (2003). PGC-1alpha-responsive genes involved in oxidative phos-
phorylation are coordinately downregulated in human diabetes. Nat.
Genet. 34, 267–273.
29. Patti, M.E., Butte, A.J., Crunkhorn, S., Cusi, K., Berria, R., Kashyap, S.,
Miyazaki, Y., Kohane, I., Costello, M., Saccone, R., et al. (2003).
Coordinated reduction of genes of oxidative metabolism in humans
with insulin resistance and diabetes: Potential role of PGC1 and
NRF1. Proc. Natl. Acad. Sci. USA 100, 8466–8471.
30. Sparks, L.M., Xie, H., Koza, R.A., Mynatt, R., Hulver, M.W., Bray, G.A.,
and Smith, S.R. (2005). A high-fat diet coordinately downregulates
genes required for mitochondrial oxidative phosphorylation in skeletal
muscle. Diabetes 54, 1926–1933.
31. Klochendler, A., Weinberg-Corem, N., Moran, M., Swisa, A., Pochet, N.,
Savova, V., Vikesa, J., Van de Peer, Y., Brandeis, M., Regev, A., et al.
(2012). A transgenic mouse marking live replicating cells reveals in vivo
transcriptional program of proliferation. Dev. Cell 23, 681–690.
32. Ludewig, S., Minor, G.R., and Hortenstine, J.C. (1939). Lipid distribution
in rat liver after partial hepatectomy. Exp. Biol. Med. (Maywood) 42,
158–161.
33. Miyaoka, Y., Ebato, K., Kato, H., Arakawa, S., Shimizu, S., andMiyajima,
A. (2012). Hypertrophy and unconventional cell division of hepatocytes
underlie liver regeneration. Curr. Biol. 22, 1166–1175.
34. Chang, C.H., Curtis, J.D., Maggi, L.B., Jr., Faubert, B., Villarino, A.V.,
O’Sullivan, D., Huang, S.C., van der Windt, G.J., Blagih, J., Qiu, J.,
et al. (2013). Posttranscriptional control of T cell effector function by
aerobic glycolysis. Cell 153, 1239–1251.
35. Slavov, N., and Botstein, D. (2013). Decoupling nutrient signaling from
growth rate causes aerobic glycolysis and deregulation of cell size
and gene expression. Mol. Biol. Cell 24, 157–168.
36. Vazquez, F., Lim, J.H., Chim, H., Bhalla, K., Girnun, G., Pierce, K., Clish,
C.B., Granter, S.R., Widlund, H.R., Spiegelman, B.M., and Puigserver, P.
(2013). PGC1a expression defines a subset of human melanoma tumors
with increased mitochondrial capacity and resistance to oxidative
stress. Cancer Cell 23, 287–301.

Current Biology, Volume 24
Supplemental Information
Identification of Transcriptional
and Metabolic Programs
Related to Mammalian Cell Size
Teemu P. Miettinen, Heli K.J. Pessa, Matias J. Caldez, Tobias Fuhrer, M. Kasim Diril,
Uwe Sauer, Philipp Kaldis, and Mikael Björklund

Figure S1, related to figure 1. Transcriptomics and metabolomics analysis of cell size in
vivo. (A) Analysis of metabolite levels by mass spectrometry. A density plot of all metabolite
level correlations with nuclear radius is shown. Median Pearson correlation (0.066) is
Number of metabolite ions
median
-1 10
80
40
0
Correlation with nuclear radius
Metabolomics
A B
Size
Hepatectomy
Cdk1
Metabolite level (log2 ion count )
Dehydroxycarnitine
12
11
13-Dihydro PGF-1a
11
9
Glutaconylcarnitine
11.6
10.6
Ubiquinone Q2
11
10
Heptadecanoic acid16.8
16.0
N-Glycolylneuraminic acid
15
14
O-Phosphoethanolamine
15
14
D-Glucuronic acid-1-phosphate
14
12
Guanidinosuccinic acid12
11
Phosphoglyceric acid
13
12
S-Lactoylglutathione
11
15
AdenosineDeoxyguanosineNeuraminic acid
13
12
Glycocholic acidTrihydroxyoxocholanyl-Glycine
13
9
Protopine
11
10
dATP
11
12
Uridine monophosphatePseudouridine 5'-phosphate
14
17
Cdk1fl/fl PrePH
Cdk1fl/fl PostPH
Cdk1Liv-/- PrePH
Cdk1Liv-/- PostPH
Sample order
Phosphoserine
Ergothioneine
11
13
15
1413
14
Glycochenodeoxy-cholate 3-sulfate
Log2FC Cdk1Flox/Flox Post-PH vs Pre-PH
Log2FC Cdk1L
iv-/-
Post-PH vs Pre-PH
-4 -2 0 2 4 6
6
4
2
0
-2
-4
Prtn3Scara5
Ttf3
Lcn2Ly6d
Esco2Mybl1Diap3
Saa2Mt2
Mt1
S100a8
Usp2
Per3Dbp
Gadd45aCux2
Scd1
Lrit1Hao2
A1bgGm15439Sult3a1
Rfx4
Mup16
Mup17
Tubb2aTubb2bTubb3
Cxcl13
Gm10290Acot10
Ica1Atp4a
Tnfrsf12a
Loxl4Gm13855
4
0
4
2
0
2
4
0
4
8
1
0
1
2
2
0
2
75
0
25 0
50
4
0
4
4
0
4
0
5
0
qPCR
RNAs
eq
qPCR
RNAs
eq
qPCR
RNAs
eq
qPCR
RNAs
eqqP
CRRN
Aseq
qPCR
RNAs
eq
qPCR
RNAs
eq
qPCR
RNAs
eqqP
CRRN
Aseq
qPCR
RNAs
eq
qPCR
RNAs
eq
Ccnd1Csnk2b Hmgcr Hsd17b2
Htatsf1 Mki67 Mup20 Sc4mol
Scd1 Slco1a1 Top2a qPCR changein expressionrelative to control
RNAseq changein expressionrelative to control
PrePostFlox/Flox Liv-/-
PostPre
R2= 0.83
Expression correlation (qPCR)
Expression correlation (RNAseq) 1
1
-1
-1
-0.5
-0.5 0.5
0.5
150
150
100
150
150
75
2.5
2.5
Lipid metabolism
Glycan Biosynthesisand metabolism
Carbohydratemetabolism
Nucleotidemetabolism
Cofactors and vitamins
Amino acid metabolismEnergy metabolism
Metabolite correlation with cell size
Metabolite log2FC
Cdk1L
iv-/- postPH vs Cdk1F
lox/Flox prePH
1-1 0.5-0.5
6
4
2
-6
-4
-2
GlycogenMaltotriose
AmylopectinGlycogen Maltohexaose
ErgothioneineAllyl isothiocyanate
Pimelylcarnitine13,14-Dihydro PGF-1a
Aminoadipic acidAminoadipic acid
PG(16:0/20:3)
O-Phosphohomoserine
1b-Hydroxycholic acid
Glycochenodeoxy-cholate-3-sulfatePhosphoserine
Glycocholic acid
NADP
Glucose
mRNA expression (log2 reads/million)
Log2FC Cdk1Liv-/- Post-PH
vs Cdk1Flox/FloxPre-PH
C
D E F
G H
-5 5 10 15 20
-8.0
-6.0
-4.0
-2.0
6.0
8.0
10.0 median log2FC of100 genes sliding window
2.0
4.0

indicated with a dotted line. (B) Examples of metabolites displaying cell size, hepatectomy or
Cdk1 effects. Note that we identified also metabolites such as ergothioneine, trehalose and
protopine which are not produced by mammalian metabolism, but maybe derived from food
or microbial metabolism. (C) Scatter plot of gene expression changes in response to
hepatectomy in Cdk1Flox/Flox (x-axis) and Cdk1Liv-/- livers (y-axis). Mean values of the
replicate samples were used to calculate fold-changes. As expected, we observed
upregulation of Scara5, serum amyloid A and metallothionein genes in response to partial
hepatectomy. (D) Validation of RNAseq data with quantitative RT-PCR analysis of a
selection of genes. Mean expression levels relative to Cdk1Flox/Flox control animal before
partial hepatectomy as measured by quantitative PCR (red bars) or RNAseq (blue bars).
qPCR data shown is mean expression of three technical replicates for each liver sample.
RNAseq data is calculated from the mean expression of technical replicates and plotted as
negative values for clarity. The gene names are indicated above the individual histograms.
Sample identities are shown in the Csnk2b graph only but are the same in all graphs. Note
that in a few cases, qPCR shows reduced expression compared to RNAseq, e.g., the last bar
in Sc4mol. (E) Correlation plot for Pearson correlation coefficients with nuclear radius for
the genes shown in (D), as analyzed by qPCR (x-axis) and RNAseq (y-axis). The correlation
between the two gene expression methods is shown (R2 = 0.83). (F) Annotation coverage of
the metabolomics data using 3 mD mass tolerance overlaid on the KEGG human metabolome
map (hsa01100). The map is colored by pathways. Dot size reflects log10 average intensity
of metabolite levels over all samples. (G) Scatter plot of metabolite ion correlations with
nuclear/cell size and log2 fold changes between smallest and largest cells. Data is derived
from both aqueous and organic extractions of the metabolomics data. (H) Comparison of
mRNA expression levels (in Cdk1flox/flox livers before hepatectomy) and fold changes
between smallest and largest cells. Red line indicates median log2 fold change of 100 genes

sliding window. Our data suggests that genes whose expression is low are most sensitive to
cell size changes.
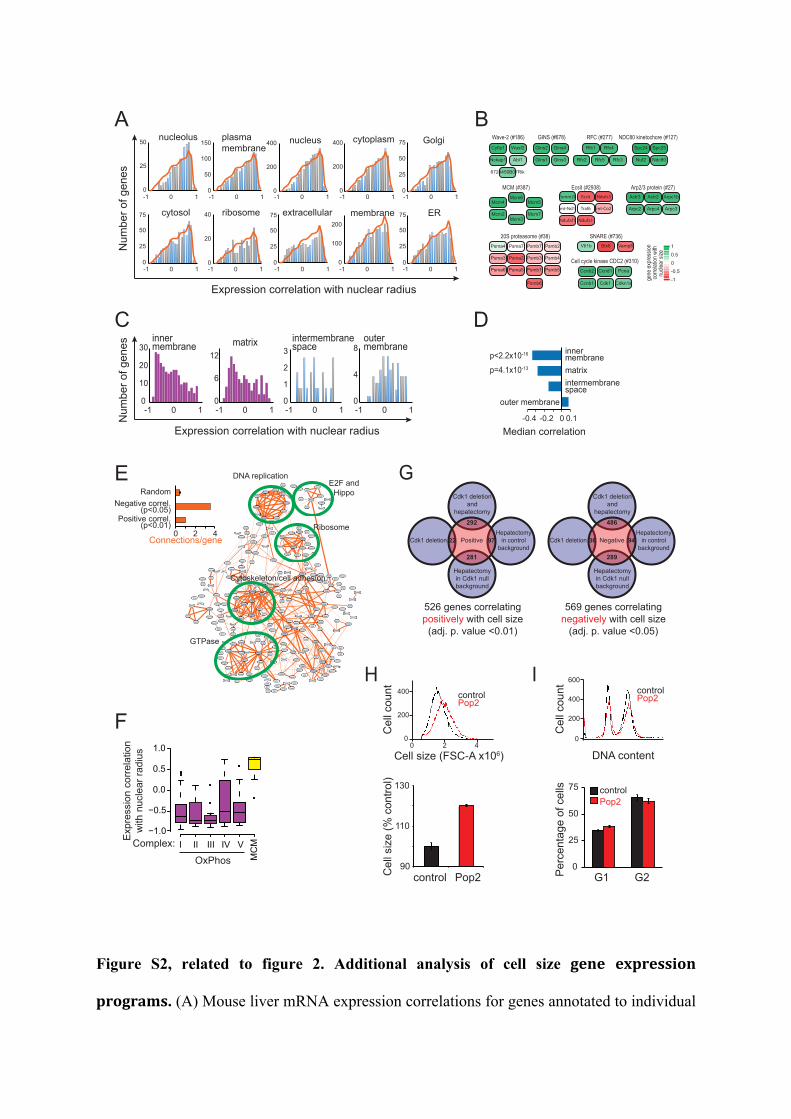
Figure S2, related to figure 2. Additional analysis of cell size gene expression
programs. (A) Mouse liver mRNA expression correlations for genes annotated to individual
controlPop2
75
25
50
0G1 G2P
ercentage of cells
Cell size (% control)
control Pop2
130
90
110
400
200
0
Cell count
Cell size (FSC-A x106)0 2 4
controlPop2
A
C
Cyfip1 Wasf2
Nckap1
6720456B07Rik
Abi1
Wave-2 (#186)Spc24 Spc25
Nuf2 Ndc80
NDC80 kinetochore (#127)
Mcm4
Mcm2
Mcm6
Mcm3
Mcm5
Mcm7
MCM (#387)
Gins2 Gins4
Gins1 Gins3
GINS (#678)Rfc1 Rfc4
Rfc2 Rfc5 Rfc3
RFC (#277)
Actr3 Actr2
Arpc2 Arpc4
Arpc1b
Arpc3
Arp2/3 protein (#27)
Ccnb2 Ccnd1
Ccnb1 Cdk1
Pcna
Cdkn1a
Cell cycle kinase CDC2 (#310)
Vti1b Vamp8Stx8
SNARE (#736)
Ecsit (#2938)
mt-Nd1 Traf6
Ndufaf1 Ndufa1
mt-Co2
Tomm20 Ecsit Ndufs3
Psma4 Psma7
Psmb4Psmb3
Psmb7
Psma3
Psma6 Psmb5Psmb1
Psma2
Psma5
Psmb6
Psmb2
20S proteasome (#38)
gene
expr
essio
nco
rrelat
ion w
ithnu
clear
size
10.5
-0.5-1
0
B
-0.2-0.4 0 0.1
Median correlation
innermembranematrixintermembranespace
outer membrane
p<2.2x10⁻¹⁶
p=4.1x10⁻¹³
Hepatectomyin controlbackground
Hepatectomyin Cdk1 nullbackground
Cdk1 deletion
Cdk1 deletionand
hepatectomy
97
281
22
292
PositiveHepatectomyin controlbackground
Hepatectomyin Cdk1 nullbackground
Cdk1 deletion
Cdk1 deletionand
hepatectomy
94
289
36
486
Negative
526 genes correlatingpositively with cell size(adj. p. value <0.01)
569 genes correlatingnegatively with cell size(adj. p. value <0.05)
G
D
F
ERandom
Negative correl.(p<0.05)
Positive correl.(p<0.01)
0 2Connections/gene
4
H
Number of genes
Expression correlation with nuclear radius
plasmamembrane
0
50
100
150
-1 10
nucleolus50
0
25
-1 10
Golgi
0
25
50
75
-1 10
nucleus
0
200
400
-1 10
cytoplasm
0
200
400
-1 10
extracellular
0
25
50
75
-1 10
ribosome
0
20
40
-1 10
cytosol
0
25
50
75
-1 10
membrane
0
100
200
-1 10
ER
0
25
50
75
-1 10
OxPhosI II III IV V
MCM
0.0
0.5
1.0
Expression correlation
with nuclear radius
Complex:
innermembrane30
20
10
0
8
4
0
3
2
1
0
12
0
6
matrix outermembrane
intermembranespace
-1 10 -1 10 -1 10-1 10
Number of genes
Expression correlation with nuclear radius
I400
200
0
600
Cell count
DNA content
controlPop2
Nop56Stmn1Rpsa
Mthfd2Lsm3
Marcks
Basp1Smc5
H2afz
Trpm7
Anxa5 Ssh2
Psat1
Mcm6
Setd7Gins2
Mcm5 E2f2
Suv39h1
Rpl5Eid1 NptnIer3
Klf6
Ywhah
Selh
Sh3bgrl
Stag2
Cdc25b
Gins4Mcm4
Gtpbp4Nap1l1
Timeless
Prim2
E2f1Dgcr8
Rpa1
Rpa2
Pole
Myst3
Atf3
Rbbp8Tead1
Rps8
Gm6030Rps13Rplp0Rpl13
AsphLgals1Ssr3
Rpl19
Rpl12
Btaf1
Gm5271
Gm6336Gm7263
Cenpj
Mcph1Tcf12
Jund
Batf3
Iqgap1
Galnt1
Nras
Camk2d
Msn
Zeb2
Igsf8
Fcer1gS100b
Mme
Ankrd26
Sykb
Hcls1
Flna
Pawr
Cybb
Grm1Rac2
Gnai2 Nckap1l
Fads3
Nedd4
Cd63
Cyfip1Arf6
Apc
Cfp
Agap1
Ap3b1
Cd300ldClec4a2
Laptm5
Uchl5
Itgb2
Cd53Lyz1
Lpl
Il3raLamp1
Ucp2Ncf1
DgkhAcsl4Dgke
Ppt1
Jak3
Cln6
Rlf
Tyrobp
Ptgs1
Cd68
Actn1
App
FybDmpk
Rif1
Mbnl2
Gpc1
Aplp2
TbcaCugbp2
Arhgef5
Heph
Capns1
Myof
Zfp217
Rhog
Arhgef2Arap2
Sox4
Cdk6
Dock10
Gdf10
Arhgap4
Pmepa1
Rgs19
Pou2f2
Gmfb
Mmp15
Cd5l Timp2
Ren1
Myo9aNcam1
ArhgdibOphn1
Rgs10
Rhoq
Bgn
Mmp14Smoc2
Senp1
Lum
Sdc3
Ccdc80Cd44Spc24
Cenpt
Nup155
Smg1Apaf1
Cfl2
Abcg3Anxa4Tmed10Mllt3 Actb
Ccar1
Plec1Vim Olfml3
Tnfaip8Casp8
Bicc1
Nol3S100a6
Mlec
MefvTmsb10
F13a1Sh3kbp1
Erbb2ip
Ap1s2
Cltc
Actr3
Galns
Myl6
VaspAtp9a
Cdk14
Nacc1
Rock2
Gpnmb
Dync1li1
Spp1FlnbCd36
Thbs1Fstl1
Adh1
ENSMUSG00000034868Epcam
Col1a2Prom1 Fkbp9Crtap Col1a1 Itgb1
Slc22a3
Tmsb4x
Col5a2Col6a3
Col5a1
Col3a1
Abcc2
Il17rb
Abcg2Spc25
Ranbp2
Calu
Ctse
Gpx3
Hk1Gpx4
Gsta4
Gstm5
Prpf31
Emr1
Tmem176b
Tmem176a
Aif1
Hnmt
Alg8
Cst3 Alg3
Ctss
C3ar1
Cd276
Soat1
C1qa
DNA replicationE2F andHippo
Ribosome
GTPase
Cytoskeleton/cell adhesion

subcellular components were binned to obtain scaling profiles (bars) for each subcellular
component. For comparison, the whole cell profile (all genes with annotation in any of the
subcellular component, orange line) is overlaid on the bar chart. The number of genes in the
whole cell profile was normalized to the number of genes in individual subcellular
component to simplify comparison. Interestingly, plasma membrane annotated genes are not
coordinately downregulated. (B) Examples of protein complexes, which gene expression
positively and negatively correlates with cell size. The CORUM complex database numbers
for each complex are indicated (mips.helmholtz-muenchen.de/genre/proj/corum ). Note that
we detect expression of Cdk1 mRNA as the knockout is a result of Cdk1 exon 3 deletion only
in hepatocytes and the signal may stem from other cell types in the liver. (C) Analysis of
gene expression profiles for mitochondrial substructures using GO analysis. (D) Summary of
the mitochondrial gene expression changes. p values were calculated using Kolmogorov-
Smirnov test. (E) Connectivity of genes correlating positively (adj.p.value <0.01) with cell
size as identified using the STRING database. Groups of functionally interacting genes are
indicated with green circles and named. Number of connections in positively and negatively
correlating gene sets (Fig. 2C) as well as in similar sized random networks (mean and SD of
five random networks) is show in the inset. Note that the number of connections in the gene
set correlating negatively with cell size is more than three times higher than that of the
positively correlating gene set. (F) Correlation of individual OxPhos complexes (I-V) and the
minichromosome maintenance complex (MCM) with nuclear radius. Boxplot indicates
median correlation. Outliers are shown with black dots. (G) Venn diagrams depicting the
overlap between differentially expressed genes in pairwise sample and size correlating genes.
Our data indicates a poor overlap between identified cell size genes and genes responding to
Cdk1 deletion or partial hepatectomy. (H) Cell size histogram and relative cell change in
dsRED control and Pop2 RNAi treated Kc167 cells. Cells were treated by RNAi for 4 days.

(I) Percentage of cells in G1 and G2 in dsRED and Pop2 RNAi treated Kc167 cells used for
Drosophila RNAseq analysis. G1 and G2 populations were analysed from DNA content
histograms. Data shown in G and H is mean and standard deviation (n=3). All data except H
and I are from mouse liver gene expression data set.

Figure S3, related to figure 3. Gene expression and metabolic changes related to
glycolysis and TCA cycle. (A) Quantification of mitochondrial number per image (n=7-‐
Glucose
Glucose-6-Phosphate
Fructose-6-Phosphate
Fructose-1,6-Bisphosphate
Dihydroxyacetone phosphate
Glyceraldehyde-3-Phosphate
1,3-Bisphosphoglycerate
3-Phosphoglycerate
2-Phosphoglycerate
Phosphoenylpyruvate
Pyruvate
Hexokinase
Glucose phosphate isomerase
Phosphofructokinase
Fructose diphosphate aldolase
Triosephosphate isomerase
Glyceraldehyde phosphate dehydrogenase
Phosphoglycerate kinase
Phosphoglycerate mutase
Enolase
Pyruvate kinase
Hk1Hk2
Gpi1
Pfkl
Pgam1
Pfkm
AldoaAldobAldoc
Tpi1
Gapdh
Pgk1
Eno1Eno3
Pkm2
Acetyl-CoAPyruvate dehydrogenase
Pdhb
LactateLactate dehydrogenase
Gck Glucokinase
Glucose sensing
Pklr
ADP-dependent glucokinaseAdpgk
2,3-bisphosphoglycerate mutase
2,3-Bisphospho
glycerate
Bpgm
Malate dehydrogenase
Mdh1Mdh2
TCA cycle
citrate
isocitrate
a-ketoglutarate
succinyl-CoAsuccinate
fumarate
malate
oxaloacetate
Glutamine
CoA
dehydrogenase
a-ketoglutarate
Ogdh
DlatPdha1
Glucokinase regulatory proteinGckr
glutamateoxaloacetate
aspartate
Glutaminase
Glutamate oxaloacetate transaminase
Got2Got1GlsGls2
Citrate synthase
Cs
Aconitase
Aco1Aco2
Fumarate hydratase
Fh1
2,3-bisphosphoglycerate phosphatase
Bpgm
Glut1/Slc2a1 Glut2/Slc2a2Glut5/Slc2a5 Glut8/Slc2a8
Glucose transporters
Pgam1
Sdha SdhbSdhc Sdhd
Idh1 Idh2 Idh3aIdh3b Idh3g
Glutaminolysis
0.8 - 1.0
0.6 - 0.8
0.4 - 0.6
0.2 - 0.4
0.0 - 0.2
0.0 - -0.2
-0.2 - -0.4
-0.4 - -0.6
-0.6 - -0.8
-0.8 - -1.0
Gene expressioncorrelation with nuclearradius
Ldha Ldhb
Isocitrate
dehydrogenase
Suclg1Suclg2Sucla2
Pentose phosphate
Serine synthesis
18
16
6-Phosphogluconate
13
12
15
14
Glyceraldehyde-3PDihydroxyacetone-P
Glycerol
13
12
Pyruvate
Lactate
Glycerol synthesis
Succinate
Malate
Fumarate
10.8
11.8
Citrate/Isocitrate
16
14
Phosphoserine
14
15
15
17
18
16
21
19
20
19
15
16
20
17
Glucose-6-phosphate
Bisphosphoglycerate
10.5
11.5
Fructose-6-phosphate
Glycolysis
TCA cycle
Branchingpathways
A
log2 ion count
log2 ion count
log2 ion count
log2 ion count
log2 ion count
log2 ion count
log2 ion count
log2 ion count
log2 ion count
log2 ion count
log2 ion count
log2 ion count
log2 ion count
log2 ion count
4
2
-2
-4
0
Glycogen
Glucose
Glucose-6-phosphate
Glyceraldehyde-3P
Bisphosphoglycerate
Lactate
Pyruvate
6-Phosphogluconate
Glycerol
Phosphoserine
Citrate/Isocitrate
Succinate
Fumarate
Malate
GlycolysisBranching
pathwaysTCA cycle
Relative metabolite change
Cdk1 knock-out
enhances
metabolite change
Cdk1 knock-out
suppresses/reverses
metabolite change
No cell size effect
Relative signal of
mtDNA/genomic DNA
Cdk1Flox/Flox
0.0
0.5
1.0
1.5
2.0
Cdk1Liv-/-
Pre Post Post Post PostPre Pre Pre
Flox/Flox PrePH
Flox/Flox PostPH
Liv-/- PrePH
Liv-/- PostPH
30
20
10
0
Gene expression (RNAseq)
Dna2
Rrm2b
Peo1Tk2
Polg
Dnaja3
Polg2
B
C
DGlycogen
20
12
16
log2 ion count
Cdk1fl/fl PrePH
Cdk1fl/fl PostPH
Cdk1Liv-/- PrePH
Cdk1Liv-/- PostPH
Sample order
Number
12
8
4
0
Area (AU)
0
4
8
Cristae
0
8
16
Density (AU)
0
1
2
Cdk1fl/fl PrePH
Cdk1fl/fl PostPH
Cdk1Liv-/- PrePH
Cdk1Liv-/- PostPH
Sample order
E

10), mitochondrial area (n=47-‐65 mitochondria), number of mitochondrial cristae
(n=44-‐65) and mitochondrial electron density (n=47-‐65). Data is mean ± SD. (B)
RNAseq expression values for genes involved in mitochondrial DNA replication in the liver
expression data. (C) Mitochondrial DNA to genomic DNA ratio as measured by quantitative
PCR from the liver samples (n=3). (D) Detailed map of glycolysis and TCA cycle with
branching biosynthesis pathways. Enzymes involved in each step are indicated next to the
metabolites in the pathway map. Positive and negative gene expression correlations with cell
size are in blue and red, respectively. Metabolite levels in liver samples are shown with box
plots. (E) Relative metabolite changes in CdkLiv-/- mice compared to Cdk1Flox/Flox control
animals. Fold changes for postPH vs. prePH were calculated and these compared between
Cdk1Liv-/- and control mice. Cdk1 knockout enhances metabolite changes in later stages of
glycolysis with an increase in metabolite levels going to serine and glycerol synthesis. The
sample order is the same in all plots (Flox/Flox prePH, Flox/Flox postPH, Liv-/- prePH and
Liv-/- postPH).

Figure S4, related to figure 4. Effects of mitochondrial targeting on proliferation and
histone acetylation. (A) HeLa cell numbers (red line) and cell size (blue line) was analysed
BA C
0
40
80
120
100
110
120
0 0.5 1 1.5 2 2.5
Azide (mM)
Cell number (% control)
Cell size (% control)
0 25 50 75 100
Hela
Mdivi-1 (µM)
0
40
80
120
100
110
120
130
Cell size (% control)
Cell number (% control) 200
100
0
Control Azide
electricalcurrentexclusion
Flowcytometry
Cell size
(% control)
200
100
0
Control AzideTotal protein/cell
(% control)
D
U2OS
Oxygen consumption
(pmol/min)
WT Rho0
Cell size (% control)
90
100
110
120 600
450
300
150
0
0 40 80 120 160
Control Rotenone Antimycin A NaN3 Oligomycin
Time (min)
Oxygen consumption
(pmol/min)
0
100
200
300Inhibitorinjection
acetyl-coenzyme A
Mevalonate
pathway
Fatty acid
synthesis
pyruvate OAA citrate
citrateOAApyruvate
acetyl-coenzyme A
Mitochondria
Cytosol
Histone
acetylation
Pcx Cs
Aclymalate
Mdh1Me1
Brp44l Slc25A1
Control SLC25A1si1 si2
U2OSHeLa
90
120
110
100
Cell size (% control)
H3H2A/H2BH4
Ac-Lys
H3-K9Ac
H4-K8Ac
H2B-K5Ac
Cdk1flox Cdk1Liv-/-PrePH PostPH PostPHPrePH
100
50
0 Ac-Lys
(% control) 100
50
0
Ac-Lys
(% control)
Ac-Lys
H3-K9Ac
H4-K8Ac
H2B-K5Ac
CoxIV
Control Rotenone
50
70
90
110 Cell size
Control
Control
Control
MB-3 CPTH2 C646
50 100
250
5 25 50 0.5
2.5
5
% Control
Cell number
Control Mdivi-1LipidMix - -+ +
Hela150
100
50
0
% control
U2OS150
100
50
0
% control
Cell size Cell number
Control Mdivi-1LipidMix - -+ +
E F G
H I J
K L
p<0.01
p<0.01
p<0.001
p<0.001
p<0.01
p<0.01

as a function of Mdivi-1 concentration (n=3, 48h). (B) U2OS cell numbers (red line) and cell
size (blue line) was analysed as a function of sodium azide concentration (n=3, 48h). (C)
Comparison of cell size measurement of control and azide treated chicken DT40 cells using
Casy TT (electrical current exclusion) and flow cytometry forward scatter methods. 1mM
azide was used for experiment (n=3, 48h). (D) Sodium azide (1mM) increases cell size by
production of more protein. U2OS were trypsinised and analysed by flow cytometry and
protein concentrations were measured by Coomassie method and normalised for cell size
(n=4, t-test). (E) Cell size (blue bars) and oxygen consumption (red line) of wild type (WT)
and Rho0 U2OS cells (n=4, t-test). (F) Validation of OxPhos inhibitor function using oxygen
consumption measurement (Seahorse assay). Inhibitors were injected at 50 minutes time
point. For concentrations used, see Table S5 (n=3-5). (G) Schematic of metabolite transport
between mitochondria and cytoplasm for lipid synthesis and histone acetylation. Expression
of the enzymes and transporters marked with red correlate negatively with cell size. (H)
Citrate transporter SLC25A1 knockdown by RNAi using two independent siRNAs in HeLa
and U2OS cell (n=3, 48h). p-value is <0.01 for all SLC25A1 treatments compared to control
siRNA (t-test). (I) Decrease in histone acetylation in vivo. Mouse liver sample histones were
purified using acid extraction, run on SDS-PAGE and stained with Coomassie (lowest panel).
Levels of histone acetylation were analysed by Western blotting using total acetylated lysine
(Ac-Lys) or individual acetylation sites. Quantification of the total Ac-Lys signal is shown in
the bottom panel. (J) U2OS cells were treated with 6 µM rotenone for 48 h. Histone
acetylation was analysed by Western blot from total cellular lysates using total acetylated
lysine (Ac-Lys) or individual acetylation sites. Total Ac-Lys levels were quantified and
plotted (blue bars). CoxIV was used as loading control. (K) U2OS cell size (blue line) and
numbers (red line) after histone acetylation inhibitor treatments. Data shown is mean with
standard deviation (n=3, 28h). MB-3 is a Gcn5 inhibitor, CPTH2 inhibitor modulates the

Gcn5 network, and C646 is a competitive inhibitor of p300/CBP. (L) Rescue of Mdivi-1
induced cell size increase by 50 µl/ml LipidMix in U2OS (upper panel, 72h) and HeLa cells
(lower panel, 44h) (n=3, t-test). Data shown in all panels is mean and standard deviation.

B
D E F
2
1
0
-1
-2
Pparg expression mRNA
counts per million (log2)
Cdk1Flox/Flox Cdk1Liv-/-
PrePH PostPH PrePH PostPH
20
10
0
-5mRNA counts per
million (log2)
Pparg
Ranked gene expression
C
-0.3
0.3
0.6
0
Correlation with nuclear size
STAT
PPAR
E2F
CSDARIDMBD
ETS
TSC22
IRF
TF family rank
A
19
20
p<0.01
oleic acid
log2 ion count
Cell size (% control)
ctrl SREBF1 SREBF2
130
120
110
100
90
Cell size (% control) 130
120
110
100
90
Control
SREBF1
SREBF2
SREBF1+2
Srebf1 Srebf2
Gtf2i
Nr1h2 Mlxipl
Atf6
Stat5b
Irf6
Zfp467Irf3
Stat1
Rxrg
Rxra
Hnf4aRxrb
Nr2f6
Ppara
SREBP1
SREBP2
SREBP1+2
SREBP1
SREBP2
SREBP1+2
10% FBS1% lipid-free
FBS
fl-SREBP2
m-SREBP2
Actin
Control
Control
120
110
100
90
hTERT-RPE
Cell size
(% control)
Srebf1
Srebf2
Scap
Insig1
Insig2
300
200
100
0
Cdk1Flox/Flox PrePH
Cdk1Liv-/- PostPH
RNAseq
reads/million
G
H
I
Cdk1Flox/Flox Cdk1Liv-/-
PrePH PostPH PrePH PostPH
Ergosterol
PE 34:2
PI 34:1
PC 34:2
PI 32:1
PC 32:2
PE 32:2
IPC 44:0:4
MIP2C 44:0:4
MIPC 44:0:4
PA 34:2
PA 34:1
lysoPC 18:1
lysoPC 16:1
PE 34:1
lysoPE 18:1
PA 32:1
PE 32:1 0
2
4
6
8
10
12
14
16
J
BY4741 (haploid a)
BY4742 (haploid
BY4743 (diploid)
Mean values (mol%/total lipids)
p<0.001p<0.001
p<0.001

Figure S5, related to figure 5. Cell size is associated with changes in lipid biosynthesis.
(A) Analysis of transcription factor family expression correlation with cell size in mouse
liver. Mean correlations for each family with three or more genes were calculated. (B) A
network of lipogenic transcription factors correlates negatively with cell size. All
transcription factors with cell size correlation <-0.3 were analysed for connectivity using
STRING database. The resulting network of 17 out of these 55 transcription factors which are
connected to each other is shown. (C) Expression of SREBPs and SREBP processing proteins
is strongly downregulated as measured by liver RNAseq. Mean and standard deviations for
the smallest and largest cells are shown. (D) Quantification of hTERT-RPE cell size changes
by targeting SREBP1 and 2 in normal culture medium with 10% FBS or two days in normal
medium followed by 24h in 1% delipidated FBS (n=3, 72h) to emulate the conditions used by
[27]. Cell size was quantified by flow cytometry. Both full length (fl-SREBP2) and mature
(m-SREBP2) forms of SREBP2 are detected by Western blotting. β-actin was used as
loading control. The cell size difference between control siRNA groups under both conditions
is statistically significant (p-value <0.001, t-test) as are the differences between SREBP
siRNA treatments to the control siRNA (p<0.001 in all, t-test). (E) siRNA inhibition of
SREBFs increases cell size in a dose dependent manner. U2OS cells were transfected with
SREBF1 and SREBF2 siRNAs that were used at 6.3, 12.5, and 25 nM concentration and
adjusting total siRNA concentration to 25 nM using the control siRNA (n=3, 48h). Compared
to control siRNA p-value is <0.001 with all siRNA concentrations (t-test). (F) Redundant
action of SREBP1 and 2 on cell size. U2OS cells were transfected with 12.5 nM of SREBP1,
SREBP2 or both in combination adjusting total siRNA concentration to 25 nM using the
control siRNA (n=4, 48h, t-test). (G) Cdk1Liv-/- mice display increase in oleate, a marker for
fatty liver disease. Statistical significance was measured by ANOVA followed by Tukey's
test. (H) PPARγ [Pparg], another biomarker for fatty liver, expression is not induced as

shown by RNAseq and (I) PPARγ does not increase in response to cell size changes in liver
gene expression data. We conclude based on lack of PPARγ induction that the mice do not
have fatty liver disease. Data shown in all panels is mean and standard deviation. (J)
Comparison of lipid profiles in haploid (smaller) and diploid (larger) yeast cells. Lipidomic
data is from Klose et al. [28]. Profiles for most abundant lipid species in haploid and diploid
cells are plotted and names of the lipid species which appear to be differentially regulated in
haploid and diploid cells are indicated with red. Two of the three most abundant
phospholipids phosphatidylethanolamine (PE 34:2) and phosphatidylcholine (PC 34:2)) are
increased in diploid cells versus haploid cells. Inositolphosphorylceramide (IPC44:0:4) and
phosphatidic acid (PA 34:1) are less abundant in diploid cells. This data suggests that
individual lipid species respond differentially to cell size changes. For naming conventions
see original article [28].

Figure S6, related to figure 6. Cell size, lipid synthesis and mitochondrial functionality
are coupled. (A) Inhibition of SREBP maturation by fatostatin in HepG2 (left, 72h) and
hTERT-RPE cells (right, 96h) increases cell size (n=3). (B) Rescue of simvastatin (7.5 µM)
effect on cell size and cell proliferation by mevalonolactone (5 mM) in HepG2 cells (n=3,
72h, t-test). (C) Reciprocal effects of the lipid mix on U2OS cell size and cell number in
LipidMix (µl/ml)
0.02
0.01
0
Mitotracker red/cell size (AU)
Fatostatin
Control
0.019
0.020
0.021
0.022
Control
SREBF1
SREBF2
HepG2
40
60
80
100
120
90
100
110
120
130
0 5 10 25
Fatostatin (uM)
Cell number (% control)
Cell size (% control)
A
E
C
D
Mitotracker red/cell size (AU)
hTERT-RPE
0
40
80
120
90
100
110
120
0 5 10 15 20 25
Cell size (% control)
Cell number (% control)
Fatostatin (µM)
88
92
96
100
104
70
90
110
130
0 20 40 60 80
Cell number (% control)
Cell size (% control)
40
60
80
100
120
% of control
B
Control
Simvastatin
Mevalonolactone
Simvastatin and
mevalonolactone
Cell size Cell number
p<0.01
p<0.01p<0.01
U2OS
p<0.01
p<0.001

normal FBS containing medium (n=3). In normal medium, lipotoxicity is observed with high
doses. (D) U2OS cells were treated with or without 20 µM fatostatin. Mitochondrial
membrane potential was measured with MitoTracker Red and normalised to cell size (n=3,
54h, t-test). (E) U2OS cells were treated with control, SREBP1 or SREBP2 RNAi.
Mitochondrial membrane potential was measured with MitoTracker Red and normalised to
cell size (n=3, 50h, t-test). Data shown in all panels is mean ± SD.
SUPPLEMENTAL EXPERIMENTAL PROCEDURES Mouse model
The generation of the Cdk1 conditional mice has been described previously [S1]. For the
RNAseq and metabolomics analyses, Cdk1Flox/Flox and Cdk1Liv-/- mice were used before and
96 hours after partial (70%) hepatectomy. All mice used were 14 weeks old females at the
time of the partial hepatectomy (PH) surgery. The liver was collected before and 96 hours
after PH, snap frozen, and stored at -80°C until RNA or metabolite extraction. Nuclear size
was calculated from Feulgen stained histological sections using Fiji image analysis software
(version 1.46a).
RNA sequencing
Total RNA from liver samples was purified using QIAzol Lysis Reagent (Qiagen) and
homogenization using Precellys homogenizer (Bertin Technologies). 15 µg total RNA was
fragmented for 3 min at 70°C in RNA fragmentation buffer (Ambion). Fragmentation was
terminated by cooling of the sample on ice and addition of EDTA to 17 mM final
concentration. RNA sequencing was performed by tag profiling essentially as described [S2].
The resulting RNAseq library was purified using SPRI beads and sequenced at Genotypic
Technology Pvt. Ltd, Bangalore, India, using 54 bp single end sequencing on Illumina GAIIx.

For Drosophila samples, total RNA from Kc167 cells treated with dsRED control and Pop2
RNAi in triplicates for four days was purified using Qiazol and processed as above. The
resulting library was sequenced at the Genepool, University of Edinburgh, using 50 bp single
end sequencing on Illumina HiSeq.
The sequencing reads were mapped to transcriptome using Bowtie version 0.12.5
[S3]. For mapping, we used the longest transcript in Ensembl database. Sequencing reads
matching to identical positions and having identical molecular identifier sequences were
merged and the numbers of unique template molecules were counted to get expression levels
[S2]. Differential gene expression was analysed using EdgeR package (mouse samples) or
DEseq (Drosophila samples) in R.
Metabolomics analysis
For each liver, three 50 mg samples were extracted with 1.5 ml cold 50:50% methanol/H2O
using TissueLyser homogenizer (Qiagen) at 2000 rpm for 5 min. 650 µl supernatant were
dried and resuspended in 1.5 ml H2O + 0.5 ml methanol and analysed in a 1:10 dilution. For
organic extraction, cell pellets from aqueous extraction were further homogenized in 1.5 ml
dichloromethane/methanol and 650 µl of the resulting supernatant were dried and
resuspended in 1 ml acetonitrile + 0.5 ml methanol. Samples were analysed on a 6550
Agilent QTOF mass spectrometer by untargeted flow injection analysis as described
previously [S4]. Profile spectra with high mass accuracy were recorded from 50 to 1000 m/z
in negative ionization mode.
For analysis, data from technical replicates (successive sample injections) was
averaged. For each sample, raw intensity data was median normalised using "robust quantile
normalization" function of preprocessCore package in R. This normalisation results in the
relative levels of individual metabolite to the total metabolite levels of the tissue and not the

metabolite levels per cell. Ions were annotated based on accurate mass comparison against
8492 human metabolites present in the Human Metabolome Database [S5] using 1 mDa mass
tolerance. The annotated metabolites were mapped on the human metabolic network derived
from the KEGG database using pathway projector [S6].
Correlation of gene and metabolite expression with nuclear size
The nuclear sizes were normalized relative to those of the Cdk1Flox/Flox mice before
hepatectomy. Pearson correlation co-efficients (r) were calculated using all samples for each
gene and metabolite. Gene ontology (GO) classifications for the genes were downloaded
from Ensembl database (version 62, April 2011) and used to calculate correlation histograms
for each cellular subcomponent. For Drosophila data, GO classifications were obtained from
Ensembl (version 73, September 2013).
Quantitative RT-PCR
Liver DNA was isolated and amplified in triplicates using primers
TAGAGGGACAAGTGGCGTTC and CGCTGAGCCAGTCAGTGT targeting 18S rDNA
sequences and mitochondrial DNA using primers
ACTTCTGCCAGCCTGACCCATAGCCA and ACGCGAATGGGCCGGCTGCGTAT
using Maxima SYBR Green qPCR Master Mix (ThermoFisher) with 0.1 µM ROX, 0.3 µM
primers. Melting curve analyses and gel electrophoresis indicated a single PCR product. The
ratio of the mitochondrial to genomic DNA values was calculated from the obtained
quantification cycle (Ct) values. For RNAseq validation, total RNA used for RNAseq was
reverse transcribed and amplified in triplicates with the gene-specific primer pairs (Table S6)
obtained from GETPrime qPCR primer database [S7]. qPCR was performed using Maxima

SYBR Green qPCR Master Mix. Results were analysed with R (version 2.14.0) package
HTqPCR (version 1.8.0) using the DCt method.
Cell culture and reagents
U2OS, HeLa, and HepG2 cells were cultured in DMEM containing 4.5g/l glucose, 10% FBS,
L-glutamine and penicillin and streptomycin. hTERT-RPE cells were grown in Advanced
DMEM/F-12 containing 4.5g/l glucose, 10% FBS, L-glutamine and penicillin and
streptomycin and the cells were supplemented with hygromycin B (50µg/ml). DT40 cells
were grown in RPMI with 10% FBS, 3% chicken serum, 1 mM β-mercaptoethanol, L-
glutamine and penicillin and streptomycin.
Delipidated FBS was prepared by extracting FBS once with 2:1 vol/vol mixture of
diisopropylether and n-butanol and a second extraction with diisopropylether followed by
extensive dialysis against PBS using 10 000 MWCO membrane. U2OSrho0 cells were
generated by incubating the cells with 0.1 µg/ml ethidium bromide for 3 weeks in the
presence of 50 µg/ml uridine in DMEM/10% FBS. Cell size and cell number measurements
were conducted using flow cytometry using Accuri C6 cytometer (Becton-Dickinson) or by
electrical current exclusion method (CASY TT, Roche).
Small molecules were obtained from Sigma-Aldrich, Tocris, Santa-Cruz and
Calbiochem. For small molecule data shown in Fig. 4A concentrations and solvents are
shown in Table S5. For rescue experiments using LipidMixture 1 (Sigma) cells were treated
with LipidMix simultaneously with chemical treatments or 24h after siRNA transfections.
RNAi was performed by transfecting with 25 nM siRNA with HiPerfect (Qiagen). The
siRNA sequences are shown in Table S6. Antibodies were used at their recommended
concentrations and detected using infrared-dye conjugated secondary antibodies and LICOR
Odyssey detection system.

For DNA content measurement, mammalian cells were stained with propidium iodide
as previously described [S8]. For Drosophila cells, DNA staining was performed using
Vybrant DyeCycle Orange live cell stain (Life Technologies) as per manufacture's
instructions. For measuring mitochondrial membrane potential, MitotrackerRed (Life
Technologies) was added to 150 nM final concentration for 40 min before the FACS assay
and cells were washed twice with PBS before flow cytometry analysis. Oxygen consumption
was measured using Seahorse XF24 instrument according to manufacturer's instructions.
Antibodies and Western Blotting
Histones were isolated using acid extraction and separated on 4-12% SDS-PAGE gels in
MES buffer (LifeTechnologies). For Western blots, the following antibodies were used:
Acetylated-Lysine #9441, Acetyl-Histone H3 (Lys9) (C5B11) #9649, Acetyl-Histone H2B
(Lys5) #2574, Acetyl-Histone H4 (Lys8) #2594, pAMPK #2535, CoxIV #4850, GAPDH
#5174, b-Actin (#4970) (all from Cell Signaling Technology). PGC-1a antibody (clone
4C1.3) was from Millipore. For analysis of OxPhos protein expression MitoProfile Total
OXPHOS Rodent WB Antibody Cocktail (ab110413, Abcam) was used. Antibodies were
used at their recommended concentrations and detected using infrared-dye conjugated
secondary antibodies and LICOR Odyssey detection system.
Electron microscopy
Liver pieces of 1 mm3 obtained before partial hepatectomy were immersed in 4%
paraformaldehyde, 2.5% glutaraldehyde in 0.1M phosphate buffer, pH 7.4 for 5 days at 4ºC
while the samples obtained after partial hepatectomy were fixed for 24 hours at 4ºC. Tissue
samples were rinsed in 0.1M phosphate buffer, pH 7.4 and then 0.1M Sodium Cacodylate
Trihydrate, pH 7.6 on ice. After fixation samples were exposed to Osmium fixative solution

[1% OsO4 + 1.5% K3Fe(CN)6 in 0.1M Sodium Cacodylate Trihydrate pH 7.6] for 1 hour at
RT. Samples were washed in dH20 and dehydrated through an ascending ethanol series (from
25% to 100% ethanol) and 100 % acetone. The infiltration was continued with resin in 100%
ethanol and then fresh resin overnight. Finally samples were embedded in Spurr’s fresh resin
and polymerized at 60ºC for 24 hours [S9]. Ultrathin sections were counterstained with 5%
uranyl acetate and Reynold's lead citrate and examined with a under JEM-1010 electron
microscope operated at 80 kV or JEM-2200FS at 100 kV. Images were analysed using
ImageJ.
Analysis of total phospholipids
Phospholipids were measured using a colorimetric method based on the formation of a
complex between phospholipids and ammonium ferrothiocyanate [S10]. Briefly, liver
samples (~20mg) were homogenised in 300µl PBS and 750µl of methanol and homogenates
were extracted with chloroform. Organic phase was allowed to react with FeCl3-thiocyanate
reagent followed by absorbance measurement at 488 nm from the organic phase. Liver
samples were analysed in triplicates.
Analysis of yeast lipidomics data
Haploid and diploid lipid profiles were obtained from supplementary file from Klose et al
[S11]. Individual lipid species were ranked by abundance in diploid cells and lipid levels in a
and a mating pairs were compared to these. Only most abundant lipid species are shown
(>1.4 mol%/total lipids). Statistical difference between yeast strains for individual lipids can
not be calculated as only means and standard deviations are available in the original
publication.

Statistics
The p-values for the obtained Pearson correlations were calculated from Student’s t-
distribution and were adjusted using Benjamini and Hochberg False Discovery Rate
correction. Statistical significances for the differential gene expression were directly obtained
using the EdgeR package (for mouse data) or DEseq package (for Drosophila data) in R. Cell
based assay data is presented as mean ± standard deviation using two-tailed t-test. All error
bars depict standard deviation. The whiskers in boxplots depict maximum and minimum
values excluding outliers which are indicated with circles. The significance of differential
correlation of gene expression levels with subcellular structures versus whole cell data was
done using Kolmogorov-Smirnov test. Significance of the individual metabolite level
changes between treatments was analysed by two-tailed t-test or ANOVA followed by
Tukey's HSD test as indicated in the figure legends. The 90% confidence intervals for linear
regression were calculated using predict function in R.

SUPPLEMENTAL REFERENCES S1. Diril, M.K., Ratnacaram, C.K., Padmakumar, V.C., Du, T., Wasser, M., Coppola, V.,
Tessarollo, L., and Kaldis, P. (2012). Cyclin-dependent kinase 1 (Cdk1) is essential for cell division and suppression of DNA re-replication but not for liver regeneration. Proc Natl Acad Sci U S A 109, 3826-3831.
S2. Kivioja, T., Vaharautio, A., Karlsson, K., Bonke, M., Enge, M., Linnarsson, S., and Taipale, J. (2012). Counting absolute numbers of molecules using unique molecular identifiers. Nature methods 9, 72-74.
S3. Langmead, B., Trapnell, C., Pop, M., and Salzberg, S.L. (2009). Ultrafast and memory-efficient alignment of short DNA sequences to the human genome. Genome Biol 10, R25.
S4. Fuhrer, T., Heer, D., Begemann, B., and Zamboni, N. (2011). High-throughput, accurate mass metabolome profiling of cellular extracts by flow injection-time-of-flight mass spectrometry. Anal Chem 83, 7074-7080.
S5. Wishart, D.S., Tzur, D., Knox, C., Eisner, R., Guo, A.C., Young, N., Cheng, D., Jewell, K., Arndt, D., Sawhney, S., et al. (2007). HMDB: the Human Metabolome Database. Nucleic Acids Res 35, D521-526.
S6. Okuda, S., Yamada, T., Hamajima, M., Itoh, M., Katayama, T., Bork, P., Goto, S., and Kanehisa, M. (2008). KEGG Atlas mapping for global analysis of metabolic pathways. Nucleic Acids Res 36, W423-426.
S7. Gubelmann, C., Gattiker, A., Massouras, A., Hens, K., David, F., Decouttere, F., Rougemont, J., and Deplancke, B. (2011). GETPrime: a gene- or transcript-specific primer database for quantitative real-time PCR. Database : the journal of biological databases and curation 2011, bar040.
S8. Bjorklund, M., Taipale, M., Varjosalo, M., Saharinen, J., Lahdenpera, J., and Taipale, J. (2006). Identification of pathways regulating cell size and cell-cycle progression by RNAi. Nature 439, 1009-1013.
S9. Wisse, E., Braet, F., Duimel, H., Vreuls, C., Koek, G., Olde Damink, S.W., van den Broek, M.A., De Geest, B., Dejong, C.H., Tateno, C., et al. (2010). Fixation methods for electron microscopy of human and other liver. World journal of gastroenterology : WJG 16, 2851-2866.
S10. Stewart, J.C. (1980). Colorimetric determination of phospholipids with ammonium ferrothiocyanate. Anal Biochem 104, 10-14.
S11. Klose, C., Surma, M.A., Gerl, M.J., Meyenhofer, F., Shevchenko, A., and Simons, K. (2012). Flexibility of a eukaryotic lipidome--insights from yeast lipidomics. PLoS One 7, e35063.
Related Documents


![Research articleComposite functional module inference ... · such as the transcriptional regulation networks, protein-protein interaction networks and metabolic networks [1-10]. However,](https://static.cupdf.com/doc/110x72/5fbdbe97a290540c7879fb2c/research-articlecomposite-functional-module-inference-such-as-the-transcriptional.jpg)
