Identification of TLR inducing Th1-responsive Leishmania donovani amastigote-specific antigens Ankita Srivastava • Nisha Singh • Manish Mishra • Vinod Kumar • Jalaj K. Gour • Surabhi Bajpai • Sangram Singh • Haushila P. Pandey • Rakesh K. Singh Received: 23 June 2011 / Accepted: 5 August 2011 Ó Springer Science+Business Media, LLC. 2011 Abstract Leishmania is known to elicit Th2 response that causes leishmaniasis progression; on the other hand, Th1 cytokines restricts amastigote growth and disease pro- gression. In this study, we report the potential of two leishmanial antigens (65 and 98 kDa, in combination) which enhance strong macrophage effector functions, viz., production of respiratory burst enzymes, nitric oxide, and Th1 cytokines. The identification of antigens were done by resolving the crude soluble antigens on SDS-PAGE and eluted by reverse staining method. Further, RAW264.7 macrophages were challenged with eluted antigens, and the innate immune response was observed by detecting respi- ratory burst enzymes, nitric oxide (NOx), TNF-a, IFN-c, IL-12, toll-like receptors (TLRs) gene expression, and TLR-signaling proteins. These antigens increased the pro- duction of nicotinamide adenine dinucleotide phosphate (NADPH) oxidase, superoxide dismutase, NOx, TNF-a, IFN-c, IL-12, TLR2, and p38 mitogen-activated protein kinase. These antigens also induced human peripheral blood mononuclear cells proliferation and Th1 cytokine production. This study concludes that these antigens induce innate immune response as well as have prophylactic efficacy. Keywords Leishmaniasis Antigens Toll-like receptors Th1 cytokines Introduction Leishmaniasis is a wide spectrum of vector born disease with great epidemiological and clinical diversity. It is caused by more than 20 species of protozoan parasite that belongs to the family Kinetoplastida and genus Leishmania [1]. The annual global prevalence of all forms i.e., cuta- neous, mucocutaneous and visceral leishmaniasis is nearly 10 million and approximately 350 million people are at risk [2]. However, there is a gross under reporting of the cases from endemic regions and these figures may go up [3]. The treatment of leishmaniasis relies primarily on chemother- apy and till date no vaccine either preventive or prophy- lactic is available [4]. The entry of Leishmania parasite into host macrophages results in the onset of respiratory burst, characterized by the increased production of reactive oxygen species (ROS), like superoxide (O 2 - ) and hydrogen peroxide (H 2 O 2 ), which is required for the killing of the parasites [5, 6]. These O 2 - are generated by activities of a multi component enzyme complex i.e., nicotinamide adenine dinucleotide phosphate (NADPH)/NADH oxidase. Moreover, in later stages of infection, reactive nitrogen intermediates (RNI) viz. nitric oxide groups (NOx) are also produced by the activity of inducible nitric oxide (iNOS), which further contribute to innate immunity and parasitic elimination. However, in leishmanial infections, the microbicidal activities of macrophage are severely hampered, leading to the survival and proliferation of parasites inside the mac- rophages [7]. In addition, owing to hampered macrophage activity, the establishment of acquired immune response is very poor in leishmanial infection. In general, leishmani- asis is distinguished by mixed Th1 and Th2 response with a positive balance towards Th2 response, which is charac- terized by increased production of IL-10 as well as IL-4 A. Srivastava N. Singh M. Mishra V. Kumar J. K. Gour S. Bajpai H. P. Pandey R. K. Singh (&) Department of Biochemistry, Faculty of Science, Banaras Hindu University, Varanasi 221005, India e-mail: [email protected]; [email protected] S. Singh Department of Biochemistry, Dr. R.M.L. Avadh University, Faizabad 224001, India 123 Mol Cell Biochem DOI 10.1007/s11010-011-1029-5

Welcome message from author
This document is posted to help you gain knowledge. Please leave a comment to let me know what you think about it! Share it to your friends and learn new things together.
Transcript
Identification of TLR inducing Th1-responsive Leishmaniadonovani amastigote-specific antigens
Ankita Srivastava • Nisha Singh • Manish Mishra •
Vinod Kumar • Jalaj K. Gour • Surabhi Bajpai •
Sangram Singh • Haushila P. Pandey • Rakesh K. Singh
Received: 23 June 2011 / Accepted: 5 August 2011
� Springer Science+Business Media, LLC. 2011
Abstract Leishmania is known to elicit Th2 response that
causes leishmaniasis progression; on the other hand, Th1
cytokines restricts amastigote growth and disease pro-
gression. In this study, we report the potential of two
leishmanial antigens (65 and 98 kDa, in combination)
which enhance strong macrophage effector functions, viz.,
production of respiratory burst enzymes, nitric oxide, and
Th1 cytokines. The identification of antigens were done by
resolving the crude soluble antigens on SDS-PAGE and
eluted by reverse staining method. Further, RAW264.7
macrophages were challenged with eluted antigens, and the
innate immune response was observed by detecting respi-
ratory burst enzymes, nitric oxide (NOx), TNF-a, IFN-c,
IL-12, toll-like receptors (TLRs) gene expression, and
TLR-signaling proteins. These antigens increased the pro-
duction of nicotinamide adenine dinucleotide phosphate
(NADPH) oxidase, superoxide dismutase, NOx, TNF-a,
IFN-c, IL-12, TLR2, and p38 mitogen-activated protein
kinase. These antigens also induced human peripheral
blood mononuclear cells proliferation and Th1 cytokine
production. This study concludes that these antigens induce
innate immune response as well as have prophylactic
efficacy.
Keywords Leishmaniasis � Antigens � Toll-like
receptors � Th1 cytokines
Introduction
Leishmaniasis is a wide spectrum of vector born disease
with great epidemiological and clinical diversity. It is
caused by more than 20 species of protozoan parasite that
belongs to the family Kinetoplastida and genus Leishmania
[1]. The annual global prevalence of all forms i.e., cuta-
neous, mucocutaneous and visceral leishmaniasis is nearly
10 million and approximately 350 million people are at risk
[2]. However, there is a gross under reporting of the cases
from endemic regions and these figures may go up [3]. The
treatment of leishmaniasis relies primarily on chemother-
apy and till date no vaccine either preventive or prophy-
lactic is available [4].
The entry of Leishmania parasite into host macrophages
results in the onset of respiratory burst, characterized by
the increased production of reactive oxygen species (ROS),
like superoxide (O2-) and hydrogen peroxide (H2O2),
which is required for the killing of the parasites [5, 6].
These O2- are generated by activities of a multi component
enzyme complex i.e., nicotinamide adenine dinucleotide
phosphate (NADPH)/NADH oxidase. Moreover, in later
stages of infection, reactive nitrogen intermediates (RNI)
viz. nitric oxide groups (NOx) are also produced by the
activity of inducible nitric oxide (iNOS), which further
contribute to innate immunity and parasitic elimination.
However, in leishmanial infections, the microbicidal
activities of macrophage are severely hampered, leading to
the survival and proliferation of parasites inside the mac-
rophages [7]. In addition, owing to hampered macrophage
activity, the establishment of acquired immune response is
very poor in leishmanial infection. In general, leishmani-
asis is distinguished by mixed Th1 and Th2 response with a
positive balance towards Th2 response, which is charac-
terized by increased production of IL-10 as well as IL-4
A. Srivastava � N. Singh � M. Mishra � V. Kumar �J. K. Gour � S. Bajpai � H. P. Pandey � R. K. Singh (&)
Department of Biochemistry, Faculty of Science,
Banaras Hindu University, Varanasi 221005, India
e-mail: [email protected]; [email protected]
S. Singh
Department of Biochemistry, Dr. R.M.L. Avadh University,
Faizabad 224001, India
123
Mol Cell Biochem
DOI 10.1007/s11010-011-1029-5
[8]. It is now well established that in leishmaniasis pro-
tective immunity is achieved only when Th1 response,
characterized by increased levels of IFN-c and IL-12,
dominates over Th2 response [9]. Unfortunately, the anti-
gens that induce Th1 response in host immune cells have
not yet been fully identified.
Toll-like receptors (TLRs) are the crucial regulators of
innate immune response against the pathogens, and till
date, 11 TLRs are identified in mammals [10]. After
attachment with specific ligands, TLRs are involved in
variety of phenomenon like maturation, phagocytosis, and
microbicidal activity of phagosomes as well as production
of inflammatory cytokines such as TNF-a, IFN-c, IL-10,
IL-12, etc. [10]. TLR signaling occurs via MyD88-depen-
dent or -independent pathways that lead to the activation of
either mitogen-activated protein kinases (MAPK), viz.,
p38MAPK or extra-cellular signal related kinase (ERK-1/
2), and subsequent production of Th1 and Th2 inflamma-
tory cytokines [11, 12]. Several studies confirm the
importance of TLR signaling in the onset of leishmanial
pathogenesis, susceptibility, and resistance [13, 14].
However, leishmanial ligands that induce production of
Th1 cytokines are not fully identified. As this is now evi-
denced that TLR may regulate the Th1/2 balance, this is
absolutely essential to identify those antigens/immunogens
that affects TLR-signaling pathways. In the present study,
we have identified two leishmanial antigens that induced
the production of inflammatory cytokines via TLR signal-
ing, which may further be employed to develop the pro-
phylactic or preventive vaccine candidates.
Materials and methods
Study design
Crude soluble antigens of Leishmania donovani were pre-
pared and, based on the molecular weights, different pro-
tein fractions were eluted from the gel. The effect of
different protein fractions (Fa, Fb, Fc, and Fd) were
observed in terms of respiratory burst activity of macro-
phage, nitric oxide assay, cytokines production, and TLR
expression. Based on the cytokines and TLR expression
results, we proceeded further only with fraction Fa and its
individual proteins to find out the most antigenic protein of
this fraction. Two proteins of Fa fraction (65 and 98 kDa)
were further assessed for their macrophage effector func-
tions and PBMC proliferation capabilities.
Axenic culture and antigen preparation
The L. donovani strain Dd8 (MHOM/IN/80) was main-
tained in vitro in Dulbecco minimum essential medium
(DMEM, Invitrogen, USA) supplemented with 10% FBS
(Invitrogen, USA) and antibiotics (gentamycin 20 lg/ml,
streptomycin 100 lg/ml, penicillin 100 U/ml, Sigma
Chemicals, USA) in a BOD incubator at 25�C. Axenic am-
astigotes were also maintained in the same medium but the
medium was acidified to pH 5.5 and incubated at 37�C in
humidified CO2 incubator containing 5% CO2. The axenic
amastigotes were characterized by their round or oval shape
without flagella and presence of amastigote-specific mega-
somes under phase contrast microscopy. Biochemical char-
acterization was done by lectin agglutination test [15]. For
preparation of leishmanial antigens, about 4 9 107 para-
sites/ml were taken in a 50-ml tube and centrifuged at
3,000 rpm for 15 min at 4�C. The resulting pellets were
washed thrice with cold 0.02 M PBS (pH 7.2). Finally, pel-
lets were dissolved in minimum amount of lysis buffer
containing 20 mM Tris–HCl (pH 7.4), 40 mM NaCl, 10 mM
EDTA, 2 mM PMSF (Sigma Chemicals, USA), 5 mM
iodoacetamide (Sigma Chemicals, USA), 10 lg/ml leupep-
tin (Sigma Chemicals, USA), and 0.4% SDS. Antigens were
prepared by sonication (12 amp/10 cycle/30 s) followed by
centrifugation at 10,000 rpm for 20 min. Supernatant was
collected, and protein estimation was done by Lowry’s
method [16]. Protein samples were stored at -80�C until use.
SDS-PAGE and elution of proteins
The leishmanial proteins (40 lg/well) were subjected to
12% SDS-PAGE to resolve individual leishmanial proteins
for 3 h in cold condition [17]. To visualize protein bands,
gel was silver stained according to the standard protocol. In
brief, gel was first incubated in fixative solution (40%
methanol, 10% glacial acetic acid, and 50% Milli Q water)
for 45 min at room temperature and then incubated in 0.2%
sodium thiosulphate with sodium acetate overnight at 4�C.
Following day, gel was incubated in 0.1% silver nitrate
solution for 1 h at room temperature. Bands were devel-
oped by 3% sodium carbonate, and reaction was stopped by
50 mM EDTA. Known molecular weight marker was run
in parallel, and gel was visualized under gel documentation
system.
For recovery, leishmanial proteins were resolved on 10%
SDS-PAGE and eluted by reverse staining approach as per
the standard protocol [18]. In brief, gel was rinsed with Milli
Q water and incubated in 0.2 M imidazole solution con-
taining 0.1% SDS for 10 min. Colorless bands were devel-
oped on white background by immersing the gel in 0.2 M
zinc sulphate for 5 min. Reaction was stopped by adding
water. Different proteins fractions were prepared by cutting
the gel pieces into fractions according to their molecular
weight. A definite range of molecular weight was selected
and, accordingly, fractions were divided into four groups,
i.e., Fa (175–65 kDa), Fb (54–43 kDa), Fc (35–23 kDa), and
Mol Cell Biochem
123
Fd (21–5 kDa). Before protein recovery, the gel strips were
rinsed with 0.02 M PBS (pH 7.2) for 10 min followed by
rinsing the gel with 100 mM EDTA to complex zinc ions for
protein mobilization. Gel was further rinsed with 0.1% Tri-
ton X-100 to remove excess SDS and to re-nature proteins to
the required amount by running several gels. Proteins were
eluted from each fraction by crushing and shaking rigorously
in minimum amount of PBS, and pure proteins were recov-
ered. Protein was estimated from each fraction and stored at
-80�C until use. The individual proteins of fraction Fa was
resolved on 8% SDS-PAGE and processed for elution and
quantification as described above.
Macrophage activation assay
The RAW264.7 macrophages were obtained from National
Centre for Cell Sciences (NCCS), Pune, India and main-
tained in DMEM containing 10% heat-inactivated FBS and
antibiotics at 37�C in humidified air containing 5% CO2.
For execution of experiments, cells (1 9 106 in 1 ml of
complete medium) were seeded in 24-well tissue culture
plates (Nunc, Demark). After 2-h incubation, macrophages
monolayer was rinsed with complete media to wash non-
adherent cells, if any. Finally, cells were sensitized with
LPS (100 ng/ml), protein fractions (20 lg/ml each), and
individual proteins (10 lg/ml each). The cells were further
incubated at 37�C in humidified air containing 5% CO2 in
an incubator for 24 h for assaying enzymes and cytokines.
Estimation of respiratory burst activities
in macrophages
Estimation of NADPH oxidase and superoxide
dismutase (SOD) activity
Nicotinamide adenine dinucleotide phosphate (NADPH)
oxidase activity was estimated by the method of Mahapatra
et al. [19]. Stimulated cells were washed with fresh 0.02 M
PBS (pH 7.2) and lysed with 0.25% SDS. This suspension
was centrifuged at 2,000 rpm for 10 min, and supernatant
was taken. The enzyme activity was determined in this
supernatant by measuring cytochrome-c reduction spec-
trophotometrically. In brief, in 900 ll of the reaction
mixture (10 mM phosphate buffer saline (pH 7.2) con-
taining 1 mM MgCl2, 80 lM cytochrome c, 2 mM NaN3)
was prepared, and 100 ll of cell supernatant was added to
make the final volume to 1.0 ml. NADPH was added
finally to initiate the reaction and absorbance was measured
at 550 nm. The enzyme activity was calculated according
to the formula: Enzyme activity (U/ml) = (DA550 nm/
min) 9 final volume of assay 9 dilution factor/extinction
coefficient 9 sample volume. Millimolar extinction coef-
ficient (e = 0.021 mM-1 cm-1) was used for calculations.
SOD estimation was done by the method of Mishra and
Fridovich using NBT and riboflavin [20]. In brief, the
100 ll cell supernatant was mixed with reaction mixtures
(5 mM PBS, 100 mM methionine, 1 mM EDTA, 450 lM
NBT, 10 lM riboflavin), and purple color was developed.
Absorbance was measured at 560 nm being the maximum
for the blank. The SOD activity was directly proportional
to % inhibition of NBT reduction and expressed in %
inhibition of NBT reduction/ml (50% of NBT reduction
correspond to one unit of enzyme/ml).
Determination of total nitric oxide (NOx)
The total nitric oxide content in the culture supernatants was
estimated by the method of Ding et al. using Griess reagent
[21]. In brief, 100 ll of supernatant was mixed with freshly
prepared Griess reagent (1% sulfanilamide, and 0.1%
naphthylethylene diammine in 5% phosphoric acid). The
mixture was incubated for 15–20 min at room temperature,
and the absorbance was recorded at 540 nm on ELISA plate
reader (Bio-Rad, USA). The concentration of total nitric
oxide (NOx; lM) was determined by comparing with a
standard curve plotted using sodium nitrite as standard.
Estimation of cytokines release from macrophages
The extracellular cytokines levels for TNF-a, IL-12, and
IFN-c were detected by ELISA MAXTM standard set
enzyme-linked immunosorbent assay kit as per manufac-
turer’s instructions (BioLegend, USA) in culture superna-
tants. The results were represented in pg of cytokines/ml.
Quantification of TLR and cytokine mRNA by RT-PCR
RNA isolation and cDNA preparation
Total RNA was extracted from stimulated cells with trizol
reagent (Sigma Chemicals, USA) following manufacturer’s
instructions. In brief, cells were collected and centrifuged at
5,000 rpm at 4�C and pelleted. The supernatant was
removed, and the cells were washed with 19 PBS so that
complete media could be removed. The cells were then
lysed in 300 ll of trizol reagent and 120 ll chloroform. The
suspension was centrifuged at 10,000 rpm at 25�C for
10 min. The upper aqueous layer was recovered, and twice
amount of isopropanol was added. The mixture was cen-
trifuged again at 10,000 rpm at 4�C for 10 min, and RNA
pellets were collected. Finally, RNA pellets were washed
with 70% DEPC ethanol three times to remove the impu-
rities. Total RNA was first digested with RNase-free DNase
(Fermantas, Germany) to avoid DNA contamination before
use. For cDNA preparation, 1 lg total RNA (kept equal for
each amplification subjected for densitometric analysis)
Mol Cell Biochem
123
was subjected to reverse transcription using 20 U M-MuLV
reverse transcriptase (Fermantas, Germany), 19 RT buffer,
20 mM dNTPs (New England Biolabs, USA), 20 U RNasin
(Fermentas, Germany), 0.1 M DTT with DEPC treated
water using 200 ng of random hexamers (Fermentas,
Germany).
cDNA amplification and analysis
The cDNA was subsequently amplified by gene-specific
PCR. The 25 ll of reaction mixture consisted 2 ll cDNA
templates, 19 PCR buffer, 0.5 mM MgCl2, 200 lM
dNTPs, 1 U Taq DNA polymerase (New England Biolabs,
USA), and 3.2 lM mice mRNA-specific forward and
reverse primers for cytokines (TNF-a, IFN-c, IL-12), toll-
like receptors (TLRs 1–9), and human mRNA-specific
IFN-c, IL-12, and IL-10. All the primers used in this study
are listed in Tables 1 and 2. The b-actin gene was used as
house-keeping control gene. Amplification was performed
in a thermal cycler (Labnet, USA) programmed for 30
cycles of denaturation at 94�C for 30 s, annealing at
55–46�C depending on the Tm of the primer for 30 s, and
extension at 72�C for 30 s, which were preceded by initial
denaturation at 94�C for 2 min. Final extension was for
5 min at 72�C. For some amplification, conditions were
changed as per requirements. The amplified DNA fragments
were separated in a 2% agarose gel, with ethidium bromide
and photographed under UV illumination on a gel docu-
mentation system (Alpha Imager EP, Alpha Innotech Cor-
poration, USA). The relative mRNA expression levels were
analyzed by Image Analysis Software (Alpha ViewTm,
Version 2.0.0.9, Alpha Innotech Corporation, USA).
Western blot analysis of MyD88, TRAF6, p38,
phospho-p38, ERK1/2, and phospho-ERK1/2
The expression of MAPK-signaling proteins in response to
65 and 98 kDa antigens were analyzed by western blotting
experiments using specific antibodies (Cell Signaling
Technology, USA) as per manufacturer’s instructions. In
brief, after 30-min stimulation with 65 and 98 kDa antigens
and LPS, macrophages were washed with tris buffer saline
50 mM TBS (pH 7.5) containing 1 mM sodium ortho-
vanadate. The cells were then lysed in 50 ll of lysis
buffer (10 mM Tris–HCl, 50 mM NaCl, 50 mM NaF,
2 mM EDTA, 1 mM EGTA, 1% SDS, 1 mM sodium
Table 1 List of mouse-specific
primersS. no. Target Mouse sequences (50–30) Product size (bp)
1. TLR1 F50TCTTGTGCCACCCAACAGTCAG30 207
R50CCCATAAGCATCTCCTAACACCAG30
2. TLR2 F 50CAGTGAGCAGGATTCCCATT30 326
R50TTATCTTGCGCAGTTTGCAG30
3. TLR3 F 50ATATGCGCTTCAATCCGTTC30 310
R50AAACCAAGAATCCGATGCAC30
4. TLR4 F50AGAATGAGGACTGGGTGAG30 267
R50CAAGGACAATGAAGATGATGC30
5. TLR5 F 50TTTCCCTTTTCATCCTGTGC30 266
R50GCATAGCCTGAGCCTGTTTC30
6. TLR6 F50CTTCACAACAACAGGATAATG30 287
R50ACCACTTCTCTTGCTACC30
7. TLR7 F 50CAGAAGTCTAAGTTTCTTCAGC30 373
R50GGGAAATATTTAACTGAGCATGG30
8. TLR8 F50GTGCTTTTGTCTGCTGTCCTCTG30 276
R50TTTGGGTGCTGTTGTTTGGC30
9. TLR9 F5’TGGAGTACCTCCTGGTGTCC3’ 367
R50GAAGGACAGGTTGAGCTTGC30
10. TNF-a F50CCGATGGGTTGTACCTTGTC30 285
R50CGGACTCCGCAAAGTCTAAG30
11. IL-12 F50 TGGAGGACCCATAAGACTGC30 319
R50TTTCCCCTTCTTGGAGGTTT30
12. IFNc F50GTGATTGCGGGGTTGTATCT30 219
R50GGGACAGCCTGTTACTACCTGA30
13. bactin F50AACCGCGAGAAGATGACCCAGATCATGTTT30 350
R50AGCAGCCGTGGCCATCTCTTGCTCGAAGTC30
Mol Cell Biochem
123
orthovanadate, 1 mM PMSF, and 50 lg/ml leupeptin) for
20 min at 4�C. The lysates were centrifuged at 15,000 rpm
for 10 min, and supernatants proteins were resolved on
12% SDS-PAGE and then transferred on nitrocellulose
membrane. The membranes were blocked with non-fat dry
milk in TBS. After blocking, membranes were incubated
with primary antibodies at appropriate dilution for MyD88
(1:500), TRAF6 (1:500), phospho-p38 (1:1,000), p38
(1:1,000), phospho-ERK1/2, and ERK1/2 for 2 h at room
temperature. Blots were washed with TBST [50 mM Tris–
HCl (pH 7.5), 150 mM NaCl, and 0.05% Tween20] thrice.
Finally, membranes were incubated with HRP-linked sec-
ondary antibody (1:1,000) for 1 h at room temperature.
Blots were developed by incubating membranes in 0.03%
DAB/0.01% H2O2 solution. Color development was stop-
ped by removing the above solution and adding water.
PBMCs proliferation and cytokine analysis
Peripheral blood mononuclear cells (PBMCs) were isolated
from the heparinised blood collected from ten healthy
(authors and lab members of this study), non endemic
individuals by density gradient centrifugation using ficoll–
paque plus (GE Healthcare, USA). In brief, blood samples
were diluted 1:1 ratio with complete DMEM and layered
on an equal volume of ficoll followed by centrifugation at
5,000 rpm for 30 min. PBMCs were carefully aspirated
and washed twice with 0.02 M PBS (pH 7.2) by centrifu-
gation at 5,000 rpm at 4�C for 15–20 min. The cellular
viability was checked by trypan blue dye exclusion
method. PBMCs were cultured in DMEM along with
antibiotics in 24-well tissue culture plates (Nunc, Den-
mark) at seeding density 1 9 106 cells/well. After 2 h cells
were washed with complete DMEM to remove non-
adherent cell, if any. Cells were then sensitized with 10 lg/
ml antigens (65 and 98 kDa) and PHA (10 lg/ml) and kept
for 72 h at 37�C in humidified air containing 5% CO2 in
CO2 incubator. The cellular proliferation was checked by
MTT assay [22]. Culture supernatants were assessed for
IFN-c, IL-12, and IL-10 by cytokine ELISA, and cells were
used for RT-PCR as described above.
Statistical analysis
The data were analyzed by one way analysis of variance
(ANOVA) using Students Newman Keuls (SNK) test with
Sigma Stat 3.5, wherever required. When comparing
between two groups student t-test was applied. The P-
values less than 0.05 were considered to be significant. All
the experiments were performed in quadruplicate, and data
are represented as mean ± standard deviation.
Results
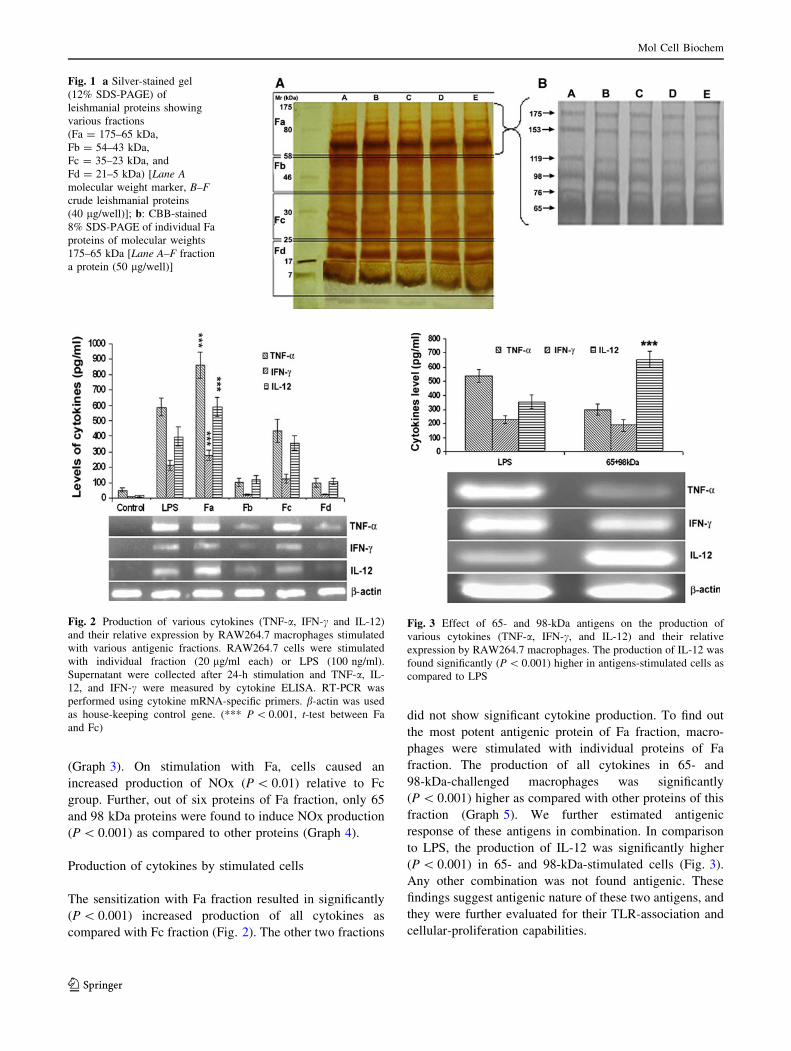
The silver staining of SDS-PAGE revealed the presence of
proteins ranging from 5 to 175 kDa (Fig. 1a). Based on the
molecular weight, proteins were divided in four fractions
viz. Fa (175–65 kDa), Fb (54–43 kDa), Fc (35–23 kDa)
and Fd (21–5 kDa). The Fa fraction showed good response
in terms of macrophage effector functions and was further
resolved on 8% SDS-PAGE to recover six proteins of
relative molecular weights 175, 153, 119, 98, 76, and
65 kDa (Fig. 1b).
NADPH oxidase and superoxide dismutase (SOD)
activities
The activities of these enzymes in protein stimulated mac-
rophages are represented in Graphs 1 and 2. LPS-stimulated
cells were considered as positive antigenic control, and cells
without stimulants were considered as normal (negative)
controls. The activity of NADPH oxidase was higher in
Fa- and Fc-stimulated cells as compared with Fb and Fd
fractions; further, activity in Fa-stimulated cells were more
significant than that in Fc (P \ 0.001). The SOD activity was
also higher in Fa- and Fc-stimulated cells and was more
significant (P \ 0.01) in Fc as compared with Fa.
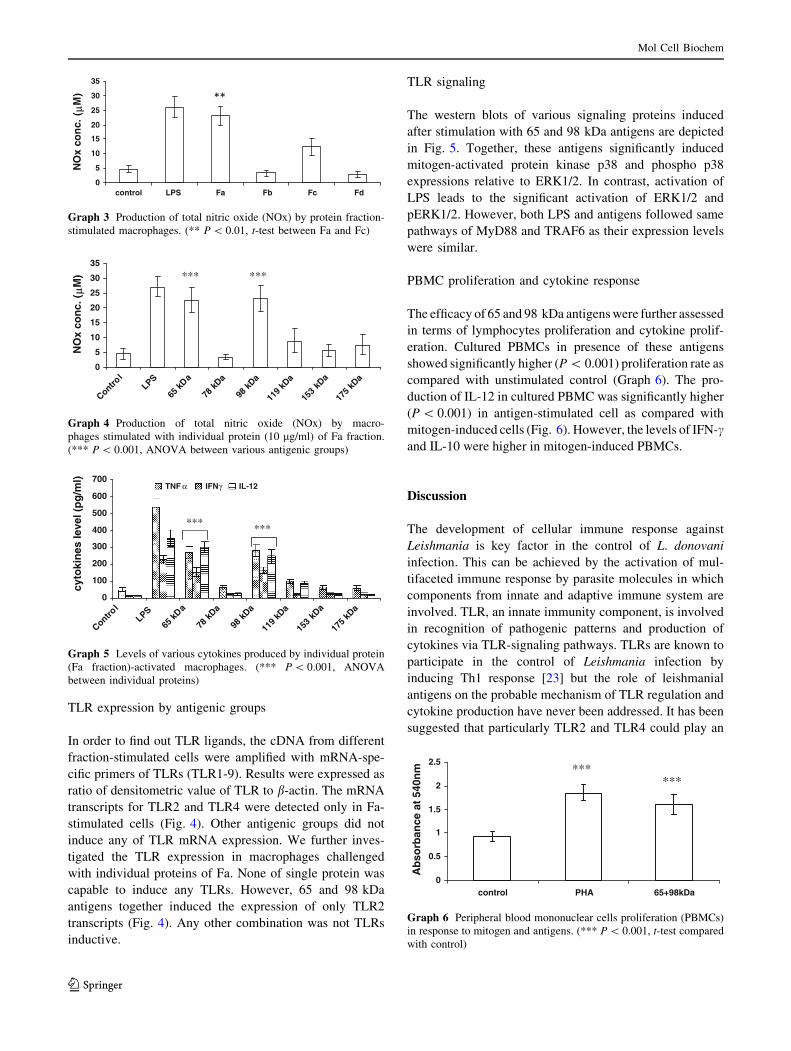
Nitric oxide production
Macrophages stimulated using protein fractions Fa and Fc
produced higher NOx levels relative to Fb and Fd
Table 2 List of human-specific
primersS. no. Target Primer sequence (50–30) Product size (bp)
1. IL-10 F50GAGGCAAGGCATTTGGATAA30 338
R50CACTGGCTGAGCAGGTCATA30
2. IL-12 F50AAGGAGGCGAGGTTCTAAGC30 283
R50TCCTTGTTGTCCCCTCTGAC30
3. IFN-c F50CCCCACTGCAAGTCTCTAGC30 320
R50CAAAGTCAACCCCAAAGGAA30
4. b-actin F50AGAAAATCTGGCACCACACC30 323
R50CTCCTTAATGTCACGCACGA30
Mol Cell Biochem
123
(Graph 3). On stimulation with Fa, cells caused an
increased production of NOx (P \ 0.01) relative to Fc
group. Further, out of six proteins of Fa fraction, only 65
and 98 kDa proteins were found to induce NOx production
(P \ 0.001) as compared to other proteins (Graph 4).
Production of cytokines by stimulated cells
The sensitization with Fa fraction resulted in significantly
(P \ 0.001) increased production of all cytokines as
compared with Fc fraction (Fig. 2). The other two fractions
did not show significant cytokine production. To find out
the most potent antigenic protein of Fa fraction, macro-
phages were stimulated with individual proteins of Fa
fraction. The production of all cytokines in 65- and
98-kDa-challenged macrophages was significantly
(P \ 0.001) higher as compared with other proteins of this
fraction (Graph 5). We further estimated antigenic
response of these antigens in combination. In comparison
to LPS, the production of IL-12 was significantly higher
(P \ 0.001) in 65- and 98-kDa-stimulated cells (Fig. 3).
Any other combination was not found antigenic. These
findings suggest antigenic nature of these two antigens, and
they were further evaluated for their TLR-association and
cellular-proliferation capabilities.
Fig. 1 a Silver-stained gel
(12% SDS-PAGE) of
leishmanial proteins showing
various fractions
(Fa = 175–65 kDa,
Fb = 54–43 kDa,
Fc = 35–23 kDa, and
Fd = 21–5 kDa) [Lane Amolecular weight marker, B–Fcrude leishmanial proteins
(40 lg/well)]; b: CBB-stained
8% SDS-PAGE of individual Fa
proteins of molecular weights
175–65 kDa [Lane A–F fraction
a protein (50 lg/well)]
Fig. 2 Production of various cytokines (TNF-a, IFN-c and IL-12)
and their relative expression by RAW264.7 macrophages stimulated
with various antigenic fractions. RAW264.7 cells were stimulated
with individual fraction (20 lg/ml each) or LPS (100 ng/ml).
Supernatant were collected after 24-h stimulation and TNF-a, IL-
12, and IFN-c were measured by cytokine ELISA. RT-PCR was
performed using cytokine mRNA-specific primers. b-actin was used
as house-keeping control gene. (*** P \ 0.001, t-test between Fa
and Fc)
Fig. 3 Effect of 65- and 98-kDa antigens on the production of
various cytokines (TNF-a, IFN-c, and IL-12) and their relative
expression by RAW264.7 macrophages. The production of IL-12 was
found significantly (P \ 0.001) higher in antigens-stimulated cells as
compared to LPS
Mol Cell Biochem
123
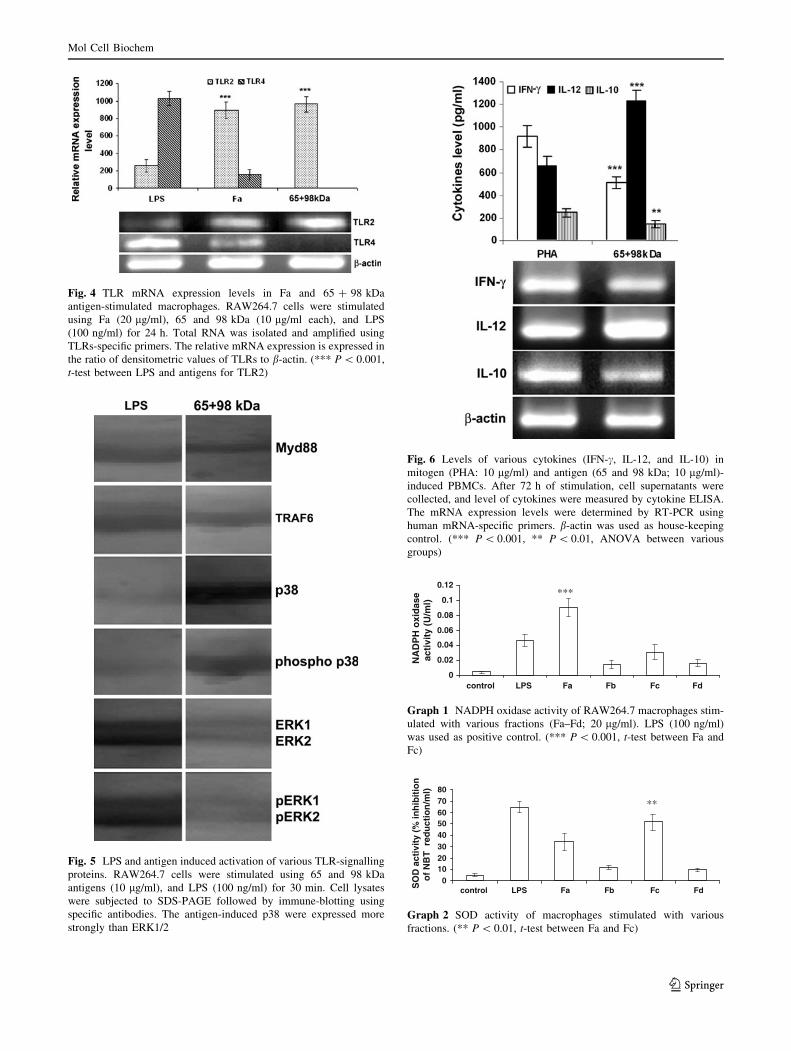
Fig. 4 TLR mRNA expression levels in Fa and 65 ? 98 kDa
antigen-stimulated macrophages. RAW264.7 cells were stimulated
using Fa (20 lg/ml), 65 and 98 kDa (10 lg/ml each), and LPS
(100 ng/ml) for 24 h. Total RNA was isolated and amplified using
TLRs-specific primers. The relative mRNA expression is expressed in
the ratio of densitometric values of TLRs to b-actin. (*** P \ 0.001,
t-test between LPS and antigens for TLR2)
Fig. 5 LPS and antigen induced activation of various TLR-signalling
proteins. RAW264.7 cells were stimulated using 65 and 98 kDa
antigens (10 lg/ml), and LPS (100 ng/ml) for 30 min. Cell lysates
were subjected to SDS-PAGE followed by immune-blotting using
specific antibodies. The antigen-induced p38 were expressed more
strongly than ERK1/2
Fig. 6 Levels of various cytokines (IFN-c, IL-12, and IL-10) in
mitogen (PHA: 10 lg/ml) and antigen (65 and 98 kDa; 10 lg/ml)-
induced PBMCs. After 72 h of stimulation, cell supernatants were
collected, and level of cytokines were measured by cytokine ELISA.
The mRNA expression levels were determined by RT-PCR using
human mRNA-specific primers. b-actin was used as house-keeping
control. (*** P \ 0.001, ** P \ 0.01, ANOVA between various
groups)
0
0.02
0.04
0.06
0.08
0.1
0.12
control LPS Fa Fb Fc Fd
NA
DP
H o
xid
ase
act
ivit
y (U
/ml)
***
Graph 1 NADPH oxidase activity of RAW264.7 macrophages stim-
ulated with various fractions (Fa–Fd; 20 lg/ml). LPS (100 ng/ml)
was used as positive control. (*** P \ 0.001, t-test between Fa and
Fc)
01020304050607080
SO
D a
ctiv
ity
(% in
hib
itio
n
of
NB
T r
edu
ctio
n/m
l)
**
control LPS Fa Fb Fc Fd
Graph 2 SOD activity of macrophages stimulated with various
fractions. (** P \ 0.01, t-test between Fa and Fc)
Mol Cell Biochem
123
TLR expression by antigenic groups
In order to find out TLR ligands, the cDNA from different
fraction-stimulated cells were amplified with mRNA-spe-
cific primers of TLRs (TLR1-9). Results were expressed as
ratio of densitometric value of TLR to b-actin. The mRNA
transcripts for TLR2 and TLR4 were detected only in Fa-
stimulated cells (Fig. 4). Other antigenic groups did not
induce any of TLR mRNA expression. We further inves-
tigated the TLR expression in macrophages challenged
with individual proteins of Fa. None of single protein was
capable to induce any TLRs. However, 65 and 98 kDa
antigens together induced the expression of only TLR2
transcripts (Fig. 4). Any other combination was not TLRs
inductive.
TLR signaling
The western blots of various signaling proteins induced
after stimulation with 65 and 98 kDa antigens are depicted
in Fig. 5. Together, these antigens significantly induced
mitogen-activated protein kinase p38 and phospho p38
expressions relative to ERK1/2. In contrast, activation of
LPS leads to the significant activation of ERK1/2 and
pERK1/2. However, both LPS and antigens followed same
pathways of MyD88 and TRAF6 as their expression levels
were similar.
PBMC proliferation and cytokine response
The efficacy of 65 and 98 kDa antigens were further assessed
in terms of lymphocytes proliferation and cytokine prolif-
eration. Cultured PBMCs in presence of these antigens
showed significantly higher (P \ 0.001) proliferation rate as
compared with unstimulated control (Graph 6). The pro-
duction of IL-12 in cultured PBMC was significantly higher
(P \ 0.001) in antigen-stimulated cell as compared with
mitogen-induced cells (Fig. 6). However, the levels of IFN-cand IL-10 were higher in mitogen-induced PBMCs.
Discussion
The development of cellular immune response against
Leishmania is key factor in the control of L. donovani
infection. This can be achieved by the activation of mul-
tifaceted immune response by parasite molecules in which
components from innate and adaptive immune system are
involved. TLR, an innate immunity component, is involved
in recognition of pathogenic patterns and production of
cytokines via TLR-signaling pathways. TLRs are known to
participate in the control of Leishmania infection by
inducing Th1 response [23] but the role of leishmanial
antigens on the probable mechanism of TLR regulation and
cytokine production have never been addressed. It has been
suggested that particularly TLR2 and TLR4 could play an
0
5
10
15
20
25
30
35N
Ox
con
c. (
μM)
control LPS Fa Fb Fc Fd
Graph 3 Production of total nitric oxide (NOx) by protein fraction-
stimulated macrophages. (** P \ 0.01, t-test between Fa and Fc)
0
5
10
15
20
25
30
35
Control
LPS
65 kD
a
78kD
a
98kD
a
119 k
Da
153 kD
a
175 k
Da
NO
x co
nc.
(μM
) *** ***
Graph 4 Production of total nitric oxide (NOx) by macro-
phages stimulated with individual protein (10 lg/ml) of Fa fraction.
(*** P \ 0.001, ANOVA between various antigenic groups)
0
100
200
300
400
500
600
700
cyto
kin
es le
vel (
pg
/ml)
TNF α IFNγ IL-12
*** ***
Control
LPS
65 kD
a
78kD
a
98kD
a
119 k
Da
153 kD
a
175 k
Da
Graph 5 Levels of various cytokines produced by individual protein
(Fa fraction)-activated macrophages. (*** P \ 0.001, ANOVA
between individual proteins)
0
0.5
1
1.5
2
2.5
control PHA 65+98kDa
Ab
sorb
ance
at
540n
m
******
Graph 6 Peripheral blood mononuclear cells proliferation (PBMCs)
in response to mitogen and antigens. (*** P \ 0.001, t-test compared
with control)
Mol Cell Biochem
123
important role by regulating the initial pro-inflammatory
response during the leishmanial infections [14, 24].
Further, in Leishmania infection, TLR-mediated mito-
gen-activated protein kinases (MAPK) signaling plays
significant role in control of infection as evidenced by
reciprocal regulation of p38 and ERK1/2, the downstream
signaling proteins. Leishmanial signals lead to either p38 or
ERK1/2 activation, or subsequent cytokines production
[25, 26]. The phosphorylation of p38 leads to the produc-
tion of IL-12, which eventually result in disease termina-
tion; and ERK1/2 signaling results in the production of IL-
10 and disease progression [27, 28]. However, these signals
are not yet identified. In this study, the western blotting
experiments revealed more expression of p38 and phospho
p38 as compared with ERK1/2 and pERK1/2. The potential
of identified antigens to elicit strong IL-12 production may
be linked to their TLR2 signaling as activation of p38
MAPK leads to production of IL-12 [27].
The innate immune response is characterized by the
phagocytosis of invading microorganism as well as huge
free radical generation, which is required to kill the path-
ogen. Further, the products of innate immune response also
facilitate the establishment of adaptive immune response to
boost immunity. In this study, the identified antigens (65
and 98 kDa) were capable of inducing macrophages in
terms of increased respiratory burst enzymes, such as
NADPH oxidase, superoxide dismutase, and elicited strong
Th1 cytokine production. The significant production of Th1
cytokine especially IL-12 by both macrophages and PBMC
confirms their antigenicity. Identification of these two
antigens is of great importance since decreased IL-12
levels in leishmanial infection play important role in dis-
ease susceptibility and resistance [27]. Leishmaniasis is
also characterized by decreased NO production [29]. These
antigens also induced production of nitric oxide by mac-
rophages though it was not very significant. However, since
IL-12 is a key player in induction of iNOS and subsequent
NO production, which is required for parasite removal, the
identified antigens having IL-12-inducing properties may
be quite useful to boost innate immunity against leish-
manial infections. These findings suggest that in spite of
less capability of NO production, these two antigens are
capable enough to elicit strong Th1 cytokines response
especially IL-12 production by macrophages via TLR2
signaling.
In addition to hampered innate immunity, leishmaniasis
is also characterized by poor proliferation of T cells
because of poor antigen recognition and presentation to T
cells [30, 31]. These antigens together showed significant
proliferative abilities for human PBMCs, which support
their potential as a strong adaptive immunity inducer. In
addition, the production of IFN-c and IL-12 was also sig-
nificant relative to IL-10, which further proves their
potential as future prophylactic or preventive candidate for
prevention of leishmanial infection. However, further
studies are required to characterize the epitopic groups of
these two antigens as well as their prophylactic
capabilities.
Acknowledgments Financial assistance received from the Depart-
ment of Science and Technology (SR/FT/LS/066/2007), and the
Department of Biotechnology—DBT (BT/PR11177/MED/29/99/
2008), New Delhi, India is gratefully acknowledged. AS and NS are
highly thankful to the DBT, New Delhi for senior research fellowship.
Conflict of interest None.
References
1. Mishra BB, Singh RK, Srivastava A, Tripathi VJ, Tiwari VK
(2009) Fighting against leishmaniasis: search of alkaloids as
future true potential anti-leishmanial agents. Mini Rev Med
Chem 9:107–123
2. Desjeux P (2004) Leishmaniasis: current situation and new per-
spectives. Comp Immunol Microbiol Infect Dis 27:305–318
3. Singh SP, Reddy DC, Rai M, Sundar S (2006) Serious underre-
porting of visceral leishmaniasis through passive case reporting in
Bihar, India. Trop Med Int Health 11:899–905
4. Singh RK, Pandey HP, Sundar S (2006) Visceral leishmaniasis
(kala-azar): challenges ahead. Indian J Med Res 123:331–344
5. Kumar P, Pai K, Pandey HP, Sundar S (2002) NADH-oxidase,
NADPH-oxidase and myeloperoxidase activity of visceral leish-
maniasis patients. J Med Microbiol 51:832–836
6. Singh VK, Balaraman S, Tewary P, Madhubala R (2004) Leish-mania donovani activates nuclear transcription factor-kappaB in
macrophages through reactive oxygen intermediates. Biochem
Biophys Res Commun 322:1086–1095
7. Olivier M, Gregory DJ, Forget G (2005) Subversion mechanisms
by which Leishmania parasites can escape the host immune
response: a signaling point of view. Clin Microbiol Rev
18:293–305
8. Bacellar O, D’Oliveira A Jr, Jeronimo S, Carvalho EM (2000) IL-
10 and IL-12 are the main regulatory cytokines in visceral
leishmaniasis. Cytokine 12:1228–1231
9. Ghalib HW, Whittle JA, Kubin M, Hashim FA, el-Hassan AM,
Grabstein KH, Trinchieri G, Reed SG (1995) IL-12 enhances
Th1-type responses in human Leishmania donovani infections.
J Immunol 154:4623–4629
10. Akira S (2003) Toll like receptor signalling. J Biol Chem
278:38105–38108
11. Ghosh S, Bhattacharyya S, Sirkar M, Sa GS, Das T, Majumdar D,
Roy S, Majumdar S (2002) Leishmania donovani suppresses
activated protein 1 and NF-kappaB activation in host macro-
phages via ceramide generation: involvement of extracellular
signal-regulated kinase. Infect Immun 70:6828–6838
12. Kawai T, Akira S (2007) TLR signaling. Semin Immunol
19:24–32
13. de Veer MJ, Curtis JM, Baldwin TM, Di Donato JA, Sexton A,
McConville MJ, Handman E, Schofield L (2003) MyD88 is
essential for clearance of Leishmania major: possible role for
lipophosphoglycan and Toll-like receptor 2 signaling. Eur J
Immunol 33:2822–2831
14. Flandin JF, Chano F, Descoteaux A (2006) RNA interference
reveals a role for TLR2 and TLR3 in the recognition of Leish-mania donovani promastigotes by interferon-gamma-primed
macrophages. Eur J Immunol 36:411–420
Mol Cell Biochem
123
15. Balanco JMF, Pral EMF, Da Silva S, Bijovsky AT, Mortara RA,
Alfieri SC (1998) Axenic cultivation and partial characterization
of Leishmania brazilensis amastigote like stages. Parasitology
116:103–113
16. Lowry OH, Rosebrough NJ, Farr AL, Randal RJ (1951) Protein
measurement with folin-phenol reagent. J Biol Chem 193:265–
275
17. Laemmli UK (1970) Cleavage of structural proteins during the
assembly of the head of bacteriophage T4. Nature 227:680–685
18. Castellanos-Serra LR, Fernandez-Patron C, Hardy E, Santana H,
Huerta V (1997) High yield elution of proteins from sodium
dodecyl sulfate-polyacrylamide gels at the low-picomole level
application to N-terminal sequencing of a scarce protein and to
in-solution biological activity analysis of on-gel renatured pro-
teins. J Protein Chem 16:415–419
19. Mahapatra SK, Chakraborty SP, Roy S (2010) In Vitro time
dependent nicotine-induced free radical generation and status of
glutathione cycle in murine peritoneal macrophage. Al Ameen J
Med Sci 3:182–194
20. Misra HP, Fridovich I (1972) The role of superoxide anion in the
autoxidation of epinephrine and a simple assay for superoxide
dismutase. J Biol Chem 247:3170–3175
21. Ding AH, Nathan CF, Stuehr DJ (1988) Release of reactive
nitrogen intermediates and reactive oxygen intermediates from
mouse peritoneal macrophages. Comparison of activating cyto-
kines and evidence for independent production. J Immunol
141:2407–2412
22. Mosmann TR, Coffman RL (1989) Th1 and Th2 cells: different
patterns of lymphokine secretion lead to different functional
properties. Annu Rev Immunol 7:145–173
23. Abou Fakher FH, Rachinel N, Klimczak M, Louis J, Doyen N
(2009) TLR9-dependent activation of dendritic cells by DNA
from Leishmania major favors Th1 cell development and the
resolution of lesions. J Immunol 182:1386–1396
24. Kropf P, Freudenberg MA, Modolell M, Price HP, Herath S,
Antoniazi S, Galanos C, Smith DF, Muller I (2004) Toll-like
receptor 4 contributes to efficient control of infection with the
protozoan parasite Leishmania major. Infect Immun 72:1920–
1928
25. Ben-Othman R, Dellagi K, Guizani-Tabbane L (2009) Leish-mania major parasites induced macrophage tolerance: implica-
tion of MAPK and NF-kappaB pathways. Mol Immunol
46:3438–3444
26. Ben-Othman R, Guizani-Tabbane L, Dellagi K (2008) Leishmaniainitially activates but subsequently down-regulates intracellular
mitogen-activated protein kinases and nuclear factor-kappaB
signaling in macrophages. Mol Immunol 45:3222–3229
27. Mathur RK, Awasthi A, Wadhone P, Ramanamurthy B, Saha B
(2004) Reciprocal CD40 signals through p38MAPK and ERK-1/2
induce counteracting immune responses. Nat Med 10:540–544
28. Murphy ML, Wille U, Villegas EN, Hunter CA, Farrell JP (2001)
IL-10 mediates susceptibility to Leishmania donovani infection.
Eur J Immunol 31:2848–2856
29. Kumar R, Pai K, Sundar S (2001) Reactive oxygen intermediates,
nitrite and IFN-gamma in Indian visceral leishmaniasis. Clin Exp
Immunol 124:262–265
30. Ghalib HW, Piuvezam MR, Skeiky YA W, Siddig M, Hasim FA,
El-Hassan AM, Russo DM, Reed SG (1993) Interleukin 10 pro-
duction correlates with pathology in human Leishmania donovaniinfections. J Clin Invest 92:324–329
31. Sacks DL, Lal SL, Shrivastava SN, Blackwell J, Neva FA (1987)
An analysis of T cell responsiveness in Indian kala-azar.
J Immunol 138:908–913
Mol Cell Biochem
123
Related Documents