Identification of target proteins of furan reactive metabolites in rat liver Dissertation Zur Erlangung des naturwissenschaftlichen Doktorgrades der Bayerischen Julius‐Maximilians‐Universität Würzburg vorgelegt von Sabrina Moro aus Elsenfeld Würzburg 2011

Welcome message from author
This document is posted to help you gain knowledge. Please leave a comment to let me know what you think about it! Share it to your friends and learn new things together.
Transcript

Identification of target proteins of furan reactive metabolites in rat
liver
Dissertation
Zur Erlangung des naturwissenschaftlichen Doktorgrades
der Bayerischen Julius‐Maximilians‐Universität Würzburg
vorgelegt von
Sabrina Moro
aus Elsenfeld
Würzburg 2011


Eingereicht am ………………………………………………………………….
bei der Fakultät für Chemie und Pharmazie
1. Gutachter ………………………………………………………………….
2. Gutachter ………………………………………………………………….
der Dissertation
1. Prüfer ………………………………………………………………….
2. Prüfer ………………………………………………………………….
3. Prüfer ………………………………………………………………….
des öffentlichen Promotionskolloquiums
Datum des öffentlichen Promotionskolloquiums
……………………………………………………………………
Doktorurkunde ausgehändigt am
……………………………………………………………………


Für Mama, Papa und Marco


"Wir glauben, Erfahrungen zu machen,
aber die Erfahrungen machen uns."
(Eugène Ionesco)


TABLE OF CONTENTS I
TABLE OF CONTENTS
Table of contents ................................................................................................... I
Abbreviations ...................................................................................................... V
1 Introduction ..................................................................................................... 1
2 State of knowledge on furan ............................................................................ 3
2.1 Structure and occurrence of furan ................................................................... 3
2.1.1 Properties of furan ................................................................................ 3
2.1.2 Formation of furan in food ................................................................... 3
2.1.3 Furan content in food and human exposure ........................................ 5
2.2 Toxicology of furan ........................................................................................... 7
2.2.1 Toxicokinetics of furan .......................................................................... 7
2.2.2 Acute and subchronic toxicity of furan ............................................... 11
2.2.3 Chronic toxicity and carcinogenicity of furan ..................................... 12
2.2.4 Mechanisms contributing to furan carcinogenicity ............................ 14
2.2.4.1 Genotoxicity of furan ..................................................................... 15
2.2.4.2 Non-genotoxic mechanisms of furan toxicity and
carcinogenicity ............................................................................... 16
3 Role of protein binding and methods for the identification of target
proteins ......................................................................................................... 18
3.1 Covalent protein binding and cytotoxicity ..................................................... 18
3.2 Methods for the identification of target proteins .......................................... 18
4 Aims of this work ........................................................................................... 21
5 Materials ....................................................................................................... 23
5.1 Equipment ....................................................................................................... 23
5.2 Chemicals and reagents .................................................................................. 24
5.3 Kits ............................................................................................................. 26
5.4 Software .......................................................................................................... 26
6 Identification of furan target proteins by protein mass spectrometry ............. 27
6.1 Introduction .................................................................................................... 27
6.2 Methods .......................................................................................................... 29
6.2.1 Housing and treatment of animals ..................................................... 29
6.2.2 Extraction of proteins from liver and kidney tissue for
determination of covalent protein binding and identification
of furan target proteins ...................................................................... 30
6.2.3 Protein quantification ......................................................................... 31
6.2.4 Liquid scintillation counting of protein extracts ................................. 33

II TABLE OF CONTENTS
6.2.5 Subcellular fractionation of the liver proteome ................................. 34
6.2.6 Two-dimensional gel electrophoresis (2D-GE) ................................... 38
6.2.6.1 Principle of two-dimensional electrophoresis ............................... 38
6.2.6.2 The first dimension of 2D-GE ......................................................... 40
6.2.6.3 Equilibration of IPG strips .............................................................. 42
6.2.6.4 The second dimension of 2D-GE .................................................... 42
6.2.6.5 Coomassie Blue staining of 2D-gels ............................................... 43
6.2.7 Fluorography for the detection of radiolabeled protein spots .......... 43
6.2.8 Spot selection and spot picking for protein identification ................. 45
6.2.9 In-gel tryptic digest of proteins........................................................... 45
6.2.10 Mass spectrometry ............................................................................. 47
6.2.10.1 Electrospray ionization (ESI) ........................................................... 47
6.2.10.2 QTOF mass spectrometry ............................................................... 48
6.2.10.3 Peptide analysis using the Q-TOF Ultima Global mass
spectrometer .................................................................................. 49
6.2.10.4 FT-ICR mass spectrometry.............................................................. 50
6.2.10.5 Peptide analysis using the LTQ FT Ultra mass
spectrometer .................................................................................. 52
6.2.10.6 Protein identification with the Mascot search engine................... 53
6.2.11 Autoradiographic analysis of furan distribution in rat liver
after oral administration ..................................................................... 58
6.3 Results and discussion .................................................................................... 58
6.3.1 Determination of covalent binding of furan to proteins .................... 58
6.3.2 Identification of target proteins of reactive furan metabolites ......... 59
6.3.3 Protein adducts in rat liver following administration of furan
at lower dose ...................................................................................... 71
6.3.4 Protein binding in the non-target organ kidney ................................. 72
6.3.5 Furan distribution in rat liver after oral administration of
[3,4-14C]-furan ..................................................................................... 74
6.4 Conclusions ..................................................................................................... 76
7 Cellular and functional consequences of furan protein binding in rat
liver ............................................................................................................... 77
7.1 Introduction .................................................................................................... 77
7.2 Methods .......................................................................................................... 79
7.2.1 Housing and treatment of animals ..................................................... 79
7.2.2 Analysis of clinical chemistry parameters for the assessment
of furan hepatotoxicity ....................................................................... 80
7.2.3 Analysis of protein expression ............................................................ 80
7.2.3.1 Subcellular fractionation and protein quantification .................... 80
7.2.3.2 Two-dimensional gel electrophoresis ............................................ 80

TABLE OF CONTENTS III
7.2.3.3 Silver staining of protein gels ......................................................... 81
7.2.3.4 Protein expression analysis ............................................................ 82
7.2.4 Effect of furan treatment on the unfolded protein response ............ 82
7.2.4.1 Samples used for analysis of the unfolded protein
response ......................................................................................... 82
7.2.4.2 Isolation of RNA from liver tissue using the RNeasy® Mini
Kit ................................................................................................... 83
7.2.4.3 cDNA synthesis using the VersoTM cDNA Kit .................................. 84
7.2.4.4 Detection of XBP1 (X-box binding protein 1) mRNA
splicing ............................................................................................ 85
7.2.4.5 Quantitative gene expression analysis of unfolded protein
response target genes using TaqMan® probes .............................. 88
7.3 Results ............................................................................................................. 91
7.3.1 Effect of furan on body and organ weights ........................................ 91
7.3.2 Effect of furan on clinical chemistry parameters ............................... 92
7.3.3 Histopathological alterations after furan treatment .......................... 93
7.3.4 Alterations in protein expression after furan treatment .................... 95
7.3.5 Impact of furan treatment on activation of the unfolded
protein response ................................................................................. 95
7.4 Discussion ....................................................................................................... 96
7.5 Conclusions ..................................................................................................... 98
8 Pathway analysis and biological interpretation of furan target proteins ........ 100
8.1 Introduction .................................................................................................. 100
8.2 Methods ........................................................................................................ 100
8.2.1 Pathway mapping to identify significantly enriched pathways ........ 100
8.2.2 Literature search ............................................................................... 101
8.2.3 Semiquantitative analysis to estimate the degree of protein
adduction .......................................................................................... 102
8.3 Results and discussion .................................................................................. 102
8.3.1 Significantly enriched pathways identified by pathway
mapping ............................................................................................ 102
8.3.2 Adduction of proteins involved in glucose and fatty acid
metabolism suggests impaired energy production as a
mechanism of furan toxicity ............................................................. 105
8.3.3 Potential link between furan toxicity and impaired function
of individual target proteins ............................................................. 111
8.3.3.1 Proteins involved in transport processes across the
mitochondrial membranes ........................................................... 111
8.3.3.2 Proteins involved in redox regulation .......................................... 113
8.3.3.3 Proteins involved in protein folding and proteolysis ................... 116

IV TABLE OF CONTENTS
8.3.3.4 Proteins involved in the urea cycle .............................................. 118
8.3.3.5 Proteins involved in the metabolism of sulfur-containing
amino acids .................................................................................. 119
8.3.3.6 Structural proteins ....................................................................... 122
8.3.3.7 Transport proteins........................................................................ 126
8.3.3.8 Proteins involved in the metabolism of nucleotides and
nucleic acids ................................................................................. 127
8.3.3.9 Intracellular transport of bile acids .............................................. 128
8.3.3.10 Miscellaneous ............................................................................... 130
8.3.4 Estimation of the degree of protein adduction ................................ 134
8.4 Conclusions ................................................................................................... 136
9 Final conclusions and future perspectives ..................................................... 138
10 Summary ..................................................................................................... 146
11 Zusammenfassung ....................................................................................... 149
12 References ................................................................................................... 152
13 Annex .......................................................................................................... 165
13.1 Comparison between theoretical and experimentally
determined molecular masses (Mr) and isoelectric points (pI)
of target proteins .............................................................................. 165
13.2 Amino acid sequences of the identified proteins ............................. 169
13.2.1 Carbohydrate metabolism ................................................................ 169
13.2.2 Lipid metabolism ............................................................................... 173
13.2.3 Amino acid metabolism, urea cycle .................................................. 176
13.2.4 Redox regulation ............................................................................... 180
13.2.5 Protein folding ................................................................................... 182
13.2.6 Proteolysis ......................................................................................... 185
13.2.7 Structural proteins ............................................................................ 187
13.2.8 Transport proteins ............................................................................. 191
13.2.9 Nucleotide metabolism ..................................................................... 193
13.2.10 Miscellaneous ............................................................................... 195
13.3 Summary of protein cysteine and lysine contents ........................... 201
13.4 Possible additional target proteins of furan ..................................... 204
13.5 Densitometry data ............................................................................ 206
14 Publications ................................................................................................. 208
14.1 Presentations at international meetings .......................................... 208
14.2 Publications ....................................................................................... 209
15 Acknowledgements ...................................................................................... 210

ABBREVIATIONS V
ABBREVIATIONS
2D-GE two-dimensional gel electrophoresis 3α-HSD 3α-hydroxysteroid dehydrogenase 4-HNE 4-hydroxy-2-nonenal 4-ONE 4-oxo-2-nonenal 8-oxo-dG 8-oxo-7,8-dihydro-2´-deoxyguanosine AAT α1-antiproteinase ALAD δ-aminolevulinic acid dehydratase ALDH-2 mitochondrial aldehyde dehydrogenase ATF-6 activating transcription factor-6 ATP adenosine triphosphate BDA cis-2-butene-1,4-dial BHMT1 betaine-homocysteine S-methyltransferase 1 bp base pairs BSA bovine serum albumin bw body weight cDNA complementary deoxyribonucleic acid CEB cytosol extraction buffer CHAPS 3-[(3-cholamidopropyl)dimethylammonio]-1-propanesulfonate CHO cells chinese hamster ovary cells CID collision-induced dissociation Ck cytoskeleton CK-8 cytokeratin 8 CM cell membrane CoA coenzyme A COPII coat protein complex II Cp cytoplasm Cs cytosol Ct threshold cycle CYP cytochrome P450 cys cysteine d days dAdo 2'-deoxyadenosine DAVID Database for Annotation, Visualization and Integrated Discovery DBP vitamin D binding protein dCyd 2'-deoxycytidine DEPC diethylpyrocarbonate (diethyldicarbonate) dGuo 2'-deoxyguanosine DNA deoxyribonucleic acid dNTP deoxyribonucleoside triphosphate dpm disintegrations per minute dRib 2-deoxyribose DTT 1,4-dithiothreitol EBP50 ezrin-radixin-moesin-binding phosphoprotein 50 EDTA ethylenediaminetetraacetic acid EFSA European Food Safety Authority

VI ABBREVIATIONS
ER endoplasmic reticulum ERAD endoplasmic reticulum-associated degradation ES extracellular space ESI electrospray ionization ESI-MS electrospray ionization-mass spectrometry EtBr ethidium bromide EU European Union FAD flavin adenine dinucleotide FAM 6-carboxyfluorescein FDA U.S. Food and Drug Administration FGG fibrinogen γ chain FTCD formimidoyltransferase-cyclodeaminase FT-ICR fourier transform ion cyclotron resonance fw forward GAPDH glyceraldehyde-3-phosphate dehydrogenase GGT γ-glutamyltransferase GO Gene Ontology GPDH-C cytosolic glycerol-3-phosphate dehydrogenase GRP78 78 kDa glucose-regulated protein GSH glutathione GST glutathione S-transferase h hours H&E hematoxylin and eosin HDL high density lipoprotein Herpud1 = HERP homocysteine-inducible, endoplasmic reticulum stress- inducible, ubiquitin-like domain member 1 his histidine hnrnp H1 heterogeneous nuclear ribonucleoprotein H1 HPLC high performance liquid chromatography IAA iodoacetamide IARC International Agency for Research on Cancer IEF isoelectric focusing IPG immobiline pH gradient IRE1 inositol-requiring protein-1 KEGG Kyoto Encyclopedia of Genes and Genomes LC liquid chromatography LCFA long chain fatty acid LD50 median lethal dose L-FABP liver fatty acid binding protein LOD limit of detection LOQ limit of quantification LSC liquid scintillation counting lys lysine MALDI-TOF matrix-assisted laser desorption/ionization time of flight MAP kinase mitogen-activated protein kinase MAT1 S-adenosylmethionine synthetase isoform type-1 MDH1 cytosolic malate dehydrogenase MEB membrane extraction buffer

ABBREVIATIONS VII
MGB dihydrocyclopyrroloindole tripeptide minor groove binder min minutes Mito mitochondrion Mr molecular mass mRNA messenger ribonucleic acid Ms microsome MS mass spectrometry MS/MS tandem mass spectrometry MST 3-mercaptopyruvate sulfurtransferase N-AcCys N-acetylcysteine N-AcLys N-acetyllysine NAD+ nicotinamide adenine dinucleotide NDRG2 N-myc downstream-regulated gene 2 NEB nuclear extraction buffer NFQ nonfluorescent quencher NHERF3 Na+/H+ exchanger regulatory factor 3 NL non-linear NPC nuclear pore complex NRK cells normal rat kidney cells NTP National Toxicology Program Nu nucleus oatp organic anion transporting polypeptide PBS phosphate buffered saline PCR polymerase chain reaction PDI protein disulfide isomerase PERK protein kinase RNA-like ER kinase pI isoelectric point PIC protease inhibitor cocktail p.o. per os ppa1 protein inorganic pyrophosphatase 1 PUFA polyunsaturated fatty acid Px peroxisome QTOF quadrupole time of flight rAFAR2-2 aflatoxin B1 aldehyde reductase member 2 RNA ribonucleic acid rpm rounds per minute RT reverse transcriptase RT-PCR real-time polymerase chain reaction rv reverse SAM S-adenosylmethionine SCE sister chromatid exchange SD standard deviation SDS sodium dodecyl sulfate SDS-PAGE sodium dodecyl sulfate- polyacrylamide gel electrophoresis sec secreted SEC13l protein SEC13 homolog serpin serine protease inhibitor SILAC stable isotope labeling by amino acids in cell culture

VIII ABBREVIATIONS
SO sulfite oxidase TAE tris-acetate-EDTA TCA trichloroacetic acid TOF time of flight Tris tris(hydroxymethyl)aminomethane Trx thioredoxin Txl-1 thioredoxin-like protein 1 ufd1 ubiquitin fusion degradation protein 1 UDS unscheduled DNA synthesis UPR unfolded protein response VDAC1 voltage-dependent anion-selective channel protein 1 XBP1 X-box binding protein 1

INTRODUCTION 1
1 INTRODUCTION
In 2004, the U.S. Food and Drug Administration (FDA) published results from studies
identifying the chemical furan in a variety of food items that undergo heat treatment.
Furan, originally known as an industrial chemical, is known to be a potent hepatotoxin
and liver carcinogen in rodents. In a 2-year bioassay, chronic furan administration to rats
caused hepatocellular adenomas and carcinomas (NTP, 1993). In addition, high incidences
of cholangiocarcinomas were observed even at the lowest furan dose tested (2.0 mg/kg
bw) (NTP, 1993). Although data on human intake of furan are limited, it appears that
there is a relatively narrow margin between human exposure and doses which cause liver
tumors in rodents, suggesting that the presence of furan in food may present a potential
risk to human health. However, the currently available data on furan toxicity is
insufficient to perform a risk assessment and more research regarding the mechanism of
furan carcinogenicity is needed (EFSA, 2004).
Hepatotoxic effects of furan are thought to be mediated by bioactivation. Furan is
oxidized by cytochrome P450 to yield a chemically reactive -unsaturated dialdehyde,
cis-2-butene-1,4-dial, which has been identified as the key cytotoxic metabolite of furan
(Chen et al., 1995; Peterson et al., 2000). In vitro studies demonstrate that cis-2-butene-
1,4-dial covalently modifies nucleosides (Byrns et al., 2002; Byrns et al., 2004) and amino
acid residues (Chen et al., 1997) (Fig. 1), suggesting that both genotoxicity (via formation
of DNA adducts) and chronic cytotoxicity mediated through binding of cis-2-butene-1,4-
dial to critical target proteins may contribute to the mechanism of tumor formation by
furan. While the important question as to whether or not furan forms DNA adducts in
vivo has not been fully resolved, support for a role of cytotoxic/non-genotoxic
mechanism(s) in furan toxicity/carcinogenicity has come from in vivo studies
demonstrating that i) 80 % of the radioactivity present in livers of rats administered 14C-
labeled furan is associated with proteins (Burka et al., 1991), ii) degraded protein adducts
are major urinary metabolites of furan (Lu et al., 2009), and iii) increased cell proliferation
secondary to furan induced hepatocyte necrosis is a critical event in furan carcinogenicity
(Wilson et al., 1992).

2 INTRODUCTION
Based on these studies, it appears that inactivation of protein function through covalent
binding may present a key event in the toxicity of furan. However, it has long been
recognized that the formation of adducts at some proteins may be critical to injury,
whereas covalent binding to others is not (Zhou et al., 2005). For a comprehensive
understanding of the molecular events involved in furan toxicity, identification of target
proteins of reactive furan intermediates, which may play a causal role in the pathogenesis
of furan-associated liver toxicity, and characterization of the cellular and functional
consequences of protein adduct formation are needed.
Figure 1 Reaction products of nucleophilic additions to the furan metabolite cis-2-butene-1,4-dial exemplified for 2'-deoxycytidine (dCyd), 2'-deoxyguanosine (dGuo), 2'-deoxyadenosine (dAdo), N-acetyllysine (N-AcLys), and N-acetylcysteine (N-AcCys) (modified from Chen et al. 1997 and Byrns et al. 2002). CYP2E1 = cytochrome P 450 2E1, dRib = 2-deoxyribose

STATE OF KNOWLEDGE ON FURAN 3
2 STATE OF KNOWLEDGE ON FURAN
2.1 Structure and occurrence of furan
2.1.1 Properties of furan
Furan is a heterocyclic and aromatic organic compound. It is a colorless, inflammable, and
volatile liquid with a boiling point of 31.4 °C. It is insoluble in water, but soluble in alcohol,
acetone, benzene, and ether (IARC, 1995). It is used in various industrial processes, e.g.
the manufacturing of lacquers and resins and the production of pharmaceuticals and
agricultural chemicals (insecticides) (IARC, 1995). Furan also occurs in the environment as
a constituent of cigarette smoke, wood smoke and exhaust gas from diesel and gasoline
engines (IARC, 1995). Furthermore, furan was shown to occur in a variety of food items
that undergo heating processes (see 2.1.3) (EFSA, 2004).
2.1.2 Formation of furan in food
Furan in food can be formed through a variety of pathways. The most important
precursors appear to be ascorbic acid, sugars, amino acids, and unsaturated fatty acids
(Fig. 2) (Crews and Castle, 2007). Experiments with single compounds or mixtures of
different substances at high temperatures showed that the most efficient precursor for
the formation of furan was ascorbic acid, followed by dehydroascorbic acid,
glycolaldehyde/alanine, and erythrose (Perez Locas and Yaylayan, 2004). It was also
observed that furan formation is strongly influenced by the reaction conditions
(temperature, time, pH) (EFSA, 2009a; Fan et al., 2008).
In contrast to model reactions using only one or two educts, food items usually consist of
more complex mixtures, in which several competing reactions may influence each other.
Therefore, it is hypothesized that furan formation in foods is much lower than observed
in reaction models (Limacher et al., 2007). Nevertheless, labeling experiments using
reaction models have provided important insight as to how furan may be formed during
heating processes (Fig. 2).

4 STATE OF KNOWLEDGE ON FURAN
Figure 2 Summary of potential routes of furan formation from different components present in food (modified from Perez Locas and Yaylayan 2004); PUFAs = polyunsaturated fatty acids
Mechanisms of furan formation from polyunsaturated fatty acids
The formation of furan from polyunsaturated fatty acids (PUFAs) was suggested to start
with the oxidative degradation of PUFAs to form lipid peroxides and hydroperoxides
either by lipoxygenases or by reactive oxygen species. In further steps, the lipid
hydroperoxides are transformed into 2-alkenals, 4-oxo-alkenals, and 4-hydroxy-2-
alkenals, e.g. 4-hydroxy-2-butenal which can form furan through cyclization and
dehydration (Fig. 2) (Perez Locas and Yaylayan, 2004).

STATE OF KNOWLEDGE ON FURAN 5
Mechanism of furan formation through degradation of amino acids
The mechanism of furan formation from amino acids involves the two key molecules
acetaldehyde and glycolaldehyde (Perez Locas and Yaylayan, 2004). Both aldehydes occur
as important intermediates in the degradation of amino acids and are able to undergo
aldol addition, thereby forming aldotetrose, which can then further react to yield furan
(Fig. 2) (Perez Locas and Yaylayan, 2004).
The degradation of the amino acids serine and cysteine can generate both acetaldehyde
and glycolaldehyde, whereas aspartic acid, alanine, and threonine can only yield
acetaldehyde and thus need reducing sugars for the production of glycolaldehyde (Perez
Locas and Yaylayan, 2004). This is consistent with findings that heating of serine or
cysteine leads to small amounts of furan, whereas heating of aspartic acid, alanine, and
threonine alone did not result in detectable furan formation (Perez Locas and Yaylayan,
2004). However, when glucose (a source of glycolaldehyde) was added to the single
amino acids and the mixtures were heated, furan formation occurred and heating of
glycolaldehyde and alanine resulted in high amounts of furan (Perez Locas and Yaylayan,
2004).
Mechanism of furan formation through degradation of carbohydrates and ascorbic acid
The formation of furan through degradation of sugars mostly involves formation of the
reactive intermediates 1-deoxyosone and 3-deoxyosone, which further react to an
aldotetrose derivative, such as aldotetrose itself, 2-deoxyaldotetrose, and 2-deoxy-3-
ketoaldotetrose (Fig. 2). These molecules occur during degradation of hexoses, pentoses,
and tetroses. Aldotetrose derivatives as intermediates are also involved in the formation
of furan from the degradation of ascorbic acid and dehydroascorbic acid.
2.1.3 Furan content in food and human exposure
Furan occurs in a variety of food items (Tab. 1). By far the highest furan contents are
found in ground roasted coffee and instant coffee. Moreover, maximal furan contents of
more than 100 μg furan/kg food were found in baby food, soups, meat products, cereal
products, sauces and fruit juices. For most food groups, the measured levels of furan vary
over a wide range.

6 STATE OF KNOWLEDGE ON FURAN
Table 1 Furan content in food per category as reported by the EFSA (EFSA, 2009b). LOQ = limit of quantification, LOD = limit of detection
Food group Total
number of samples
Number of samples > LOQ
Number of samples
≤ LOD
Number of samples ≤ LOQ
Range of furan content
[µg furan/kg food]
Mean furan content
[µg furan/kg food]
Roasted coffee (ground)
66 50 0 16 5 - 5749 1114
Instant coffee 48 41 0 7 8 - 2200 589
Baby food 985 778 59 148 0.03 - 215 25
Soups 198 158 15 25 0.7 - 225 24
Meat products 65 36 15 14 2 - 115 22
Infant formulas 35 27 3 5 2 - 56 19
Milk products 20 14 0 6 1 - 80 15
Cereal products 99 37 44 18 0.2 - 168 14
Sauces 207 10 19 88 0.1 - 120 12
Vegetables 95 28 7 60 1 - 74 12
Fruits 84 22 7 55 0.6 - 27 7
Vegetable juices 45 7 10 28 1 - 20 7
Beer 86 36 17 33 1 - 28 6
Fruit juices 203 69 32 102 0.5 - 420 6
The exposure of humans against furan was assessed using data on food consumption in
Europe in connection with the furan contents determined in various food items. The
estimated mean exposure of adults to furan in food ranges from 0.34 µg/kg bw/d to 1.23
µg/kg bw/d in the different states of the EU, with a median of 0.78 µg/kg bw/d (EFSA,
2009b). For infants at 3-12 months age, an estimated mean exposure between 0.27 µg/kg
bw/d and 1.01 µg/kg bw/d was calculated (EFSA, 2009b). In the case of adults, coffee was
identified as the main source of furan from food, while in infants exposure to furan is
predominantly caused through intake of infant formulas and jarred baby food (EFSA,
2009b). Considering these estimated daily intakes, the difference between human
exposure to furan and furan doses which cause carcinogenic effects in rodents after
chronic administration (2 mg/kg bw) appears to be rather small (NTP, 1993). Thus, the
presence of furan in food may present a potential risk to human health.

STATE OF KNOWLEDGE ON FURAN 7
2.2 Toxicology of furan
2.2.1 Toxicokinetics of furan
Furan toxicokinetics have been studied extensively. After a single oral administration of
[2,5-14C]-furan to rats, more than 80 % of the radioactivity were eliminated during the
first 24 hours, with 14 % exhaled as unchanged furan, 26 % exhaled as CO2, 20 % excreted
via urine and 22 % via feces (Burka et al., 1991). The formation of CO2 presumably occurs
through opening of the furan ring followed by complete oxidation of at least one of the
labeled carbons (Burka et al., 1991). Measurement of the radioactivity still present in rats
after 24 hours revealed that by far the highest amount was present in the liver, where it
was reported to be mainly covalently bound to proteins (Burka et al., 1991). Repeated
administration of [2,5-14C]-furan (daily dose of 8 mg/kg bw) to rats resulted in
accumulation of radioactivity in the liver, levelling off after the 4th dose (Burka et al.,
1991).
Furan was found to be metabolized by cytochrome P450 (CYP) enzymes, predominantly
CYP2E1, to its major metabolite cis-2-butene-1,4-dial (BDA, maleic dialdehyde) (Chen et
al., 1995; Kedderis et al., 1993). BDA is a highly reactive electrophilic compound that can
easily react with cellular nucleophiles in nucleophilic addition reactions (Michael additions
and/or 1,2-additions) and is thus assumed to be the key mediator of furan toxicity and
carcinogenicity (Fig. 3). This is supported by a study on furan toxicity in freshly isolated rat
hepatocytes in vitro, which demonstrated that furan-mediated glutathione depletion and
reduction of cell viability could be suppressed by the CYP inhibitor 1-phenylimidazole and
increased by acetone pretreatment (a CYP2E1 inductor), indicating that furan cytotoxicity
depends on its metabolic activation (Carfagna et al., 1993). In line with these findings,
furan-induced hepatotoxic effects in vivo could be prevented by cotreatment with the
irreversible CYP450 inhibitor aminobenzotriazole (Fransson-Steen et al., 1997).
Figure 3 Initial step in the metabolism of furan. Furan is metabolized by cytochrome P450 2E1 (CYP2E1) to its key metabolite cis-2-butene-1,4-dial (BDA). By nucleophilic addition reactions (Michael addition and/or 1,2-addition), BDA can react with cellular nucleophiles. Thus, BDA is assumed to be the key mediator of furan toxicity and carcinogenicity.

8 STATE OF KNOWLEDGE ON FURAN
To address the reactivity of the furan metabolite cis-2-butene-1,4-dial (BDA) against
cellular nucleophiles and further elucidate furan metabolism, several in vitro and in vivo
studies were conducted.
In vitro, BDA was shown to react with both thiol and amino groups and to cause cross-link
formation between compounds containing these residues (Chen et al., 1997). Model
reactions of BDA with N-acetyllysine, N-acetylcysteine, and glutathione (GSH) yielded
molecules containing lactam or pyrrole structures (Fig. 4 and 5). According to the hard
and soft acids and bases concept, the compounds formed after reaction of BDA with thiol
groups were still reactive towards nucleophiles, such as amino groups, whereas molecules
formed after reaction of BDA with amino groups did not show further reactivity towards
thiol groups (Fig. 4). Consistently, cis-2-butene-1,4-dial was reported to react in vitro with
glutathione, which contains a thiol group and a free amino group to form inter- and
intramolecular cross-links, i.e. mono- and bis-glutathione conjugates (Peterson et al.,
2005) (Fig. 5).
Figure 4 Reactivity of the furan metabolite cis-2-butene-1,4-dial towards amines (R-NH2) and/or thiols (R-SH) (modified from Chen et al. 1997). CYP2E1 = cytochrome P 450 2E1

STATE OF KNOWLEDGE ON FURAN 9
Figure 5 Formation of mono- and bis-glutathione conjugates from cis-2-butene-1,4-dial (modified from Peterson et al. 2005). CYP2E1 = cytochrome P 450 2E1, GSH = glutathione
In in vivo studies, the cyclic mono-glutathione conjugates but not the bis-glutathione
conjugates were observed in urine of furan-treated rats (Peterson et al., 2006). This may
be due to the fact that the bis-glutathione conjugates show a high molecular weight and
thus are more likely to be excreted via bile than via urine. Similarly, a recent study aimed
at identifying furan metabolites in bile of furan-treated rats did not show the presence of
the bis-glutathione conjugates per se. However, degradation products resulting from
enzymatic processing by γ-glutamyltransferase and dipeptidase (cysteinylglycine-GSH-
conjugate and cysteine-GSH-conjugate) were found in bile, suggesting that the bis-
glutathione conjugates are formed, but are rapidly cleaved by GSH-processing enzymes
(Hamberger et al., 2010a).
Besides the mono-glutathione conjugate, further metabolites have recently been
identified in urine and bile of rats treated with furan (Hamberger et al., 2010a; Kellert et
al., 2008b; Lu et al., 2009). Based on these studies, it was suggested that the observed
furan metabolites not only represent products derived from the reaction of BDA with
glutathione and free amino acids, but also degradation products of protein adducts
formed through the reaction of BDA with cysteine and/or lysine residues of proteins (Fig.
6).

10 STATE OF KNOWLEDGE ON FURAN
Figure 6 Proposed metabolic pathways of furan by conjugation with cysteine (cys) and lysine (lys) either as free amino acids or protein residues (modified from Hamberger et al. 2010). CYP2E1 = cytochrome P 450 2E1, GGT = γ-glutamyltransferase, N-AcCys = N-acetylcysteine, N-AcLys = N-acetyllysine, BDA = cis-2-butene-1,4-dial, GSH = glutathione

STATE OF KNOWLEDGE ON FURAN 11
Besides its ability to form adducts with amino acid residues, BDA has also been
demonstrated to form adducts with nucleosides in vitro (Byrns et al., 2002). Moreover,
recent results from our group indicate the potential to form DNA adducts in vivo
(Hamberger et al., 2010b).
Taken together, some of the metabolites identified in bile and urine of rats treated with
furan appear to represent degradation products of protein adducts formed through the
reactions of BDA with cysteine and lysine residues in proteins (Hamberger et al., 2010a;
Kellert et al., 2008b; Lu et al., 2009), providing additional support that significant protein
binding of furan reactive metabolites occurs in vivo and is likely to contribute to furan
toxicity and carcinogenicity.
2.2.2 Acute and subchronic toxicity of furan
Furan was reported to cause toxic effects in several organs, but the main target organ of
furan toxicity and carcinogenicity is the liver (NTP, 1993). LD50 values determined after
intraperitoneal administration of furan were 5.2 mg/kg bw (rats) and 7.0 mg/kg bw (mice)
(Egle and Gochberg, 1979). In a study conducted by Wilson et al., rats received a single
furan dose (30 mg/kg bw) by gavage and were sacrificed 12 h, 24 h, 48 h, 4 days or 8 days
after administration (Wilson et al., 1992). Histopathological examination of liver sections
revealed that furan induced hepatocellular necrosis already at 12 h after administration,
showing maximal necrotic lesions at 24 h. Moreover, inflammation and elevated liver
enzyme activities in plasma were observed at the 24 h timepoint. At 48 h post-dosing, an
increase in regenerative cell proliferation was found, indicative of the liver trying to
replace the loss of cells. After 8 days, livers showed scarring and some residual
inflammation. In another study also using doses of 30 mg/kg bw, furan administration for
up to 3 months resulted in extensive hepatocellular necrosis and inflammation, followed
by proliferation of hepatocytes and biliary cells and fibrosis (Hickling et al., 2010a).
Furthermore, an oral 13-week study with higher furan doses (0, 4, 8, 15, 30, or 60 mg/kg
bw) showed increased liver weights and hepatotoxic effects such as bile duct hyperplasia
and cholangiofibrosis in rats of all dose groups (NTP, 1993). In this study, 9/10 male and
4/10 female rats treated with 60 mg/kg bw died before the end of the study.
In a further study, furan administration by gavage (4 and 40 mg/kg bw, 1-14 d) was found
to induce hepatocellular degeneration, hepatic inflammation and compensatory cell

12 STATE OF KNOWLEDGE ON FURAN
proliferation (Hamadeh et al., 2004). Moreover, furan treatment resulted in elevated
plasma levels of endogenous metabolites normally excreted in bile such as cholesterol
and bilirubin, suggesting that furan may interfere with hepatobiliary transport
mechanisms (Hamadeh et al., 2004).
In a recent study conducted with furan doses of 0.0, 0.03, 0.12, 0.5, 2.0, and 8.0 mg/kg
bw, macroscopic and histological changes were also observed after 90 days of treatment
(Gill et al., 2010). In the high dose group, nodular structures were reported to be present
within the caudate and left liver lobes of all animals (Gill et al., 2010). Apoptosis of
hepatocytes, alterations in Kupffer cells, and inflammation occurred in the caudate lobes
at doses ≥ 0.12 mg/kg bw and were also detected in the left lobe at doses of ≥ 0.5 mg/kg
bw (Gill et al., 2010). At the lower doses, the subcapsular toxic effects were mild and were
only observed at the visceral surface of the left lateral and caudate lobes. However, with
increasing doses the lesions became more pronounced and extended deeper into the
liver lobe. At the highest dose of 8 mg/kg bw, subcapsular inflammation, hyperplasia of
biliary epithelial cells and cholangiofibrosis with fibrotic tissue replacing the liver
parenchyma were reported (Gill et al., 2010). Supporting the abovementioned hypothesis
that furan may affect hepatobiliary transport mechanisms, Gill et al. also found elevated
serum levels of bilirubin and cholesterol (Gill et al., 2010).
2.2.3 Chronic toxicity and carcinogenicity of furan
Chronic toxicity and carcinogenicity of furan were investigated in a 2-year bioassay
conducted by the National Toxicology Program (NTP) with furan doses of 0, 2, 4, 8 mg/kg
bw (NTP, 1993). In this study, various nonneoplastic hepatic lesions were reported in
F344/N rats of both sexes, including bile duct hyperplasia, cholangiofibrosis, necrosis,
chronic inflammation, biliary cell proliferation, hepatocellular cytomegaly and
degeneration, and nodular hyperplasia of hepatocytes (NTP, 1993).
Additionally, in animals dosed with 2 and 4 mg/kg bw furan for 9 months, toxic furan
effects, i.e. nodular changes and scarring of the liver, were observed to be most
pronounced at the visceral surfaces of the left lateral and caudate liver lobes facing the
forestomach (Maronpot et al., 1991). In line with these findings, furan administration (8
mg/kg bw) was reported to result in hepatic lesions including necrosis, inflammation,
cholangiofibrosis and slight bile duct proliferation extending from the subcapsular visceral

STATE OF KNOWLEDGE ON FURAN 13
surface of the left and caudate liver lobes (Wilson et al., 1992). Although the reasons for
these regionally specific effects remain to be established, it was suggested that furan may
directly diffuse through the stomach into the subcapsular area of the liver where it can
cause toxic effects (Wilson et al., 1992). Another possible explanation for the selective
toxic effects may be intra- and interlobular differences in blood flow (Hamadeh et al.,
2004; Metzger and Schywalsky, 1992). Furthermore, vascular lesions or formation of
thrombi may constrict the blood flow in the specific areas and thus induce hypoxia and
subsequent necrosis (Mally et al., 2010).
Furan administration for 2 years significantly increased the combined incidence of
hepatocellular adenomas and carcinomas in male and female B6C3F1 mice and in male
F344/N rats (Tab. 2). Furthermore, furan was found to cause high incidences of
cholangiocarcinomas in male and female F344/N rats after 2 years of furan administration
(Tab. 2). High incidences of cholangiocarcinomas were also observed in F344/N rats at the
9- or 15- months interim evaluations (NTP, 1993). Interestingly, no cholangiocarcinomas
were found in mice after 2 years of furan administration.
Table 2 Tumor incidences in F344/N rats and B6C3F1 mice in the rodent bioassay on furan conducted by the National Toxicology Program (NTP, 1993). m = male, f = female
Rats Sex 0 mg/kg bw 2 mg/kg bw 4 mg/kg bw 8 mg/kg bw
Cholangiocarcinoma
m 0/50 43/50 48/50 49/50
f 0/50 49/50 50/50 48/50
Hepatocellular adenoma or carcinoma
m 1/50 5/50 22/50 35/50
f 0/50 2/50 4/50 8/50
Mice Sex 0 mg/kg bw 8 mg/kg bw 15 mg/kg bw
Hepatocellular adenoma or carcinoma
m 26/50 44/50 50/50
f 7/50 34/50 50/50

14 STATE OF KNOWLEDGE ON FURAN
2.2.4 Mechanisms contributing to furan carcinogenicity
Depending on their mode of action, carcinogenic compounds can be separated into two
groups. Genotoxic carcinogens directly react with DNA to form covalent DNA adducts. The
formation of these adducts can then lead to mutations. Multiple mutations can induce
loss of function of tumor suppressors (e.g. p53) or transformation of proto-oncogenes
(e.g. ras) into oncogenes, thus resulting in loss of cell growth regulation and subsequent
tumor formation.
The second group of carcinogens consists of substances that act in a non-genotoxic
manner, i.e. they do not show direct reactivity against DNA. Instead, non-genotoxic
carcinogens can exert carcinogenic effects through disruption of tissue homeostasis
leading to increased cell proliferation (Klaunig et al., 2000). Increased mitosis may result
from either mitogenic mechanisms (interaction with cellular receptors, modulation of
growth factors, disruption of cell growth regulation) or regenerative cell proliferation
secondary to cytotoxicity. Furthermore, escape from apoptosis as a protective process to
eliminate altered and potentially mutagenic cells may contribute to disruption of tissue
homeostasis. An additional factor involved in non-genotoxic carcinogenesis may be the
decrease of intercellular communication via gap junctions, presumably leading to
inhibited growth control through neighboring cells (Klaunig et al., 2000). Moreover,
increased oxidative stress in cells exposed to non-genotoxic carcinogens may participate
in cancer development through oxidative damage to DNA, proteins, and lipids, leading to
mutations and/or disrupted cellular functions. Oxidative stress may also result in altered
gene expression through directly activating transcriptional pathways or indirectly causing
hypomethylation (Klaunig et al., 2000). In addition, non-genotoxic carcinogens may elicit
effects on intracellular signaling pathways, transcription factors, and DNA methylation
status. Hyper- and hypomethylation of genes is associated with decreased and increased
gene expression, respectively. Thus, non-genotoxic carcinogens may influence gene
expression of oncogenes and tumor suppressor genes.
In the case of furan-induced carcinogenicity, it is still unclear to what extent genotoxic or
non-genotoxic mechanisms contribute to tumor formation. Findings of studies addressing
both genotoxic and non-genotoxic effects are briefly summarized below.

STATE OF KNOWLEDGE ON FURAN 15
2.2.4.1 Genotoxicity of furan
Data on furan genotoxicity in vitro and in vivo are inconsistent. Furan was reported not to
be mutagenic in the Ames test conducted with 4 different Salmonella typhimurium strains
(NTP, 1993), but to induce chromosomal aberrations and sister chromatid exchanges
(SCEs) in chinese hamster ovary (CHO) cells (NTP, 1993) and double-strand breaks in
isolated rat hepatocytes (Mugford et al., 1997). No genotoxic effects were observed after
treatment of L5178Y tk(+/-) mouse lymphoma cells with furan (Kellert et al., 2008a).
Furthermore, chromosomal aberrations, but no SCEs were found in mouse bone marrow
cells after intraperitoneal administration of furan (NTP, 1993). Unscheduled DNA
synthesis (UDS) was not detected in mouse or rat hepatocytes in vivo and in vitro (Wilson
et al., 1992). Furan was also negative in the micronucleus-test in mice (Durling et al.,
2007). Importantly, no radioactivity was found to be associated with liver DNA after
administration of [2,5-14C]-furan to rats (Burka et al., 1991). However, detection of furan-
derived DNA adducts in this study may have been compromised by the low specific
activity (90 µCi/mmol), which may have been too low to detect DNA adducts, and the
positions of the radiolabel (2 and 5) at the labile carbons, which may give rise to CO2
(EFSA, 2004). Moreover, it is possible that DNA adducts are unstable and are cleaved by
the isolation method used (EFSA, 2004). Thus, results from this study were considered
inconclusive and recent data from our group suggest that furan covalently binds to DNA
in vivo (Hamberger et al., 2010b).
In contrast to furan, cis-2-butene-1,4-dial, the reactive metabolite of furan, was shown to
increase mutant frequency in L5178Y tk+/− mouse lymphoma cells and tail length in the
comet assay (Kellert et al., 2008a). In these studies, however, a strong cytotoxic effect of
BDA on the cells was apparent. BDA was also found to be mutagenic in the Ames test in a
strain sensitive to aldehydes (TA 104) (Peterson et al., 2000) and to cause DNA single-
strand breaks and cross-links in CHO cells (Marinari et al., 1984). Furthermore, BDA was
found to form adducts with 2’-deoxyribonucleosides in vitro (Byrns et al., 2002). However,
under BDA treatment no cross-link formation in mouse lymphoma cells was observed and
BDA was not positive in the micronucleus test (Kellert et al., 2008a).
The inconsistency of the in vitro data may in part be due to the fact that furan is highly
volatile and may evaporate easily from the reaction mixture, resulting in a need to

16 STATE OF KNOWLEDGE ON FURAN
monitor the actual furan concentration in the cell medium (Wilson et al., 1992), which
may not have been conducted in all studies.
Taken together, the available information on furan and BDA genotoxicity is insufficient to
establish whether the mechanism of furan-induced toxicity and carcinogenicity involves
direct genotoxic effects. Furthermore, it seems likely that toxic furan effects are mediated
by BDA rather than by furan itself. This is in line with findings that furan toxicity requires
metabolic activation to BDA (Fransson-Steen et al., 1997; Mugford et al., 1997).
2.2.4.2 Non-genotoxic mechanisms of furan toxicity and carcinogenicity
Besides studies addressing genotoxic effects of furan, results from a range of studies
suggest that furan carcinogenicity may in part be mediated through non-genotoxic
mechanisms. This includes protein binding followed by cytotoxicity and secondary cell
proliferation, leading to tumor formation.
It is well established that protein binding of reactive intermediates may lead to cell death
(Evans et al., 2004). In the case of furan, covalent binding of BDA to amino acids and
glutathione was observed in vitro (Chen et al., 1997). Furthermore, Burka et al. reported
that 24 hours after administration of 14C-labeled furan most of the radioactivity still
present in the rat was detected in the liver and that it was associated with proteins (Burka
et al., 1991). This finding shows that BDA covalently binds to proteins in vivo.
Consistent with a non-genotoxic mechanism of furan-induced carcinogenicity, sustained
cell proliferation without induction of DNA repair was detected in mice and rats after
furan treatment, leading to the suggestion that enhanced cell proliferation may play a key
role in tumor development in rodents exposed to furan (Wilson et al., 1992). In these and
other experiments, subcapsular necrosis and inflammation were observed and it was
concluded that cell proliferation occurred as a regenerative mechanism secondary to cell
death (Wilson et al., 1992). In line with these data, a study in female mice showed that
furan induced a substantial increase in the rate of apoptosis and slightly enhanced cell
proliferation (Fransson-Steen et al., 1997). Thus, both forms of cell death, necrosis and
apoptosis, may play a role in furan-induced toxicity and carcinogenesis. It was suggested
that dose and duration of furan treatment determine which form of cell death occurs
depending on factors such as cellular ATP level (Fransson-Steen et al., 1997; Richter et al.,
1996). Indeed, furan was found to uncouple oxidative phosphorylation, leading to the

STATE OF KNOWLEDGE ON FURAN 17
hypothesis that furan-induced ATP depletion and mitochondrial injury represent early
events in cell death (Mugford et al., 1997).
In a rat study to elucidate the sequential events during the process of furan-induced
carcinogenicity (daily furan dose of 30 mg/kg bw; several timepoints for sacrifice from 8
hours to 3 months), furan administration was shown to cause subcapsular and
centrilobular necrosis and inflammation already at 24 hours after the first dose (Hickling
et al., 2010a). By day 3 of the study, the centrilobular necrosis was mostly repaired
through proliferation of hepatocytes and inflammation was absent in these areas.
Conversely, in focal regions with more severe injury (subcapsular and portal) the damage
could not be repaired by hepatocyte proliferation only and the response to injury
consisted of bile duct proliferation and sustained inflammation. The biliary cells derived
from the expanding bile ducts later transformed into hepatocytes to replace the necrotic
tissue. Altogether, this is assumed to represent a normal response to liver injury.
However, in some regions where the initial injury had been severe, biliary cells did not
differentiate into hepatocytes and the biliary ducts kept extending into the parenchyma,
finally leading to cholangiofibrosis. It was suggested that lack of signals supposed to
terminate the repair response caused by chronic furan administration may be involved in
the development of cholangiofibrosis, which may represent a precursor of
cholangiocarcinomas (Hickling et al., 2010a).
Although the genotoxic potential of furan has not been conclusively elucidated yet, the
findings described here indicate that non-genotoxic effects may play a significant role in
the mechanisms of furan-induced toxicity and carcinogenicity.

18 ROLE OF PROTEIN BINDING AND METHODS FOR TARGET PROTEIN IDENTIFICATION
3 ROLE OF PROTEIN BINDING AND METHODS FOR THE IDENTIFICATION OF TARGET PROTEINS
3.1 Covalent protein binding and cytotoxicity
First insights into a role of covalent protein adduct formation in toxicity and
carcinogenicity were provided in the late 1940s (Miller and Miller, 1948). Based on results
from their studies, Miller and Miller suggested that the carcinogenic effect of the azo dye
4-dimethylaminoazobenzene was associated with binding of its metabolite, 4-
monomethylaminoazobenzene to liver proteins.
In the following decades, further research concerning the link between protein
modification and toxicity has been conducted. It was observed that both acetaminophen
and its regioisomer 3'-hydroxyacetanilide form similar levels of covalent protein adducts
in the liver (Tirmenstein and Nelson, 1989). However, acetaminophen administration
resulted in hepatotoxicity, whereas 3'-hydroxyacetanilide was not toxic. Thus, it was
suggested that there may be proteins whose adduction may result in toxicity, while
modification of other proteins does not lead to toxic effects (Evans et al., 2004). However,
there is still little information as to which proteins might be critical for the development
of cytotoxicity.
3.2 Methods for the identification of target proteins
From the beginning of the 1980s until 1998, methods used for the identification of target
proteins of various chemical compounds had been very labor- and time-consuming. Thus,
in this time span only 28 target proteins of chemicals were identified (Hanzlik et al.,
2009).
In 1998, Qiu et al. published a newly developed method, which combined separation of
proteins by two-dimensional gel electrophoresis (2D-GE) with peptide mass mapping and
tandem mass spectrometry (MS/MS) sequencing to identify target proteins of reactive
metabolites (Qiu et al., 1998). This method represented a milestone in the field of target
protein identification. Using the new approach, Qiu et al. were able to identify more than
20 target proteins of reactive acetaminophen metabolites in a single workflow, which is
about as many as had been found in total in the previous two decades. Using methods
similar to the workflow developed by Qui et al., more than 320 target proteins of reactive

ROLE OF PROTEIN BINDING AND METHODS FOR TARGET PROTEIN IDENTIFICATION 19
metabolites are known today, which can be found in the target protein database (TPDB;
http://tpdb.medchem.ku.edu:8080/protein_database/).
Today, most methodological approaches are similar to the one used by Qiu et al., i.e. they
apply 2D-GE (or two-dimensional liquid chromatography) to separate modified and
unmodified proteins and subsequent mass spectrometry to identify the detected target
proteins. Detection of the adducted proteins is usually conducted using either
radiolabeling or specific antibodies.
The power of the approach using radiolabeled compounds was demonstrated by Koen et
al. (2007). In their studies, rats received 14C-labeled bromobenzene (specific activity 5.17
Ci/mol, 2 mmol/kg bw, intraperitoneal) and proteins were isolated from liver. After
subcellular fractionation, liquid scintillation counting revealed the amount of radioactivity
covalently bound to liver cytosolic proteins (3900 pmol equiv 14C-bromobenzene/mg
protein). Following separation by 2D-GE, proteins were transferred to a membrane by
electroblotting and radioactive spots were detected by phosphorimaging. Protein
identification was conducted using matrix-assisted laser desorption/ionization time-of-
flight (MALDI-TOF) mass spectrometry and MS/MS and database search, resulting in the
identification of 33 target proteins of bromobenzene. Methods using radiolabeled
compounds have been widely applied for the detection of adducted proteins due to their
high sensitivity and simplicity. However, disadvantages of this approach are special safety
issues, which have to be regarded when using radioactive material. Moreover, it may be
difficult and expensive to obtain the radiolabeled material needed for the study since
many radiolabeled compounds show a limited availability and have to be specifically
synthesized.
In contrast to the use of radiolabeled compounds, Druckova et al. (2007) detected
adducted proteins on a Western blot using a specific antibody against teucrin A, a
hepatotoxic furan-containing compound found in the herb germander. Teucrin A is
bioactivated to an 1,4-enedial derivative structurally similar to cis-2-butene-1,4-dial and
was found to react with both lysine and cysteine residues of proteins (Druckova and
Marnett, 2006). Moreover, the teucrin-A specific antibody was also used for
immunoprecipitation to enrich modified proteins from rat liver homogenates. After
enrichment, the proteins were digested and analyzed by liquid chromatography-MS/MS
(LC-MS/MS). In this study, 46 target proteins of the furan derivative teucrin A were

20 ROLE OF PROTEIN BINDING AND METHODS FOR TARGET PROTEIN IDENTIFICATION
identified. Antibody-based methods are easier to handle compared to radioactive
material. However, problems may occur if no specific antibody against the metabolite-
protein adduct is commercially available. In this case, a specific antiserum has to be
manufactured, which needs the use of laboratory animals and may be very expensive.

AIMS OF THIS WORK 21
4 AIMS OF THIS WORK
Furan, a potent hepatotoxin and liver carcinogen in rodents, was reported to be present
in a variety of food items that undergo heat treatment (Crews and Castle, 2007; NTP,
1993). The toxic and carcinogenic effects of furan were found to depend on the formation
of its reactive metabolite cis-2-butene-1,4-dial (BDA) (Fransson-Steen et al., 1997).
However, the mechanisms of furan-induced tumor formation are still poorly understood
and both genotoxic and non-genotoxic mechanisms have been proposed.
Despite possible genotoxic effects of furan (Byrns et al., 2002; Hamberger et al., 2010b),
results from several studies indicate that furan covalently binds to proteins in vitro and in
vivo (Burka et al., 1991; Chen et al., 1997; Hamberger et al., 2010a; Lu et al., 2009). Since
it is well established that protein binding of reactive intermediates may lead to cell death
(Evans et al., 2004), it has been suggested that inactivation of protein function through
covalent binding of reactive furan metabolites and subsequent cell death leading to
regenerative cell proliferation may present key events in furan-induced carcinogenicity.
However, it has long been recognized that adduction of some proteins may be critical to
injury, whereas covalent binding to others is not (Zhou et al., 2005). For a comprehensive
understanding of the molecular events involved in furan toxicity, identification of target
proteins of reactive furan intermediates, which may play a causal role in the pathogenesis
of furan-associated liver toxicity, and characterization of the cellular and functional
consequences of protein adduct formation are needed.
Therefore, the major aims of this work were to identify target proteins of furan reactive
intermediates in rat liver by employing state-of-the-art proteomics methods involving
administration of 14C-labeled furan to rats, separation of unmodified and furan-adducted
proteins present in liver by two-dimensional gel electrophoresis, detection of protein
spots containing radiolabel by fluorography, and identification of proteins by modern
mass spectrometry techniques (Chapter 6) and to discuss the potential relationship
between loss of target protein function and furan toxicity (Chapter 8).
To determine the cellular and functional consequences associated with protein damage, a
further aim of this work was to characterize the effects of subacute furan administration
to rats at a known carcinogenic dose and at doses closer to estimated human exposure
(Chapter 7). In this regard, we also want to establish if the administration of furan at
either a known carcinogenic dose or at a clearly hepatotoxic dose results in activation of

22 AIMS OF THIS WORK
the unfolded protein response (UPR). The UPR is a cellular pathway, which is activated
upon stress in the endoplasmic reticulum (ER) caused by accumulation of unfolded or
misfolded proteins and which serves to increase the cells capacity to recognize misfolded
proteins and target them for degradation by the proteasome.

MATERIALS 23
5 MATERIALS
5.1 Equipment
A list containing information on the equipment used for this work is provided in Tab. 3.
Table 3 Equipment used for this work
Equipment Provider
Autoradiography cassette Hartenstein, Würzburg, Germany
DC Power Supply PS 3000 Hoefer, Holliston, MA, USA
Electrode strips GE Healthcare, München, Germany
Electrophoresis Power Supply EPS 3500 GE Healthcare, München, Germany
E-Pure Water Purification Systems, Barnstead Thermo Fisher Scientific, Dreieich, Germany
Eppendorf Centrifuge 5403 Eppendorf, Hamburg, Germany
Eppendorf Concentrator Eppendorf, Histon, UK
ExcelGel 2-D Homogeneous 12.5 GE Healthcare, München, Germany
ExcelGel SDS Buffer Strips GE Healthcare, München, Germany
FluorChemQ imaging system Cell Biosciences, Santa Clara, CA, USA
Rotanta/RP Hettich, Tuttingen, Germany
Glass capillary (100 x 1.5 mm) Hartenstein, Würzburg, Germany
Glassware Schott, Mainz, Germany
Capillary liquid chromatography system CapLC including autosampler
Waters, Elstree, UK
HP ScanJet 5550C Flatbed Scanner Hewlett-Packard, Germany
Hyperfilm MP GE Healthcare, München, Germany
Immobiline DryStrip Kit GE Healthcare, München, Germany
Immobiline DryStrip pH 3-11 NL (non-linear), 18 cm GE Healthcare, München, Germany
Immobiline DryStrip pH 4-7, 18 cm GE Healthcare, München, Germany
Immobiline DryStrip pH 6-9, 18 cm GE Healthcare, München, Germany
Immobiline DryStrip Reswelling Tray GE Healthcare, München, Germany
Integrafrit column (10 cm/ 75 µm C8) New Objective, Woburn, MA, USA
Kodak X-OMAT 1000 Processor Kodak, Stuttgart, Germany
LTQ FT Ultra mass spectrometer Thermo Fisher Scientific, Dreieich, Germany
Makrolon® type-4 cages Bayer Makrolon, Leverkusen, Germany
Megafuge 1.0R Heraeus, Hanau, Germany
Mettler Toledo AG 245 Mettler-Toledo, Giessen, Germany
Micro AS autosampler Thermo Fisher Scientific, Dreieich, Germany
Microspin FV-2400 mini-centrifuge Biosan, Riga, Latvia
Multiphor II Electrophoresis System GE Healthcare, München, Germany
MultiTemp cooling unit GE Healthcare, München, Germany
Nanodrop 2000C Thermo Fisher Scientific, Dreieich, Germany
Owl Separation Systems Model B1 Thermo Fisher Scientific, Dreieich, Germany
Pelleted standard rat maintenance diet SSNIFF Spezialdiäten GmbH, Soest, Germany

24 MATERIALS
Polypropylene reaction tubes (0.5 ml, 1.5 ml, 2.0 ml) Sarstedt, Nümbrecht, Germany
Polystyrene cuvettes (10 x 4 x 45 mm) Sarstedt, Nümbrecht, Germany
PTC‐200™ Programmable Thermal Controller MJ Research, Waltham, USA
Qiagen BioRobot 3000 Qiagen, Hilden, Germany
Q-TOF Ultima Global mass spectrometer Waters, Elstree, UK
LC Packings column (15 cm/75 µm C18, 3 µm, 100 Å) Dionex-LC Packings, Amsterdam, The Netherlands
LightCycler 480 Roche, Mannheim, Germany
Rotho Clear Box Rotho, Görwihl, Germany
Sample application pieces, large (0.5 x 2.5 cm) GE Healthcare, München, Germany
Sample application pieces, small (0.5 x 1 cm) GE Healthcare, München, Germany
Sample cups GE Healthcare, München, Germany
Sample cup bar GE Healthcare, München, Germany
Saran foil Dow, Schwalbach/Ts, Germany
Sero-Wel 96 Well Plates, V-well, I/W sterile, Sterilin Appleton Woods, Birmingham, UK
Shaker L-40 Hartenstein, Würzburg, Germany
Sigma 4-15C Qiagen, Hilden, Germany
Surveyor MS pump Thermo Fisher Scientific, Dreieich, Germany
Tri-Carb 2900 TR Liquid Scintillation Analyzer PerkinElmer, Rodgau, Germany
TriVersa NanoMate (ESI) source Advion BioSciences, Ithaca, NY, USA
Polypropylene tubes (15 ml, 50 ml) Sarstedt, Nümbrecht, Germany
Ultrospec 2000 Pharmacia Biotech, Cambridge, UK
Vortex Duo Press_To_Mix 525 Labinco, Giessen, Germany
5.2 Chemicals and reagents
Tab. 4 shows the chemicals and reagents used for this work.
Table 4 Chemicals and reagents used for this work
Chemical/Reagent Provider
Acetone AppliChem, Darmstadt, Germany
Acetonitrile Sigma-Aldrich, Taufkirchen, Germany
Agarose (Biozym LE Agarose) Biozym, Hessisch Oldendorf, Germany
Amersham AmplifyTM
Fluorographic Reagent GE Healthcare, München, Germany
Ammonium bicarbonate (NH4HCO3) Thermo Fisher Scientific, Dreieich, Germany
Bromophenol blue Carl Roth, Karlsruhe, Germany
3-[(3-Cholamidopropyl)dimethylammonio]-1-propanesulfonate (CHAPS)
AppliChem, Darmstadt, Germany
Corn oil Sigma-Aldrich, Taufkirchen, Germany
Deionized water see E-Pure Water Purification Systems
DEPC-H2O (DNase free, RNase free, sterile) Carl Roth, Karlsruhe, Germany
1,4-Dithiothreitol (DTT) Carl Roth, Karlsruhe, Germany

MATERIALS 25
Dry Strip Cover Fluid GE Healthcare, München, Germany
Ethylenediaminetetraacetic acid (EDTA) Sigma-Aldrich, Taufkirchen, Germany
Ethanol Carl Roth, Karlsruhe, Germany
Ethidium bromide solution for fluorescence Sigma-Aldrich, Taufkirchen, Germany
Formic acid Sigma-Aldrich, Gillingham, UK
[3,4-14
C]-Furan Tjaden Biosciences, Burlington IA,USA
Furan (Cat. 18,592-2) Sigma-Aldrich, Taufkirchen, Germany
Gel loading dye New England Biolabs, Frankfurt, Germany
Glacial acetic acid Carl Roth, Karlsruhe, Germany
[Glu1]-Fibrinopeptide B, human Sigma-Aldrich, Taufkirchen, Germany
Glycerol 86 % Carl Roth, Karlsruhe, Germany
Hydrochloric acid (HCl) 25 % Carl Roth, Karlsruhe, Germany
Water, HPLC Grade J.T. Baker, Philipsburg, NJ, USA
Iodoacetamide (IAA) GE Healthcare, München, Germany
IPG Buffer pH 3-11 non-linear (NL) GE Healthcare, München, Germany
IPG Buffer pH 4-7 GE Healthcare, München, Germany
IPG Buffer pH 6-11 GE Healthcare, München, Germany
Isopropanol Sigma-Aldrich, Taufkirchen, Germany
MassPREPTM
Digestion Standard Enolase Waters, Elstree, UK
Methanol Carl Roth, Karlsruhe, Germany
Potassium chloride (KCl) Merck, Darmstadt, Germany
Potassium dihydrogen phosphate (KH2PO4) Ferak, Berlin, Germany
Primers for XBP1 and GAPDH, reverse and forward Biomers, Ulm, Germany
Protease Inhibitor Cocktail Carl Roth, Karlsruhe, Germany
peqGOLD Orange 50 bp ladder PEQLAB, Erlangen, Germany
peqGOLD Prestained Protein-Marker IV PEQLAB, Erlangen, Germany
RotiBlue Carl Roth, Karlsruhe, Germany
Rotiszint 22 Carl Roth, Karlsruhe, Germany
Sodium dodecyl sulfate (SDS) Pellets Carl Roth, Karlsruhe, Germany
Sodium chloride (NaCl) Carl Roth, Karlsruhe, Germany
Sodium hydrogen phosphate dihydrate (Na2HPO4 * 2H2O)
Merck, Darmstadt, Germany
TaqMan® Gene Expression Master Mix Applied Biosystems, Darmstadt, Germany
Tissue-Tek® O.C.TTM
Compound Sakura Finetek, Staufen, Germany
Thermo-Start PCR Master Mix (2x) Thermo Fisher Scientific, Dreieich, Germany
Thiourea AppliChem, Darmstadt, Germany
Trichloroacetic acid (TCA) Sigma-Aldrich, Taufkirchen, Germany
Tris(hydroxymethyl)aminomethane (Tris) base Carl Roth, Karlsruhe, Germany
Tris(hydroxymethyl)aminomethane (Tris) HCl AppliChem, Darmstadt, Germany
Trypsin Gold, Mass Spectrometry Grade Promega, Southampton, UK
Urea Carl Roth, Karlsruhe, Germany

26 MATERIALS
5.3 Kits
Names and providers of the kits used for this work are listed in Tab. 5.
Table 5 Kits used for this work
Product Provider
2-D Quant Kit GE Healthcare, München, Germany
FractionPREPTM
Cell Fractionation Kit Biocat, Heidelberg, Germany
RNase-Free DNase Set Qiagen, Hilden, Germany
RNeasy® Mini Kit Qiagen, Hilden, Germany
Silver staining Kit GE Healthcare, München, Germany
TaqMan® Gene Expression Assays Applied Biosystems, Darmstadt, Germany
VersoTM
cDNA Kit Thermo Fisher Scientific, Dreieich, Germany
5.4 Software
Names and providers of the software tools used for this work are listed in Tab. 6.
Table 6 Software used for this work
Product Provider
DAVID 6.7 National Institute of Allergy and Infectious Diseases, Bethesda, Maryland, USA
LightCycler®480 SW 1.5 Roche, Mannheim, Germany
Mascot Matrix Science, London, UK
Masslynx 4.0 Waters, Elstree, UK
Qiasoft4 Qiagen, Crawley, UK
REDFIN 3, 2D gel image analysis software Ludesi, Malmö, Sweden
Xcalibur 2.0.7 Thermo Fisher Scientific, Dreieich, Germany

IDENTIFICATION OF FURAN TARGET PROTEINS 27
6 IDENTIFICATION OF FURAN TARGET PROTEINS BY PROTEIN MASS SPECTROMETRY
6.1 Introduction
Furan is known to be a potent hepatotoxin and liver carcinogen in rodents. In a 2-year
bioassay, chronic furan administration to rats caused hepatocellular adenomas and
carcinomas as well as cholangiocarcinomas (NTP, 1993). To date, the mechanisms of
furan-induced toxicity and carcinogenicity are still unknown. However, there are findings
indicative of involvement of a non-genotoxic mechanism including protein adduct
formation, cell death and regenerative cell proliferation (Burka et al., 1991; Lu et al.,
2009; Wilson et al., 1992). Covalent binding of furan reactive metabolites to cellular
proteins may result in loss of their functions and subsequent cell death. Thus, it is
important to identify the target proteins of furan reactive metabolites in order to better
understand a possible role in the cellular events leading to cell death.
A common approach addressing this issue includes the administration of a radiolabeled
compound to animals and subsequent protein extraction from target and non-target
tissues. The obtained protein extracts are then measured by liquid scintillation counting
to determine the extent of protein adduct formation, i.e. the amount of compound
covalently bound to proteins. Moreover, for identification of target proteins, adducted
and unmodified proteins are separated by two-dimensional gel electrophoresis (2D-GE),
radiolabeled protein spots in the gel are detected by fluorography, and proteins
contained in selected spots were cleaved into peptides by in-gel digestion (Fig. 7). The
resulting peptides are then used for identification of modified proteins by mass
spectrometry and protein sequence database search.
In our study, male rats received [3,4-14C]-furan at a single dose of 2 mg/kg bw (known
carcinogenic dose) or 0.1 mg/kg bw (dose closer to estimated human exposure) and were
sacrificed 2h after administration. Protein extracts were used to determine the extent of
protein adducts formation in liver (target) and kidney (non-target) tissue and to identify
furan target proteins in rat liver.

28 IDENTIFICATION OF FURAN TARGET PROTEINS
Figure 7 Study design and methodological approach to identify furan target proteins in liver of rats treated with [3,4-
14C]-furan. 2D-GE = two-dimensional gel electrophoresis
[3,4-14C]-Furan, 20 mCi/mmol0, 0.1, and 2.0 mg/kg bw p.o. (gavage)
male F344 rats(n = 5 / group)
Proteinextraction
Fluorography
2D-GE
Subcellularfractionation
Amino acid sequence
Identified protein
Sequencedatabase
Spot picking from the gel
Tryptic digest into peptides
Analysis of the peptidesusing mass spectrometry
Spot selection

IDENTIFICATION OF FURAN TARGET PROTEINS 29
In addition to the quantification of covalent binding to proteins and the identification of
the target proteins, the use of radiolabeled compounds also enables to visualize the
distribution of a compound in a tissue. Thus, it is possible to establish whether there are
locally different concentrations of furan in the different liver lobes and in various areas of
the single lobes. This is of interest, because the left and the caudate lobes represent the
main target lobes of furan toxicity and the subcapsular region is most susceptible to toxic
effects (Gill et al., 2010; Maronpot et al., 1991; Wilson et al., 1992). Since the liver lobe
areas most affected by furan toxicity are located close to the stomach, it has been
suggested that diffusion of furan from the stomach, resulting in higher exposure against
furan, might be involved in the different responses of liver lobes after furan
administration (Hamadeh et al., 2004; Wilson et al., 1992). Moreover, it has been
suggested that blood flow was limited in the more susceptible areas and that resulting
hypoxia may lead to necrosis (Mally et al., 2010).
To investigate if furan is evenly distributed or if there are areas of higher furan
concentrations in the liver after oral administration, rats received a single dose of [3,4-
14C]-furan and liver slices were examined using autoradiography.
6.2 Methods
6.2.1 Housing and treatment of animals
15 Male Fischer F344/N rats (200-250g on arrival, Harlan-Winkelmann GmbH, Borchen,
Germany) were housed under standard laboratory conditions (climate cabinets,
temperature 22 ± 2 °C, relative humidity 30-70 %, 12-15 air changes per hour, 12 hour
light/dark cycle) in groups of 5 in Makrolon® type-4 cages with wire meshtops and
standard softwood bedding. Rats received pelleted standard rat maintenance diet and
tap-water ad libitum. After acclimatization, animals received [3,4-14C]-furan (specific
activity 20 mCi/mmol) in corn oil (4 ml/kg bw) by gavage at single doses of 0.0 mg/kg bw,
0.1 mg/kg bw and 2.0 mg/kg bw. The doses were chosen, because 2.0 mg/kg bw was the
lowest dose tested in a 2-year bioassay known to cause carcinogenic effects (NTP, 1993)
and 0.1 mg/kg bw represents a dose closer to the estimated human exposure (EFSA,
2004). Rats were sacrificed 2 h after administration by cardiac puncture under CO2
anesthesia and livers were removed, separated into their lobes, flash frozen in liquid
nitrogen, and stored at - 80 °C for further analyses. The time point of 2 h after

30 IDENTIFICATION OF FURAN TARGET PROTEINS
administration was chosen to allow distribution and bioactivation of furan based on the
rapid excretion of furan metabolites with bile (Hamberger et al., 2010a), whilst avoiding
metabolic incorporation of 14C.
6.2.2 Extraction of proteins from liver and kidney tissue for determination of covalent protein binding and identification of furan target proteins
Extraction solution: 7M urea, 2M thiourea, 4 % CHAPS, 2 % IPG Buffer pH 3-11
non-linear (NL), 65mM DTT, 1 tablet protease inhibitor cocktail
TCA (Trichloroacetic acid) solution: 10 % TCA in acetone containing 20 mM DTT
Washing solution: acetone containing 20 mM DTT
Sample solution: 7M urea, 2M thiourea, 4 % CHAPS, 2 % IPG Buffer pH 3-11 NL,
and 40 mM DTT
The extraction solution contained urea and thiourea to denature and thus solubilize and
unfold the proteins in the solution, thereby exposing the amino acid residues for
ionization. This results in better resolution in the first dimension where proteins are
separated according to their isoelectric point. 3-[(3-Cholamidopropyl)dimethylammonio]-
1-propanesulfonate (CHAPS), a zwitterionic detergent, was included to enhance
solubilization and to avoid aggregation of the proteins. An immobiline pH gradient (IPG)
buffer containing a mixture of carrier ampholytes (not specified by the manufacturer GE
Healthcare) was added to the solution to improve protein solubility by decreasing protein
aggregation through charge-charge interactions and to produce a more homogeneous
conductivity across the pH gradient during the first dimension. Dithiothreitol (DTT) acts as
a reducing agent in the extraction solution, breaking disulfide bonds and keeping the
proteins in their completely unfolded and reduced form. DTT was added to the solution
shortly before use. The protease inhibitor cocktail was added to the solution to prevent
protease-mediated protein degradation during the homogenizing process.
All centrifugation steps for the protein extraction were conducted at 4 °C using the
Megafuge 1.0R and the samples were kept on ice during the process. Frozen tissue (200
mg) from the left liver lobe or right kidney were homogenized in 2.5 ml extraction
solution and the homogenate was centrifuged for 30 min at 1000 x g. The supernatant
was transferred to a fresh tube and the proteins were precipitated with 2.5 ml TCA
solution over night at -20 °C. The next day, the samples were centrifuged for 30 min at

IDENTIFICATION OF FURAN TARGET PROTEINS 31
4000 x g and the supernatant was discarded. The obtained pellet was washed 9 times
with 2.5 ml acetone containing 20 mM DTT (15 min, 4000 x g) to remove non-covalently
bound radioactivity. Subsequent liquid scintillation counting (Tri-Carb 2900 TR Liquid
Scintillation Analyzer) of the homogenate and the supernatants obtained during the
washing procedure showed a decreasing content of radioactivity until background levels
were achieved after the final washing step (Fig. 8). The washed protein pellet was
dissolved in 2 ml sample solution. However, if the pellet did not dissolve completely, the
solution was centrifuged again, the supernatant was transferred to a fresh tube, and the
pellet was discarded. The protein extract was aliquoted and stored at -80 °C.
HW
1W
3W
5W
7W
9
0
20000
40000
60000
80000
100000
Step
Rad
ioacti
vit
y [
dp
m/m
l]
Figure 8 Radioactivity [dpm/ml] present in the homogenate (H) and after the washing steps (W1-9). Radioactivity was determined by liquid scintillation counting of proteins extracted from livers of high dose animals (n=5). Values are expressed as mean +SD. Radioactivity decreased during the washing procedure until background levels were achieved. dpm = disintegrations per minute
6.2.3 Protein quantification
Since high concentrations of denaturating agents, detergents and reductants in the
sample solution are known to interfere with standard protein quantification methods
such as the Bradford assay, protein solutions were quantified using the 2D Quant Kit (GE
Healthcare). In brief, this protein quantification is conducted by quantitatively
precipitating the proteins, while the interfering substances stay in the supernatant. After
centrifugation, the supernatant is removed and the pellet is resolved in an alkaline
solution containing cupric ions, which bind to the protein backbone. The unbound rest of
the cupric ions reacts with a colorimetric agent (not further specified by the
manufacturer) that is added to the solution. Thus, the color density inversely correlates

32 IDENTIFICATION OF FURAN TARGET PROTEINS
with the amount of protein in the sample. The protein concentration in the sample can be
calculated using a BSA (bovine serum albumin) standard curve (Fig. 9).
Figure 9 Representative standard curve for protein quantification using the 2D Quant Kit. The higher the amount of protein present in the sample, the lower is the absorbance.
2D Quant Kit containing the following solutions:
Bovine serum albumin (BSA) standard solution (2 µg/µl)
Precipitant
Co-Precipitant
Copper solution
Working color reagent A
Working color reagent B
The composition of the solutions contained in the 2D Quant Kit is not further specified by
the manufacturer (GE Healthcare). All steps of the protein quantification were carried out
at room temperature. In the first step, the working color reagent was prepared (100 parts
of reagent A + 1 part color reagent B), from which 1 ml per sample was needed. Then, the
standard curve (0, 10, 20, 30, 40, 50 µg BSA) and the protein extracts (5 µl) were pipetted
into tubes. 500 µl precipitant were added to each tube, the samples were shortly
vortexed, incubated for 2 min at room temperature, and 500 µl co-precipitant was added.
After shortly vortexing, the samples were centrifuged at 15.000 rpm for 10 min
(Eppendorf Centrifuge 5403) and the supernatants were removed and discarded. The
samples were briefly centrifuged again with a mini-centrifuge (Microspin FV-2400) and
the remaining liquid was removed and discarded. 100 µl copper solution and 400 µl
y = -0,0077x + 0,8245R² = 0,9991
0
0,1
0,2
0,3
0,4
0,5
0,6
0,7
0,8
0,9
0 20 40 60
Absorb
ance
mg protein
Standard curve

IDENTIFICATION OF FURAN TARGET PROTEINS 33
deionized water were added to the pellet and the sample was vortexed until the pellet
dissolved completely. 1 ml working color reagent was added and the samples were mixed
immediately by inverting them several times. The samples were incubated for 20 min at
room temperature and the absorbance at 480 nm was measured using the UV/Vis
spectrophotometer Ultrospec 2000 and deionized water as blank reference. The protein
concentrations were calculated using a standard curve.
6.2.4 Liquid scintillation counting of protein extracts
In our study, furan labeled with 14C was used. 14C is a radioactive isotope of carbon whose
nucleus contains 6 protons and 8 neutrons. Through transformation of a neutron to a
proton and an electron in the nucleus, 14C decays to 14N with a radioactive half life of
5730 years, thereby emitting β- radiation.
To conduct liquid scintillation counting (LSC), a scintillation fluid was added to the sample.
In our studies, we used Rotiszint 22, a liquid scintillator based on toluene and Triton X-
100. In general, the essential components of a scintillation fluid are a solvent such as
toluene and a scintillator, e.g. 2,5-diphenyloxazole. The solvent collects the energy
emitted by 14C and transfers it to the scintillator molecules, which convert the absorbed
energy into light, thereby emitting photons with a characteristic wavelength. The
resulting signal is detected by a photomultiplier and displayed as disintegrations per
minute (dpm).
150 µl of the obtained protein extract were used for liquid scintillation counting. Rotiszint
22 (10 ml) was added to the sample and the sample was vortexed. LSC was conducted in a
Tri-Carb 2900 TR Liquid Scintillation Analyzer with a counting time of 10 min per sample.
Using the data obtained by protein quantification, the dpm values were then converted
into pmol furan equivalent/mg protein (furan equiv/mg protein).
Example:
Samples measured using LSC (mean): 15903 dpm = 265 Bq = 7164 pCi
Protein content in the samples (mean): 1254 µg protein
→ 5.7 pCi/µg protein
Specific activity of furan (20 pCi/pmol) → 5.7 pCi ≡ 0.286 pmol → 286 pmol/mg protein

34 IDENTIFICATION OF FURAN TARGET PROTEINS
6.2.5 Subcellular fractionation of the liver proteome
Since furan treatment was shown to result in elevated plasma levels of endogenous
metabolites normally excreted in bile such as cholesterol and bilirubin (Hamadeh et al.,
2004), it has been suggested that furan may interfere with hepatobiliary transport
mechanisms (2.2.2). Furthermore, it has been hypothesized that the underlying
mechanism of this interference may include covalent binding of furan reactive
metabolites to transport proteins located in the cell membranes of hepatocytes, which
may then result in impaired transport function of these proteins. To obtain a fraction
enriched with membrane proteins for improved detection of adducted membrane
proteins, subcellular fractionation of the liver proteome was conducted.
The FractionPREPTM Cell Fractionation Kit (Biocat) was used to obtain four subcellular
protein fractions (cytosolic, nuclear, membrane/particulate, and cytoskeletal fraction)
from each sample. This fractionation kit works on a principle similar to the differential
detergent fractionation (Ramsby et al., 1994). In the method described by Ramsby et al.
(Ramsby et al., 1994), the buffer for the first step contains the nonionic detergent
digitonin. Low digitonin concentrations (0.01-0.05 %) cause cell permeabilization and
release of cytosolic proteins, thereby not disrupting membranes of organelles such as
endoplasmic reticulum (ER) or mitochondrion. In the second step, a buffer including the
nonionic detergent Triton X-100 is used. When using isomolar and isotonic buffer
conditions and low concentrations of Triton (0.5 %), membrane and organellar proteins
are efficiently extracted, while nuclear integrity remains unaffected. The last extraction
step is conducted using a buffer which contains the non-ionic detergent tween-40 and the
anionic deoxycholate. An hypoosmotic and hypotonic buffer including tween-40 (1 %) and
deoxycholate (0.5 %) disrupts nuclear integrity and extracts nuclear proteins. The
remaining pellet contains the cytoskeletal proteins.

IDENTIFICATION OF FURAN TARGET PROTEINS 35
A workflow overview for subcellular fractionation using the FractionPREPTM Cell
Fractionation Kit is provided in Fig. 10.
10x PBS: 1g KCl, 41g NaCl, 2.86g Na2HPO4 x 2 H2O, 1g KH2PO4, deionized water
was added up to 500 ml, the pH was adjusted to 7.2
1x PBS: 10x PBS was diluted 1:10 with deionized water
FractionPREPTM Cell Fractionation Kit containing the following solutions:
Cytosol Extraction Buffer (CEB)
Membrane Extraction Buffer-A (MEB-A)
Membrane Extraction Buffer-B (MEB-B)
Nuclear Extraction Buffer (NEB)
DTT (1 M)
Protease Inhibitor Cocktail (PIC) dissolved in DMSO
TCA solution: 10 % TCA in acetone containing 20 mM DTT
Sample solution: 7M urea, 2M thiourea, 4 % CHAPS, 2 % IPG Buffer pH 3-11 NL,
and 40 mM DTT
Before starting, working solutions CEB-Mix (2.5 ml CEB + 5 µl PIC + 5 µl DTT), MEB-A-Mix
(2.5 ml MEB-A + 5 µl PIC + 5 µl DTT), and NEB-Mix (1.5 ml NEB + 3 µl PIC + 3 µl DTT) were
prepared.

36 IDENTIFICATION OF FURAN TARGET PROTEINS
Figure 10 Workflow for subcellular fractionation of proteins using FractionPREPTM
Cell Fractionation Kit. PBS = Phosphate Buffered Saline, CEB = Cytosol Extraction Buffer, MEB-A = Membrane Extraction Buffer-A, MEB-B = Membrane Extraction Buffer-B, NEB = Nuclear Extraction Buffer
Liver homogenization in 1x PBSCentrifugation: 10 min, 500 x g
Disposal of supernatant
Addition of 1x PBSCentrifugation: 5 min, 700 x g
Disposal of supernatant
Addition of 400 µl CEB-MixIncubation for 20 minCentrifugation: 10 min, 700 x g
Supernatant: cytosolic fractionAddition of 400 µl MEB-A-MixAddition of 22 µl MEB-BIncubation for 1 minCentrifugation: 5 min, 1000 x g
Supernatant: membrane/particulate fraction
Supernatant: nuclear fraction
Addition of 200 µl NEB-MixIncubation for 40 minCentrifugation: 10 min, 15000 rpm
Addition of 100 µl sample solutionIncubation for 2 hCentrifugation: 10 min, 15000 rpm
Supernatant: cytoskeletal fraction

IDENTIFICATION OF FURAN TARGET PROTEINS 37
During the procedure, buffers and samples were kept on ice. Unless stated otherwise, all
centrifugation steps were performed using an Eppendorf Centrifuge 5403 at 4 °C.
Frozen liver tissue (400 mg) was cut into small pieces, 1 ml ice cold 1x PBS was added, and
the tissue was homogenized in a manual tissue homogenizer. The homogenate was
transferred to a 15 ml tube and 1.5 ml ice cold 1x PBS was added to the sample. The
sample was centrifuged for 10 min at 500 x g (Megafuge 1.0R) and the supernatant was
discarded. The pellet was resuspended in 1 ml ice cold 1x PBS, transferred to an
Eppendorf tube, centrifuged for 5 min at 700 x g, and the supernatant was discarded.
CEB-Mix (400 μl) containing DTT and protease inhibitor cocktail was added to the pellet
and mixed well by pipetting up and down several times. The sample was incubated on ice
for 20 min with gentle tapping 3-4 times every 5 min and centrifuged for 10 min at 700 x
g. The supernatant representing the cytosolic fraction was collected in a clean and
prechilled tube and kept on ice. The pellet was resuspended in 400 μl of MEB-A-Mix
containing DTT and protease inhibitor cocktail by pipetting up and down several times
and vortexed for 15 seconds. Membrane Extraction Buffer-B (22 μl) was added. The
sample was vortexed for 5 seconds, incubated on ice for 1 minute, vortexed again for 5
seconds, and centrifuged for 5 min at 1000 x g. The supernatant representing the
membrane/particulate fraction was immediately transferred to a clean prechilled tube
and kept on ice. The pellet was resuspended in 200 μl of ice-cold NEB-Mix containing DTT
and protease inhibitor cocktail, vortexed for 15 seconds, and kept on ice for 40 min with
vortexing for 15 seconds every 10 min. The sample was centrifuged for 10 min at 15000
rpm. The supernatant representing the nuclear fraction was transferred to a clean
prechilled tube. The pellet representing the cytoskeletal fraction was dissolved in 100 μl
sample solution by pipetting up and down and vortexing several times. After incubation
for 2 hours on ice, the cytoskeletal fraction was again centrifuged for 10 min at 15000
rpm, the supernatant was transferred to a clean prechilled tube.
The proteins contained in the fractions were precipitated with TCA solution (volume 1+1)
overnight at -20 °C. The next day, the samples were centrifuged for 30 min at 4000 x g,
the supernatant was discarded, and the resulting pellet was dissolved in 450 µl sample
solution. The protein concentrations of all fractions were determined using the 2D Quant
Kit as described in 6.2.3. The fractions were stored at –80 °C until further use.

38 IDENTIFICATION OF FURAN TARGET PROTEINS
6.2.6 Two-dimensional gel electrophoresis (2D-GE)
6.2.6.1 Principle of two-dimensional electrophoresis
Proteins are amphoteric molecules and as such can be either positively or negatively
charged or carry no net charge, depending on the pH of the surrounding medium. Each
protein has a specific isoelectric point representing the pH value at which the net charge
of the protein is zero. If the protein is kept in a medium with a pH lower than its
isoelectric point, the side chains, the carboxylic terminus, and the amino terminus are
protonated and the protein carries a positive net charge. If the medium in which the
protein is dissolved has a pH higher than its isoelectric point, the proteins will be
negatively charged. During the first dimension of the two-dimensional gel
electrophoresis, proteins are separated according to their isoelectric points along a pH
gradient which is fixed in a gel strip, the Immobiline pH gradient (IPG) strip. This process is
called isoelectric focusing (IEF). After IEF, the IPG strips are equilibrated to the conditions
of the second dimension, which consists of a SDS-PAGE (sodium dodecyl sulfate-
polyacrylamide gel electrophoresis). SDS, an anionic detergent, denatures the proteins
and coats them with many negative charges, thus leading to unfolded and negatively
charged amino acid chains. During the second dimension of the two-dimensional gel
electrophoresis, the proteins are separated according to their molecular mass. Small
proteins move faster through the gel than big ones. At the beginning of the second
dimension, the proteins move out of the IPG strip into the SDS gel where the separation
process takes place. Fig. 11 depicts the different steps of the two-dimensional gel
electrophoresis.

IDENTIFICATION OF FURAN TARGET PROTEINS 39
Figure 11 Workflow for two-dimensional (2D) gel electrophoresis, modified from http://www.ucl.ac.uk/ich/services/lab-services/mass_spectrometry/proteomics/technologies/2d_page. During the isoelectric focusing (IEF), proteins are separated according to their isoelectric points using an immobiline pH gradient (IPG) strip. After equilibration, proteins are separated according to their molecular mass using SDS-PAGE (sodium dodecyl sulfate- polyacrylamide gel electrophoresis).
SDS-PAGE:In an electrical field, proteins are separated
according to theirmolecular weights
IEF:In an electrical field, proteins are separated
along a pH gradientaccording to theirisoelectric points
acidic basic
pH gradient
IPG strip
Protein extract
2D-gel after run
Equilibration of IPG strips
+
-
+
-

40 IDENTIFICATION OF FURAN TARGET PROTEINS
6.2.6.2 The first dimension of 2D-GE
In this work, isoelectric focusing was conducted using a Multiphor II electrophoresis unit
equipped with an additional frame (Immobiline Dry Strip Tray), a cooling unit (MultiTemp)
and a power supply (Electrophoresis Power Supply EPS 3500).
At first, IPG strips with a pH range of 3-11 NL (non-linear) were used in the first dimension
to obtain a broad range overview. In further experiments, IPG strips with narrow pH
ranges were used (pH 4-7 and pH 6-9) to improve resolution and to decrease the
streaking typically observed in the basic parts of the gel. Moreover, samples consisting of
either whole tissue extracts or membrane fractions were analyzed. Since the running
conditions depend on several factors, such as strip length and protein load, the processes
were optimized for each type of IPG strip (Tab. 7).
Table 7 Running conditions used for protein separation during the first dimension (isoelectric focusing). IPG = immobiline pH gradient
Samples IPG strip Amount of
protein loaded [µg]
Length of strip [cm]
Settings for the first dimension
Whole tissue protein extract
Immobiline DryStrip pH 3-11 non-linear
500 18 2 mA, 5 W, 20 °C
Step 1: 500 V, 1700 Vh Step 2: 500-3500 V, 1300 Vh
Step 3: 3500 V, 22 kVh Whole tissue
protein extract Immobiline DryStrip pH 4-7
900 18 2 mA, 5 W, 20 °C
Step 1: 500 V, 3 kVh Step 2: 3500 V, 33 kVh
Membrane fraction
Whole tissue protein extract Immobiline DryStrip
pH 6-9 500 18
2 mA, 5 W, 20 °C Step1: 150 V, 150 Vh Step 2: 300 V, 600 Vh Step 3: 600 V, 600 Vh
Step 4: 3500 V, 50 kVh
Membrane fraction
First dimension of pH 3-11 NL (non-linear)
Rehydration solution: 7M urea, 2M thiourea, 2 % CHAPS, 0.5 % IPG Buffer pH 3-11
NL, 20 mM DTT, 0.002 % bromophenol blue
DTT solution: 3 % (m/v) DTT in deionized water
Liver protein extracts containing the required amount of protein (Tab. 7) were diluted
with rehydration solution to a final volume of 360 µl and pipetted into the Immobiline
DryStrip Reswelling Tray. The dehydrated IPG gel strips (Immobiline DryStrip pH 3-11 NL)
were placed onto the protein solutions in the tray and, after adding a layer of Dry Strip
Cover Fluid to prevent drying of the strips, were left to rehydrate over night. The next

IDENTIFICATION OF FURAN TARGET PROTEINS 41
day, the strips were washed and blotted dry before they were placed on the cooling plate
of a Multiphor II system equipped with an Immobiline Dry Strip Tray, a temperature
control unit (MultiTemp) and a power supply (Electrophoresis Power Supply EPS 3500).
The strips were held in the right position by a strip aligner. To ensure an even flow of
current through all IPG strips and to improve the electrical conductivity between
electrodes and IPG strips, electrode strips were placed orthogonally on top of both sides
of the IPG strips. The electrode strip at the anodic side was soaked with deionized water.
For the cathodic electrode strip a 3 % DTT solution was used since DTT migrates to the
anode during the run of the first dimension, the IPG strip loses DTT, and the proteins are
at risk to oxidize and form disulfide bridges, which would alter their position in the IPG
strip. After setup of the system, the chamber with the IPG strips was filled up with Dry
Strip Cover Fluid to prevent drying of IPG strips. The running conditions applied for the pH
range 3-11 NL are shown in Tab. 7. After the run, the IPG strips were wrapped in Saran foil
and stored at -80 °C until further use.
First dimension of pH 4-7
Rehydration solution: 7M urea, 2M thiourea, 2 % CHAPS, 0.5 % IPG Buffer pH 4-7,
20 mM DTT, 0.002 % bromophenol blue
The first dimension of the pH 4-7 was conducted as described for pH 3-11 NL, the only
difference representing the pH range of the IPG Buffer used for preparation of the
rehydration solutions.
First dimension of pH 6-9
Rehydration solution: 7M urea, 2M thiourea, 4 % CHAPS, 0.5 % IPG Buffer pH 6-
11, 10 % isopropanol, 65 mM DTT, 0.002 % bromophenol blue
Sample buffer: 7M urea, 2M thiourea, 4 % CHAPS, 0.5 % IPG Buffer pH 6-11, 10 %
isopropanol, 85 mM DTT, 0.002 % bromophenol blue
IPG strips (Immobiline DryStrip pH 6-9) were rehydrated over night in 360 µl rehydration
solution using the Immobiline DryStrip Reswelling Tray. The next day, the amount of
sample containing 500 µg protein was diluted with sample buffer to a volume of 200 µl
and each sample was pipetted onto a large sample application piece (0.5 x 2.5 cm). The
rehydrated strips were placed on the cooling plate of a Multiphor II system equipped with

42 IDENTIFICATION OF FURAN TARGET PROTEINS
an Immobiline Dry Strip Tray, a temperature control unit (MultiTemp) and a power supply
(Electrophoresis Power Supply EPS 3500). The large sample application pieces containing
the samples were positioned on top of the anodic end of the rehydrated strips and fixed
with sample cups on a sample cup bar so that close contact between sample application
piece and IPG strip was assured. To ensure an even flow of current through all IPG strips
and to improve the electrical conductivity between electrodes and IPG strips, electrode
strips were placed orthogonally on top of the IPG strips. The electrode strip at the anodic
side was soaked with deionized water while for the cathodic electrode strip rehydration
solution was used. For isoelectric focusing of IPG strips with a pH range of 6-9, a specific
program was applied (Tab. 7).
6.2.6.3 Equilibration of IPG strips
Equilibration solution A: 6M urea, 75 mM Tris-HCl pH 8.8, 30 % glycerol, 2 % SDS,
0.002 % bromophenol blue, 65 mM DTT
Equilibration solution B: 6M urea, 75 mM Tris-HCl pH 8.8, 30 % glycerol, 2 % SDS,
0.002 % bromophenol blue, 135 mM IAA
IPG strips were left in equilibration solution A for 20 min followed by incubation in
equilibration solution B for 20 min. The strips were then air-dried for 6 min.
6.2.6.4 The second dimension of 2D-GE
After cooling the ceramic plate of the Multiphor II to 15 °C, 5 ml Dry Strip Cover Fluid was
poured onto the plate and the precast gel (ExcelGel SDS 2-D Homogeneous 12.5) and
buffer strips (ExcelGel SDS Buffer Strips) were positioned on top of it. The gel was left to
dry slightly for 30 min. The equilibrated IPG strip was laid face down onto the gel, trapped
air bubbles were removed, and small sample application pieces were placed underneath
each side of the strip in order to absorb water leaking from the IPG strip during the
process. A small sample application piece, which was cut to 1/4 of its original size, was
placed beside the IPG strip and was soaked with 5 µl of protein marker solution
(peqGOLD Prestained Protein-Marker IV, diluted 1:5). The Multiphor II was connected to
the power supply and in the first step 600 V, 20 mA, and 30 W were applied for 40 min.
After this step, the IPG strip and the sample application pieces were removed from the
gel and 600 V, 50 mA, and 30 W were applied for 60 to 75 min. The current was switched

IDENTIFICATION OF FURAN TARGET PROTEINS 43
off when the dye front had reached the anodic buffer strip, then the buffer strips were
removed and the gel was placed in a Rotho Clear Box for further treatment.
6.2.6.5 Coomassie Blue staining of 2D-gels
Fixing solution: 125 ml deionized water, 100 ml ethanol, 25 ml glacial acetic acid
Coomassie Blue solution: 120 ml deionized water, 40 ml methanol, 40 ml RotiBlue
(Carl Roth)
The gel was left in the fixing solution for 2 hours to prevent the proteins from further
migrating in the gel, washed for 10 min in deionized water and stained in the Coomassie
Blue solution over night. During the staining procedure, the dye associates with the basic
amino acid side chains of the proteins and thus stains the proteins unspecifically. The next
day, the gel was washed in deionized water for 10 min to remove the precipitated dye
and, after drying for some minutes, the gel was scanned on a HP ScanJet 5550C flatbed
scanner to obtain digital images.
6.2.7 Fluorography for the detection of radiolabeled protein spots
In the case of 14C, which emits low energy β-particles with a short path length, the
detection of signals from a polyacrylamide gel can be dramatically impaired by internal
absorption of the radiation by the gel matrix. Thus, signals are likely to be only
inefficiently detected by autoradiography. To overcome this problem, fluorography
instead of direct autoradiography was conducted in this study. Impregnation of the
polyacrylamide gel with the fluorographic reagent AmplifyTM (GE Healthcare) can improve
the sensitivity by more than 10-fold and can thus significantly reduce exposure times
required for the detection of 14C. Through impregnation of the polyacrylamide gel with
AmplifyTM, the scintillator contained in the fluorographic reagent comes in close contact
with the isotope, which can then transfer its energy to the scintillator molecules. After
absorption of the β-radiation, the scintillator converts the energy into light, which can
penetrate the polyacrylamide gel much further than the original β-particle and can
efficiently be detected by the radiographic film, forming an image on the adjacent region
of the film.
After impregnation, the gels need to be dried since the formation of ice crystals during
the exposure at -70 °C can distort the gel and decrease the resolution.

44 IDENTIFICATION OF FURAN TARGET PROTEINS
However, a disadvantage of fluorography is that photographic emulsions are
disproportionately insensitive to very low intensities of light, resulting in non-linear signal
generation on the film. The reason lies in the reversibility of the initial stage of latent
image formation in the film at room temperature. In order to yield a blackening signal
during development of the film, a silver halide crystal (grain) in the film emulsion must
accumulate several atoms of metallic silver, which then catalyze the reduction of the
entire silver halide grain (or large parts of it) to metallic silver during developing. A single
silver atom in a silver halide crystal is unstable and reverts to a silver ion with a half-life of
about one second, whereas two or more silver atoms in a grain are stable. While a single
hit by a β-particle has the ability to produce hundreds of silver atoms, a hit by a photon of
light can only yield one silver atom. Thus, each photon produces only one silver atom,
which means that the latent image can only accumulate when two photons are captured
by a grain within one second to produce a stable pair of silver atoms, which is quite
unlikely in the case of low intensities of light. If the temperature is lowered, the half-life
of the single silver atoms is increased, thus enhancing the probability for a second photon
to arrive in time to prevent the first silver atom from reverting to a silver ion and
stabilizing the grain. Therefore, the exposure of the film was conducted at -80 °C, which
was reported to greatly increase sensitivity of the film to very low intensities of light.
For impregnation, the gel was soaked for 30 min in 150 ml AmplifyTM to which 20 ml of
glycerol was added to prevent the gel from cracking during the following drying process.
The gel was dried at 70 °C for 2.5 hours under vacuum. After drying, the supporting foil
was peeled off and the gel was positioned in an autoradiography cassette (Hartenstein)
using adhesive strips. A Hyperfilm MP (GE Healthcare) was placed on the gel and the
cassette was stored at -80 °C for up to 28 weeks. After this time, the films were allowed
to warm to room temperature in order to avoid the formation of artifacts and were then
developed using Kodak X-OMAT 1000 Processor. Developed films were scanned on a HP
ScanJet 5550C flatbed scanner to obtain digital images.

IDENTIFICATION OF FURAN TARGET PROTEINS 45
6.2.8 Spot selection and spot picking for protein identification
For spot selection, the developed films were matched with the Coomassie Blue-stained
gel images (Fig. 12). Spots that occurred consistently on the fluorographic images of high
dose animals and corresponded to protein spots on the gel were determined and chosen
for protein identification. Protein spots corresponding to the spots on the film were cut
from the gels using a glass capillary (100 x 1.5 mm), and placed into 96-well plates.
Figure 12 Matched Coomassie Blue-stained gel (blue) and fluorographic image (colored in red for better visibility of the spots) obtained after separation of proteins over the pH range 4-7 (high dose). Several spots detected by fluorography correspond to Coomassie-Blue stained spots, indicating that these spots contain radiolabeled proteins.
6.2.9 In-gel tryptic digest of proteins
The tryptic digests and the following mass spectrometry analyses were conducted at the
laboratories of the Functional Genomics and Proteomics Unit (Q-TOF Ultima Global mass
spectrometer) and the Advanced Mass Spectrometry Facility (LTQ FT Ultra mass
spectrometer) at the School of Biosciences, University of Birmingham, United Kingdom, in
cooperation with the external collaborator J.K. Chipman.
Before analysis by mass spectrometry, the proteins present in the gel plugs were digested
into peptides. This step is required, because tryptic peptides can efficiently be extracted
from the gel and show a suitable length for electrospray ionization-mass spectrometry
(ESI-MS) analysis. Furthermore, tryptic peptides contain arginine or lysine, which are both
basic amino acids, at the C-terminus, thus enhancing ionization of the peptide for mass
spectrometry.

46 IDENTIFICATION OF FURAN TARGET PROTEINS
NH4HCO3 solution: 100 mM in HPLC grade water
1,4-Dithiothreitol (DTT) solution: 10 mM DTT in NH4HCO3 solution
Iodoacetamide (IAA) solution: 50 mM IAA in NH4HCO3 solution
Trypsin stock solution: 100 µg lyophilized trypsin (Trypsin Gold, Promega) is
dissolved in 925 µl acetic acid (50mM)
Trypsin solution: 46 µl trypsin stock solution, 360 µl NH4HCO3 solution, 400 µl
HPLC grade water
Extraction solution A: 53 µl formic acid, 100 µl acetonitrile, filled up to 5 ml with
HPLC grade water
Extraction solution B: 53 µl formic acid, 2 ml acetonitrile, filled up to 5 ml with
HPLC grade water
Resuspension solution: 53 µl formic acid, 250 µl acetonitrile, filled up to 5 ml with
HPLC grade water
Tryptic digest was conducted at room temperature using a Qiagen BioRobot 3000. The
values given in the protocol are the amounts of liquid used per well, i.e. per gel plug. The
96-well plate containing the picked gel plugs was centrifuged for 3 min at 1000 x g (Sigma
4-15C) to bring the plugs to the bottoms of the wells. The cover foil was removed and the
plate was positioned on the right plate shaker in the robot. The robot was controlled by
the software Qiasoft4. The program was started and the robot conducted the pipetting
steps as follows: The gel plugs were destained by first adding 60 µl acetonitrile and
incubating for 5 min. After the liquid was removed, 50 µl acetonitrile and 50 µl NH4HCO3
solution were added and the plate was incubated for 10 min. The liquid was discarded
and the gel plugs were washed twice with 50 µl NH4HCO3 solution. To dehydrate the gel
plugs, 10 µl acetonitrile was added and the plate was incubated for 15 min. After removal
of the liquid and addition of 50 µl NH4HCO3 solution to rehydrate the gel plugs, the plate
was incubated for 10 min. Then again, dehydration was achieved by adding 10 µl
acetonitrile and incubating for 15 min. The liquid was discarded and the gel plugs were
dried in the Eppendorf concentrator 5301 for 45 min at 45 °C. After drying, the plate was
again placed in the robot, 25 µl DTT solution was added to reduce protein disulfide bonds,
and the plate was left on a heating block for 15 min at 60 °C. The plate was placed in the
robot and left to cool for 5 min. The DTT solution was removed and 25 µl IAA solution was
added to alkylate the thiol groups of the proteins, thus preventing the formation of

IDENTIFICATION OF FURAN TARGET PROTEINS 47
disulfide bonds. The plate was kept in the dark for 45 min and the IAA solution was
discarded. The gel plugs were washed with 25 µl NH4HCO3 solution and dehydrated,
rehydrated, and again dehydrated as described above. The plate was removed from the
robot, dried in the Eppendorf concentrator 5301 at 45 °C, and placed back in the robot.
Trypsin solution (20 µl) was added and the plate was incubated for 20 min so that the gel
plugs could soak up the trypsin solution. NH4HCO3 solution (20 µl) was added and the
plate was incubated over night at 37° C. After placing the plate back in the robot the next
day, 30 µl extraction solution A was added and the plate was incubated for 30 min. The
solution was transferred into the corresponding wells of a fresh plate, 12 µl extraction
solution B and 12 µl acetonitrile were added to the original plate and the plate was
incubated for 30 min. The solution was then added to the wells of the fresh plate and the
fresh plate was dried in the Eppendorf concentrator 5301 at 45 °C, while the original plate
was discarded. 10 µl resuspension solution was added and the samples were stored at -80
°C for further analyses.
6.2.10 Mass spectrometry
The first set of samples from the pH range 4-7 (whole tissue extract) was measured on a
Q-TOF Ultima Global mass spectrometer. The second set of samples, i.e. the samples from
the pH range 6-9 (whole tissue extract) and from the pH range 4-7 (membrane fraction),
was analyzed using a LTQ FT Ultra mass spectrometer, because the Q-TOF Ultima Global
mass spectrometer was out of service. To confirm the results obtained by the Q-TOF
Ultima Global mass spectrometer, selected samples from the pH range 4-7 (whole tissue
extract) were reanalyzed using the LTQ FT Ultra mass spectrometer.
Before the peptides extracted from the gel plugs were subjected to mass spectrometry,
they were separated by liquid chromatography to make the mixture less complex.
6.2.10.1 Electrospray ionization (ESI)
In both cases, an electrospray ionization (ESI) source was used to produce positively
charged peptide ions, which were online transferred into the mass analyzer.
Predominantly, ESI leads to the formation of doubly charged peptide ions, but if the
peptide consists of more than 15 amino acids or includes several amino acids with basic
residues, such as lysine, arginine, and histidine, it can also carry three or more charges.

48 IDENTIFICATION OF FURAN TARGET PROTEINS
ESI is a gentle ionization method and causes only slight fragmentation of the ionized
peptides. Weak acids support the formation of positively charged molecules and organic
solvents support the spray formation. Thus, the mobile phase used for separation of the
peptides by liquid chromatography before mass spectrometry analysis (6.2.10.3 and
6.2.10.5) consisted of a mixture of 0.1 % formic acid in HPLC grade water and 0.1 % formic
acid in acetonitrile.
During introduction of the sample into the mass spectrometer via a capillary, a very high
voltage is applied and the peptides in the mobile phase become charged. Since all the
peptides carry one or more positive charges, they strongly repel each other. Thus, the
solvent containing the peptides forms a cone shape (Taylor cone), before it is dispersed
into a fine spray. After entering the evaporation chamber, the solvent in these small
droplets gradually evaporates with the help of the nebulizer gas nitrogen and the positive
charges in the droplet are forced closer to each other. When the repelling Coulomb force
exceeds the surface tension of the solvent, the formation of even smaller droplets occurs
repeatedly until the solvent is completely evaporated and the charged peptide molecules
are introduced into the mass analyzer.
6.2.10.2 QTOF mass spectrometry
QTOF mass spectrometers are very suitable for the determination of peptide masses,
because they show high resolution over a wide m/z range.
The acronym QTOF stands for quadrupole time-of-flight and describes the kind of mass
analyzer that is used for the determination of peptide masses (Fig. 13). Before entering
the QTOF analyzer, the ions from the source pass two cones and are accelerated using an
electrical field, thereby gaining a specific speed, which depends on their m/z ratio, for
every type of ion. In the next step, the accelerated ions pass a quadrupole and a hexapole
and then enter a field-free vacuum tube (= time-of-flight analyzer), which is arranged
orthogonally to the trajectory of the ions. In MS mode, the first quadrupole can be used
as an ion guide, while in MS/MS mode it can act as a precursor mass selector, filtering out
the peptide ions that are further fragmented in the collision cell (hexapole). The charged
ions from either MS or MS/MS mode are directed orthogonally into the tube while
neutral and solvent molecules are lost. The ions in the tube are redirected by a special
reflector plate, which doubles the path length in the tube and improves resolution. The

IDENTIFICATION OF FURAN TARGET PROTEINS 49
time, which the ions need to fly through the tube until they reach the detector
(photomultiplier), is measured and with this information, the masses of the ions can be
calculated.
Figure 13 Time-of-flight tube showing separation of ions according to their time of flight and signal focusing through a reflector, modified from (Rehm, 2006).
6.2.10.3 Peptide analysis using the Q-TOF Ultima Global mass spectrometer
Solvent A: 0.1 % formic acid in HPLC grade water
Solvent B: 0.1 % formic acid in acetonitrile
After the tryptic digest, peptide extracts were analyzed on a Q-TOF Ultima Global mass
spectrometer connected with a Waters capillary HPLC system (CapLC pump). 5 µl of
sample was injected by a Waters autosampler and run on a LC Packings column (15 cm/75
µm C18, 3 µm, 100 Å) with a 45 min gradient, consisting of 7 % to 90 % solvent B in 38
min followed by 6 min 7 % solvent B, and a flow rate of 4 µl/min to separate the peptides.
The sample was inserted into the mass spectrometer via a Waters ESI source with
capillary voltage 3.0-3.5 kV, cone voltage 80-100 kV, source temperature 80 °C and the
nebulizer gas nitrogen. The mass spectrometer was controlled by the software Masslynx
4.0 and altered between a full scan (m/z 400-1800, positive ion mode) and subsequent
Collision-Induced Dissociation (CID) MS/MS scans of the three most abundant ions with
charges of 2+ or 3+ (resolution 10,000 over 50-2000 m/z). The collision gas argon had a
collision energy of 10 eV for MS and 32 eV for MS/MS mode. Weekly calibrations with the
+ +
++
+
+
+
+
++++
+
+
+
+
Detector
Reflector
Acceleration of ions in an electrical field before theyenter the field-free tube
Vacuum
+ -++
++
+
+
+
+
Separation according to time of flight

50 IDENTIFICATION OF FURAN TARGET PROTEINS
standard peptide [Glu1]-Fibrinopeptide and daily control samples of MassPREPTM
Digestion Standard Enolase assured the proper function of the mass spectrometer.
After the analyses were completed, the software Masslynx 4.0 converted the information
obtained through the MS and MS/MS spectra into monoisotopic peak lists and produced
data files containing this information in a compressed form. These data files were then
directly uploaded into the Mascot search engine to determine the amino acid sequences
of the peptides and to identify proteins from which the peptides may be derived. For the
Mascot search (MS/MS Ions Score) the following settings were used: database: MSDB,
enzyme: trypsin, up to 2 missed cleavages allowed, taxonomy: rattus, fixed modifications:
Carbamidomethyl (C), variable modifications: Oxidation (M), peptide tolerance ± 2 Da,
MS/MS tolerance ± 0.8 Da, peptide charge 2+ and 3+, monoisotopic peak list, data
format: micromass (.pkl), instrument: ESI-QUAD-TOF.
6.2.10.4 FT-ICR mass spectrometry
For parts of this study, the LTQ FT Ultra mass spectrometer was used for peptide
analyses. The LTQ FT Ultra represents a hybrid mass spectrometer, which combines Ion
Trap and Fourier Transform Ion Cyclotron Resonance (FT-ICR) technologies into a single
instrument and is able to analyze masses with very high accuracy, ultra high resolution (>
750,000), and attomole sensitivity.
The ionized molecules from the ESI source are funneled into the analyzer cell (Fig. 14)
with the use of an ion guide. The cell is located in the center of a superconducting
magnet. Ions entering the cell begin to circle the magnetic field, thereby describing tiny
orbits. While the radius of the orbit is the same for all ions, the speed of the flying ions
depends on their mass and thus all ions with the same mass travel at the same speed
around the orbits, which is called their cyclotron frequency. The lighter ions are faster
than the heavier ones and therefore have higher cyclotron frequencies. This is the
criterion how the machine will eventually differentiate between the various ions. With
increasing power of the magnet and thus enhanced strength of the magnetic field, not
only the cyclotron frequencies themselves increase, but also the differences between the
ICR frequencies, thus making it easier to differentiate between various types of ions with
different masses, i.e. the stronger the magnetic field is, the better a resolution can be
obtained.

IDENTIFICATION OF FURAN TARGET PROTEINS 51
Ions of the same mass travelling at the same speed have to be focused in order to
measure them. When the ions inside the cell pass the detector plates close enough to the
electrodes on each plate, a flow of negatively-charged electrons (equal in charge to the
packet) is induced and can be measured in the connected electric circuit outside the cell.
However, without excitation the ions travel on orbits too small (0.1 millimeter) for them
to reach the detection plates. Using an external circuit connected to the excitation plates,
a series of oscillating radio frequency pulses (chirp) is transferred to the excitation plates.
Each chirp excites only the one mass-type of ions whose particular cyclotron frequency
corresponds to the chirp. The chirps start at a low frequency, which is increased with
time, and thus the heavier ions will respond first. The ions absorb the additional energy
from the radiofrequency pulse and use it to increase the size of their orbits. Travelling on
the new and bigger orbits, the ions are focused into a "packet" and come close enough to
the electrodes on the detector plates to induce a signal without crashing into the walls of
the cell.
Once the ions have induced a signal at an electrode, they continue on their orbit and
circle back toward the electrode at the opposite side, where they also induce a flow of
electrons. These currents in the external circuit are measured by a resistor. When the ion
packets have reached their biggest orbits and the radio frequency chirp is removed, the
packets lose their energy and spiral back down to the original orbit, thereby inducing
gradually less current. The machine detects the decay of the orbits over time while it
simultaneously measures the packets corresponding to all the masses in the sample, a
process which takes about one second.
After amplification and digitalization of the voltages measured in the external circuit, a
signal composed of all of the cyclotron frequencies of all of the ions present is obtained.
In order to acquire readable signals from raw data, a mathematical algorithm called
Fourier transform is applied, which shows the amplitude of each of the different
frequencies detected. This amplitude corresponds to the number of ions associated with
that frequency. Finally, the results of the Fourier transform are translated to produce a
mass spectrum.

52 IDENTIFICATION OF FURAN TARGET PROTEINS
Figure 14 Schematic setup of an analyzer cell as used for Fourier Transform-Ion Cyclotron Resonance (FT-ICR) mass spectrometry. Figure modified from http://www.magnet.fsu.edu/education/tutorials/magnetacademy/fticr/.
6.2.10.5 Peptide analysis using the LTQ FT Ultra mass spectrometer
Solvent A: 0.1 % formic acid in HPLC grade water
Solvent B: 0.1 % formic acid in acetonitrile
The digested samples (5 µl) were injected into a system consisting of a Micro AS
autosampler, a Surveyor MS pump, an Integrafrit column (10 cm/ 75 µm, C8), a TriVersa
NanoMate (ESI) source and a LTQ FT Ultra mass spectrometer. For the separation of the
peptides, a linear gradient with a flow rate of 300 nl per minute was used during which
the fraction of solvent B was increased from 5 % to 40 % in 40 min. The nanospray source
sprayed the eluted peptides into the mass spectrometer using a voltage of +1.7 kV. Data
acquisition by data-dependent scanning in the mass spectrometer was performed under
control of the Xcalibur 2.0.7 software. The mass spectrometer conducted a full FT-MS
scan (m/z 380-2000) followed by Collision-Induced Dissociation (CID) MS/MS scans of the
three most frequent ions.
The CID MS/MS data were uploaded into the in-house Mascot search engine to
determine the amino acid sequences of the peptides and to identify proteins from which
the peptides may be derived. For the Mascot search (MS/MS Ions Search), the following
Data Output
Radio frequency
source
Amplifier
Excitationplates
Detectorplates
Resistor
Ions

IDENTIFICATION OF FURAN TARGET PROTEINS 53
search parameters were used: database: NCBInr, enzyme: trypsin, up to 3 missed
cleavages allowed, taxonomy: rattus, fixed modifications: Carbamidomethyl (C), variable
modifications: Acetyl (K), Deamidated (NQ), Oxidation (M), Phospho (ST), Phospho (Y),
peptide tolerance ± 20 ppm, MS/MS tolerance ± 0.5 Da, and the error tolerant search was
not used.
6.2.10.6 Protein identification with the Mascot search engine
During CID, the peptides break at various sites and thus disintegrate into smaller
fragments. Although breaking of the amino acid side chains can also be observed,
cleavage mainly occurs at the peptide backbone. Depending on whether the charge
remains at the N-terminus or at the C-terminus, the ions are called a, b, c fragment ions
or x, y, z fragment ions (Fig. 15), respectively. When the peptide bond is cleaved, b and y
fragment ions occur and these ion pairs are the most important ones for the identification
of a peptide's amino acid sequence. The number in the index of the fragment ion
corresponds to the number of amino acids contained in the fragment ion. The localization
of the charge and the preferred position of the cleavage depend on the amino acid
sequence of the peptide.
Figure 15 Possible cleavage sites of a peptide during MS/MS fragmentation. Despite possible breaking of amino acid side chains, cleavage mainly occurs at the protein backbone. Depending on whether the charge remains at the N-terminus or at the C-terminus, the ions are called a, b, c fragment ions or x, y, z fragment ions, respectively. For subsequent database search, b- and y-ions are the most important ones. Figure modified from http://www.matrixscience.com/help/fragmentation_help.html.
For MS/MS Ions Search using Mascot search engine (www.matrixscience.com), the
monoisotopic peak lists and spectra contained in the data files or in the raw data were
directly uploaded into the online search engine or into the in-house search engine at the
University of Birmingham, respectively. By comparison of theoretical mass values present
C C NH2N
H
OR1
H
C C N
H
OR2
H
C C N
H
OR3
H
C COOH
R4
H
a1 b1 c1 a2 b2 c2 a3 b3 c3
x3 y3 z3 x2 y2 z2 x1 y1 z1 H+
54 IDENTIFICATION OF FURAN TARGET PROTEINS
in the database with experimentally determined masses, the Mascot search engine
assigns the peaks to the various fragments, thus revealing the amino acid sequence of the
peptide.
The Mascot search engine applies a scoring system based on the Mowse score, which can
be calculated for each entry by giving a certain statistical weight to each match according
to an empirically determined frequency factor matrix. Mascot combines the Mowse score
with a probability based scoring system and reports a "probability based Mowse score"
for each peptide (= ions score) on the results page shown after the search. This
probability based Mowse score represents the absolute probability that the obtained
match occurred at random. The probability is transformed into the score using the
equation -10*LOG10(P) (with P being the probability) and thus a high score stands for a
high probability that the hit is not a random event. Using the probability and the known
size of the searched database, Mascot calculates the minimum score that is needed for a
hit to be a significant match (p < 0.05) and shows this confidence threshold on the results
page for every peptide. If the peptide has an ions score higher than the confidence
threshold, this indicates that the experimentally determined peptide is identical or
extensively homologous to the peptide in the database.
However, the protein scores which are reported for every protein match, as opposed to
the ions scores reported for every peptide match, represent the combined ions scores of
all peptides that are assigned to a single protein. The more peptides are assigned to a
protein hit, the higher the protein score is. The protein score functions as a non-
probabilistic basis for ranking protein hits. Also for the protein scores, a threshold is given
on the results page, which gives a clue as to which proteins are the most probable hits. If
a hit has a protein score higher than this threshold, this also indicates that the protein is a
significant hit (p<0.05).
In our study, the protein score thresholds were in the range of 35-36 or 29-43 for samples
measured with Q-TOF Ultima Global mass spectrometer or LTQ FT Ultra mass
spectrometer, respectively.
Besides the scores, further important information needed to determine whether a match
is accepted as an identified protein, can also be obtained by Mascot. This information
includes the number of peptides assigned to a protein and the sequence coverage.

IDENTIFICATION OF FURAN TARGET PROTEINS 55
It often happens that a peptide occurs several times on the results list. This can be due to
different charge states or various modifications. To obtain the number of peptides
assigned to one protein, only unique peptide sequences were counted. This means that if
a peptide sequence occurs three times in the peptide list with different modifications or
charges, it was only counted as one peptide. The minimal number of peptides assigned to
one protein should be at least 2 since finding only a single peptide matched to a protein
strongly increases the risk of a false-positive protein assignment (Nesvizhskii and
Aebersold, 2004).
The sequence coverage is the percentage of the protein sequence for which matching
peptides were detected. The higher the sequence coverage is, the more of the amino acid
sequence was confirmed by the analyses. The ideal case of 100 % protein coverage has
already been obtained (Meyer et al., 2010), but only after special sample preparation,
which included digests with different enzymes to obtain many peptides with various
cleavage sites. In standard high-throughput screening workflows, only cleavage with the
enzyme trypsin is conducted. Thus, only reduced sequence coverages are obtained. A
further factor contributing to limited sequence coverage may be the amino acid
composition and thus the hydrophobicity of peptides in connection to the ionization
technique applied. It was observed that for small and hydrophobic peptides ESI is the
preferred ionization method, whereas basic and polar peptides are better detectable
using MALDI (Meyer et al., 2010). Moreover, the amount of sample available for analysis
can influence the sequence coverage. It is possible that proteins in the gel plugs excised
from the gels are not properly digested or extracted from the gel plugs and hence the
amount of peptides available for analysis is reduced.
However, reduced sequence coverage does not prevent the reliable identification of a
protein. In studies using similar high-throughput screening approaches to identify target
proteins of reactive metabolites, sequence coverages of 5-57 % (Dooley et al., 2008), 11-
83 % (Koen et al., 2007), and 4-39 % (Druckova et al., 2007) were obtained. There are no
fixed rules as to how the sequence coverage should be to get definitive protein
identification. In our study, we used a cut-off of 10 % sequence coverage in an attempt to
exclude proteins identified with a low level of confidence.
To obtain the target protein list for our study, in the first step all proteins with protein
scores higher than their protein score thresholds were listed. Then, all protein hits

56 IDENTIFICATION OF FURAN TARGET PROTEINS
consisting of only one peptide hit and/or showing less than 10 % sequence coverage were
excluded. Since only highly consistent proteins should be subjected to the subsequent
functional analysis, only proteins found in all three high dose animals were picked for the
target protein list. In summary, in our study a protein was regarded as identified if
detected in all high dose animals (n=3), each with a protein score above the confidence
threshold, a sequence coverage of at least 10 % based on at least 2 identified peptides.
The online database Protein Knowledgebase (UniProtKB; http://www.uniprot.org/) was
used to gain further information on the proteins, such as protein family, function and
subcellular localization.
As an example to illustrate how data obtained by mass spectrometry were processed, the
peptide CLLFVDIPSK, which was assigned to the protein regucalcin, is used. Fig. 16 depicts
the MS/MS spectrum of the peptide. Tab. 8 shows the fragment masses that may
theoretically be found after CID fragmentation, while the ions that were actually observed
are marked in red. The more complete the fragment series are, predominantly the b and
y series, the more information on the peptide sequence is present and the better the ions
score is. In our example, it is clearly visible that a, b, and y fragment ions were detected
and that the b-y series is nearly complete. Thus, the amino acid sequence of the peptide
can be determined. In this example, a peptide from the protein regucalcin, the results
page showed that an ions score > 33 indicates identity or extensive homology (p < 0.05).
Considering this confidence threshold, the peptide with an ions score of 75 represents a
significant hit.

IDENTIFICATION OF FURAN TARGET PROTEINS 57
Figure 16 MS/MS spectra of the peptide CLLFVDIPSK belonging to the protein regucalcin. The detected peaks are assigned to a-, b-, and y-ions. The number in brackets correspond to the number of amino acids contained in the fragment ion.
Table 8 All a-, b-, and y-fragment ions of the peptide CLLFVDIPSK that can theoretically be obtained by MS/MS are listed in the table. Fragments that were actually found in the analysis are marked in red.
# a a++ b b++ Sequence y y++ y* y*++ #
1 133.0430 67.0251 161.0379 81.0226 C
10
2 246.1271 123.5672 274.1220 137.5646 L 1031.6136 516.3104 1014.5870 507.7971 9
3 359.2111 180.1092 387.2061 194.1067 L 918.5295 459.7684 901.5029 451.2551 8
4 506.2796 253.6434 534.2745 267.6409 F 805.4454 403.2264 788.4189 394.7131 7
5 605.3480 303.1776 633.3429 317.1751 V 658.3770 329.6921 641.3505 321.1789 6
6 720.3749 360.6911 748.3698 374.6886 D 559.3086 280.1579 542.2821 271.6447 5
7 833.4590 417.2331 861.4539 431.2306 I 444.2817 222.6445 427.2551 214.1312 4
8 930.5117 465.7595 958.5067 479.7570 P 331.1976 166.1024 314.1710 157.5892 3
9 1017.5438 509.2755 1045.5387 523.2730 S 234.1448 117.5761 217.1183 109.0628 2
10
K 147.1128 74.0600 130.0863 65.5468 1
In the case of our example, 30 peptides were assigned to regucalcin, 19 of which
represented significant hits, i.e. had ions scores higher than their respective confidence
thresholds. This led to a very high protein score of 1263, which is by far higher than the
range of protein score threshold of 29-43 for samples measured with the LTQ FT Ultra

58 IDENTIFICATION OF FURAN TARGET PROTEINS
mass spectrometer, and a very high sequence coverage of 86 %. Thus, regucalcin is
identified with very high confidence.
6.2.11 Autoradiographic analysis of furan distribution in rat liver after oral administration
3 Male Fischer F344/N rats (140-170 g on arrival, Harlan-Winkelmann GmbH, Borchen,
Germany) were housed at standard laboratory conditions (climate cabinets, temperature
22 ± 2 °C, relative humidity 30-70 %, 12-15 air changes per hour, 12 hour light/dark cycle)
in Makrolon® type-4 cages with wire meshtops and standard softwood bedding. Rats
received pelleted standard rat maintenance diet and tap-water ad libitum. After
acclimatization, animals received a single oral dose of [3,4-14C]-furan (0.8 mg/kg bw;
specific activity 20 mCi/mmol) in corn oil (4 ml/kg bw) by gavage. Rats were sacrificed 2
hours after administration by cardiac puncture under CO2 anesthesia and livers were
removed and mounted without disrupting the anatomical order on a precast base of
frozen Tissue-Tek® O.C.TTM Compound, which was placed in a cube formed of aluminum
foil. After documentation of the liver position on the base, the cube was filled up with
Tissue-Tek® O.C.TTM Compound and frozen at -20 °C to yield a solid block in which the
liver was embedded. The tissue block including the liver was cut into slices, which were
mounted on plastic foil. The liver slices were dried under vacuum at -70 °C and were
placed into an autoradiography cassette. A Hyperfilm MP was placed onto the dried slices
and the cassette was kept at -80 °C for two weeks. After the exposure time, the film was
developed and scanned on a HP ScanJet 5550C flatbed scanner to obtain digital images.
6.3 Results and discussion
6.3.1 Determination of covalent binding of furan to proteins
To determine covalent binding of furan to proteins, the radioactivity contained in the
protein extracts isolated from liver and kidney tissue was determined by liquid
scintillation counting. Following treatment with [3,4-14C]-furan, a dose-dependent
increase in the amount of radiolabeled furan covalently bound to proteins was observed
in both target (liver) and non-target (kidney) tissue of furan carcinogenicity (Tab. 9). In the
high dose group (2 mg/kg bw), protein binding in the liver was 286 ± 25 pmol furan
equiv/mg protein, a level of protein adduction roughly three times higher than measured
in kidney (88 ± 49 pmol furan equiv/mg protein). The difference between target and non-

IDENTIFICATION OF FURAN TARGET PROTEINS 59
target organ was even more pronounced in the low dose group (0.1 mg/kg bw) in which
29 ± 7 pmol furan equiv/mg protein (liver) and 3 ± 1 pmol furan equiv/mg protein (kidney)
were measured.
Thus, the level of covalent adducts in livers of rats given a single dose of [3,4-14C]-furan,
which is not expected to cause significant hepatotoxicity (Mally et al., 2010), was about
1/3 of what is typically observed following treatment with a dose of a prototypical drug
inducing hepatocellular necrosis (1 nmol drug equiv/mg protein) (Evans et al., 2004) and
indicates for a 25 kDa protein an average labeling density of approximately 0.01 adducts
per molecule of protein (Ikehata et al., 2008).
Table 9 Amount of furan equivalents covalently bound to proteins in target and non-target tissue of furan carcinogenicity following treatment of rats with [3,4-
14C]-furan. Data are expressed as mean ± SD
(n=5). The amount of furan bound to proteins increased with increasing dose in both organs, but was higher in liver than in kidney tissue.
Dose group (mg/kg bw)
14C-furan bound to proteins in rat liver (pmol furan equiv/mg protein)
14C-furan bound to proteins in rat kidney (pmol furan equiv/mg protein)
0 0 ± 0 0 ± 0
0.1 29 ± 7 3 ± 1
2.0 286 ± 25 88 ± 49
6.3.2 Identification of target proteins of reactive furan metabolites
Two-dimensional gel electrophoresis and fluorography
Using wide range IPG strips (pH 3-11), separation of unmodified and furan-adducted
proteins from whole liver extracts by two-dimensional gel electrophoresis and
subsequent detection by fluorography (exposure ≥ 10 weeks) revealed highly consistent
spot patterns of adducted proteins in all high dose animals (Fig. 17). However, the
resolution of the protein spots was not satisfying and streaking occurred to a great extent
in the basic part of the gel. Thus, to improve spot resolution and facilitate spot picking for
subsequent analysis by mass spectrometry, narrow range IPG strips (pH 4-7 and pH 6-9)
were used and optimized independently. This procedure led to gel images with better
resolution and less streaking in both narrow pH ranges (Fig. 18).
Furthermore, subcellular fractionation was conducted and membrane fractions were
analyzed in addition to total liver extracts. This was done since it had been hypothesized

60 IDENTIFICATION OF FURAN TARGET PROTEINS
that furan reactive metabolites may bind to transport proteins located in the canalicular
membrane of hepatocytes, resulting in disruption of membrane integrity and/or
interference with hepatobiliary transport (6.2.5).
Figure 17 Images of a representative Coomassie Blue-stained gel (A) and fluorographic film images (B-F) obtained from 5 different rats treated with 2 mg/kg bw furan. Modified and unmodified proteins were separated by two-dimensional gel electrophoresis (pH range 3-11, whole liver extract) and adducted proteins were detected by fluorography. Spot patterns appeared to be consistent in all animals, but strong streaking in the basic part (right side) of the gels made spot selection difficult.
A
C D
F
B
pH 3 pH 11
E

IDENTIFICATION OF FURAN TARGET PROTEINS 61
Figure 18 Using narrow range pH ranges, improved spot resolution and reduced streaking in the basic pH range was obtained. Representative images shown are Coomassie Blue-stained gel images obtained after separation of proteins over a broad (A: pH 3-11) and two different narrow pH ranges (B: pH 4-7, C: pH 6-9) with their corresponding fluorographic film images (D, E).
As expected, no spots were observed on fluorographic films prepared from control
animals (Fig. 19). In contrast, a total of 83 radioactive spots were consistently detected in
high dose animals (Fig. 20) and were selected for identification by mass spectrometry. 37,
15, and 31 of the 83 spots were detected after separation of modified and unmodified
proteins by two-dimensional gel electrophoresis using pH ranges 4-7 (whole tissue
homogenate,), 6-9 (whole tissue homogenate), and 4-7 (membrane fraction),
respectively. On the fluorographic films obtained from the pH range 6-9 (membrane
fraction) only very few spots were detected in proteins isolated from a single animal.
Thus, these few spots were excluded from further identification.
pH 3 pH6 pH 11
Improved spot resolution
Reduced streaking in the
basic pH range
B C
D E
A
pH 4 pH 7 pH 6 pH 9

62 IDENTIFICATION OF FURAN TARGET PROTEINS
Figure 19 Representative fluorographic film image obtained from a control animal (pH range 4-7, whole tissue extract, 26 weeks exposure time). As expected, no spots derived from radioactively labeled proteins were observed.
Figure 20 Representative film images obtained from high dose animals. The top (A, D), middle (B, E), and bottom (C,F) row each show two representative film images of whole tissue extract (pH range 4-7), whole tissue extract (pH range 6-9), and membrane fraction (pH range 4-7), respectively. The spot patterns of A and D, B and E, and C and F show high consistency.
Protein identification by mass spectrometry
Analysis of the selected spots using Q-TOF Ultima Global mass spectrometer (QTOF) and
LTQ FT Ultra mass spectrometer (FT-ICR) followed by a Mascot database search identified
61 proteins as putative targets of furan reactive metabolites (Tab. 10 and Fig. 21). A
protein was regarded as identified if it was detected in all high dose animals (n=3), in each
case showing a sequence coverage of at least 10 % and the identification of at least 2
peptides. Since the spots were analyzed using two different mass spectrometers with the
FT-ICR being far more sensitive and accurate than the QTOF, the overall protein scores,
sequence coverages, and peptide numbers obtained by the FT-ICR were higher than the

IDENTIFICATION OF FURAN TARGET PROTEINS 63
ones observed during analysis with the QTOF. For this reason, some spots for which
insufficient sequence coverage was obtained with QTOF were confirmed by repeating
mass spectrometry analysis using the FT-ICR. For instance, in the case of thioredoxin-1,
analyses using the QTOF yielded a maximum of only two peptides (21 % sequence
coverage) assigned to the protein whereas using the FT-ICR 8 peptides (65 % sequence
coverage) of the protein could be detected.
Figure 21 Putative furan target proteins identified by mass spectrometry following separation by two-dimensional gel electrophoresis and detection by fluorography. EBP50 = ezrin-radixin-moesin-binding phosphoprotein 50
Heat shock cognate 71 kDa protein
Long-chain-fatty-acid-CoA ligase 1β-Actin/γ-Actin
Malate dehydrogenaseβ-Actin/γ-Actin
Protein SEC13 homologRegucalcinATP synthase β subunitPpa1 protein
β-Actin/γ-Actin
Fructose-1,6-bisphosphatase 1
α2μ-Globulin
Fibrinogen γ chain
Keratin, type II
cytoskeletal 8
α-Enolase
3-Mercaptopyruvate sulfurtransferase
Triosephosphate isomerase
Glycerol-3-phosphate dehydrogenase
Isovaleryl-CoA dehydrogenase
3α-Hydroxysteroid
dehydrogenase
Malate dehydrogenase
δ-Aminolevulinic acid dehydratase
Thioredoxin-like protein 1
ThioredoxinRibonuclease UK114
Keratin, type II cytoskeletal 8
EBP50
Protein AMBP
Aldehydedehydrogenase
Acetyl-CoA acetyltransferase
Fructose-bisphosphate aldolase B
Argininosuccinate synthase
Betaine-homocysteine S-methyltransferase 13-Ketoacyl-CoA thiolasePhospoglycerate kinase 1
Multifunctional protein ADE2
Glyceraldehyde-3-phosphate
dehydrogenase
L-lactate dehydrogenase A chainVoltage-dependent anion-selective channel protein 1
Ornithine carbamoyltransferase
Argininosuccinate synthase3-Ketoacyl-CoA thiolase
Isovaleryl-CoA
dehydrogenase
Short-chain specific acyl-CoA dehydrogenase
Arginase 1
Peroxiredoxin 1
Putative L-aspartate dehydrogease
Electron transfer flavoprotein subunit α
Glycerol-3-phosphate dehydrogenase
3α-Hydroxysteroid dehydrogenaseOrnithine carmaboyltransferase
Enoyl-CoA hydratase
Ribonuclease UK114Fatty acid binding protein 1
α2μ-GlobulinFatty acid binding protein 1 Transthyretin
Keratin, type II cytoskeletal 8
γ-ActinProtein NDRG2
78 kDa Glucose-
regulated protein
Protein disulfide-isomerase
ATP synthase β subunit
78 kDa Glucose-regulated protein
Protein disulfide-isomeraseNa(+)/H(+) exchanger regulatory factor 3
Heat shock cognate 71 kDa proteinNa(+)/H(+) exchanger regulatory factor 3
Serine protease inhibitor A3KVitamin D-binding protein
α1-Antiproteinase
Aldehyde dehydrogenaseS-Adenosylmethionine synthetase isoform type -1
S-Adenosylmethionine synthetase isoform type -1
2-Oxoisovalerate dehydrogenase subunit α
Protein disulfide-isomerase A3Formimidoyltransferase-cyclodeaminaseSulfite oxidase
Triosephosphate isomerase
Aflatoxin B1 aldehyde
reductase member 2
Ubiquitin fusion degradation
protein 1 homolog
Heterogeneous nuclear ribonucleoprotein H1Long-chain specific acyl-CoA dehydrogenase
pH range 4-7, 2 mg/kg bw, 900 µg whole liver protein extract (10 weeks exposure)
pH range 6-9, 2 mg/kg bw, 500 µg whole liver protein extract, (16 weeks exposure)
pH range 4-7, 2 mg/kg bw 900 µg liver membrane fraction, (24 weeks exposure)

64 IDENTIFICATION OF FURAN TARGET PROTEINS
Table 10 Target proteins of reactive furan metabolites (continued on next pages)
Protein data obtained from Mascot search engine and UniProtKB database following peptide analysis by *FT-ICR (LTQ FT Ultra
TM, Thermo Fisher Scientific) or
+ESI-QTOF-MS/MS (Q-TOF Ultima Global, Waters). Proteins were regarded as
identified if present in three different animals, each with a peptide score above the confidence threshold (> 36 or > 43 for samples measured with
+ESI-QTOF-MS/MS or *FT-ICR, respectively), a sequence coverage of at least 10 % and at least 2
identified peptides. For proteins identified in more than one spot, data shown represent the maximum scores, sequence coverages, and peptide numbers (derived from the bold and underlined spot). Protein molecular mass (Mr) and isoelectric point (pI) represent the theoretical values. Cs = cytosol, CM = cell membrane, Cp = cytoplasm, Mito = mitochondrion, ER = endoplasmic reticulum, Ck = cytoskeleton, ES = extracellular space, sec = secreted, Nu = nucleus, Ms = microsome, Px = peroxisome. Several proteins are also reported to present targets of
1mycophenolic acid (Asif et al., 2007),
2diaminochlorotriazine (Dooley et al., 2008),
3teucrin A (Druckova et al., 2007),
4thiobenzamide (Ikehata et al., 2008),
5bromobenzene (Koen et al., 2007; Koen and Hanzlik, 2002),
6acetaminophen (Qiu et al., 1998).
Protein Name Spot UniProt
ID Mr
[Da] pI
Protein scores
Sequence coverage
[%]
Peptides assigned
to protein Location
Carbohydrate metabolism
+α-Enolase
1,2,4,5
27 P04764 47128 6.2 70, 80, 57 17, 13, 12 9,6,7 Cs, CM
*Fructose-bisphosphate aldolase B1,3,4
50 P00884 39618 8.7 232, 291, 277 26, 31, 26 8, 9, 10 Cs
+Fructose-1,6-bisphosphatase 1 6 P19112 39609 5.5 88, 115, 38 19, 20, 12 7, 11, 4 Cs
*Glyceraldehyde-3-phosphate dehydrogenase1,3,4
52 P04797 35828 8.4 258, 145, 195 28, 20, 19 8, 8, 8 Cs
*L-Lactate dehydrogenase A chain 53 P04642 36451 8.5 90, 101, 80 12, 15, 12 4, 5, 4 Cs
+Malate dehydrogenase
4
2b, 31 O88989 36483 6.2 103, 251, 155 22, 31, 24 9, 9, 9 Cs
*Phosphoglycerate kinase 12,4,5
51 P16617 44538 8.0 104, 239, 113 14, 36, 17 4, 11, 5 Cs
*Triosephosphate isomerase1,2,5
47, 97 P48500 26849 6.5 157, 264, 706 15, 41, 81 3, 9, 19 Cs
Lipid metabolism
*Enoyl-CoA hydratase 64 P14604 31516 6.4 110, 67, 121 13, 13, 19 3, 3, 5 Mito
*3-Ketoacyl-CoA thiolase3 51, 55 P13437 41871 8.1 159, 223, 160 17, 20, 17 5, 6, 5 Mito
+Long-chain fatty acid CoA ligase 1
3
2a P18163 78179 6.6 46, 221, 59 10, 18, 10 7, 12, 7
ER, Mito, Ms,
Px
*Long-chain specific acyl-CoA dehydrogenase1,3
93 P15650 47873 7.6 71, 291, 731 10, 26, 43 5, 10, 21 Mito
*Short-chain specific acyl-CoA dehydrogenase 59 P15651 44765 8.5 179, 237, 225 20, 31, 23 8, 12, 9 Mito
Amino acid metabolism, urea cycle
*Arginase 14,5
59 P07824 34973 6.8 145, 157, 108 20, 16, 12 6, 5, 4 Cp
*Argininosuccinate synthase3
51, 55 P09034 46496 7.6 257, 239, 321 29, 31, 34 19, 18, 21 Mito, ER
*Betaine-homocysteine S-methyltransferase 13
51 O09171 44976 8.0 215, 124, 103 51, 31, 33 14, 10, 10 Cs, CM
*Formimidoyltransferase-cyclodeaminase 83 O88618 58914 5.8 189, 311, 487 14, 23, 39 8, 13, 22 Ck, Golgi
*Isovaleryl-CoA dehydrogenase 33c, 58 P12007 46435 8.0 201, 141, 97 22, 16, 14 9, 8, 7 Mito
*Ornithine carbamoyltransferase 55, 60 P00481 39886 9.1 197, 87, 133 31, 14, 28 10, 5, 9 Mito
*2-Oxoisovalerate dehydrogenase subunit α 85 P11960 50164 7.7 275, 198, 521 29, 18, 45 11, 8, 19 Mito
*S-Adenosylmethionine synthetase isoform type-1 85, 86 P13444 43698 5.6 309, 251, 547 31, 34, 50 13, 14, 20 Cs
Redox regulation
*Electron transfer flavoprotein subunit α2,3
61 P13803 34951 8.6 233, 183, 203 31, 36, 31 8, 11, 9 Mito
*Peroxiredoxin-14,6
62 Q63716 22109 8.3 104, 274, 160 41, 57, 47 10, 14, 11 Cs
+*Thioredoxin-1
4,5
12 P11232 11673 4.8 155, 41, 67 65, 21, 21 8, 2, 2 Cp
+*Thioredoxin-like protein 1 3 Q920J4 32249 4.8 61, 43, 1271 20, 19, 76 5, 6, 27 Cp

IDENTIFICATION OF FURAN TARGET PROTEINS 65
Table 10 (continued)
Protein Name Spot UniProt
ID Mr
[Da] pI
Protein scores
Sequence coverage [%]
Peptides assigned to
protein Location
Protein folding
*78 kDa Glucose-regulated protein3,4,5
75, 76 P06761 72347 5.1
2066, 2250,
7714 58, 53, 60 48, 45, 49 ER lumen
*Heat shock cognate 71 kDa protein1,4,5
1, 79 P63018 70871 5.4 168, 407, 922 13, 31, 47 8, 20, 33 Cp
*Protein disulfide-isomerase4,5
74, 75 P04785 56951 4.8 613, 599, 2787 51, 55, 77 32, 32, 45 ER lumen, CM
*Protein disulfide-isomerase A31,2,4,5
83 P11598 56623 5.9 393, 468, 1222 35, 41, 71 21, 26, 46 ER lumen
Proteolysis
*α1-antiproteinase4
86 P17475 46136 5.7 333, 311, 1087 33, 36, 52 16, 19, 23 sec
+*Protein AMBP: Bikunin and Trypstatin 23 Q64240 38851 5.8 48, 80, 736 10, 21, 69 4, 6, 24 sec
*Serine protease inhibitor A3K 80 P05545 46562 5.3 297, 549, 982 25, 37, 51 12, 14, 25 sec
*Ubiquitin fusion degradation protein 1 homolog 94 Q9ES53 34485 6.3 97, 62, 336 18, 12, 50 6, 3, 17 Nu, Cp
Structural proteins
+β-Actin
1/ γ-Actin 2a, 2b, 5, 78 P60711/ P63259 41737 5.3 75, 121, 117 28, 26, 17 10, 9, 6 Cp, Ck
+*Ezrin-radixin-moesin-binding phosphoprotein 50 21a Q9JJ19 38830 5.7 884, 40, 87 83, 20, 29 31, 6, 10 Cp, CM
+Fibrinogen γ chain 21c P02680 50633 5.9 42, 131, 55 23, 37, 13 9, 14, 7 sec
*Keratin, type II cytoskeletal 8 21b, 24, 25, 78 Q10758 54019 5.8 3254, 122, 1339 90, 19, 78 65, 9, 52 Ck, Cp, Nu
*Na(+)/H(+) exchanger regulatory factor 3 75, 79 Q9JJ40 56800 5.3 133, 254, 859 20, 30, 59 9, 17, 29 CM
*Protein SEC13 homolog 4 Q5XFW8 35548 5.2 195, 486, 447 24, 35, 64 5, 9, 17 ER, Nu
*Voltage-dependent anion-selective
channel protein 11
53
Q9Z2L0 30756 8.4 89, 83, 155 12, 10, 17 3, 3, 5 Mito, CM
Transport proteins
*α2µ-Globulin4
19, 20a, 87 P02761 20737 5.9 69, 101, 1045 20, 55, 71 4, 10, 17 Cp, sec
*Fatty acid binding protein 14,5
63, 91 P02692 14273 7.8 52, 99, 243 14, 36, 79 2, 5, 8 Cp
+*Protein AMBP: α1-Microglobulin 23 Q64240 38851 5.8 48, 80, 736 10, 21, 69 4, 6, 24 sec
*Transthyretin4,5
92 P02767 15720 5.8 121, 300, 368 37, 52, 73 7, 13, 12 sec
*Vitamin D binding protein 80 P04276 53544 5.8 134, 276, 702 22, 42, 62 10, 18, 29 sec
Nucleotide metabolism
*Multifunctional protein ADE2 51 P51583 47096 7.9 81, 50, 137 17, 16, 18 7, 8, 9
*Putative L-aspartate dehydrogenase 61 Q5I0J9 31260 5.5 301, 87, 207 41, 16, 34 11, 5, 10
*Heterogeneous nuclear ribonucleoprotein H12
93 Q8VHV7 49188 5.9 100, 94, 515 14, 18, 44 6, 7, 16 Nu, Cp

66 IDENTIFICATION OF FURAN TARGET PROTEINS
Table 10 (continued)
Protein Name Spot UniProt
ID Mr
[Da] pI
Protein scores
Sequence coverage [%]
Peptides assigned to
protein Location
Miscellaneous
*Acetyl-CoA acetyltransferase 50 P17764 44695 8.9 293, 517, 308 36, 44, 36 14, 22, 15 Mito
*Aflatoxin B1 aldehyde reductase member 2 96 Q8CG45 40675 6.3 115, 236, 490 19, 30, 50 5, 10, 16 Cp, Golgi
*Aldehyde dehydrogenase1,3,5,6
29, 86 P11884 56488 6.7 269, 209, 660 26, 20, 49 14, 13, 25 Mito
+3α-Hydroxysteroid dehydrogenase
4,5
37, 60 P23457 37028 6.7 106, 151, 140 22, 39, 29 8, 14, 10 Cp
*ATP synthase β subunit1,3
4, 74 P10719 56354 5.2 252, 253, 657 24, 23, 35 10, 9, 14 Mito
+δ-Aminolevulinic acid dehydratase 35 P06214 36032 6.3 177, 210, 176 28, 34, 19 10, 12, 7 Cp, ES
*Glycerol-3-phosphate dehydrogenase [NAD+]5
33b, 60 O35077 37453 6.2 329, 126, 143 41, 25, 25 16, 10, 10 Cp
+3-Mercaptopyruvate sulfurtransferase 30 P97532 32940 5.9 64, 131, 125 21, 34, 31 7, 11, 9 Cp, Mito
*Ppa1 protein6
4 Q499R7 37677 6.4 130, 119, 453 29, 11, 48 9, 4, 19 Cp
*Protein NDRG2 78 Q8VBU2 40779 5.2 158, 162, 344 12, 18, 56 4, 5, 13 Cp
*Regucalcin5
4 Q03336 33390 5.4
1109, 1263,
2623 90, 86, 88 42, 30, 37 Cp, Nu
+*Ribonuclease UK114
1,4,5
14, 63 P52759 14303 7.8 2226, 169, 144 96, 34, 26 15, 4, 3 Mito, Cp, Nu.
Px, ER
*Sulfite oxidase 83 Q07116 60806 6.3 140, 153, 466 16, 21, 52 8, 11, 22 Mito
Note:
β-Actin and γ-actin show 99 % sequence homology and thus in most cases it was not possible to determine which of both was present in the spots.
Protein AMBP is a precursor protein which is synthesized in the liver and is then cleaved into α1-microglobulin and bikunin/trypstatin, which are secreted separately. These two cleavage products have different functions and thus protein AMBP occurs twice in the protein list (in the groups "proteolysis" and "transport proteins"). Although there are two separate proteins after the cleavage, there is only one common accession number for protein AMBP.

IDENTIFICATION OF FURAN TARGET PROTEINS 67
Comparison of theoretical and experimentally determined molecular masses and
isoelectric points of the identified proteins
Most proteins identified showed experimentally determined (estimated from positions on
the gel in relation to the protein marker) molecular masses and isoelectric points which
were ≤ 10 kDa and ≤ 1.0 different from the theoretical values, respectively (see Annex,
Tab. 21). However, in some cases the differences between theoretical and experimentally
determined molecular mass values were higher than 10 kDa. In the case of long-chain
fatty acid CoA ligase 1, the theoretical molecular mass of 79 kDa strongly differs from the
experimentally determined molecular mass of 47 kDa. The reasons for this are not known,
but a possible explanation may be that the protein was cleaved during sample
preparation or that there are different forms of the protein in the cell. Literature data
report the existence of a long-chain fatty acid CoA ligase 1 in Escherichia coli showing
molecular masses of 45-50 kDa, but it is unknown whether this protein may also be
present in mammalian cells (Kameda et al., 1985). Interestingly, all peptides detected for
this protein are located within the first 370 amino acids of the protein sequence,
suggesting that a truncated form of this protein was present in the spot.
Several proteins occurred in multiple spots
Analyses of 83 spots yielded only 61 identified proteins. This may in part be due to
insufficient sample material in some gel plugs. Especially in the case of the less sensitive
QTOF, a small amount of material may lead to failure of protein identification.
Furthermore, several proteins were present in more than one spot. This is in line with
literature data and is thought to be the result of posttranslational modifications resulting
in mobility shifts (Ikehata et al., 2008; Koen et al., 2007; Koen and Hanzlik, 2002; Qiu et
al., 1998). The groups of spots containing the same protein were either present on the
same gel or on gels derived from different pH ranges or sample preparation methods. For
example, S-adenosylmethionine synthetase isoform type-1 was found in spots 85 and 86
(53 kDa, pI 5.8 and 53 kDa, pI 5.7), which were both detected on the gel obtained after
protein separation over the pH range 4-7 (membrane fraction). In contrast, heat shock
cognate 71 kDa protein was identified in spots 1 and 79 (70 kDa, pI 5.3 and 70 kDa, pI
5.2), which were detected after protein separation over the pH range 4-7 (whole tissue
homogenate and membrane fraction). In these cases, the same proteins were present in

68 IDENTIFICATION OF FURAN TARGET PROTEINS
spots with the same molecular mass, but slightly different pI values. On the other hand, it
is also possible that the same protein occurs in spots with different molecular masses and
same pI values, e.g. 78 kDa glucose-regulated protein, which was observed in spots 75
and 76 (70 kDa, pI 5.0 and 42 kDa, pI 5.0).
Several spots contain multiple proteins
It is important to point out that identification of furan target proteins by this approach is
considered as tentative and that unambiguous identification requires additional
confirmatory experiments, e.g. demonstration of furan-adducted peptides of individual
proteins using mass spectrometry. This is particularly evident as a single spot was
sometimes found to contain more than one protein, making it impossible to discern
which of the proteins present in the spot carries the radiolabel. For example, spot 83 (58
kDa, pI 5.7) was found to contain the three proteins formimidoyltransferase-
cyclodeaminase, sulfite oxidase, and protein disulfide-isomerase A3. The phenomenon of
comigration of different proteins with similar molecular masses and isoelectric points into
one spot is common if the sample is a complex mixture of many proteins and was also
described in reports from groups using a similar approach (Koen et al., 2007; Qiu et al.,
1998).
Proteins identified using less stringent criteria
In addition to the 61 proteins identified as putative furan target proteins, 37 further
proteins were found which did not match the criteria set for protein identification
(detected in all high dose animals (n=3), each with a sequence coverage of at least 10 %
and at least 2 peptides). These proteins were either positively identified only in two of
three high dose animals (both showing sequence coverages > 10 %) or they were
detected in all three animals, but showed a sequence coverage < 10 % in one of the
animals (see Annex, Tab. 23). These additional proteins were excluded from the detailed
analysis, but were used to obtain clues as to which additional pathways may also be
affected by covalent protein binding of furan metabolites.

IDENTIFICATION OF FURAN TARGET PROTEINS 69
Classes of furan target proteins
Regarding information on the protein properties taken from the Mascot search engine
and UniProtKB database, we found that target proteins represent - among others -
enzymes, transport proteins, structural proteins, and chaperones which predominantly
localize to cytosol and mitochondria and participate in various cellular processes (Tab.
10).
Cysteine and lysine contents of identified furan target proteins
In order to establish whether there are protein properties that favor a protein to become
a target for furan metabolites, the cysteine and lysine content of the proteins were
determined (see Annex, Tab. 22). The cysteine content ranged from 0.3 to 5.9 % (mean
1.9 %), with two proteins not containing any cysteine residue (cytokeratin 8, ATP synthase
β subunit), and the lysine content from 0.7 to 13.4 % (mean 6.9 %), calculated as number
of cysteine or lysine residues/total number of amino acids in the protein. Considering that
both cysteine and lysine are encoded by two different codons each, the theoretically
calculated mean contents of cysteine and lysine in proteins are both 3.3 % (Miseta and
Csutora, 2000). However, experimental approaches revealed a mean cysteine content in
mammalian proteins of 2.3 % (Miseta and Csutora, 2000), while the mean lysine content
of rat proteome was reported to be 5.5 % (Labenski et al., 2009). Thus, it seems that
cysteine is underrepresented in the identified furan target proteins, whereas the mean
lysine content of the target proteins is higher than average. This is in line with result from
bioinformatic analyses which identified protein lysine - but not cysteine - content as a
protein feature important to determine if a protein is likely to become adducted by
reactive metabolites (Fang et al., 2009). In this respect, it is also interesting to note that
some of the metabolites identified in bile and urine of rats treated with furan seem to
represent degradation products of protein adducts formed through the reactions of BDA
with cysteine and lysine residues in proteins (Hamberger et al., 2010a; Kellert et al.,
2008b; Lu et al., 2009).

70 IDENTIFICATION OF FURAN TARGET PROTEINS
Commonalities and differences in target proteins of various compounds
Interestingly, 33/61 proteins identified also represent target proteins of other
drugs/compounds thought to cause toxicity via reactive metabolite formation. This is of
particular interest since establishing commonalities and differences in target proteins of
different chemical compounds (and their reactive metabolites) may help to elucidate how
covalent binding to proteins may be connected to cytotoxicity. To summarize the current
knowledge on target proteins of various compounds and to gain a comprehensive
overview of target proteins whose adduction may be involved in cytotoxicity, Hanzlik et
al. established a target protein database (Hanzlik et al., 2007). A function of this database
is the commonality matrix, which shows the number of target proteins which any two
chemicals have in common. To date, the database includes information on the target
proteins of 45 chemicals and a total of 352 target proteins
(http://tpdb.medchem.ku.edu:8080/protein_database/). The target proteins in the
database which are most often reported to be adducted by a compound are 56 kDa
selenium-binding protein, 78 kDa glucose-regulated protein, glutathione S-transferase Mu
1, protein disulfide-isomerase, and serum albumin. Interestingly, two of these proteins
(78 kDa glucose-regulated protein, protein disulfide-isomerase) were also identified as
furan target proteins.

IDENTIFICATION OF FURAN TARGET PROTEINS 71
6.3.3 Protein adducts in rat liver following administration of furan at lower dose
In order to assess protein adduction at a lower dose closer to human exposure, liver
proteins isolated form rats treated with the low dose of [3,4-14C]-furan (0.1 mg/kg bw)
were separated by 2D-GE and fluorography was performed.
Despite longer exposure times used for the detection of radioactively labeled spots on
gels derived from low dose animals (30 weeks) as compared to high dose animals (10
weeks), spots on fluorographic films derived from low dose-treated animals were fewer
and weaker compared to the spots detected on films obtained from high dose animals.
This is consistent with the results obtained using liquid scintillation counting of the
protein extracts, where it was shown that the amount of 14C-furan bound to proteins in
rat liver after administration of low dose furan was only about 10 % of the amount after
treatment with the high dose. However, a similar spot pattern as found in high dose
animals was observed on films from low dose animals (Fig. 22). Thus, the target proteins
appear to be identical to those identified after high dose furan treatment.

72 IDENTIFICATION OF FURAN TARGET PROTEINS
Figure 22 Spot patterns of furan-adducted proteins obtained by separation of proteins extracts obtained from rats treated with a low dose of
14C-furan (A) as compared to high dose
14C-furan treatment (B). In both
cases, similar spot patterns were observed. Proteins identified in the spots: 1 = Heat shock cognate 71 kDa protein; 2a = Long-chain fatty acid CoA ligase 1 and β-Actin / γ-Actin; 3 = Thioredoxin-like protein 1; 4 = Regucalcin, ATP synthase β subunit, Protein SEC13 homolog, and Ppa1 protein; 5 = β-Actin / γ-Actin; 6 = Fructose-1,6-bisphosphatase 1; 12 = Thioredoxin-1; 14 = Ribonuclease UK114; 19 and 20a = α2µ-Globulin; 25 = Keratin, type II cytoskeletal 8; 27 = α-Enolase; 33b = Glycerol-3-phosphate dehydrogenase; 33c = Isovaleryl-CoA dehydrogenase; 35 = δ-Amiolevulinic acid dehydratase; 37 = 3α-Hydroxysteroid dehydrogenase; 47 = Triosephosphate isomerase
6.3.4 Protein binding in the non-target organ kidney
Since liquid scintillation counting revealed that covalent binding of furan to proteins is not
restricted to the target organ of furan carcinogenicity (liver) but also occurs in the non-
target organ kidney, we were interested if similar patterns of adducted proteins may be
detected in both organs.
Comparison of the Coomassie Blue-stained 2D-gels suggested differential protein
expression in liver and kidney tissue. In agreement with results from liquid scintillation
counting, also films obtained from kidney tissue showed radioactive spots containing
adducted proteins. Similar to the films derived from liver tissue of low dose treated
animals, most spots on the fluorographic films obtained from kidney tissue were less
intense than spots on films from liver tissue, although the exposure time for the kidney
sample was about three times the exposure time for the liver sample. This is in line with
the finding that the amount of radiolabeled furan covalently bound to proteins is around
3735
47
20a
19
3
42a 27
25
12
1 33b33c
14
56
A
B

IDENTIFICATION OF FURAN TARGET PROTEINS 73
3-4 fold higher in liver than in kidney tissue. Some but not all spots which were detected
on films derived from liver tissue were also observed on films from kidney tissue (Fig. 23).
Thus, it seems that liver and kidney share several target proteins.
Even though it appears that in both tissues similar proteins may be adducted, effects of
furan administration on liver and kidneys were found to be quite different. While toxic
lesions in rat liver tissue were already observed after 0.12 mg/kg bw furan p.o. for 90
days, microscopic examination of kidney tissue showed no signs of nephrotoxicity under
these conditions (Gill et al., 2010). Statistically significant toxic kidney lesions were found
only after furan high dose exposure (60 mg/kg bw) over 13 weeks (NTP, 1993). A possible
explanation for this finding may be that the level of protein adduction in liver tissue was
found to be about three times higher than in kidney tissue (6.3.1), suggesting that a
higher amount of protein binding may result in increased toxicity.
Moreover, furan treatment at 2 mg/kg bw for 2 years was reported to induce
hepatocellular adenomas and carcinomas as well as cholangiocarcinomas, whereas no
tumors were observed in kidneys (NTP, 1993). This may also be due to different levels of
protein adduction in both tissues.
Figure 23 Representative images of Coomassie Blue-stained gels obtained after protein separation by two-dimensional gel electrophoresis (pH range 4-7) (top) and their corresponding fluorographic film images (bottom) obtained from target organ liver (A, B) and non-target organ kidney (C, D). For analyses, protein extracts (900µg protein) from high dose animals (2 mg/kg bw) were used and the films were exposed to the gels for 10 weeks (liver) and 28 weeks (kidney). Apparently common spots between the films from both organs are marked with circles.
A
B
C
D

74 IDENTIFICATION OF FURAN TARGET PROTEINS
6.3.5 Furan distribution in rat liver after oral administration of [3,4-14C]-furan
In contrast to the hypothesis that different responses to furan treatment in liver lobes
may be caused by diffusion from the stomach leading to high concentrations along the
subcapsular surface of furan target lobes, no regions with higher concentrations of 14C-
labeled furan were observed in our study (Fig. 24). This suggests that under the
conditions used in this study (single oral dose of 0.8 mg/kg bw and sacrifice 2 hours after
administration) furan is evenly distributed across all liver lobes.
Alternatively, it was hypothesized that inter- and intralobular differences in liver
perfusion or vascular lesions constricting blood supply may play a role in locally different
susceptibilities of liver lobes to toxic furan effects (Mally et al., 2010). Interestingly,
fibrinogen γ chain (FGG) was also identified as furan target. It was reported that
mutations of FGG and subsequent exchange of an amino acid can result in malfunction of
important FGG binding sites, leading to dysfibrinogenemia and an increased risk of
thrombosis (Robert-Ebadi et al., 2008) (see paragraph on FGG in 8.3.3.6). Hence, binding
of furan metabolites to FGG which may result in blocking of important binding sites of
fibrinogen, may also increase the risk of thrombus formation. The occurrence of blood
clots in small vessels and their resulting obstruction may lead to locally different blood
flows. Thus, loss of function of FGG through furan adduct formation may represent a link
between protein binding and the phenomenon of locally different susceptibility of liver
lobes to furan toxicity.

IDENTIFICATION OF FURAN TARGET PROTEINS 75
Figure 24 Images of liver slices (A-F) and their corresponding autoradiographic images (a-f). The slices are shown in the order from dorsal to ventral (A-F and a-f), i. e. slice A is closest to the bottom and slice F is closest to the top of the casted tissue block. Furan appears to be evenly distributed over the whole liver.
A B C
FED
Left lobeCaudate lobe
a b c
d e f
Left lobeCaudate lobe

76 IDENTIFICATION OF FURAN TARGET PROTEINS
6.4 Conclusions
Liquid scintillation counting of protein extracts from rats treated with [3,4-14C]-furan
revealed a dose-dependent increase in the amount of radiolabeled compound covalently
bound to proteins in both target (liver) and non-target (kidney) tissue of furan
carcinogenicity. However, furan covalent protein binding occurred to a lesser extent in
kidney than in liver tissue. Consistent with these results, fluorographic analysis of two-
dimensional gels showed the presence of adducted proteins in both liver and kidney
tissue. Furthermore, similar spot patterns but lower levels of overall protein adduction
were observed in kidney tissue (as compared to liver tissue) and after administration of
furan at the lower dose of 0.1 mg/kg bw (as compared to 2 mg/kg bw).
Separation of whole liver extracts and liver membrane fractions by two-dimensional gel
electrophoresis and subsequent detection of radioactive protein adducts by fluorography
led to the identification of 61 putative furan target proteins of furan reactive metabolites
by mass spectrometry and Mascot database search. The identified proteins are derived
from various cellular compartments, mainly mitochondria and cytosol, and serve various
cellular functions.
From the 61 putative furan target proteins, 33 proteins also represent targets of other
compounds known to form reactive metabolites. Gathering information on
commonalities and differences in target proteins of various compounds, which are
assumed to cause toxicity via reactive metabolite formation and subsequent protein
binding, may help to elucidate mechanisms of toxicity.
In contrast to the hypothesis that the reasons for the different toxic responses to furan in
rat liver lobes were due to locally different furan concentrations after oral administration
(Hamadeh et al., 2004; Metzger and Schywalsky, 1992), furan appeared to be evenly
distributed over all areas of the different liver lobes in our study.

CELLULAR AND FUNCTIONAL CONSEQUENCES OF FURAN PROTEIN BINDING 77
7 CELLULAR AND FUNCTIONAL CONSEQUENCES OF FURAN PROTEIN BINDING IN RAT LIVER
7.1 Introduction
Furan administration at 2 mg/kg bw for 2 years was found to induce hepatotoxicity and
liver tumors in rats (NTP, 1993), but the mechanisms involved are still poorly understood.
Our study using radiolabeled furan revealed covalent furan binding to proteins at a level
of approximately 1 adduct per 100 molecules of protein (calculated for a 25 kDa protein)
in rat liver after administration of the known carcinogenic furan dose of 2 mg/kg bw
(6.3.1). For a comprehensive understanding of molecular events which may link furan
protein binding to the toxicity and carcinogenicity of furan, characterization of the cellular
and functional consequences of furan administration is needed. For this purpose, a
subacute toxicity study was conducted with rats receiving furan at a known carcinogenic
dose (2 mg/kg bw) and at doses closer to estimated human exposure (0.1 and 0.5 mg/kg
bw). In addition, also samples from a study using furan high dose (30 mg/kg bw)
treatment were examined. Since furan administration at this dose was reported to cause
extensive hepatotoxicity (Hickling et al., 2010a), it would be expected that the induced
effects may be more pronounced than after the relatively low doses used in the subacute
toxicity study.
A possible link between furan protein binding and the toxicity and carcinogenicity of furan
may be reflected by activation of the unfolded protein response (UPR). Protein function
requires proper folding of proteins, which is established and maintained by the
endoplasmic reticulum (ER). It is well known that protein adduction by reactive
metabolites, e.g. the furan metabolite BDA, may compromise the three-dimensional
protein structure and may thus lead to accumulation of misfolded and nonfunctional
proteins. To cope with accumulated proteins and to prevent toxicity associated with
impaired protein function, cells may respond by activating the UPR. Activation of the UPR
leads to increased transcription of genes encoding chaperones and components of the
ER-associated degradation (ERAD) machinery, thereby increasing the cells capacity to
recognize misfolded proteins and repair or target them for degradation by the
proteasome. However, if the ER folding capacity is overwhelmed and homeostasis cannot
be maintained, cell death may occur.

78 CELLULAR AND FUNCTIONAL CONSEQUENCES OF FURAN PROTEIN BINDING
At present, three different sensors of ER stress have been identified, namely inositol-
requiring protein-1 (IRE1), protein kinase RNA (PRK)-like ER kinase (PERK) and activating
transcription factor-6 (ATF-6) (Ron and Walter, 2007). Upon activation, these sensors
transmit their signal from the ER to the nucleus (via the Golgi and/or cytoplasm), resulting
in transcription of unfolded protein response (UPR) target genes (Fig. 25). Activation of
these signaling pathways is regulated in part by the chaperone glucose-regulated protein
78 (GRP78; BiP). Direct binding of misfolded proteins to BiP or the lumenal domain of
IRE1 is thought to release BiP from IRE1, leading to oligomerization and
autophosphorylation of IRE1, and subsequent cleavage of X-box binding protein-1 (XBP1)
mRNA via IRE1 endoribonuclease activity. Spliced XBP1 protein translocates to the
nucleus where it functions as a potent transcription factor and key regulator of the UPR
(Ron and Walter, 2007). Thus, splicing of XBP1 mRNA and expression of UPR target genes
function as indicators of ER stress and UPR (Samali et al., 2010) and were used in this
study to determine if protein binding by furan triggers the UPR in rat liver.
Figure 25 UPR signaling via the ER stress sensor IRE1 (modified from Ron and Walter, 2007).
Unstressed Stressed
Autophosphorylation
P P
BiP
IRE1
IRE1 - Inositol requiring protein 1
BiP – Immunoglobulin binding protein= GRP78 – Glucose regulated protein 78
XBP1 mRNA
Intron
Ligase
mRNAprocessing
XBP1 - X-box binding protein-1
ER lumen
Cytoplasm
Translation Translation
Nucleus
Gene expression
XBP1u XBP1s
UPR target genes
Unfolded or damagedprotein
Endoribonuclease activity

CELLULAR AND FUNCTIONAL CONSEQUENCES OF FURAN PROTEIN BINDING 79
7.2 Methods
7.2.1 Housing and treatment of animals
Male Fischer F344/N rats (aged 5-7 weeks on arrival, Harlan-Winkelmann GmbH,
Borchen, Germany) were housed at standard laboratory conditions (climate cabinets,
temperature 22 ± 2 °C, relative humidity 30-70 %, 12-15 air changes per hour, 12 hours
light/dark cycle) in groups of 5 in Makrolon® type-4 cages with wire meshtops and
standard softwood bedding. Rats received pelleted standard rat maintenance diet and
tap-water ad libitum. After 2 weeks of acclimatization, animals received furan in corn oil
(4 ml/kg bw) by gavage five days a week (Fig. 26). To assess furan toxicity at a known
carcinogenic dose (2 mg/kg bw) and at lower doses closer to estimated human exposure,
4 dose groups of 0.0 mg/kg bw, 0.1 mg/kg bw, 0.5 mg/kg bw, and 2.0 mg/kg bw were
used. Rats were transferred into metabolic cages for 24 hours prior to sacrifice to collect
urine.
Viability, mortality, and clinical signs were recorded daily, body weights twice a week, and
food and drinking water consumption weekly. After 5 days, 4 weeks or 6 weeks (4 weeks
treatment + 2 weeks recovery), rats were anesthetized with CO2 and sacrificed by cardiac
puncture. The livers were removed, aliquoted, flash frozen in liquid nitrogen and stored at
-80 °C or fixed in formalin and embedded in paraffin.
Figure 26 Study design for the 28 days oral toxicity study.
Timepoint 1: Sacrificeafter 5 days treatment
42 days352821147-2 0
10 rats(5 control, 5 high dose)24h in metabolic cages
20 rats(5 per dose group)
24h in metabolic cages
20 rats(5 per dose group)
24h in metabolic cages
28 days furan treatment4 dose groups (0, 0.1, 0.5, 2.0 mg/kg bw)
Timepoint 2: Sacrificeafter 4 weeks treatment
Timepoint 3: Sacrifice after 4 weeks treatment +
2 weeks recovery

80 CELLULAR AND FUNCTIONAL CONSEQUENCES OF FURAN PROTEIN BINDING
7.2.2 Analysis of clinical chemistry parameters for the assessment of furan hepatotoxicity
Blood and urine were analyzed at the Laboratory for Clinical Chemistry, University of
Würzburg, using standard protocols. In urine, nitrite, protein, creatinine, glucose,
ketones, urobilinogen, bilirubin, erythrocytes, and leukocytes were measured, while
glucose, urea, creatinine, total bilirubin, total cholesterol, triglycerides, aspartate
aminotransferase, alanine aminotransferase, lactate dehydrogenase, glutamate
dehydrogenase, creatine kinase, alkaline phosphatase, γ-glutamyltransferase, total
protein, albumin, globulin, and albumin/globulin ratio were determined in plasma.
7.2.3 Analysis of protein expression
To establish whether administration of furan at low doses causes changes in the
expression of protein in liver tissue of furan-treated rats, proteins from the livers of 3
control and 3 high dose animals (2 mg/kg bw, 4 weeks) were divided into 4 subcellular
fractions and separated by two-dimensional gel electrophoresis. The obtained gels were
stained with silver, and analyzed using Ludesi Redfin3 software.
7.2.3.1 Subcellular fractionation and protein quantification
As described in 6.2.5, the FractionPREPTM Cell Fractionation Kit (Biocat) was used to
obtain four subcellular protein fractions (cytosolic, nuclear, membrane/particulate, and
cytoskeletal fraction) from each sample. Subcellular fractionation was conducted using
the right anterior liver lobes of 3 control and 3 high dose rats (2 mg/kg bw, 4 weeks).
After fractionation, 300 µl acetone (-20 °C) was added to 100 µl of each fraction and the
samples were left at 4 °C over night for the proteins to precipitate. The next day, the
samples were centrifuged at 4 °C for 30 min (10,000 x g, Eppendorf Centrifuge 5403) and
the pellets were dissolved in 100 µl sample solution. The protein concentrations of all
fractions were determined by 2D Quant Kit as described in 6.2.3. The fractions were
stored at –80 °C for further use.
7.2.3.2 Two-dimensional gel electrophoresis
Two-dimensional gel electrophoresis was conducted as described in 6.2.6 with the
following changes: Liver protein extracts (subcellular fractions) containing 10 µg protein
were diluted with rehydration solution (7M urea, 2M thiourea, 2 % CHAPS, 0.5 % IPG

CELLULAR AND FUNCTIONAL CONSEQUENCES OF FURAN PROTEIN BINDING 81
Buffer pH 3-11 NL, 20 mM DTT, 0.002 % bromophenol blue) to a final volume of 210 µl.
Isoelectric focusing was performed using Immobiline DryStrips pH 3-11 NL (11 cm) on a
Multiphor II electrophoresis unit equipped with an additional frame (Immobiline Dry Strip
Tray), a cooling unit (MultiTemp) and a power supply (Electrophoresis Power Supply EPS
3500) running 3500 V, 1 mA, 5 W, 2.9 kVh in the first step and 3500 V, 1 mA, 5 W, 9.1 kVh
in the second step. After equilibration, for the second dimension two equilibrated IPG
strips from the same subcellular fraction, one of a control and one of a high dose animal,
were used on one ExcelGel SDS 2-D Homogeneous 12.5 (Fig. 27).
Figure 27 Schematic view of positioning strips and marker on ExcelGel SDS 2-D Homogeneous 12.5 when two immobiline pH gradient (IPG) strips were used for the second dimension.
7.2.3.3 Silver staining of protein gels
Fixing solution: 125 ml deionized water, 100 ml ethanol, 25 ml acetic acid glacial
Sensitizing solution: ethanol 75 ml, sodium thiosulfate (5 % w/v) 10 ml, sodium
acetate 17 g, deionized water to 250 ml, before use 1.25 ml glutardialdehyde (25
% w/v) was added
Silver solution: silver nitrate solution (2.5 % w/v) 25 ml, deionized water to 250 ml
Developing solution: sodium carbonate 6.25 g, deionized water to 250 ml, before
use 0.2 ml formaldehyde (37 % w/v) was added
Stop solution: 3.65 g EDTA-Na2•2H2O, deionized water to 250 ml
Washing solution: deionized water
Preserving solution: glycerol (87 % w/w) 25 ml, deionized water to 250 ml
The gel was soaked in fixing solution for 30 min and washed three times in deionized
water for 5 min. The sensitizing solution was added, the gel was left shaking for at least
30 min and was washed three times in deionized water for 10 min. The silver solution was
added, the gel was left shaking for 20 min, and was rinsed twice in deionized water for
one minute. After addition of the developing solution, the gel was left shaking for 3 min
IPG strip from control animal
IPG strip from high dose animal
Marker
ExcelGel SDS 2-D Homogeneous 12.5
Separation accordingto molecular weight

82 CELLULAR AND FUNCTIONAL CONSEQUENCES OF FURAN PROTEIN BINDING
and was transferred to the stop solution once the spots had reached the desired
intensity. The gel was left shaking in the stop solution for 10 min. Deionized water was
added and the gel was washed three times for 5 min. To prevent the gel from drying and
cracking, the preserving solution was added and the gel was left shaking for 20 min. The
gel was then shortly dried and scanned on a HP ScanJet 5550C flatbed scanner to obtain
digital images. After the procedure, the gel was wrapped in plastic foil and kept at 4 °C.
7.2.3.4 Protein expression analysis
To establish whether the expression of proteins was altered through treatment with furan
for 4 weeks, the silver stained images were analyzed using Ludesi Redfin3 software. For
this purpose, the scanned gel images were converted into grey scale and uploaded into
the online analyzing program. The software measured and compared the densities of the
single spots between treated and control samples. The following settings were used for
analysis: fold change ≥ 1.5, p-value ≤ 0.05, presence 100 %, and volume ≥ 1000.
7.2.4 Effect of furan treatment on the unfolded protein response
7.2.4.1 Samples used for analysis of the unfolded protein response
Frozen tissue from the caudate liver lobes of control and high dose animals (0 or 2 mg/kg
bw, 4 weeks) derived from the 28 days oral toxicity study (7.2.1) were used for analysis.
Additional liver samples (caudate liver lobes) from an acute oral toxicity study on furan
were kindly provided by H. Hoffmann (Hoffmann, 2010). In this study, male Fischer
F344/N rats (200-250 g on arrival, Harlan-Winkelmann GmbH, Borchen, Germany) were
housed in groups of 4 in Makrolon® type-4 cages with wire meshtops and standard
softwood bedding at standard laboratory conditions (climate cabinets, temperature 22 ±
2 °C, relative humidity 30-70 %, 12-15 air changes per hour, 12 hours light/dark cycle).
Rats received both pelleted standard rat maintenance diet and autoclaved tap-water ad
libitum. After acclimatization, animals received a p.o. single dose of furan (30 mg/kg bw)
in corn oil (4 ml/kg bw) or vehicle only. At sacrifice (24 hours post-dose), blood samples
were taken by cardiac puncture and the livers were removed, separated into the different
lobes and stored until further use. Plasma was analyzed at the Laboratory for Clinical
Chemistry, University of Würzburg, using standard protocols. Moreover, light microscopic
evaluation of liver slices stained with hematoxylin and eosin was performed.

CELLULAR AND FUNCTIONAL CONSEQUENCES OF FURAN PROTEIN BINDING 83
7.2.4.2 Isolation of RNA from liver tissue using the RNeasy® Mini Kit
Isolation of the RNA was conducted using the RNeasy® Mini Kit, which is based on binding
of RNA to the silica membranes of the RNeasy® Mini Spin Columns.
RNeasy® Mini Kit (Qiagen): before use 300 µl β-mercaptoethanol is added to 30
ml RLT buffer (lysis buffer)
RNase-Free DNase Set (Qiagen): for preparation of the DNase I solution, 121 µl
DNase I stock solution (1500 units in 550 μl DEPC-H2O) is mixed with 847 µl
digestion buffer (RDD buffer)
From each sample, 100 mg frozen tissue was homogenized in 2 ml lysis buffer (RLT buffer;
contains guanidine thiocyanate) including β-mercaptoethanol in a manual tissue
homogenizer. The chaotropic agent guanidine thiocyanate supports the cell lysis and,
together with β-mercaptoethanol, protects the mRNAs by inactivation of mRNA-
degrading enzymes (RNases) through reduction of their protein thiol groups. The
homogenates were transferred into autoclaved Eppendorf caps and kept on ice until
centrifugation for 10 min at 8000 rpm and 4 °C. The supernatant (350 µl) was transferred
into autoclaved Eppendorf caps and 350 µl ethanol 70 % (RNase free) was added to
increase the affinity of the mRNA to the column material and mixed by pipetting several
times. The whole volume was transferred to a RNeasy® Mini column, the columns were
centrifuged for 15 seconds at 11000 rpm and the collected liquid was discarded. As a
washing step, 350 µl RW1 buffer (contains ethanol and guanidine thiocyanate) was
added, the columns were centrifuged for 15 seconds at 11000 rpm and the liquid was
discarded. DNase I solution (80 µl) was pipetted to the column to degrade remaining
DNA, which would disturb the analyses of mRNA. The columns were then incubated for
15 min at room temperature. RW1 buffer (350 µl) was added to wash away the degraded
DNA and the DNase I, the columns were centrifuged for 15 seconds at 11000 rpm and the
liquid was discarded. The columns were placed into fresh tubes and a further washing
step was conducted with 500 µl RPE buffer. After centrifugation of the columns for 15
seconds at 11000 rpm, the liquid was discarded. In the next step, 500 µl RPE buffer was
added, the columns were centrifuged for 2 min at 11000 rpm, and the liquid was
discarded. The columns were placed into fresh tubes and centrifuged for 1 minute at
14000 rpm to remove the remaining washing buffers from the columns. To elute the
mRNAs, the columns were placed into fresh tubes and 30 µl RNase free water was added.

84 CELLULAR AND FUNCTIONAL CONSEQUENCES OF FURAN PROTEIN BINDING
After incubating the columns for 1 minute at room temperature, they were centrifuged
for 1 minute at 11000 rpm. The RNA content of the obtained liquid containing the
isolated mRNAs was measured using a Nanodrop 2000C (Thermo Fisher Scientific) and a
sample volume of 2 µl. The samples were stored at -80 °C until further use.
7.2.4.3 cDNA synthesis using the VersoTM cDNA Kit
The obtained RNA was transcribed into cDNA using the VersoTM cDNA Kit (Thermo Fisher
Scientific). This kit contains VersoTM Enzyme Mix, which consists of VersoTM Reverse
Transcriptase (RT) to synthesize cDNA strands and RNase inhibitors for protection of the
template mRNA against degradation. Furthermore, cDNA synthesis buffer (5 x) for
optimal reaction conditions, RT enhancer for removal of contaminating DNA, random
hexamer (400 ng/µl), and dNTP mix are included in the kit.
Each sample was diluted with DEPC-H2O to a concentration of 1 µg RNA in 11 µl. In order
to obtain no-enzyme control (= RT control) samples, several samples were pooled: From
each sample of control and treated rats (24 hours oral toxicity study) 0.9 µl was taken and
5.6 µl DEPC-H2O was added (= RT_A), while from each sample of control and high dose
rats (28 days oral toxicity study) 0.9 µl was taken and mixed with 5.6 µl DEPC-H2O (=
RT_B). Furthermore, a water control (= no-template control) was included consisting of 11
µl DEPC-H2O without any RNA. To the 11 µl of sample or control, 1 µl random hexamer
was added and the solutions were mixed by inverting. The samples were placed in the
thermocycler (PTC‐200™ Programmable Thermal Controller MJ) for 5 min at 70 °C for
annealing of the hexamers and were then kept on ice. 8 µl Mastermix (containing 4 µl
cDNA synthesis buffer (5 x), 2 µl dNTP mix, 1 µl RT enhancer, and 1 µl VersoTM Enzyme
Mix) was added to the samples and the water control and mixed well by pipetting. To the
RT controls, the components of the Mastermix were added in the same way, except that
DEPC-H2O was added instead of VersoTM Enzyme Mix so that no reverse transcriptase was
present. Thus, no cDNA is produced and hence no PCR products should appear in later
analyses unless the sample is contaminated. Also in the water control no PCR product
should be visible since no RNA had been present as template. The samples and controls
were placed in the thermocycler (PTC‐200™ Programmable Thermal Controller MJ) and
cDNA synthesis was conducted applying 47 °C for 50 min, 95 °C for 2 min, and then

CELLULAR AND FUNCTIONAL CONSEQUENCES OF FURAN PROTEIN BINDING 85
cooling down to 4 °C. The thermocycler kept the samples at 4 °C until they were taken out
of the machine. The cDNA was stored at -80 °C until further use.
7.2.4.4 Detection of XBP1 (X-box binding protein 1) mRNA splicing
Role of XBP1 in the unfolded protein response
An important step in the activation of the unfolded protein response is the cleavage of
XBP1 mRNA to the spliced XBP1 mRNA by the cytoplasmic domain (endoribonuclease
activity) of inositol-requiring protein-1 (IRE1). The spliced XBP1 mRNA migrates into the
nucleus, where it functions as a transcription factor. Thus, the relation between unspliced
and spliced XBP1 mRNA can indicate whether the unfolded protein response is activated
in the cell. For this purpose, a PCR reaction for amplification of the cDNAs of XBP1 and
GAPDH (housekeeping gene) was conducted, followed by separation of the obtained
products on an agarose gel.
Principle of the polymerase chain reaction (PCR)
PCR is a fast and sensitive method to exponentially amplify a specific DNA sequence
defined by the added primers through several cycles of an enzymatic reaction. One
reaction cycle consists of three steps. During the first step (95 °C), the DNA is denatured
to completely separate the two strands. Next, there is the hybridization step during which
the primers anneal at specific DNA regions, followed by the synthesis step during which
the enzyme polymerase specifically synthesizes the part of the DNA strand between the
primers from deoxyribonucleotide triphosphates. Thus, the amount of DNA in the
reaction mix should double after the completion of each cycle and amplify exponentially.
However, the PCR reaction is usually linear during the starting cycles, continues in an
exponential way and reaches a plateau at the end of the cycles. This is due to the fact that
the activity of the enzyme decreases and the oligonucleotides start to hybridize amongst
each other instead of reacting with the primers. Thus, in practice the exponential
amplification occurs only at a level of 70-80 % and this reaction kinetic must be taken into
account if quantification is conducted.

86 CELLULAR AND FUNCTIONAL CONSEQUENCES OF FURAN PROTEIN BINDING
cDNA amplification by PCR
To detect whether the ratio between unspliced XBP1 mRNA (289 bp) and spliced XBP1
mRNA (263 bp) is altered by furan treatment, the cDNAs have to be amplified by PCR. The
cDNAs used for analysis had a concentration of 50 ng/µl and GAPDH was used as a
housekeeping gene. A total of 15 samples were examined including 12 cDNA samples
obtained from control and furan-treated rats (1-12) and 3 control samples (13-16) (Tab.
11).
XBP1 forward (fw) primer 5'-ccttgtggttgagaaccagg-3' (3 µM)
XBP1 reverse (rv) primer 5'-ctagaggcttggtgtatac-3' (3 µM)
GAPDH forward primer 5'-tgccactcagaagactgtgg-3' (3 µM)
GAPDH reverse primer 5'-ggatgcagggatgatgttct-3' (3 µM)
cDNA (50 ng/µl) of samples 1-12 (Tab. 11)
Thermo-Start PCR Mastermix (2x) (Thermo Fisher Scientific)
Table 11 Samples used for the detection of XBP1 mRNA splicing in livers of furan-treated rats. RT_A is the no-enzyme control of the pooled samples 1-6; RT_B is the no-enzyme control of the pooled samples 7-12.
Sample number Time point Furan dose
1 24 hours 0 mg/kg bw
2 24 hours 0 mg/kg bw
3 24 hours 0 mg/kg bw
4 24 hours 30 mg/kg bw
5 24 hours 30 mg/kg bw
6 24 hours 30 mg/kg bw
7 4 weeks 0 mg/kg bw
8 4 weeks 0 mg/kg bw
9 4 weeks 0 mg/kg bw
10 4 weeks 2 mg/kg bw
11 4 weeks 2 mg/kg bw
12 4 weeks 2 mg/kg bw
13 No-enzyme control (RT_A)
14 No-enzyme control (RT_B)
15 No-template control (DEPC-H2O)

CELLULAR AND FUNCTIONAL CONSEQUENCES OF FURAN PROTEIN BINDING 87
Table 12 Composition of the PCR reaction mixture for the detection of XBP1 mRNA splicing in livers of furan-treated rats.
Reagent Volume/tube [µl]
Thermo-Start PCR Mastermix (2x) 12.5
Fw primer (3 µM) 2.5
Rv primer (3 µM) 2.5
DEPC-H2O 5
Final Volume 22.5
To 22.5 µl PCR reaction mixture (Tab. 12), 2.5 µl cDNA or control was added and mixed by
pipetting several times. The samples were then placed in the thermocycler (PTC‐200™
Programmable Thermal Controller MJ) and incubated at 95 °C for 4 min. Then 40 reaction
cycles followed, each consisting of 95 °C for 30 seconds (denaturating of the DNA
strands), 55 °C for 30 seconds (annealing of the primers), and 72 °C for 45 seconds
(elongation). After the last cycle, another 7 min at 72 °C were applied for the polymerase
to complete the DNA synthesis. The thermocycler kept the samples at 4 °C until they were
taken out of the machine. The PCR products were stored at -80 °C until further use.
Separation of the PCR products by agarose gel electrophoresis
10x TAE (Tris-Acetate-EDTA) buffer: 48.4 g Tris-HCl, 11.42 ml acetic acid glacial, 20
ml EDTA (0.5 M) pH 8.0, 900 ml deionized water, the pH was adjusted with HCl (25
%) to pH 8.0, the solution was filled up to 1 liter with deionized water
1x TAE buffer: 100 ml 10x TAE buffer, 900 ml deionized water
Gel loading dye
Gel electrophoresis was conducted at room temperature using an Owl Separation
Systems Model B1 connected to a DC Power Supply PS 3000. To prepare a 3.5 % agarose
gel, 3.5 g agarose was heated in 100 ml 1x TAE buffer in the microwave until the agarose
had dissolved. After a short time of cooling, the liquid gel was cast in a gel form with a 14-
well gel comb and was left to cool down and to solidify. Then the cast gel was transferred
into a gel chamber. The electrophoresis chamber was filled up with 1x TAE as running
buffer until the gel was completely covered by a layer of liquid and the gel comb was
removed. For each sample, 10 µl PCR product and 2 µl gel loading dye were mixed and
loaded onto the agarose gel. One lane of the gel was used for the marker DNA ladder

88 CELLULAR AND FUNCTIONAL CONSEQUENCES OF FURAN PROTEIN BINDING
(peqGOLD Orange 50 bp). The gel chamber was connected to the power supply and the
gel was run at 80 V, 100 mA, and 9 W for 2 hours. After the run, the gel was placed in an
ethidiumbromide (EtBr) bath containing 100 µl EtBr solution (1 % in water) in 100ml 1x
TAE buffer for 30 min and was scanned with a FluorChemQ imaging system (Cell
Biosciences) to obtain digital images.
7.2.4.5 Quantitative gene expression analysis of unfolded protein response target genes using TaqMan® probes
The DNA amplification can be quantified by the use of TaqMan® probes (5' nuclease
assay). A TaqMan® probe represents an oligonucleotide that is designed to anneal within
the DNA region of interest, i.e. the DNA region specifically amplified by the added
primers, and contains a fluorophore covalently bound to its 5’-end and a quencher at the
3’-end. In this experiment, the fluorophore 6-carboxyfluorescein (acronym: FAM) and the
quencher dihydrocyclopyrroloindole tripeptide minor groove binder (acronym: MGB)
were used. When the probe is bound to the DNA in its original state, the fluorophore and
the quencher are close to each other and any fluorescence signal, which is emitted by the
fluorophore FAM after excitation, is suppressed by the quencher. During the amplification
process, the enzyme DNA polymerase synthesizes the nascent strand and, through its 5'
to 3' exonuclease activity, degrades the probe annealed to the DNA template (Fig. 28).
After cleavage of the probe, the fragments are displaced from the template, the
fluorophore and the quencher become separated, and the quenching effect is lost, thus
allowing fluorescence of the fluorophore. The accumulation of the PCR products over
time is directly proportional to the increasing fluorescence signals.
To calculate the amount of DNA in a sample, the threshold cycle value (Ct value) is used.
The Ct value is defined as the number of cycles required for the accumulated fluorescence
signals to exceed the background fluorescence level. The higher the amount of template
was in the original sample, the faster, i.e. after less cycles, the Ct value is reached, which
means there is an inversely proportional correlation between the Ct value and the
amount of template in the sample.

CELLULAR AND FUNCTIONAL CONSEQUENCES OF FURAN PROTEIN BINDING 89
Figure 28 Principle of quantitative real-time PCR using TaqMan® probes. Figure modified from http://www.hgbiochip.com/images/TaqMan.gif. FAM = fluorophore, NFQ = nonfluorescent quencher, MGB = minor groove binder, P = polymerase
TaqMan® Gene Expression Assay: Glucose-regulated protein 78 (GRP78);
(Rn00565250_m1)
TaqMan® Gene Expression Assay: Homocysteine-responsive endoplasmic
reticulum-resident ubiquitin-like domain member 1 protein (Herpud1);
(Rn00585371_m1)
TaqMan® Gene Expression Assay: housekeeping gene Glyceraldehyde-3-
phosphate dehydrogenase (GAPDH); (Rn99999916_s1)
TaqMan® Gene Expression Mastermix
cDNA (10 ng/µl) of samples 1-12 (Tab. 11)
Forward primer
Reverse primer
ProbeFAM NFQ-MGB
3‘
5‘
5‘
3‘
3‘5‘5‘
5‘
Forward primer
Reverse primer
Probe
FAMNFQ-MGB
3‘
5‘
5‘
3‘
3‘5‘
5‘
P
P
Forward primer
Reverse primer
Probe
FAM
NFQ-MGB
3‘
5‘
5‘
3‘
3‘
5‘
5‘
P
P
P
P

90 CELLULAR AND FUNCTIONAL CONSEQUENCES OF FURAN PROTEIN BINDING
Real-time PCR analysis was performed as described by Samali et al. 2010 using TaqMan®
Gene Expression Assays, which contain two unlabeled primers (20 x stock concentration is
18 µM for each primer) and one specific 6-FAM dye-labeled TaqMan® MGB probe (20 x
stock concentration is 5 µM), and TaqMan® Gene Expression Mastermix, which consists of
the main components AmpliTaq Gold® DNA Polymerase UP (Ultra Pure) and
deoxyribonucleotide triphosphates (dTNPs) (Samali et al., 2010).
The samples used for analysis were the same 15 samples described in 7.2.4.4 (Tab. 11),
but were further diluted to a cDNA concentration of 10 ng/µl. In addition, a dilution series
of one sample was pipetted diluting 1:1 with DEPC-H2O every step (from S_1:2 until
S_1:32) and included into each PCR run to obtain an internal control for the efficiency of
the PCR reaction. According to the scheme (Tab. 14), 2 µl cDNA or control was pipetted
into each well of a 96 well plate. 18 µl of the PCR reaction mixture (Tab. 13) was added
and was mixed by pipetting several times. The plate was sealed with adhesive foil and
transferred into the Roche LightCycler® 480.
Table 13 Composition of PCR reaction mixtures for the determination of gene expression of GRP78 and Herpud1 in livers of furan-treated rats.
TaqMan® PCR Volume/well [µl]
TaqMan® Gene Expression Mastermix (2x) 10
TaqMan® Gene Expression Assay (20x) 1
DEPC-H2O 7
Final Volume 18
Table 14 Pipetting scheme used for the TaqMan® PCR analyses with housekeeping gene (rows A-D) and target gene (GRP78 or Herpud1) (rows E-H).
1 2 3 4 5 6 7 8 9 10 11 12
A 1 2 3 4 5 6 7 8 9 10 11 12
B 1 2 3 4 5 6 7 8 9 10 11 12
C 1 2 3 4 5 6 7 8 9 10 11 12
D S_1:2 S_1:4 S_1:8 S_1:16 S_1:32 13 13 13 14 14 14 15
E 1 2 3 4 5 6 7 8 9 10 11 12
F 1 2 3 4 5 6 7 8 9 10 11 12
G 1 2 3 4 5 6 7 8 9 10 11 12
H S_1:2 S_1:4 S_1:8 S_1:16 S_1:32 13 13 13 14 14 14 15

CELLULAR AND FUNCTIONAL CONSEQUENCES OF FURAN PROTEIN BINDING 91
For analysis, the Roche LightCycler® 480 was run at 95 °C for 10 min to activate the
enzyme. Then, 45 amplification cycles, each consisting of 15 seconds at 95 °C
(denaturation) and 60 seconds at 60 °C (primer annealing and strand synthesis), were run.
For data analysis, the software LightCycler® 480 SW 1.5 (Roche) was used. Gene
expression was calculated as fold expression using the ΔΔ Ct method. For this relative
quantification, a normalization using a housekeeping gene was used. In this respect, it is
important that the efficiency of the PCR reactions is the same or at least similar for both
the housekeeping and the target gene in the same run. Under ideal conditions (efficiency
of 100 %), the amount of template is doubled with every cycle which means the reaction
shows an efficiency value of 2. However, in practice values between 1.8 and 2 occur and
are regarded as adequate. To ensure that the amplification efficiency of the PCR runs is
sufficient and comparable, a standard dilution series of one sample (S_1:2 to S_1:32) was
included in every run for both the housekeeping and the target gene. The PCR efficiency
was calculated using the standard dilution series and was found to be comparable for
housekeeping and target gene in both runs: Values of 1.8 and 1.9 were determined for
the runs of GRP78/GAPDH and Herpud1/GAPDH, respectively. Thus, a comparison with
the aim to detect changes in gene expression could be conducted.
7.3 Results
7.3.1 Effect of furan on body and organ weights
Oral administration of furan at doses of 0, 0.1, 0.5 and 2 mg/kg bw for 4 weeks had no
effect on the consumption of food and drinking water. Furthermore, no clinical signs of
toxicity were observed. Determination of body and relative organ weights showed no
treatment-related changes (Tab. 15).
Table 15 Body weight and relative liver weight after furan administration for 4 weeks. Data are expressed as mean ± SD (n = 5/ dose group). Statistical analysis was performed by ANOVA and Dunnett's post-hoc test (*p<0.05, **p<0.01).
Furan dose (mg/kg bw)
0 0.1 0.5 2
Body weight initial (g) 125.2 ± 6.3 124.8 ± 4.4 126.6 ± 9.8 136.9 ± 5.6
Body weight final (g) 208.5 ± 8.7 207.5 ± 9.7 199.4 ± 13.7 212.6 ± 14.3
Relative liver weight (%) 3.4 ± 0.1 3.2 ± 0.1 3.1 ± 0.04** 3.3 ± 0.1

92 CELLULAR AND FUNCTIONAL CONSEQUENCES OF FURAN PROTEIN BINDING
7.3.2 Effect of furan on clinical chemistry parameters
Furan treatment with 0, 0.1, 0.5 and 2 mg/kg bw had no significant effects on clinical
chemistry parameters in plasma or urine except for a small, but dose-dependent increase
in plasma cholesterol following 4 weeks treatment with furan, which returned to control
levels after a 2 week recovery period (Mally et al., 2010). Furthermore, a slight decrease
in glucose and alkaline phosphatase was observed, but these changes were not
considered to be toxicologically relevant. No changes in liver enzymes indicative of
hepatic injury were observed throughout the study (Tab. 16).
Table 16 Clinical chemistry after furan administration for 4 weeks. Data are expressed as mean ± SD (n = 5/ dose group). Statistical analysis was performed by ANOVA and Dunnett's post-hoc test (*p<0.05, **p<0.01). Furan dose (mg/kg bw)
0 0.1 0.5 2
Glucose (mg/dl) 164 ± 12 153 ± 6 150 ± 12 138 ± 20*
Creatinine (mg/dl) 0.3 ± 0.1 0.2 ± 0.1 0.3 ± 0.1 0.3 ± 0.1
Urea (mg/dl) 30.9 ± 3.0 29.4 ± 1.7 30.3 ± 1.6 34.2 ± 2.4
Total bilirubin (mg/dl)
0.0 ± 0.0 0.02 ± 0.05 0.02 ± 0.05 0.02 ± 0.05
Aspartate aminotransferase (U/l) 134 ± 19 132 ± 36 142 ± 56 168 ± 105
Alanine aminotransferase (U/l) 53.5 ± 5.2 58.8 ± 10.0 67.0 ± 29.2 81.1 ± 57.9
Glutamate dehydrogenase (U/l) 6.4 ± 0.7 7.4 ± 2.0 8 ± 3.2 11.2 ± 7.2
γ-Glutamyltransferase (U/l) 1.6 ± 0.7 2.2 ± 1.6 1.6 ± 0.9 1.9 ± 1.0
Alkaline phosphatase (U/l) 320 ± 35 278 ± 20* 259 ± 6** 264 ± 7.8**
Lactate dehydrogenase (U/l) 303 ± 78 255 ± 155 330 ± 216 457 ± 521
Creatinine kinase total (U/l) 1177 ± 300 982 ± 760 1004 ± 580 1344 ± 1350
Cholesterol (mg/dl) 48.6 ± 3.8 49.4 ± 3.2 53.6 ± 2.7 56.0 ± 3.5**
Triglycerides (mg/dl) 39.4 ± 9.3 59.6 ± 9.6* 53.6 ± 10.6 49.6 ± 7.6
Total protein (g/dl) 6.9 ± 0.2 6.6 ± 0.2 6.7 ± 0.3 6.9 ± 0.2

CELLULAR AND FUNCTIONAL CONSEQUENCES OF FURAN PROTEIN BINDING 93
In contrast to animals which had received furan at doses of 0.1 to 2 mg/kg bw for 4
weeks, rats treated with a single furan dose of 30 mg/kg bw showed a strong increase in
the plasma levels of aspartate aminotransferase, alanine aminotransferase, and
glutamate dehydrogenase after 24 hours, indicative of substantial liver damage (Tab. 17)
(Hoffmann, 2010). Furthermore, γ-glutamyltransferase was found to be elevated in
plasma, while alkaline phosphatase and total bilirubin levels remained unchanged.
Table 17 Clinical chemistry 24 hours after a single dose of furan (30 mg/kg bw). Data are expressed as mean ± SD (n = 4/ dose group). Statistical analysis was performed by unpaired t-test (*p<0.05, **p<0.01).
Control Furan (30 mg/kg bw, 24h)
Total bilirubin [mg/dl] 0.0 ± 0.1 0.0 ± 0.1
Aspartate aminotransferase [U/l] 101 ± 16 853 ± 235**
Alanine aminotransferase [U/l] 65 ± 5 874 ± 232**
Glutamate dehydrogenase [U/l] 6 ± 1 800 ± 247**
γ-Glutamyltransferase [U/l] 0.6 ± 0.5 0.9 ± 0.4
Alkaline phosphatase [U/l] 361 ± 26 379 ± 43
7.3.3 Histopathological alterations after furan treatment
Consistent with the lack of effects of furan exposure on plasma transaminases, light
microscopic evaluation of H&E (hematoxylin and eosin) stained liver sections did not
reveal marked histopathological changes in response to furan treatment (2 mg/kg bw) for
28 days (Fig. 29A) (Mally et al., 2010). However, slight inflammation was observed in
subcapsular regions of left liver lobes (Fig. 29C). Few apoptotic cells were seen in the
various exposed livers, but at similar frequency as in the control livers.
In contrast, furan administration of 30 mg/kg bw induced extensive degeneration and
inflammation within liver parenchyma and subcapsular areas after 24 hours (Fig. 29B, D).
Consistent with these results, a similar study in rats using furan doses of 30 mg/kg bw also
showed subcapsular and centrilobular necrosis and inflammation already at 24 hours
after the first dose (Hickling et al., 2010a).

94 CELLULAR AND FUNCTIONAL CONSEQUENCES OF FURAN PROTEIN BINDING
Figure 29 Rat liver after furan administration (left liver lobes; hematoxylin and eosin stain). Treatment with 2 mg/kg bw furan for 28 days showed no marked treatment-related effects around the central vein (A). In contrast, furan administration of 30 mg/kg bw induced extensive degeneration and inflammation (arrows) in the parenchyma around the central vein after 24 hours (B). While slight subcapsular inflammation (arrows) was observed in livers of rats treated with 2 mg/kg bw furan for 28 days (C), extensive degeneration and inflammation (arrows) was observed in this area after administration of furan (30 mg/kg bw) after 24 hours (D).
A
C
B
D
Furan 28 days Furan 24 hours
control
2 mg/kg bw
control
30 mg/kg bw
control control
2 mg/kg bw 30 mg/kg bw

CELLULAR AND FUNCTIONAL CONSEQUENCES OF FURAN PROTEIN BINDING 95
7.3.4 Alterations in protein expression after furan treatment
In good agreement with the overall absence of significant hepatotoxicity, proteomics
analysis by 2D-GE did not reveal significant alterations in protein expression in livers of
rats treated with furan at doses up to 2 mg/kg bw for 28 days (Fig. 30). For the cytosolic,
membrane, nuclear and cytoskeletal fraction 911, 1221, 1061, and 728 protein spots were
detected, respectively, none of which showed a significant treatment-related change.
Figure 30 Gel images of the cytosolic fraction of a control rat (A) and a rat treated with 2 mg/kg bw for 4 weeks (B) and two representative enlarged sections of A (a, c) and B (b, d) as indicated by the red rectangles. No changes in protein expression were evident after furan treatment.
7.3.5 Impact of furan treatment on activation of the unfolded protein response
Splicing of XBP1 mRNA was analyzed in livers of furan treated rats by semiquantitative RT-
PCR using primers designed to detect both unspliced and spliced XBP1 mRNA (Samali et
al., 2010). Expression of key UPR target genes encoding GRP78, which we also identified
as a protein target of furan, and Herpud1, one of the most highly inducible UPR targets,
were analyzed using predesigned TaqMan® assays (Samali et al., 2010). Low levels of
spliced XBP1 mRNA were detected in both control and furan treated samples (Fig. 31A).
However, no treatment related effects on XBP1 mRNA splicing were evident. Consistent
with these findings, gene expression analysis did not reveal upregulation of GRP78 and
Herpud1 (Fig. 31B). Thus, under the conditions of our studies, protein binding of furan
reactive metabolites does not appear to trigger an unfolded protein response. It is
important to note that the unfolded protein response was not found to be activated at
the high furan dose of 30 mg/kg bw, which was clearly shown to induce toxic effects in rat

96 CELLULAR AND FUNCTIONAL CONSEQUENCES OF FURAN PROTEIN BINDING
liver, such as increases in liver enzymes indicative of hepatic injury and extensive hepatic
degeneration and inflammation.
Figure 31 X-box binding protein 1 (XPB-1) mRNA splicing (A) and expression of unfolded protein response (UPR) target genes (B) in rat liver in response to treatment with furan. No treatment-related changes in either XBP-1 m RNA splicing or UPR target gene expression were evident. GRP78 = 78 kDa glucose-regulated protein, HERP = Herpud1 = homocysteine-inducible, endoplasmic reticulum stress-inducible, ubiquitin-like domain member 1
7.4 Discussion
A subacute oral toxicity study was conducted to determine the cellular and functional
consequences potentially associated with covalent protein binding after administration of
a known carcinogenic dose (2 mg/kg bw) and at lower doses closer to estimated human
exposure (0.5 and 0.1 mg/kg bw). After 28 days of furan administration, body and organ
weight, clinical chemistry parameters, histopathological examination of liver tissue, and
analysis of protein expression showed no evidence of hepatotoxic effects except for a
slight and reversible increase in plasma cholesterol.
However, further analyses conducted within our group and by our collaborators revealed
that furan treatment caused cellular and functional changes indicative of mild
hepatotoxicity.
Furan(mg/kg bw)
Treatment time
UPR target gene expression(fold change relative to controls)
GRP78 HERP
0 24h 1.0 ± 0.43 1.0 ± 0.51
30 24h 0.96 ± 0.06 1.02 ± 0.08
0 28d 1.0 ± 0.05 1.0 ± 10
2 28d 0.82 ± 0.15 0.94 ± 0.33
UPR target gene expression (TaqMan®)
289 bp - Unspliced mRNA
263 bp - Spliced mRNA
X box-binding protein 1 (XBP1) mRNA splicing
Furan (mg/kg bw)0 30 20
24h 28d
A
B

CELLULAR AND FUNCTIONAL CONSEQUENCES OF FURAN PROTEIN BINDING 97
In line with findings that furan administration caused enhanced plasma levels of bile acids
in female B6C3F1 mice (Fransson-Steen et al., 1997), furan treatment (2 mg/kg bw) for 4
weeks was found to induce a statistically significant increase of unconjugated bile acids in
rat plasma (Mally et al., 2010). Considering the fact that plasma cholesterol was also
observed to be slightly increased in this study, this indicates that furan may impair
hepatobiliary transport. Since unconjugated bile acids are known to induce necrosis and
apoptosis (Palmeira and Rolo, 2004), accumulation of unconjugated bile acids caused by
impaired hepatobiliary transport may contribute to cellular injury.
Furthermore, assessment of cell proliferation in subcapsular areas of the left and caudate
lobes revealed a statistically significant increase in the number of proliferating
hepatocytes in high dose rats (2 mg/kg bw), suggesting that furan treatment may lead to
proliferative changes even at doses which do not induce no significant hepatotoxicity. In
support of this, an increase in cell proliferation without the occurrence of elevated liver
enzymes indicative of hepatic injury was observed in rats after furan treatment with 8
mg/kg bw for 6 weeks (Wilson et al., 1992). In addition, the localization of lesions is
consistent with previous studies at higher doses showing necrosis, inflammatory cell
infiltration, proliferation and fibrotic changes developing from the subcapsular visceral
surface and extending into the parenchyma (Hickling et al., 2010a).
Consistent with the proliferative changes observed after 4 weeks of furan administration,
gene expression analysis of rat liver tissue revealed significant alterations in the
expression of genes involved in cell-cycle control (Chen et al., 2010). In addition to cell-
cycle control genes, also apoptosis-related genes were found to be altered, but in this
group the greatest response was at 2 mg/kg bw. In contrast to these two groups of genes,
no significant alterations in genes related to DNA damage response were seen at the dose
levels used in the 28 days oral toxicity study, indicating that the levels of protein binding
observed after treatment with 0.1 or 2 mg/kg bw furan (6.3.1) may not result in oxidative
stress. This is in line with the finding that no significant changes on 8-oxo-7,8-dihydro-2´-
deoxyguanosine (8-oxo-dG) levels were evident after furan treatment at doses of 2 mg/kg
bw and below for 4 weeks (Mally et al., 2010).
Conversely, in a recent study performed with a high dose of furan (30 mg/kg bw) both
expression changes of genes associated with DNA damage and increased levels of 8-oxo-
dG indicative of oxidative DNA damage were observed (Hickling et al., 2010b).

98 CELLULAR AND FUNCTIONAL CONSEQUENCES OF FURAN PROTEIN BINDING
In addition to the analyses on furan hepatotoxicity, we addressed the question whether
protein binding by furan induces activation of the unfolded protein response (UPR) in rat
liver. No signs for activation of the UPR were observed after furan administration of 2
mg/kg bw. Since furan treatment at this dose only resulted in slight evidence for toxic
effects after 4 weeks, these findings suggest that furan does not lead to significant
accumulation of misfolded proteins under these conditions. However, even at a high
furan dose (30 mg/kg bw for 24 hours), which clearly showed hepatotoxic effects such as
necrosis and inflammation (Hickling et al., 2010a) and which would be expected to induce
cellular defense mechanisms, no activation of the UPR was evident in our experiments.
Thus, protein adduct formation caused by furan treatment associated with marked
hepatotoxicity did not appear to trigger the unfolded protein response. However, this
finding may also indicate that cells lack the ability to adequately respond to protein
damage and thus cannot activate the unfolded protein response despite the
accumulation of damaged proteins. Support for this comes from the fact that loss of
function of GRP 78, which was identified as a furan target protein, was reported to
increase ER stress-induced cell death, presumably through inhibition of homeostatic
responses to ER stress (e.g. UPR) (Martin et al., 2010). Hence, adduction of GRP78 by
furan reactive metabolites may disrupt the cellular ability to activate the unfolded protein
response, which may result in cell death. These events may play a role in furan-induced
carcinogenicity.
7.5 Conclusions
The cellular and functional consequences of subacute furan administration which may be
associated with covalent protein binding were determined to establish a link between
protein adduct formation and the toxicity and carcinogenicity of furan. Furan treatment
with the known carcinogenic dose of 2 mg/kg bw and below for 4 weeks was found not to
induce marked hepatotoxicity, although a statistically significant increase of unconjugated
bile acids and cholesterol in plasma was observed (Mally et al., 2010). This indicates that
furan may impair hepatobiliary transport, which may contribute to cellular injury through
hepatic accumulation of surface-active and hence toxic bile acids. Furthermore, increased
cell proliferation and alterations in the expression of genes involved in cell-cycle control
and apoptosis were observed, suggesting that chronic furan exposure may lead to

CELLULAR AND FUNCTIONAL CONSEQUENCES OF FURAN PROTEIN BINDING 99
proliferative changes even at doses below the already known carcinogenic dose.
Considering the collective findings of the subacute toxicity study, it seems that the levels
of protein binding observed after furan administration of 2 and 0.1 mg/kg bw (6.3.1) may
not be sufficient to induce pronounced hepatotoxicity. However, results from this study
also suggest that protein binding may contribute to furan toxicity and carcinogenicity
through mechanisms such as impairment of the hepatobiliary transport by adduct
formation with involved transport proteins.
A further possible explanation how protein adduct formation may be linked to the toxicity
and carcinogenicity of furan may be that covalent protein binding may compromise the
three-dimensional protein structure and may thus lead to accumulation of misfolded and
nonfunctional proteins in the endoplasmic reticulum (ER). This ER stress may then trigger
the activation of the unfolded protein response (UPR), a cellular defense mechanism
against accumulation of unfolded proteins. Upon activation of the UPR, splicing of XBP1
mRNA and expression of UPR target genes are specifically altered. However, neither
altered XBP1 mRNA splicing nor expression changes of UPR target genes were evident in
our experiments. This may either be due to the fact that not enough damaged and
nonfunctional proteins accumulate in rat livers after administration of furan to trigger the
UPR or may result from loss of function of a protein involved in activation of the UPR
(GRP 78). In support of the latter, even a clearly hepatotoxic dose of furan did not appear
to activate the UPR.

100 PATHWAY ANALYSIS AND BIOLOGICAL INTERPRETATION
8 PATHWAY ANALYSIS AND BIOLOGICAL INTERPRETATION OF FURAN TARGET PROTEINS
8.1 Introduction
Covalent binding of furan reactive metabolites to cellular proteins, subsequent cell death
and regenerative cell proliferation may represent important steps in the mechanism of
furan toxicity and carcinogenicity in rat liver. To date, it is still unknown which proteins
are critical for the development of cytotoxicity caused by protein adduct formation.
According to their functions, cellular proteins can be assigned to specific pathways. Since
it is well known that adduct formation at proteins may lead to loss of their function,
covalent binding to different proteins involved in the same pathway may result in
disruption of this pathway. Using pathway mapping tools, we wanted to determine which
pathways are enriched among the identified furan target proteins. Thus, identification of
possibly impaired pathways may provide information regarding the cellular events that
link cytotoxicity and adduct formation at the 61 identified furan target proteins.
Moreover, it was suggested that there may be individual proteins with key functions
whose loss of function may lead to cytotoxicity. Hence, a literature research was
conducted to better understand individual protein functions and to establish a
mechanistic connection between loss of protein function and cytotoxicity.
8.2 Methods
8.2.1 Pathway mapping to identify significantly enriched pathways
To establish whether there are metabolic pathways which are specifically enriched among
the 61 identified furan target proteins, a list of the UniProt IDs of the target proteins was
copied and pasted into an online pathway analysis tool called Database for Annotation,
Visualization and Integrated Discovery (DAVID, version 6.7)
(http://david.abcc.ncifcrf.gov/) (Dennis, Sherman et al. 2003; Huang da, Sherman et al.
2009). The identifier "UNIPROT_ACCESSION" and the list type "Gene List" were selected
for the protein list and the list was submitted for analysis. Then the functional annotation
tool was used to view the results. The annotation summary results for the three gene
ontology (GO) terms biological process, cellular compartment, and molecular functions
and for the Kyoto Encyclopedia of Genes and Genomes (KEGG) pathways were selected.
The enriched pathways showing p-values of less than 0.05 were inspected and

PATHWAY ANALYSIS AND BIOLOGICAL INTERPRETATION 101
summarized. The DAVID software uses the EASE Score, a modified Fisher Exact p-Value, to
measure whether an enrichment in annotation terms is significant. For the calculation of
the EASE Score p-value for each annotation category, the total number of entries of the
background list (i.e. the default background list of Rattus norvegicus), the total number of
entries belonging to the annotation category, the total number of entries on the list
which was uploaded into DAVID (61 target proteins), and the number of entries from the
uploaded list which was assigned to the annotation category were considered.
To illustrate the considerations which are the basic of these calculations, a hypothetical
example taken from the DAVID website is described: In an uploaded list containing 300
entries, 3 entries were found to be involved in a certain pathway (p53 signaling). The
background list in this case includes 30000 entries, 40 of which participate in total in p53
signaling. The question is now whether 3/300 is more than random chance compared to
the background of 40/30000. In this example, an EASE Score of 0.06 was calculated, which
means, regarding a significance threshold of 0.05, that this specific enrichment is not
statistically significant.
The pathway analysis was first conducted using the 61 furan target proteins. Moreover, a
second analysis was performed with an extended protein list including the 61 already
analyzed proteins and 37 additional proteins which had closely failed to meet the
stringently set criteria for protein identification (6.3.2). The second analysis was done to
find out whether these additional proteins may also participate in the pathways found to
be enriched in the first analysis.
8.2.2 Literature search
Various sources such as PubMed (http://www.ncbi.nlm.nih.gov/pubmed) and the Protein
Knowledgebase UniProtKB (http://www.uniprot.org/) were used to obtain information on
individual target protein functions and loss of their functions.

102 PATHWAY ANALYSIS AND BIOLOGICAL INTERPRETATION
8.2.3 Semiquantitative analysis to estimate the degree of protein adduction
To gather information as to which proteins appear to be most heavily adducted relative
to their abundance in rat liver, a densitometric analysis was conducted. Therefore,
Coomassie Blue-stained gels and their corresponding films obtained by fluorography were
scanned on a HP ScanJet 5550C flatbed scanner to obtain digital images and
densitometric analysis was performed using Ludesi Redfin3 (Ludesi) software. The relative
ratios of the amount of radioactivity present in spots on the film (arbitrary units) and the
total amount of protein as detected by Coomassie Blue staining (arbitrary units) were
calculated for each spot. In the next step, the mean ratios and standard deviations were
determined. This allowed ranking of target proteins according to the degree of protein
adduction relative to the abundance of the protein. Ranking was performed separately
for proteins isolated from gels derived from pH 4-7 (whole tissue extract), pH 6-9 (whole
tissue extract), and pH 4-7 (membrane fraction) due to different exposure times and
different amounts of protein loaded onto the gels.
8.3 Results and discussion
8.3.1 Significantly enriched pathways identified by pathway mapping
Pathway mapping of the 61 furan target proteins using DAVID revealed fatty acid, amino
acid, and glucose metabolism as significantly enriched KEGG pathways with 7/61 (11.5 %),
7/61 (11.5 %), and 8/61 (13.1 %) proteins assigned to the annotation terms, respectively
(Tab. 18). Similarly, the gene ontology category biological process glucose metabolic
process (9/61, 14.8 %), nitrogen compound biosynthetic process (9/61, 14.8 %), and fatty
acid metabolic process (6/61, 9.8 %) were found to be significantly enriched. The
differences in the exact numbers of proteins assigned to the terms is due to the fact that
the terms in KEGG pathways and gene ontology are not fully identical. Additionally, the
gene ontology category biological process showed significant enrichment in the
annotation terms oxidation/reduction (17/61, 27.9 %), generation of precursor
metabolites and energy (11/61, 18 %), and cell redox homeostasis (5/61, 8.2 %).
Furthermore, we found that a large number of proteins were derived from mitochondria
(24/61, 39.3 %) and cytosol (21/61, 34.4 %).
It is important to note that the terms are not mutually exclusive and that some proteins
may be assigned to more than one annotation term. For example, the protein aldehyde

PATHWAY ANALYSIS AND BIOLOGICAL INTERPRETATION 103
dehydrogenase (P11884) was observed in all three, while the protein acetyl-CoA
acetyltransferase (P17764) was found in two of the three enriched KEGG pathways.
Table 18 Enriched categories and terms as determined with the DAVID Gene-Enrichment and Functional Annotation Analysis (Dennis et al., 2003; Huang da et al., 2009); *indicates number of proteins in the dataset that belong to this category, **indicates percentage of proteins in the dataset that belong to this category, *** p-Values were calculated with a modified Fisher exact test.
Annotation category Annotation term Proteins assigned to
annotation term Count* %** p-Value***
KEGG pathway
Fatty acid metabolism P13437, P14604, P15650, P15651, P17764,
P18163, P11884 7 11.5 2.9 x 10⁻⁷
Valine, leucine and isoleucine degradation
P11884, P11960, P12007, P13437, P14604,
P15651, P17764 7 11.5 5.0 x 10⁻⁷
Glycolysis / Gluconeogenesis
P00884, P04642, P04764, P04797, P11884,
P16617, P19112, P48500 8 13.1 1.2 x 10⁻⁶
Gene ontology
Cellular component
Mitochondrion
O35077, O88989, P00481, P04642, P09034,
P10719, P11232, P11884, P11960, P12007,
P13437, P13803, P14604, P15650, P15651,
P17764, P18163, P52759, P97532, Q07116,
Q63716, Q8CG45, Q9JJ40, Q9Z2L0
24 39.3 4.9 x 10⁻⁹
Cytosol
O35077, O88989, P00884, P02692, P02761,
P04642, P04764, P04797, P06214, P06761,
P11232, P16617, P18163, P19112, P48500,
P60711, P63018, Q07116, Q499R7, Q63716,
Q9ES53
21 34.4 1.3 x 10⁻⁷
Gene ontology
Biological process
Oxidation/Reduction
O35077, O88989, P04642, P04797, P11232,
P11884, P11960, P12007, P13803, P15650,
P15651, P23457, Q07116, Q5I0J9, Q63716,
Q8CG45, Q920J4
17 27.9 7.2 x 10⁻⁹
Generation of precursor metabolites and energy
O88989, P00884, P04642, P04764, P04797,
P10719, P11232, P13803, P16617, P48500,
Q920J4
11 18 9.7 x 10⁻⁸
Glucose metabolic process O35077, O88989, P00884, P04642, P04764,
P04797, P16617, P19112, P48500 9 14.8 1.2 x 10⁻⁶
Nitrogen compound biosynthetic process
O09171, P00481, P06214, P07824, P09034,
P10719, P13444, P51583, Q5I0J9 9 14.8 1.1 x 10⁻⁴
Cell redox homeostasis P04785, P11232, P11598, Q63716, Q920J4 5 8.2 1.9 x 10⁻⁴
Fatty acid metabolic process
P13437, P14604, P15650, P15651, P18163,
P48500 6 9.8 1.6 x 10⁻³
Gene ontology
Molecular function Electron carrier activity P12007, P13803, P15650, P15651, Q07116 5 8.2 2.1 x 10⁻²
In addition to the 61 proteins identified as putative furan target proteins, 37 further
proteins were found which did not match our stringent criteria set for protein
identification. These additional proteins have not been included in the detailed
interpretation. However, since the additional proteins may also represent furan target
proteins which may just have closely failed to meet the stringently set criteria, we were
interested to see whether they provide further support to our findings regarding possible
mechanisms involved in furan-mediated cytotoxicity and carcinogenicity. Thus, a further

104 PATHWAY ANALYSIS AND BIOLOGICAL INTERPRETATION
analysis using DAVID was conducted in which the 37 additional proteins were included
(Tab. 19).
Table 19 Enriched categories and terms as determined with the DAVID Gene-Enrichment and Functional Annotation Analysis (Dennis et al., 2003; Huang da et al., 2009); *indicates number of proteins in the dataset that belong to this category, **indicates percentage of proteins in the dataset that belong to this category, *** p-Values were calculated with a modified Fisher exact test. Additional proteins assigned to the terms and newly observed terms are marked in red.
Category Term Enriched proteins Count* %** p-Value***
KEGG pathway
Fatty acid metabolism P13437, P14604, P15650, P15651, P17764,
P18163, P11884, Q9JLJ3 8 8.2 2.9 x 10⁻⁷
Valine, leucine and isoleucine degradation
P11884, P11960, P12007, P13437, P14604,
P15651, P17425, P17764, P22791, P29266,
Q99PU6, Q9JLJ3
12 12.4 1.2 x 10⁻¹²
Glycolysis / Gluconeogenesis
P00884, P04642, P04764, P04797, P11884,
P16617, P19112, P48500, Q9JLJ3 9 9.3 3.2 x 10⁻⁶
Gene ontology
Cellular component
Mitochondrion
O35077, O88989, P00173, P00481, P04642,
P09034, P10719, P11232, P11884, P11960,
P12007, P13437, P13803, P14604, P15650,
P15651, P15999, P17764, P18163, P22734,
P22791, P24329, P29266, P41562, P51650,
P52759, P60901, P70473, P97532, Q05982,
Q07116, Q63060, Q63716, Q68FT4, Q6AYQ8,
Q8CG45, Q99PU6, Q9JJ40, Q9JLJ3, Q9QZU7,
Q9Z2L0
41 42.3 5.9 x 10⁻¹⁷
Cytosol
O35077, O88989, P00884, P02692, P02761,
P04642, P04764, P04797, P06214, P06761,
P11232, P16617, P17425, P18163, P19112,
P22734, P25093, P25409, P41562, P48500,
P50237, P60711, P63018, Q05982, Q07116,
Q499R7, Q5RK09, Q63060, Q63716, Q6P9T8,
Q9EQS0, Q9ES53, Q9JLJ3
33 34.0 7.4 x 10⁻¹²
Gene ontology
Biological process
Oxidation/Reduction
O35077, O88989, P00173, P04176, P04642,
P04797, P11232, P11884, P11960, P12007,
P13803, P15650, P15651, P23457, P29266,
P32755, P41562, P51650, Q07116, Q5I0J9,
Q5I0M4, Q63716, Q8CG45, Q920J4, Q9JLJ3,
Q9QZU7,
26 26.8 5.6 x 10⁻¹³
Generation of precursor metabolites and energy
O88989, P00173, P00884, P04642, P04764,
P04797, P10719, P11232, P13803, P15999,
P16617, P41562, P48500, P51650, Q68FT4,
Q920J4
16 16.5 1.2 x 10⁻¹⁰
Glucose metabolic process
O35077, O88989, P00884, P04642, P04764,
P04797, P16617, P19112, P29266, P48500,
P51650, Q9EQS0
12 12.4 4.9 x 10⁻⁸
Nitrogen compound biosynthetic process
O09171, P00481, P04176, P06214, P07824,
P09034, P10719, P13444, P15999, P51583,
Q05982, Q5I0J9, Q9JLJ3, Q9QZU7
14 14.4 5.9 x 10⁻⁷
Cell redox homeostasis P04785, P11232, P11598, Q63716, Q920J4 5 5.2 1.1 x 10⁻³
Steroid metabolic process P04276, P17425, P22734, P22791, P23457,
P70473, Q6PAH0 7 7.2 1.3 x 10⁻³
Fatty acid metabolic process
P13437, P14604, P15650, P15651, P18163,
P48500, P51650 7 7.2 2.3 x 10⁻³
Gene ontology
Molecular function Electron carrier activity
P00173, P12007, P13803, P15650, P15651,
Q07116, Q9QZU7 7 7.2 7.2 x 10⁻³

PATHWAY ANALYSIS AND BIOLOGICAL INTERPRETATION 105
In comparison to the first DAVID analysis, additional proteins were assigned to all terms
except the gene ontology term cell redox homeostasis. The gene ontology term steroid
metabolic process, which had not been observed in the first DAVID analysis, was found to
be significantly enriched in the second analysis. In the category KEGG pathway, the terms
fatty acid metabolism and glycolysis/gluconeogenesis both showed one additional
protein, while 5 additional proteins were assigned to the term valine, leucine and
isoleucine degradation. Thus, it appears that the degradation of the branched chain
amino acids became more important. Moreover, 42.3 % (before: 39.3 %) of the proteins
were now assigned to the gene ontology term mitochondrion, while the percentage of
proteins in the dataset assigned to the cytosol did not change after analysis including the
additional proteins (34.4 % vs. 34.0 %). Hence, it seems that a larger fraction of proteins is
associated with the mitochondrion.
8.3.2 Adduction of proteins involved in glucose and fatty acid metabolism suggests impaired energy production as a mechanism of furan toxicity
Pathway mapping of the 61 furan target proteins using DAVID revealed that furan binds
to a range of proteins involved in glycolysis/gluconeogenesis (α-enolase, fructose-
bisphosphate aldolase B, fructose-1,6-bisphosphatase, glyceraldehyde-3-phosphate
dehydrogenase, L-lactate dehydrogenase A chain, phosphoglycerate kinase 1,
triosephosphate isomerase), mitochondrial fatty acid metabolism (long-chain fatty acid
CoA ligase 1, short/long-chain specific acyl-CoA dehydrogenase, enoyl-CoA hydratase, 3-
ketoacyl-CoA thiolase) and ATP synthesis (ATP synthase β subunit) (Fig. 32 and 33).

106 PATHWAY ANALYSIS AND BIOLOGICAL INTERPRETATION
Figure 32 Furan target proteins (red) involved in glycolysis and gluconeogenesis (modified from KEGG Pathway Database, http://www.genome.jp/kegg/pathway.html).
Glucose
Glucose-6-phosphate
Fructose-6-phosphate
Fructose-1,6-bisphosphatase(regulatory enzyme of gluconeogenesis)
Fructose bisphosphate aldolase
Fructose-1,6-bisphosphate
Dihydroxyacetone-phosphate
Glyceraldehyde-3-phosphate
Triosephosphateisomerase
1,3-Bisphosphoglycerate
3-Phosphoglycerate
2-Phosphoglycerate
Phosphoenolpyruvate
Pyruvate
Lactate
Lactate dehydrogenase
α-Enolase
Glyceraldehyde-3-phosphate dehydrogenase
Phosphoglycerate kinase
Hexokinase
Glucose-6-phosphate isomerase
Phosphoglycerate mutase
Pyruvate kinase
Phosphofructokinase

PATHWAY ANALYSIS AND BIOLOGICAL INTERPRETATION 107
Figure 33 Furan target proteins (red) involved in mitochondrial β-oxidation of fatty acids (modified from KEGG Pathway Database, http://www.genome.jp/kegg/pathway.html).
Provided that covalent binding of furan actually results in an impaired or loss of protein
function, it is possible that glycolysis/gluconeogenesis and mitochondrial β-oxidation may
be disrupted. This may lead to a decreased supply of precursor metabolites crucial for the
production of energy in the mitochondria, i.e. pyruvate and acetyl-CoA as final products
of glycolysis and mitochondrial β-oxidation of fatty acids, respectively. Under
physiological conditions, these precursors enter the citric acid cycle in the mitochondrial
matrix, resulting in the formation of CO2 and reduction equivalents NADH/H+ and FADH2.
The obtained reduction equivalents are then oxidized by the respiratory chain, leading to
the production of ATP. However, if there is a strong decrease in the concentration of the
precursor compounds, the production of ATP may be decreased.
In addition, we found that furan also binds to several enzymes involved in degradation of
amino acids (2-oxoisovalerate dehydrogenase subunit α, isovaleryl-CoA dehydrogenase,
short-chain specific acyl-CoA dehydrogenase, enoyl-CoA hydratase, 3-ketoacyl-CoA
thiolase, acetyl-CoA acetyltransferase, ornithine carbamoyltransferase, argininosuccinate
synthase, arginase 1). Under physiological conditions, these amino acid degradation
pathways also supply acetyl-CoA, pyruvate or other intermediates which enter the citric
acid cycle and contribute to energy production (Fig. 34). Taken together, overall
impairment of energy production may occur due to disruption of several different
pathways which normally lead to formation of energy precursors (Fig. 35).
Fatty acid
Acyl-CoA
Trans-enoyl-CoA
L-3-Hydroxyacyl-CoA
3-Ketoacyl-CoA
Acyl-CoA + Acetyl-CoA
3-Ketoacyl-CoA thiolase
Enoyl-CoA hydratase
Acyl-CoA dehydrogenase
Fatty acid CoA ligase
3-Hydroxyacyl-CoA dehydrogenase

108 PATHWAY ANALYSIS AND BIOLOGICAL INTERPRETATION
Figure 34 Adducted proteins (red) involved in the degradation of branched chain amino acids exemplified by leucine (modified from KEGG Pathway Database, http://www.genome.jp/kegg/pathway.html).
L-Leucine
4-Methyl-2-oxopentanoate
3-Methyl-1-hydroxybutyl-thiamin diphosphate
S-(3-Methylbutanoyl)-dihydrolipoamide-E
3-Methylbutanoyl-CoA
3-Methylbut-2-enoyl-CoA
3-Methylglutaconyl-CoA
(S)-3-Hydroxy-3-methylglutaryl-CoA
Acetoacetate
Isovaleryl-CoA dehydrogenase
Enoyl-CoA hydratase
Acetyl-CoA acetyltransferase
Acetyl-CoA
Acetoacetyl-CoA
3-Hydroxyisovaleryl-CoA
2-Oxoisovalerate dehydrogenase subunit alpha
2-Oxoisovalerate dehydrogenase subunit alpha
Branched-chain amino acid aminotransferase
Dihydrolipoyl transacylase
3-Methylcrotonyl-CoA carboxylase alpha subunit
Methylglutaconyl-CoA hydratase
Hydroxymethylglutaryl-CoAlyase
Hydroxymethylglutaryl-CoAsynthase
3-Oxoacid CoA-transferase

PATHWAY ANALYSIS AND BIOLOGICAL INTERPRETATION 109
Figure 35 Connection of cellular pathways potentially affected by furan protein binding (modified from KEGG Pathway Database, http://www.genome.jp/kegg/pathway.html).
In addition to potential insufficient supply of precursor metabolites and reduction
equivalents, the respiratory chain and the oxidative phosphorylation may also be
disrupted since subunits of the electron transfer flavoprotein and the ATP synthase were
identified as target proteins of furan reactive metabolites.
Inhibition of the mitochondrial β-oxidation and impairment of the respiratory chain
(causing the formation of reactive oxygen species) were reported to result in severe
cellular consequences leading to necrosis, inflammation, and fibrosis (Pessayre et al.,
1999). Taken together, this suggests that furan cytotoxicity may result from ATP depletion
and oxidative stress through decreased generation of acetyl-CoA and accumulation of
free fatty acids, which act as mitochondrial uncouplers (Skulachev, 1991; Vickers, 2009)
(Fig. 36). This is consistent with a study by Mugford et al. which demonstrates that
uncoupling of hepatic oxidative phosphorylation is an early event in furan-mediated cell
death (Mugford et al., 1997).
Citrate
Isocitrate
α-Ketoglutarate
Succinyl-CoASuccinate
Fumarate
Malate
Oxaloacetate
Acetyl-CoA
Pyruvate
Urea cycle(8.3.3.4)
Glycolysis
β-OxidationAmino acid
degradation(isoleucine,
leucine, valine)
Citric acid cycle
Amino aciddegradation(isoleucine,
leucine, valine)
Amino aciddegradation
(cysteine)(8.3.3.5)

110 PATHWAY ANALYSIS AND BIOLOGICAL INTERPRETATION
Figure 36 Potential mechanistic link between furan toxicity and adducted proteins: impaired mitochondrial energy production and altered redox state due to binding to ATP synthase and enzymes
involved in glycolysis and mitochondrial -oxidation.
While α-enolase, fructose-bisphosphate aldolase B, glyceraldehyde-3-phosphate
dehydrogenase, phosphoglycerate kinase 1, and triosephosphate isomerase were shown
to form adducts with hepatotoxic metabolites of thiobenzamide and bromobenzene
(Ikehata et al., 2008; Koen et al., 2007), it is interesting to note that several of the
enzymes involved in energy production, i.e. 3-ketoacyl-CoA thiolase, long-chain fatty acid
CoA ligase 1, long-chain specific acyl-CoA dehydrogenase, fructose-bisphosphate aldolase
B, glyceraldehyde-3-phosphate dehydrogenase, and ATP synthase β subunit were
previously shown to represent targets of teucrin A, a hepatotoxic furan-containing
compound found in the herb germander, which is bioactivated to an 1,4-enedial
derivative structurally similar to cis-2-butene-1,4-dial (Druckova et al., 2007). Since
teucrin A was shown to form adducts with several mitochondrial proteins, it was
suggested that mitochondrial dysfunction may play a role in teucrin A-induced
cytotoxicity (Druckova et al., 2007).
Glucose
Pyruvate
Fatty acids
Fatty acyl-CoA
Acetyl-CoA
H+ e-
NADH + H+NAD+
O24- 4H+
H2O
ANT
ADP ATPPi
ATP
SYN
O2
+ -
+ -
+ -
+ -
+ -
+-
+-
+-
+-
+-
Electron
Transport Chain
ATP synthesis (oxidative phosphorylation) in mitochondriaATP synthase subnunit β

PATHWAY ANALYSIS AND BIOLOGICAL INTERPRETATION 111
8.3.3 Potential link between furan toxicity and impaired function of individual target proteins
8.3.3.1 Proteins involved in transport processes across the mitochondrial membranes
Further support for mitochondrial toxicity as a key event in furan mediated cell death
comes from the finding that voltage-dependent anion-selective channel protein 1
(VDAC1, also known as porin) appears to be targeted by furan. VDAC1 is a pore-forming
protein in the outer mitochondrial membrane, which facilitates exchange of metabolites
such as ADP/ATP, succinate and citrate between the cytosol and mitochondria, thereby
contributing to the regulation of mitochondrial energy metabolism (Lawen et al., 2005).
Silencing of VDAC1 has been shown to impair mitochondrial ATP production (Abu-Hamad
et al., 2006). In addition, there is increasing evidence to suggest that VDAC1 is a key
player in apoptosis by forming complexes with Bcl-2 family proteins such as Bax, Bak, Bcl-
2 and Bcl-XL and regulating cytochrome c release (Lawen et al., 2005; Shoshan-Barmatz et
al.). Although the precise mechanism as to how binding of pro- and anti-apoptotic
proteins to VDAC1 modulates mitochondrial permeability is still unknown, dissociation
from VDAC1 may promote mitochondria-dependent apoptosis (Shoshan-Barmatz et al.,
2010). Interestingly, VDAC1 has also been identified as a protein target of acrolein, a
cytotoxic -unsaturated aldehyde, which – similar to cis-2-butene-1,4-dial –
preferentially reacts with thiol groups of cysteine residues (Mello et al., 2007). VDAC1 has
been shown to contain two highly conserved cysteine residues, with Cys232 facing the
VDAC pore, whereas the second cysteine residue (Cys127) is oriented towards the lipid
bilayer or may be exposed to the cytosol (Aram et al., 2010). Although recent work
suggests that VDAC cysteine residues are not essential for VDAC channel activity and
induction of apoptosis (Aram et al., 2010), the functional consequences of covalent
binding of furan remain to be established.

112 PATHWAY ANALYSIS AND BIOLOGICAL INTERPRETATION
The enzyme cytosolic malate dehydrogenase (MDH1), which was also reported to form
adducts with thiobenzamide intermediates in vivo, participates in the malate-aspartate
shuttle (Ikehata et al., 2008; Lo et al., 2005). The function of this shuttle system is the
transport of reducing equivalents into the mitochondrium (Lo et al., 2005; Minarik et al.,
2002). MDH1 mRNA expression was observed to correlate with the tissue's dependency
on glucose (Lo et al., 2005), suggesting an important role of MDH1 in cellular energy
supply. Independent of its catalytic activity, results from recent knockdown experiments
indicate that MHD1 mediates glucose depletion-induced activation of p53, which was
found to act as a central regulator of energy metabolism and to induce cell cycle arrest
and cell death if energy is depleted (Lee et al., 2009). Considering these findings in
combination with the above discussed furan-induced energy depletion through disturbed
glucose and fatty acid metabolism and altered transport mechanisms, impaired MDH1
function may contribute to furan-mediated disruption of energy production resulting in
cytotoxicity and cell death.
The cytosolic glycerol-3-phosphate dehydrogenase (GPDH-C), which was also identified
as a target protein of bromobenzene (Koen et al., 2007), works in concert with the
mitochondrial form (GPDH-M) of the enzyme to function as a glycerol-3-phosphate
shuttle system, transporting electrons from cytosolic NADH/H+ produced during glycolysis
to the mitochondrial electron transport chain (Brisson et al., 2001). Through oxidation of
NADH/H+ to NAD+, GPDH-C reduces dihydroxyacetone phosphate to glycerol-3-
phosphate, which enters the mitochondrion and is oxidized back to dihydroxyacetone
phosphate by GPDH-M, thereby reducing FAD to FADH2 that can be used in the oxidative
phosphorylation (Brisson et al., 2001). Although the glycerol-3-phosphate shuttle plays a
role in brain and skeletal muscle, the malate-aspartate shuttle appears to be the
predominant system in the liver (Brisson et al., 2001). However, since the malate-
aspartate shuttle may also be impaired by furan binding to cytosolic malate
dehydrogenase, combined loss of function of both shuttle systems may have pronounced
negative effects on energy production in the liver and may thus result in cytotoxicity and
cell death.

PATHWAY ANALYSIS AND BIOLOGICAL INTERPRETATION 113
8.3.3.2 Proteins involved in redox regulation
Functional loss of electron transfer flavoprotein subunit α and peroxiredoxin-1, which
participate in mitochondrial electron transfer and maintenance of redox homeostasis,
respectively, may further contribute to altered redox state and subsequent induction of
cell death. Owing to redox-sensitive cysteine residues, which may be targeted by furan,
peroxiredoxins play an important role in antioxidative defense by reducing H2O2,
peroxynitrite and lipid peroxides (Kalinina et al., 2008).
Furthermore, impaired thioredoxin-1 (Trx-1) function could play a role in furan-induced
toxicity. Trx-1, which was also identified as a target protein of thiobenzamide and
bromobenzene in vivo (Ikehata et al., 2008; Koen et al., 2007), is ubiquitously expressed
and is localized to cytosol and nucleus (Powis and Montfort, 2001). The thioredoxin family
shows a highly conserved catalytic site containing one lysine and two cysteine residues
(Powis and Montfort, 2001). Thioredoxins function by reducing disulfide residues of
oxidized proteins through cysteine thiol-disulfide exchange, thereby regulating protein
function. In turn, thioredoxin reductase reduces oxidized Trx back to its thiol form (Powis
and Montfort, 2001). Mice overexpressing Trx show an enhanced life-span and ability to
cope with oxidative stress (Mitsui et al., 2002), whereas mice homozygous with defects in
the Trx gene die shortly after implantation (Matsui et al., 1996). In addition to regulation
of the redox state of a cell, Trx is thought to participate in a variety of processes, including
cell signaling via extra- and intracellular pathways and regulation of gene expression via
interaction with transcription factors (Lillig and Holmgren, 2007). For instance, Trx has
been reported to suppress cell death through inhibition of a mitogen-activated protein
(MAP) kinase–kinase–kinase (i.e. apoptosis signal-regulating kinase 1) and the
downstream c-Jun N-terminal kinase and p38 MAP kinase pathways (Ichijo et al., 1997;
Niso-Santano et al., 2010; Saitoh et al., 1998). Collectively, these studies demonstrate
that Trx protects against oxidative damage and cell death, suggesting that impaired Trx
function mediated by covalent binding of furan reactive metabolites may contribute to
furan toxicity and carcinogenicity.

114 PATHWAY ANALYSIS AND BIOLOGICAL INTERPRETATION
Thioredoxin-like protein 1 (Txl-1) is expressed in various tissues and contains one N-
terminal thioredoxin domain (Jimenez et al., 2006; Miranda-Vizuete et al., 1998). Similar
to thioredoxin-1 (Trx-1), Txl-1 also acts as a reducing protein, but showed only 25 % of
Trx-1 activity (Jimenez et al., 2006). In vitro, overexpression of Txl-1 was found to protect
cells against cytotoxicity induced by glucose deprivation, but not against hydrogen
peroxide-induced toxic effects (Jimenez et al., 2006). Knockdown of Txl-1 was shown to
result in slightly elevated amounts of ubiquitin-protein conjugates in vitro, suggesting that
Txl-1 may be involved in protein degradation by the ubiquitin-proteasome system
(Andersen et al., 2009). Taken together, loss of Txl-1 function through adduct formation
may lead to both impaired redox regulation and protein degradation and may thus
promote furan-induced cytotoxicity.
Regucalcin (senescence marker protein 30), which was also reported to represent a target
protein of bromobenzene (Koen et al., 2007), is a Ca2+ binding protein expressed in liver
and kidney (Nakagawa and Yamaguchi, 2008). Regucalcin is involved in the maintenance
of intracellular Ca2+ homeostasis by regulating the activity of Ca2+ pumps in the plasma
membrane, endoplasmic reticulum and mitochondria (Yamaguchi, 2000), thereby
protecting cells against intracellular calcium elevation and oxidative stress (Son et al.,
2008). Importantly, regucalcin deficiency has been reported to cause generation of
reactive oxygen species (Son et al., 2006). Thus, loss of regucalcin function through furan
covalent binding may lead to increased cellular oxidative stress, which may result in
cytotoxicity.
3-Mercaptopyruvate sulfurtransferase (MST) is present in the cytosol and mitochondria
of a variety of organs (Nagahara and Nishino, 1996). It contains five cysteine residues, one
of which is located in the active site and is important for protein function (Nagahara et al.,
2007). MST catalyzes the transfer of sulfur from 3-mercaptopyruvate to various acceptor
molecules. One possibility is the detoxification of cyanide through the reaction with 3-
mercaptopyruvate, yielding pyruvate and thiocyanate (Nagahara and Nishino, 1996).
Furthermore, MST participates in the anaerobic degradation of cysteine leading to the
formation of sulfane sulfur-containing compounds (e.g. persulfides, thiosulfate, elemental
sulfur, disulfides) (Iciek and Wlodek, 2001). These substances are presumably involved in

PATHWAY ANALYSIS AND BIOLOGICAL INTERPRETATION 115
regulation of enzymes and receptors through modification of their thiol groups (Iciek and
Wlodek, 2001). Sulfane sulfur-containing compounds were also found to have
antioxidative effects in the cell through removal of free radicals and enhancement of
antioxidative enzymes (e.g. glutathione peroxidase, glutathione reductase) (Iciek and
Wlodek, 2001). Additionally, MST was reported to be involved in the cellular redox
homeostasis together with thioredoxin (Nagahara et al., 2007). Thus, binding of furan
metabolites may result in impaired cellular defense against oxidative stress and thus lead
to cytotoxicity.
Considering the role of several putative furan target proteins in regulating redox state, it
appears that adduction by furan may result in impaired antioxidant defense. In this
respect, it is interesting to note that evidence of oxidative stress in form of increased 8-
oxo-7,8-dihydro-2´-deoxyguanosine was seen after high dose furan exposure associated
with substantial hepatotoxicity (Hickling et al., 2010b). In contrast, no increased levels of
8-oxo-7,8-dihydro-2´-deoxyguanosine were observed in response to furan treatment at 2
mg/kg bw for 28 days (Mally et al., 2010), suggesting that under the conditions of this
study no oxidative stress is induced. This may indicate that the levels of protein binding
observed after furan treatment at 2 mg/kg bw may not be high enough to affect the
overall cellular antioxidative defense mechanisms. However, administration of furan at 2
mg/kg bw was reported to induce toxic and hyperplastic effects in rat liver after 90 days
and to result in tumor formation after 2 years (Gill et al., 2010; NTP, 1993). Moreover, a
recent study conducted with a high dose of furan (30 mg/kg bw) showed expression
changes of genes associated with DNA damage and increased levels of 8-oxo-dG
indicative of oxidative DNA damage (Hickling et al., 2010b). Thus, it is conceivable that the
amount of protein binding observed after furan treatment at 2 mg/kg bw may not induce
oxidative stress after 4 weeks of administration but may lead to oxidative stress after
longer exposure times, thereby possibly contributing to toxicity and cancer.

116 PATHWAY ANALYSIS AND BIOLOGICAL INTERPRETATION
8.3.3.3 Proteins involved in protein folding and proteolysis
Heat shock cognate 71 kDa protein (also called Hsc70, Hsp73, Hsp70-8, Hspa8) and 78
kDa glucose-regulated protein (also known as heat shock 70 kDa protein 5, Hsp70-5,
Hspa5, BiP), which were also identified as targets of teucrin A, thiobenzamide, and
bromobenzene (Druckova et al., 2007; Ikehata et al., 2008; Koen et al., 2007), both belong
to the heat shock protein 70 family. Proteins from this family show very similar sequences
(Daugaard et al., 2007) and are highly conserved across different species (Kelley and
Schlesinger, 1982). Heat shock cognate 71 kDa protein is constitutively expressed in
various tissues including liver (Dworniczak and Mirault, 1987; O'Malley et al., 1985). It is
thought to function predominantly as an ATP-dependent chaperone, directing processes
critical for cell survival such as protein folding, assembly of protein complexes,
intracellular protein transport, and protein degradation (Lindquist and Craig, 1988;
Pelham, 1986; Rohde et al., 2005). Thus, loss of heat shock cognate 71 kDa protein
function may lead to decreased chaperone activity, which may then cause toxicity
through accumulation of unfolded and misfolded proteins.
Similarly, 78 kDa glucose-regulated protein (GRP78), which localizes to the lumen of the
endoplasmic reticulum, regulates protein folding and proteasomal degradation by binding
ATP-dependently to unfolded and misfolded proteins. Moreover, GRP78 was suggested to
be the primary sensor of ER stress and thus important regulator of the unfolded protein
response (as further described in chapter 7). Interestingly, recent data suggest that
abrogation of GRP78 function can increase ER stress-induced cell death, presumably
through inhibition of homeostatic responses to ER stress (Martin et al., 2010). This
suggests that adduction of GRP78 by furan reactive metabolites may limit the cells ability
to cope with damaged proteins due to reduced chaperone activity and failure to activate
the UPR. It is worth noting that GRP78 was also shown to be targeted by teucrin A, a
hepatotoxic furan derivative (Druckova et al., 2007).
Protein disulfide isomerase (PDI) and protein disulfide isomerase A3 (PDIA3, Erp60,
Erp57, 58 kDa glucose-regulated protein, p58), which were both reported to form adducts
with thiobenzamide and bromobenzene (Druckova et al., 2007; Ikehata et al., 2008; Koen
et al., 2007), are members of the thioredoxin superfamily and contain two catalytically
active thioredoxin domains (Wilkinson and Gilbert, 2004). PDI was reported to be among
the high abundance proteins in the ER where it functions as a chaperone, oxidoreductase

PATHWAY ANALYSIS AND BIOLOGICAL INTERPRETATION 117
and isomerase, thereby preventing aggregation of misfolded proteins and oxidizing
and/or reducing thiols and disulfides in order to restore proper protein folding (Wilkinson
and Gilbert, 2004). Similarly, PDIA3 is a thiol oxidoreductase involved in the regulation of
protein folding (Ni and Lee, 2007). Thus, impaired PDI and PDIA43 function through
adduct formation with furan may contribute to accumulation of protein aggregates, thus
enhancing cellular stress and toxicity. However, considering that PDI represents a high
abundance protein in the ER, it is unclear if the level of adduction is sufficient to exert a
significant effect on overall PDI function.
Ubiquitin fusion degradation protein 1 homolog (UB fusion protein 1, Ufd1l) belongs to
the UFD1 family and represents the homolog to the yeast protein Ufd1, which is involved
in the degradation of ubiquitin fusion proteins in yeast. Proper function of Udf1 appears
to be required for cell survival (Johnson et al., 1995). Ufd1 is involved in regulation of the
ATPase p97, a mediator of various cellular processes such as endoplasmic reticulum
associated protein degradation (ERAD), membrane fusion, transcription factor activation,
and cell cycle regulation (Meyer et al., 2000; Woodman, 2003). Binding of a complex
including p97 and Ufd1 to ubiquitinated proteins mediates their transport from the ER to
the cytosol for degradation by the proteasome (Ye et al., 2001). Thus, disturbance of Udf1
function through covalent binding of furan reactive metabolites may lead to impaired
proteasomal protein degradation and thus accumulation of misfolded proteins.
α1-Antiproteinase (α1-antitrypsin, AAT, serpin A1), a glycoprotein predominantly
expressed in liver is secreted into the plasma where it acts as a major serum serine
protease inhibitor (Carlson et al., 1988; Rogers et al., 1983). AAT, which was also
identified as a target of thiobenzamide (Ikehata et al., 2008), is an acute phase protein
(Schreiber et al., 1989), which is induced during inflammatory processes (Perlmutter et
al., 1989). Mutations within the α1-antiproteinase gene were found to be associated with
the formation of protein polymers in the endoplasmic reticulum (Fairbanks and Tavill,
2008). Inherited deficiency of α1-antiproteinase predisposes affected individuals to liver
diseases, including hepatocellular carcinoma, presumably as a result of the accumulated
polymerization products within the cells (Fairbanks and Tavill, 2008). Thus, loss of AAT
function may contribute to furan toxicity and carcinogenicity in rodent liver.

118 PATHWAY ANALYSIS AND BIOLOGICAL INTERPRETATION
Serine protease inhibitor A3K (serpin A3K, kallikrein-binding protein, growth hormone-
regulated proteinase inhibitor, SPI-2), which is highly expressed in liver, was first
identified in human serum (Chao et al., 1986). It belongs to the serpin family and
specifically inhibits the proteolytic activity of tissue kallikrein, a protease that releases
kinins from kininogens (Bhoola et al., 1992; Chao et al., 1990). Knockdown of SerpinA3K
by siRNA was shown to activate the canonical Wnt pathway, leading to an increase in
cytosolic β-catenin and expression of Wnt target genes including c-myc and cyclin D1
(Zhang et al., 2010). These findings suggest that SerpinA3K has antiproliferative effects by
blocking the canonical Wnt pathway. Thus, furan binding to Serpin A3K may contribute to
carcinogenesis by abrogating the inhibitory effects of Serpin A3K on the Wnt pathway.
8.3.3.4 Proteins involved in the urea cycle
Three out of five enzymes involved in the urea cycle, i.e. ornithine carbamoyltransferase,
argininosuccinate synthase, and arginase 1, were identified as putative furan target
proteins (Fig. 37). Arginase 1 was also reported to represent a target protein of the
reactive metabolites of thiobenzamide and bromobenzene in rat liver in vivo (Ikehata et
al., 2008; Koen et al., 2007), while argininosuccinate synthase was found to be adducted
by teucrin A intermediates (Druckova et al., 2007). The function of the urea cycle is the
elimination of excess nitrogen by transformation of toxic ammonia derived from dietary
sources and amino acid catabolism into easily excretable urea (Deignan et al., 2008).
Although we cannot rule out that increased intracellular ammonia resulting from
disruption of the hepatic urea cycle may induce local effects, hyperammonemia resulting
from inherited deficiencies of urea cycle enzymes was reported to cause damage to the
brain without inducing toxicity in other tissues (Walker, 2009). Thus, it is not evident if
and how disruption of the urea cycle as such may contribute to furan toxicity in rat liver.
However, arginase 1, a cytosolic enzyme which catalyzes the reaction of arginine to
ornithine and urea, participates in the regulation of nitric oxide production by competing
with nitric oxide synthase for their common substrate arginine (Maarsingh et al., 2009).
Thus, decreased activity of the arginine-degrading enzyme arginase 1 may result in
increased nitric oxide synthesis and subsequent toxicity caused by peroxynitrite
(produced from reaction between NO and the superoxide anion) (Pacher et al., 2007).

PATHWAY ANALYSIS AND BIOLOGICAL INTERPRETATION 119
Figure 37 Furan target proteins (red) involved in the urea cycle (modified from KEGG Pathway Database, http://www.genome.jp/kegg/pathway.html).
8.3.3.5 Proteins involved in the metabolism of sulfur-containing amino acids
The conversion of methionine to homocysteine via S-adenosylmethionine and S-
adenosylhomocysteine represents an important pathway for transmethylation reactions.
It can be followed either by transsulfuration to form cysteine or by remethylation to
regenerate methionine (Baric, 2009). Several enzymes are involved in these pathways and
two of these enzymes also represent putative target proteins of furan adduct formation,
i.e. S-adenosylmethionine synthetase isoform type-1 and betaine-homocysteine S-
methyltransferase 1 (Fig. 38).
Arginase 1
Argininosuccinate synthase
Argininosuccinate
Arginine
Ornithine
Citrulline
Fumarate
Urea
Carbamoyl-phosphate
Aspartate
Ornithinecarbamoyltransferase
Mitochondrion
Cytosol
Argininosuccinate lyase
CO2 + NH3
Carbamoylphosphatesynthase

120 PATHWAY ANALYSIS AND BIOLOGICAL INTERPRETATION
Figure 38 Metabolism of the sulfur-containing amino acids methionine, homocysteine, and cysteine (modified from KEGG Pathway Database, http://www.genome.jp/kegg/pathway.html, Baric 2009, and Tan 2005). Furan target proteins are marked in red.
S-Adenosylmethionine synthetase isoform type-1 (methionine adenosyltransferase 1,
MAT 1) is expressed in the liver and transfers the adenosyl group of ATP to the amino
acid methionine, thereby producing S-adenosylmethionine (SAM), which represents the
main biological methyl donor (Baric, 2009; Ulrey et al., 2005). Substrates of SAM-
dependent transmethylation reactions are DNA, RNA, proteins, neurotransmitters, and
phospholipids (Ulrey et al., 2005). Knockout of the MAT 1 gene in mice led to increased
S-Adenosylhomocysteine
MethionineHomocysteine
S-Adenosylmethionine
S-Adenosylmethioninesynthase
Betaine-homocysteine S-methyltransferase
S-Adenosylmethionine-dependent
methyltransferases
Acceptors (DNA, RNA, proteins, …)Methylated acceptors
Cystathionine
Cysteine
γ-Glutamylcysteine Cysteine sulfinate 3-Mercaptopyruvate
Sulfite
Sulfate
Sulfite oxidase
3-Mercaptopyruvate sulfurtransferase
Pyruvate
S-Adenosylhomocysteinehydrolase
Cystathionine β-synthase
γ-Cystathionase
Aspartate aminotransferaseCysteinedioxygenase
Aspartateaminotransferase
Glutathione
Glutamate-cysteineligase
Glutathionesynthase

PATHWAY ANALYSIS AND BIOLOGICAL INTERPRETATION 121
plasma levels of methionine and a decreased hepatic content of S-adenosylmethionine
and glutathione, while S-adenosylhomocysteine levels and global DNA methylation were
not altered (Lu et al., 2001). In MAT 1 knockout mice, liver hyperplasia, inflammation and
macrovesicular steatosis were observed. Furthermore, a study using MAT 1 knockout
mice revealed changes in the expression of genes involved in lipid and glucose
metabolism accompanied by hyperglycemia, induction of CYP2E1 and mitochondrial
uncoupling protein 2, enhanced triglyceride and decreased hepatic glutathione content,
and increased lipid peroxidation (Martinez-Chantar et al., 2002). Importantly, MAT 1
knockout mice also showed increased incidences of hepatocellular carcinoma. Although
no changes in the global DNA methylation were observed in MAT 1 knockout mice, it may
well be possible that the methylation state of promoter regions of individual genes may
be altered. The methylation state of a gene promoter region is known to affect gene
expression. Increased or decreased methylation can lead to silencing or overexpression of
the gene, respectively (Ulrey et al., 2005). Thus, hypermethylation of tumor suppressor
genes or hypomethylation of oncogenes can promote tumor initiation. In this respect, the
increased incidences of hepatocellular carcinoma reported in MAT 1 knockout mice may
represent the final step in a chain of events leading from lack of functional MAT 1 protein
via decreased SAM levels and altered methylation of cancer-related genes to cancer
development. No changes in global DNA methylation were evident after furan treatment
for 28 days in both male mice (2, 4, 8 and 15 mg/kg bw) and male rats (0.1, 0.5, 2 mg/kg
bw) (Chen et al., 2010; Cordelli et al., 2010). Moreover, in male rats furan treatment did
not appear to alter DNA methylation status of five different genes relevant to
carcinogenesis (Chen et al., 2010). Thus, it is unclear whether loss of MAT 1 function
caused by covalent binding of furan reactive metabolites may contribute to furan-induced
liver carcinogenicity.
Betaine-homocysteine S-methyltransferase 1 (BHMT1) is a high abundance protein in
the liver of most mammals (0.6-1.6 % of total protein), which catalyzes the formation of
methionine from homocysteine through transmethylation, thereby converting betaine to
dimethylglycine (Pajares and Perez-Sala, 2006). Druckova et al. showed that BHMT1
represents a target protein of the hepatotoxic compound teucrin A which forms a
reactive metabolite structurally similar to cis-2-butene-1,4-dial (Druckova et al., 2007).

122 PATHWAY ANALYSIS AND BIOLOGICAL INTERPRETATION
Inhibition of BHMT1 expression in vitro was associated with impaired homocysteine
metabolism and induction of ER stress (Ou et al., 2007). However, BHMT1 represents a
high abundance protein and the remethylation of homocysteine to methionine is also
possible through other enzymes like methionine synthase. Thus, it is unclear whether
adduct formation at BHMT1 by furan and teucrin A may result in reduction of overall
BHMT1 function and disturbed methionine and homocysteine metabolism.
Sulfite oxidase (SO), an enzyme present in the mitochondrial intermembrane space of
many mammalian tissues including liver, catalyzes the oxidation and detoxification of
sulfite to sulfate as a final reaction in the metabolism of sulfur amino acids, thereby
transferring electrons to its physiological electron acceptor cytochrome c (Feng et al.,
2007; Woo et al., 2003). Cytochrome c is a small heme-containing protein located in the
inner mitochondrial membrane, which participates in the respiratory chain through
shuttling electrons between the complexes III (cytochrome reductase) and IV
(cytochrome c oxidase). Thus, SO contributes to energy production by passing on
electrons obtained from the reduction of sulfite to the respiratory chain. Patients
suffering from SO deficiency show severe neurological, but no hepatic symptoms (Tan et
al., 2005). The loss of SO function through binding of furan metabolites may lead to an
accumulation of sulfites, but there is no evidence whether this may also affect liver
function or have hepatotoxic effects.
8.3.3.6 Structural proteins
Actin, one of the most abundant proteins present in eukaryotic cells (Schleicher and
Jockusch, 2008), is a key component of the cytoskeleton, which provides mechanical
support, allows cell motility, and participates in the regulation of intracellular signaling.
Although impaired function of actin may have detrimental effects on cells, we consider
that covalent binding of furan reactive metabolites to a small fraction of this high
abundance protein is unlikely to affect overall protein function.
The protein Ezrin-radixin-moesin-binding phosphoprotein 50 (EBP50), also known as
Na+/H+ exchanger regulatory factor 1, was reported to participate in protein complexes,
which anchor and stabilize transmembrane receptors and transporters at the plasma

PATHWAY ANALYSIS AND BIOLOGICAL INTERPRETATION 123
membrane and regulate their activity (Georgescu et al., 2008). In hepatocytes and
cholangiocytes, EBP50 was found to be localized to the apical membrane where it was
suggested to play a role in organization and regulation of bile secretory proteins
(Fouassier et al., 2001). In line with this, it was reported that in EBP50 knockout mice the
transport protein mrp2 (multidrug resistance-associated protein 2) was decreased to 70
% and that bile flow was reduced to approximately 70 % together with a 50 % reduction
in glutathione excretion, while bile acid and bilirubin excretion were not altered (Li et al.,
2010). These findings indicate that EBP50 is involved in the canalicular expression of
mrp2, which regulates glutathione-dependent, bile acid-independent bile flow (Li et al.,
2010). Thus, covalent binding of furan metabolites to EBP50 and possible loss of its
function may result in decreased bile flow. In addition to transporters and receptors,
EPB50 can also bind further ligands such as β-catenin (mitogenic and possibly oncogenic)
and localize them to the cell membrane, thereby preventing the ligands from
translocating to cytoplasm and nucleus where they may induce cellular effects (e.g. cell
growth) (Georgescu et al., 2008). Although the role of EBP50 in cancer is still not fully
established, the aforementioned findings suggest that EBP50 may act as a tumor
suppressor when located at the membrane (Georgescu et al., 2008). Consequently, loss of
EBP50 function, e.g. due to furan adduct formation, may disrupt interactions between
EBP50 and its ligands and cause their redistribution to the cytoplasm and/or nucleus.
There, EBP50 may act in an oncogenic manner and promote cell growth, possibly via
formation of complexes with mediators like β-catenin (Georgescu et al., 2008). In support
of this, siRNA-mediated knockdown of EBP50 in proliferating cholangiocytes was shown
to result in strong reduction of bromodeoxyuridine incorporation, indicating that EBP50
may participate in the regulation of cell proliferation (Fouassier et al., 2009).
Fibrinogen γ chain (FGG) is one of the three fibrinogen chains which are synthesized in
hepatocytes and are combined to yield fibrinogen (Vu and Neerman-Arbez, 2007). During
the coagulation process, fibrinogen is cleaved by thrombin to fibrin that forms a clot by
polymerization (Vu and Neerman-Arbez, 2007). Several mutations of the genes encoding
the fibrinogen chains in humans have been reported, with patients developing
quantitative (hypo-, afibrinogenemia) or qualitative (dysfibrinogenemia) fibrinogen
alterations (Undas et al., 2009). Nearly half of these cases were associated with either

124 PATHWAY ANALYSIS AND BIOLOGICAL INTERPRETATION
bleeding (hypo- or afibrinogenemia) or thrombosis (dysfibrinogenemia) (Undas et al.,
2009). It was reported that mutations resulting in the exchange of amino acids in FGG can
lead to dysfibrinogenemia and an increased risk of thrombosis (Robert-Ebadi et al., 2008).
This may be due to the fact that thrombin binding to altered fibrinogen is impaired and
excessive thrombin in the blood circulation may result in thrombosis. A further
explanation may be that changes in FGG may lead to reduced binding of tissue
plasminogen activator and thus decreased fibrinolysis. This is supported by the finding
that the structure of clots containing altered fibrinogen varies from normal clots (Robert-
Ebadi et al., 2008). A third factor possibly contributing to an increased risk of thrombosis
in patients with dysfibrinogenemia may be the loss of functionality of a certain site at FGG
that is responsible for correct polymerization of fibrinogen. The binding of furan
metabolites to FGG may result in blocking of important binding sites of fibrinogen and an
increased risk of thrombus formation. The occurrence of blood clots in small vessels and
their resulting obstruction may lead to locally different blood flows. It was hypothesized
that inter- and intralobular differences in liver perfusion or vascular lesions constricting
blood supply may play a role in locally different susceptibilities of liver lobes to toxic furan
effects (Mally et al., 2010). Thus, loss of function of FGG through furan adduct formation
may represent a link between protein binding and the phenomenon of the regional
susceptibility of liver lobes to furan toxicity.
Keratin, type II cytoskeletal 8 (cytokeratin-8, CK-8) is a member of the family of
intermediate filaments (IF). IFs are important for mechanical stability of the cell,
intracellular organization, and transport (Gonias et al., 2001). In the liver, CK-8 is highly
expressed in hepatocytes, oval cells and cholangiocytes (Strnad et al., 2008). Although CK-
8/CK-18 knockout mice have been shown to be more susceptible to liver injury (Strnad et
al., 2008), it is questionable if furan binding to this high abundance protein results in
significant loss of overall protein function.
Na(+)/H(+) exchanger regulatory factor 3 (NHERF3, diphor-1, clamp, PDZK1) is a scaffold
protein that is expressed in epithelia and endothelia of several organs including liver
(Kocher and Krieger, 2009). NHERF3 contains four binding domains, which interact with
different partner proteins such as receptors (e.g. high density lipoprotein (HDL) receptor

PATHWAY ANALYSIS AND BIOLOGICAL INTERPRETATION 125
SR-BI (scavenger receptor class B type I)), ion channels and ion transporters (Hu et al.,
2009; Kocher and Krieger, 2009). In studies using NHERF3 knockout mice, nearly total loss
of hepatic SR-BI protein expression, hypercholesterolemia and enlarged HDL particles
were observed (Kocher et al., 2003). Thus, it was suggested that NHERF3 represents an
adaptor protein for the regulation of hepatic HDL receptor levels and may hence be
involved in reverse cholesterol transport (Kocher and Krieger, 2009). SR-BI null mice were
reported to show increased plasma levels of cholesterol, probably as a result of decreased
selective cholesterol uptake (Rigotti et al., 1997). Moreover, it was observed that in
NHERF3 knockout mice an organic anion transporting polypeptide (Oatp1a1) was not
correctly localized to the liver cell surface as in wildtype mice, but was present at
intracellular structures, indicating that NHERF3 is responsible for targeting Oatp1a1 to the
basolateral cell membrane where it can exert its transport functions (Wang et al., 2005b).
Oatp1a1 was reported to be involved in the basolateral uptake of a variety of molecules
such as enalapril and different bile acids derivatives into hepatocytes (Chang et al., 2005;
Zsembery et al., 2000). Knockout of Oatp1a/1b in mice was reported to result in increased
plasma levels of unconjugated bile acids (van de Steeg et al., 2010). Furan administration
(2 mg/kg bw, 4 weeks) induced a statistically significant increase in unconjugated bile
acids and a slight increase in cholesterol in rat plasma (Mally et al., 2010). These findings
may represent a possible hint that loss of NHERF3 function through binding of furan
metabolites may result in disrupted regulation of NHERF3 partner proteins, which may,
for example, lead to impaired transport function of Oatp1a1 or inhibition of SR-BI-
mediated cholesterol uptake.
Protein SEC13 homolog (SEC13l1) is the mammalian form of the yeast SEC13 protein
(Tang et al., 1997). SEC13l is a part of and plays a structural role in the coat protein
complex II (COPII) and in the nuclear pore complex (NPC) (Brohawn and Schwartz, 2009;
Stagg et al., 2006). COPII is involved in the vesicular transport of proteins from the rough
endoplasmic reticulum to the Golgi apparatus (anterograde transport), whereas the NPCs
provide the possibility to exchange various molecules between the cytosol and the
nucleus (Siniossoglou et al., 2000; Stagg et al., 2006). Depletion of SEC13l was found to
inhibit ER-Golgi transport in normal rat kidney (NRK) cells (Tang et al., 1997). Yeast SEC13
mutants were shown to display disrupted nuclear envelopes and NPCs (Siniossoglou et al.,

126 PATHWAY ANALYSIS AND BIOLOGICAL INTERPRETATION
2000). Considering the various and essential roles of SEC13l1, binding of furan
metabolites and subsequent loss of protein function may lead to impaired vesicular
transport and nonfunctional NPCs, which may result in cell death.
8.3.3.7 Transport proteins
α2µ-Globulin belongs to the lipocalin family whose members bind and transport small
lipophilic molecules such as pheromones (Cuervo et al., 1999; Pervaiz and Brew, 1987).
α2µ-globulin is extensively synthesized in male rat liver, secreted into plasma and
degraded in lysosomes in kidney epithelial cells (Hard et al., 1993). It is well established
that non-covalent binding of certain chemicals can prevent lysosomal degradation of α2µ-
globulin, leading to accumulation within proximal tubules cells and subsequent tubule
damage. Furthermore, covalent binding of thiobenzamide metabolites, which are
associated with hepatotoxicity, to α2µ-globulin was reported (Ikehata et al., 2008). Based
on our current understanding of the role and function of α2µ-globulin and the fact that
α2µ-globulin is expressed in male rats only whereas no sex differences exist with regard
to furan toxicity and carcinogenicity, it appears that covalent binding of furan to α2µ-
globulin is unlikely to contribute to furan hepatotoxicity.
Transthyretin (thyroxine binding prealbumin), which is synthesized predominantly in the
liver and the choroid plexus (brain), was first known as a binding and transport protein of
thyroxine and retinol in serum and cerebrospinal fluid (Buxbaum and Reixach, 2009;
Fleming et al., 2009). Transthyretin was also reported to represent a target protein of
thiobenzamide (Ikehata et al., 2008). Transthyretin or its mutant forms were found to be
involved in the pathogenesis of some forms of amyloidoses, diseases associated with the
extracellular aggregation and deposition of misfolded proteins leading to impaired organ
function (Buxbaum and Reixach, 2009). While the nervous system and heart represent
the main targets of these diseases, deposition of aggregates in the liver and impaired
hepatic function have not been reported (Buxbaum and Reixach, 2009). Transthyretin was
suggested to participate – together with albumin – in detoxification of a variety of small
endogenous and exogenous molecules by transporting them to the liver for metabolism
or to the kidneys for excretion (Buxbaum and Reixach, 2009). Interestingly, binding of
these small molecules seems to stabilize the tetrameric form of transthyretin and thus

PATHWAY ANALYSIS AND BIOLOGICAL INTERPRETATION 127
decrease the formation of aggregates (Buxbaum and Reixach, 2009). Considering the role
of transthyretin in the detoxification of small molecules, this protein may have
cytoprotective effects by binding the reactive furan metabolite cis-2-butene-1,4-dial.
Vitamin D binding protein (DBP, Gc globulin) is formed in the liver and is excreted into
the plasma where it represents the main carrier of vitamin D and its metabolites
(Speeckaert et al., 2006). DBP also binds free G-actin monomers released from injured or
dying cells in order to prevent their polymerization in the extracellular space, thereby
protecting from organ dysfunction and vascular obstruction (Speeckaert et al., 2006). DBP
shows a rapid turnover rate and is highly polymorphic (Speeckaert et al., 2006). It was
reported that DBP null mice expressing no DBP showed normal viability, fertility, size and
appearance (Safadi et al., 1999). Impaired DBP function through furan adduct formation
may lead to increased polymerization of actin in the extracellular space. However, there is
no evidence so far to suggest that this effect may be involved in furan-induced liver
toxicity and carcinogenicity.
8.3.3.8 Proteins involved in the metabolism of nucleotides and nucleic acids
Heterogeneous nuclear ribonucleoprotein H1 (hnrnp H1) represents an isoform of hnrnp
H, which belongs to a family of RNA binding proteins, heterogeneous nuclear
ribonucleoproteins (hnrnps), that are ubiquitously expressed and participate in the
processing of pre-mRNAs and mRNAs, i.e. regulation of splicing and alternative splicing,
polyadenylation, capping, transcriptional regulation, export from the nucleus into the
cytoplasm, localization, stability, and translation (Chaudhury et al., 2010). For this
purpose, hnrnps together with further proteins are associated with mRNAs in mixed
complexes, which are formed specifically with each mRNA species and do not only act as
a simple packaging unit, but also play an important role in mRNA development by
carrying the information about mRNA processing (Dreyfuss et al., 2002). Since also pro-
and antiapoptotic effects of hnrnp H1 were reported (Garneau et al., 2005; Rauch et al.,
2010), loss of hnrnp H1 function through binding of furan metabolites may cause
impaired mRNA processing and influence apoptosis. These effects may contribute to
furan cytotoxicity and carcinogenicity.

128 PATHWAY ANALYSIS AND BIOLOGICAL INTERPRETATION
Little information is available about the mammalian or eukaryotic L-aspartate
dehydrogenase. However, the enzyme was characterized in the bacterium Thermotoga
maritima and in the archaeon Archaeoglobus fulgidus (Yang et al., 2003; Yoneda et al.,
2006). In Thermotoga maritima, L-aspartate dehydrogenase is thought to be involved in
the de novo biosynthesis of NAD+ from L-aspartate where it catalyzes the first step, i.e.
the conversion of L-aspartate to iminoaspartate, which is unstable and can decompose to
oxalacetate and ammonia (Yang et al., 2003). Since it remains unknown whether L-
aspartate dehydrogenase exerts the same function in mammals, it is difficult to suggest a
connection to furan-induced toxicity.
Multifunctional protein ADE2 is an octameric and bifunctional enzyme that contains the
domains for phosphoribosylaminoimidazole-succinocarboxamide synthase and
phosphoribosylaminoimidazole carboxylase, both of which participate in purine
metabolism where they catalyze two consecutive steps in the chain of reactions from 5-
phosphoribosyl-1-pyrophosphate to inosine-5'-monophosphate formation (Li et al., 2007;
Zhang et al., 2008). Loss of function of this bifunctional enzyme through binding of furan
metabolites may impair de novo purine biosynthesis. However, since normal cells, in
contrast to tumor cells, mainly use the salvage pathway to cover their purine demands (Li
et al., 2007), functional inactivation through adduct formation does not appear to have a
strong influence on the cellular purine pool and thus may not play a major role in the
pathogenesis of furan-induced toxicity.
8.3.3.9 Intracellular transport of bile acids
It is well known that deficiency of bile acid transport proteins (e.g. bile salt export pump,
multidrug-resistant protein 3) in the cell membrane of hepatocytes may play a role in the
pathophysiology of cholestatic liver disease (Pellicoro and Faber, 2007), which includes
accumulation of toxic bile acids resulting in mitochondrial dysfunction and cell death via
damage to biological membranes (Palmeira and Rolo, 2004; Perez and Briz, 2009).
Furan administration was reported to result in elevated plasma levels of endogenous
metabolites normally excreted in bile such as cholesterol and bilirubin (Hamadeh et al.,
2004; Mally et al., 2010). Moreover, treatment with furan was shown to cause elevated
levels of bile acids in mice and rats (Fransson-Steen et al., 1997; Mally et al., 2010).
PATHWAY ANALYSIS AND BIOLOGICAL INTERPRETATION 129
Therefore, it has been suggested that furan may interfere with hepatobiliary transport
mechanisms through covalent binding of furan reactive metabolites to transport proteins
located in the cell membranes of hepatocytes. However, adduct formation directly at
these membrane transporters was not confirmed in our study as no membrane
transporters were identified as furan target proteins. Nevertheless, furan may interfere
with bile acid transport since two intracellular bile acid transport proteins were identified
as furan targets, i.e. 3α-hydroxysteroid dehydrogenase (3α-HSD, Akr1C9) and liver fatty
acid binding protein (L-FABP, FABP1) (Alrefai and Gill, 2007).
3α-HSD, which was previously shown to be adducted by reactive metabolites of both
thiobenzamide and bromobenzene (Ikehata et al., 2008; Koen et al., 2007), is highly
expressed in the liver (MacLeod et al., 2010) and is involved in the metabolism of various
compounds such as steroid hormones and glucocorticoids (Usui et al., 1994). In vitro,
inhibition of bile acid binding to 3α-HSD by indomethacin was shown to cause
redistribution of bile acids from the cytosol out of the cell into the media, suggesting that
loss of function of 3α-HSD may induce decreased uptake, increased sinusoidal reflux, and
decreased excretion of bile acids into bile (Alrefai and Gill, 2007). Thus, loss of function of
3α-HSD by covalent binding of furan may impair hepatobiliary transport, hence
contributing to furan-induced cytotoxicity.
Liver fatty acid binding protein (L-FABP, FABP1), which was identified as a target protein
of thiobenzamide and bromobenzene (Ikehata et al., 2008; Koen et al., 2007), is a high
abundance protein, accounting for 2-6 % of the cytosolic protein in rat liver cells (Sorof,
1994). L-FABP has various functions in the uptake and metabolism of long chain fatty
acids (LCFA) and protects the cells from deleterious effects of free fatty acids through
binding of LCFAs and LCFA-CoAs (Atshaves et al., 2010). Several studies using L-FABP null
mice yielded inconsistent results regarding the influence of L-FABP gene ablation on
different parameters such as bile acid pool size and biliary lipid secretion (Martin et al.,
2005; Xie et al., 2009). Considering these findings, together with the fact that L-FABP is a
high abundance protein, it is unclear whether or to what extent loss of L-FABP function
through furan adduct formation may have cellular consequences. Additionally, stable
transfection of L-FABP into non-L-FABP-expressing liver cells improved their ability to

130 PATHWAY ANALYSIS AND BIOLOGICAL INTERPRETATION
cope with oxidative stress, suggesting antioxidant and cytoprotective roles of L-FABP
(Wang et al., 2005a). Interestingly, chemically reactive intermediates, including
prostaglandins containing -unsaturated carbonyls and electrophilic metabolites of the
genotoxic hepatocarcinogen 2-acetylaminofluorene, were found to covalently bind to L-
FABP, thereby apparently inhibiting cell proliferation (Sorof, 1994). It has been speculated
that this covalent modification blocked or decreased the L-FABP binding capacity for
endogenous mitogenic ligands (e.g. unsaturated fatty acids, peroxisome proliferators),
thereby interfering with the proliferative effects of these ligands (Sorof, 1994).
8.3.3.10 Miscellaneous
Aflatoxin B1 aldehyde reductase member 2 (rAFAR2-2, AKR7A2, succinic semialdehyde
reductase) belongs to the aldo-keto reductase family 7 and was found to be located to
the Golgi apparatus, where it catalyzes the synthesis of γ-hydroxybutyrate (GHB) from
succinic semialdehyde and presumably facilitates its secretion (Kelly et al., 2002).
Regarding the function of rAFAR2-2, there seems to be no evidence for a potential
connection between loss of protein function and furan toxicity.
Mitochondrial aldehyde dehydrogenase (ALDH-2), which represents a common target of
furan, teucrin A, bromobenzene, and acetaminophen (Druckova et al., 2007; Koen et al.,
2007; Qiu et al., 1998), is expressed predominantly in the liver and kidneys. Its role is to
metabolize aliphatic and aromatic aldehydes, including detoxification of reactive
aldehydes formed during oxidative stress, such as malondialdehyde and 4-
hydroxynonenal (Crabb et al., 2004; Wenzel et al., 2008). The catalytic site of ALDH-2
contains three cysteine residues (Wenzel et al., 2008), which may be targeted by cis-2-
butene-1,4-dial, potentially during an attempt to metabolize this reactive furan
metabolite. Loss of function through covalent binding of furan reactive metabolites may
then lead to decreased ability to detoxify endogenous aldehydes, leading to increased
oxidative stress and cytotoxicity.
δ-Aminolevulinic acid dehydratase (ALAD, porphobilinogen synthase) is involved in the
formation of porphobilinogen through asymmetric condensation of two molecules of δ-
aminolevulinic acid (Jaffe, 2004). Porphobilinogen and δ-aminolevulinic acid represent

PATHWAY ANALYSIS AND BIOLOGICAL INTERPRETATION 131
important intermediates in the biosynthesis of tetrapyrrole pigments, such as porphyrin,
which is further used to produce heme (Jaffe, 2004). Hereditary deficiency of ALAD, which
occurs as acute hepatic porphyria, was reported, but occurs very rarely (Jaffe and Stith,
2007). The clinical manifestations in patients showing a decrease in ALAD activity down to
less than 10 % include colicky abdominal pain, vomiting, and polyneuropathy (Doss et al.,
2004; Thunell et al., 1987). Thus, it is not evident whether and how inactivation of δ-
aminolevulinic acid dehydratase may be involved in furan-induced toxicity in rat liver.
Formimidoyltransferase-cyclodeaminase (FTCD) is a bifunctional and homooctameric
enzyme consisting of the domains glutamate formimidoyltransferase (FT) and
formimidoyltetrahydrofolate cyclodeaminase (CD) (Murley and MacKenzie, 1997). FTCD
catalyzes two successive reactions, thereby connecting histidine degradation with folate
metabolism (Mao et al., 2004). Additionally, FTCD was reported to be associated with the
Golgi apparatus and to be involved in the assembly of vimentin intermediate filaments,
suggesting that FTCD functions as a mediator between the Golgi apparatus and the
cytoskeleton, a function that appears to be independent of its catalytic activity (Bashour
and Bloom, 1998; Gao and Sztul, 2001; Mao et al., 2004). FTCD was also found to be
located at the centrosome where it presumably provides the centriole tubulins with
glutamate required for stabilization through polyglutamylation (Hagiwara et al., 2006).
Moreover, glutamate formimidoyltransferase deficiency with modest neurological
symptoms was observed in humans (Hilton et al., 2003). Impaired protein function of
FTCD through binding of furan metabolites may result in disturbed catalytic activity
and/or disrupted cell structure. However, it is unclear how these effects may contribute
to furan cytotoxicity.
NDRG2 (N-myc downstream-regulated gene 2) was found to be expressed in the
cytoplasm of a variety of tissues including brain, heart, and liver (Yao et al., 2008). NDRG2
overexpression was shown to cause cell cycle arrest, enhanced apoptosis, and inhibition
of tumor invasion via suppression of NFκB activity (Kim et al., 2009; Yao et al., 2008),
suggesting antiproliferative, proapoptotic and antimetastatic functions of NDRG2. Overall,
it appears that loss of NDRG2 function through covalent binding of furan may play a role

132 PATHWAY ANALYSIS AND BIOLOGICAL INTERPRETATION
in promoting cell proliferation and tumorigenesis rather than participating in furan-
mediated cytotoxicity.
The finding that ppa1 protein (inorganic pyrophosphatase 1, PPase) was identified as a
putative target of furan, might further support the hypothesis that furan toxicity may be
mediated through impaired energy production. Ppa1 protein, a highly conserved
cytoplasmic enzyme present in many cells and tissues, mainly the liver, catalyzes the
hydrolysis of diphosphate (pyrophosphate) yielding two molecules of phosphate (Shatton
et al., 1983). This cleavage represents an exergonic reaction and provides energy that is
needed for unfavorable cellular processes, such as the activation of fatty acids for
degradation (Lundin et al., 1991; Shatton et al., 1983). This important role of ppa1 protein
which consists of enabling and driving forward many unfavorable metabolic processes
indicates the importance of ppa1 protein for cell survival (Lundin et al., 1991). In line with
this assumption, disruption of the ppa1 gene was reported to result in cell death in yeast
(Lundin et al., 1991). Thus, impaired protein function through binding of furan
metabolites to ppa1 protein may contribute to disruption of metabolic pathways, such as
fat metabolism, amino acid activation, glycogen synthesis, and urea synthesis (Guynn et
al., 1974; Panda et al., 2007). In line with this, ppa1 protein was also observed to be
adducted during the occurrence of acetaminophen-induced hepatotoxicity, which was
shown to be associated with impaired mitochondrial energy metabolism in the liver
(Katyare and Satav, 1989; Qiu et al., 1998).
Ribonuclease UK114 (Perchloric acid soluble protein, 14.5 kDa translational inhibitor
protein), which is mainly expressed in liver and kidneys, was reported to effectively
inhibit protein synthesis in a rabbit reticulocyte lysate system through its
endoribonucleolytic activity (Antonenkov et al., 2007; Chong et al., 2008; Morishita et al.,
1999). Furthermore, ribonuclease UK114 was observed to be induced after activation of
ER stress, suggesting that it participates in cellular stress response (Kanouchi et al., 2005).
While it was reported that overexpression of ribonuclease UK114 caused decreased cell
proliferation in a rat kidney, hepatocyte, and hepatoma cell line, contradictory findings
were observed in HepG2 cells (Chong et al., 2008; Kanouchi et al., 2001). Thus, it remains
unclear whether ribonuclease UK114 actually represents a tumor suppressor. It is hence

PATHWAY ANALYSIS AND BIOLOGICAL INTERPRETATION 133
not evident which effect adduct formation through furan reactive metabolites and
possible loss of protein function may have on cell proliferation. However, considering the
possible role of ribonuclease UK144 in ER stress response, impaired protein function due
to furan binding may result in disturbed cellular defense mechanisms. Interestingly,
ribonuclease UK114 was also identified as a target protein of thiobenzamide and
bromobenzene (Ikehata et al., 2008; Koen et al., 2007).
After its synthesis in the liver, the precursor protein AMBP is transported to the Golgi
system where it is cleaved into two separately secreted proteins, i.e. α1-microglobulin
and bikunin (inter-α-trypsin inhibitor light chain) (Akerstrom et al., 2000; Lindqvist et al.,
1992). Moreover, the proteinase inhibitor trypstatin identified in rat peritoneal mast cell
granules was shown to consist of an amino acid sequence identical with the C-terminal
part of bikunin, thus indicating that it is also derived from the protein AMBP (Itoh et al.,
1994). The reason for the phenomenon of cosynthesis of α1-microglobulin and bikunin is
still unknown since the obtained proteins can also be expressed independently
(Akerstrom et al., 2000).
The glycoprotein α1-microglobulin is a member of the lipocalin family and is mainly
localized in liver, plasma, and kidneys (Akerstrom et al., 2000). α1-microglobulin was
found to form complexes in plasma with various binding partners, such as IgA, albumin,
and mutated versions of coagulation factors, probably via the free cysteine residue Cys34
(Akerstrom et al., 2000). It is unclear whether and how loss of α1-microglobulin may
contribute to furan toxicity and carcinogenicity.
Bikunin is a monomeric glycoprotein mainly expressed in the liver and contains two
domains which show proteinase inhibitor activity and include three characteristically
arranged disulfide bonds (Fries and Blom, 2000). Female mice deficient in the bikunin
gene showed infertility, which occurred presumably due to disturbed formation of
extracellular oocyte matrix, indicating that bikunin function may be essential for the
extracellular matrix (Zhuo et al., 2001). The results of several studies suggested that
bikunin exerts an antiinflammatory function through suppression of proteolysis, which is
usually activated during inflammation, through stabilization of the extracellular matrix,
through inhibition of expression and translation of inflammatory cytokines, and through
disruption of the inflammatory cascade (Kobayashi, 2006). In various studies, it was

134 PATHWAY ANALYSIS AND BIOLOGICAL INTERPRETATION
reported that furan administration resulted in inflammation, which is assumed to
contribute to tissue damage and tumor formation (Gill et al., 2010; Hamadeh et al., 2004;
NTP, 1993; Wilson et al., 1992). Thus, loss of function of bikunin through adduct
formation may enhance the inflammatory effects of furan and may hence be involved in
furan-mediated cytotoxicity and carcinogenesis.
8.3.4 Estimation of the degree of protein adduction
To estimate the relative degree of covalent protein adduction, the ratios of the amount of
radioactivity and the total amount of protein were calculated for each spot. The mean
ratios and standard deviations were determined (see Annex, Fig. 39). Ranking of target
proteins was conducted according to the degree of protein adduction relative to the
abundance of the protein (Tab. 20). Based on these semiquantitative analyses, some of
the most adducted proteins were found to be structural proteins (keratin type II
cytoskeletal 8, actin β/γ) and transport proteins (α2µ-globulin, fatty acid binding protein
1). Furthermore, proteins involved in detoxification (aldehyde dehydrogenase) and redox
homeostasis (thioredoxin-1, peroxiredoxin-1), glucose (glyceraldehyde-3-phosphate
dehydrogenase, triosephosphate isomerase) and lipid metabolism (short-chain specific
acyl-CoA dehydrogenase, isovaleryl-CoA dehydrogenase), as well as the ER stress sensor
78 kDa glucose-regulated protein, showed a relatively high level of adduction. These
findings further support a potential role of impaired energy production, altered redox
balance and reduced ability to cope with misfolded proteins in furan toxicity.

PATHWAY ANALYSIS AND BIOLOGICAL INTERPRETATION 135
Table 20 Ranking of furan target proteins based on densitometry of protein spots on Coomassie Blue stained gels and spots obtained by fluorography (Ratio film/gel). ++++ = ratio > 100, +++ = ratio 50-100, ++ = 25-50, + = < 25
Level of adduction
pH range 4-7, whole tissue extract
pH range 6-9, whole tissue extract
pH range 4-7, membrane fraction
++++
α2µ-Globulin
Thioredoxin-1
Short-chain specific acyl-CoA dehydrogenase
Arginase 1
Glyceraldehyde-3-phosphate dehydrogenase
78 kDa Glucose-regulated protein
+++
Aldehyde dehydrogenase Peroxiredoxin-1
Isovaleryl-CoA dehydrogenase
Fatty acid binding protein 1
Keratin type II cytoskeletal 8
Actin β/γ
Protein NDRG2
Triosephosphate isomerase
++
Keratin, type II cytoskeletal 8
δ-Amiolevulinic acid dehydratase
Long-chain fatty acid CoA ligase 1
Actin β/γ
Ribonuclease UK114
Heat shock cognate 71 kDa protein
Triosephosphate isomerase
Ornithine carbamoyltransferase
Argininosuccinate synthase
3-Ketoacyl-CoA thiolase
Enoyl-CoA hydratase
Heat shock cognate 71 kDa protein,
Na(+)/H(+)exchanger regulatory factor 3
+
Thioredoxin-like protein 1
Protein AMBP
Glycerol-3-phosphate dehydrogenase
Fructose-1,6-bisphosphatase 1
3α-Hydroxysteroid dehydrogenase
Fibrinogen γ chain
Malate dehydrogenase
Actin β/γ
Keratin, type II cytoskeletal 8
α-Enolase
Ezrin-radixin-moesin-binding phosphoprotein 50
Isovaleryl-CoA dehydrogenase
α2µ-Globulin
3-Mercaptopyruvate sulfurtransferase
Regucalcin
ATP synthase β subunit
Protein SEC13 homolog
Ppa1 protein
Putative L-aspartate dehydrogenase
Electron transfer flavoprotein subunit α
Acetyl-CoA acetyltransferase
Fructose-bisphosphate aldolase B
L-lactate dehydrogenase A chain
Voltage-dependent anion-selective channel protein 1
Argininosuccinate synthase
Betaine-homocysteine S-methyltransferase 1
3-Ketoacyl-CoA thiolase
Phosphoglycerate kinase 1
Multifunctional protein ADE2
Glycerol-3-phosphate dehydrogenase
3α-Hydroxysteroid dehydrogenase
Ornithine carbamoyltransferase
Ribonuclease UK114
Fatty acid binding protein 1
Ubiquitin fusion degradation protein 1 homolog
S-Adenosylmethionine synthetase isoform type-1
2-Oxoisovalerate dehydrogenase subunit α
α1-Antiproteinase
Aldehyde dehydrogenase
Heterogeneous nuclear ribonucleoprotein H1
Long-chain specific acyl-CoA dehydrogenase
Aflatoxin B1 aldehyde reductase member 2
Transthyretin
α2µ-Globulin
Protein disulfide-isomerase A3
Formimidoyltransferase-cyclodeaminase
Sulfite oxidase
Serine protease inhibitor A3K,
Vitamin D-binding protein,
Protein disulfide-isomerase
ATP synthase β subunit
78 kDa Glucose-regulated protein
Na(+)/H(+) exchanger regulatory factor 3

136 PATHWAY ANALYSIS AND BIOLOGICAL INTERPRETATION
8.4 Conclusions
Pathway mapping analysis showed that the 61 identified furan target proteins are mainly
derived from cytosol and mitochondria and participate in various cellular pathways,
predominantly fatty acid, amino acid, and glucose metabolism. Furthermore, several
target proteins were found to be involved in cell redox homeostasis. While it is not known
if adduct formation at proteins through furan actually leads to loss of protein function, we
tried to establish which cellular consequences may result from inhibited functions of the
61 furan target proteins and how these cellular effects may be linked to cytotoxicity.
First, disrupted function of proteins involved in glycolysis/gluconeogenesis, mitochondrial
fatty acid metabolism, degradation of amino acids and ATP synthesis may lead to a
decreased supply of precursor metabolites for the production of energy in the
mitochondria, reduced mitochondrial energy production, ATP depletion and oxidative
stress. These findings suggest that furan cytotoxicity may be mediated through
mitochondrial dysfunction and energy depletion. This is consistent with a study by
Mugford et al. which demonstrated that uncoupling of hepatic oxidative phosphorylation
is involved in furan-mediated cell death (Mugford et al., 1997).
Second, furan was also found to bind to proteins participating in cellular redox regulation
(electron transfer flavoprotein subunit α, peroxiredoxin-1, thioredoxin-1, thioredoxin-like
protein 1, regucalcin, 3-mercaptopyruvate sulfurtransferase). A loss of function of these
proteins may lead to oxidative stress in the cell and thus promote mitochondrial
dysfunction, thereby contributing to furan-induced cytotoxicity.
Third, loss of function of proteins participating in protein folding and proteolysis (heat
shock cognate 71 kDa protein, 78 kDa glucose-regulated protein, protein disulfide
isomerase, protein disulfide isomerase A3, ubiquitin fusion degradation protein 1
homolog, α1-antiproteinase, serine protease inhibitor A3K, protein AMBP) may lead to
impaired detection of damaged proteins and disruption of protein repair and degradation
in the cell, resulting in an increased load of damaged and nonfunctional proteins.
Besides the potential malfunction of whole pathways due to loss of functions of several
participating proteins, adduction of individual proteins with key functions may also be
involved in furan toxicity and carcinogenicity. For instance, loss of function of proteins
involved in transport processes across the mitochondrial membranes (voltage-dependent
anion-selective channel protein 1, cytosolic malate dehydrogenase, cytosolic glycerol-3-

PATHWAY ANALYSIS AND BIOLOGICAL INTERPRETATION 137
phosphate dehydrogenase) may contribute to mitochondrial dysfunction and thus to
cytotoxicity. Furthermore, proteins involved in processes such as cell signaling (canonical
Wnt pathway: serine protease inhibitor A3K), DNA methylation (S-adenosylmethionine
synthetase isoform type-1), blood coagulation (fibrinogen γ chain), and bile acid transport
(3α-hydroxysteroid dehydrogenase) may participate in furan-induced cytotoxicity and
carcinogenicity.
A semiquantitative analysis to estimate the amount of radioactivity covalently bound to
proteins in various spots showed that structural proteins (keratin type II cytoskeletal 8,
actin β/γ) and transport proteins (α2µ-globulin, fatty acid binding protein 1) were among
the most adducted furan targets. These proteins are mostly high abundance proteins and
hence adduction of a small fraction of these proteins through furan metabolites may not
per se contribute to cytotoxicity. Thus, their role in furan toxicity is unclear. However, it
has been proposed that these proteins may detoxify and/or inactivate reactive furan
metabolites, thus protecting proteins which may be less abundant but perhaps more
important for cell survival (Hoivik et al., 1996).

138 FINAL CONCLUSIONS AND FUTURE PERSPECTIVES
9 FINAL CONCLUSIONS AND FUTURE PERSPECTIVES
Furan administration was shown to induce hepatotoxicity and liver tumors in rodents
(NTP, 1993), but the mechanisms involved in furan toxicity and carcinogenicity remain to
be elucidated. Irrespective of its genotoxic potential, results from previous studies
suggest that furan toxic and carcinogenic effects may at least partly be mediated through
a non-genotoxic mechanism including covalent binding to proteins, leading to cytotoxicity
and subsequent regenerative cell proliferation (Burka et al., 1991; Lu et al., 2009; Wilson
et al., 1992). In support of this, our data confirm that furan forms covalent protein
adducts in rat liver, both at a known carcinogenic dose (2 mg/kg bw) and at a dose closer
to estimated human exposure (0.1 mg/kg bw). While it is well established that protein
binding may result in cytotoxicity (Evans et al., 2004), the cellular events involved are still
poorly understood. In this context, two mechanistic links between protein adduct
formation and furan toxicity are conceivable.
The first possible link is that covalent binding of reactive metabolites to cellular proteins
may disrupt their proper folding and lead to accumulation of unfolded or damaged
proteins in the endoplasmic reticulum (ER). In response to this ER stress, activation of the
unfolded protein response (UPR) may be triggered to cope with the accumulated
proteins. The UPR is a cellular pathway which enhances the cells capacity to recognize
misfolded proteins and repair or target them for degradation by the proteasome.
However, if the ER stress through accumulated proteins is too extensive and homeostasis
cannot be maintained, cytotoxicity may occur.
Activation of the UPR leads to enhanced splicing of X-box binding protein-1 (XBP1) mRNA
and specific alterations of expression of UPR target genes. In our experiments, neither
altered XBP1 mRNA splicing nor expression changes of UPR target genes were evident.
Thus, it appears that the amount of damaged and nonfunctional proteins accumulated in
rat livers after treatment with either a known carcinogenic or an acutely hepatotoxic
furan dose is not high enough to trigger activation of the UPR. Another possible
explanation, however, may be that activation of the UPR cannot work properly due to loss
of function of a protein involved in this process. Indeed, it may well be possible that
adduction and inhibition of GRP78, the primary sensor of ER stress, may prevent
activation of the UPR (Martin et al., 2010).

FINAL CONCLUSIONS AND FUTURE PERSPECTIVES 139
The second possibility for a mechanistic link between protein adduct formation and furan
toxicity is that protein binding by a compound may lead to impaired function of individual
proteins or whole pathways, which may result in disruption of cell/tissue homeostasis and
may cause toxicity. Moreover, it has also been recognized that adduction of some
proteins may be critical to injury, whereas covalent binding to others is not (Zhou et al.,
2005). To establish how furan protein binding may be involved in furan-induced liver
toxicity and carcinogenicity, we identified putative target proteins of furan reactive
metabolites.
Our data demonstrate that furan binds to a large number of proteins localized
predominantly in the cytosol and mitochondria. Among the most adducted furan targets
were structural proteins and transport proteins. However, their contribution to the
mechanism of furan toxicity is not apparent. It is conceivable that binding to these high
abundance proteins may lead to detoxification/inactivation of reactive furan metabolites,
thus preventing damage and loss of function of proteins which may be less abundant but
perhaps more important for cell survival.
In contrast, the finding that furan binds to a range of enzymes involved in glucose
metabolism, mitochondrial β-oxidation and ATP synthesis suggests that furan toxicity may
involve impaired mitochondrial energy production and oxidative stress through
mitochondrial uncoupling. This is in line with data showing that uncoupling of hepatic
oxidative phosphorylation is an early event in furan-mediated cell death (Mugford et al.,
1997). In addition, adduct formation with proteins participating in the maintenance of
redox homeostasis and protein folding/degradation mechanisms may result in reduced
ability to cope with cellular/oxidative stress, including accumulation of misfolded
proteins.
Besides the potential malfunction of whole pathways due to loss of functions of several
participating proteins, loss of function of individual proteins which are involved in cellular
processes such as transport processes across the mitochondrial membranes, cell
signaling, DNA methylation, blood coagulation, and bile acid transport may also play a
role in furan-induced cytotoxicity and carcinogenicity, e.g. through altered gene
expression due to changes in gene methylation state or impaired hepatobiliary transport.
Commonalities and differences in target proteins of various chemical compounds (and
their reactive metabolites) may help to elucidate how covalent binding to proteins may

140 FINAL CONCLUSIONS AND FUTURE PERSPECTIVES
be connected to toxicity and/or carcinogenicity. In the context of possible commonalities
in target proteins, it is interesting to note that 33 of the 61 identified furan target proteins
also represent target proteins of other drugs/compounds thought to cause toxicity via
reactive metabolite formation. These 33 proteins predominantly relate to carbohydrate
metabolism, redox regulation, and protein folding, suggesting that targeting and
inhibiting these cellular functions may represent common events contributing to toxicity.
However, not all drugs that target proteins are necessarily also carcinogenic. Thus, it may
be hypothesized that inactivation of some proteins through adduct formation may relate
to cytotoxicity, while inactivation of other proteins may promote carcinogenicity.
In summary, our data suggest that functional loss of several individual proteins and
pathways, most notably mitochondrial energy production, redox regulation and protein
folding, may combine to disrupt cell homeostasis and cause hepatocyte cell death.
However, further work is needed to establish if adduction by furan reactive metabolites
results in loss of individual protein function. In this respect, key questions that remain to
be addressed are (i) to what extent peptides/proteins are adducted, (ii) which residues
and sites of the proteins are adducted, i.e. catalytic and/or non-active sites, and (iii) what
the turn-over rate of the protein is, i.e. how fast the damaged protein will be repaired.
Recent approaches to address these questions are described below.
Determination of protein covalent modification sites
In order to experimentally establish whether and to what extent the identified putative
target proteins of furan reactive metabolites actually lose their function and thus may be
involved in furan toxicity, it is necessary to both determine the sites of covalent
modification and assess the functionality of the protein after adduct formation.
Several studies addressing these questions have already been conducted for various
substances and impaired or even loss of protein function through adduct formation by
reactive compounds has been described. For instance, the α,β-unsaturated aldehyde
acrolein showing a structure similar to BDA was found to covalently bind to a functionally
important cysteine residue (Cys215) in the active site of protein tyrosine phosphatase 1B,
thus causing irreversible inactivation of the protein (Seiner et al., 2007). The experimental
approach used by Seiner et al. consisted of the incubation of protein tyrosine

FINAL CONCLUSIONS AND FUTURE PERSPECTIVES 141
phosphatase 1B with acrolein and subsequent analysis of the purified tryptic digest using
MALDI-TOF and ESI-QTOF mass spectrometry. MALDI-TOF analysis of the peptides
revealed the presence of five adducted peptides. Among these adducted peptides, there
was also the one containing the active site of the protein. To identify the sites of acrolein
modification in the active site, this peptide was further analyzed using ESI-QTOF mass
spectrometry. This analysis showed increased masses corresponding to acrolein adducts
for certain b- and y-ions which identified cysteine Cys215 as the site of modification.
Furthermore, Seiner et al. conducted inactivation assays, which demonstrated time-
dependent inactivation of the protein tyrosine phosphatase 1B by acrolein. In addition to
the modification of cysteine residues, acrolein was also reported to covalently form
adducts at protein histidine and lysine residues and to inhibit protein disulfide isomerase,
one of the proteins identified in our studies (Carbone et al., 2005; Seiner et al., 2007).
Furthermore, two other α,β-unsaturated aldehydes, the lipid peroxidation products 4-
hydroxynonenal (4-HNE) and 4-oxononenal (4-ONE), were shown to react with the
cytoskeletal protein tubulin and form protein cross-links, thus inhibiting proper protein
function, i.e. the ability to form polymeric microtubules (Stewart et al., 2007). It has
already been shown that impaired microtubule formation may be a result of adduct
formation at both cysteine and lysine residues of tubulin. Additionally, both 4-HNE and 4-
ONE were known to have the ability to modify cysteine, histidine, and lysine residues.
Thus, the exact adduction sites of 4-HNE and 4-ONE at tubulin were determined. 4-HNE
was observed to covalently bind to different cysteine residues in tubulin, Cys347α, Cys376α,
and Cys303β, while for 4-ONE, which represents a rapid and very potent inductor of cross-
links, it could not be determined at which residues adduct formation occurred (Stewart et
al., 2007). Based on their results, the authors concluded that most tubulin adducts and
cross-links of 4-HNE and 4-ONE were formed through covalent binding to lysine residues
and had only mild inhibiting effects on protein function, whereas formation of adducts
and cross-links at cysteine residues dramatically reduced the ability of tubulin to
polymerize (Stewart et al., 2007). 4-HNE was not only found to inhibit the function of
tubulin, but was also reported to covalently modify the enzyme creatine kinase at its
active site residues His66, His191, Cys283, and His296, thus leading to reduced enzyme
activity, which may finally result in cell death (Eliuk et al., 2007).

142 FINAL CONCLUSIONS AND FUTURE PERSPECTIVES
Many different study designs and experimental procedures have been reported for the
determination of the sites of covalent protein modification and to address this question, a
method similar to the one described by Eliuk et al. could be applied for furan target
proteins (Eliuk et al., 2007).
In brief, the protein of interest was incubated with the reactive compound in vitro at
different concentrations ranging from a very high concentration to achieve a maximum of
adduct formation for the development of a suitable analytical method down to a
physiological or pathophysiological concentration to mimic in vivo conditions. After the
reaction, the protein was isolated and digested into peptides, which were separated by
liquid chromatography and analyzed by mass spectrometry. With knowledge about the
amino acid sequence and the amino acid residues most likely to be adducted on one hand
and information on the nature of the different modifications on the other hand, the
obtained peak lists were searched for the masses of modified peptides as calculated from
the masses of unmodified peptide plus its assumed modification(s). Furthermore, using
the MS/MS fragment data of the modified peptides it can be determined which y- and b-
ions show a mass shift corresponding to specific modifications, thus establishing which
amino acid residues are adducted.
This experimental setup is suitable to detect the binding sites at a certain protein in vitro
and predict possible binding sites in vivo. However, in vivo several additional factors
which make the detection of covalently modified peptides very difficult have to be taken
into account. These factors include very low levels of protein adduction, insufficient
sequence coverage for proteins in the mass spectrometry analyses, and the occurrence of
modifications at multiple sites within a protein. Koen et al. were only able to determine a
binding site (Cys111) of bromobenzene reactive metabolites at glutathione-S-transferase
(GST) subunits in rat liver after the use of high accuracy and high sensitivity mass
spectrometry and previous enrichment of GST with a glutathione-agarose affinity column
(Koen et al., 2006).
Data from several in vivo studies indicate that furan has the ability to modify cysteine and
lysine residues and that the bifunctionality of BDA can lead to the formation of cross-links
between these residues (Chen et al., 1997; Peterson et al., 2005). Thus, a wide variety of
different protein modifications can occur, making it difficult to predict the nature of the
adducts. However, unambiguous detection of the modification sites in putative furan

FINAL CONCLUSIONS AND FUTURE PERSPECTIVES 143
target proteins, as conducted for protein targets of thiobenzamide in rat liver (Ikehata et
al., 2008), is needed for assessing whether the function of the adducted proteins may be
impaired. For this purpose, an approach similar to the one applied by Ikehata et al. may
also be used in the case of furan (Ikehata et al., 2008). A possible problem, however, may
be the level of protein adduct formation after furan treatment (286 pmol equiv/mg
protein), which is around 100 times lower than the amount of adduction seen after
thiobenzamide administration (25.6 and 36.8 nmol equiv/mg protein for cytosolic and
microsomal proteins, respectively) (Ikehata et al., 2008). Therefore, it may be more
difficult to detect the amino acid residues adducted after furan administration and for
this purpose higher furan doses would be needed.
To identify the protein sites of adduct formation, Ikehata et al. administered a 1:1 mixture
of thiobenzamide and thiobenzamide-d5 to rats and, after protein isolation, two-
dimensional gel electrophoresis, spot excision, tryptic digest and FT-ICR mass
spectrometry, searched for pairs of m/z peaks showing similar intensities and a mass
difference of 5 units (Ikehata et al., 2008). In the next step, it was ensured that the
masses of these peptide ion peak pairs did not correspond to the masses of theoretically
predicted peptides. After subtraction of the modification mass from the mass of the
adducted peptide, the mass of the unmodified peptide was obtained and again compared
to theoretical peptide masses to identify the peptide. Since adduct formation by
thiobenzamide metabolites can occur at the lysine residue and the enzyme trypsin
cleaves after lysine, also a missed cleavage site should be visible in the peptide spectra.
Furthermore, exact adduct location in the peptide was conducted using MS/MS analyses
(Ikehata et al., 2008).
Determination of protein function after adduct formation
A further important question regarding the role of covalent protein modification in
cytotoxicity is whether adduct formation will result in impaired or even loss of protein
function. This can be addressed using specific assays determining the activity of an
enzyme in biological fluids or tissues. However, problems can occur if specific activity
assays are not available for a certain enzyme or if a protein does not represent an
enzyme, but e.g. a structural protein, making it hard to find parameters to measure their
functionality.

144 FINAL CONCLUSIONS AND FUTURE PERSPECTIVES
In the context of assessing protein functionality, it is also interesting to determine the
subcellular location and the turnover rate of the proteins. Changes in the subcellular
location of a protein, which can be established by immunohistochemistry, might indicate
that it is more or less active than in controls or even that its functions are altered, such as
in the case of ezrin-radixin-moesin-binding phosphoprotein 50 (Georgescu et al., 2008).
The protein turnover rate is a parameter of high significance regarding the manifestation
of protein adduct-mediated toxic effects in the cell, because it expresses how fast a
damaged protein can be replaced by a new and functional one. Proteins with a high
turnover rate are replaced faster than proteins showing a low turnover rate, thus having
less possibility to introduce cytotoxicity. For determination of protein turnover, Doherty
et al. applied a method referred to as dynamic SILAC (stable isotope labeling by amino
acids in cell culture), which monitors the incorporation of stable isotope amino acid
precursors in proteins using one-dimensional gel electrophoresis, in-gel digestion, and LC-
MS/MS analysis (Doherty et al., 2009).
Mitochondrial toxicity
As described above, the fact that several target proteins are involved in mitochondrial
energy production, suggests that furan toxicity may be mediated by mitochondrial toxicity
and impaired energy production. Consistently, Mugford et al. reported that mitochondrial
uncoupling might represent an early event in furan-induced cytotoxicity (Mugford et al.,
1997). In these studies relatively high furan doses were used and thus it might be
interesting to find out to what extent ATP depletion and mitochondrial toxicity might
occur at lower doses, e.g. doses as used in the 28 day oral toxicity study. However, this
was beyond the scope of this work.
Common protein properties
It has been suggested that finding commonalities in target proteins and their protein
properties might elucidate a general mechanism of protein adduct-induced toxicity. By
building up a target protein database and applying bioinformatic tools, Hanzlik et al.
provided first insights into this field (Fang et al., 2009; Hanzlik et al., 2009; Hanzlik et al.,
2007). However, the currently available information on target proteins of toxic
metabolites in vivo appears to be insufficient to reveal a general mechanism of toxicity.

FINAL CONCLUSIONS AND FUTURE PERSPECTIVES 145
In addition to the abundance and turnover of a protein, also further protein properties
such as cysteine or lysine content may determine which proteins are adducted by reactive
metabolites. For instance, it was reported that acylating electrophilic metabolites prefer
modification of lysine residues of proteins, whereas alkylating agents mainly form adducts
with cysteine, lysine, and histidine side chains (Fang et al., 2009).

146 SUMMARY
10 SUMMARY
Furan was recently found to be present in a variety of food items that undergo heat
treatment. It is known to act as a potent hepatotoxin and liver carcinogen in rodents. In a
2-year bioassay, chronic furan administration to rats was shown to cause hepatocellular
adenomas and carcinomas and very high incidences of cholangiocarcinomas even at the
lowest furan dose tested (2.0 mg/kg bw) (NTP, 1993). However, the mechanisms of furan-
induced tumor formation are poorly understood.
Furan is metabolized by cytochrome P450 (CYP) enzymes, predominantly CYP2E1, to its
major metabolite cis-2-butene-1,4-dial (BDA) (Chen et al., 1995; Kedderis et al., 1993).
BDA is thought to be the key mediator of furan toxicity and carcinogenicity (Carfagna et
al., 1993; Fransson-Steen et al., 1997; Mugford et al., 1997) and was shown to react with
cellular nucleophiles such as nucleosides (Byrns et al., 2002; Byrns et al., 2004) and amino
acid residues (Chen et al., 1997) in vitro.
It is well known that covalent protein binding may lead to cytotoxicity, but the cellular
mechanisms involved remain to be elucidated. Since covalent binding of reactive
intermediates to a target protein may result in loss of protein function and subsequent
damage to the cell, the aim of this study was to identify furan target proteins to establish
their role in the pathogenesis of furan-associated liver toxicity and carcinogenicity.
In order to identify target proteins of furan reactive metabolites, male F344/N rats were
administered [3,4-14C]-furan. Liquid scintillation counting of protein extracts revealed a
dose-dependent increase of radioactivity covalently bound to liver proteins. After
separation of the liver protein extracts by two-dimensional gel electrophoresis and
subsequent detection of radioactive spots by fluorography, target proteins of reactive
furan intermediates were identified by mass spectrometry and database search via
Mascot. A total of 61 putative target proteins were consistently found to be adducted in 3
furan-treated rats. The identified proteins represent - among others - enzymes, transport
proteins, structural proteins and chaperones. Pathway mapping tools revealed that target
proteins are predominantly located in the cytosol and mitochondria and participate in
glucose metabolism, mitochondrial β-oxidation of fatty acids, and amino acid
degradation. These findings together with the fact that ATP synthase β subunit was also
identified as a putative target protein strongly suggest that binding of furan reactive
metabolites to proteins may result in mitochondrial injury, impaired cellular energy

SUMMARY 147
production, and altered redox state, which may contribute to cell death. Moreover,
several proteins involved in the regulation of redox homeostasis represent putative furan
target proteins. Loss of function of these proteins by covalent binding of furan reactive
metabolites may impair cellular defense mechanisms against oxidative stress, which may
also result in cell death. Besides the potential malfunction of whole pathways due to loss
of functions of several participating proteins, loss of function of individual proteins which
are involved in various cellular processes such as transport processes across the
mitochondrial membranes, cell signaling, DNA methylation, blood coagulation, and bile
acid transport may also contribute to furan-induced cytotoxicity and carcinogenicity.
Covalent binding of reactive metabolites to cellular proteins may result in accumulation of
high amounts of unfolded or damaged proteins in the endoplasmic reticulum (ER). In
response to this ER stress, the cell can activate the unfolded protein response (UPR) to
repair or degrade damaged proteins. To address whether binding of furan reactive
metabolites to cellular proteins triggers activation of the UPR, semiquantitative PCR and
TaqMan® real-time PCR were performed. In the case of UPR activation, semiquantitative
PCR should show enhanced splicing of X-box binding protein-1 (XBP1) mRNA
(transcription factor and key regulator of the UPR) and TaqMan® real-time PCR should
determine an increased expression of UPR target genes. However, our data showed no
evidence for activation of the UPR in the livers of rats treated either with a single
hepatotoxic dose or with a known carcinogenic dose for 4 weeks. This suggests either that
furan administration does not induce ER stress through accumulation of damaged
proteins or that activation of the UPR is disrupted. Consistent with the latter, glucose-
regulated protein 78 (GRP78), identified as a target protein in our study, represents an
important mediator involved in activation of the UPR whose inhibition was shown to
impair induction of the UPR (Martin et al., 2010). Thus, adduct formation and inactivation
of GRP78 by furan metabolites may disturb activation of the UPR. In addition to impaired
activation of UPR, protein repair and degradation functions may be altered, because
several proteins involved in these processes also represent target proteins of furan and
thus may show impaired functionality.
Taken together, our data suggest that covalent binding of furan reactive metabolites to
several proteins may result in impaired protein function and thus disruption of cellular
functions, most notably mitochondrial energy production, redox regulation, and protein

148 SUMMARY
folding and degradation, which may combine to disrupt cell homeostasis and cause
hepatocyte cell death. However, further work is needed to establish whether protein
adduction by furan reactive metabolites results in loss of individual protein function.

ZUSAMMENFASSUNG 149
11 ZUSAMMENFASSUNG
Im Rahmen von Untersuchungen der U.S. Food and Drug Administration (FDA) wurde im
Jahr 2004 bekannt, dass Furan in verschiedensten hitzebehandelten Lebensmitteln
vorkommt. Durch Tierstudien des National Toxicology Programs (NTP) aus den 90er
Jahren wusste man bereits, dass Furan hepatotoxische und leberkanzerogene Wirkungen
in Nagern verursacht. In diesen Studien wurden nach chronischer Verabreichung von
Furan an Ratten über einen Zeitraum von 2 Jahren bereits bei der niedrigsten getesteten
Dosis von 2 mg/kg Körpergewicht hepatozelluläre Adenome und Karzinome sowie sehr
hohe Inzidenzen von Cholangiokarzinomen beobachtet (NTP, 1993). Die Mechanismen,
die der Tumorentstehung durch Furan zugrunde liegen, sind jedoch bis heute nicht
ausreichend untersucht.
Furan wird durch Enzyme der Cytochrom P450 (CYP) Familie, vor allem durch CYP2E1, zu
seinem Hauptmetaboliten cis-2-Buten-1,4-dial (BDA) verstoffwechselt (Chen et al., 1995;
Kedderis et al., 1993). Der reaktive Furan-Metabolit BDA kann in vitro mit zellulären
Nukleophilen wie Nukleosiden und Aminosäureresten reagieren (Byrns et al., 2002; Byrns
et al., 2004; Chen et al., 1997). Verschiedene Untersuchungen weisen darauf hin, dass die
toxischen und kanzerogenen Effekte von Furan hauptsächlich durch BDA vermittelt
werden (Carfagna et al., 1993; Fransson-Steen et al., 1997; Mugford et al., 1997).
Es ist seit langem bekannt, dass kovalente Bindung an Proteine zu Zytotoxizität führen
kann. Der zugrunde liegende Mechanismus ist bislang noch ungeklärt. Es wird jedoch
vermutet, dass die kovalente Bindung von reaktiven Metaboliten an Proteine zu deren
Funktionsverlust führt, was wiederum fatale Konsequenzen für die Zellen haben kann.
Eine Identifizierung der Zielproteine von Furan, d.h. jener Proteine an denen eine
Adduktbildung durch reaktive Metabolite von Furan erfolgt, könnte daher Aufschluss
über deren mögliche Rolle in der Pathogenese der durch Furan induzierten Lebertoxizität
und -kanzerogenität geben.
Um die Zielproteine reaktiver Furan-Metabolite zu identifizieren, wurde [3,4-14C]-Furan
an männliche F344/N Ratten verabreicht. Durch Flüssigkeitsszintillationszählung der
Proteinextrakte wurde ein dosisabhängiger Anstieg der kovalent an Leberproteine
gebundenen Radioaktivität ermittelt. Nach der Auftrennung der Leberproteinextrakte
durch zweidimensionale Gelelektrophorese und der Detektion der radioaktiven Spots

150 ZUSAMMENFASSUNG
durch Fluorographie wurden die Zielproteine reaktiver Furan-Metabolite durch
Massenspektrometrie und Datenbanksuche (Mascot-Datenbank) identifiziert. In 3 Ratten,
die mit Furan behandelt worden waren, wurden übereinstimmend 61 mögliche
Zielproteine von Furan identifiziert. Unter diesen Zielproteinen waren unter anderem
Enzyme, Transportproteine, Strukturproteine und Chaperones vertreten. Die Zuordnung
der identifizierten Proteine zu zellulären Signal- und Stoffwechselwegen mittels spezieller
Software zeigte, dass die Zielproteine hauptsächlich aus dem Zytosol und den
Mitochondrien stammen und an Glucosemetabolismus, mitochondrieller β-Oxidation von
Fettsäuren und dem Abbau von Aminosäuren beteiligt sind. Außerdem wurde auch die β-
Untereinheit der ATP-Synthase als mögliches Zielprotein identifiziert. Diese Ergebnisse
weisen stark darauf hin, dass die Bindung reaktiver Furan-Metabolite an Proteine zur
Schädigung der Mitochondrien, Beeinträchtigung der zellulären Energieproduktion und
verändertem Redox-Status führen und damit zum Zelltod beitragen könnte. Weiterhin
befanden sich unter den möglichen Zielproteinen auch Proteine, die für die Regulation
der Redox-Homöostase in der Zelle verantwortlich sind. Ein Funktionsverlust dieser
Proteine durch die kovalente Bindung reaktiver Furan-Metabolite könnte eine
verminderte Fähigkeit der Zelle oxidativen Stress abzuwehren zur Folge haben, was
wiederum zum Zelltod führen könnte. Zusätzlich dazu, dass die kovalente Modifikation
mehrerer Proteine aus dem gleichen Stoffwechselweg dessen Gesamtfunktion
beeinträchtigen kann, ist es außerdem möglich, dass Adduktbildung an einzelnen
Proteinen mit Schlüsselfunktionen in der Aufrechterhaltung der Zellhomöostase toxische
Effekte auslösen kann. Ein Funktionsverlust dieser Proteine, die z.B. in Transportprozesse
durch Mitochondrienmembranen, zelluläre Signalwege, DNA-Methylierung,
Blutgerinnung und Gallensäuren-Transport involviert sind, könnte ebenfalls an den
zytotoxischen und kanzerogenen Wirkungen von Furan beteiligt sein.
Die kovalente Bindung reaktiver Furan-Metabolite an zelluläre Proteine kann zu einer
Akkumulation großer Mengen an ungefalteten oder beschädigten Proteinen im
endoplasmatischen Retikulum (ER) führen. Als Antwort auf diesen sogenannten ER-Stress
kann die Zelle den Unfolded Protein Response (UPR) aktivieren, einen zellulären
Signalweg um vermehrt beschädigte Proteine zu reparieren oder abzubauen. Um
festzustellen, ob die Bindung reaktiver Furan-Metabolite an zelluläre Proteine eine
Aktivierung des UPR auslöst, wurden semiquantitative PCR und Real-Time-PCR Analysen

ZUSAMMENFASSUNG 151
durchgeführt. Nach einer Aktivierung des UPR sollte die semiquantitative PCR das
vermehrte Auftreten gespleißter X-box binding protein-1 (XBP1) mRNA zeigen, die als
Transkriptionsfaktor die Expression der UPR-Zielgene auslöst. Weiterhin sollte im Falle
einer UPR-Aktivierung eine erhöhte Expression der Zielgene des UPR durch Real-Time-PCR
sichtbar werden. Unsere Daten zeigen jedoch keine Hinweise auf eine Aktivierung des
UPR in der Rattenleber, weder nach Verabreichung einer einzigen hepatotoxischen Dosis
noch nach Behandlung über 4 Wochen mit einer bekanntlich kanzerogenen Dosis. Diese
Ergebnisse lassen vermuten, dass nach der Verabreichung von Furan entweder kein ER-
Stress durch Akkumulation beschädigter Proteine entsteht oder die Aktivierung des UPR
beeinträchtigt ist. Für Letzteres spricht, dass das Glucose-regulierte Protein 78 (GRP78),
das eine wichtige Mediatorfunktion bei der Aktivierung des UPR aufweist und durch
dessen Inhibition die Aktivierung des UPR behindert werden kann (Martin et al., 2010), in
unseren Untersuchungen als ein Zielprotein von Furan identifiziert wurde. Es erscheint
daher möglich, dass kovalente Modifikation von GRP78 durch reaktive Furan-Metabolite
die Aktivierung des UPR beeinträchtigt. Zusätzlich dazu ist es außerdem möglich, dass
Reparatur- und Degradierungsfunktionen der Zelle nicht vollständig funktionsfähig sind,
weil einige Proteine, die an diesen Prozessen teilnehmen, auch als Zielproteine von Furan
identifiziert wurden und daher in ihrer Funktionalität beeinträchtigt sein können.
Zusammenfassend weisen unsere Daten darauf hin, dass die kovalente Bindung reaktiver
Furan-Metabolite an verschiedenste Proteine zu deren beeinträchtigter Funktion führen
könnte, was wiederum eine Störung der zellulären Funktionen zur Folge haben könnte. Im
Fall von Furan scheint es vor allem zur Beeinträchtigung der mitochondriellen
Energieproduktion, der Redox-Regulation sowie der Proteinfaltung und des -abbaus zu
kommen, was im Zusammenspiel den Zelltod von Hepatozyten herbeiführen könnte. Um
jedoch eindeutig zu klären, ob die Furan-bedingte Adduktbildung an Proteinen tatsächlich
zu einem Funktionsverlust der betroffenen Proteine führt, sind weitere Untersuchungen
nötig.

152 REFERENCES
12 REFERENCES
Abu-Hamad, S., Sivan, S., and Shoshan-Barmatz, V. (2006). The expression level of the voltage-dependent anion channel controls life and death of the cell. Proc Natl Acad Sci U S A 103, 5787-5792.
Akerstrom, B., Logdberg, L., Berggard, T., Osmark, P., and Lindqvist, A. (2000). alpha(1)-Microglobulin: a yellow-brown lipocalin. Biochim Biophys Acta 1482, 172-184.
Alrefai, W.A., and Gill, R.K. (2007). Bile acid transporters: structure, function, regulation and pathophysiological implications. Pharm Res 24, 1803-1823.
Andersen, K.M., Madsen, L., Prag, S., Johnsen, A.H., Semple, C.A., Hendil, K.B., and Hartmann-Petersen, R. (2009). Thioredoxin Txnl1/TRP32 is a redox-active cofactor of the 26 S proteasome. J Biol Chem 284, 15246-15254.
Antonenkov, V.D., Ohlmeier, S., Sormunen, R.T., and Hiltunen, J.K. (2007). UK114, a YjgF/Yer057p/UK114 family protein highly conserved from bacteria to mammals, is localized in rat liver peroxisomes. Biochem Biophys Res Commun 357, 252-257.
Aram, L., Geula, S., Arbel, N., and Shoshan-Barmatz, V. (2010). VDAC1 cysteine residues: topology and function in channel activity and apoptosis. Biochem J 427, 445-454.
Asif, A.R., Armstrong, V.W., Voland, A., Wieland, E., Oellerich, M., and Shipkova, M. (2007). Proteins identified as targets of the acyl glucuronide metabolite of mycophenolic acid in kidney tissue from mycophenolate mofetil treated rats. Biochimie 89, 393-402.
Atshaves, B.P., Martin, G.G., Hostetler, H.A., McIntosh, A.L., Kier, A.B., and Schroeder, F. (2010). Liver fatty acid-binding protein and obesity. J Nutr Biochem.
Baric, I. (2009). Inherited disorders in the conversion of methionine to homocysteine. J Inherit Metab Dis 32, 459-471.
Bashour, A.M., and Bloom, G.S. (1998). 58K, a microtubule-binding Golgi protein, is a formiminotransferase cyclodeaminase. J Biol Chem 273, 19612-19617.
Bhoola, K.D., Figueroa, C.D., and Worthy, K. (1992). Bioregulation of kinins: kallikreins, kininogens, and kininases. Pharmacol Rev 44, 1-80.
Brisson, D., Vohl, M.C., St-Pierre, J., Hudson, T.J., and Gaudet, D. (2001). Glycerol: a neglected variable in metabolic processes? Bioessays 23, 534-542.
Brohawn, S.G., and Schwartz, T.U. (2009). Molecular architecture of the Nup84-Nup145C-Sec13 edge element in the nuclear pore complex lattice. Nat Struct Mol Biol 16, 1173-1177.
Burka, L.T., Washburn, K.D., and Irwin, R.D. (1991). Disposition of [14C]furan in the male F344 rat. J Toxicol Environ Health 34, 245-257.
Buxbaum, J.N., and Reixach, N. (2009). Transthyretin: the servant of many masters. Cell Mol Life Sci 66, 3095-3101.
Byrns, M.C., Predecki, D.P., and Peterson, L.A. (2002). Characterization of nucleoside adducts of cis-2-butene-1,4-dial, a reactive metabolite of furan. Chem Res Toxicol 15, 373-379.
Byrns, M.C., Vu, C.C., and Peterson, L.A. (2004). The formation of substituted 1,N6-etheno-2'-deoxyadenosine and 1,N2-etheno-2'-deoxyguanosine adducts by cis-2-butene-1,4-dial, a reactive metabolite of furan. Chem Res Toxicol 17, 1607-1613.
Carbone, D.L., Doorn, J.A., Kiebler, Z., and Petersen, D.R. (2005). Cysteine modification by lipid peroxidation products inhibits protein disulfide isomerase. Chem Res Toxicol 18, 1324-1331.
Carfagna, M.A., Held, S.D., and Kedderis, G.L. (1993). Furan-induced cytolethality in isolated rat hepatocytes: correspondence with in vivo dosimetry. Toxicol Appl Pharmacol 123, 265-273.

REFERENCES 153
Carlson, J.A., Rogers, B.B., Sifers, R.N., Hawkins, H.K., Finegold, M.J., and Woo, S.L. (1988). Multiple tissues express alpha 1-antitrypsin in transgenic mice and man. J Clin Invest 82, 26-36.
Chang, C., Pang, K.S., Swaan, P.W., and Ekins, S. (2005). Comparative pharmacophore modeling of organic anion transporting polypeptides: a meta-analysis of rat Oatp1a1 and human OATP1B1. J Pharmacol Exp Ther 314, 533-541.
Chao, J., Chai, K.X., Chen, L.M., Xiong, W., Chao, S., Woodley-Miller, C., Wang, L.X., Lu, H.S., and Chao, L. (1990). Tissue kallikrein-binding protein is a serpin. I. Purification, characterization, and distribution in normotensive and spontaneously hypertensive rats. J Biol Chem 265, 16394-16401.
Chao, J., Tillman, D.M., Wang, M.Y., Margolius, H.S., and Chao, L. (1986). Identification of a new tissue-kallikrein-binding protein. Biochem J 239, 325-331.
Chaudhury, A., Chander, P., and Howe, P.H. (2010). Heterogeneous nuclear ribonucleoproteins (hnRNPs) in cellular processes: Focus on hnRNP E1's multifunctional regulatory roles. RNA 16, 1449-1462.
Chen, L.J., Hecht, S.S., and Peterson, L.A. (1995). Identification of cis-2-butene-1,4-dial as a microsomal metabolite of furan. Chem Res Toxicol 8, 903-906.
Chen, L.J., Hecht, S.S., and Peterson, L.A. (1997). Characterization of amino acid and glutathione adducts of cis-2-butene-1,4-dial, a reactive metabolite of furan. Chem Res Toxicol 10, 866-874.
Chen, T., Mally, A., Ozden, S., and Chipman, J.K. (2010). Low Doses of the Carcinogen Furan Alter Cell Cycle and Apoptosis Gene Expression in Rat Liver Independent of DNA Methylation. Environ Health Perspect.
Chong, C.L., Huang, S.F., Hu, C.P., Chen, Y.L., Chou, H.Y., Chau, G.Y., Shew, J.Y., Tsai, Y.L., Chen, C.T., Chang, C., et al. (2008). Decreased expression of UK114 is related to the differentiation status of human hepatocellular carcinoma. Cancer Epidemiol Biomarkers Prev 17, 535-542.
Cordelli, E., Leopardi, P., Villani, P., Marcon, F., Macri, C., Caiola, S., Siniscalchi, E., Conti, L., Eleuteri, P., Malchiodi-Albedi, F., et al. (2010). Toxic and genotoxic effects of oral administration of furan in mouse liver. Mutagenesis 25, 305-314.
Crabb, D.W., Matsumoto, M., Chang, D., and You, M. (2004). Overview of the role of alcohol dehydrogenase and aldehyde dehydrogenase and their variants in the genesis of alcohol-related pathology. Proc Nutr Soc 63, 49-63.
Crews, C., and Castle, L. (2007). A review of the occurence, formation and analysis of furan in heat-processed foods. Trends in Food Science & Technology 18, 365-372.
Cuervo, A.M., Hildebrand, H., Bomhard, E.M., and Dice, J.F. (1999). Direct lysosomal uptake of alpha 2-microglobulin contributes to chemically induced nephropathy. Kidney Int 55, 529-545.
Daugaard, M., Rohde, M., and Jaattela, M. (2007). The heat shock protein 70 family: Highly homologous proteins with overlapping and distinct functions. FEBS Lett 581, 3702-3710.
Deignan, J.L., Cederbaum, S.D., and Grody, W.W. (2008). Contrasting features of urea cycle disorders in human patients and knockout mouse models. Mol Genet Metab 93, 7-14.
Dennis, G., Jr., Sherman, B.T., Hosack, D.A., Yang, J., Gao, W., Lane, H.C., and Lempicki, R.A. (2003). DAVID: Database for Annotation, Visualization, and Integrated Discovery. Genome Biol 4, P3.
Doherty, M.K., Hammond, D.E., Clague, M.J., Gaskell, S.J., and Beynon, R.J. (2009). Turnover of the human proteome: determination of protein intracellular stability by dynamic SILAC. J Proteome Res 8, 104-112.

154 REFERENCES
Dooley, G.P., Reardon, K.F., Prenni, J.E., Tjalkens, R.B., Legare, M.E., Foradori, C.D., Tessari, J.E., and Hanneman, W.H. (2008). Proteomic analysis of diaminochlorotriazine adducts in wistar rat pituitary glands and LbetaT2 rat pituitary cells. Chem Res Toxicol 21, 844-851.
Doss, M.O., Stauch, T., Gross, U., Renz, M., Akagi, R., Doss-Frank, M., Seelig, H.P., and Sassa, S. (2004). The third case of Doss porphyria (delta-amino-levulinic acid dehydratase deficiency) in Germany. J Inherit Metab Dis 27, 529-536.
Dreyfuss, G., Kim, V.N., and Kataoka, N. (2002). Messenger-RNA-binding proteins and the messages they carry. Nat Rev Mol Cell Biol 3, 195-205.
Druckova, A., and Marnett, L.J. (2006). Characterization of the amino acid adducts of the enedial derivative of teucrin A. Chem Res Toxicol 19, 1330-1340.
Druckova, A., Mernaugh, R.L., Ham, A.J., and Marnett, L.J. (2007). Identification of the protein targets of the reactive metabolite of teucrin A in vivo in the rat. Chem Res Toxicol 20, 1393-1408.
Durling, L.J., Svensson, K., and Abramsson-Zetterberg, L. (2007). Furan is not genotoxic in the micronucleus assay in vivo or in vitro. Toxicol Lett 169, 43-50.
Dworniczak, B., and Mirault, M.E. (1987). Structure and expression of a human gene coding for a 71 kd heat shock 'cognate' protein. Nucleic Acids Res 15, 5181-5197.
EFSA (2004). Report of the Scientific Panel on Contaminants in the Food Chain on provisional findings on furan in food. The EFSA Journal 137, 1-20.
EFSA (2009a). Furan in heat processed food products including home cooked food products and ready-to-eat products. SCIENTIFIC REPORT submitted to EFSA.
EFSA (2009b). Results on the monitoring of furan levels in food. EFSA Scientific Report 304, 1-23.
Egle, J.L., Jr., and Gochberg, B.J. (1979). Respiratory retention and acute toxicity of furan. Am Ind Hyg Assoc J 40, 310-314.
Eliuk, S.M., Renfrow, M.B., Shonsey, E.M., Barnes, S., and Kim, H. (2007). active site modifications of the brain isoform of creatine kinase by 4-hydroxy-2-nonenal correlate with reduced enzyme activity: mapping of modified sites by Fourier transform-ion cyclotron resonance mass spectrometry. Chem Res Toxicol 20, 1260-1268.
Evans, D.C., Watt, A.P., Nicoll-Griffith, D.A., and Baillie, T.A. (2004). Drug-protein adducts: an industry perspective on minimizing the potential for drug bioactivation in drug discovery and development. Chem Res Toxicol 17, 3-16.
Fairbanks, K.D., and Tavill, A.S. (2008). Liver disease in alpha 1-antitrypsin deficiency: a review. Am J Gastroenterol 103, 2136-2141; quiz 2142.
Fan, X., Huang, L., and Sokorai, K.J. (2008). Factors Affecting Thermally Induced Furan Formation. J Agric Food Chem.
Fang, J., Koen, Y.M., and Hanzlik, R.P. (2009). Bioinformatic analysis of xenobiotic reactive metabolite target proteins and their interacting partners. BMC Chem Biol 9, 5.
Feng, C., Tollin, G., and Enemark, J.H. (2007). Sulfite oxidizing enzymes. Biochim Biophys Acta 1774, 527-539.
Fleming, C.E., Nunes, A.F., and Sousa, M.M. (2009). Transthyretin: more than meets the eye. Prog Neurobiol 89, 266-276.
Fouassier, L., Duan, C.Y., Feranchak, A.P., Yun, C.H., Sutherland, E., Simon, F., Fitz, J.G., and Doctor, R.B. (2001). Ezrin-radixin-moesin-binding phosphoprotein 50 is expressed at the apical membrane of rat liver epithelia. Hepatology 33, 166-176.

REFERENCES 155
Fouassier, L., Rosenberg, P., Mergey, M., Saubamea, B., Claperon, A., Kinnman, N., Chignard, N., Jacobsson-Ekman, G., Strandvik, B., Rey, C., et al. (2009). Ezrin-radixin-moesin-binding phosphoprotein (EBP50), an estrogen-inducible scaffold protein, contributes to biliary epithelial cell proliferation. Am J Pathol 174, 869-880.
Fransson-Steen, R., Goldsworthy, T.L., Kedderis, G.L., and Maronpot, R.R. (1997). Furan-induced liver cell proliferation and apoptosis in female B6C3F1 mice. Toxicology 118, 195-204.
Fries, E., and Blom, A.M. (2000). Bikunin--not just a plasma proteinase inhibitor. Int J Biochem Cell Biol 32, 125-137.
Gao, Y., and Sztul, E. (2001). A novel interaction of the Golgi complex with the vimentin intermediate filament cytoskeleton. J Cell Biol 152, 877-894.
Garneau, D., Revil, T., Fisette, J.F., and Chabot, B. (2005). Heterogeneous nuclear ribonucleoprotein F/H proteins modulate the alternative splicing of the apoptotic mediator Bcl-x. J Biol Chem 280, 22641-22650.
Georgescu, M.M., Morales, F.C., Molina, J.R., and Hayashi, Y. (2008). Roles of NHERF1/EBP50 in cancer. Curr Mol Med 8, 459-468.
Gill, S., Bondy, G., Lefebvre, D.E., Becalski, A., Kavanagh, M., Hou, Y., Turcotte, A.M., Barker, M., Weld, M., Vavasour, E., et al. (2010). Subchronic oral toxicity study of furan in Fischer-344 rats. Toxicol Pathol 38, 619-630.
Gonias, S.L., Hembrough, T.A., and Sankovic, M. (2001). Cytokeratin 8 functions as a major plasminogen receptor in select epithelial and carcinoma cells. Front Biosci 6, D1403-1411.
Guynn, R.W., Veloso, D., Lawson, J.W., and Veech, R.L. (1974). The concentration and control of cytoplasmic free inorganic pyrophosphate in rat liver in vivo. Biochem J 140, 369-375.
Hagiwara, H., Tajika, Y., Matsuzaki, T., Suzuki, T., Aoki, T., and Takata, K. (2006). Localization of Golgi 58K protein (formiminotransferase cyclodeaminase) to the centrosome. Histochem Cell Biol 126, 251-259.
Hamadeh, H.K., Jayadev, S., Gaillard, E.T., Huang, Q., Stoll, R., Blanchard, K., Chou, J., Tucker, C.J., Collins, J., Maronpot, R., et al. (2004). Integration of clinical and gene expression endpoints to explore furan-mediated hepatotoxicity. Mutat Res 549, 169-183.
Hamberger, C., Kellert, M., Schauer, U.M., Dekant, W., and Mally, A. (2010a). Hepatobiliary toxicity of furan: Identification of furan metabolites in bile of male F344/N rats. Drug Metab Dispos.
Hamberger, C., Moro, S., Malfatti, M., Turteltaub, K., Dekant, W., and Mally, A. (2010b). Analysis of DNA binding of [3,4-14C]-furan in rat liver by accelerator mass spectrometry. (Poster). Society of Toxicology 49th Annual Meeting, Salt Lake City, 2010 The Toxicologist, Supplement to Toxicological Sciences.
Hanzlik, R.P., Fang, J., and Koen, Y.M. (2009). Filling and mining the reactive metabolite target protein database. Chem Biol Interact 179, 38-44.
Hanzlik, R.P., Koen, Y.M., Theertham, B., Dong, Y., and Fang, J. (2007). The reactive metabolite target protein database (TPDB)--a web-accessible resource. BMC Bioinformatics 8, 95.
Hard, G.C., Rodgers, I.S., Baetcke, K.P., Richards, W.L., McGaughy, R.E., and Valcovic, L.R. (1993). Hazard evaluation of chemicals that cause accumulation of alpha 2u-globulin, hyaline droplet nephropathy, and tubule neoplasia in the kidneys of male rats. Environ Health Perspect 99, 313-349.
Hickling, K., Hitchcock, J.M., Chipman, J.K., Hammond, T.G., and Evans, J.G. (2010a). Induction and progression of cholangiofibrosis in rat liver injured by oral administration of furan. Toxicologic Pathology 38, 213-229.

156 REFERENCES
Hickling, K.C., Hitchcock, J.M., Oreffo, V., Mally, A., Coleman, R., Hammond, T.G., Evans, J.G., and Chipman, J.K. (2010b). Evidence of oxidative stress and associated DNA damage, increased proliferative drive and altered gene expression in rat liver produced by the cholangiocarcinogenic agent furan. Toxicologic Pathology 38, 230-243.
Hilton, J.F., Christensen, K.E., Watkins, D., Raby, B.A., Renaud, Y., de la Luna, S., Estivill, X., MacKenzie, R.E., Hudson, T.J., and Rosenblatt, D.S. (2003). The molecular basis of glutamate formiminotransferase deficiency. Hum Mutat 22, 67-73.
Hoffmann, H. (2010). Untersuchungen zur Beteiligung von bakterieller Translokation an der Hepatotoxizität von Furan. Diplomarbeit Universität Würzburg.
Hoivik, D.J., Manautou, J.E., Tveit, A., Mankowski, D.C., Khairallah, E.A., and Cohen, S.D. (1996). Evidence suggesting the 58-kDa acetaminophen binding protein is a preferential target for acetaminophen electrophile. Fundam Appl Toxicol 32, 79-86.
Hu, S., Song, E., Tian, R., Ma, S., Yang, T., Mu, Y., Li, Y., Shao, C., Gao, S., and Gao, Y. (2009). Systematic analysis of a simple adaptor protein PDZK1: ligand identification, interaction and functional prediction of complex. Cell Physiol Biochem 24, 231-242.
Huang da, W., Sherman, B.T., and Lempicki, R.A. (2009). Systematic and integrative analysis of large gene lists using DAVID bioinformatics resources. Nat Protoc 4, 44-57.
IARC (1995). Furan. Dry Cleaning, Some Chlorinated Solvents and Other Industrial Chemicals. International Agency for Research on Cancer (IARC) Monograph 63, 393.
Ichijo, H., Nishida, E., Irie, K., ten Dijke, P., Saitoh, M., Moriguchi, T., Takagi, M., Matsumoto, K., Miyazono, K., and Gotoh, Y. (1997). Induction of apoptosis by ASK1, a mammalian MAPKKK that activates SAPK/JNK and p38 signaling pathways. Science 275, 90-94.
Iciek, M., and Wlodek, L. (2001). Biosynthesis and biological properties of compounds containing highly reactive, reduced sulfane sulfur. Pol J Pharmacol 53, 215-225.
Ikehata, K., Duzhak, T.G., Galeva, N.A., Ji, T., Koen, Y.M., and Hanzlik, R.P. (2008). Protein targets of reactive metabolites of thiobenzamide in rat liver in vivo. Chem Res Toxicol 21, 1432-1442.
Itoh, H., Ide, H., Ishikawa, N., and Nawa, Y. (1994). Mast cell protease inhibitor, trypstatin, is a fragment of inter-alpha-trypsin inhibitor light chain. J Biol Chem 269, 3818-3822.
Jaffe, E.K. (2004). The porphobilinogen synthase catalyzed reaction mechanism. Bioorg Chem 32, 316-325.
Jaffe, E.K., and Stith, L. (2007). ALAD porphyria is a conformational disease. Am J Hum Genet 80, 329-337.
Jimenez, A., Pelto-Huikko, M., Gustafsson, J.A., and Miranda-Vizuete, A. (2006). Characterization of human thioredoxin-like-1: potential involvement in the cellular response against glucose deprivation. FEBS Lett 580, 960-967.
Johnson, E.S., Ma, P.C., Ota, I.M., and Varshavsky, A. (1995). A proteolytic pathway that recognizes ubiquitin as a degradation signal. J Biol Chem 270, 17442-17456.
Kalinina, E.V., Chernov, N.N., and Saprin, A.N. (2008). Involvement of thio-, peroxi-, and glutaredoxins in cellular redox-dependent processes. Biochemistry (Mosc) 73, 1493-1510.
Kameda, K., Suzuki, L.K., and Imai, Y. (1985). Further purification, characterization and salt activation of acyl-CoA synthetase from Escherichia coli. Biochim Biophys Acta 840, 29-36.
Kanouchi, H., Matsumoto, M., Taga, M., Yamada, K., Oka, T., Tone, S., and Minatogawa, Y. (2005). Nuclear transfer of perchloric acid-soluble protein by endoplasmic reticulum stressors. Protein Sci 14, 2344-2349.

REFERENCES 157
Kanouchi, H., Tachibana, H., Oka, T., and Yamada, K. (2001). Recombinant expression of perchloric acid-soluble protein reduces cell proliferation. Cell Mol Life Sci 58, 1340-1343.
Katyare, S.S., and Satav, J.G. (1989). Impaired mitochondrial oxidative energy metabolism following paracetamol-induced hepatotoxicity in the rat. Br J Pharmacol 96, 51-58.
Kedderis, G.L., Carfagna, M.A., Held, S.D., Batra, R., Murphy, J.E., and Gargas, M.L. (1993). Kinetic analysis of furan biotransformation by F-344 rats in vivo and in vitro. Toxicol Appl Pharmacol 123, 274-282.
Kellert, M., Brink, A., Richter, I., Schlatter, J., and Lutz, W.K. (2008a). Tests for genotoxicity and mutagenicity of furan and its metabolite cis-2-butene-1,4-dial in L5178Y tk(+/-) mouse lymphoma cells. Mutat Res.
Kellert, M., Wagner, S., Lutz, U., and Lutz, W.K. (2008b). Biomarkers of furan exposure by metabolic profiling of rat urine with liquid chromatography-tandem mass spectrometry and principal component analysis. Chem Res Toxicol 21, 761-768.
Kelley, P.M., and Schlesinger, M.J. (1982). Antibodies to two major chicken heat shock proteins cross-react with similar proteins in widely divergent species. Mol Cell Biol 2, 267-274.
Kelly, V.P., Sherratt, P.J., Crouch, D.H., and Hayes, J.D. (2002). Novel homodimeric and heterodimeric rat gamma-hydroxybutyrate synthases that associate with the Golgi apparatus define a distinct subclass of aldo-keto reductase 7 family proteins. Biochem J 366, 847-861.
Kim, A., Kim, M.J., Yang, Y., Kim, J.W., Yeom, Y.I., and Lim, J.S. (2009). Suppression of NF-kappaB activity by NDRG2 expression attenuates the invasive potential of highly malignant tumor cells. Carcinogenesis 30, 927-936.
Klaunig, J.E., Kamendulis, L.M., and Xu, Y. (2000). Epigenetic mechanisms of chemical carcinogenesis. Hum Exp Toxicol 19, 543-555.
Kobayashi, H. (2006). Endogenous anti-inflammatory substances, inter-alpha-inhibitor and bikunin. Biol Chem 387, 1545-1549.
Kocher, O., and Krieger, M. (2009). Role of the adaptor protein PDZK1 in controlling the HDL receptor SR-BI. Curr Opin Lipidol 20, 236-241.
Kocher, O., Yesilaltay, A., Cirovic, C., Pal, R., Rigotti, A., and Krieger, M. (2003). Targeted disruption of the PDZK1 gene in mice causes tissue-specific depletion of the high density lipoprotein receptor scavenger receptor class B type I and altered lipoprotein metabolism. J Biol Chem 278, 52820-52825.
Koen, Y.M., Gogichaeva, N.V., Alterman, M.A., and Hanzlik, R.P. (2007). A proteomic analysis of bromobenzene reactive metabolite targets in rat liver cytosol in vivo. Chem Res Toxicol 20, 511-519.
Koen, Y.M., and Hanzlik, R.P. (2002). Identification of seven proteins in the endoplasmic reticulum as targets for reactive metabolites of bromobenzene. Chem Res Toxicol 15, 699-706.
Koen, Y.M., Yue, W., Galeva, N.A., Williams, T.D., and Hanzlik, R.P. (2006). Site-specific arylation of rat glutathione s-transferase A1 and A2 by bromobenzene metabolites in vivo. Chem Res Toxicol 19, 1426-1434.
Labenski, M.T., Fisher, A.A., Lo, H.H., Monks, T.J., and Lau, S.S. (2009). Protein electrophile-binding motifs: lysine-rich proteins are preferential targets of quinones. Drug Metab Dispos 37, 1211-1218.
Lawen, A., Ly, J.D., Lane, D.J., Zarschler, K., Messina, A., and De Pinto, V. (2005). Voltage-dependent anion-selective channel 1 (VDAC1)--a mitochondrial protein, rediscovered as a novel enzyme in the plasma membrane. Int J Biochem Cell Biol 37, 277-282.

158 REFERENCES
Lee, S.M., Kim, J.H., Cho, E.J., and Youn, H.D. (2009). A nucleocytoplasmic malate dehydrogenase regulates p53 transcriptional activity in response to metabolic stress. Cell Death Differ 16, 738-748.
Li, M., Wang, W., Soroka, C.J., Mennone, A., Harry, K., Weinman, E.J., and Boyer, J.L. (2010). NHERF-1 binds to Mrp2 and regulates hepatic Mrp2 expression and function. J Biol Chem 285, 19299-19307.
Li, S.X., Tong, Y.P., Xie, X.C., Wang, Q.H., Zhou, H.N., Han, Y., Zhang, Z.Y., Gao, W., Li, S.G., Zhang, X.C., et al. (2007). Octameric structure of the human bifunctional enzyme PAICS in purine biosynthesis. J Mol Biol 366, 1603-1614.
Lillig, C.H., and Holmgren, A. (2007). Thioredoxin and related molecules--from biology to health and disease. Antioxid Redox Signal 9, 25-47.
Limacher, A., Kerler, J., Conde-Petit, B., and Blank, I. (2007). Formation of furan and methylfuran from ascorbic acid in model systems and food. Food Addit Contam 24 Suppl 1, 122-135.
Lindquist, S., and Craig, E.A. (1988). The heat-shock proteins. Annu Rev Genet 22, 631-677.
Lindqvist, A., Bratt, T., Altieri, M., Kastern, W., and Akerstrom, B. (1992). Rat alpha 1-microglobulin: co-expression in liver with the light chain of inter-alpha-trypsin inhibitor. Biochim Biophys Acta 1130, 63-67.
Lo, A.S., Liew, C.T., Ngai, S.M., Tsui, S.K., Fung, K.P., Lee, C.Y., and Waye, M.M. (2005). Developmental regulation and cellular distribution of human cytosolic malate dehydrogenase (MDH1). J Cell Biochem 94, 763-773.
Lu, D., Sullivan, M.M., Phillips, M.B., and Peterson, L.A. (2009). Degraded protein adducts of cis-2-butene-1,4-dial are urinary and hepatocyte metabolites of furan. Chem Res Toxicol 22, 997-1007.
Lu, S.C., Alvarez, L., Huang, Z.Z., Chen, L., An, W., Corrales, F.J., Avila, M.A., Kanel, G., and Mato, J.M. (2001). Methionine adenosyltransferase 1A knockout mice are predisposed to liver injury and exhibit increased expression of genes involved in proliferation. Proc Natl Acad Sci U S A 98, 5560-5565.
Lundin, M., Baltscheffsky, H., and Ronne, H. (1991). Yeast PPA2 gene encodes a mitochondrial inorganic pyrophosphatase that is essential for mitochondrial function. J Biol Chem 266, 12168-12172.
Maarsingh, H., Zaagsma, J., and Meurs, H. (2009). Arginase: a key enzyme in the pathophysiology of allergic asthma opening novel therapeutic perspectives. Br J Pharmacol 158, 652-664.
MacLeod, A.K., Kelly, V.P., Higgins, L.G., Kelleher, M.O., Price, S.A., Bigley, A.L., Betton, G.R., and Hayes, J.D. (2010). Expression and localization of rat aldo-keto reductases and induction of the 1B13 and 1D2 isoforms by phenolic antioxidants. Drug Metab Dispos 38, 341-346.
Mally, A., Graff, C., Schmal, O., Moro, S., Hamberger, C., Schauer, U.M., Bruck, J., Ozden, S., Sieber, M., Steger, U., et al. (2010). Functional and proliferative effects of repeated low-dose oral administration of furan in rat liver. Mol Nutr Food Res.
Mao, Y., Vyas, N.K., Vyas, M.N., Chen, D.H., Ludtke, S.J., Chiu, W., and Quiocho, F.A. (2004). Structure of the bifunctional and Golgi-associated formiminotransferase cyclodeaminase octamer. EMBO J 23, 2963-2971.
Marinari, U.M., Ferro, M., Sciaba, L., Finollo, R., Bassi, A.M., and Brambilla, G. (1984). DNA-damaging activity of biotic and xenobiotic aldehydes in Chinese hamster ovary cells. Cell Biochem Funct 2, 243-248.
Maronpot, R.R., Giles, H.D., Dykes, D.J., and Irwin, R.D. (1991). Furan-induced hepatic cholangiocarcinomas in Fischer 344 rats. Toxicol Pathol 19, 561-570.

REFERENCES 159
Martin, G.G., Atshaves, B.P., McIntosh, A.L., Mackie, J.T., Kier, A.B., and Schroeder, F. (2005). Liver fatty-acid-binding protein (L-FABP) gene ablation alters liver bile acid metabolism in male mice. Biochem J 391, 549-560.
Martin, S., Hill, D.S., Paton, J.C., Paton, A.W., Birch-Machin, M.A., Lovat, P.E., and Redfern, C.P. (2010). Targeting GRP78 to enhance melanoma cell death. Pigment Cell Melanoma Res 23, 675-682.
Martinez-Chantar, M.L., Corrales, F.J., Martinez-Cruz, L.A., Garcia-Trevijano, E.R., Huang, Z.Z., Chen, L., Kanel, G., Avila, M.A., Mato, J.M., and Lu, S.C. (2002). Spontaneous oxidative stress and liver tumors in mice lacking methionine adenosyltransferase 1A. FASEB J 16, 1292-1294.
Matsui, M., Oshima, M., Oshima, H., Takaku, K., Maruyama, T., Yodoi, J., and Taketo, M.M. (1996). Early embryonic lethality caused by targeted disruption of the mouse thioredoxin gene. Dev Biol 178, 179-185.
Mello, C.F., Sultana, R., Piroddi, M., Cai, J., Pierce, W.M., Klein, J.B., and Butterfield, D.A. (2007). Acrolein induces selective protein carbonylation in synaptosomes. Neuroscience 147, 674-679.
Metzger, H.P., and Schywalsky, M. (1992). Intraorgan differences of blood flow, oxygen supply and glycogen content in the multilobular liver of normal and hemorrhagic rats. Int J Microcirc Clin Exp 11, 67-83.
Meyer, B., Papasotiriou, D.G., and Karas, M. (2010). 100% protein sequence coverage: a modern form of surrealism in proteomics. Amino Acids.
Meyer, H.H., Shorter, J.G., Seemann, J., Pappin, D., and Warren, G. (2000). A complex of mammalian ufd1 and npl4 links the AAA-ATPase, p97, to ubiquitin and nuclear transport pathways. EMBO J 19, 2181-2192.
Miller, J.A., and Miller, E.C. (1948). The carcinogenicity of certain derivatives of p-dimethylaminozobenz in the rat. J Exp Med 87, 139-156.
Minarik, P., Tomaskova, N., Kollarova, M., and Antalik, M. (2002). Malate dehydrogenases--structure and function. Gen Physiol Biophys 21, 257-265.
Miranda-Vizuete, A., Gustafsson, J.A., and Spyrou, G. (1998). Molecular cloning and expression of a cDNA encoding a human thioredoxin-like protein. Biochem Biophys Res Commun 243, 284-288.
Miseta, A., and Csutora, P. (2000). Relationship between the occurrence of cysteine in proteins and the complexity of organisms. Mol Biol Evol 17, 1232-1239.
Mitsui, A., Hamuro, J., Nakamura, H., Kondo, N., Hirabayashi, Y., Ishizaki-Koizumi, S., Hirakawa, T., Inoue, T., and Yodoi, J. (2002). Overexpression of human thioredoxin in transgenic mice controls oxidative stress and life span. Antioxid Redox Signal 4, 693-696.
Morishita, R., Kawagoshi, A., Sawasaki, T., Madin, K., Ogasawara, T., Oka, T., and Endo, Y. (1999). Ribonuclease activity of rat liver perchloric acid-soluble protein, a potent inhibitor of protein synthesis. J Biol Chem 274, 20688-20692.
Mugford, C.A., Carfagna, M.A., and Kedderis, G.L. (1997). Furan-mediated uncoupling of hepatic oxidative phosphorylation in Fischer-344 rats: an early event in cell death. Toxicol Appl Pharmacol 144, 1-11.
Murley, L.L., and MacKenzie, R.E. (1997). Monofunctional domains of formiminotransferase-cyclodeaminase retain similar conformational stabilities outside the bifunctional octamer. Biochim Biophys Acta 1338, 223-232.
Nagahara, N., and Nishino, T. (1996). Role of amino acid residues in the active site of rat liver mercaptopyruvate sulfurtransferase. CDNA cloning, overexpression, and site-directed mutagenesis. J Biol Chem 271, 27395-27401.

160 REFERENCES
Nagahara, N., Yoshii, T., Abe, Y., and Matsumura, T. (2007). Thioredoxin-dependent enzymatic activation of mercaptopyruvate sulfurtransferase. An intersubunit disulfide bond serves as a redox switch for activation. J Biol Chem 282, 1561-1569.
Nakagawa, T., and Yamaguchi, M. (2008). Nuclear localization of regucalcin is enhanced in culture with protein kinase C activation in cloned normal rat kidney proximal tubular epithelial NRK52E cells. Int J Mol Med 21, 605-610.
Nesvizhskii, A.I., and Aebersold, R. (2004). Analysis, statistical validation and dissemination of large-scale proteomics datasets generated by tandem MS. Drug Discov Today 9, 173-181.
Ni, M., and Lee, A.S. (2007). ER chaperones in mammalian development and human diseases. FEBS Lett 581, 3641-3651.
Niso-Santano, M., Gonzalez-Polo, R.A., Bravo-San Pedro, J.M., Gomez-Sanchez, R., Lastres-Becker, I., Ortiz-Ortiz, M.A., Soler, G., Moran, J.M., Cuadrado, A., and Fuentes, J.M. (2010). Activation of apoptosis signal-regulating kinase 1 is a key factor in paraquat-induced cell death: modulation by the Nrf2/Trx axis. Free Radic Biol Med 48, 1370-1381.
NTP, U.S.D.o.H.a.H.S., Public Health Service, Research Triangle Park, NC. (1993). Toxicology and Carcinogenesis Studies of Furan (CAS No. 110-00-9) in F344/N Rats and B6C3F1 Mice (Gavage Studies). National Toxicology Program Technical Report Series 402, 1-286.
O'Malley, K., Mauron, A., Barchas, J.D., and Kedes, L. (1985). Constitutively expressed rat mRNA encoding a 70-kilodalton heat-shock-like protein. Mol Cell Biol 5, 3476-3483.
Ou, X., Yang, H., Ramani, K., Ara, A.I., Chen, H., Mato, J.M., and Lu, S.C. (2007). Inhibition of human betaine-homocysteine methyltransferase expression by S-adenosylmethionine and methylthioadenosine. Biochem J 401, 87-96.
Pacher, P., Beckman, J.S., and Liaudet, L. (2007). Nitric oxide and peroxynitrite in health and disease. Physiol Rev 87, 315-424.
Pajares, M.A., and Perez-Sala, D. (2006). Betaine homocysteine S-methyltransferase: just a regulator of homocysteine metabolism? Cell Mol Life Sci 63, 2792-2803.
Palmeira, C.M., and Rolo, A.P. (2004). Mitochondrially-mediated toxicity of bile acids. Toxicology 203, 1-15.
Panda, H., Pandey, R.S., Debata, P.R., and Supakar, P.C. (2007). Age-dependent differential expression and activity of rat liver cytosolic inorganic pyrophosphatase gene. Biogerontology 8, 517-525.
Pelham, H.R. (1986). Speculations on the functions of the major heat shock and glucose-regulated proteins. Cell 46, 959-961.
Pellicoro, A., and Faber, K.N. (2007). Review article: The function and regulation of proteins involved in bile salt biosynthesis and transport. Aliment Pharmacol Ther 26 Suppl 2, 149-160.
Perez Locas, C., and Yaylayan, V.A. (2004). Origin and mechanistic pathways of formation of the parent furan--a food toxicant. J Agric Food Chem 52, 6830-6836.
Perez, M.J., and Briz, O. (2009). Bile-acid-induced cell injury and protection. World J Gastroenterol 15, 1677-1689.
Perlmutter, D.H., May, L.T., and Sehgal, P.B. (1989). Interferon beta 2/interleukin 6 modulates synthesis of alpha 1-antitrypsin in human mononuclear phagocytes and in human hepatoma cells. J Clin Invest 84, 138-144.
Pervaiz, S., and Brew, K. (1987). Homology and structure-function correlations between alpha 1-acid glycoprotein and serum retinol-binding protein and its relatives. FASEB J 1, 209-214.

REFERENCES 161
Pessayre, D., Mansouri, A., Haouzi, D., and Fromenty, B. (1999). Hepatotoxicity due to mitochondrial dysfunction. Cell Biol Toxicol 15, 367-373.
Peterson, L.A., Cummings, M.E., Chan, J.Y., Vu, C.C., and Matter, B.A. (2006). Identification of a cis-2-butene-1,4-dial-derived glutathione conjugate in the urine of furan-treated rats. Chem Res Toxicol 19, 1138-1141.
Peterson, L.A., Cummings, M.E., Vu, C.C., and Matter, B.A. (2005). Glutathione trapping to measure microsomal oxidation of furan to cis-2-butene-1,4-dial. Drug Metab Dispos 33, 1453-1458.
Peterson, L.A., Naruko, K.C., and Predecki, D.P. (2000). A reactive metabolite of furan, cis-2-butene-1,4-dial, is mutagenic in the Ames assay. Chem Res Toxicol 13, 531-534.
Powis, G., and Montfort, W.R. (2001). Properties and biological activities of thioredoxins. Annu Rev Pharmacol Toxicol 41, 261-295.
Qiu, Y., Benet, L.Z., and Burlingame, A.L. (1998). Identification of the hepatic protein targets of reactive metabolites of acetaminophen in vivo in mice using two-dimensional gel electrophoresis and mass spectrometry. J Biol Chem 273, 17940-17953.
Ramsby, M.L., Makowski, G.S., and Khairallah, E.A. (1994). Differential detergent fractionation of isolated hepatocytes: biochemical, immunochemical and two-dimensional gel electrophoresis characterization of cytoskeletal and noncytoskeletal compartments. Electrophoresis 15, 265-277.
Rauch, J., O'Neill, E., Mack, B., Matthias, C., Munz, M., Kolch, W., and Gires, O. (2010). Heterogeneous nuclear ribonucleoprotein H blocks MST2-mediated apoptosis in cancer cells by regulating A-Raf transcription. Cancer Res 70, 1679-1688.
Rehm, H. (2006). Der Experimentator Proteinbiochemie/Proteomics. 5. Auflage, Elsevier GmbH, München.
Richter, C., Schweizer, M., Cossarizza, A., and Franceschi, C. (1996). Control of apoptosis by the cellular ATP level. FEBS Lett 378, 107-110.
Rigotti, A., Trigatti, B.L., Penman, M., Rayburn, H., Herz, J., and Krieger, M. (1997). A targeted mutation in the murine gene encoding the high density lipoprotein (HDL) receptor scavenger receptor class B type I reveals its key role in HDL metabolism. Proc Natl Acad Sci U S A 94, 12610-12615.
Robert-Ebadi, H., Le Querrec, A., de Moerloose, P., Gandon-Laloum, S., Borel Derlon, A., and Neerman-Arbez, M. (2008). A novel Asp344Val substitution in the fibrinogen gamma chain (fibrinogen Caen) causes dysfibrinogenemia associated with thrombosis. Blood Coagul Fibrinolysis 19, 697-699.
Rogers, J., Kalsheker, N., Wallis, S., Speer, A., Coutelle, C.H., Woods, D., and Humphries, S.E. (1983). The isolation of a clone for human alpha 1-antitrypsin and the detection of alpha 1-antitrypsin in mRNA from liver and leukocytes. Biochem Biophys Res Commun 116, 375-382.
Rohde, M., Daugaard, M., Jensen, M.H., Helin, K., Nylandsted, J., and Jaattela, M. (2005). Members of the heat-shock protein 70 family promote cancer cell growth by distinct mechanisms. Genes Dev 19, 570-582.
Ron, D., and Walter, P. (2007). Signal integration in the endoplasmic reticulum unfolded protein response. Nat Rev Mol Cell Biol 8, 519-529.
Safadi, F.F., Thornton, P., Magiera, H., Hollis, B.W., Gentile, M., Haddad, J.G., Liebhaber, S.A., and Cooke, N.E. (1999). Osteopathy and resistance to vitamin D toxicity in mice null for vitamin D binding protein. J Clin Invest 103, 239-251.

162 REFERENCES
Saitoh, M., Nishitoh, H., Fujii, M., Takeda, K., Tobiume, K., Sawada, Y., Kawabata, M., Miyazono, K., and Ichijo, H. (1998). Mammalian thioredoxin is a direct inhibitor of apoptosis signal-regulating kinase (ASK) 1. EMBO J 17, 2596-2606.
Samali, A., Fitzgerald, U., Deegan, S., and Gupta, S. (2010). Methods for monitoring endoplasmic reticulum stress and the unfolded protein response. Int J Cell Biol 2010, 830307.
Schleicher, M., and Jockusch, B.M. (2008). Actin: its cumbersome pilgrimage through cellular compartments. Histochem Cell Biol 129, 695-704.
Schreiber, G., Tsykin, A., Aldred, A.R., Thomas, T., Fung, W.P., Dickson, P.W., Cole, T., Birch, H., De Jong, F.A., and Milland, J. (1989). The acute phase response in the rodent. Ann N Y Acad Sci 557, 61-85; discussion 85-66.
Seiner, D.R., LaButti, J.N., and Gates, K.S. (2007). Kinetics and mechanism of protein tyrosine phosphatase 1B inactivation by acrolein. Chem Res Toxicol 20, 1315-1320.
Shatton, J.B., Williams, A., and Weinhouse, S. (1983). Subcellular distribution of inorganic pyrophosphatase activity in various normal and neoplastic cell types. Cancer Res 43, 3742-3747.
Shoshan-Barmatz, V., De Pinto, V., Zweckstetter, M., Raviv, Z., Keinan, N., and Arbel, N. (2010). VDAC, a multi-functional mitochondrial protein regulating cell life and death. Mol Aspects Med.
Siniossoglou, S., Lutzmann, M., Santos-Rosa, H., Leonard, K., Mueller, S., Aebi, U., and Hurt, E. (2000). Structure and assembly of the Nup84p complex. J Cell Biol 149, 41-54.
Skulachev, V.P. (1991). Fatty acid circuit as a physiological mechanism of uncoupling of oxidative phosphorylation. FEBS Lett 294, 158-162.
Son, T.G., Kim, S.J., Kim, K., Kim, M.S., Chung, H.Y., and Lee, J. (2008). Cytoprotective roles of senescence marker protein 30 against intracellular calcium elevation and oxidative stress. Arch Pharm Res 31, 872-877.
Son, T.G., Zou, Y., Jung, K.J., Yu, B.P., Ishigami, A., Maruyama, N., and Lee, J. (2006). SMP30 deficiency causes increased oxidative stress in brain. Mech Ageing Dev 127, 451-457.
Sorof, S. (1994). Modulation of mitogenesis by liver fatty acid binding protein. Cancer Metastasis Rev 13, 317-336.
Speeckaert, M., Huang, G., Delanghe, J.R., and Taes, Y.E. (2006). Biological and clinical aspects of the vitamin D binding protein (Gc-globulin) and its polymorphism. Clin Chim Acta 372, 33-42.
Stagg, S.M., Gurkan, C., Fowler, D.M., LaPointe, P., Foss, T.R., Potter, C.S., Carragher, B., and Balch, W.E. (2006). Structure of the Sec13/31 COPII coat cage. Nature 439, 234-238.
Stewart, B.J., Doorn, J.A., and Petersen, D.R. (2007). Residue-specific adduction of tubulin by 4-hydroxynonenal and 4-oxononenal causes cross-linking and inhibits polymerization. Chem Res Toxicol 20, 1111-1119.
Strnad, P., Stumptner, C., Zatloukal, K., and Denk, H. (2008). Intermediate filament cytoskeleton of the liver in health and disease. Histochem Cell Biol 129, 735-749.
Tan, W.H., Eichler, F.S., Hoda, S., Lee, M.S., Baris, H., Hanley, C.A., Grant, P.E., Krishnamoorthy, K.S., and Shih, V.E. (2005). Isolated sulfite oxidase deficiency: a case report with a novel mutation and review of the literature. Pediatrics 116, 757-766.
Tang, B.L., Peter, F., Krijnse-Locker, J., Low, S.H., Griffiths, G., and Hong, W. (1997). The mammalian homolog of yeast Sec13p is enriched in the intermediate compartment and is essential for protein transport from the endoplasmic reticulum to the Golgi apparatus. Mol Cell Biol 17, 256-266.
Thunell, S., Holmberg, L., and Lundgren, J. (1987). Aminolaevulinate dehydratase porphyria in infancy. A clinical and biochemical study. J Clin Chem Clin Biochem 25, 5-14.

REFERENCES 163
Tirmenstein, M.A., and Nelson, S.D. (1989). Subcellular binding and effects on calcium homeostasis produced by acetaminophen and a nonhepatotoxic regioisomer, 3'-hydroxyacetanilide, in mouse liver. J Biol Chem 264, 9814-9819.
Ulrey, C.L., Liu, L., Andrews, L.G., and Tollefsbol, T.O. (2005). The impact of metabolism on DNA methylation. Hum Mol Genet 14 Spec No 1, R139-147.
Undas, A., Zdziarska, J., Iwaniec, T., Stepien, E., Skotnicki, A.B., de Moerloose, P., and Neerman-Arbez, M. (2009). Fibrinogen Krakow: a novel hypo/dysfibrinogenemia mutation in fibrinogen gamma chain (Asn325Ile) affecting fibrin clot structure and function. Thromb Haemost 101, 975-976.
Usui, E., Okuda, K., Kato, Y., and Noshiro, M. (1994). Rat hepatic 3 alpha-hydroxysteroid dehydrogenase: expression of cDNA and physiological function in bile acid biosynthetic pathway. J Biochem 115, 230-237.
van de Steeg, E., Wagenaar, E., van der Kruijssen, C.M., Burggraaff, J.E., de Waart, D.R., Elferink, R.P., Kenworthy, K.E., and Schinkel, A.H. (2010). Organic anion transporting polypeptide 1a/1b-knockout mice provide insights into hepatic handling of bilirubin, bile acids, and drugs. J Clin Invest 120, 2942-2952.
Vickers, A.E. (2009). Characterization of hepatic mitochondrial injury induced by fatty acid oxidation inhibitors. Toxicol Pathol 37, 78-88.
Vu, D., and Neerman-Arbez, M. (2007). Molecular mechanisms accounting for fibrinogen deficiency: from large deletions to intracellular retention of misfolded proteins. J Thromb Haemost 5 Suppl 1, 125-131.
Walker, V. (2009). Ammonia toxicity and its prevention in inherited defects of the urea cycle. Diabetes Obes Metab 11, 823-835.
Wang, G., Gong, Y., Anderson, J., Sun, D., Minuk, G., Roberts, M.S., and Burczynski, F.J. (2005a). Antioxidative function of L-FABP in L-FABP stably transfected Chang liver cells. Hepatology 42, 871-879.
Wang, P., Wang, J.J., Xiao, Y., Murray, J.W., Novikoff, P.M., Angeletti, R.H., Orr, G.A., Lan, D., Silver, D.L., and Wolkoff, A.W. (2005b). Interaction with PDZK1 is required for expression of organic anion transporting protein 1A1 on the hepatocyte surface. J Biol Chem 280, 30143-30149.
Wenzel, P., Muller, J., Zurmeyer, S., Schuhmacher, S., Schulz, E., Oelze, M., Pautz, A., Kawamoto, T., Wojnowski, L., Kleinert, H., et al. (2008). ALDH-2 deficiency increases cardiovascular oxidative stress--evidence for indirect antioxidative properties. Biochem Biophys Res Commun 367, 137-143.
Wilkinson, B., and Gilbert, H.F. (2004). Protein disulfide isomerase. Biochim Biophys Acta 1699, 35-44.
Wilson, D.M., Goldsworthy, T.L., Popp, J.A., and Butterworth, B.E. (1992). Evaluation of genotoxicity, pathological lesions, and cell proliferation in livers of rats and mice treated with furan. Environ Mol Mutagen 19, 209-222.
Woo, W.H., Yang, H., Wong, K.P., and Halliwell, B. (2003). Sulphite oxidase gene expression in human brain and in other human and rat tissues. Biochem Biophys Res Commun 305, 619-623.
Woodman, P.G. (2003). p97, a protein coping with multiple identities. J Cell Sci 116, 4283-4290.
Xie, Y., Newberry, E.P., Kennedy, S.M., Luo, J., and Davidson, N.O. (2009). Increased susceptibility to diet-induced gallstones in liver fatty acid binding protein knockout mice. J Lipid Res 50, 977-987.
Yamaguchi, M. (2000). Role of regucalcin in calcium signaling. Life Sci 66, 1769-1780.

164 REFERENCES
Yang, Z., Savchenko, A., Yakunin, A., Zhang, R., Edwards, A., Arrowsmith, C., and Tong, L. (2003). Aspartate dehydrogenase, a novel enzyme identified from structural and functional studies of TM1643. J Biol Chem 278, 8804-8808.
Yao, L., Zhang, J., and Liu, X. (2008). NDRG2: a Myc-repressed gene involved in cancer and cell stress. Acta Biochim Biophys Sin (Shanghai) 40, 625-635.
Ye, Y., Meyer, H.H., and Rapoport, T.A. (2001). The AAA ATPase Cdc48/p97 and its partners transport proteins from the ER into the cytosol. Nature 414, 652-656.
Yoneda, K., Kawakami, R., Tagashira, Y., Sakuraba, H., Goda, S., and Ohshima, T. (2006). The first archaeal L-aspartate dehydrogenase from the hyperthermophile Archaeoglobus fulgidus: gene cloning and enzymological characterization. Biochim Biophys Acta 1764, 1087-1093.
Zhang, B., Abreu, J.G., Zhou, K., Chen, Y., Hu, Y., Zhou, T., He, X., and Ma, J.X. (2010). Blocking the Wnt pathway, a unifying mechanism for an angiogenic inhibitor in the serine proteinase inhibitor family. Proc Natl Acad Sci U S A 107, 6900-6905.
Zhang, Y., Morar, M., and Ealick, S.E. (2008). Structural biology of the purine biosynthetic pathway. Cell Mol Life Sci 65, 3699-3724.
Zhou, S., Chan, E., Duan, W., Huang, M., and Chen, Y.Z. (2005). Drug bioactivation, covalent binding to target proteins and toxicity relevance. Drug Metab Rev 37, 41-213.
Zhuo, L., Yoneda, M., Zhao, M., Yingsung, W., Yoshida, N., Kitagawa, Y., Kawamura, K., Suzuki, T., and Kimata, K. (2001). Defect in SHAP-hyaluronan complex causes severe female infertility. A study by inactivation of the bikunin gene in mice. J Biol Chem 276, 7693-7696.
Zsembery, A., Thalhammer, T., and Graf, J. (2000). Bile Formation: a Concerted Action of Membrane Transporters in Hepatocytes and Cholangiocytes. News Physiol Sci 15, 6-11.

ANNEX 165
13 ANNEX
13.1 Comparison between theoretical and experimentally determined molecular masses (Mr) and isoelectric points (pI) of target proteins
Table 21 Comparison between theoretical and experimentally determined protein data (continued on next pages); theoretical protein mass and pI were taken from the UniProtKB database and the Mascot search engine, respectively. Experimentally determined protein molecular mass (Mr exp) and pI (pI exp) were obtained from the spot positions on the 2D-gels in comparison to the protein marker used and the pH range of the IPG strip. Discrepancies between theoretical and experimentally determined protein mass may be due to the facts that the protein was cleaved during sample preparation or that there are different forms of the protein in the cell. Discrepancies between theoretical and experimentally determined pI are in line with literature data and are thought to be the result of posttranslational modifications resulting in mobility shifts (Koen et al., 2007, Koen and Hanzlik, 2002, Qiu et al., 1998, Ikehata et al., 2008).
Protein Name Spot UniProt ID Mr
theoretical [kDa]
Mr exp
[kDa]
pI theoretical
pI exp
Carbohydrate metabolism
+α-enolase 27 P04764 47 55 6.2 5.9
*Fructose-bisphosphate aldolase B 50 P00884 40 49 8.7 8.0
+Fructose-1,6-bisphosphatase 1 6 P19112 40 45 5.5 5.4
*Glyceraldehyde-3-phosphate dehydrogenase 52 P04797 36 45 8.4 7.2
*L-Lactate dehydrogenase A chain 53 P04642 36 40 8.5 7.2
+Malate dehydrogenase
2b
31
O88989
36
53
37
6.2
5.2
6.2
*Phosphoglycerate kinase 1 51 P16617 45 52 8.0 7.5
*Triosephosphate isomerase
47
97
P48500
27
26
25
6.5
6.5
6.4
Lipid metabolism
*Enoyl-CoA hydratase 64 P14604 32 31 6.4 6.3
*3-Ketoacyl-CoA thiolase
51
55
P13437
42
52
54
8.1
7.5
6.9
+Long-chain fatty acid CoA ligase 1 2a P18163 78 49 6.6 5.2
*Long-chain specific acyl-CoA dehydrogenase 93 P15650 48 46 7.6 6.4
*Short-chain specific acyl-CoA dehydrogenase 59 P15651 45 46 8.5 6.2
Amino acid metabolism, urea cycle
*Arginase 1
59 P07824 35 46 6.8 6.2
*Argininosuccinate synthase
51
55
P09034
46
52
54
7.6
7.5
6.9
*Betaine-homocysteine S-methyltransferase 1 51 O09171 45 52 8.0 7.5
*Formimidoyltransferase-cyclodeaminase 83 O88618 59 58 5.8 5.7
*Isovaleryl-CoA dehydrogenase
33c
58
P12007
46
48
53
8.0
6.3
6.3
*Ornithine carbamoyltransferase
55
60
P00481
40
54
44
9.1
6.9
6.3
*2-Oxoisovalerate dehydrogenase subunit α 85 P11960 50 53 7.7 5.8

166 ANNEX
Table 21 (continued)
Protein Name Spot UniProt ID Mr
theoretical [kDa]
Mr exp
[kDa]
pI theoretical
pI exp
*S-Adenosylmethionine synthetase isoform type-1
85
86
P13444
44
53
53
5.6
5.8
5.7
Redox regulation
*Electron transfer flavoprotein subunit α 61 P13803 35 40 8.6 6.4
*Peroxiredoxin-1 62 Q63716 22 25 8.3 6.7
+*Thioredoxin-1 12 P11232 12 13 4.8 4.6
+*Thioredoxin-like protein 1 3 Q920J4 32 40 4.8 5.0
Protein folding
*78 kDa Glucose-regulated protein
75
76
P06761
72
70
42
5.1
5.0
5.0
*Heat shock cognate 71 kDa protein
1
79
P63018
71
70
70
5.4
5.3
5.2
*Protein disulfide-isomerase
74
75
P04785
57
62
70
4.8
4.8
5.0
*Protein disulfide-isomerase A3 83 P11598 57 58 5.9 5.7
Proteolysis
*α1-antiproteinase 86 P17475 46 53 5.7 5.7
+*Protein AMBP: Bikunin and Trypstatin 23 Q64240 39 50 5.8 5.7
*Serine protease inhibitor A3K 80 P05545 47 58 5.3 5.4
*Ubiquitin fusion degradation protein 1 homolog 94 Q9ES53 34 43 6.3 6.4
Structural proteins
+β-Actin
2a
2b
5
78
P60711
42
49
53
50
48
5.3
5.2
5.2
5.4
5.1
+*Ezrin-radixin-moesin-binding phosphoprotein 50 21a Q9JJ19 39 55 5.7 5.6
+Fibrinogen γ chain 21c P02680 51 55 5.9 5.6
+γ-Actin
2a
2b
5
78
P63259
42
49
53
50
48
5.3
5.2
5.2
5.4
5.1
*Keratin, type II cytoskeletal 8
21b
24
25
78
Q10758
54
58
60
39
48
5.8
5.6
5.7
5.7
5.1

ANNEX 167
Table 21 (continued)
Protein Name Spot UniProt ID Mr
theoretical [kDa]
Mr exp
[kDa]
pI theoretical
pI exp
*Na(+)/H(+) exchanger regulatory factor 3
75
79 Q9JJ40
57
70
70
5.3
5.0
5.2
*Protein SEC13 homolog 4 Q5XFW8 36 41 5.2 5.2
*Voltage-dependent anion-selective
channel protein 1
53
Q9Z2L0
31
40
8.4
7.2
Transport proteins
*α2µ-Globulin
19
20a
87
P02761
21
16
13
17
5.9
5.6
6.0
5.5
*Fatty acid binding protein 1
63
91
P02692
14
14
14
7.8
6.4
5.9
+*Protein AMBP: α1-microglobulin 23 Q64240 39 50 5.8 5.7
*Transthyretin 92 P02767 16 14 5.8 6.0
*Vitamin D binding protein 80 P04276 54 58 5.8 5.4
Nucleotide metabolism
*Multifunctional protein ADE2 51 P51583 47 52 7.9 7.5
*Putative L-aspartate dehydrogenase 61 Q5I0J9 31 40 5.5 6.4
*Heterogeneous nuclear ribonucleoprotein H1 93 Q8VHV7 49 46 5.9 6.4

168 ANNEX
Table 21 (continued)
Protein Name Spot UniProt ID Mr
theoretical [kDa]
Mr exp
[kDa]
pI theoretical
pI exp
Miscellaneous
*Acetyl-CoA acetyltransferase 50 P17764 45 49 8.9 8.0
*Aflatoxin B1 aldehyde reductase member 2 96 Q8CG45 41 38 6.3 6.4
*Aldehyde dehydrogenase
29
86
P11884
56
40
53
6.7
6.1
5.7
+3α-Hydroxysteroid dehydrogenase
37
60
P23457
37
40
44
6.7
6.5
6.3
*ATP synthase β subunit
4
74
P10719
56
41
62
5.2
5.2
4.8
+δ-aminolevulinic acid dehydratase 35 P06214 36 40 6.3 6.4
*Glycerol-3-phosphate dehydrogenase [NAD+]
33b
60
O35077
37
41
44
6.2
6.3
6.3
+3-Mercaptopyruvate sulfurtransferase 30 P97532 33 36 5.9 6.1
*Ppa1 protein 4 Q499R7 38 41 6.4 5.2
*Protein NDRG2 78 Q8VBU2 41 48 5.2 5.1
*Regucalcin 4 Q03336 33 41 5.4 5.2
+*Ribonuclease UK114
14
63
P52759
14
13
14
7.8
5.4
6.4
*Sulfite oxidase 83 Q07116 61 58 6.3 5.7

ANNEX 169
13.2 Amino acid sequences of the identified proteins
Data on amino acid sequences were taken from the online database Protein
Knowledgebase (UniProtKB, http://www.uniprot.org/).
13.2.1 Carbohydrate metabolism
α-Enolase
10 20 30 40 50 60
MSILKIHARE IFDSRGNPTV EVDLYTAKGL FRAAVPSGAS TGIYEALELR DNDKTRFMGK
70 80 90 100 110 120
GVSKAVEHIN KTIAPALVSK KLNVVEQEKI DQLMIEMDGT ENKSKFGANA ILGVSLAVCK
130 140 150 160 170 180
AGAVEKGVPL YRHIADLAGN PEVILPVPAF NVINGGSHAG NKLAMQEFMI LPVGASSFRE
190 200 210 220 230 240
AMRIGAEVYH NLKNVIKEKY GKDATNVGDE GGFAPNILEN KEALELLKSA IAKAGYTDQV
250 260 270 280 290 300
VIGMDVAASE FYRAGKYDLD FKSPDDASRY ITPDQLADLY KSFIKDYPVV SIEDPFDQDD
310 320 330 340 350 360
WDAWQKFTAT AGIQVVGDDL TVTNPKRIAK AAGEKSCNCL LLKVNQIGSV TESLQACKLA
370 380 390 400 410 420
QSNGWGVMVS HRSGETEDTF IADLVVGLCT GQIKTGAPCR SERLAKYNQI LRIEEELGSK
430
AKFAGRSFRN PLAK

170 ANNEX
Fructose-bisphosphate aldolase B
10 20 30 40 50 60
MAHRFPALTS EQKKELSEIA QRIVANGKGI LAADESVGTM GNRLQRIKVE NTEENRRQFR
70 80 90 100 110 120
ELLFSVDNSI SQSIGGVILF HETLYQKDSQ GKLFRNILKE KGIVVGIKLD QGGAPLAGTN
130 140 150 160 170 180
KETTIQGLDG LSERCAQYKK DGVDFGKWRA VLRISDQCPS SLAIQENANA LARYASICQQ
190 200 210 220 230 240
NGLVPIVEPE VLPDGDHDLE HCQYVSEKVL AAVYKALNDH HVYLEGTLLK PNMLTAGHAC
250 260 270 280 290 300
TKKYTPEQVA MATVTALHRT VPAAVPSICF LSGGMSEEDA TLNLNAIYRC PLPRPWKLSF
310 320 330 340 350 360
SYGRALQASA LAAWGGKAAN KKATQEAFMK RAVANCQAAQ GQYVHTGSSG AASTQSLFTA
SYTY
Fructose-1,6-bisphosphatase 1
10 20 30 40 50 60
MVDHAPFETD ISTLTRFVLE EGRKAGGTGE MTQLLNSLCT AIKAISSAVR QAGIAQLYGI
70 80 90 100 110 120
AGSTNVTGDQ VKKLDILSND LVINMLKSSY ATCVLVSEED THAIIIEPEK RGKYVVCFDP
130 140 150 160 170 180
LDGSSNIDCL ASIGTIFGIY RKTSANEPSE KDALQPGRNL VAAGYALYGS ATMLVLAMNC
190 200 210 220 230 240
GVNCFMLDPS IGEFILVDRD VKIKKKGNIY SINEGYAKDF DPAINEYIQR KKFPPDNSAP
250 260 270 280 290 300
YGARYVGSMV ADVHRTLVYG GIFLYPANKK NPSGKLRLLY ECNPIAYVME KAGGLATTGN
310 320 330 340 350 360
EDILDIVPTE IHQKAPVIMG STEDVQEFLE IYNKDKAKSR PSLPLPQSRA RESPVHSICD
ELF

ANNEX 171
Glyceraldehyde-3-phosphate dehydrogenase
10 20 30 40 50 60
MVKVGVNGFG RIGRLVTRAA FSCDKVDIVA INDPFIDLNY MVYMFQYDST HGKFNGTVKA
70 80 90 100 110 120
ENGKLVINGK PITIFQERDP ANIKWGDAGA EYVVESTGVF TTMEKAGAHL KGGAKRVIIS
130 140 150 160 170 180
APSADAPMFV MGVNHEKYDN SLKIVSNASC TTNCLAPLAK VIHDNFGIVE GLMTTVHAIT
190 200 210 220 230 240
ATQKTVDGPS GKLWRDGRGA AQNIIPASTG AAKAVGKVIP ELNGKLTGMA FRVPTPNVSV
250 260 270 280 290 300
VDLTCRLEKP AKYDDIKKVV KQAAEGPLKG ILGYTEDQVV SCDFNSNSHS STFDAGAGIA
310 320 330
LNDNFVKLIS WYDNEYGYSN RVVDLMAYMA SKE
L-Lactate dehydrogenase A chain
10 20 30 40 50 60
MAALKDQLIV NLLKEEQVPQ NKITVVGVGA VGMACAISIL MKDLADELAL VDVIEDKLKG
70 80 90 100 110 120
EMMDLQHGSL FLKTPKIVSS KDYSVTANSK LVIITAGARQ QEGESRLNLV QRNVNIFKFI
130 140 150 160 170 180
IPNVVKYSPQ CKLLIVSNPV DILTYVAWKI SGFPKNRVIG SGCNLDSARF RYLMGERLGV
190 200 210 220 230 240
HPLSCHGWVL GEHGDSSVPV WSGVNVAGVS LKSLNPQLGT DADKEQWKDV HKQVVDSAYE
250 260 270 280 290 300
VIKLKGYTSW AIGLSVADLA ESIMKNLRRV HPISTMIKGL YGIKEDVFLS VPCILGQNGI
310 320 330
SDVVKVTLTP DEEARLKKSA DTLWGIQKEL QF
Malate dehydrogenase
10 20 30 40 50 60
MSEPIRVLVT GAAGQIAYSL LYSIGNGSVF GKDQPIILVL LDITPMMGVL DGVLMELQDC
70 80 90 100 110 120
ALPLLQDVIA TDKEEVAFKD LDVAVLVGSM PRREGMERKD LLKANVKIFK SQGAALEKYA
130 140 150 160 170 180
KKSVKVIVVG NPANTNCLTA SKSAPSIPKE NFSCLTRLDH NRAKSQIALK LGVTADDVKN
190 200 210 220 230 240
VIIWGNHSST QYPDVNHAKV KLQGKEVGVY EALKDDSWLK GEFITTVQQR GAAVIKARKL
250 260 270 280 290 300
SSAMSAAKAI SDHIRDIWFG TPEGEFVSMG VISDGNSYGV PDDLLYSFPV VIKNKTWKFV
310 320 330
EGLPINDFSR EKMDLTAKEL TEEKETAFEF LSSA

172 ANNEX
Phosphoglycerate kinase 1 10 20 30 40 50 60
MSLSNKLTLD KLDVKGKRVV MRVDFNVPMK NNQITNNQRI KAAVPSIKFC LDNGAKSVVL
70 80 90 100 110 120
MSHLGRPDGV PMPDKYSLEP VAAELKSLLG KDVLFLKDCV GSEVENACAN PAAGTVILLE
130 140 150 160 170 180
NLRFHVEEEG KGKDASGNKV KAEPAKIDAF RASLSKLGDV YVNDAFGTAH RAHSSMVGVN
190 200 210 220 230 240
LPQKAGGFLM KKELNYFAKA LESPERPFLA ILGGAKVADK IQLINNMLDK VNEMIIGGGM
250 260 270 280 290 300
AFTFLKVLNN MEIGTSLYDE EGAKIVKDLM AKAEKNGVKI TLPVDFVTAD KFDENAKTGQ
310 320 330 340 350 360
ATVASGIPAG WMGLDCGTES SKKYAEAVAR AKQIVWNGPV GVFEWEAFAR GTKSLMDEVV
370 380 390 400 410
KATSRGCITI IGGGDTATCC AKWNTEDKVS HVSTGGGASL ELLEGKVLPG VDALSNV
Triosephosphate isomerase
10 20 30 40 50 60
MAPSRKFFVG GNWKMNGRKK CLGELICTLN AAKLPADTEV VCAPPTAYID FARQKLDPKI
70 80 90 100 110 120
AVAAQNCYKV TNGAFTGEIS PGMIKDLGAT WVVLGHSERR HIFGESDELI GQKVNHALSE
130 140 150 160 170 180
GLGVIACIGE KLDEREAGIT EKVVFEQTKA IADNVKDWCK VVLAYEPVWA IGTGKTATPQ
190 200 210 220 230 240
QAQEVHEKLR GWLKCNVSEG VAQCTRIIYG GSVTGATCKE LASQPDVDGF LVGGASLKPE
FVDIINAKQ

ANNEX 173
13.2.2 Lipid metabolism
Enoyl-CoA hydratase
10 20 30 40 50 60
MAALRALLPR ACNSLLSPVR CPEFRRFASG ANFQYIITEK KGKNSSVGLI QLNRPKALNA
70 80 90 100 110 120
LCNGLIEELN QALETFEEDP AVGAIVLTGG EKAFAAGADI KEMQNRTFQD CYSGKFLSHW
130 140 150 160 170 180
DHITRIKKPV IAAVNGYALG GGCELAMMCD IIYAGEKAQF GQPEILLGTI PGAGGTQRLT
190 200 210 220 230 240
RAVGKSLAME MVLTGDRISA QDAKQAGLVS KIFPVETLVE EAIQCAEKIA NNSKIIVAMA
250 260 270 280 290
KESVNAAFEM TLTEGNKLEK KLFYSTFATD DRREGMSAFV EKRKANFKDH
3-Ketoacyl-CoA thiolase 10 20 30 40 50 60
MALLRGVFIV AAKRTPFGAY GGLLKDFTAT DLTEFAARAA LSAGKVPPET IDSVIVGNVM
70 80 90 100 110 120
QSSSDAAYLA RHVGLRVGVP TETGALTLNR LCGSGFQSIV SGCQEICSKD AEVVLCGGTE
130 140 150 160 170 180
SMSQSPYSVR NVRFGTKFGL DLKLEDTLWA GLTDQHVKLP MGMTAENLAA KYNISREDCD
190 200 210 220 230 240
RYALQSQQRW KAANEAGYFN EEMAPIEVKT KKGKQTMQVD EHARPQTTLE QLQNLPPVFK
250 260 270 280 290 300
KEGTVTAGNA SGMSDGAGVV IIASEDAVKK HNFTPLARVV GYFVSGCDPA IMGIGPVPAI
310 320 330 340 350 360
TGALKKAGLS LKDMDLIDVN EAFAPQFLAV QKSLDLDPSK TNVSGGAIAL GHPLGGSGSR
370 380 390
ITAHLVHELR RRGGKYAVGS ACIGGGQGIS LIIQNTA

174 ANNEX
Long-chain fatty acid CoA ligase 1
10 20 30 40 50 60
MEVHELFRYF RMPELIDIRQ YVRTLPTNTL MGFGAFAALT TFWYATRPKA LKPPCDLSMQ
70 80 90 100 110 120
SVEVTGTTEG VRRSAVLEDD KLLLYYYDDV RTMYDGFQRG IQVSNDGPCL GSRKPNQPYE
130 140 150 160 170 180
WISYKQVAEM AECIGSALIQ KGFKPCSEQF IGIFSQNRPE WVTIEQGCFT YSMVVVPLYD
190 200 210 220 230 240
TLGTDAITYI VNKAELSVIF ADKPEKAKLL LEGVENKLTP CLKIIVIMDS YDNDLVERGQ
250 260 270 280 290 300
KCGVEIIGLK ALEDLGRVNR TKPKPPEPED LAIICFTSGT TGNPKGAMVT HQNIMNDCSG
310 320 330 340 350 360
FIKATESAFI ASPEDVLISF LPLAHMFETV VECVMLCHGA KIGFFQGDIR LLMDDLKVLQ
370 380 390 400 410 420
PTIFPVVPRL LNRMFDRIFG QANTSVKRWL LDFASKRKEA ELRSGIVRNN SLWDKLIFHK
430 440 450 460 470 480
IQSSLGGKVR LMITGAAPVS ATVLTFLRAA LGCQFYEGYG QTECTAGCCL SLPGDWTAGH
490 500 510 520 530 540
VGAPMPCNYI KLVDVEDMNY QAAKGEGEVC VKGANVFKGY LKDPARTAEA LDKDGWLHTG
550 560 570 580 590 600
DIGKWLPNGT LKIIDRKKHI FKLAQGEYIA PEKIENIYLR SEAVAQVFVH GESLQAFLIA
610 620 630 640 650 660
IVVPDVEILP SWAQKRGFQG SFEELCRNKD INKAILEDMV KLGKNAGLKP FEQVKGIAVH
670 680 690
PELFSIDNGL LTPTLKAKRP ELRNYFRSQI DELYSTIKI

ANNEX 175
Long-chain specific acyl-CoA dehydrogenase 10 20 30 40 50 60
MAARLLLRSL RVLSARSATL PPPSARCSHS GAEARLETPS AKKLTDIGIR RIFSSEHDIF
70 80 90 100 110 120
RESVRKFFQE EVIPYHEEWE KAGEVSRELW EKAGKQGLLG INIAEKHGGI GGDLLSTAVT
130 140 150 160 170 180
WEEQAYSNCT GPGFSLHSDI VMPYIANYGT KEQIEQFIPQ MTAGKCIGAI AMTEPGAGSD
190 200 210 220 230 240
LQGVRTNAKR SGSDWILNGS KVFITNGWLS DLVIVVAVTN REARSPAHGI SLFLVENGMK
250 260 270 280 290 300
GFIKGKKLHK MGMKAQDTAE LFFEDVRLPA SALLGEENKG FYYLMQELPQ ERLLIADLAI
310 320 330 340 350 360
SACEFMFEET RNYVRQRKAF GKTVAHIQTV QHKLAELKTN ICVTRAFVDS CLQLHETKRL
370 380 390 400 410 420
DSASASMAKY WASELQNTVA YQCVQLHGGW GYMWEYPIAK AYVDARVQPI YGGTNEIMKE
430
LIARQIVSDS
Short-chain specific acyl-CoA dehydrogenase
10 20 30 40 50 60
MAAALLARAG GSLGRALRAR DWRRLHTVYQ SVELPETHQM LRQTCRDFAE KELVPIAAQL
70 80 90 100 110 120
DKEHLFPTSQ VKKMGELGLL AMDVPEELSG AGLDYLAYSI ALEEISRGCA STGVIMSVNN
130 140 150 160 170 180
SLYLGPILKF GSSQQKQQWI TPFTNGDKIG CFALSEPGNG SDAGAASTTA REEGDSWVLN
190 200 210 220 230 240
GTKAWITNSW EASATVVFAS TDRSRQNKGI SAFLVPMPTP GLTLGKKEDK LGIRASSTAN
250 260 270 280 290 300
LIFEDCRIPK ENLLGEPGMG FKIAMQTLDM GRIGIASQAL GIAQASLDCA VKYAENRHAF
310 320 330 340 350 360
GAPLTKLQNI QFKLADMALA LESARLLTWR AAMLKDNKKP FTKESAMAKL AASEAATAIS
370 380 390 400 410
HQAIQILGGM GYVTEMPAER YYRDARITEI YEGTSEIQRL VIAGHLLRSY RS

176 ANNEX
13.2.3 Amino acid metabolism, urea cycle
Arginase 1
10 20 30 40 50 60
MSSKPKPIEI IGAPFSKGQP RGGVEKGPAA LRKAGLVEKL KETEYNVRDH GDLAFVDVPN
70 80 90 100 110 120
DSPFQIVKNP RSVGKANEQL AAVVAETQKN GTISVVLGGD HSMAIGSISG HARVHPDLCV
130 140 150 160 170 180
IWVDAHTDIN TPLTTSSGNL HGQPVAFLLK ELKGKFPDVP GFSWVTPCIS AKDIVYIGLR
190 200 210 220 230 240
DVDPGEHYII KTLGIKYFSM TEVDKLGIGK VMEETFSYLL GRKKRPIHLS FDVDGLDPVF
250 260 270 280 290 300
TPATGTPVVG GLSYREGLYI TEEIYKTGLL SGLDIMEVNP TLGKTPEEVT RTVNTAVALT
310 320
LSCFGTKREG NHKPETDYLK PPK
Argininosuccinate synthase
10 20 30 40 50 60
MSSKGSVVLA YSGGLDTSCI LVWLKEQGYD VIAYLANIGQ KEDFEEARKK ALKLGAKKVF
70 80 90 100 110 120
IEDVSKEFVE EFIWPAVQSS ALYEDRYLLG TSLARPCIAR KQVEIAQREG AKYVSHGATG
130 140 150 160 170 180
KGNDQVRFEL TCYSLAPQIK VIAPWRMPEF YNRFKGRNDL MEYAKQHGIP IPVTPKSPWS
190 200 210 220 230 240
MDENLMHISY EAGILENPKN QAPPGLYTKT QDPAKAPNTP DVLEIEFKKG VPVKVTNVKD
250 260 270 280 290 300
GTTHSTSLDL FMYLNEVAGK HGVGRIDIVE NRFIGMKSRG IYETPAGTIL YHAHLDIEAF
310 320 330 340 350 360
TMDREVRKIK QGLGLKFAEL VYTGFWHSPE CEFVRHCIDK SQERVEGKVQ VSVFKGQVYI
370 380 390 400 410
LGRESPLSLY NEELVSMNVQ GDYEPIDATG FININSLRLK EYHRLQSKVT AK

ANNEX 177
Betaine-homocysteine S-methyltransferase 1
10 20 30 40 50 60
MAPIAGKKAK RGILERLNAG EVVIGDGGFV FALEKRGYVK AGPWTPEAAV EHPEAVRQLH
70 80 90 100 110 120
REFLRAGSNV MQTFTFYASE DKLENRGNYV AEKISGQKVN EAACDIARQV ADEGDALVAG
130 140 150 160 170 180
GVSQTPSYLS CKSETEVKKI FHQQLEVFMK KNVDFLIAEY FEHVEEAVWA VEALKTSGKP
190 200 210 220 230 240
IAATMCIGPE GDLHGVSPGE CAVRLVKAGA AIVGVNCHFD PSTSLQTIKL MKEGLEAARL
250 260 270 280 290 300
KAYLMSHALA YHTPDCGKQG FIDLPEFPFG LEPRVATRWD IQKYAREAYN LGVRYIGGCC
310 320 330 340 350 360
GFEPYHIRAI AEELAPERGF LPPASEKHGS WGSGLDMHTK PWIRARARKE YWQNLRIASG
370 380 390 400
RPYNPSMSKP DAWGVTKGAA ELMQQKEATT EQQLRALFEK QKFKSAQ
Formimidoyltransferase-cyclodeaminase
10 20 30 40 50 60
MSQLVECVPN FSEGNNQEVI DAISQAISQT PGCVLLDVDA GPSTNRTVYT FVGQPECVVE
70 80 90 100 110 120
GALSAARTAS QLIDMRKHKG EHPRMGALDV CPFIPVRGVS MDECVLCAKA FGQRLAEELN
130 140 150 160 170 180
VPVYLYGEAA QMPSRQTLPA IRAGEYEALP EKLKQAEWVP DFGPSSFVPS WGATVTGARK
190 200 210 220 230 240
FLIAFNINLL STKEQAHRIA LNLREQGRGK DQPGRLKKVQ GIGWYLEEKN LAQVSTNLLD
250 260 270 280 290 300
FEVTALHTVY EEARREAQEL NLPVVGSQLV GLVPLKALLD AAAFYCDKEK LFVLEEEHRI
310 320 330 340 350 360
RLVVNRLGLD SLAPFDPKER IIEYLVPDSG PEQSLLDASL RAFVREVGAR SAAPGGGSVA
370 380 390 400 410 420
AAVAALGAAL ASMVGQMTYG RRQFDHLDST MRRLIPPFHA ASAQLTSLVD ADARAFAACL
430 440 450 460 470 480
GAIKLPKNTP EERDRRTCAL QEGLRQAVAV PLKLAETVSQ LWPALQELAQ CGNLSCLSDL
490 500 510 520 530 540
QVAAKALETG VFGAYFNVLI NLKDMTDDVF KEKTRHRISS LLQEAKTQAA LVLGSLEARK
E

178 ANNEX
Isovaleryl-CoA dehydrogenase
10 20 30 40 50 60
MATAVRLLGR RVSSWRLRPL PSPLAVPQRA HSMLPVDDDI NGLNEEQKQL RHTISKFVQE
70 80 90 100 110 120
NLAPKAQEID QSNDFKNLRE FWKQLGSLGV LGITAPVQYG GSGLGYLEHV LVMEEISRAS
130 140 150 160 170 180
AAVGLSYGAH SNLCINQIVR NGNEAQKEKY LPKLISGEFI GALAMSEPNA GSDVVSMRLK
190 200 210 220 230 240
AEKKGDHYVL NGNKFWITNG PDADVLVVYA KTDLTAVPAS RGITAFIVEK DMPGFSTSKK
250 260 270 280 290 300
LDKLGMRGSN TCELVFEDCK VPAANILSQE SKGVYVLMSG LDLERLVLAG GPLGIMQAVL
310 320 330 340 350 360
DHTIPYLHVR EAFGQKIGQF QLMQGKMADM YTRLMACRQY VYNVARACDE GHITAKDCAG
370 380 390 400 410 420
VILYTAECAT QVALDGIQCL GGNGYINDFP MGRFLRDAKL YEIGGGTSEV RRLVIGRAFN
ADFR
Ornithine carbamoyltransferase
10 20 30 40 50 60
MLSNLRILLN KAALRKAHTS MVRNFRYGKP VQSQVQLKGR DLLTLKNFTG EEIQYMLWLS
70 80 90 100 110 120
ADLKFRIKQK GEYLPLLQGK SLGMIFEKRS TRTRLSTETG FALLGGHPSF LTTQDIHLGV
130 140 150 160 170 180
NESLTDTARV LSSMTDAVLA RVYKQSDLDI LAKEATIPIV NGLSDLYHPI QILADYLTLQ
190 200 210 220 230 240
EHYGSLKGLT LSWIGDGNNI LHSIMMSAAK FGMHLQAATP KGYEPDPNIV KLAEQYAKEN
250 260 270 280 290 300
GTRLSMTNDP LEAARGGNVL ITDTWISMGQ EDEKKKRLQA FQGYQVTMKT AKVAASDWTF
310 320 330 340 350
LHCLPRKPEE VDDEVFYSPR SLVFPEAENR KWTIMAVMVS LLTDYSPVLQ KPKF

ANNEX 179
2-Oxoisovalerate dehydrogenase subunit α
10 20 30 40 50 60
SAAKIWRPSR GLRQAALLLL GRPGARGLAR FHPSRQQQQQ FPSLDDKPQF PGASAEFVDK
70 80 90 100 110 120
LEFIQPNVIS GIPIYRVMDR QGQIINPSED PHLPQEEVLK LYRSMTLLNT MDRILYESQR
130 140 150 160 170 180
QGRISFYMTN YGEEGTHVGS AAALERTDLV FGQYREAGVL MYRDYPLELF MAQCYGNVSD
190 200 210 220 230 240
PGKGRQMPVH YGCKERHFVT ISSPLATQIP QAVGAAYAAK RANANQIVIC YFGEGAASEG
250 260 270 280 290 300
DAHAGFNFAA TLECPIIFFC RNNGYAISTP TSEQYRGDGI AARGPGYGIM SIRVDGNDVF
310 320 330 340 350 360
AVYNATKEAR RRAVAENQPF LIEAMTYRIG HHSTSDDSSA YRSVDEVNYW DKQDHPISRL
370 380 390 400 410 420
RQYLLNQGWW DEEQEKAWRK QSRKKVMEAF EQAERKLKPN PSLLFSDVYQ EMPAQLRRQQ
430 440
ESLARHLQTY GEHYPLDHFD K
S-Adenosylmethionine synthetase isoform type-1
10 20 30 40 50 60
MNGPVDGLCD HSLSEEGAFM FTSESVGEGH PDKICDQISD AVLDAHLKQD PNAKVACETV
70 80 90 100 110 120
CKTGMVLLCG EITSMAMIDY QRVVRDTIKH IGYDDSAKGF DFKTCNVLVA LEQQSPDIAQ
130 140 150 160 170 180
CVHLDRNEED VGAGDQGLMF GYATDETEEC MPLTIVLAHK LNTRMADLRR SGVLPWLRPD
190 200 210 220 230 240
SKTQVTVQYV QDNGAVIPVR VHTIVISVQH NEDITLEAMR EALKEQVIKA VVPAKYLDED
250 260 270 280 290 300
TIYHLQPSGR FVIGGPQGDA GVTGRKIIVD TYGGWGAHGG GAFSGKDYTK VDRSAAYAAR
310 320 330 340 350 360
WVAKSLVKAG LCRRVLVQVS YAIGVAEPLS ISIFTYGTSK KTERDELLEV VNKNFDLRPG
370 380 390
VIVRDLDLKK PIYQKTACYG HFGRSEFPWE VPKKLVF

180 ANNEX
13.2.4 Redox regulation
Electron transfer flavoprotein subunit α
10 20 30 40 50 60
MFRAAAPGQL RRAASLLRFQ STLVIAEHAN DSLAPITLNT ITAAGRLGGE VSCLVAGTKC
70 80 90 100 110 120
DKVVQDLCKV AGVAKVLVAQ HDAYKGLLPE ELTPLILETQ KQFSYTHICA GASAFGKNLL
130 140 150 160 170 180
PRVAAKLNVA PVSDIIEIKS PDTFVRTIYA GNALCTVKCD EKVKVFSVRG TSFEAAAASG
190 200 210 220 230 240
GSASSEKAPS SSSAGISEWL DQKLTKSDRP ELTGAKVVVS GGRGLKSGEN FKLLYDLADQ
250 260 270 280 290 300
LHAAVGASRA AVDAGFVPND MQVGQTGKIV APELYIAVGI SGAIQHLAGM KDSKTIVAIN
310 320 330
KDPEAPIFQV ADYGIVADLF KVVPEMTEIL KKK
Peroxiredoxin-1
10 20 30 40 50 60
MSSGNAKIGH PAPSFKATAV MPDGQFKDIS LSDYKGKYVV FFFYPLDFTF VCPTEIIAFS
70 80 90 100 110 120
DRAEEFKKLN CQVIGASVDS HFCHLAWINT PKKQGGLGPM NIPLVSDPKR TIAQDYGVLK
130 140 150 160 170 180
ADEGISFRGL FIIDDKGILR QITINDLPVG RSVDEILRLV QAFQFTDKHG EVCPAGWKPG
190
SDTIKPDVNK SKEYFSKQK
Thioredoxin-1
10 20 30 40 50 60
MVKLIESKEA FQEALAAAGD KLVVVDFSAT WCGPCKMIKP FFHSLCDKYS NVVFLEVDVD
70 80 90 100
DCQDVAADCE VKCMPTFQFY KKGQKVGEFS GANKEKLEAT ITEFA

ANNEX 181
Thioredoxin-like protein 1
10 20 30 40 50 60
MVGVKPVGSD PDFQPELSGA GSRLAVVKFT MRGCGPCLRI APAFSSMSNK YPQAVFLEVD
70 80 90 100 110 120
VHQCQGTAAT NNISATPTFL FFRNKVRIDQ YQGADAVGLE EKIKQHLEND PGSNEDTDIP
130 140 150 160 170 180
KGYMDLMPFI NKAGCECLNE SDEHGFDNCL RKDLSFLESD CDEQLLITVA FNQPVKLYSM
190 200 210 220 230 240
KFQGPDNGQG PKYVKIFINL PRSMDFEEAE RSEPTQALEL TEDDIKEDGI VPLRYVKFQN
250 260 270 280
VNSVTLFVQS NQGEEETTRI SYFTFIGTPV QATNMNDFKR VVGKKGESH

182 ANNEX
13.2.5 Protein folding
78 kDa Glucose-regulated protein
10 20 30 40 50 60
MKFTVVAAAL LLLCAVRAEE EDKKEDVGTV VGIDLGTTYS CVGVFKNGRV EIIANDQGNR
70 80 90 100 110 120
ITPSYVAFTP EGERLIGDAA KNQLTSNPEN TVFDAKRLIG RTWNDPSVQQ DIKFLPFKVV
130 140 150 160 170 180
EKKTKPYIQV DIGGGQTKTF APEEISAMVL TKMKETAEAY LGKKVTHAVV TVPAYFNDAQ
190 200 210 220 230 240
RQATKDAGTI AGLNVMRIIN EPTAAAIAYG LDKREGEKNI LVFDLGGGTF DVSLLTIDNG
250 260 270 280 290 300
VFEVVATNGD THLGGEDFDQ RVMEHFIKLY KKKTGKDVRK DNRAVQKLRR EVEKAKRALS
310 320 330 340 350 360
SQHQARIEIE SFFEGEDFSE TLTRAKFEEL NMDLFRSTMK PVQKVLEDSD LKKSDIDEIV
370 380 390 400 410 420
LVGGSTRIPK IQQLVKEFFN GKEPSRGINP DEAVAYGAAV QAGVLSGDQD TGDLVLLDVC
430 440 450 460 470 480
PLTLGIETVG GVMTKLIPRN TVVPTKKSQI FSTASDNQPT VTIKVYEGER PLTKDNHLLG
490 500 510 520 530 540
TFDLTGIPPA PRGVPQIEVT FEIDVNGILR VTAEDKGTGN KNKITITNDQ NRLTPEEIER
550 560 570 580 590 600
MVNDAEKFAE EDKKLKERID TRNELESYAY SLKNQIGDKE KLGGKLSPED KETMEKAVEE
610 620 630 640 650
KIEWLESHQD ADIEDFKAKK KELEEIVQPI ISKLYGSGGP PPTGEEDTSE KDEL

ANNEX 183
Heat shock cognate 71 kDa protein
10 20 30 40 50 60
MSKGPAVGID LGTTYSCVGV FQHGKVEIIA NDQGNRTTPS YVAFTDTERL IGDAAKNQVA
70 80 90 100 110 120
MNPTNTVFDA KRLIGRRFDD AVVQSDMKHW PFMVVNDAGR PKVQVEYKGE TKSFYPEEVS
130 140 150 160 170 180
SMVLTKMKEI AEAYLGKTVT NAVVTVPAYF NDSQRQATKD AGTIAGLNVL RIINEPTAAA
190 200 210 220 230 240
IAYGLDKKVG AERNVLIFDL GGGTFDVSIL TIEDGIFEVK STAGDTHLGG EDFDNRMVNH
250 260 270 280 290 300
FIAEFKRKHK KDISENKRAV RRLRTACERA KRTLSSSTQA SIEIDSLYEG IDFYTSITRA
310 320 330 340 350 360
RFEELNADLF RGTLDPVEKA LRDAKLDKSQ IHDIVLVGGS TRIPKIQKLL QDFFNGKELN
370 380 390 400 410 420
KSINPDEAVA YGAAVQAAIL SGDKSENVQD LLLLDVTPLS LGIETAGGVM TVLIKRNTTI
430 440 450 460 470 480
PTKQTQTFTT YSDNQPGVLI QVYEGERAMT KDNNLLGKFE LTGIPPAPRG VPQIEVTFDI
490 500 510 520 530 540
DANGILNVSA VDKSTGKENK ITITNDKGRL SKEDIERMVQ EAEKYKAEDE KQRDKVSSKN
550 560 570 580 590 600
SLESYAFNMK ATVEDEKLQG KINDEDKQKI LDKCNEIISW LDKNQTAEKE EFEHQQKELE
610 620 630 640
KVCNPIITKL YQSAGGMPGG MPGGFPGGGA PPSGGASSGP TIEEVD

184 ANNEX
Protein disulfide-isomerase
10 20 30 40 50 60
MLSRALLCLA LAWAARVGAD ALEEEDNVLV LKKSNFAEAL AAHNYLLVEF YAPWCGHCKA
70 80 90 100 110 120
LAPEYAKAAA KLKAEGSEIR LAKVDATEES DLAQQYGVRG YPTIKFFKNG DTASPKEYTA
130 140 150 160 170 180
GREADDIVNW LKKRTGPAAT TLSDTAAAES LVDSSEVTVI GFFKDAGSDS AKQFLLAAEA
190 200 210 220 230 240
VDDIPFGITS NSDVFSKYQL DKDGVVLFKK FDEGRNNFEG EITKEKLLDF IKHNQLPLVI
250 260 270 280 290 300
EFTEQTAPKI FGGEIKTHIL LFLPKSVSDY DGKLSNFKKA AEGFKGKILF IFIDSDHTDN
310 320 330 340 350 360
QRILEFFGLK KEECPAVRLI TLEEEMTKYK PESDELTAEK ITQFCHHFLE GKIKPHLMSQ
370 380 390 400 410 420
ELPEDWDKQP VKVLVGKNFE EVAFDEKKNV FVEFYAPWCG HCKQLAPIWD KLGETYKDHE
430 440 450 460 470 480
NIVIAKMDST ANEVEAVKVH SFPTLKFFPA SADRTVIDYN GERTLDGFKK FLESGGQDGA
490 500
GDNDDLDLEE ALEPDMEEDD DQKAVKDEL
Protein disulfide-isomerase A3
10 20 30 40 50 60
MRFSCLALLP GVALLLASAL LASASDVLEL TDENFESRVS DTGSAGLMLV EFFAPWCGHC
70 80 90 100 110 120
KRLAPEYEAA ATRLKGIVPL AKVDCTANTN TCNKYGVSGY PTLKIFRDGE EAGAYDGPRT
130 140 150 160 170 180
ADGIVSHLKK QAGPASVPLR TEDEFKKFIS DKDASVVGFF RDLFSDGHSE FLKAASNLRD
190 200 210 220 230 240
NYRFAHTNVE SLVKEYDDNG EGITIFRPLH LANKFEDKIV AYTEKKMTSG KIKKFIQESI
250 260 270 280 290 300
FGLCPHMTED NKDLIQGKDL LTAYYDVDYE KNTKGSNYWR NRVMMVAKTF LDAGHKLNFA
310 320 330 340 350 360
VASRKTFSHE LSDFGLESTT GEIPVVAIRT AKGEKFVMQE EFSRDGKALE RFLQEYFDGN
370 380 390 400 410 420
LKRYLKSEPI PETNEGPVKV VVAESFDDIV NAEDKDVLIE FYAPWCGHCK NLEPKYKELG
430 440 450 460 470 480
EKLSKDPNIV IAKMDATAND VPSPYEVKGF PTIYFSPANK KLTPKKYEGG RELNDFISYL
490 500
QREATNPPII QEEKPKKKKK AQEDL

ANNEX 185
13.2.6 Proteolysis
α1-Antiproteinase
10 20 30 40 50 60
MAPSISRGLL LLAALCCLAP SFLAEDAQET DTSQQDQSPT YRKISSNLAD FAFSLYRELV
70 80 90 100 110 120
HQSNTSNIFF SPMSITTAFA MLSLGSKGDT RKQILEGLEF NLTQIPEADI HKAFHHLLQT
130 140 150 160 170 180
LNRPDSELQL NTGNGLFVNK NLKLVEKFLE EVKNNYHSEA FSVNFADSEE AKKVINDYVE
190 200 210 220 230 240
KGTQGKIVDL MKQLDEDTVF ALVNYIFFKG KWKRPFNPEH TRDADFHVDK STTVKVPMMN
250 260 270 280 290 300
RLGMFDMHYC STLSSWVLMM DYLGNATAIF LLPDDGKMQH LEQTLTKDLI SRFLLNRQTR
310 320 330 340 350 360
SAILYFPKLS ISGTYNLKTL LSSLGITRVF NNDADLSGIT EDAPLKLSQA VHKAVLTLDE
370 380 390 400 410
RGTEAAGATV VEAVPMSLPP QVKFDHPFIF MIVESETQSP LFVGKVIDPT R
Protein AMBP: Bikunin and Trypstatin 10 20 30 40 50 60
MQGLGALFLL LTACLTLKAD NVPTLPDIQV QENFNEARIY GKWFNLAVGS TCPWLRRIKN
70 80 90 100 110 120
KMSVSTLVLQ EGATEAEISV TSTQWRKGVC EEISGVYQKT DIDGKFLYHK SKWNATLESY
130 140 150 160 170 180
VVHTNYDEYA IFLTKKFSHR HGPTITAKLY GREPQLRDSL LQEFREVALS VGIPENSIVF
190 200 210 220 230 240
MADRGECVPG DREVESTSFA RARRAVLPQE NEGSGSEPLI TGTLKKEDSC QLNYSEGPCL
250 260 270 280 290 300
GMQQKYYYNG ASMACETFQY GGCLGNGNNF ASEKECLQTC RTIAACNLPI VQGPCRAFAE
310 320 330 340
LWAFDAAQGK CIQFIYGGCK GNGNKFYSEK ECKEYCGVPG DGYEELTRS

186 ANNEX
Serine protease inhibitor A3K
10 20 30 40 50 60
MAFIAALGLL MAGICPAVLC DGILGRDTLP HEDQGKGRQL HSLTLASINT DFTLSLYKKL
70 80 90 100 110 120
ALRNPDKNVV FSPLSISAAL AILSLGAKDS TMEEILEVLK FNLTEITEEE IHQGFGHLLQ
130 140 150 160 170 180
RLSQPEDQAE INTGSALFID KEQPILSEFQ EKTRALYQAE AFVADFKQCN EAKKFINDYV
190 200 210 220 230 240
SNQTQGKIAE LFSELDERTS MVLVNYLLFK GKWKVPFNPN DTFESEFYLD EKRSVKVPMM
250 260 270 280 290 300
KIKDLTTPYI RDEELSCSVL ELKYTGNASA LFILPDQGKM QQVESSLQPE TLKKWKDSLR
310 320 330 340 350 360
PRIISELRMP KFSISTDYNL EEVLPELGIR KIFSQQADLS RITGTKNLHV SQVVHKAVLD
370 380 390 400 410
VDETGTEGAA ATAVTAALKS LPQTIPLLNF NRPFMLVITD NNGQSVFFMG KVTNPM
Ubiquitin fusion degradation protein 1 homolog
10 20 30 40 50 60
MFSFNMFDHP IPRVFQNRFS TQYRCFSVSM LAGPNDRSDV EKGGKIIMPP SALDQLSRLN
70 80 90 100 110 120
ITYPMLFKLT NKNSDRMTHC GVLEFVADEG ICYLPHWMMQ NLLLEEGGLV QVESVNLQVA
130 140 150 160 170 180
TYSKFQPQSP DFLDITNPKA VLENALRNFA CLTTGDVIAI NYNEKIYELR VMETKPDKAV
190 200 210 220 230 240
SIIECDMNVD FDAPLGYKEP ERPVQHEESI EGEADHSGYA GEVGFRAFSG SGNRLDGKKK
250 260 270 280 290 300
GVEPSPSPIK PGDIKRGIPN YEFKLGKITF IRNSRPMVKK VEEDEAGGRF VAFSGEGQSL
RKKGRKP

ANNEX 187
13.2.7 Structural proteins
β-Actin
10 20 30 40 50 60
MDDDIAALVV DNGSGMCKAG FAGDDAPRAV FPSIVGRPRH QGVMVGMGQK DSYVGDEAQS
70 80 90 100 110 120
KRGILTLKYP IEHGIVTNWD DMEKIWHHTF YNELRVAPEE HPVLLTEAPL NPKANREKMT
130 140 150 160 170 180
QIMFETFNTP AMYVAIQAVL SLYASGRTTG IVMDSGDGVT HTVPIYEGYA LPHAILRLDL
190 200 210 220 230 240
AGRDLTDYLM KILTERGYSF TTTAEREIVR DIKEKLCYVA LDFEQEMATA ASSSSLEKSY
250 260 270 280 290 300
ELPDGQVITI GNERFRCPEA LFQPSFLGME SCGIHETTFN SIMKCDVDIR KDLYANTVLS
310 320 330 340 350 360
GGTTMYPGIA DRMQKEITAL APSTMKIKII APPERKYSVW IGGSILASLS TFQQMWISKQ
370
EYDESGPSIV HRKCF
Ezrin-radixin-moesin-binding phosphoprotein 50
10 20 30 40 50 60
MSADAAAGEP LPRLCCLEKG PNGYGFHLHG EKGKVGQFIR LVEPGSPAEK SGLLAGDRLV
70 80 90 100 110 120
EVNGENVEKE THQQVVSRIR AALNAVRLLV VDPETDEQLK KLGVPIREEL LRAQEKSEHT
130 140 150 160 170 180
EPPAAADTKK AGDQNEAEKS HLERCELRPR LCTMKKGPNG YGFNLHSDKS KPGQFIRAVD
190 200 210 220 230 240
PDSPAEASGL RAQDRIVEVN GVCMEGKQHG DVVSAIKAGG DEAKLLVVDK ETDEFFKKCR
250 260 270 280 290 300
VTPSQEHLDG PLPEPFSNGE IQKENSREAL VEPASESPRP ALARSASSDT SEELNAQDSP
310 320 330 340 350
KRHDSTEPSS TSSSSDPILD FNISLAVAKE RAHQKRSSKR APQMDWSKKN ELFSNL

188 ANNEX
Fibrinogen γ chain
10 20 30 40 50 60
MNWSLQLRSF ILCWALLLLS PTGLAQYTAT RDNCCILDER FGSYCPTTCG ISDFLNSYQT
70 80 90 100 110 120
DVDTDLQTLE NILQRAENRT TEAKELIKAI QVYYNPDQPP KPGMIEGATQ KSKKMVEEIL
130 140 150 160 170 180
KYEALLLTHE SSIRYLQDIY TSNKQKITNL KQKVAQLEAQ CQEPCKDSVR IHDTTGKDCQ
190 200 210 220 230 240
DIANKGAKES GLYFIRPLKA TQQFLVYCEI DGSGNGWTVL QKRLDGSVDF KKNWIQYKEG
250 260 270 280 290 300
FGHLSPTGTT EFWLGNEKIH LISMQSTIPY ALRIQLKDWS GRTSTADYAM FRVGPESDKY
310 320 330 340 350 360
RLTYAYFIGG DAGDAFDGYD FGDDPSDKFF TSHNGMHFST WDNDNDKFEG NCAEQDGSGW
370 380 390 400 410 420
WMNKCHAGHL NGVYYQGGTY SKSSTPNGYD NGIIWATWKT RWYSMKETTM KIIPFNRLSI
430 440
GDGQQHHMGG SKQVSVEHEV DVEYP
γ-Actin
10 20 30 40 50 60
MEEEIAALVI DNGSGMCKAG FAGDDAPRAV FPSIVGRPRH QGVMVGMGQK DSYVGDEAQS
70 80 90 100 110 120
KRGILTLKYP IEHGIVTNWD DMEKIWHHTF YNELRVAPEE HPVLLTEAPL NPKANREKMT
130 140 150 160 170 180
QIMFETFNTP AMYVAIQAVL SLYASGRTTG IVMDSGDGVT HTVPIYEGYA LPHAILRLDL
190 200 210 220 230 240
AGRDLTDYLM KILTERGYSF TTTAEREIVR DIKEKLCYVA LDFEQEMATA ASSSSLEKSY
250 260 270 280 290 300
ELPDGQVITI GNERFRCPEA LFQPSFLGME SCGIHETTFN SIMKCDVDIR KDLYANTVLS
310 320 330 340 350 360
GGTTMYPGIA DRMQKEITAL APSTMKIKII APPERKYSVW IGGSILASLS TFQQMWISKQ
370
EYDESGPSIV HRKCF

ANNEX 189
Keratin, type II cytoskeletal 8
10 20 30 40 50 60
MSVRVTQKSY KMSTSGPRAF SSRSFTSGPG ARISSSSFSR VGSSSSSFRG SLGGFGGAGV
70 80 90 100 110 120
GGITAVTVNQ SLLNPLKLEV DPNIQAVRTQ EKEQIKTLNN KFASFIDKVR FLEQQNKMLE
130 140 150 160 170 180
TKWSLLQQQK TSRSNMDNMF ESYINNLRRQ LEALGQEKLK LEVELGNMQG LVEDFKNKYE
190 200 210 220 230 240
DEINKRTEME NEFVLIKKDV DEAYMNKVEL ESRLEGLTDE INFLRQIHEE EIRELQSQIS
250 260 270 280 290 300
DTSVVLSMDN SRSLDMDSII AEVRAQYEEI ANRSRAEAET MYQIKYEELQ TLAGKHGDDL
310 320 330 340 350 360
RRSKTEISEM NRNISRLQAE IDALKGQRAT LEAAIADAEQ RGELAVKDAN AKLEDLKNAL
370 380 390 400 410 420
QKAKQDMARQ LREYQELMNV KLALDIEIAT YRKLLEGEES RLESGMQNMS IHTKTTSGYA
430 440 450 460 470 480
GGLSSSYGGL TSPGFSYGMS SFQPGFGSVG GSSTYSRTKA VVVKKIETRD GKLVSESSDI
MSK
Na(+)/H(+) exchanger regulatory factor 3
10 20 30 40 50 60
MASTFNPREC KLSKKEGQNY GFFLRIEKDT DGHLVRVIEE GSPAEKAGLL DGDRVLRING
70 80 90 100 110 120
VFVDKEEHAQ VVDLVRKSGN SVTLLVLDGD SYEKAVKHQV DLKELDQSPR EPALNEKKPD
130 140 150 160 170 180
LGMNGGVETC AQPRLCYLVK EGNSFGFSLK TIQGKKGVFL TDITPQGVAM KAGVLADDHL
190 200 210 220 230 240
IEVNGENVEN ASHEEVVEKV TKSGSRIMFL LVDKETARCH SEQKTPFKRE TASLKLLPHQ
250 260 270 280 290 300
PRVVVIKKGS NGYGFYLRAG PEQKGQIIKD IEPGSPAEAA GLKNNDLVVA VNGESVEALD
310 320 330 340 350 360
HDGVVEMIRN GGDQTTLLVL DKEADRIYSL ARFSPLLYCQ SQELPNGSVK EAPAPISAPL
370 380 390 400 410 420
EAPGSATTED VGDHKPKLCR LIKEDDSYGF HLNAIRGQPG SFVKEVQQGG PADKAGLENE
430 440 450 460 470 480
DIIIEVNGEN VQDEPYDRVV ERIKSSGEHV TLLVCGKVAY SYFQAKKIPI LSSLADPLVA
490 500 510 520
GPDAKGETEH DSAESTKDSS HPARDRTLSA ASHSSSNSED TVM

190 ANNEX
Protein SEC13 homolog
10 20 30 40 50 60
MVSVINTVDT SHEDMIHDAQ MDYYGTRLAT CSSDRSVKIF DVRNGGQILI ADLRGHEGPV
70 80 90 100 110 120
WQVAWAHPMY GNILASCSYD RKVIIWKEEN GTWEKTHEHS GHDSSVNSVC WAPHDYGLIL
130 140 150 160 170 180
ACGSSDGAIS LLTYTGEGQW EVKKINNAHT IGCNAVSWAP AVVPGSLIDQ PSGQKPNYIK
190 200 210 220 230 240
KFASGGCDNL IKLWREEEDG QWKEEQKLEA HSDWVRDVAW APSIGLPTST IASCSQDGRV
250 260 270 280 290 300
FIWTCDDASG NMWSPKLLHK FNDVVWHVSW SITANILAVS GGDNKVTLWK ESVDGQWVCI
310 320
SDVNKGQGSV SASITEGQQN EQ
Voltage-dependent anion-selective channel protein 1
10 20 30 40 50 60
MAVPPTYADL GKSARDVFTK GYGFGLIKLD LKTKSENGLE FTSSGSANTE TTKVNGSLET
70 80 90 100 110 120
KYRWTEYGLT FTEKWNTDNT LGTEITVEDQ LARGLKLTFD SSFSPNTGKK NAKIKTGYKR
130 140 150 160 170 180
EHINLGCDVD FDIAGPSIRG ALVLGYEGWL AGYQMNFETS KSRVTQSNFA VGYKTDEFQL
190 200 210 220 230 240
HTNVNDGTEF GGSIYQKVNK KLETAVNLAW TAGNSNTRFG IAAKYQVDPD ACFSAKVNNS
250 260 270 280
SLIGLGYTQT LKPGIKLTLS ALLDGKNVNA GGHKLGLGLE FQA

ANNEX 191
13.2.8 Transport proteins
α2µ-Globulin
10 20 30 40 50 60
MKLLLLLLCL GLTLVCGHAE EASSTRGNLD VAKLNGDWFS IVVASNKREK IEENGSMRVF
70 80 90 100 110 120
MQHIDVLENS LGFKFRIKEN GECRELYLVA YKTPEDGEYF VEYDGGNTFT ILKTDYDRYV
130 140 150 160 170 180
MFHLINFKNG ETFQLMVLYG RTKDLSSDIK EKFAKLCEAH GITRDNIIDL TKTDRCLQAR
G
Fatty acid binding protein 1
10 20 30 40 50 60
MNFSGKYQVQ SQENFEPFMK AMGLPEDLIQ KGKDIKGVSE IVHEGKKVKL TITYGSKVIH
70 80 90 100 110 120
NEFTLGEECE LETMTGEKVK AVVKMEGDNK MVTTFKGIKS VTEFNGDTIT NTMTLGDIVY
KRVSKRI
Protein AMBP: α1-Microglobulin
10 20 30 40 50 60
MQGLGALFLL LTACLTLKAD NVPTLPDIQV QENFNEARIY GKWFNLAVGS TCPWLRRIKN
70 80 90 100 110 120
KMSVSTLVLQ EGATEAEISV TSTQWRKGVC EEISGVYQKT DIDGKFLYHK SKWNATLESY
130 140 150 160 170 180
VVHTNYDEYA IFLTKKFSHR HGPTITAKLY GREPQLRDSL LQEFREVALS VGIPENSIVF
190 200 210 220 230 240
MADRGECVPG DREVESTSFA RARRAVLPQE NEGSGSEPLI TGTLKKEDSC QLNYSEGPCL
250 260 270 280 290 300
GMQQKYYYNG ASMACETFQY GGCLGNGNNF ASEKECLQTC RTIAACNLPI VQGPCRAFAE
310 320 330 340
LWAFDAAQGK CIQFIYGGCK GNGNKFYSEK ECKEYCGVPG DGYEELTRS
Transthyretin
10 20 30 40 50 60
MASLRLFLLC LAGLIFASEA GPGGAGESKC PLMVKVLDAV RGSPAVDVAV KVFKKTADGS
70 80 90 100 110 120
WEPFASGKTA ESGELHGLTT DEKFTEGVYR VELDTKSYWK ALGISPFHEY AEVVFTANDS
130 140
GHRHYTIAAL LSPYSYSTTA VVSNPQN

192 ANNEX
Vitamin D binding protein 10 20 30 40 50 60
MKRVLVLLLA LAFGHALERG RDYEKDKVCQ ELSTLGKDDF RSLSLILYSR KFPSSTFEQV
70 80 90 100 110 120
SQLVKEVVSL TEECCAEGAD PNCYDTRTSE LSIKSCESDA PFPVHPGTSE CCTKEGLERK
130 140 150 160 170 180
LCMAALSHQP QEFPAYVEPT NDEICEAFRK DPKGFADQFL FEYSSNYGQA PLPLLVGYTK
190 200 210 220 230 240
SYLSMVGSCC TSAKPTVCFL KERLQMKQLL LLTTMSNRVC SQYAAYGKEK SRMSHLIKLA
250 260 270 280 290 300
QKVPTANLED VLPLAEDLTE ILSRCCKSTS EDCMARELPE HTLKICGNLS KKNSKFEECC
310 320 330 340 350 360
YETTPMGIFM CSYFMPTAEP LQLPAIKLPT SKDLCGQSAT QAMDQYTFEL SRRTQVPEVF
370 380 390 400 410 420
LSKVLDTTLK TLRECCDTQD SVSCFSTQSP LMKRQLTSFI EKGQEMCADY SENTFTEYKK
430 440 450 460 470
KLAERLRTKM PNASPEELAD MVAKHSDFAS KCCSINSPPR YCSSQIDAEM RDILQS

ANNEX 193
13.2.9 Nucleotide metabolism
Multifunctional protein ADE2
10 20 30 40 50 60
MATAEVLNIG RKLYEGKTKE VYELLDSPGR VLLQSKDQIT AGNAARKNHL EGKAAISNKI
70 80 90 100 110 120
TSCIFQLLQE AGIKTAFTKK CGETAFIAPQ CEMIPIEWVC RRIATGSFLK RNPGVKEGYR
130 140 150 160 170 180
FYPPKVEMFF KDDANNDPQW SEEQLIAAKF CFAGLVIGQT EVDIMSHATQ AIFEILEKSW
190 200 210 220 230 240
LPQNCTLVDM KIEFGVDVTT KEIVLADVID NDSWRLWPSG DRSQQKDKQS YRDLKEVTPE
250 260 270 280 290 300
GLQMVKKNFE WVADRVELLL KSNSQCRVVV LMGSTSDLGH CEKIKKACGN FGIPCELRVT
310 320 330 340 350 360
SAHKGPDETL RIKAEYEGDG IPTVFVAVAG RSNGLGPVMS GNTAYPVISC PPITADWGAQ
370 380 390 400 410 420
DVWSSLRLPS GIGCSTILSP EGSAQFAAQI FGLNNHLVWA KLRASKLNTW ISLKQADKKI
RECNL
Putative L-aspartate dehydrogenase 10 20 30 40 50 60
MDASMVPRVP HKVGVVGYGR LGQSLVSRLL AQGSELGLEL VFVWNRDPGR MAGSVPPALQ
70 80 90 100 110 120
LEDLTTLEER HPDLVVEVAH PKIIHESGVQ ILRHANLLVG SPSALADQTT ERQLLEASNH
130 140 150 160 170 180
WGHTVFVARG ALWGCEDISR LDAAGGLQSL RVTMATHPDG FRLEGPLAAA HSSGPRTVLY
190 200 210 220 230 240
EGPVRGLCPL APRNSNTMAA AALAAPSLGF DRVIGVLVAD LSLTDMHVVD VELTGPQGPQ
250 260 270 280 290
AAALPCTPTE RTQPSLALSL APLLLQPSGT AYWAAVSFPP DLGSASAEFP PLPLLSP

194 ANNEX
Heterogeneous nuclear ribonucleoprotein H1
10 20 30 40 50 60
MMLGAEGGEG FVVKVRGLPW SCSADEVQRF FSDCKIQNGA QGIRFIYTRE GRPSGEAFVE
70 80 90 100 110 120
LESEDEVKLA LKKDRETMGH RYVEVFKSNN VEMDWVLKHT GPNSPDTAND GFVRLRGLPF
130 140 150 160 170 180
GCSEEEIVQF FSGLEIVPNG ITLPVDFQGR STGEAFVQFA SQEIAEKALK KHKERIGHRY
190 200 210 220 230 240
IEIFKSSRAE VRTHYDPPRK LMAMQRPGPY DRPGAGRGYN SIGRGAGFER MRRGAYGGGY
250 260 270 280 290 300
GGYDDYNGYN DGYGFGSDRF GRDLNYCFSG MSDHRYGDGG STFQSTTGHC VHMRGLPYRA
310 320 330 340 350 360
TENDIYNFFS PLNPVRVHIE TGPDGRVTGE ADVEFATHED AVAAMSKDKA NMQHRYVELF
370 380 390 400 410 420
LNSTAGASGG AYEHRYVELF LNSTAGASGG AYGSQMMGGM GLSNQSSYGG PASQQLSGGY
430 440
GGGYGGQSSM SGYDQVLQEN SSDFQSNIA

ANNEX 195
13.2.10 Miscellaneous
Acetyl-CoA acetyltransferase
10 20 30 40 50 60
MAALAVLHGV VRRPLLRGLL QEVRCLGRSY ASKPTLNDVV IVSATRTPIG SFLGSLASQP
70 80 90 100 110 120
ATKLGTIAIQ GAIEKAGIPK EEVKEVYMGN VIQGGEGQAP TRQATLGAGL PIATPCTTVN
130 140 150 160 170 180
KVCASGMKAI MMASQSLMCG HQDVMVAGGM ESMSNVPYVM SRGATPYGGV KLEDLIVKDG
190 200 210 220 230 240
LTDVYNKIHM GNCAENTAKK LSISREEQDK YAIGSYTRSK EAWDAGKFAN EITPITISVK
250 260 270 280 290 300
GKPDVVVKED EEYKRVDFSK VPKLKTVFQK ENGTVTAANA STLNDGAAAV VLMTAEAAQR
310 320 330 340 350 360
LKVKPLARIA AFADAAVDPI DFPLAPAYAV PKVLKYAGLK KEDIAMWEVN EAFSVVVLAN
370 380 390 400 410 420
IKMLEIDPQK VNVHGGAVSL GHPIGMSGAR IVVHLAHALK QGEFGLASIC NGGGGASAVL
IEKL
Aflatoxin B1 aldehyde reductase member 2
10 20 30 40 50 60
MLRAVSRAVS RAAVRCAWRS GPSVARPLAM SRSPAPRAVS GAPLRPGTVL GTMEMGRRMD
70 80 90 100 110 120
ASASAATVRA FLERGLNELD TAFMYCDGQS ESILGSLGLG LGSGDCTVKI ATKANPWDGK
130 140 150 160 170 180
SLKPDSVRSQ LETSLKRLQC PRVDLFYLHA PDHGTPIVET LQACQQLHQE GKFVELGLSN
190 200 210 220 230 240
YASWEVAEIY TLCKSNGWIL PTVYQGMYNA TTRQVETELL PCLRYFGLRF YAYNPLAGGL
250 260 270 280 290 300
LTGKYRYEDK DGKQPEGRFF GNSWSETYRN RFWKEHHFEA IALVEKALKT TYGTSAPSMT
310 320 330 340 350 360
SAALRWMYHH SQLQGTRGDA VILGMSSLEQ LEQNLAATEE GPLEPAVVEA FNQAWNVVAH
ECPNYFR

196 ANNEX
Aldehyde dehydrogenase
10 20 30 40 50 60
MLRAALSTAR RGPRLSRLLS AAATSAVPAP NQQPEVFCNQ IFINNEWHDA VSKKTFPTVN
70 80 90 100 110 120
PSTGEVICQV AEGNKEDVDK AVKAAQAAFQ LGSPWRRMDA SDRGRLLYRL ADLIERDRTY
130 140 150 160 170 180
LAALETLDNG KPYVISYLVD LDMVLKCLRY YAGWADKYHG KTIPIDGDFF SYTRHEPVGV
190 200 210 220 230 240
CGQIIPWNFP LLMQAWKLGP ALATGNVVVM KVAEQTPLTA LYVANLIKEA GFPPGVVNIV
250 260 270 280 290 300
PGFGPTAGAA IASHEDVDKV AFTGSTEVGH LIQVAAGSSN LKRVTLELGG KSPNIIMSDA
310 320 330 340 350 360
DMDWAVEQAH FALFFNQGQC CCAGSRTFVQ EDVYDEFVER SVARAKSRVV GNPFDSRTEQ
370 380 390 400 410 420
GPQVDETQFK KILGYIKSGQ QEGAKLLCGG GAAADRGYFI QPTVFGDVKD GMTIAKEEIF
430 440 450 460 470 480
GPVMQILKFK TIEEVVGRAN NSKYGLAAAV FTKDLDKANY LSQALQAGTV WINCYDVFGA
490 500 510
QSPFGGYKMS GSGRELGEYG LQAYTEVKTV TVKVPQKNS
3α-Hydroxysteroid dehydrogenase
10 20 30 40 50 60
MDSISLRVAL NDGNFIPVLG FGTTVPEKVA KDEVIKATKI AIDNGFRHFD SAYLYEVEEE
70 80 90 100 110 120
VGQAIRSKIE DGTVKREDIF YTSKLWSTFH RPELVRTCLE KTLKSTQLDY VDLYIIHFPM
130 140 150 160 170 180
ALQPGDIFFP RDEHGKLLFE TVDICDTWEA MEKCKDAGLA KSIGVSNFNC RQLERILNKP
190 200 210 220 230 240
GLKYKPVCNQ VECHLYLNQS KMLDYCKSKD IILVSYCTLG SSRDKTWVDQ KSPVLLDDPV
250 260 270 280 290 300
LCAIAKKYKQ TPALVALRYQ LQRGVVPLIR SFNAKRIKEL TQVFEFQLAS EDMKALDGLN
310 320
RNFRYNNAKY FDDHPNHPFT DE

ANNEX 197
ATP synthase β subunit
10 20 30 40 50 60
MLSLVGRVAS ASASGALRGL NPLAALPQAH LLLRTAPAGV HPARDYAAQS SAAPKAGTAT
70 80 90 100 110 120
GQIVAVIGAV VDVQFDEGLP PILNALEVQG RESRLVLEVA QHLGESTVRT IAMDGTEGLV
130 140 150 160 170 180
RGQKVLDSGA PIKIPVGPET LGRIMNVIGE PIDERGPIKT KQFAPIHAEA PEFIEMSVEQ
190 200 210 220 230 240
EILVTGIKVV DLLAPYAKGG KIGLFGGAGV GKTVLIMELI NNVAKAHGGY SVFAGVGERT
250 260 270 280 290 300
REGNDLYHEM IESGVINLKD ATSKVALVYG QMNEPPGARA RVALTGLTVA EYFRDQEGQD
310 320 330 340 350 360
VLLFIDNIFR FTQAGSEVSA LLGRIPSAVG YQPTLATDMG TMQERITTTK KGSITSVQAI
370 380 390 400 410 420
YVPADDLTDP APATTFAHLD ATTVLSRAIA ELGIYPAVDP LDSTSRIMDP NIVGSEHYDV
430 440 450 460 470 480
ARGVQKILQD YKSLQDIIAI LGMDELSEED KLTVSRARKI QRFLSQPFQV AEVFTGHMGK
490 500 510 520
LVPLKETIKG FQQILAGDYD HLPEQAFYMV GPIEEAVAKA DKLAEEHGS
δ-Aminolevulinic acid dehydratase
10 20 30 40 50 60
MHHQSVLHSG YFHPLLRAWQ TTPSTVSATN LIYPIFVTDV PDDVQPIASL PGVARYGVNQ
70 80 90 100 110 120
LEEMLRPLVE AGLRCVLIFG VPSRVPKDEQ GSAADSEDSP TIEAVRLLRK TFPTLLVACD
130 140 150 160 170 180
VCLCPYTSHG HCGLLSENGA FLAEESRQRL AEVALAYAKA GCQVVAPSDM MDGRVEAIKA
190 200 210 220 230 240
ALLKHGLGNR VSVMSYSAKF ASCFYGPFRD AAQSSPAFGD RRCYQLPPGA RGLALRAVAR
250 260 270 280 290 300
DIQEGADILM VKPGLPYLDM VQEVKDKHPE LPLAVYQVSG EFAMLWHGAK AGAFDLRTAV
310 320 330
LESMTAFRRA GADIIITYFA PQLLKWLKEE

198 ANNEX
Glycerol-3-phosphate dehydrogenase [NAD+]
10 20 30 40 50 60
MAGKKVCIVG SGNWGSAIAK IVGSNASQLA HFDPRVTMWV FEEDIGGRKL TEIINTQHEN
70 80 90 100 110 120
VKYLPGHKLP PNVVAVPDVV QAATGADILV FVVPHQFIGK ICDQLKGHLK ANTIGISLIK
130 140 150 160 170 180
GIDEGPNGLK LISEVIGESL GIPMSVLMGA NIASEVAEEK FCETTIGCKD PAQGQLLKEL
190 200 210 220 230 240
MQTPNFRITV VQEVDTVEIC GALKNIVAVG AGFCDGLGFG DNTKAAVIRL GLMEMIAFAK
250 260 270 280 290 300
LFCSGSVSSA TFLESCGVAD LITTCYGGRN RKVAEAFART GKSIEQLEKE MLNGQKLQGP
310 320 330 340
QTARELHSIL QHKGLVDKFP LFTAVYKVCY EGQPVGEFIC CLQNHPEHM
3-Mercaptopyruvate sulfurtransferase
10 20 30 40 50 60
MAAPQLFRAL VSAQWVAEAL KSPRASQPLK LLDASWYLPK LGRDARREFE ERHIPGAAFF
70 80 90 100 110 120
DIDRCSDHTS PYDHMLPSAT HFADYAGSLG VSAATHVVIY DGSDQGLYSA PRVWWMFRAF
130 140 150 160 170 180
GHHSVSLLDG GFRYWLSQNL PISSGKSPSE PAEFCAQLDP SFIKTHEDIL ENLDARRFQV
190 200 210 220 230 240
VDARAAGRFQ GTQPEPRDGI EPGHIPGSVN IPFTEFLTSE GLEKSPEEIQ RLFQEKKVDL
250 260 270 280 290
SKPLVATCGS GVTACHVVLG AFLCGKPDVP VYDGSWVEWY MRAQPEHVIS QGRGKTL
Ppa1 protein
10 20 30 40 50 60
PAGQLVVRRR ELPPRYNRSE AGLCGCVAVQ RRRRRHRHIS DTMSSFSSEE RAAPFTLEYR
70 80 90 100 110 120
VFIKNEKGQY ISPFHDVPIY ADKDVFHMVV EVPRWSNAKM EIATKDPLNP IKQDVKKGKL
130 140 150 160 170 180
RYVANLFPYK GYIWNYGAIP QTWEDPGHSD EHTGCCGDND PIDVCEIGSK VCARGEIIRV
190 200 210 220 230 240
KVLGILAMID EGETDWKVIA INVDDPDAAN YHDISDVERL KPGYLEATVD WFRRYKVPDG
250 260 270 280 290 300
KPENEFAFNA EFKNKEFAVD IIKNTHDYWK ALVTKKTDGK GISCMNTTVS ESPFKCDPDA
310 320 330
AKAIVDALPP PCESACALPM DVDKWFHHQK N
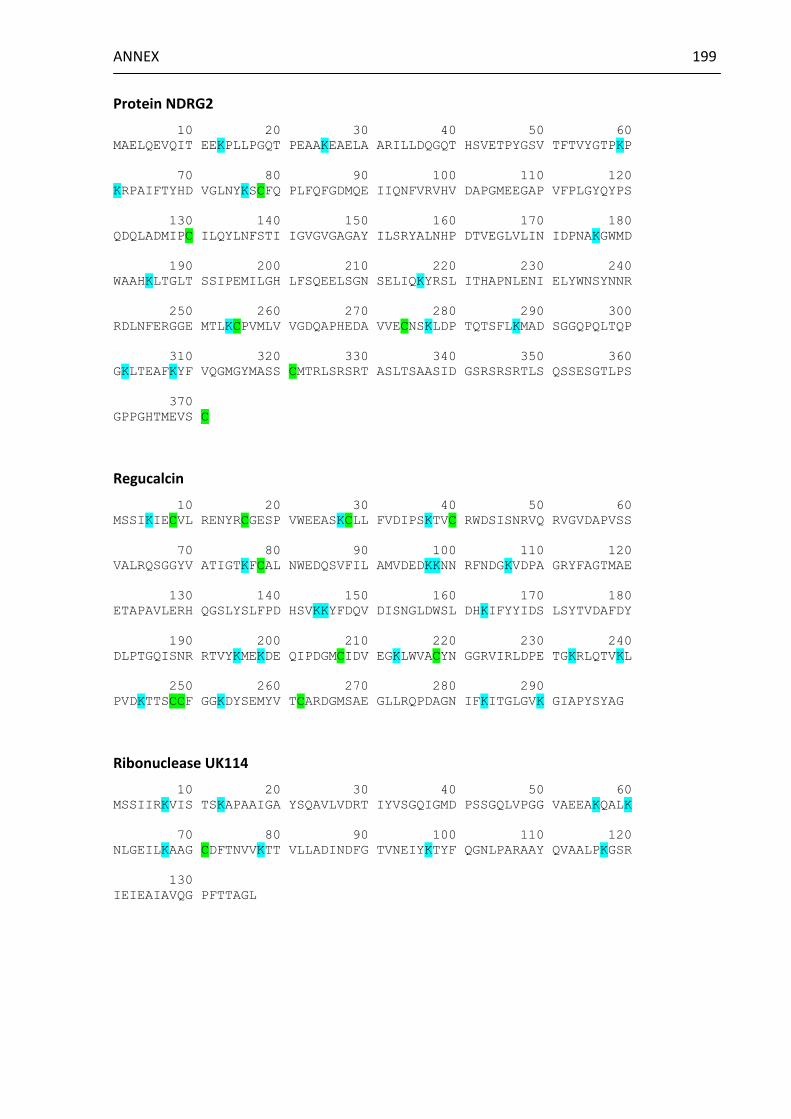
ANNEX 199
Protein NDRG2
10 20 30 40 50 60
MAELQEVQIT EEKPLLPGQT PEAAKEAELA ARILLDQGQT HSVETPYGSV TFTVYGTPKP
70 80 90 100 110 120
KRPAIFTYHD VGLNYKSCFQ PLFQFGDMQE IIQNFVRVHV DAPGMEEGAP VFPLGYQYPS
130 140 150 160 170 180
QDQLADMIPC ILQYLNFSTI IGVGVGAGAY ILSRYALNHP DTVEGLVLIN IDPNAKGWMD
190 200 210 220 230 240
WAAHKLTGLT SSIPEMILGH LFSQEELSGN SELIQKYRSL ITHAPNLENI ELYWNSYNNR
250 260 270 280 290 300
RDLNFERGGE MTLKCPVMLV VGDQAPHEDA VVECNSKLDP TQTSFLKMAD SGGQPQLTQP
310 320 330 340 350 360
GKLTEAFKYF VQGMGYMASS CMTRLSRSRT ASLTSAASID GSRSRSRTLS QSSESGTLPS
370
GPPGHTMEVS C
Regucalcin
10 20 30 40 50 60
MSSIKIECVL RENYRCGESP VWEEASKCLL FVDIPSKTVC RWDSISNRVQ RVGVDAPVSS
70 80 90 100 110 120
VALRQSGGYV ATIGTKFCAL NWEDQSVFIL AMVDEDKKNN RFNDGKVDPA GRYFAGTMAE
130 140 150 160 170 180
ETAPAVLERH QGSLYSLFPD HSVKKYFDQV DISNGLDWSL DHKIFYYIDS LSYTVDAFDY
190 200 210 220 230 240
DLPTGQISNR RTVYKMEKDE QIPDGMCIDV EGKLWVACYN GGRVIRLDPE TGKRLQTVKL
250 260 270 280 290
PVDKTTSCCF GGKDYSEMYV TCARDGMSAE GLLRQPDAGN IFKITGLGVK GIAPYSYAG
Ribonuclease UK114
10 20 30 40 50 60
MSSIIRKVIS TSKAPAAIGA YSQAVLVDRT IYVSGQIGMD PSSGQLVPGG VAEEAKQALK
70 80 90 100 110 120
NLGEILKAAG CDFTNVVKTT VLLADINDFG TVNEIYKTYF QGNLPARAAY QVAALPKGSR
130
IEIEAIAVQG PFTTAGL

200 ANNEX
Sulfite oxidase
10 20 30 40 50 60
MLPRLYRSVA VGLPRAIRAK STPLRLCIQA CSSSDSLKPQ HPSLTFSDDN SRTRGWKVMG
70 80 90 100 110 120
TLIGLGAVLA YHDHRCRASQ ESPRIYSKED VRSHNNLKTG VWVTLGSEVF DVTKFVDLHP
130 140 150 160 170 180
GGQSKLMLAA GGPLEPFWAL YAVHNQPHVR ELLAEYKIGE LNPEDRMSPP LEASDPYSND
190 200 210 220 230 240
PMRHPALRIN SQRPFNAEPP PELLTESYIT PNPIFFTRNH LPVPNLDPDT YRLHVVGAPG
250 260 270 280 290 300
GQSLSLSLDD LHKFPKHEVT VTLQCAGNRR SEMNKVKEVK GLEWRTGAIS TARWAGARLC
310 320 330 340 350 360
DVLAQAGHRL RETEAHVCFE GLDSDPTGTA YGASIPLARA MDPQAEVLLA YEMNGQPLPR
370 380 390 400 410 420
DHGFPVRVVV PGVVGARHVK WLGRVSVESE ESYSHWQRRD YKGFSPSVDW DTVDFDLAPS
430 440 450 460 470 480
IQELPIQSAI TQPQDGTTVE SGEVIIKGYA WSGGGRAVIR VDVSMDGGLT WQEAELEGEE
490 500 510 520 530 540
QHPRKAWAWR IWQLKAHVPA EQKELNIICK AVDDSYNVQP DTVAPIWNLR GVLSNAWHRV
HVQVVP

ANNEX 201
13.3 Summary of protein cysteine and lysine contents
Table 22 Cysteine and lysine contents of furan target proteins (continued on next pages). Protein sequence data obtained from UniProt database. The % values for cysteine and lysine are calculated as number of cysteine or lysine amino acid residues/total number of amino acids.
Protein Name Spot ID Mr pI Total
number of amino acids
Cysteine Lysine
Number % Number %
Carbohydrate metabolism
α-Enolase 27 P04764 47128 6.16 434 6 1.4 36 8.3
Fructose-bisphosphate aldolase B 50 P00884 39618 8.66 364 8 2.2 23 6.3
Fructose-1,6-bisphosphatase 1 6 P19112 39609 5.54 363 8 2.2 24 6.6
Glyceraldehyde-3-phosphate dehydrogenase 52 P04797 35828 8.43 333 5 1.5 26 7.8
L-Lactate dehydrogenase A chain 53 P04642 36451 8.45 332 5 1.5 28 8.4
Malate dehydrogenase 2b, 31 O88989 36483 6.16 334 3 0.9 30 9.0
Phosphoglycerate kinase 1 51 P16617 44538 8.02 417 7 1.7 41 9.8
Triosephosphate isomerase 47, 97 P48500 26849 6.51 249 9 3.6 21 8.4
Lipid metabolism
Enoyl-CoA hydratase 64 P14604 31516 6.41 290 7 2.4 22 7.6
3-Ketoacyl-CoA thiolase 51, 55 P13437 41871 8.09 397 7 1.8 23 5.8
Long-chain fatty acid CoA ligase 1 2a P18163 78179 6.60 699 18 2.6 49 7.0
Long-chain specific acyl-CoA dehydrogenase 93 P15650 47873 7.63 430 7 1.6 26 6.0
Short-chain specific acyl-CoA dehydrogenase 59 P15651 44765 8.47 412 5 1.2 22 5.3
Amino acid metabolism, urea cycle
Arginase 1 59 P07824 34973 6.76 323 3 0.9 26 7.7
Argininosuccinate synthase 51, 55 P09034 46496 7.63 412 5 1.2 34 8.3
Betaine-homocysteine S-methyltransferase 1 51 O09171 44976 8.01 407 8 2.0 30 7.4
Formimidoyltransferase-cyclodeaminase 83 O88618 58914 5.80 541 11 2.0 24 4.4
Isovaleryl-CoA dehydrogenase 33c, 58 P12007 46435 8.03 424 8 1.9 23 5.4
Ornithine carbamoyltransferase 55, 60 P00481 39886 9.12 354 1 0.3 26 7.3
2-Oxoisovalerate dehydrogenase subunit α 85 P11960 50164 7.68 441 5 1.1 16 3.6
S-Adenosylmethionine synthetase isoform type-1 85, 86 P13444 43698 5.61 397 10 2.5 25 6.3
Redox regulation
Electron transfer flavoprotein subunit α 61 P13803 34951 8.62 333 6 1.8 26 7.8
Peroxiredoxin-1 62 Q63716 22109 8.27 199 4 2.0 19 9.5
Thioredoxin-1 12 P11232 11673 4.80 105 6 5.7 12 11.4
Thioredoxin-like protein 1 3 Q920J4 32249 4.84 289 7 2.4 18 5.9

202 ANNEX
Table 22 (continued)
Protein Name Spot ID Mr pI Total number
of amino acids
Cysteine Lysine
Number % Number %
Protein folding
78 kDa Glucose-regulated protein 75, 76 P06761 72347 5.07 654 3 0.5 61 9.3
Heat shock cognate 71 kDa protein 1, 79 P63018 70871 5.43 646 4 0.6 54 8.4
Protein disulfide-isomerase 74, 75 P04785 56951 4.82 509 7 1.4 51 10.0
Protein disulfide-isomerase A3 83 P11598 56623 5.88 505 8 1.6 50 9.9
Proteolysis
α1-Antiproteinase 86 P17475 46136 5.70 411 3 0.7 26 6.3
Protein AMBP: Bikunin and Trypstatin 23 Q64240 38851 5.77 349 16 4.6 21 6.0
Serine protease inhibitor A3K 80 P05545 46562 5.31 416 4 1.0 30 7.2
Ubiquitin fusion degradation protein 1 homolog 94 Q9ES53 34485 6.27 307 5 1.6 22 7.2
Structural proteins
β-Actin 2a, 2b, 5 P60711 41737 5.29 375 6 1.6 19 5.1
Ezrin-radixin-moesin-binding phosphoprotein 50 21a Q9JJ19 38830 5.70 356 6 1.7 28 7.9
Fibrinogen γ chain 21c P02680 50633 5.85 445 11 2.5 31 7.0
γ-Actin 2a, 2b, 5, 78 P63259 41793 5.29 375 6 1.6 19 5.1
Keratin, type II cytoskeletal 8 21b, 24, 25, 78 Q10758 54019 5.82 483 / / 35 7.2
Na(+)/H(+) exchanger regulatory factor 3 75, 79 Q9JJ40 56800 5.23 523 7 1.3 41 7.8
Protein SEC13 homolog 4 Q5XFW8 35548 5.15 322 9 2.8 17 5.3
Voltage-dependent anion-selective channel
protein 1 53
Q9Z2L0 30756 8.35 283 2 0.7 25 8.9
Transport proteins
α2µ-Globulin 19, 20a, 87 P02761 20737 5.85 181 5 2.8 14 7.7
Fatty acid binding protein 1 63, 91 P02692 14273 7.79 127 1 0.8 17 13.4
Protein AMBP: α1-Microglobulin 23 Q64240 38851 5.77 349 16 4.6 21 6.0
Transthyretin 92 P02767 15720 5.76 147 2 1.4 9 6.1
Vitamin D binding protein 80 P04276 53544 5.76 476 28 5.9 36 7.6
Nucleotide metabolism
Multifunctional protein ADE2 51 P51583 47096 7.87 425 13 3.1 43 10.1
Putative L-aspartate dehydrogenase 61 Q5I0J9 31260 5.52 297 3 1.0 2 0.7
Heterogeneous nuclear ribonucleoprotein H1 93 Q8VHV7 49188 5.93 449 5 1.1 15 3.3
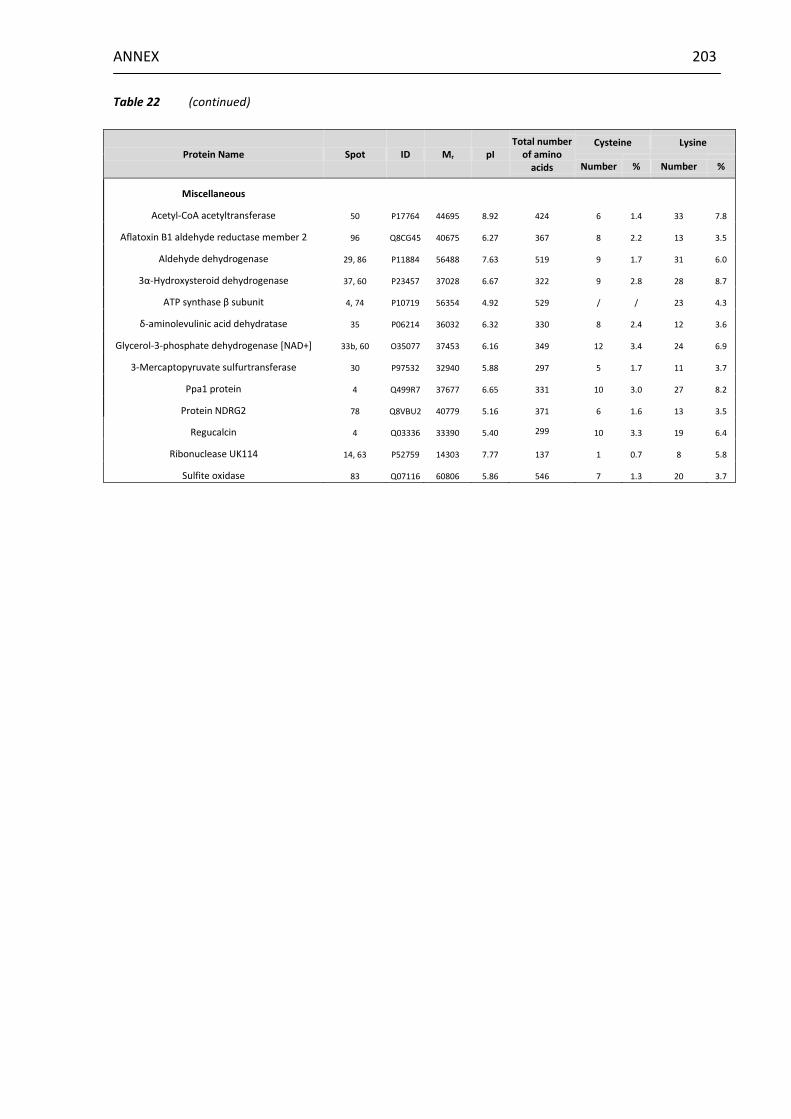
ANNEX 203
Table 22 (continued)
Protein Name Spot ID Mr pI Total number
of amino acids
Cysteine Lysine
Number % Number %
Miscellaneous
Acetyl-CoA acetyltransferase 50 P17764 44695 8.92 424 6 1.4 33 7.8
Aflatoxin B1 aldehyde reductase member 2 96 Q8CG45 40675 6.27 367 8 2.2 13 3.5
Aldehyde dehydrogenase 29, 86 P11884 56488 7.63 519 9 1.7 31 6.0
3α-Hydroxysteroid dehydrogenase 37, 60 P23457 37028 6.67 322 9 2.8 28 8.7
ATP synthase β subunit 4, 74 P10719 56354 4.92 529 / / 23 4.3
δ-aminolevulinic acid dehydratase 35 P06214 36032 6.32 330 8 2.4 12 3.6
Glycerol-3-phosphate dehydrogenase [NAD+] 33b, 60 O35077 37453 6.16 349 12 3.4 24 6.9
3-Mercaptopyruvate sulfurtransferase 30 P97532 32940 5.88 297 5 1.7 11 3.7
Ppa1 protein 4 Q499R7 37677 6.65 331 10 3.0 27 8.2
Protein NDRG2 78 Q8VBU2 40779 5.16 371 6 1.6 13 3.5
Regucalcin 4 Q03336 33390 5.40 299 10 3.3 19 6.4
Ribonuclease UK114 14, 63 P52759 14303 7.77 137 1 0.7 8 5.8
Sulfite oxidase 83 Q07116 60806 5.86 546 7 1.3 20 3.7

204 ANNEX
13.4 Possible additional target proteins of furan
Table 23 Further putative target proteins of reactive furan metabolites (continued on next page) Protein data obtained from Mascot search engine and UniProt database following peptide analysis by FT-ICR* (LTQ FT Ultra
TM, Thermo Scientific) or ESI-QTOF-MS/MS
+ (Q-TOF Ultima Global, Waters). Proteins in this
category were either found in three different animals showing once a sequence coverage < 10 % or were only observed in two animals, but both with a sequence coverage of > 10 %. Cs = cytosol, CM = cell membrane, Cp = cytoplasm, Mito = mitochondrion, ER = endoplasmic reticulum, Ck = cytoskeletal, ES = extracellular space, sec = secreted, Nu = nucleus, Ms = microsome, Px = peroxisome
Protein Spot ID Mr pI
Found in 3 animals, but
sequence coverage was once less than
10 %
Found in 2 animals, but twice
> 10 %
Location
Carbohydrate metabolism
*Transaldolase 60 Q9EQS0 37624 6.57
x Cp
Amino acid metabolism, urea cycle
*Alanine aminotransferase 1 98 P25409 55872 6.08
x Cp
*Branched-chain α-keto acid dihydrolipoyl acyltransferase 98 Q99PU6 20825 5.21
x Mito
*Fumarylacetoacetase 57 P25093 46231 6.67 x
*3-Hydroxyisobutyrate dehydrogenase 61 P29266 36741 8.58
x Mito
*4-Hydroxyphenylpyruvate dioxygenase 58 P32755 45312 6.29 x
Cp, ER, Golgi, CM
94 P32755 45312 6.29
x Cp, ER, Golgi, CM
*Phenylalanine-4-hydroxylase 24 P04176 52303 5.76
x
*Succinate semialdehyde dehydrogenase 98 P51650 52669 6.40
x Mito
Redox regulation
*Cytochrome b5 70 P00173 11400 5.26
x ER, Ms
Proteolysis
*Cytosolic non-specific dipeptidase 80 Q6Q0N1 53116 5.43
x Cp
*Proteasome subunit α type-6 64 P60901 27838 6.34 x
Cp, Nu
Structural proteins
*Tubulin β2C chain 74 Q6P9T8 50225 4.79
x Ck
Nucleotide metabolism
*Nucleoside diphosphate kinase A 87 Q05982 17296 5.96
x Cp, Nu
*Poly(RC) binding protein 2 94 Q6AYU5 37987 6.66
x Cp
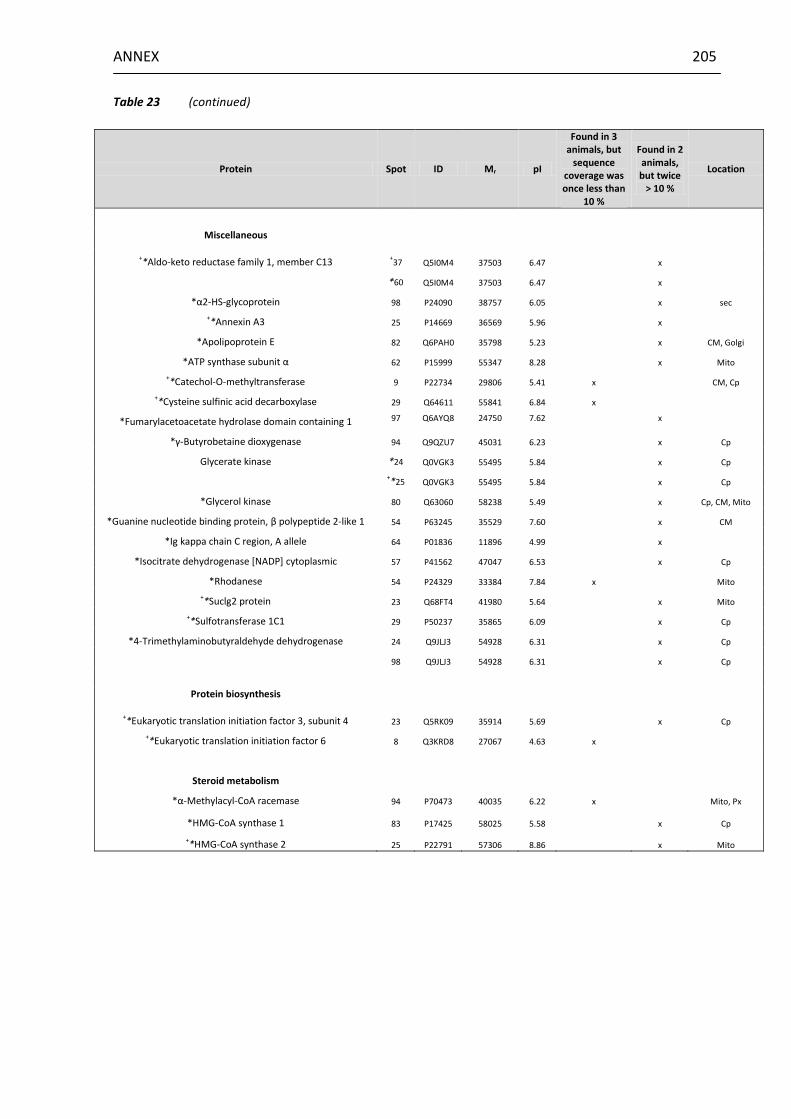
ANNEX 205
Table 23 (continued)
Protein Spot ID Mr pI
Found in 3 animals, but
sequence coverage was once less than
10 %
Found in 2 animals, but twice
> 10 %
Location
Miscellaneous
+*Aldo-keto reductase family 1, member C13 +37 Q5I0M4 37503 6.47
x
*60 Q5I0M4 37503 6.47
x
*α2-HS-glycoprotein 98 P24090 38757 6.05
x sec
+*Annexin A3 25 P14669 36569 5.96
x
*Apolipoprotein E 82 Q6PAH0 35798 5.23
x CM, Golgi
*ATP synthase subunit α 62 P15999 55347 8.28
x Mito
+*Catechol-O-methyltransferase 9 P22734 29806 5.41 x
CM, Cp
+*Cysteine sulfinic acid decarboxylase 29 Q64611 55841 6.84 x
*Fumarylacetoacetate hydrolase domain containing 1 97 Q6AYQ8 24750 7.62
x
*γ-Butyrobetaine dioxygenase 94 Q9QZU7 45031 6.23
x Cp
Glycerate kinase *24 Q0VGK3 55495 5.84
x Cp
+*25 Q0VGK3 55495 5.84
x Cp
*Glycerol kinase 80 Q63060 58238 5.49
x Cp, CM, Mito
*Guanine nucleotide binding protein, β polypeptide 2-like 1 54 P63245 35529 7.60
x CM
*Ig kappa chain C region, A allele 64 P01836 11896 4.99
x
*Isocitrate dehydrogenase [NADP] cytoplasmic 57 P41562 47047 6.53
x Cp
*Rhodanese 54 P24329 33384 7.84 x
Mito
+*Suclg2 protein 23 Q68FT4 41980 5.64
x Mito
+*Sulfotransferase 1C1 29 P50237 35865 6.09
x Cp
*4-Trimethylaminobutyraldehyde dehydrogenase 24 Q9JLJ3 54928 6.31
x Cp
98 Q9JLJ3 54928 6.31
x Cp
Protein biosynthesis
+*Eukaryotic translation initiation factor 3, subunit 4 23 Q5RK09 35914 5.69
x Cp
+*Eukaryotic translation initiation factor 6 8 Q3KRD8 27067 4.63 x
Steroid metabolism
*α-Methylacyl-CoA racemase 94 P70473 40035 6.22 x
Mito, Px
*HMG-CoA synthase 1 83 P17425 58025 5.58
x Cp
+*HMG-CoA synthase 2 25 P22791 57306 8.86
x Mito

206 ANNEX
13.5 Densitometry data
pH 4-7, whole cell extract
20a 12 29 25 35 2a 21
b 14 1 47 3 23 33b 6 37 21
c 2b 24 27 21a 31 33
c 19 5 30 4
0
100
200
300
400
Spot
Rati
o
pH 6-9, whole cell extract
59 52 62 58 55 64 61 50 53 51 60 63
0
50
100
150
200
Spot
Rati
o
pH 4-7, membrane fraction
76 91 78 97 79 94 85 86 93 96 92 87 83 80 74 75
0
50
100
150
200
Spot
Rati
o
Figure 39 Scatter blots showing the different ratio values for each spot plus their means and standard deviation. For identity of the proteins identified in the various spots see Tab. 24. Top: pH 4-7, whole tissue extract, 900 µg protein, 10 weeks exposure time, n=3 Middle: pH 6-9, whole tissue extract, 500 µg protein, 16 weeks exposure time, n=4 Bottom: pH 4-7, membrane fraction, 900 µg protein, 24 weeks exposure time, n=4

ANNEX 207
Table 24 Summary of the proteins identified in the different protein spots.
Spot Protein Spot Protein
1 Heat shock cognate 71 kDa protein
55
Ornithine carbamoyltransferase
2a Long-chain fatty acid CoA ligase 1 Argininosuccinate synthase
β-Actin / γ-Actin 3-Ketoacyl-CoA thiolase
2b Malate dehydrogenase 58 Isovaleryl-CoA dehydrogenase
β-Actin / γ-Actin 59
Short-chain specific acyl-CoA dehydrogenase
3 Thioredoxin-like protein 1 Arginase 1
4
Regucalcin
60
Glycerol-3-phosphate dehydrogenase [NAD+]
ATP synthase β subunit 3α-Hydroxysteroid dehydrogenase
Protein SEC13 homolog Ornithine carbamoyltransferase
Ppa1 protein 61
Putative L-aspartate dehydrogenase
5 β-Actin / γ-Actin Electron transfer flavoprotein subunit α
6 Fructose-1,6-bisphosphatase 1 62 Peroxiredoxin-1
12 Thioredoxin-1 63
Ribonuclease UK114
14 Ribonuclease UK114 Fatty acid binding protein 1
19 α2µ-Globulin 64 Enoyl-CoA hydratase
20a α2µ-Globulin 74
Protein disulfide-isomerase
21a Ezrin-radixin-moesin-binding phosphoprotein 50 ATP synthase β subunit
21b Keratin, type II cytoskeletal 8
75
78 kDa Glucose-regulated protein
21c Fibrinogen γ chain Protein disulfide-isomerase
23 Protein AMBP Na(+)/H(+) exchanger regulatory factor 3
24 Keratin, type II cytoskeletal 8 76 78 kDa Glucose-regulated protein
25 Keratin, type II cytoskeletal 8
78
Keratin, type II cytoskeletal 8
27 α-Enolase β-Actin / γ-Actin
29 Aldehyde dehydrogenase Protein NDRG2
30 3-Mercaptopyruvate sulfurtransferase 79
Heat shock cognate 71 kDa protein
31 Malate dehydrogenase Na(+)/H(+) exchanger regulatory factor 3
33b Glycerol-3-phosphate dehydrogenase 80
Serine protease inhibitor A3K
33c Isovaleryl-CoA dehydrogenase Vitamin D-binding protein
35 δ-Aminolevulinic acid dehydratase
83
Protein disulfide-isomerase A3
37 3α-Hydroxysteroid dehydrogenase Formimidoyltransferase-cyclodeaminase
47 Triosephosphate isomerase Sulfite oxidase
50 Acetyl-CoA acetyltransferase
85 S-Adenosylmethionine synthetase isoform type-1
Fructose-bisphosphate aldolase B 2-Oxoisovalerate dehydrogenase subunit α
51
Argininosuccinate synthase
86
α1-Antiproteinase
Betaine-homocysteine S-methyltransferase 1 Aldehyde dehydrogenase
3-Ketoacyl-CoA thiolase S-Adenosylmethionine synthetase isoform type-1
Phosphoglycerate kinase 1 87 α2µ-Globulin
Multifunctional protein ADE2 91 Fatty acid binding protein 1
52 Glyceraldehyde-3-phosphate dehydrogenase 92 Transthyretin
53 L-lactate dehydrogenase A chain
93 Heterogeneous nuclear ribonucleoprotein H1
Voltage-dependent anion-selective channel protein 1 Long-chain specific acyl-CoA dehydrogenase
94 Ubiquitin fusion degradation protein 1 homolog
96 Aflatoxin B1 aldehyde reductase member 2
97 Triosephosphate isomerase

208 PUBLICATIONS
14 PUBLICATIONS
14.1 Presentations at international meetings
Mally, A., Graff, C., Moro, S., Hamberger, C., Schauer, U.M., Brück, J., Özden, S., Sieber,
M., Steger, U., Hard, G.C., Chipman, J.K., Schrenk, D., and Dekant, W. Furan in Food: 28
Day Oral Toxicity and Cell proliferation in Male F344/N Rats. (Poster) Society of Toxicology
48th Annual Meeting, Baltimore, 2009. The Toxicologist, Supplement to Toxicological
Sciences
Moro, S., Hamberger, C., Dekant, W., Chipman, K. and Mally, A. Identification of target
proteins of furan in rat liver. (Oral presentation + Poster) 46th Congress of the European
Society of Toxicology, Dresden, 2009. Toxicology Letters, Vol. 189S
Hamberger, C., Moro, S., Malfatti, M., Turteltaub, K., Mally, A., Dekant, W. Analysis of
DNA binding of furan in rat liver by accelerator mass spectrometry. (Oral presentation +
Poster) 46th Congress of the European Society of Toxicology, Dresden, 2009. Toxicology
Letters, Vol. 189S
Moro, S., Hamberger, C., Dekant, W., Chipman, K. and Mally, A. Identification of target
proteins of furan in rat liver. (Poster) Society of Toxicology 49th Annual Meeting, Salt Lake
City, 2010. The Toxicologist, Supplement to Toxicological Sciences
Hamberger, C., Moro, S., Malfatti, M., Turteltaub, K., Dekant, W., Mally, A. Analysis of
DNA binding of [3,4-14C]-furan in rat liver by accelerator mass spectrometry. (Poster)
Society of Toxicology 49th Annual Meeting, Salt Lake City, 2010. The Toxicologist,
Supplement to Toxicological Sciences

PUBLICATIONS 209
14.2 Publication
Mally, A., Graff, C., Schmal, O., Moro, S., Hamberger, C., Schauer, U.M., Brück, J., Özden,
S., Sieber, M., Steger, U., Schrenk, D., Hard, G.C., Chipman, J.K. and Dekant, W. Functional
and proliferative effects of repeated low-dose oral administration of furan in rat liver.
Mol. Nutr. Food Res. 2010, 54, 1-12

210 ACKNOWLEDGEMENTS
15 ACKNOWLEDGEMENTS
First of all, I would like to thank PD Dr. Angela Mally and Prof. Dr. Wolfgang Dekant for
giving me the opportunity to work on this interesting PhD project. Thank you for your
understanding and your support. I am deeply grateful that I had the chance to spend a
few months working in England and to present the results of my work at meetings and
international conferences.
I would like to thank Prof. Dr. Ulrike Holzgrabe for supervising my PhD thesis on behalf of
the Faculty for Chemistry and Pharmacy.
I am very thankful to our cooperation partner Prof. J. Kevin Chipman for giving me the
possibility to perform a part of my work at the School of Biosciences (The University of
Birmingham).
I would like to thank Antony Jones, Lorraine Wallace, Dr. Jonathan James, and Dr.
Cleidiane Zampronio for kindly supporting me in the mass spectrometry analyses. I am
also grateful to my friends and colleagues at the University of Birmingham. I had a really
great time with you - during the working hours as well as at tea times and curries.
Financial support by the DFG (Deutsche Forschungsgemeinschaft) is gratefully
acknowledged. Furthermore, I would like to thank all participants of the FP6 European
Union funded project “Role of genetic and non-genetic mechanisms in furan risk” for kind
cooperation.
I am thankful to Christian Dees, Reinhold Krug, and Dr. Benjamin Mentzel for helping me
with the radioactive work and measuring samples for me.
Thank you to Michaela Bekteshi, Ursula Tatsch, Heike Keim-Heusler, Caroline Kröcher,
and Elisabeth Rüb-Spiegel for excellent technical assistance and animal care. Moreover, I
am very grateful to all my colleagues from the working groups of PD Dr. Angela Mally and
Prof. Dr. Wolfgang Dekant for the nice and friendly working atmosphere.

ACKNOWLEDGEMENTS 211
I am particularly thankful to Silvi, Dana, Melli, Caro, Tinka, and Marion for countless
helpful discussions, for your optimism, for your friendship, and for your support (private
and scientific).
Finally, I would like to express my special thanks to my dear parents. Thank you for your
unlimited support during my years of study and my PhD work and for your patience and
encouragement while I was writing up the thesis! I would also like to thank the rest of my
familiy and my friends who always supported me.
Related Documents