CROP SCIENCE, VOL. 47, NOVEMBER– DECEMBER 2007 2403 RESEARCH I dentifying quantitative trait loci (QTLs) associated with eco- nomically valuable phenotypes is of particular interest as the basis for developing efficient strategies for genomics-based approaches to plant improvement. Identification of QTLs is also a valuable starting point for positional cloning of genes underlying quantitative pheno- types and for interpreting the molecular and biochemical mecha- nisms that condition plant growth and development. The QTL studies that are conducted over several years and locations provide information about which regions of the genome Identification of Quantitative Trait Loci in Rice for Yield, Yield Components, and Agronomic Traits across Years and Locations Yong-Gu Cho, Hyeon-Jung Kang, Jeom-Sig Lee, Young-Tae Lee, Sang-Jong Lim, Hugh Gauch, Moo-Young Eun, and Susan R. McCouch* ABSTRACT A population of 164 recombinant inbred lines (RILs) of rice (Oryza sativa L.) derived from a cross between Milyang23 and Gihobyeo was evaluated for nine phenotypic characters over three years and two regions in Korea. The pop- ulation had been previously mapped using 414 molecular markers. Genotype × environment (G × E) interaction was analyzed for six grain yield- related traits and three agronomic traits across years and locations using the AMMI model. The quantitative trait loci (QTLs) were detected by interval mapping and composite interval map- ping. A total of 75 QTLs were identified for the nine traits across five environments and they were categorized as (i) 29 QTLs with main effect, (ii) 18 QTLs with minor effect, (iii) 13 QTLs with G × E interaction effect, (iv) six QTLs with both main effect and G × E interaction effect, and (v) nine potential QTLs with low log of the odds (LOD) scores. The AMMI model explained from 68.6% to 84.7% of the interaction effect and 19 QTLs were significantly associated with G × E interaction. Culm length had the least G × E, while the maximum G × E interaction was exhibited for spikelets per panicle (39.7%) and percent ripened grain (35.3%). Markers closely linked to main effect QTLs will be most useful for marker-assisted breeding. Y.-G. Cho and M.-Y. Eun, National Institute of Agricultural Biotech- nology, Suwon 441-707, Korea; Y.-G. Cho, current address: Dep. of Crop Science, Chungbuk National Univ., Chongju 361-763, Korea; H.-J. Kang and Y.-T. Lee, Honam Agricultural Research Institute, Iksan 570-080, Korea; J.-S. Lee and S.-J. Lim, Youngnam Agricul- tural Research Institute, Milyang 627-130, Korea;. H. Gauch, Crop and Soil Sciences, Cornell Univ., Ithaca, NY 14853-1901; S.R. McCouch, Dep. of Plant Breeding, Cornell Univ., Ithaca, NY 14853-1901. This research was supported by grants from the Rural Development Admin- istration and the Rockefeller Foundation’s Biotechnology Career Fel- lowship (RF95001, No. 342) for Y.G. Cho’s work at Cornell. Received 2 Aug. 2006. *Corresponding author ([email protected]). Abbreviations: AMMI, additive main effects and multiplicative inter- action; ANOVA, analysis of variance; BR, brown/rough grain ratio; CIM, composite interval mapping; CL, culm length; DTH, days to heading; G × E, genotype × environment; IM, interval mapping; IPC, interactive principal component; LOD, log of the odds; LR, lin- ear regression; PCA, principal component analysis; PL, panicle length; PPP, panicles per plant; PRG, percent ripened grain; QTL, quantitative trait locus; RIL, recombinant inbred line; SPP, spikelets per panicle; TGW, 1000-grain weight; YLD, yield. Published in Crop Sci. 47:2403–2417 (2007). doi: 10.2135/cropsci2006.08.0509 © Crop Science Society of America 677 S. Segoe Rd., Madison, WI 53711 USA All rights reserved. No part of this periodical may be reproduced or transmitted in any form or by any means, electronic or mechanical, including photocopying, recording, or any information storage and retrieval system, without permission in writing from the publisher. Permission for printing and for reprinting the material contained herein has been obtained by the publisher.

Welcome message from author
This document is posted to help you gain knowledge. Please leave a comment to let me know what you think about it! Share it to your friends and learn new things together.
Transcript

CROP SCIENCE, VOL. 47, NOVEMBER–DECEMBER 2007 2403
RESEARCH
Identifying quantitative trait loci (QTLs) associated with eco-nomically valuable phenotypes is of particular interest as the basis
for developing effi cient strategies for genomics-based approaches to plant improvement. Identifi cation of QTLs is also a valuable starting point for positional cloning of genes underlying quantitative pheno-types and for interpreting the molecular and biochemical mecha-nisms that condition plant growth and development.
The QTL studies that are conducted over several years and locations provide information about which regions of the genome
Identifi cation of Quantitative Trait Loci in Rice for Yield, Yield Components, and
Agronomic Traits across Years and Locations
Yong-Gu Cho, Hyeon-Jung Kang, Jeom-Sig Lee, Young-Tae Lee, Sang-Jong Lim, Hugh Gauch, Moo-Young Eun, and Susan R. McCouch*
ABSTRACT
A population of 164 recombinant inbred lines
(RILs) of rice (Oryza sativa L.) derived from a
cross between Milyang23 and Gihobyeo was
evaluated for nine phenotypic characters over
three years and two regions in Korea. The pop-
ulation had been previously mapped using 414
molecular markers. Genotype × environment (G
× E) interaction was analyzed for six grain yield-
related traits and three agronomic traits across
years and locations using the AMMI model. The
quantitative trait loci (QTLs) were detected by
interval mapping and composite interval map-
ping. A total of 75 QTLs were identifi ed for the
nine traits across fi ve environments and they
were categorized as (i) 29 QTLs with main
effect, (ii) 18 QTLs with minor effect, (iii) 13 QTLs
with G × E interaction effect, (iv) six QTLs with
both main effect and G × E interaction effect,
and (v) nine potential QTLs with low log of the
odds (LOD) scores. The AMMI model explained
from 68.6% to 84.7% of the interaction effect
and 19 QTLs were signifi cantly associated with
G × E interaction. Culm length had the least G
× E, while the maximum G × E interaction was
exhibited for spikelets per panicle (39.7%) and
percent ripened grain (35.3%). Markers closely
linked to main effect QTLs will be most useful
for marker-assisted breeding.
Y.-G. Cho and M.-Y. Eun, National Institute of Agricultural Biotech-
nology, Suwon 441-707, Korea; Y.-G. Cho, current address: Dep. of
Crop Science, Chungbuk National Univ., Chongju 361-763, Korea;
H.-J. Kang and Y.-T. Lee, Honam Agricultural Research Institute,
Iksan 570-080, Korea; J.-S. Lee and S.-J. Lim, Youngnam Agricul-
tural Research Institute, Milyang 627-130, Korea;. H. Gauch, Crop and
Soil Sciences, Cornell Univ., Ithaca, NY 14853-1901; S.R. McCouch,
Dep. of Plant Breeding, Cornell Univ., Ithaca, NY 14853-1901. This
research was supported by grants from the Rural Development Admin-
istration and the Rockefeller Foundation’s Biotechnology Career Fel-
lowship (RF95001, No. 342) for Y.G. Cho’s work at Cornell. Received
2 Aug. 2006. *Corresponding author ([email protected]).
Abbreviations: AMMI, additive main eff ects and multiplicative inter-
action; ANOVA, analysis of variance; BR, brown/rough grain ratio;
CIM, composite interval mapping; CL, culm length; DTH, days to
heading; G × E, genotype × environment; IM, interval mapping;
IPC, interactive principal component; LOD, log of the odds; LR, lin-
ear regression; PCA, principal component analysis; PL, panicle length;
PPP, panicles per plant; PRG, percent ripened grain; QTL, quantitative
trait locus; RIL, recombinant inbred line; SPP, spikelets per panicle;
TGW, 1000-grain weight; YLD, yield.
Published in Crop Sci. 47:2403–2417 (2007).doi: 10.2135/cropsci2006.08.0509© Crop Science Society of America677 S. Segoe Rd., Madison, WI 53711 USA
All rights reserved. No part of this periodical may be reproduced or transmitted in any form or by any means, electronic or mechanical, including photocopying, recording, or any information storage and retrieval system, without permission in writing from the publisher. Permission for printing and for reprinting the material contained herein has been obtained by the publisher.

2404 WWW.CROPS.ORG CROP SCIENCE, VOL. 47, NOVEMBER–DECEMBER 2007
are consistently identifi ed with target traits. In rice (Oryza sativa L.), approximately 8,000 QTLs have been identifi ed as of December 2006 (www.gramene.org) and a compari-son of QTL positions across populations and environments allows researchers to develop testable hypotheses about the behavior of genetic factors underlying the putative QTL.
Many agronomic traits of importance are quantita-tively expressed. Quantitative traits are also infl uenced by environment and tend to show varied degrees of genotype × environment (G × E) interactions (Zhuang et al., 1997; Austin and Lee, 1998; Jiang et al., 1999; Crossa et al., 1999; Hayes et al., 1993; Lu et al., 1996). G × E interaction occurs when genotypes perform diff erently in various environ-ments. Signifi cant G × E interaction has been reported by comparing QTLs detected in multiple environments (Stu-ber et al., 1992; Zhuang et al., 1997). In these studies, the appearance of QTLs detected in one environment but not in another was considered to be an indication of G × E interaction. However it has also been shown that QTLs that are stable and consistently detected across environments may still have signifi cant G × E eff ects (Yan et al., 1998).
It is not always clear whether inconsistent QTL detec-tion is due to the type-II error arising from the use of single thresholds or to true diff erential trait expression across envi-ronments. Using composite interval mapping, Tinker et al. (1996) were able to detect considerable QTL × environment interaction for seven agronomic traits in two barley crosses, even though many of the detected QTLs were highly con-sistent across environments. Li et al. (2003) reported signifi -cant G × E interaction associated with main-eff ect QTLs for plant height and heading date traits with a rice doubled haploid (DH) population in nine diff erent environments of Asia and quantifi ed main-eff ect QTLs and epistatic QTLs.
Statistical procedures such as analysis of variance (ANOVA), principal component analysis (PCA), and linear regression (LR) analysis can be used to evaluate genotype and environmental main-eff ects and G × E interaction. Their limitations have been discussed (Gollob, 1968; Mandel, 1971; Bradu and Gabriel, 1978; Kempton, 1984). The additive main eff ects and multiplicative interaction (AMMI) model is useful in understanding both main eff ects and G × E interaction in multi-location variety trials (Zobel et al., 1988; Gauch, 1992; Romagosa et al., 1996; Gauch and Zobel, 1997; Hittalmani et al., 2003; Gauch, 2006a). The AMMI model combines ANOVA for genotype and environment main eff ects with PCA of the G × E interaction into a single model with additive and multiplicative parameters. It has proven useful for under-standing complex G × E interaction (Kang, 1996; Ebdon and Gauch, 2002; Gauch, 2006b). Results can be graphed in a very informative biplot that shows both main and interaction eff ects for both genotypes and environments.
The AMMI model is particularly useful in understand-ing G × E interaction and summarizing patterns and relation-
ships of genotypes and environments (Crossa, 1990). During the initial ANOVA the total variation is partitioned into three orthogonal sources, genotypes (G), environments (E) and G × E interaction. Romagosa and Fox (1993) observed that “in most yield trials, the proportion of sum of squares due to diff erences among sites ranged from 80 to 90% and variation due to G × E interaction was usually larger than genotypic variation.” In AMMI analysis, even just the fi rst interactive principle component (IPC1) sum of squares alone is often larger than for G. As genotypes and environments become more diverse, G × E interaction tends to increase and may reach 40 to 60% of total variation. The environ-mental main eff ect, which sometimes contributes up to 90% of the total variation, is of interest to soil scientists but only G and G × E interaction are relevant for plant breeders and their selection procedures. The AMMI model can produce graphs (biplots) that focus on the data structure relevant to selection, in other words on the G and G × E interaction (Romagosa and Fox, 1993; Gauch and Zobel, 1997). The PCA portion of the AMMI model partitions G × E interaction into several orthogonal components, so a choice must be made regarding how many components to include in the model, particularly because an ideal choice can gain accuracy (Gauch, 2006a; Ebdon and Gauch, 2002). Gauch and Zobel (1996) reported that the AMMI model, with one or two interaction com-ponents, is often most accurate. Gauch (1992) and Cornelius (1993) presented several statistical tests for guiding this choice for each individual data set.
The present study was conducted with a population of 164 recombinant inbred lines (RILs) of rice derived from a cross between Milyang23 and Gihobyeo. The population was evaluated for nine traits over 3 yr in Honam Agricultural Research Institute (HARI) and 2 yr in Youngnam Agricul-tural Research Institute (YARI) in Korea to determine both main eff ects and G × E interaction eff ects of QTLs using the AMMI model. Detecting QTL in regions of the world where rice cultivation is most intensively practiced is essential for developing new varieties based on marker-assisted breed-ing. Breeders are likely to be more interested in using infor-mation about QTLs of agronomic importance when they are detected within the relatively small regions that they are tar-geting for new varieties. Despite the restricted size of a target environment, environmental variation over years and across locations must be factored into the performance evaluation of a new variety. In this study, we aimed to identify main-eff ect QTLs and distinguish them from QTLs showing large G × E variation. This allows plant breeders to more effi ciently target marker-assisted strategies for plant improvement.
MATERIALS AND METHODS
Plant MaterialAn RI population consisting of 164 F
11 lines was developed
from a cross between cultivar Milyang 23 (M, an Indica/Japonica
derivative known as the Tongil type) and cv. Gihobyeo (G, a

CROP SCIENCE, VOL. 47, NOVEMBER–DECEMBER 2007 WWW.CROPS.ORG 2405
ture (Gauch, 1992; Romagosa et al., 1996). From the ANOVA,
the AMMI model fi rst accounts for the additive main eff ects and
then applies PCA to the interaction (residual) portion from the
ANOVA to extract a new set of co-ordinate axes, that summarize
the interaction patterns. The AMMI analysis was performed by
MATMODEL Version 2.0 (Gauch, 2002). The AMMI model is:
Yger
= μ + αg + β
e + Σ
nλ
nγ
gnδ
en + ρ
ge + ε
ger
where Yger
= yield of genotype g in environment e for repli-
cate r; μ = grand mean (mean value over all genotypes and
environments, unweighted by number of replications); αg
= mean deviation of the genotype g; βe = mean deviation
of the environment mean e; λn = the singular value for IPC
axis n; γgn
= the genotype g eigenvector value for IPC axis n;
δen
= the environment e eigenvector value for IPC axis n; ρge
= the residual for phenotype g in environment e; and εger
=
the error for genotype g in environment e for replicate r. G
× E interaction was analyzed using AMMI analysis (Crossa,
1990; Gauch, 1992) to assess similarity and dissimilarity
among fi ve environments and interaction patterns between
genotypes and environments.
QTL AnalysisThe QTL analysis was performed by interval mapping (IM)
and composite interval mapping (CIM) with automatic cofactor
selections by a forward/backward regression (forward P < 0.01,
backward P < 0.01) using QTL Cartographer v2.0 (Basten et
al., 1997). To determine the empirical signifi cance thresholds
(Churchill and Doerge, 1994) for declaring putative QTLs, we
used QGene 3.06y and QTL Cartographer 2.0 to calculate the
empirical log of the odds (LOD) and p = 1 signifi cance levels.
The odds ratio is the likelihood that two markers are linked
divided by the likelihood that they are not linked. The QTLs
that were at or above the 0.05 signifi cance threshold for one or
more environments are reported as putative QTLs and those that
were at or above the 0.1 signifi cance threshold for two or more
environments are put in parenthesis as potential QTLs. Corre-
lation analyses were performed using QGene 3.06y (Nelson,
1997). The QTLs were categorized as (i) QTLs with main eff ect
that were identifi ed over two or more environments, (ii) QTLs
with minor eff ect that were detected in only one environment,
(iii) QTLs with G × E interaction eff ect that were detected
from IPC1 & 2, (iv) QTLs with both main eff ect and G × E
interaction eff ect, or (v) potential QTLs with LOD scores just
above the 0.05 signifi cance threshold.
QTL NomenclatureNomenclature for QTLs was as described in (McCouch et
al., 1997) where a two or three letter abbreviation is fol-
lowed by the number of the chromosome on which the QTL
is found and a terminal suffi x, separated by a period, provid-
ing a unique identifi er to distinguish multiple QTL on a
single chromosome.
RESULTS AND DISCUSSION
Trait Performance
Most of the traits showed an approximately normal dis-tribution as illustrated in Fig. 1. Transgressive variation,
temperate Japonica type). This MG RI population was devel-
oped at the National Institute of Agricultural Biotechnology in
Suwon, Korea as previously reported by Cho et al. (1998a). F11
,
F12
, and F13
generations of this population were planted in the
fi eld for phenotypic evaluation. The molecular map, consisting
of 414 markers, was developed with DNA extracted from F11
lines as previously described by Cho et al. (1998b).
EnvironmentsThe MG RI population was evaluated in two locations in
Korea: Honam Agricultural Research Institute (HARI, abbre-
viated “H”) for 3 yr (1995–1997) and Youngnam Agricultural
Research Institute (YARI, abbreviated “Y”) for 2 yr (1996–
1997). HARI is located at Iksan (36°N, 126.5°E), which is in
the lowland region of Southwestern Korea with an average
rainfall of 1,058 mm yr−1, an average summer (May–Septem-
ber) temperature of 22.4°C and a relative humidity of 74.4%
during the rice growing season. YARI is located at Milyang
(35 oN, 128.5 oE), in the southern part of the Korean peninsula
with an average rainfall of 1,103 mm yr−1 and a summer tem-
perature of 22.0°C and a relative humidity of 73.6%
Field Trials and Trait EvaluationThe MG RI lines and their parents, Milyang 23 and Gihobyeo,
were cultivated in 10 rows with two replications at both HARI
and YARI. The seeds of the RI lines and their parents were planted
in the seedling nursery in both locations in mid-May and the 30-
d-old seedlings were transplanted in mid-June. Each row consisted
of 30 plants with a spacing of 15 cm between the plants and 30 cm
between rows. Fertilizer (N-P2O
5–K
2O) was applied at a rate of
110, 70, and 80 kg ha−1, respectively (Kang et al., 1998).
At maturity, 10 plants for each RI line and both parents
were evaluated for panicles per plant (PPP), spikelets per pan-
icle (SPP), 1000-grain weight (TGW), percent ripened grain
(PRG), brown/rough grain ratio (BR), culm length (CL),
panicle length (PL), and days to heading (DTH). Evaluation
was similar to that described in Kang et al. (1998). Panicles
per plant were the average number of panicles. Spikelets per
panicle were measured as the average number of fi lled spike-
lets per panicle. 1000-grain weight was the average weight of
1000 fi lled spikelets, measured in grams, averaged over three
samples taken from bulk harvested grain. Percent ripened grain
was the number of fi lled spikelets divided by the total number
of spikelets per panicle. Days to heading were evaluated as the
average number of days from seeding until 10% of the panicles
had headed. Culm length was measured as the average length
in centimeters from the soil surface to the panicle tip of the
main tiller. Panicle length was measured as the average number
of centimeters from the panicle neck to the panicle tip (exclud-
ing the awn). Yield per plant was the average weight per plant
of bulked harvested grain measured in grams for 25 plants and
calculated on a per area basis (0.1 ha).
Additive Main Effects and Multiplicative Interaction Analysis for Main and Interaction EffectsThe AMMI model is a powerful hybrid statistical model that ana-
lyzes both main and interaction eff ects for a two-way data struc-

2406 WWW.CROPS.ORG CROP SCIENCE, VOL. 47, NOVEMBER–DECEMBER 2007
both positive and negative, was observed for most of the traits. The maximum range of phenotypic variation was observed for panicles per plant, spikelets per panicle, days to heading, culm length, and panicle length, while 1000-
grain weight, percent ripened grain, and brown/rough grain ratio had the least. Means and the range (min–max) of phenotypes for the nine traits are summarized in Table 1 for the MG RI population and the parents, Milyang23
Figure 1. Frequency distribution of the 164 Milyang23 × Gihobyeo inbred lines for nine traits evaluated in fi ve environments in Korea. Black
arrows represent trait means of Milyang23, while white arrows indicate trait means of Gihobyeo.
CROP SCIENCE, VOL. 47, NOVEMBER–DECEMBER 2007 WWW.CROPS.ORG 2407
and Gihobyeo, in all fi ve environments. Variation for years and locations was detected for all traits.
Trait Correlations
Correlations among traits were evaluated at p < 0.05 and p < 0.01. As summarized in Table 2, the highest correlations were found between yield and spikelets per panicle and between yield and percent ripened grain, indicating that an increase in the number of ripened grains per land area is an important component of yield. There were also signifi -cant correlations between yield and 1000-grain weight, culm length, and panicle length. There was a negative correlation between spikelets per panicle and 1000-grain weight, and between panicles per plant and grains per panicle, as expected. The correlation between yield and days to heading was not signifi cant, indicating that early lines yielded as well as late lines in this population.
G × E InteractionThe eff ects of genotype, environment, and G × E interac-tion were estimated for the nine traits based on AMMI analysis as summarized in Table 3. The G × E compo-nent was relatively small for culm length and 1000-grain weight, while it was much larger for spikelets per panicle, percent ripened grain, panicle length, brown/rough grain ratio, yield, panicles per plant and days to heading. The
AMMI2 model dissected the interaction component into IPC1 and IPC2 and relegated the higher components to an ignored residual that was mostly noise. Of the total G × E interaction eff ect, the AMMI2 model explained an average of 75.9% across all traits, which is comparable to the results by Hittalmani et al. (2003).
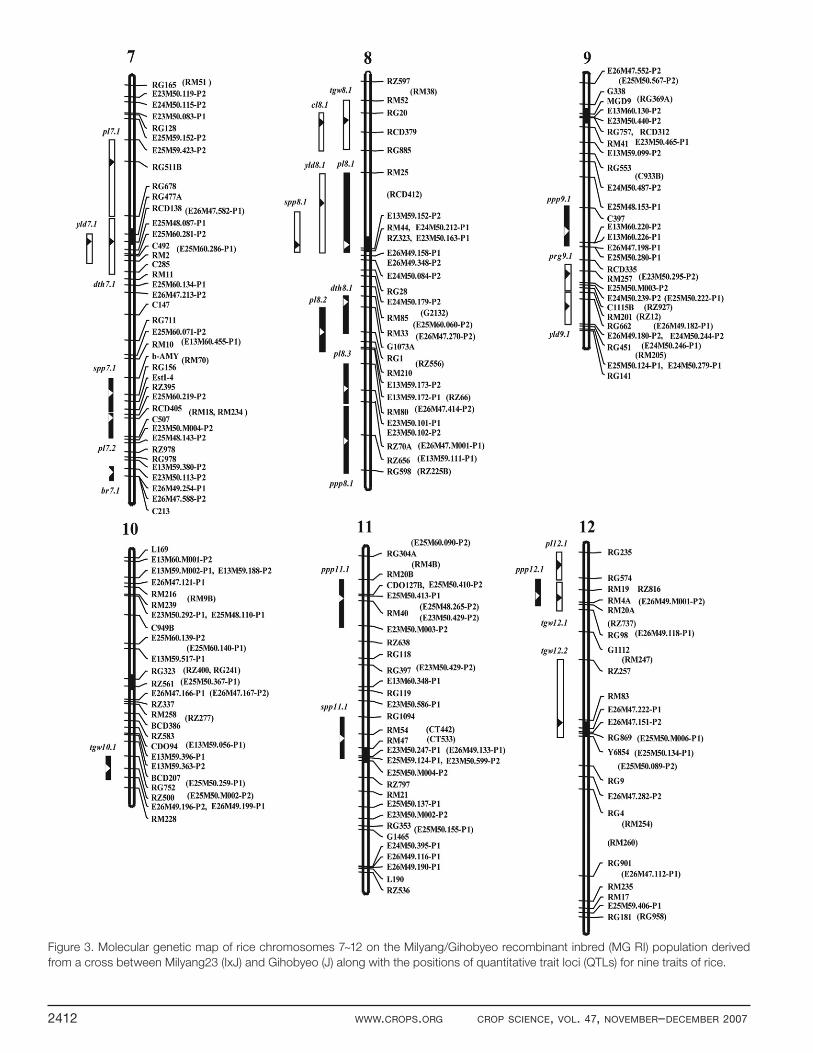
QTL Analysis by Interval Mapping and Composite Interval MappingA total of 75 QTLs were detected for the nine traits as summarized in Table 4, Fig. 2 and Fig. 3. Thirty QTLs were identifi ed for two or more environments and were classifi ed as repeated QTLs, while 29 QTLs were detected in only one environment. Most of the repeated QTLs (26/30) were also identifi ed as main eff ects, and 19 QTLs were found with G × E interaction. The IM analysis detected fewer QTLs (44) than CIM QTLs (73). Forty-two QTLs (56.0%) were common for both meth-ods, while two were exclusively detected by IM, and 31 QTLs (41.3%) were identifi ed only by CIM. Identifi cation of more QTLs using CIM could result from the use of cofactors in CIM that accounted for the variation from the major QTLs, thereby increasing the power of detection of minor QTLs (Septiningsih et al., 2003). In the discus-sion that follows, statistics will be given only for CIM. The QTLs were categorized as (i) QTLs with main eff ect
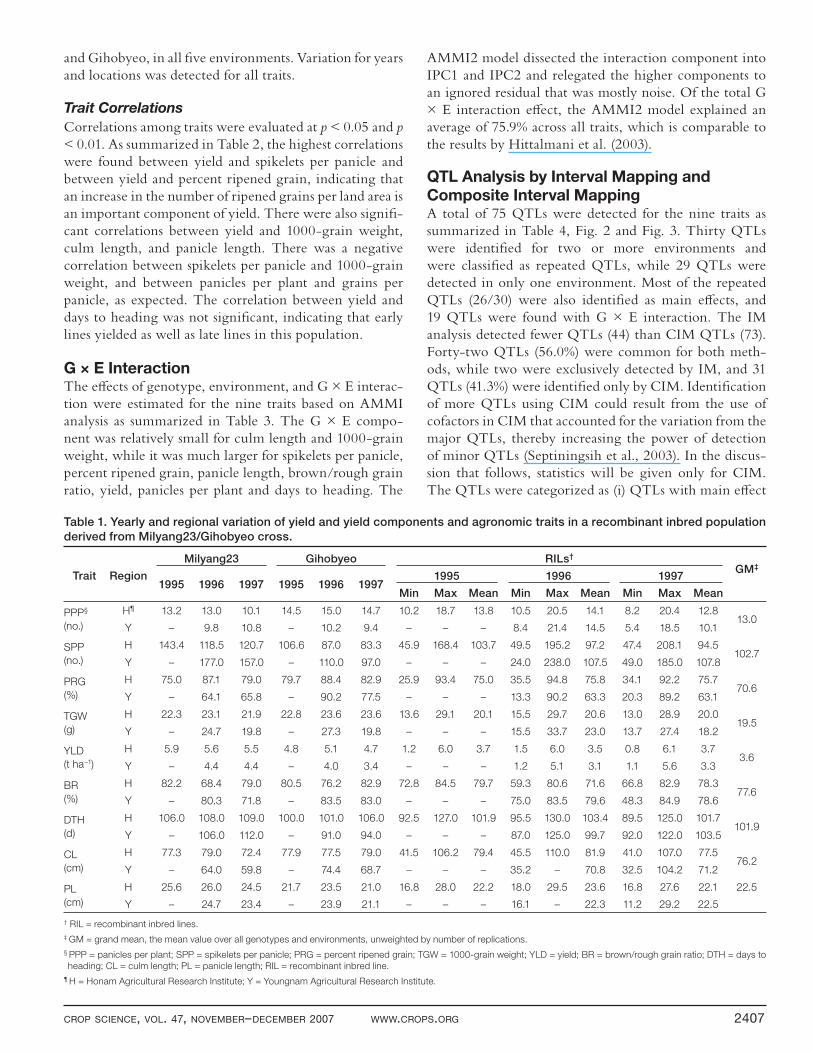
Table 1. Yearly and regional variation of yield and yield components and agronomic traits in a recombinant inbred population
derived from Milyang23/Gihobyeo cross.
Trait Region
Milyang23 Gihobyeo RILs† GM‡
1995 1996 1997 1995 1996 19971995 1996 1997
Min Max Mean Min Max Mean Min Max Mean
PPP§
(no.)
H¶ 13.2 13.0 10.1 14.5 15.0 14.7 10.2 18.7 13.8 10.5 20.5 14.1 8.2 20.4 12.813.0
Y – 9.8 10.8 – 10.2 9.4 – – – 8.4 21.4 14.5 5.4 18.5 10.1
SPP
(no.)
H 143.4 118.5 120.7 106.6 87.0 83.3 45.9 168.4 103.7 49.5 195.2 97.2 47.4 208.1 94.5102.7
Y – 177.0 157.0 – 110.0 97.0 – – – 24.0 238.0 107.5 49.0 185.0 107.8
PRG
(%)
H 75.0 87.1 79.0 79.7 88.4 82.9 25.9 93.4 75.0 35.5 94.8 75.8 34.1 92.2 75.770.6
Y – 64.1 65.8 – 90.2 77.5 – – – 13.3 90.2 63.3 20.3 89.2 63.1
TGW
(g)
H 22.3 23.1 21.9 22.8 23.6 23.6 13.6 29.1 20.1 15.5 29.7 20.6 13.0 28.9 20.019.5
Y – 24.7 19.8 – 27.3 19.8 – – – 15.5 33.7 23.0 13.7 27.4 18.2
YLD
(t ha−1)
H 5.9 5.6 5.5 4.8 5.1 4.7 1.2 6.0 3.7 1.5 6.0 3.5 0.8 6.1 3.73.6
Y – 4.4 4.4 – 4.0 3.4 – – – 1.2 5.1 3.1 1.1 5.6 3.3
BR
(%)
H 82.2 68.4 79.0 80.5 76.2 82.9 72.8 84.5 79.7 59.3 80.6 71.6 66.8 82.9 78.377.6
Y – 80.3 71.8 – 83.5 83.0 – – – 75.0 83.5 79.6 48.3 84.9 78.6
DTH
(d)
H 106.0 108.0 109.0 100.0 101.0 106.0 92.5 127.0 101.9 95.5 130.0 103.4 89.5 125.0 101.7101.9
Y – 106.0 112.0 – 91.0 94.0 – – – 87.0 125.0 99.7 92.0 122.0 103.5
CL
(cm)
H 77.3 79.0 72.4 77.9 77.5 79.0 41.5 106.2 79.4 45.5 110.0 81.9 41.0 107.0 77.576.2
Y – 64.0 59.8 – 74.4 68.7 – – – 35.2 – 70.8 32.5 104.2 71.2
PL
(cm)
H 25.6 26.0 24.5 21.7 23.5 21.0 16.8 28.0 22.2 18.0 29.5 23.6 16.8 27.6 22.1 22.5
Y – 24.7 23.4 – 23.9 21.1 – – – 16.1 – 22.3 11.2 29.2 22.5
† RIL = recombinant inbred lines.
‡ GM = grand mean, the mean value over all genotypes and environments, unweighted by number of replications.
§ PPP = panicles per plant; SPP = spikelets per panicle; PRG = percent ripened grain; TGW = 1000-grain weight; YLD = yield; BR = brown/rough grain ratio; DTH = days to
heading; CL = culm length; PL = panicle length; RIL = recombinant inbred line.
¶ H = Honam Agricultural Research Institute; Y = Youngnam Agricultural Research Institute.
2408 WWW.CROPS.ORG CROP SCIENCE, VOL. 47, NOVEMBER–DECEMBER 2007
that were identifi ed over two or more environments, (ii) QTLs with minor eff ect that were detected in one envi-ronment, (iii) QTLs with G × E interaction eff ect that were detected from IPC1 & 2, (iv) QTLs with both main eff ect and G × E interaction eff ect, or (v) potential QTLs with LOD scores just above the 0.05 signifi cance thresh-old, but below 0.1 used elsewhere in this study (Table 4).
Panicles per Plant Twelve QTLs on nine chromosomes were signifi cantly asso-ciated with panicles per plant (PPP) as summarized in Table 4 and as mapped in Fig. 2 and 3. Six were detected as QTLs with main eff ect, two were identifi ed as QTLs with minor eff ect, one QTL was detected as QTL with G × E inter-action eff ect, and two were identifi ed as potential QTLs. Six QTLs were detected for the grand mean (GM) and one QTL, ppp11, was identifi ed for IPC2. Overall, 10 putative QTLs were identifi ed for this trait as well as two potential QTLs. The percent of the phenotypic variation explained by an individual QTL ranged from 6.07 to 16.97%.
Two of the six QTLs detected for the grand mean, ppp1.1 and ppp12.1, were identifi ed across years in the same location (Honam), indicating a stable but narrow adaptation to this location. These QTLs might be useful for a breeding
program that targeted the specifi c region around Honam. In particular, ppp1.1 has a high LOD value (5.24) and high R-square value (16.97%), so it would lend itself to selection using linked markers (i.e., RG140 and RM243) in a breeding program. ppp9.1 is likely to be less useful because it was not consistently detected across years or locations. When comparing QTL results across the Oryza genus, nine QTLs out of 12 were mapped onto similar locations in diff erent studies (Table 5), indicating that genes in similar loca-tions along the rice chromosomes may aff ect the same traits in diff erent genetic populations and diff erent environments.
Spikelets per Panicle Ten QTLs on six chromosomes were detected
for spikelets per panicle (SPP) (Table 4, Fig. 2 and 3). Four QTLs were identifi ed on chromosome 1, and three were detected in more than two environments and had a clear main eff ect. Two QTLs, spp4.1 and spp11.1, were detected for IPC2 and IPC1, respectively as QTLs with G × E interaction eff ect. Overall, nine putative QTLs were iden-tifi ed and one potential QTL was detected for spikelets per panicle. The phenotypic variation explained by indi-vidual QTLs ranged from 6.51 to 16.67%.
spp1.2 (LOD 7.47; 15.87% variation) and spp1.4 (LOD 5.64; 9.73% variation) could be useful in the Honam region, while spp1.1 (LOD 5.95; 13.13% variation) would be widely adapted for both environments. All of these QTLs were located on similar positions of chromosomes with other results (Table 5), especially spp1.1, spp1.4, spp2.1, spp4.2 and spp8.1, which are reported in two or more previous studies, showing strong agreements of putative QTLs (Brondani et al., 2002; Hittalmani et al., 2003; Mei et al., 2003; Thomson et al., 2003; Xiao et al., 1995,1998; Xiong et al., 1999; Zhuang et al., 1997, 2002).
1000-Grain Weight Eleven QTLs on eight chromosomes were associated with 1000-grain weight (TGW) (Table 4, Fig. 2 and Fig. 3). Of
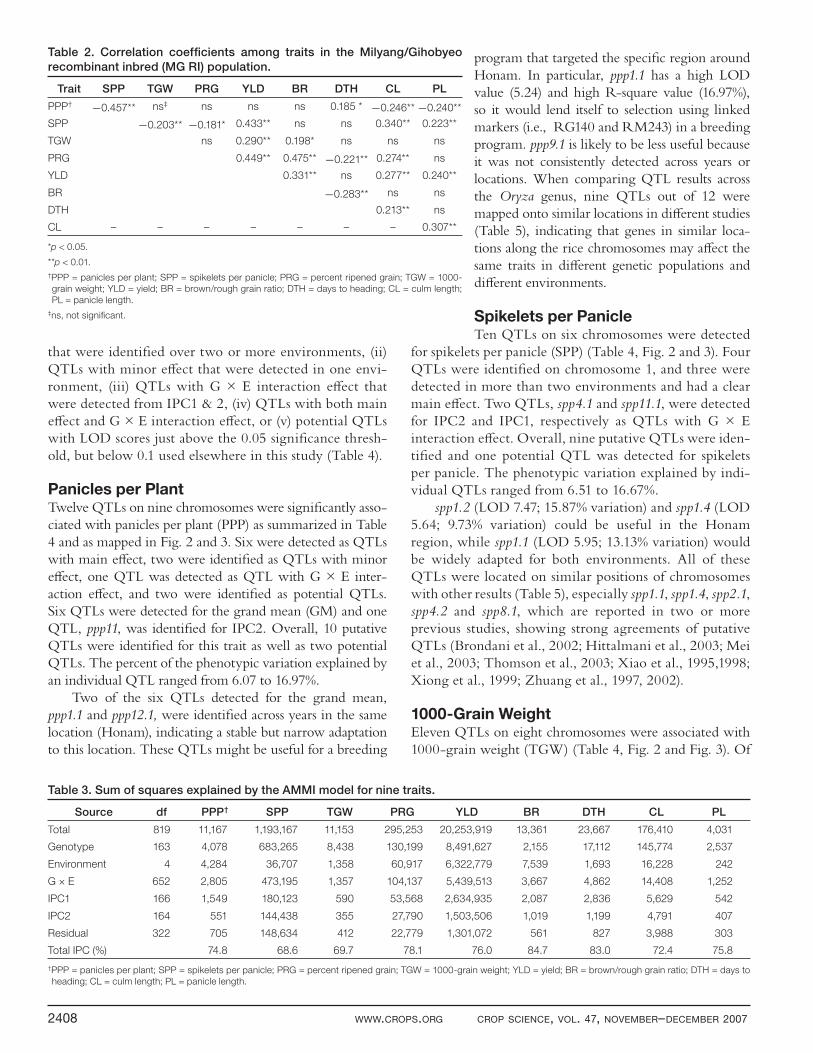
Table 2. Correlation coeffi cients among traits in the Milyang/Gihobyeo
recombinant inbred (MG RI) population.
Trait SPP TGW PRG YLD BR DTH CL PL
PPP† −0.457** ns‡ ns ns ns 0.185 * −0.246** −0.240**
SPP −0.203** −0.181* 0.433** ns ns 0.340** 0.223**
TGW ns 0.290** 0.198* ns ns ns
PRG 0.449** 0.475** −0.221** 0.274** ns
YLD 0.331** ns 0.277** 0.240**
BR −0.283** ns ns
DTH 0.213** ns
CL – – – – – – – 0.307**
*p < 0.05.
**p < 0.01.
†PPP = panicles per plant; SPP = spikelets per panicle; PRG = percent ripened grain; TGW = 1000-
grain weight; YLD = yield; BR = brown/rough grain ratio; DTH = days to heading; CL = culm length;
PL = panicle length.
‡ns, not signifi cant.
Table 3. Sum of squares explained by the AMMI model for nine traits.
Source df PPP† SPP TGW PRG YLD BR DTH CL PL
Total 819 11,167 1,193,167 11,153 295,253 20,253,919 13,361 23,667 176,410 4,031
Genotype 163 4,078 683,265 8,438 130,199 8,491,627 2,155 17,112 145,774 2,537
Environment 4 4,284 36,707 1,358 60,917 6,322,779 7,539 1,693 16,228 242
G × E 652 2,805 473,195 1,357 104,137 5,439,513 3,667 4,862 14,408 1,252
IPC1 166 1,549 180,123 590 53,568 2,634,935 2,087 2,836 5,629 542
IPC2 164 551 144,438 355 27,790 1,503,506 1,019 1,199 4,791 407
Residual 322 705 148,634 412 22,779 1,301,072 561 827 3,988 303
Total IPC (%) 74.8 68.6 69.7 78.1 76.0 84.7 83.0 72.4 75.8
†PPP = panicles per plant; SPP = spikelets per panicle; PRG = percent ripened grain; TGW = 1000-grain weight; YLD = yield; BR = brown/rough grain ratio; DTH = days to
heading; CL = culm length; PL = panicle length.

CROP SCIENCE, VOL. 47, NOVEMBER–DECEMBER 2007 WWW.CROPS.ORG 2409
Table 4. The quantitative trait loci (QTLs) identifi ed for yield, yield components and agricultural traits evaluated across
fi ve environments.†
QTL ChrMarkers
bordering QTL
IM‡ CIM‡Increased
EffectLocation, year,
and AMMI‡
QTL§ categoryLOD‡ R2 LOD R2
Panicles per plant: ppp 2.99 (2.68)† 3.08 (2.78)
ppp1.1 1 RG140-RM243 3.65 13.60 5.24 16.97 Gihobyeo H95,H96,H97,GM¶ A
ppp1.2 1 RG513-RG109 – – 4.25 9.61 Milyang23 Y96,Y97 A
ppp1.3 1 RM14-E26M47.M002P2 2.99 9.38 3.40 9.74 Milyang23 H96,(GM) A
ppp2.1 2 E25M48.246P2-E26M47.278P1 – – 3.38 7.33 Milyang23 H95 B
ppp3.1 3 G200-RZ745 – – (3.00) 7.57 Gihobyeo (GM) E
ppp3.2 3 E13M59.305P2-RG1356 – – 3.18 6.65 Milyang23 Y95,GM A
ppp4.1 4 E13M60.279P2-RM241 2.99 8.21 3.14 7.01 Milyang23 H95,Y96,(GM) A
ppp6.1 6 RCD592-RZ508 3.10 8.88 4.26 9.48 Gihobyeo Y97 B
ppp8.1 8 RZ70A-RG598 – – 3.65 9.90 Gihobyeo H95 B
ppp9.1 9 C397-E25M50.280P1 – – (2.83) 6.07 Gihobyeo (Y97) E
ppp11.1 11 RM20B-E23M50.M003P2 – – 3.58 8.65 Gihobyeo IPC2 C
ppp12.1 12 RG574-RM4A 3.43 10.20 4.52 10.12 Gihobyeo H95,H97,GM A
Spikelets per panicle: spp 3.02 (2.73) 3.12 (2.80)
spp1.1 1 RG1028-ESTI1 5.04 13.11 5.95 13.13 Milyang23 H96,Y96,Y97,GM A
spp1.2 1 RG140-RM243 8.42 23.7 7.47 15.87 Milyang23 H95,H97,GM A
spp1.3 1 RM35-RG811 4.40 12.38 7.13 16.67 Milyang23 Y97 B
spp1.4 1 RG109-RZ14 (2.84) 7.61 5.64 9.73 Gihobyeo H95,H96,(H97) A
spp2.1 2 RCD536-E25M48.116P1 – – 3.87 7.55 Milyang23 GM B
spp4.1 4 E23M50.154P2-E25M59.186P2 – – 3.65 14.23 Gihobyeo IPC2 C
spp4.2 4 RG214-RZ590 – – (3.00) 6.51 Gihobyeo (Y97) E
spp7.1 7 b-AMY-E25M60.219P2 – – 4.51 9.78 Gihobyeo GM B
spp8.1 8 E13M59.152P2-RZ323 3.33 8.87 3.12 6.81 Milyang23 Y97 B
spp11.1 11 RG1094-E25M59.124P1 3.86 10.77 4.24 9.79 Gihobyeo IPC1 C
1000-grain weight: tgw 2.99 (2.72) 3.14 (2.84)
tgw1.1 1 RZ744-RG375 – – 3.78 9.82 Gihobyeo IPC1 C
tgw2.1 2 RCD532-E13M59.M003P2 6.16 20.13 5.67 16.14 Gihobyeo H95,H96,H97,Y96,Y97,GM A
tgw2.2 2 E13M59.M003P2-G1184B 5.77 14.93 9.60 18.85 Gihobyeo H95,H97,Y96,Y97,GM A
tgw4.1 4 RG396B-RG449 – – 3.50 7.78 Gihobyeo IPC1 C
tgw5.1 5 E25M48.219P2-RCD511 (2.72) 7.39 3.83 7.51 Gihobyeo H95,H97 A
tgw6.1 6 RG264-RM3 4.82 12.61 8.68 18.08 Gihobyeo H95,H96,H97,Y96,Y97,GM A
tgw6.2 6 RZ682-RZ828 – – (3.03) 10.16 Gihobyeo (Y96) E
tgw8.1 8 RM52-RG885 4.50 14.98 5.88 15.10 Milyang23 H95,H96,H97,Y96,Y97,GM A
tgw10.1 10 RG752-E26M49.196P2 – – 3.81 5.81 Gihobyeo GM B
tgw12.1 12 RG574-RG98 – – 5.03 10.87 Milyang23 H96,Y97,GM A
tgw12.2 12 RZ257-Y6854 – – 3.68 6.54 Milyang23 H97 B
Percent ripened grain: prg 3.03 (2.78) 3.16 (2.84)
prg1.1 1 C161-RG1028 (2.91) 8.67 (3.07) 6.90 Gihobyeo (H95),(GM) E
prg1.2 1 RG140-RM243 6.06 15.97 8.58 18.48 Gihobyeo H96,H97 A
prg1.3 1 RM35-RG81A – – 3.33 7.65 Gihobyeo Y97 B
prg2.1 2 E24M50.276.P1-RG437A 3.77 11.75 3.73 9.36 Gihobyeo Y97 B
prg2.2 2 RG437A-E13M59.M003P2 4.82 14.21 5.59 14.21 Gihobyeo H95,Y96,Y97,GM,IPC1 D
prg9.1 9 RCD335-E25M50.M003P2 4.54 13.51 5.19 12.16 Milyang23 H96,H97,GM A
Yield: yld 3.08 (2.73) 3.15 (2.81)
yld1.1 1 RM5-RG462 (3.00) 8.10 3.66 8.41 Milyang23 H95,(H96),H97,GM A
yld6.1 6 RG213-E13M59.279P2 (2.86) 7.7 (2.81) 8.96 Gihobyeo (Y96),(GM) E
yld7.1 7 RG477A-RM2 4.19 11.14 4.65 9.93 Milyang23 IPC1 C
yld8.1 8 RM25-E13M59.152P2 – – (2.81) 15.94 Milyang23 (H96) E
yld9.1 9 RM201-E26M49.180P2 3.11 9.84 3.77 10.42 Milyang23 H95,(H96),H97 A
Brown/rough grain ratio: br 2.92 (2.63) 3.12 (2.83)

2410 WWW.CROPS.ORG CROP SCIENCE, VOL. 47, NOVEMBER–DECEMBER 2007
them six QTLs were detected in more than two environ-ments showing main eff ect, especially tgw2.1, tgw2.2, tgw6.1, and tgw8.1 were identifi ed in four or more environments with high LOD scores of 5.67–9.60. Two QTLs, tgw1.1 and tgw4.1 on chromosome 1 and 4, were detected for IPC1 as QTLs with G × E interaction eff ect. Overall, 10 putative QTLs were identifi ed and one potential QTL was detected for 1000-grain weight. The phenotypic variation explained by individual QTLs ranged from 5.81 to 18.85%.
Interestingly, 1000-grain weight was increased by the Japonica type parent, Gihobyeo, at 9 QTLs, while three QTLs, tgw8, tgw12.1, and tgw12.2 have increased eff ects from the maternal parent, Milyang23. tgw2.1, tgw2.2, tgw6.1, and tgw8.1 were identifi ed in four or more envi-ronments by both IM and CIM methods and have high LOD scores and R2 values, thus providing high confi -dence for MAS in breeding programs. The QTL map-ping information provides a starting point to clone genes underlying specifi c QTL. For example, the grain-weight
Table 4. Continued.
QTL ChrMarkers
bordering QTL
IM‡ CIM‡Increased
EffectLocation, year,
and AMMI‡
QTL§ categoryLOD‡ R2 LOD R2
br1.1 1 RZ513-RG317 (2.91) 7.86 4.37 9.90 Milyang23 H95,IPC1 D
br4.1 4 RZ740-E26M49.365P1 5.86 15.08 8.80 18.74 Milyang23 H95,Y97,GM A
br5.1 5 E26M48.219P2-RCD511 2.94 7.9 3.20 8.51 Gihobyeo H96 B
br6.1 6 E13M59.270P1-RG64 – – (2.87) 5.73 Gihobyeo (H95) E
br6.2 6 E13M60.136P2-RZ682 (2.72) 7.35 – – Milyang23 (H97),(GM) E
br7.1 7 E23M50.113P2-C213 3.03 8.71 3.25 7.32 Gihobyeo Y96 B
Days to heading: dth 2.93 (2.69) 3.18 (2.78)
dth1.1 1 RG541-RG109 3.15 9.76 3.42 7.22 Milyang23 (H95),H96,H97,Y96,Y97,GM A
dth2.1 2 RM259-C132 – – (2.91) 6.85 Milyang23 (IPC2) C
dth2.2 2 E25M60.168P1-E13M59.M003P2 3.87 12.97 4.46 6.63 Milyang23 IPC1 C
dth2.3 2 RZ318-E13M59.296P1 4.80 14.31 4.37 6.63 Milyang23 IPC1 C
dth3.1 3 RZ575-E13M59.305P2 6.88 18.05 14.63 26.24 Milyang23 H95,H96,H97,Y96,Y97,GM,IPC1 D
dth4.1 4 RZ879B-RZ569B – – (3.11) 6.42 Milyang23 (H95),(IPC1) E
dth6.1 6 E13M59.279P2-E23M50.208P1 5.69 16.78 13.98 30.20 Gihobyeo H95,H96,H97,(Y97),GM,IPC1 D
dth7.1 7 RG678-C285 4.49 11.8 10.37 17.16 Milyang23 H95,H96,H97,Y96,Y97,GM,IPC1 D
dth8.1 8 RM33-RG1 – – 4.38 7.13 Gihobyeo Y96,Y97,GM A
Culm length: cl 3.04 (2.78) 3.12 (2.87)
cl1.1 1 RZ317-RZ14 31.28 58.79 40.62 61.07 Gihobyeo H95,H96,H97,Y96,Y97,GM A
cl4.1 4 RG939-RZ590 – – 3.66 10.88 Gihobyeo IPC2 C
cl6.1 6 E24M50.331P2-RZ682 – – 9.58 9.61 Milyang23 H95,H96,H97,Y96,Y97,GM A
cl8.1 8 RG20-RG885 – – 4.49 4.58 Milyang23 H95,H96,H97,GM A
Panicle length: pl 3.01 (2.68) 3.17 (2.78)
pl1.1 1 RG303-RG519 (2.86) 10.05 4.15 11.14 Milyang23 H96 B
pl1.2 1 RG317-RG109 – – 5.76 15.67 Gihobyeo Y97 B
pl2.1 2 RZ913-RM48 4.12 14.02 – – Milyang23 H97 B
pl3.1 3 RM218-E25M48.237P2 3.35 9.63 7.82 13.65 Milyang23 H95,H96,H97,Y96,Y97,GM A
pl4.1 4 RG329-RG476 – – 3.38 7.52 Gihobyeo Y96 B
pl6.1 6 RG716-E24M50.331P2 4.45 12.31 6.33 15.54 Milyang23 H96,Y96,Y97,GM A
pl7.1 7 E25M59.423P2-RG678 – – 3.97 10.55 Milyang23 Y97,GM A
pl7.2 7 E25M60.219P2-C507 – – (3.12) 7.69 Gihobyeo (IPC1) C
pl8.1 8 RM25-E23M50.163P1 3.35 8.92 4.07 9.05 Gihobyeo IPC2 C
pl8.2 8 G1073A-E13M59.172P1 3.17 9.50 4.05 8.69 Gihobyeo H95,H97 A
pl8.3 8 RM80-RZ70A – – 3.24 6.91 Gihobyeo H96 B
pl12.1 12 RG235-RG574 4.44 15.29 3.88 10.01 Milyang23 H97,GM,IPC1 D
†The empirical signifi cance thresholds for declaring putative QTLs were determined for each trait based on 1000 permutations for both the p = 0.05 and p = 0.1 signifi cance
levels. QTLs that were between p < 0.05– 0.1 signifi cance threshold for two or more environments are put in parenthesis.
‡IM, interval mapping; CIM, composite interval mapping; AMMI, additive main effects and multiplicative interaction; LOD, log of the odds.
§QTLs were categorized as (A) QTLs with main effect that were identifi ed over two or more environments, (B) QTLs with minor effect that were detected in one environment,
(C) QTLs with G × E interaction effect that were detected from IPC1 & 2, (D) QTLs with both main effect and G × E interaction effect, or (E) potential QTLs with LOD scores
just above the 0.05 signifi cance threshold, but below 0.1 used elsewhere in this study.
¶GM = grand mean, the mean value over all genotypes and environments, unweighted by number of replications.
CROP SCIENCE, VOL. 47, NOVEMBER–DECEMBER 2007 WWW.CROPS.ORG 2411
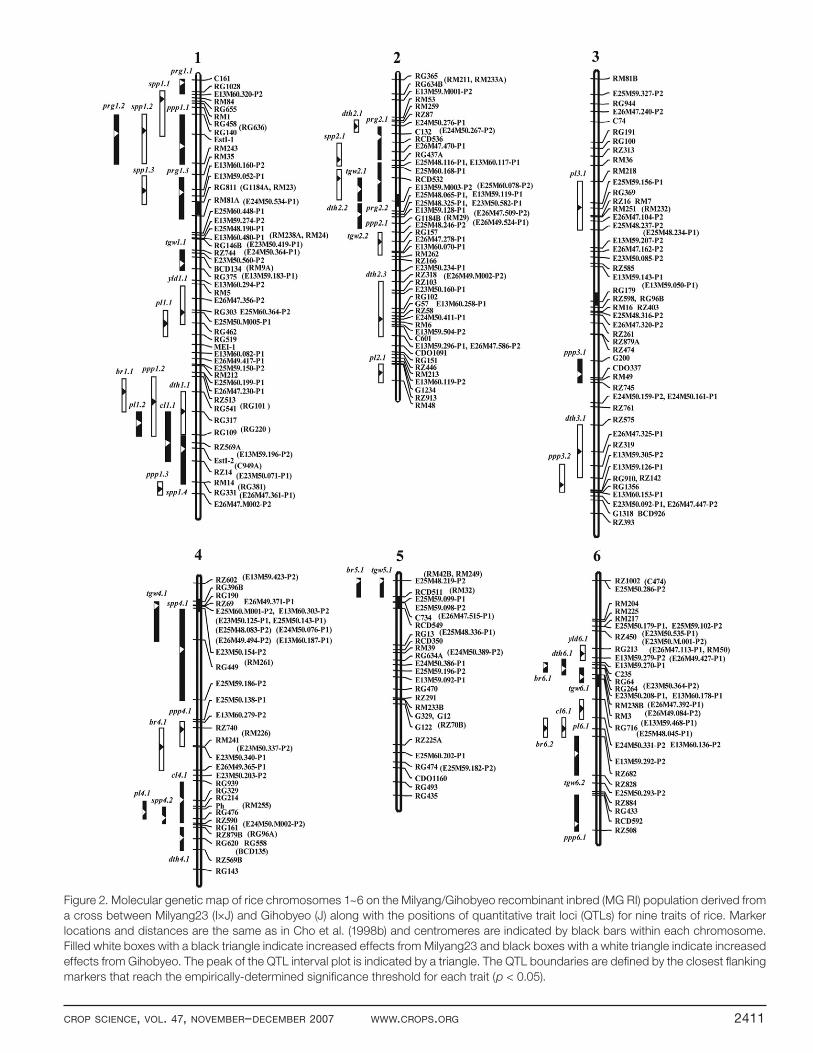
Figure 2. Molecular genetic map of rice chromosomes 1~6 on the Milyang/Gihobyeo recombinant inbred (MG RI) population derived from
a cross between Milyang23 (I×J) and Gihobyeo (J) along with the positions of quantitative trait loci (QTLs) for nine traits of rice. Marker
locations and distances are the same as in Cho et al. (1998b) and centromeres are indicated by black bars within each chromosome.
Filled white boxes with a black triangle indicate increased effects from Milyang23 and black boxes with a white triangle indicate increased
effects from Gihobyeo. The peak of the QTL interval plot is indicated by a triangle. The QTL boundaries are defi ned by the closest fl anking
markers that reach the empirically-determined signifi cance threshold for each trait (p < 0.05).
2412 WWW.CROPS.ORG CROP SCIENCE, VOL. 47, NOVEMBER–DECEMBER 2007
Figure 3. Molecular genetic map of rice chromosomes 7~12 on the Milyang/Gihobyeo recombinant inbred (MG RI) population derived
from a cross between Milyang23 (IxJ) and Gihobyeo (J) along with the positions of quantitative trait loci (QTLs) for nine traits of rice.

CROP SCIENCE, VOL. 47, NOVEMBER–DECEMBER 2007 WWW.CROPS.ORG 2413
Table 5. Comparison of quantitative trait locus (QTL) results across the Oryza genus and agronomically important traits that
have been cloned.
QT L Chr Markers bordering QTL Previous studies shared common regions
Panicles per plant: ppp
ppp1.1 1 RG140-RM243 tp1 (Li et al. 2000), NP-1 (Zhuang et al., 2002)
ppp1.2 1 RG513-RG109 tp1 (Xiong et al. 1999)
ppp1.3 1 RM14-E26M47.M002P2 qNOP1–1 (Hittalmani et al. 2003), ppl1.1 (Septiningsih et al. 2003), PNF(DH)1, PNP(DH)1
(Liao et al. 2001)
ppp2.1 2 E25M48.246P2-E26M47.278P1 np2 (Zhuang et al. 1997), NP-2–2 (Zhuang et al., 2002)
ppp3.1 3 G200-RZ745 NP-3–2 (Zhuang et al., 2002 epist)
ppp3.2 3 E13M59.305P2-RG1356 qNOP3–1 (Hittalmani et al. 2003)
ppp4.1 4 E13M60.279P2-RM241 qNOP4–1 (Hittalmani et al. 2003), tp4 (Xiong et al. 1999)
ppp6.1 6 RCD592-RZ508
ppp8.1 8 RZ70A-RG598
ppp9.1 9 C397-E25M50.280P1
ppp11.1 11 RM20B-E23M50.M003P2 PNR1 (Brondani et al. 2002)
ppp12.1 12 RG574-RM4A PNP(DH)12 (Liao et al. 2001)
Spikelets per panicle: spp
spp1.1 1 RG1028-ESTI1 SPP1 (Brondani et al. 2002), qTNSP-1–1 (Zhuang et al. 2002), qNOS1–1 (Hittalmani et al. 2003), spp1.2
(Xiao et al. 1998)
spp1.2 1 RG140-RM243 sp1 (Xiong et al. 1999)
spp1.3 1 RM35-RG811 gpp1.1 (Thomson et al. 2003)
spp1.4 1 RG109-RZ14 spp1.1 (Xiao et al. 1998), QSn1 (Mei et al. 2003)
spp2.1 2 RCD536-E25M48.116P1 TNSP-2–1 (Zhuang et al. 2002)
spp4.1 4 E23M50.154P2-E25M59.186P2 qNOS4–1 (Hittalmani et al. 2003)
spp4.2 4 RG214-RZ590 SPP1, SPP2 (Brondani et al. 2002), tns4 (Zhuang et al. 1997), qNOS4–4 (Hittalmani et al. 2003), gpp4
(Xiao et al. 1995), gpp4.1 (Thomson et al. 2003)
spp7.1 7 b-AMY-E25M60.219P2 qNOS7–1 (Hittalmani et al. 2003)
spp8.1 8 E13M59.152P2-RZ323 tns8 (Zhuang et al. 1997), sp8 (Xiong et al. 1999)
spp11.1 11 RG1094-E25M59.124P1 QSn11 (Mei et al. 2003)
1000-grain weight: tgw
tgw1.1 1 RZ744-RG375
tgw2.1 2 RCD532-E13M59.M003P2
tgw2.2 2 E13M59.M003P2-G1184B
tgw4.1 4 RG396B-RG449 gw4.1 (Xiao et al. 1998)
tgw5.1 5 E25M48.219P2-RCD511 gw5.1 (Xiao et al. 1998)
tgw6.1 6 RG264-RM3 qTGWT-6 (Zhuang et al. 2002)
tgw6.2 6 RZ682-RZ828
tgw8.1 8 RM52-RG885
tgw10.1 10 RG752-E26M49.196P2 qTGW10–3 (Hittalmani et al. 2003), tgwt10 (Zhuang et al. 1997), qTGWT-10 (Zhuang et al. 2002)
tgw12.1 12 RG574-RG98
tgw12.2 12 RZ257-Y6854
Percent ripened grain: prg
prg1.1 1 C161-RG1028
prg1.2 1 RG140-RM243
prg1.3 1 RM35-RG81A
prg2.1 2 E24M50.276.P1-RG437A sf2 (Zhuang et al. 1997)
prg2.2 2 RG437A-E13M59.M003P2 PFG1 (Brondani et al. 2002)
prg9.1 9 RCD335-E25M50.M003P2
Yield: yld
yld1.1 1 RM5-RG462 yld1.1 (Xiao et al. 1998), yld1.2 (Septiningsih et al. 2003)
yld6.1 6 RG213-E13M59.279P2 yd6 (Li et al. 2000)
yld7.1 7 RG477A-RM2 yd7a (Li et al. 2000), GYPa1, GYPa2 (Brondani et al. 2002)
yld8.1 8 RM25-E13M59.152P2 gy8 (Xiao et al. 1995), yld8.1 (Xiao et al. 1998), yd8 (Li et al. 2000), yld6.1 (Thomson et al. 2003)
yld9.1 9 RM201-E26M49.180P2 qYLD9–1 (Hittalmani et al. 2003), yld9.1 (Thomson et al. 2003)

2414 WWW.CROPS.ORG CROP SCIENCE, VOL. 47, NOVEMBER–DECEMBER 2007
QTL, Xie et al. (2006) fi ne mapped a grain weight QTL on chromosome 8 and narrowed the region containing the gene(s) to 306 kb (~1.2 cM) and Li et al. (2004) fi ne mapped a grain weight QTL on chromosome 3 to 94 kb and the gene underlying this QTL was later cloned by Fan et al. (2006).
Percent Ripened Grain Six QTLs on three chromosomes were identifi ed for per-cent ripened grain (PRG) (Table 4, Fig. 2 and Fig. 3). Three were detected in more than two environments showing main eff ect, but prg2.2 was detected for three environ-ments, grand mean, and IPC1 as QTLs with main and G × E interaction eff ect. Overall, fi ve putative QTLs were iden-tifi ed and one potential QTL was detected for PRG. The phenotypic variation explained by individual QTLs ranged from 6.90 to 18.48%. prg1.2 (8.58), prg2.2 (5.59), and prg9.1 (5.19) had very high LOD scores with high levels of percent variation ranging from 12.16 to 18.48.
Yield Five QTLs on fi ve chromosomes were associated with grain yield (YLD) (Table 4, Fig. 2 and 3). Two were detected in more than two environments as QTLs with main eff ect. Locus, yld1.1 between RM5 and RG462 showed a good agreement with results from a wild rice relative, Oryza rufi -pogon (Xiao et al., 1998). In our present results, Milyang23 alleles were associated with YLD increases at four of these loci, while the Gihobyeo allele, yld6.1, was linked with a YLD decrease. Locus, yld7.1 was identifi ed for IPC1 show-ing G × E interaction eff ect. Two potential QTLs, yld6.1 and yld8.1, were detected for YLD. The positions of four QTLs on chromosome 1, 6, 7, and 9, yld1.1, yld6.1, yld7.1 and yld9.1, coincide with other reports (Brondani et al., 2002; Hittalmani et al., 2003; Li et al., 2000; Septiningsih et al., 2003; Thomson et al., 2003; Xiao et al., 1998; Xiao et al., 1995) (Table 5). The phenotypic variation explained by individual QTLs ranged from 8.41 to 15.94%.
A QTL on the short arm of rice chromosome 1 that increases grain productivity in rice was recently cloned by
QT L Chr Markers bordering QTL Previous studies shared common regions
Days to heading: dth
dth1.1 1 RG541-RG109 dth1.2 (Thomson et al. 2003)
dth2.1 2 RM259-C132 dth2.1 (Septiningsih et al. 2003)
dth2.2 2 E25M60.168P1-E13M59.M003P2
dth2.3 2 RZ318-E13M59.296P1 dth2.1 (Thomson et al. 2003), dth2.2 (Septiningsih et al. 2003)
dth3.1 3 RZ575-E13M59.305P2 Hd-C1488 (Lin et al., 1998), dth3.4 (Thomson et al. 2003), Hd6(Cloned QTL by forward genetics,
Takahashi et al. 2001)
dth4.1 4 RZ879B-RZ569B Hd-R2373 (Lin et al., 1998), QHd4 (Mei et al. 2003)
dth6.1 6 E13M59.279P2-E23M50.208P1 Hd-1 (Yano et al. 1997), dth6.1 (Xiao et al. 1998), Hd-R2171 (Lin et al., 1998), hd6 (Xiong et al. 1999),
Hd1 (Lin et al., 2000), Dtf6 (Maheswaran et al. 2000) Hd1(Cloned QTL by forward genetics, Yano et al.
2000), Hd3a(Cloned QTL by forward genetics, Kojima et al. 2002)
dth7.1 7 RG678-C285Hd-4(Yano et al. 1997), dth7.1 (Moncada et al. 2001), dth7.1 (Septiningsih et al. 2003), dth7.1 (Thomson
et al. 2003)
dth8.1 8 RM33-RG1 Dtf8b (Maheswaran et al. 2000)
Culm length: cl
cl1.1 1 RZ317-RZ14 sd-1 (Cho et al. 1994), ph1 (Xiong et al. 1999), ph1.1 (Moncada et al. 2001), ph1.2 (Thomson et al.
2003), (Septiningsih et al. 2003), qPHT1–1 (Hittalmani et al. 2003) sd1(Cloned by forward genetics,
Sasaki et al. 2002; Ashikari et al. 2002; Monna et al. 2002; Spielmeyer et al. 2002)
cl4.1 4 RG939-RZ590 ph4.1 (Moncada et al. 2001), QPh4 (Mei et al. 2003)
cl6.1 6 E24M50.331P2-RZ682 ph6.1 (Thomson et al. 2003)
cl8.1 8 RG20-RG885 pl8 (Xiao et al. 1995), ph8 (Xiong et al. 1999)
Panicle length: pl
pl1.1 1 RG303-RG519
pl1.2 1 RG317-RG109 pl1 (Xiong et al. 1999), pl1.1 (Septiningsih et al. 2003), pl1.1 (Thomson et al. 2003)
pl2.1 2 RZ913-RM48 QPl2 (Mei et al. 2003), pl2.1 (Thomson et al. 2003)
pl3.1 3 RM218-E25M48.237P2 pl3.1 (Septiningsih et al. 2003), pl3b (Zhuang et al. 1997)
pl4.1 4 RG329-RG476
pl6.1 6 RG716-E24M50.331P2
pl7.1 7 E25M59.423P2-RG678
pl7.2 7 E25M60.219P2-C507 pl7 (Xiong et al. 1999)
pl8.1 8 RM25-E23M50.163P1 QPl8 (Mei et al. 2003), PLH1, PLH2 (Brondani et al. 2002)
pl8.2 8 G1073A-E13M59.172P1 pl8 (Zhuang et al. 1997)
pl8.3 8 RM80-RZ70A pl8.1 (Xiao et al. 1998)
pl12.1 12 RG235-RG574
Table 5. Continued.

CROP SCIENCE, VOL. 47, NOVEMBER–DECEMBER 2007 WWW.CROPS.ORG 2415
Ashikari et al. (2005) and shown to be cytokinin oxidase/dehydrogenase (OsCKX2), an enzyme that degrades the phytohormone cytokinin. This gene does not map to any of the yield QTL identifi ed in the present study.
Brown/Rough Grain Ratio Six QTLs on fi ve chromosomes were identifi ed for brown/rough grain ratio (BR) (Table 4, Fig. 2 and 3). br4.1 was detected in two environments as a QTL with main eff ect and br1.1 was identifi ed for IPC1 showing G × E interac-tion eff ect. Two potential QTLs, br6.1 and br6.2, were detected for BR. The phenotypic variation explained by individual QTLs ranged from 5.73to 18.74%.
Days to HeadingNine QTLs on seven chromosomes showed signifi cant association with days to heading (DTH) (Table 4, Fig. 2 and 3). Five QTLs, dth1.1, dth3.1, dth6.1, dth7.1, and dth8.1, were identifi ed in two or more environments, especially dth1.1, dth3.1, dth6.1, and dth7.1 were identifi ed in four or more environments with high LOD scores of 10.37 to 14.63 (except dth1.1– 3.42). But dth3.1, dth6.1, and dth7.1 were also detected for grand mean and IPC1 as QTLs with main eff ect and G × E interaction eff ect, having relatively high phenotypic variations ranged from 17.16 to 30.20%. The QTLs, dth3.1, dth6.1, and dth7.1, were mapped in a similar position in several diff erent studies (Hittalmani et al., 2003; Lin et al., 1998, 2000; Maheswaran et al., 2000; Moncada et al., 2001; Septiningsih et al., 2003; Thomson et al., 2003; Xiao et al., 1998; Xiong et al., 1999; Yano et al., 1997) (Table 5), thus showing wide adaptation across vari-ous populations and environments. The markers bordering the QTLs are likely to be useful for selecting favorable lines by MAS. The overall phenotypic variation explained by individual QTLs ranged from 6.42 to 30.20%. Gihobyeo alleles dth6.1 and dth9.1 were associated with decreases in days to heading by 5.5 and 1.8 d, respectively.
Quantitative trait loci that have high phenotypic main eff ects can be effi ciently targeted based on fi ne mapping with nearly isogenic lines. Recently, QTLs related to fl owering time have been targeted for cloning. Three genes, Hd6, Hd1, and Hd3a on chromosomes 3 and 6, that are involved in the control of fl owering time of rice in response to changes in daylength have been identifi ed by map-based cloning (Kojima et al., 2002; Takahashi et al., 2001; Yano, 2001).
Culm Length Four QTLs on four chromosomes were identifi ed for culm length (CL) (Table 4, Fig. 2 and 3). Of which three, cl1.1, cl7.1, and cl8.1, were detected in three or more environments as QTLs with main eff ect and cl4.1 was identifi ed for IPC2 as a QTL with G × E interaction eff ect. The phenotypic variation explained by individual QTLs ranged from 4.58 to 61.07%. Two QTLs in particular, cl1.1 and cl6.1, were signifi -
cant across fi ve environments, indicating that closely linked markers are likely to be useful for MAS in breeding for plant height. cl1.1 with a LOD of 40.62 explained 61.07% the phe-notypic variation, the highest for the 75 QTLs detected in this study, thus behaving almost like a single genic eff ect. The chromosomal position of this QTL coincides with the major semi-dwarf gene sd-1, associated with the green revo-lution (Cho et al., 1994; Ashikari et al., 2002; Monna et al., 2002; Sasaki et al., 2002; Spielmeyer et al., 2002) (Table 5).
Panicle LengthTwelve QTLs were signifi cantly associated with panicle length (PL) (Table 4, Fig. 2 and 3). Of which only three, pl3.1, pl6.1, and pl8.2, were detected in two or more envi-ronments as QTLs with main eff ect, especially pl3.1 was identifi ed in fi ve environments and the grand mean, show-ing that the markers bordering it are likely to be useful for panicle length selection. pl7.2 and pl8.1 were identifi ed for IPC1 and IPC2, respectively as QTLs with G × E interac-tion eff ect. However, pl12.1 was detected for both grand mean and IPC1 as a QTL with main eff ect and G × E interaction eff ect. The phenotypic variation explained by individual QTLs ranged from 6.91 to 15.67%.
Implications for Plant BreedersThe ability to use markers associated with QTLs of inter-est for MAS or map-based cloning requires that QTLs showing genotypic main eff ects can be discriminated from QTLs with a sizable G × E interaction. This study identifi ed many QTLs that are stable across environments in the two diff erent southern agricultural regions in Korea and evaluated the percent of variance explained by each so that markers closely associated with useful alleles could be used to trace the inheritance of specifi c chromosomal segments in a segregating population.
Nine QTLs, tgw2.1, tgw6.1, and tgw8.1 for TGW; dth1.1, dth3.1, and dth7.1 for DTH; cl1.1 and cl6.1 for CL; and pl3.1 for PL, were signifi cant in all years in both environments as QTLs with main eff ect and were also detected for the grand mean. Markers delineating these QTLs are likely to be very useful for practical plant breeding using MAS.
The Korean peninsula is a temperate rice growing region. There are two major areas where rice is intensively culti-vated, one in the southwestern part (Iksan, 36°N,126.5°E) and one in the southeastern part (Milyang, 35 oN,128.5 oE). Information about performance-enhancing QTL from these regions off ers breeders a useful set of markers for developing new varieties that can be widely adapted in these agricultural areas. Other nations that share similar quality and agronomic concerns may also make use of this information to facili-tate breeding of improved varieties. Extended analysis of the RILs used in this study may off er additional insights into the stability of QTLs in new environments and help increase the effi ciency of variety development.

2416 WWW.CROPS.ORG CROP SCIENCE, VOL. 47, NOVEMBER–DECEMBER 2007
This information can also be used as a starting point for positional cloning aimed at isolating genes of interest. As the genes underlying the QTLs are identifi ed, and the interac-tions between genes and their environments (G × E) as well as among genes within a genotype (G × G) are better under-stood, more accurate predictions about the genotype–phe-notype relationship will enable plant breeders to make more informed decisions about useful parental combinations and more effi cient selection among recombinants.
AcknowledgmentsWe would like to thank Dr. Y. Xu and the anonymous reviewers
for critical reviews of this manuscript and Lois Swales for help with
formatting. We acknowledge the fi nancial support from the Rural
Development Administration and the Rockefeller Foundation’s
Biotechnology Career Fellowship (RF95001, No. 342) for Y.G. Cho’s
work at Cornell, and NSF Grant No. DBI-032/685.
ReferencesAshikari, M., H. Sakakibara, L. Shaoyang, T. Yamamoto, T.
Takashi, A. Nishimura, E.R. Angeles, Q. Qian, H. Kitano,
and M. Matsuoka. 2005. Cytokinin oxidase regulates rice
grain production. Science 309:741–745.
Ashikari, M., A. Sasaki, M. Ueguchi-Tanaka, H. Itoh, A. Nishimura,
S. Datta, K. Ishiyama, T. Saito, M. Kobayashi, G.S. Khush, H.
Kitano, and M. Matsuoka. 2002. Loss-of-function of a rice gib-
berellin biosynthesis gene, GA20 oxidase (GA20 ox-2), led to the
rice “green revolution.” Breed. Sci. 52:143–150.
Austin, D.F., and M. Lee. 1998. Detection of quantitative trait
loci for grain yield and yield components in maize across
generations in stress and nonstress environments. Crop Sci.
38:1296–1308.
Basten, C.J., B.S. Weir, and Z.B. Zeng. 1997. QTL cartographer:
A reference manual and tutorial for QTL mapping. Dep. of
Statistics, North Carolina State Univ., Raleigh.
Bradu, D., and K.R. Gabriel. 1978. The biplot as a diagnostic tool
for models of two-way tables. Technometrics 20:47–68.
Brondani, C., N. Rangel, V. Brondani, and E. Ferreira. 2002.
QTL mapping and introgression of yield-related traits from
Oryza glumaepatula to cultivated rice (Oryza sativa) using mic-
rosatellite markers. Theor. Appl. Genet. 104:1192–1203.
Cho, Y.G., M.Y. Eun, S.R. McCouch, and Y.A. Chae. 1994. The
semidwarf gene, sd-1, of rice (Oryza sativa L.): Molecular mapping
and marker-assisted selection. Theor. Appl. Genet. 89:54–59.
Cho, Y.G., M.R. Kang, Y.W. Kim, Y.T. Lee, M.Y. Eun, and T.Y.
Chung. 1998a. Development of molecular map using recombi-
nant inbred population derived from a cross between Milyang23
and Gihobyeo in rice: I. Constructions of molecular framework
map with RFLP markers. Korean J. Plant Breed. 30:289–297.
Cho, Y.G., S. McCouch, M. Kuiper, M.R. Kang, J. Pot, J. Groenen,
and M.Y. Eun. 1998b. Integrated map of AFLP, SSLP, and
RFLP markers using a recombinant inbred population of rice
(Oryza sativa L.). Theor. Appl. Genet. 97:370–380.
Churchill, G.A., and R.W. Doerge. 1994. Empirical threshold val-
ues for quantitative trait mapping. Genetics 138:963–971.
Cornelius, P.L. 1993. Statistical tests and retention terms in the
additive main eff ects and multiplicative interaction model for
cultivar trials. Crop Sci. 33:1186–1193.
Crossa, J. 1990. Statistical analysis of multi-location trials. Adv.
Agron. 44:55–85.
Crossa, J., M. Vargas, F.A. Van Eeuwijk, C. Jiang, G.O. Edmeades,
and D. Hoisington. 1999. Interpreting genotype × environment
interaction in tropical maize using linked molecular markers and
environmental covariables. Theor. Appl. Genet. 99:611–625.
Ebdon, J.S., and H.G. Gauch. 2002. Additive main eff ect and mul-
tiplicative interaction analysis of national turfgrass performance
trials: II. Cultivar recommendation. Crop Sci. 42:497–506.
Fan, C., Y. Xing, H.M.T. Lu, B. Han, C. Xu, X. Li, and Q. Zhang.
2006. GS3, a major QTL for grain length and weight and minor
QTL for grain width and thickness in rice, encodes a putative
transmembrane protein. Theor. Appl. Genet. 112:1164–1171.
Gauch, H.G. 1992. Statistical analysis of regional yield trials:
AMMI analysis of factorial designs. Elsevier, Amsterdam,
the Netherlands.
Gauch, H.G. 2002. MATMODEL version 2.2: AMMI and related
analyses for two-way data matrices. Microcomputer Power,
Ithaca, NY.
Gauch, H.G. 2006a. Statistical analysis of yield trial by AMMI and
GGE. Crop Sci. 46:1488–1500.
Gauch, H.G. 2006b. Winning the accuracy game. Am. Scientist
94:133–141.
Gauch, H.G., and R.W. Zobel. 1996. AMMI analysis of yield tri-
als. p. 85–122. In M.S. Kang and H.G. Gauch (ed.) Genotype
by environment interaction. CRC Press, Boca Raton, FL.
Gauch, H.G., and R.W. Zobel. 1997. Identifying mega-environ-
ments and targeting genotypes. Crop Sci. 37:311–326.
Gollob, H.F. 1968. A statistical model which combines features
of factor analytic and analysis of variance techniques. Psy-
chometrika 33:73–115.
Hayes, P.M., B.H. Liu, S.J. Knapp, F. Chen, and B. Jones. 1993.
Quantitative trait loci eff ects and environmental interaction
in a sample of North American barley germplasm. Theor.
Appl. Genet. 87:392–401.
Hittalmani, S., N. Huang, B. Courtois, R. Venuprasad, H.E.
Shashidhar, J.Y. Zhuang, K.L. Zheng, G.F. Liu, G.C. Wang,
J.S. Sidhu, S. Srivantaneeyakul, V.P. Singh, P.G. Bagali, H.C.
Prasanna, G. Mclaren, and G.S. Khush. 2003. Identifi cation
of QTL for growth- and grain yield-related traits in rice across
nine locations of Asia. Theor. Appl. Genet. 107:679–690.
Jiang, C., G.O. Edmeades, I. Armstead, H.R. Laffi te, and M.D.
Hayward. 1999. Genetic analysis of adaptation diff erence
between highland and lowland tropical maize using molecu-
lar markers. Theor. Appl. Genet. 99:1106–1119.
Kang, H.J., Y.G. Cho, Y.T. Lee, Y.D. Kim, M.Y. Eun, and J.U.
Shim. 1998. QTL mapping of genes conferring days to head-
ing, culm length, and panicle length based on molecular map-
ping map of rice. RDA J. Crop Sci. 40:55–61.
Kang, M.S. 1996. Using genotype by environment interaction for
crop cultivar development. Adv. Agron. 62:199–252.
Kempton, R.A. 1984. The use of biplots in interpreting variety by
environment interactions. J. Agric. Sci. 103:123–135.
Kojima, S., Y. Takahashi, Y. Kobayashi, L. Monna, T. Sasaki, T. Araki,
and M. Yano. 2002. Hd3a, a rice ortholog of the Arabidopsis FT
gene, promotes transition to fl owering downstream of Hd1 under
short-day conditions. Plant Cell Physiol. 43:1096–1105.
Li, J., M. Thomson, and S. McCouch. 2004. Fine mapping of a
grain-weight quantitative trait locus in the pericentromeric
region of rice chromosome 3. Genetics 168:2187–2195.
Li, J.X., S.B. Yu, C.G. Xu, Y.F. Tan, Y.J. Gao, X.H. Li, and Q. Zhang.
2000. Analyzing quantitative trait loci for yield using a vegeta-
tively replicated F2 population from a cross between the parents
of an elite rice hybrid. Theor. Appl. Genet. 101:248–254.

CROP SCIENCE, VOL. 47, NOVEMBER–DECEMBER 2007 WWW.CROPS.ORG 2417
Li, Z.K., S.B. Yu, H.R. Lafi tte, N. Huang, B. Courtois, S. Hit-
talmani, C.H.M. Vijayakumar, G.F. Liu, G.C. Wang, H.E.
Shashidhar, J.Y. Zhuang, K.L. Zheng, V.P. Singh, J.S. Sidhu,
S. Srivantaneeyakul, and G.S. Khush. 2003. QTL × environ-
ment interactions in rice. I. Heading date and plant height.
Theor. Appl. Genet. 108:141–153.
Liao, C.Y., P. Wu, B. Hu, and K.K. Yi. 2001. Eff ects of genetic back-
ground and environment on QTLs and epistasis for rice (Oryza
sativa L.) panicle number. Theor. Appl. Genet. 103:104–111.
Lin, H.X., T. Yamamoto, T. Sasaki, and M. Yano. 2000. Charac-
terization and detection of epistatic interactions of 3 QTLs,
Hd1, Hd2, and Hd3, controlling heading date in rice using
nearly isogenic lines. Theor. Appl. Genet. 101:1021–1028.
Lin, S.Y., T. Sasaki, and M. Yano. 1998. Mapping quantitative
trait loci controlling seed dormancy and heading date in rice,
Oryza sativa L., using backcross inbred lines. Theor. Appl.
Genet. 96:997–1003.
Lu, C.L., L. Shen, Z. Tan, Y. Xu, and P. He. 1996. Compara-
tive mapping of QTLs for agronomy traits of rice across envi-
ronments using a doubled-haploid population. Theor. Appl.
Genet. 93:1211–1217.
Maheswaran, M., N. Huang, S. Sreerangasamy, and S. McCouch.
2000. Mapping quantitative trait loci associated with days to
fl owering and photoperiod sensitivity in rice (Oryza sativa L.).
Mol. Breed. 6:145–155.
Mandel, J. 1971. A new analysis of variance model for non-additive
data. Technometrics 13:1–18.
McCouch, S.R., Y.G. Cho, M. Yano, E.M. Paul, M. Blinstrub, H.
Morishima, and T. Kinoshita. 1997. Report on QTL nomen-
clature. Rice Genet. Newsl. 14:11–13.
Mei, H.W., L.J. Luo, C.S. Ying, Y.P. Wang, X.Q. Yu, L.B. Guo,
A.H. Paterson, and Z.K. Li. 2003. Gene action of QTLs
aff ecting several agronomic traits resolved in a recombinant
inbred rice population and two testcross populations. Theor.
Appl. Genet. 107:89–101.
Moncada, P., C.P. Martinez, J. Borrero, M. Chatel, H. Gauch, Jr.,
E. Guimaraes, J. Tohme, and S.-R. McCouch. 2001. Quan-
titative trait loci for yield and yield components in an Oryza
sativa × Oryza rufi pogon BC2F2 population evaluated in an
upland environment. Theor. Appl. Genet. 102:41–52.
Monna, L., X. Lin, S. Kojima, T. Sasaki, and M. Yano. 2002.
Genetic dissection of a genomic region for a quantitative trait
locus, Hd3, into two loci, Hd3a and Hd3b, controlling head-
ing date in rice. Theor. Appl. Genet. 104:772–778.
Nelson, J.C. 1997. QGENE: Software for marker-based genomic
analysis and breeding. Mol. Breed. 3:239–245.
Romagosa, I., and P.N. Fox. 1993. Genotype × environmental
interaction and adaptation. p. 373–390. In M.D Hayward et
al. (ed.) Plant breeding: Principles and prospects. Chapman
and Hall, London.
Romagosa, I., S.E. Ullrich, F. Han, and P.M. Hays. 1996. Use
of the additive main eff ects and multiplicative interaction
model in QTL mapping for adaptation in barley. Theor. Appl.
Genet. 93:30–37.
Sasaki, A., M. Ashikari, M. Ueguchi-Tanaka, H. Itoh, A.
Nishimura, D. Swapan, K. Ishiyama, T. Saito, M. Kobayashi,
G.S. Khush, H. Kitano, and M. Matsuoka. 2002. A mutant
gibberellin-synthesis gene in rice. Nature 416:701–702.
Septiningsih, E.M., J. Prasetiyono, E. Lubis, T.H. Tai, T. Tjubaryat,
S. Moeljopawiro, and S.R. McCouch. 2003. Identifi cation of
quantitative trait loci for yield and yield components in an
advanced backcross population derived from the Oryza sativa
variety IR64 and the wild relative O. rufi pogon. Theor. Appl.
Genet. 107:1419–1432.
Spielmeyer, W., M.H. Ellis, and P.M. Chandler. 2002. Semidwarf
(sd-1), “green revolution” rice, contains a defective gibberellin
20-oxidase gene. Proc. Natl. Acad. Sci. USA 99:9043–9048.
Stuber, C.W., S.E. Lincoln, D.W. Wolff , T. Helentjaris, and E.S.
Lander. 1992. Identifi cation of genetic factors contributing to
heterosis in a hybrid from two elite maize inbred lines using
molecular markers. Genetics 132:823–839.
Takahashi, Y., A. Shomura, T. Sasaki, and M. Yano. 2001. Hd6, a
rice quantitative trait locus involved in photoperiod sensitiv-
ity, encodes the alpha subunit of protein kinase CK2. Proc.
Natl. Acad. Sci. USA 98:7922–7927.
Thomson, M.J., T.H. Tai, A.M. McClung, M.E. Hinga, K.B.
Lobos, Y. Xu, C. Martinez, and S.R. McCouch. 2003. Map-
ping quantitative trait loci for yield, yield components, and
morphological traits in an advanced backcross population
between Oryza rufi pogon and the Oryza sativa cultivar Jeff er-
son. Theor. Appl. Genet. 107:479–493.
Tinker, N.A., D.E. Mather, B.G. Rossnagel, K.J. Kasha, and A.
Kleiohofs. 1996. Regions of the genome that aff ect agronomic
performance in two barley cultivars. Crop Sci. 36:1053–1062.
Xiao, J., J. Li, S. Grandillo, S.N. Ahn, L. Yuan, S.D. Tanksley,
and S.R. McCouch. 1998. Identifi cation of trait-improving
quantitative trait loci alleles from a wild rice relative, Oryza
rufi pogon. Genetics 150:899–909.
Xiao, J., J. Li, L. Yuan, and S.D. Tanksley. 1995. Dominance is
the major genetic basis of heterosis in rice as revealed by QTL
analysis using molecular markers. Genetics 140:745–754.
Xie, X., M.H. Song, F. Jin, S.N. Ahn, J.P. Suh, H.G. Hwang, and
S.R. McCouch. 2006. Fine mapping of a grain weight quan-
titative trait locus on rice chromosome 8 using near-isogenic
lines derived from a cross between Oryza sativa and Oryza
rufi pogon. Theor. Appl. Genet. 113:885–894.
Xiong, L.Z., K.D. Liu, X.K. Dai, C.G. Xu, and Q. Zhang. 1999.
Identifi cation of genetic factors controlling domestication-related
traits of rice using an F2 population of a cross between Oryza
sativa and O. rufi pogon. Theor. Appl. Genet. 98:243–251.
Yan, J., J. Zhu, C. He, M. Benmoussa, and P. Wu. 1998. Molecular
dissection of developmental behavior of plant height in rice
(Oryza sativa L.). Genetics 150:1257–1265.
Yano, M. 2001. Genetic and molecular dissection of naturally
occurring variation. Curr. Opin. Plant Biol. 4:130–135.
Yano, M., Y. Harushima, Y. Nagamura, N. Kurata, Y. Minobe,
and T. Sasaki. 1997. Identifi cation of quantitative trait loci
controlling heading date in rice using a high-density linkage
map. Theor. Appl. Genet. 95:1025–1032.
Yano, M.Y., M. Katayose, U. Ashikari, L. Yamanouchi, T. Monna, B.
Fuse, K. Baba, Y. Yamamoto, Y. Umehara, Y. Nagamura, and T.
Sasaki. 2000. Hd1, a major photoperiod sensitivity quantitative
trait locus in rice, is closely related to the Arabidopsis fl owering
time gene CONSTANS. Plant Cell 12:2473–2483.
Zhuang, J.Y., Y.Y. Fan, Z.M. Rao, J.L. Wu, Y.W. Xia, and K.L. Zheng.
2002. Analysis on additive eff ects and additive-by-additive epi-
static eff ects of QTLs for yield traits in a recombinant inbred line
population of rice. Theor. Appl. Genet. 105:1137–1145.
Zhuang, J.Y., H.X. Lin, J. Lu, H.R. Qian, S. Hittalmani, N.
Huang, and K.L. Zheng. 1997. Analysis of QTL × environ-
ment interaction for yield components and plant height in
rice. Theor. Appl. Genet. 95:799–808.
Zobel, R.W., M.J. Wright, and H.G. Gauch. 1988. Statistical anal-
ysis of a yield trial. Agron. J. 80:388–393.
Related Documents