Identification of Pathogen and Host-Response Markers Correlated With Periodontal Disease Christoph A. Ramseier,* Janet S. Kinney,* Amy E. Herr, † Thomas Braun,* ‡ James V. Sugai,* Charlie A. Shelburne, § Lindsay A. Rayburn,* Huu M. Tran, i Anup K. Singh, i and William V. Giannobile* ¶ Background: Periodontitis is the major cause of tooth loss in adults and is linked to systemic illnesses, such as cardiovascular disease and stroke. The development of rapid point-of-care (POC) chairside diagnostics has the potential for the early detection of periodontal infection and progression to identify incipient disease and reduce health care costs. However, validation of effective diagnostics requires the identification and verifica- tion of biomarkers correlated with disease progression. This clinical study sought to determine the ability of putative host- and microbially derived biomarkers to identify periodontal disease status from whole saliva and plaque biofilm. Methods: One hundred human subjects were equally recruited into a healthy/gingivitis group or a periodontitis population. Whole saliva was collected from all subjects and analyzed using antibody arrays to measure the levels of multiple proinflammatory cytokines and bone resorptive/turnover markers. Results: Salivary biomarker data were correlated to comprehensive clinical, radiographic, and microbial plaque biofilm levels measured by quantitative polymerase chain reaction (qPCR) for the generation of models for periodontal disease identification. Significantly elevated levels of matrix metalloproteinase (MMP)-8 and -9 were found in subjects with advanced periodontitis with Random Forest importance scores of 7.1 and 5.1, re- spectively. The generation of receiver operating characteristic curves demonstrated that permutations of salivary biomarkers and pathogen biofilm values augmented the prediction of disease category. Multiple com- binations of salivary biomarkers (especially MMP-8 and -9 and osteoprotegerin) combined with red-complex an- aerobic periodontal pathogens (such as Porphyromonas gingivalis or Treponema denticola) provided highly accurate predictions of periodontal disease category. Elevated salivary MMP-8 and T. denticola biofilm levels displayed robust combinatorial characteristics in predicting periodontal disease severity (area under the curve = 0.88; odds ratio = 24.6; 95% confidence interval: 5.2 to 116.5). Conclusions: Using qPCR and sensitive immunoassays, we identified host- and bacterially derived bio- markers correlated with periodontal disease. This approach offers significant potential for the discovery of biomarker signatures useful in the development of rapid POC chairside diagnostics for oral and systemic diseases. Studies are ongoing to apply this approach to the longitudinal predictions of disease activity. J Periodontol 2009;80:436-446. KEY WORDS Diagnosis; periodontal disease; saliva. doi: 10.1902/jop.2009.080480 * Department of Periodontics and Oral Medicine, Michigan Center for Oral Health Research, University of Michigan School of Dentistry, Ann Arbor, MI. † Department of Bioengineering, University of California at Berkeley, Berkeley, CA. ‡ Biostatistics Department, School of Public Health, University of Michigan, Ann Arbor, MI. § Department of Biologic and Material Sciences, University of Michigan School of Dentistry. i Biosystems Research Department, Sandia National Laboratories, Livermore, CA. ¶ Department of Biomedical Engineering, College of Engineering, University of Michigan. indicates supplementary slide presentation (with audio) in the online Journal of Periodontology. Volume 80 • Number 3 436

Welcome message from author
This document is posted to help you gain knowledge. Please leave a comment to let me know what you think about it! Share it to your friends and learn new things together.
Transcript
Identification of Pathogenand Host-Response Markers CorrelatedWith Periodontal DiseaseChristoph A. Ramseier,* Janet S. Kinney,* Amy E. Herr,† Thomas Braun,*‡ James V. Sugai,*Charlie A. Shelburne,§ Lindsay A. Rayburn,* Huu M. Tran,i Anup K. Singh,i
and William V. Giannobile*¶
Background: Periodontitis is the major cause of tooth loss in adults and is linked to systemic illnesses, suchascardiovascular disease and stroke. The developmentof rapidpoint-of-care (POC) chairsidediagnosticshasthe potential for the early detection of periodontal infection and progression to identify incipient disease andreduce health care costs. However, validation of effective diagnostics requires the identification and verifica-tion of biomarkers correlated with disease progression. This clinical study sought to determine the ability ofputative host- and microbially derived biomarkers to identify periodontal disease status from whole salivaand plaque biofilm.
Methods: One hundred human subjects were equally recruited into ahealthy/gingivitis group or aperiodontitispopulation. Whole saliva was collected from all subjects and analyzed using antibody arrays to measure the levelsof multiple proinflammatory cytokines and bone resorptive/turnover markers.
Results: Salivary biomarker data were correlated to comprehensive clinical, radiographic, and microbialplaque biofilm levels measured by quantitative polymerase chain reaction (qPCR) for the generation of modelsfor periodontal disease identification. Significantly elevated levels of matrix metalloproteinase (MMP)-8 and -9were found in subjects with advanced periodontitis with Random Forest importance scores of 7.1 and 5.1, re-spectively. The generation of receiver operating characteristic curves demonstrated that permutations ofsalivary biomarkers and pathogen biofilm values augmented the prediction of disease category. Multiple com-binationsof salivarybiomarkers (especiallyMMP-8and-9andosteoprotegerin)combinedwith red-complexan-aerobic periodontal pathogens (such as Porphyromonas gingivalis or Treponema denticola) provided highlyaccurate predictions of periodontal disease category. Elevated salivary MMP-8 and T. denticola biofilm levelsdisplayed robust combinatorial characteristics in predicting periodontal disease severity (area under the curve =0.88; odds ratio = 24.6; 95% confidence interval: 5.2 to 116.5).
Conclusions: Using qPCR and sensitive immunoassays, we identified host- and bacterially derived bio-markers correlated with periodontal disease. This approach offers significant potential for the discovery ofbiomarker signatures useful in the development of rapid POC chairside diagnostics for oral and systemicdiseases. Studies are ongoing to apply this approach to the longitudinal predictions of disease activity.J Periodontol 2009;80:436-446.
KEY WORDS
Diagnosis; periodontal disease; saliva.
doi: 10.1902/jop.2009.080480
* Department of Periodontics and Oral Medicine, Michigan Center for Oral Health Research, University of Michigan School of Dentistry, Ann Arbor, MI.† Department of Bioengineering, University of California at Berkeley, Berkeley, CA.‡ Biostatistics Department, School of Public Health, University of Michigan, Ann Arbor, MI.§ Department of Biologic and Material Sciences, University of Michigan School of Dentistry.i Biosystems Research Department, Sandia National Laboratories, Livermore, CA.¶ Department of Biomedical Engineering, College of Engineering, University of Michigan.
indicates supplementary slide presentation (with audio) in the online Journal of Periodontology.
Volume 80 • Number 3
436
Periodontal disease is the leading cause of toothloss in adults.1 Periodontitis is initiated by tooth-associated microbial biofilms triggering an al-
tered host response leading to soft tissue inflammationand alveolar bone loss. Periodontal infections areimplicated in a variety of other diseases, such as car-diovascular disease, stroke, and aspiration pneumonia,whereby the microbial biofilm serves as a ‘‘slow-delivery system’’ of oral pathogens adhering to teeth,leading to a chronic microbial challenge and down-stream effects of an altered host response.2 Diagnosticmethods used in clinical practice today lack the abilityto detect the onset of inflammation and to identify thosepatients who are susceptible to future disease progres-sion. Oral fluid–based point-of-care (POC) diagnosticsarecommonlyused in medicine and, more recently, arebeing adapted for the potential ‘‘chairside’’ determina-tion of oral diseases.3 The latest clinical applicationsuse new ‘‘lab-on-a-chip’’ (LOC) technologies as rapidPOC diagnostic tests for systemic infectious dis-eases4,5 and periodontal disease.6 The human salivaryproteome project, supported by the United StatesNational Institute of Dental and Craniofacial Research,Bethesda, Maryland, has generated further emphasison theuseofproteomicmarkers fordiseasediagnosis.7
The identification of the proteomic content of humansaliva in diagnostic tests, assessing the fingerprint ofdifferent human illnesses, generally suggests the prob-ability that multianalyte detection approaches willsurpass conventional clinical diagnostic proceduresusing single biomarkers.
The use of oral fluids in oral-based diagnostics haveproven to be easy to use forPOC application8 in the de-tection of oral cancer9,10 or human immunodeficiencyvirus infection.11 Furthermore, the use of microfluidicdevices as examples of LOC technology offers signifi-cant potential for rapid saliva diagnosis for widespreadpublic health purposes.6,12 However, for periodontaldisease determination, most research has focused pri-marily on gingival crevicular fluid (GCF) biomarkersthat provide local disease status, but it represents acumbersome, difficult-to-use approach for clinical ap-plication.13 Easy-to-access saliva contains locallyandsystemically derived mediators of periodontal diseaseand, thus, offers significant potential for the assess-ment of periodontal disease status and risk.14
Although a single specific target biomarker for peri-odontal disease has not been identified, combinationsof putative biomarkers of disease have been evaluatedin GCF and demonstrated significant potential aspanels of targets for the development of an oral fluidfingerprint of periodontal disease status. Given themultifaceted pattern of periodontal disease as a con-tinuum of infection to inflammatory dysregulationand subsequent bone loss, specific biomarkers, suchas matrix metalloproteinase (MMP)-8, interleukin
(IL)-1b and -6, and type I collagen pyridinolinecross-linked telopeptide (ICTP), have been assessedin GCF singularly for disease identification.15 This ap-proach of developing ‘‘biologic phenotypes’’ that con-sider themicrobial and inflammatory responsemaybeuseful in the developmentofpatientdiseaseclassifica-tions with implications in targeted therapeutics.16,17
Here we demonstrate the validation of multipleproinflammatory and bone-specific biomarkers fromwhole saliva coupled with microbial biofilm patho-gens for the identification of periodontal disease. Thisunique combinatorial approach resulted in robust pre-dictions of periodontitis in human subjects.
MATERIALS AND METHODS
SubjectsThis clinical study was approved by the University ofMichigan Health Sciences Institutional Review Boardand registered with the clinical trials database of theNational Institutes of Health, Bethesda, Maryland. Re-search subjects were recruited from September 2005through June 2006. Upon receiving written consent,100 human subjects aged 18 years and older wereevaluated at the Michigan Center for Oral Health Re-search. All subjects possessed ‡20 teeth and had re-ceived no periodontal treatment or antibiotic therapyfor medical or dental reasons 3 months prior to the in-vestigation. In addition, the subjects did not previ-ously undergo any long-term use of medicationsaffecting periodontal status, such as anti-inflamma-tory drugs.
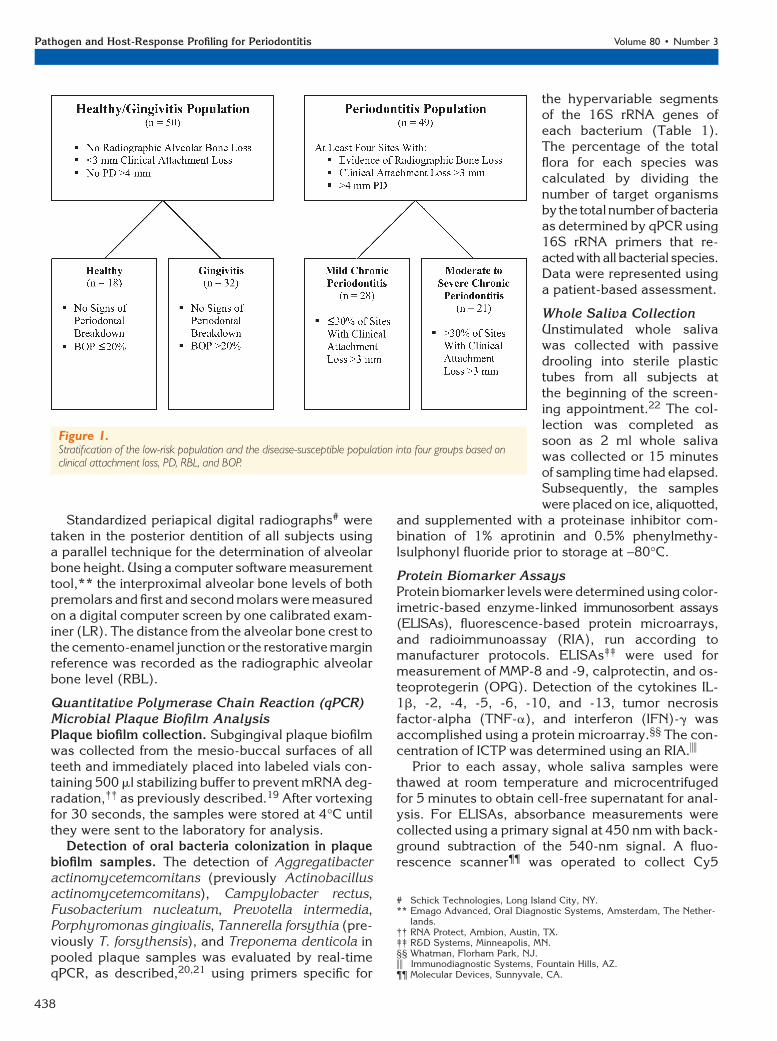
Subjects were enrolled into a healthy/gingivitis po-pulation (n = 50) or a periodontitis population (n = 49;one patient dropped out at experimental baseline).Subjects from the healthy and gingivitis populationexhibited <3 mm of attachment loss, no periodontalprobing depth (PD) >4 mm, and no radiographic alve-olar bone loss. Periodontitis subjects exhibited at leastfour sites with evidence of radiographic bone loss, atleast four sites with attachment loss >3 mm, and atleast four sites with PD >4 mm (Fig. 1).
Subjects were excluded if they possessed a historyof metabolic bone diseases, autoimmune diseases,unstable diabetes, or postmenopausal osteoporosis.Women who were pregnant were also excluded fromthe study.
Clinical MeasuresAll teeth except third molars were assessed for peri-odontal clinical measures by two calibrated examiners(CR and JK). Clinical parameters, including PD, clin-ical attachment level (CAL), and bleeding on probing(BOP), were measured at six sites per tooth. Otherclinical assessments included dichotomous measuresof plaque accumulation (PI) and gingival redness in-dex (GRI), as previously described by Haffajee et al.18
J Periodontol • March 2009 Ramseier, Kinney, Herr, et al.
437
Standardized periapical digital radiographs# weretaken in the posterior dentition of all subjects usinga parallel technique for the determination of alveolarbone height. Using a computer software measurementtool,** the interproximal alveolar bone levels of bothpremolars and first and second molars were measuredon a digital computer screen by one calibrated exam-iner (LR). The distance from the alveolar bone crest tothe cemento-enamel junction or the restorative marginreference was recorded as the radiographic alveolarbone level (RBL).
Quantitative Polymerase Chain Reaction (qPCR)Microbial Plaque Biofilm AnalysisPlaque biofilm collection. Subgingival plaque biofilmwas collected from the mesio-buccal surfaces of allteeth and immediately placed into labeled vials con-taining 500 ml stabilizing buffer to prevent mRNA deg-radation,†† as previously described.19 After vortexingfor 30 seconds, the samples were stored at 4�C untilthey were sent to the laboratory for analysis.
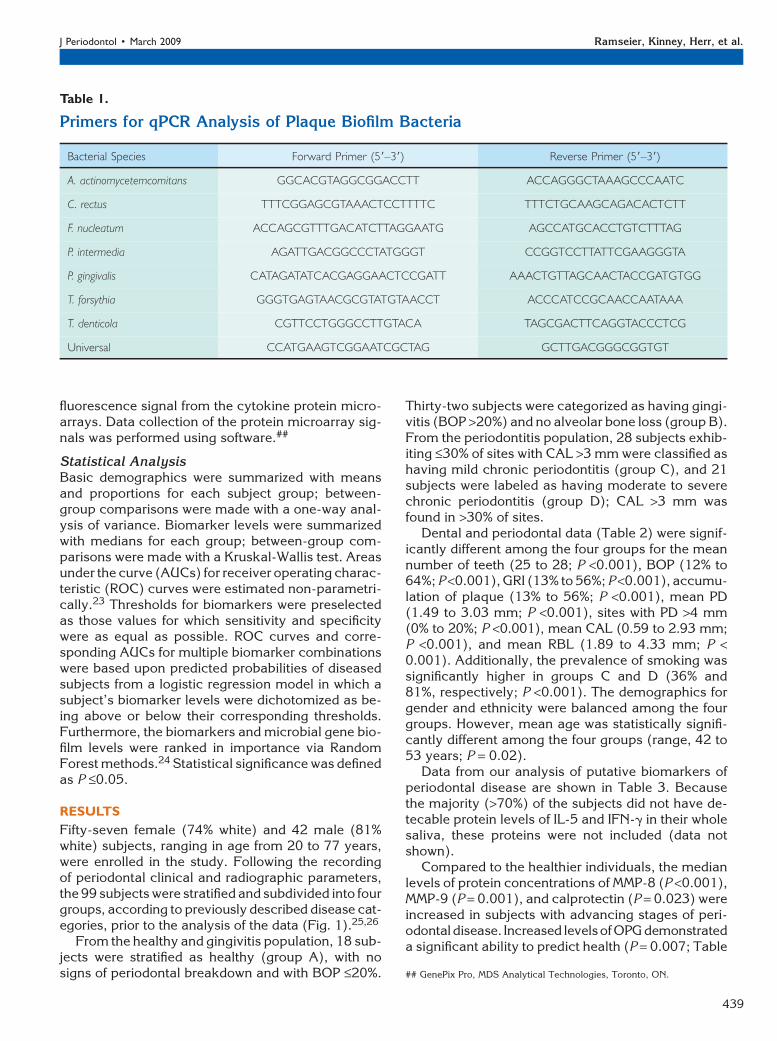
Detection of oral bacteria colonization in plaquebiofilm samples. The detection of Aggregatibacteractinomycetemcomitans (previously Actinobacillusactinomycetemcomitans), Campylobacter rectus,Fusobacterium nucleatum, Prevotella intermedia,Porphyromonas gingivalis, Tannerella forsythia (pre-viously T. forsythensis), and Treponema denticola inpooled plaque samples was evaluated by real-timeqPCR, as described,20,21 using primers specific for
the hypervariable segmentsof the 16S rRNA genes ofeach bacterium (Table 1).The percentage of the totalflora for each species wascalculated by dividing thenumber of target organismsby the totalnumber of bacteriaas determined by qPCR using16S rRNA primers that re-acted with all bacterial species.Data were represented usinga patient-based assessment.
Whole Saliva CollectionUnstimulated whole salivawas collected with passivedrooling into sterile plastictubes from all subjects atthe beginning of the screen-ing appointment.22 The col-lection was completed assoon as 2 ml whole salivawas collected or 15 minutesof sampling time had elapsed.Subsequently, the sampleswere placed on ice, aliquotted,
and supplemented with a proteinase inhibitor com-bination of 1% aprotinin and 0.5% phenylmethy-lsulphonyl fluoride prior to storage at -80�C.
Protein Biomarker AssaysProtein biomarker levels were determined using color-imetric-based enzyme-linked immunosorbent assays(ELISAs), fluorescence-based protein microarrays,and radioimmunoassay (RIA), run according tomanufacturer protocols. ELISAs‡‡ were used formeasurement of MMP-8 and -9, calprotectin, and os-teoprotegerin (OPG). Detection of the cytokines IL-1b, -2, -4, -5, -6, -10, and -13, tumor necrosisfactor-alpha (TNF-a), and interferon (IFN)-g wasaccomplished using a protein microarray.§§ The con-centration of ICTP was determined using an RIA.ii
Prior to each assay, whole saliva samples werethawed at room temperature and microcentrifugedfor 5 minutes to obtain cell-free supernatant for anal-ysis. For ELISAs, absorbance measurements werecollected using a primary signal at 450 nm with back-ground subtraction of the 540-nm signal. A fluo-rescence scanner¶¶ was operated to collect Cy5
Figure 1.Stratification of the low-risk population and the disease-susceptible population into four groups based onclinical attachment loss, PD, RBL, and BOP.
# Schick Technologies, Long Island City, NY.** Emago Advanced, Oral Diagnostic Systems, Amsterdam, The Nether-
lands.†† RNA Protect, Ambion, Austin, TX.‡‡ R&D Systems, Minneapolis, MN.§§ Whatman, Florham Park, NJ.ii Immunodiagnostic Systems, Fountain Hills, AZ.¶¶ Molecular Devices, Sunnyvale, CA.
Pathogen and Host-Response Profiling for Periodontitis Volume 80 • Number 3
438
fluorescence signal from the cytokine protein micro-arrays. Data collection of the protein microarray sig-nals was performed using software.##
Statistical AnalysisBasic demographics were summarized with meansand proportions for each subject group; between-group comparisons were made with a one-way anal-ysis of variance. Biomarker levels were summarizedwith medians for each group; between-group com-parisons were made with a Kruskal-Wallis test. Areasunder the curve (AUCs) for receiver operating charac-teristic (ROC) curves were estimated non-parametri-cally.23 Thresholds for biomarkers were preselectedas those values for which sensitivity and specificitywere as equal as possible. ROC curves and corre-sponding AUCs for multiple biomarker combinationswere based upon predicted probabilities of diseasedsubjects from a logistic regression model in which asubject’s biomarker levels were dichotomized as be-ing above or below their corresponding thresholds.Furthermore, the biomarkers and microbial gene bio-film levels were ranked in importance via RandomForest methods.24 Statistical significance was definedas P £0.05.
RESULTS
Fifty-seven female (74% white) and 42 male (81%white) subjects, ranging in age from 20 to 77 years,were enrolled in the study. Following the recordingof periodontal clinical and radiographic parameters,the 99 subjects were stratified and subdivided into fourgroups, according to previously described disease cat-egories, prior to the analysis of the data (Fig. 1).25,26
From the healthy and gingivitis population, 18 sub-jects were stratified as healthy (group A), with nosigns of periodontal breakdown and with BOP £20%.
Thirty-two subjects were categorized as having gingi-vitis (BOP >20%) and no alveolar bone loss (group B).From the periodontitis population, 28 subjects exhib-iting £30% of sites with CAL >3 mm were classified ashaving mild chronic periodontitis (group C), and 21subjects were labeled as having moderate to severechronic periodontitis (group D); CAL >3 mm wasfound in >30% of sites.
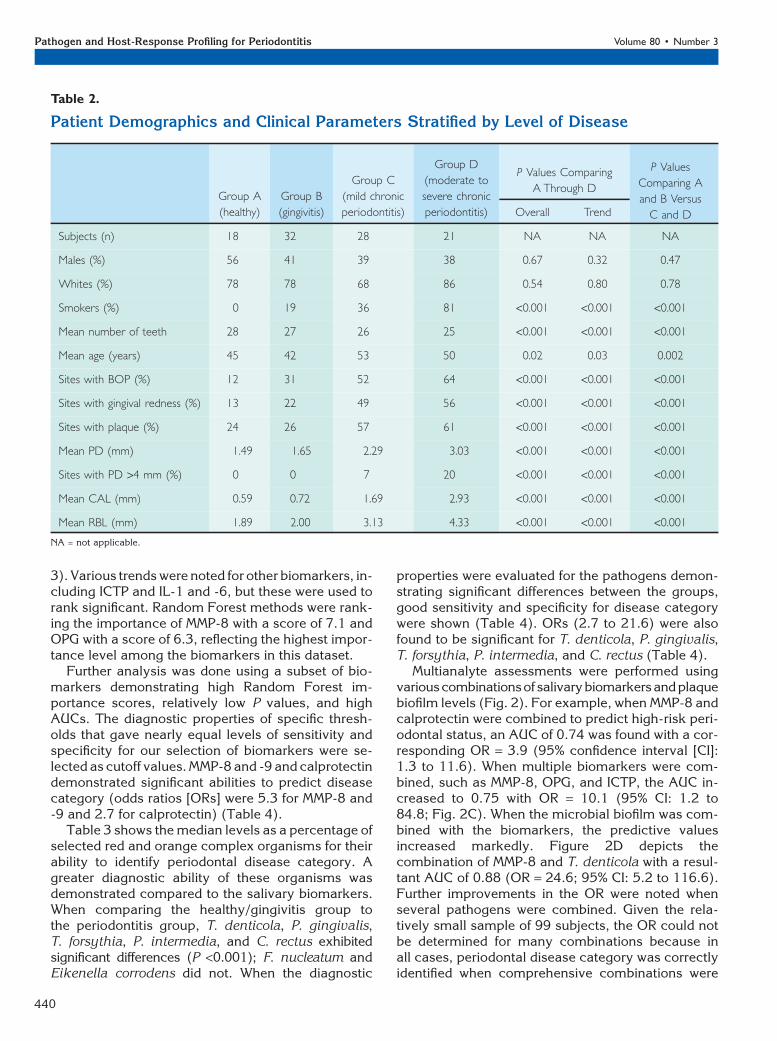
Dental and periodontal data (Table 2) were signif-icantly different among the four groups for the meannumber of teeth (25 to 28; P <0.001), BOP (12% to64%; P <0.001), GRI (13% to 56%; P <0.001), accumu-lation of plaque (13% to 56%; P <0.001), mean PD(1.49 to 3.03 mm; P <0.001), sites with PD >4 mm(0% to 20%; P <0.001), mean CAL (0.59 to 2.93 mm;P <0.001), and mean RBL (1.89 to 4.33 mm; P <0.001). Additionally, the prevalence of smoking wassignificantly higher in groups C and D (36% and81%, respectively; P <0.001). The demographics forgender and ethnicity were balanced among the fourgroups. However, mean age was statistically signifi-cantly different among the four groups (range, 42 to53 years; P = 0.02).
Data from our analysis of putative biomarkers ofperiodontal disease are shown in Table 3. Becausethe majority (>70%) of the subjects did not have de-tecable protein levels of IL-5 and IFN-g in their wholesaliva, these proteins were not included (data notshown).
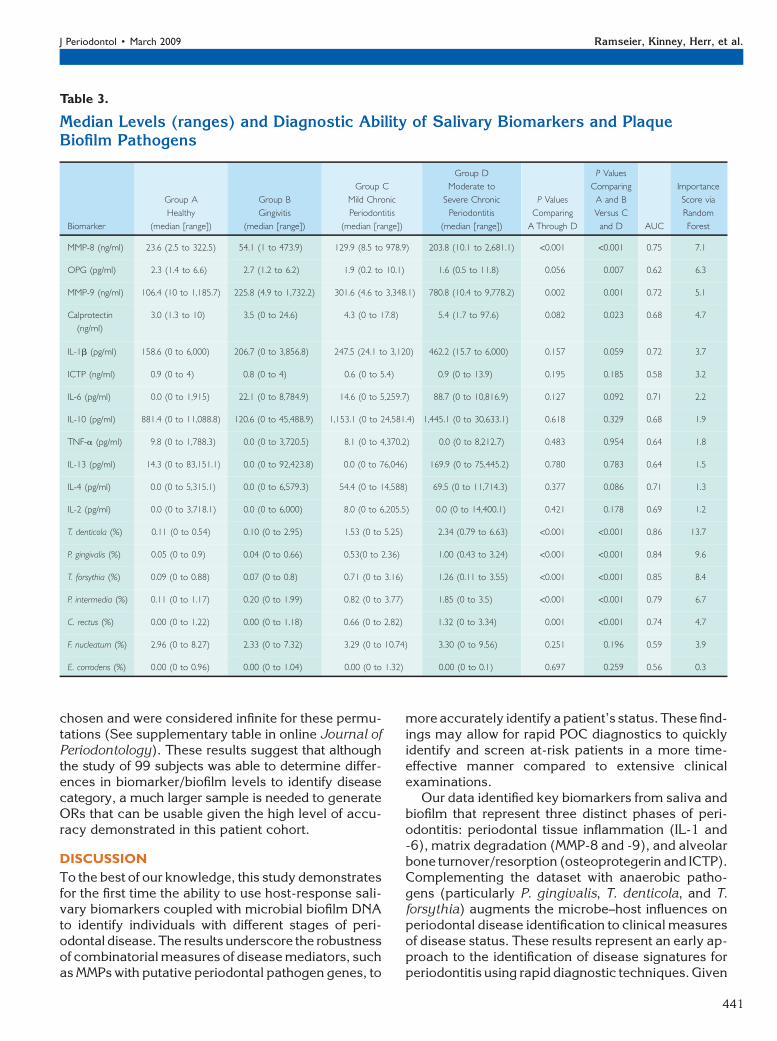
Compared to the healthier individuals, the medianlevels of protein concentrations of MMP-8 (P <0.001),MMP-9 (P = 0.001), and calprotectin (P = 0.023) wereincreased in subjects with advancing stages of peri-odontal disease. Increased levelsofOPG demonstrateda significant ability to predict health (P = 0.007; Table
Table 1.
Primers for qPCR Analysis of Plaque Biofilm Bacteria
Bacterial Species Forward Primer (59–39) Reverse Primer (59–39)
A. actinomycetemcomitans GGCACGTAGGCGGACCTT ACCAGGGCTAAAGCCCAATC
C. rectus TTTCGGAGCGTAAACTCCTTTTC TTTCTGCAAGCAGACACTCTT
F. nucleatum ACCAGCGTTTGACATCTTAGGAATG AGCCATGCACCTGTCTTTAG
P. intermedia AGATTGACGGCCCTATGGGT CCGGTCCTTATTCGAAGGGTA
P. gingivalis CATAGATATCACGAGGAACTCCGATT AAACTGTTAGCAACTACCGATGTGG
T. forsythia GGGTGAGTAACGCGTATGTAACCT ACCCATCCGCAACCAATAAA
T. denticola CGTTCCTGGGCCTTGTACA TAGCGACTTCAGGTACCCTCG
Universal CCATGAAGTCGGAATCGCTAG GCTTGACGGGCGGTGT
## GenePix Pro, MDS Analytical Technologies, Toronto, ON.
J Periodontol • March 2009 Ramseier, Kinney, Herr, et al.
439
3). Various trends were noted for other biomarkers, in-cluding ICTP and IL-1 and -6, but these were used torank significant. Random Forest methods were rank-ing the importance of MMP-8 with a score of 7.1 andOPG with a score of 6.3, reflecting the highest impor-tance level among the biomarkers in this dataset.
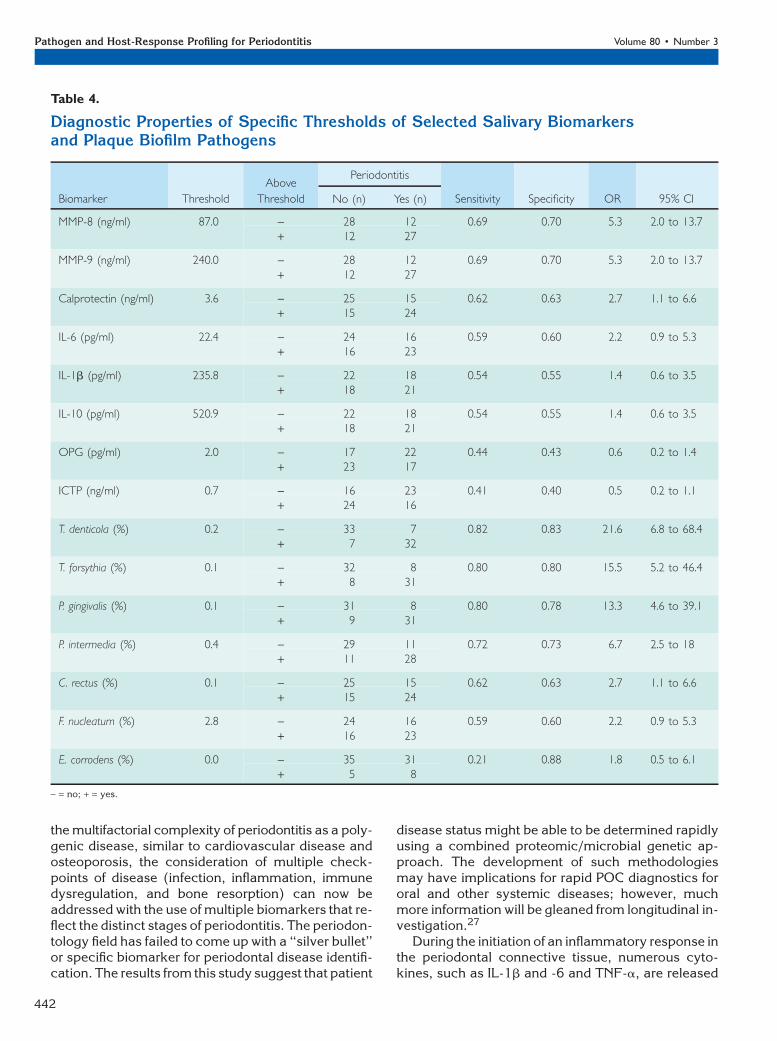
Further analysis was done using a subset of bio-markers demonstrating high Random Forest im-portance scores, relatively low P values, and highAUCs. The diagnostic properties of specific thresh-olds that gave nearly equal levels of sensitivity andspecificity for our selection of biomarkers were se-lected as cutoff values. MMP-8 and -9 and calprotectindemonstrated significant abilities to predict diseasecategory (odds ratios [ORs] were 5.3 for MMP-8 and-9 and 2.7 for calprotectin) (Table 4).
Table 3 shows the median levels as a percentage ofselected red and orange complex organisms for theirability to identify periodontal disease category. Agreater diagnostic ability of these organisms wasdemonstrated compared to the salivary biomarkers.When comparing the healthy/gingivitis group tothe periodontitis group, T. denticola, P. gingivalis,T. forsythia, P. intermedia, and C. rectus exhibitedsignificant differences (P <0.001); F. nucleatum andEikenella corrodens did not. When the diagnostic
properties were evaluated for the pathogens demon-strating significant differences between the groups,good sensitivity and specificity for disease categorywere shown (Table 4). ORs (2.7 to 21.6) were alsofound to be significant for T. denticola, P. gingivalis,T. forsythia, P. intermedia, and C. rectus (Table 4).
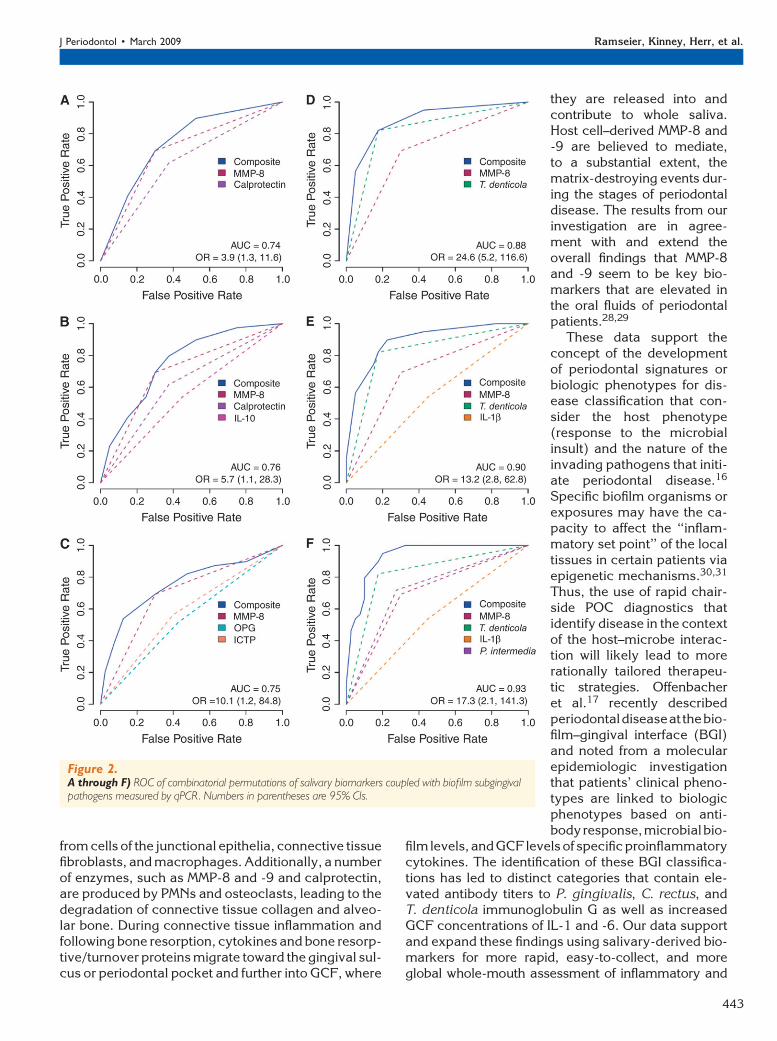
Multianalyte assessments were performed usingvariouscombinationsof salivarybiomarkersandplaquebiofilm levels (Fig. 2). For example, when MMP-8 andcalprotectin were combined to predict high-risk peri-odontal status, an AUC of 0.74 was found with a cor-responding OR = 3.9 (95% confidence interval [CI]:1.3 to 11.6). When multiple biomarkers were com-bined, such as MMP-8, OPG, and ICTP, the AUC in-creased to 0.75 with OR = 10.1 (95% CI: 1.2 to84.8; Fig. 2C). When the microbial biofilm was com-bined with the biomarkers, the predictive valuesincreased markedly. Figure 2D depicts thecombination of MMP-8 and T. denticola with a resul-tant AUC of 0.88 (OR = 24.6; 95% CI: 5.2 to 116.6).Further improvements in the OR were noted whenseveral pathogens were combined. Given the rela-tively small sample of 99 subjects, the OR could notbe determined for many combinations because inall cases, periodontal disease category was correctlyidentified when comprehensive combinations were
Table 2.
Patient Demographics and Clinical Parameters Stratified by Level of Disease
Group A
(healthy)
Group B
(gingivitis)
Group C
(mild chronic
periodontitis)
Group D
(moderate to
severe chronic
periodontitis)
P Values Comparing
A Through D
P Values
Comparing A
and B Versus
C and DOverall Trend
Subjects (n) 18 32 28 21 NA NA NA
Males (%) 56 41 39 38 0.67 0.32 0.47
Whites (%) 78 78 68 86 0.54 0.80 0.78
Smokers (%) 0 19 36 81 <0.001 <0.001 <0.001
Mean number of teeth 28 27 26 25 <0.001 <0.001 <0.001
Mean age (years) 45 42 53 50 0.02 0.03 0.002
Sites with BOP (%) 12 31 52 64 <0.001 <0.001 <0.001
Sites with gingival redness (%) 13 22 49 56 <0.001 <0.001 <0.001
Sites with plaque (%) 24 26 57 61 <0.001 <0.001 <0.001
Mean PD (mm) 1.49 1.65 2.29 3.03 <0.001 <0.001 <0.001
Sites with PD >4 mm (%) 0 0 7 20 <0.001 <0.001 <0.001
Mean CAL (mm) 0.59 0.72 1.69 2.93 <0.001 <0.001 <0.001
Mean RBL (mm) 1.89 2.00 3.13 4.33 <0.001 <0.001 <0.001
NA = not applicable.
Pathogen and Host-Response Profiling for Periodontitis Volume 80 • Number 3
440
chosen and were considered infinite for these permu-tations (See supplementary table in online Journal ofPeriodontology). These results suggest that althoughthe study of 99 subjects was able to determine differ-ences in biomarker/biofilm levels to identify diseasecategory, a much larger sample is needed to generateORs that can be usable given the high level of accu-racy demonstrated in this patient cohort.
DISCUSSION
To the best of our knowledge, this study demonstratesfor the first time the ability to use host-response sali-vary biomarkers coupled with microbial biofilm DNAto identify individuals with different stages of peri-odontal disease. The results underscore the robustnessof combinatorial measures of disease mediators, suchas MMPs with putative periodontal pathogen genes, to
more accurately identify a patient’s status. These find-ings may allow for rapid POC diagnostics to quicklyidentify and screen at-risk patients in a more time-effective manner compared to extensive clinicalexaminations.
Our data identified key biomarkers from saliva andbiofilm that represent three distinct phases of peri-odontitis: periodontal tissue inflammation (IL-1 and-6), matrix degradation (MMP-8 and -9), and alveolarbone turnover/resorption (osteoprotegerin and ICTP).Complementing the dataset with anaerobic patho-gens (particularly P. gingivalis, T. denticola, and T.forsythia) augments the microbe–host influences onperiodontal disease identification to clinical measuresof disease status. These results represent an early ap-proach to the identification of disease signatures forperiodontitis using rapid diagnostic techniques. Given
Table 3.
Median Levels (ranges) and Diagnostic Ability of Salivary Biomarkers and PlaqueBiofilm Pathogens
Biomarker
Group A
Healthy
(median [range])
Group B
Gingivitis
(median [range])
Group C
Mild Chronic
Periodontitis
(median [range])
Group D
Moderate to
Severe Chronic
Periodontitis
(median [range])
P Values
Comparing
A Through D
P Values
Comparing
A and B
Versus C
and D AUC
Importance
Score via
Random
Forest
MMP-8 (ng/ml) 23.6 (2.5 to 322.5) 54.1 (1 to 473.9) 129.9 (8.5 to 978.9) 203.8 (10.1 to 2,681.1) <0.001 <0.001 0.75 7.1
OPG (pg/ml) 2.3 (1.4 to 6.6) 2.7 (1.2 to 6.2) 1.9 (0.2 to 10.1) 1.6 (0.5 to 11.8) 0.056 0.007 0.62 6.3
MMP-9 (ng/ml) 106.4 (10 to 1,185.7) 225.8 (4.9 to 1,732.2) 301.6 (4.6 to 3,348.1) 780.8 (10.4 to 9,778.2) 0.002 0.001 0.72 5.1
Calprotectin
(ng/ml)
3.0 (1.3 to 10) 3.5 (0 to 24.6) 4.3 (0 to 17.8) 5.4 (1.7 to 97.6) 0.082 0.023 0.68 4.7
IL-1b (pg/ml) 158.6 (0 to 6,000) 206.7 (0 to 3,856.8) 247.5 (24.1 to 3,120) 462.2 (15.7 to 6,000) 0.157 0.059 0.72 3.7
ICTP (ng/ml) 0.9 (0 to 4) 0.8 (0 to 4) 0.6 (0 to 5.4) 0.9 (0 to 13.9) 0.195 0.185 0.58 3.2
IL-6 (pg/ml) 0.0 (0 to 1,915) 22.1 (0 to 8,784.9) 14.6 (0 to 5,259.7) 88.7 (0 to 10,816.9) 0.127 0.092 0.71 2.2
IL-10 (pg/ml) 881.4 (0 to 11,088.8) 120.6 (0 to 45,488.9) 1,153.1 (0 to 24,581.4) 1,445.1 (0 to 30,633.1) 0.618 0.329 0.68 1.9
TNF-a (pg/ml) 9.8 (0 to 1,788.3) 0.0 (0 to 3,720.5) 8.1 (0 to 4,370.2) 0.0 (0 to 8,212.7) 0.483 0.954 0.64 1.8
IL-13 (pg/ml) 14.3 (0 to 83,151.1) 0.0 (0 to 92,423.8) 0.0 (0 to 76,046) 169.9 (0 to 75,445.2) 0.780 0.783 0.64 1.5
IL-4 (pg/ml) 0.0 (0 to 5,315.1) 0.0 (0 to 6,579.3) 54.4 (0 to 14,588) 69.5 (0 to 11,714.3) 0.377 0.086 0.71 1.3
IL-2 (pg/ml) 0.0 (0 to 3,718.1) 0.0 (0 to 6,000) 8.0 (0 to 6,205.5) 0.0 (0 to 14,400.1) 0.421 0.178 0.69 1.2
T. denticola (%) 0.11 (0 to 0.54) 0.10 (0 to 2.95) 1.53 (0 to 5.25) 2.34 (0.79 to 6.63) <0.001 <0.001 0.86 13.7
P. gingivalis (%) 0.05 (0 to 0.9) 0.04 (0 to 0.66) 0.53(0 to 2.36) 1.00 (0.43 to 3.24) <0.001 <0.001 0.84 9.6
T. forsythia (%) 0.09 (0 to 0.88) 0.07 (0 to 0.8) 0.71 (0 to 3.16) 1.26 (0.11 to 3.55) <0.001 <0.001 0.85 8.4
P. intermedia (%) 0.11 (0 to 1.17) 0.20 (0 to 1.99) 0.82 (0 to 3.77) 1.85 (0 to 3.5) <0.001 <0.001 0.79 6.7
C. rectus (%) 0.00 (0 to 1.22) 0.00 (0 to 1.18) 0.66 (0 to 2.82) 1.32 (0 to 3.34) 0.001 <0.001 0.74 4.7
F. nucleatum (%) 2.96 (0 to 8.27) 2.33 (0 to 7.32) 3.29 (0 to 10.74) 3.30 (0 to 9.56) 0.251 0.196 0.59 3.9
E. corrodens (%) 0.00 (0 to 0.96) 0.00 (0 to 1.04) 0.00 (0 to 1.32) 0.00 (0 to 0.1) 0.697 0.259 0.56 0.3
J Periodontol • March 2009 Ramseier, Kinney, Herr, et al.
441
the multifactorial complexity of periodontitis as a poly-genic disease, similar to cardiovascular disease andosteoporosis, the consideration of multiple check-points of disease (infection, inflammation, immunedysregulation, and bone resorption) can now beaddressed with the use of multiple biomarkers that re-flect the distinct stages of periodontitis. The periodon-tology field has failed to come up with a ‘‘silver bullet’’or specific biomarker for periodontal disease identifi-cation. The results from this study suggest that patient
disease status might be able to be determined rapidlyusing a combined proteomic/microbial genetic ap-proach. The development of such methodologiesmay have implications for rapid POC diagnostics fororal and other systemic diseases; however, muchmore information will be gleaned from longitudinal in-vestigation.27
During the initiation of an inflammatory response inthe periodontal connective tissue, numerous cyto-kines, such as IL-1b and -6 and TNF-a, are released
Table 4.
Diagnostic Properties of Specific Thresholds of Selected Salivary Biomarkersand Plaque Biofilm Pathogens
Biomarker Threshold
Above
Threshold
Periodontitis
Sensitivity Specificity OR 95% CINo (n) Yes (n)
MMP-8 (ng/ml) 87.0 - 28 12 0.69 0.70 5.3 2.0 to 13.7+ 12 27
MMP-9 (ng/ml) 240.0 - 28 12 0.69 0.70 5.3 2.0 to 13.7+ 12 27
Calprotectin (ng/ml) 3.6 - 25 15 0.62 0.63 2.7 1.1 to 6.6+ 15 24
IL-6 (pg/ml) 22.4 - 24 16 0.59 0.60 2.2 0.9 to 5.3+ 16 23
IL-1b (pg/ml) 235.8 - 22 18 0.54 0.55 1.4 0.6 to 3.5+ 18 21
IL-10 (pg/ml) 520.9 - 22 18 0.54 0.55 1.4 0.6 to 3.5+ 18 21
OPG (pg/ml) 2.0 - 17 22 0.44 0.43 0.6 0.2 to 1.4+ 23 17
ICTP (ng/ml) 0.7 - 16 23 0.41 0.40 0.5 0.2 to 1.1+ 24 16
T. denticola (%) 0.2 - 33 7 0.82 0.83 21.6 6.8 to 68.4+ 7 32
T. forsythia (%) 0.1 - 32 8 0.80 0.80 15.5 5.2 to 46.4+ 8 31
P. gingivalis (%) 0.1 - 31 8 0.80 0.78 13.3 4.6 to 39.1+ 9 31
P. intermedia (%) 0.4 - 29 11 0.72 0.73 6.7 2.5 to 18+ 11 28
C. rectus (%) 0.1 - 25 15 0.62 0.63 2.7 1.1 to 6.6+ 15 24
F. nucleatum (%) 2.8 - 24 16 0.59 0.60 2.2 0.9 to 5.3+ 16 23
E. corrodens (%) 0.0 - 35 31 0.21 0.88 1.8 0.5 to 6.1+ 5 8
- = no; + = yes.
Pathogen and Host-Response Profiling for Periodontitis Volume 80 • Number 3
442
from cells of the junctional epithelia, connective tissuefibroblasts, and macrophages. Additionally, a numberof enzymes, such as MMP-8 and -9 and calprotectin,are produced by PMNs and osteoclasts, leading to thedegradation of connective tissue collagen and alveo-lar bone. During connective tissue inflammation andfollowing bone resorption, cytokines and bone resorp-tive/turnover proteins migrate toward the gingival sul-cus or periodontal pocket and further into GCF, where
they are released into andcontribute to whole saliva.Host cell–derived MMP-8 and-9 are believed to mediate,to a substantial extent, thematrix-destroying events dur-ing the stages of periodontaldisease. The results from ourinvestigation are in agree-ment with and extend theoverall findings that MMP-8and -9 seem to be key bio-markers that are elevated inthe oral fluids of periodontalpatients.28,29
These data support theconcept of the developmentof periodontal signatures orbiologic phenotypes for dis-ease classification that con-sider the host phenotype(response to the microbialinsult) and the nature of theinvading pathogens that initi-ate periodontal disease.16
Specific biofilm organisms orexposures may have the ca-pacity to affect the ‘‘inflam-matory set point’’ of the localtissues in certain patients viaepigenetic mechanisms.30,31
Thus, the use of rapid chair-side POC diagnostics thatidentify disease in the contextof the host–microbe interac-tion will likely lead to morerationally tailored therapeu-tic strategies. Offenbacheret al.17 recently describedperiodontaldiseaseat thebio-film–gingival interface (BGI)and noted from a molecularepidemiologic investigationthat patients’ clinical pheno-types are linked to biologicphenotypes based on anti-bodyresponse,microbialbio-
film levels, andGCF levels of specificproinflammatorycytokines. The identification of these BGI classifica-tions has led to distinct categories that contain ele-vated antibody titers to P. gingivalis, C. rectus, andT. denticola immunoglobulin G as well as increasedGCF concentrations of IL-1 and -6. Our data supportand expand these findings using salivary-derived bio-markers for more rapid, easy-to-collect, and moreglobal whole-mouth assessment of inflammatory and
Figure 2.A through F) ROC of combinatorial permutations of salivary biomarkers coupled with biofilm subgingivalpathogens measured by qPCR. Numbers in parentheses are 95% CIs.
J Periodontol • March 2009 Ramseier, Kinney, Herr, et al.
443
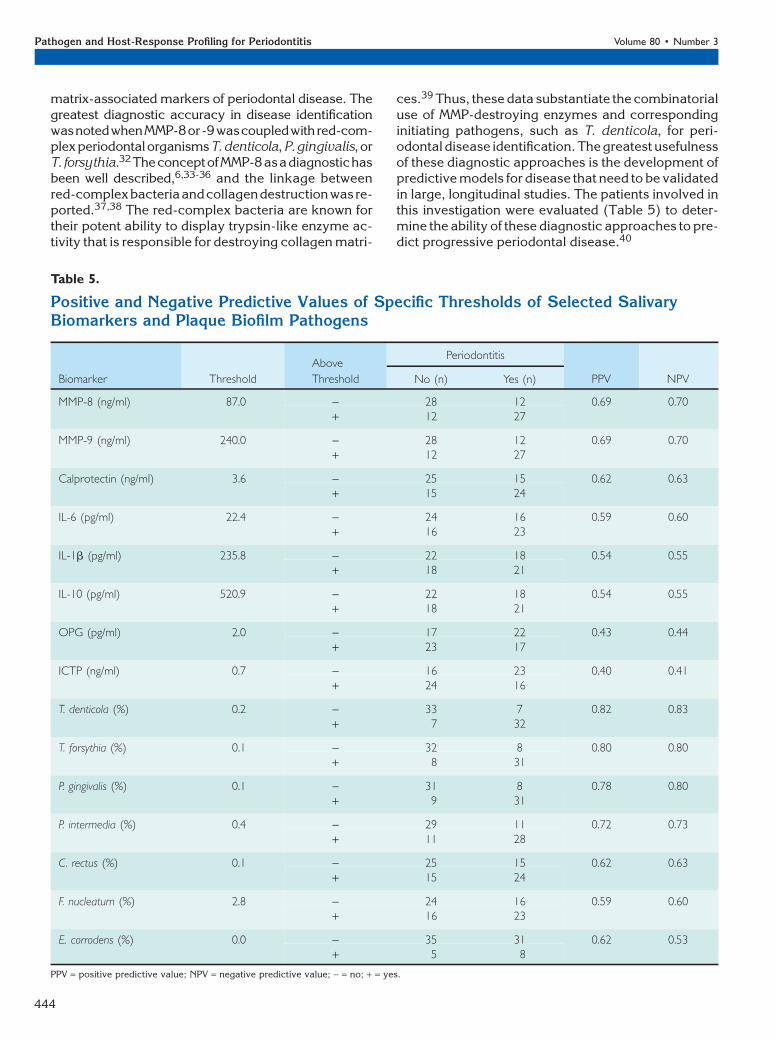
matrix-associated markers of periodontal disease. Thegreatest diagnostic accuracy in disease identificationwasnotedwhenMMP-8or-9wascoupledwithred-com-plexperiodontalorganismsT.denticola,P.gingivalis,orT. forsythia.32TheconceptofMMP-8asadiagnostichasbeen well described,6,33-36 and the linkage betweenred-complexbacteriaandcollagendestructionwasre-ported.37,38 The red-complex bacteria are known fortheir potent ability to display trypsin-like enzyme ac-tivity that is responsible for destroying collagen matri-
ces.39 Thus, these data substantiate the combinatorialuse of MMP-destroying enzymes and correspondinginitiating pathogens, such as T. denticola, for peri-odontal disease identification. The greatest usefulnessof these diagnostic approaches is the development ofpredictive models for disease that need to be validatedin large, longitudinal studies. The patients involved inthis investigation were evaluated (Table 5) to deter-mine the ability of these diagnostic approaches to pre-dict progressive periodontal disease.40
Table 5.
Positive and Negative Predictive Values of Specific Thresholds of Selected SalivaryBiomarkers and Plaque Biofilm Pathogens
Biomarker Threshold
Above
Threshold
Periodontitis
PPV NPVNo (n) Yes (n)
MMP-8 (ng/ml) 87.0 - 28 12 0.69 0.70+ 12 27
MMP-9 (ng/ml) 240.0 - 28 12 0.69 0.70+ 12 27
Calprotectin (ng/ml) 3.6 - 25 15 0.62 0.63+ 15 24
IL-6 (pg/ml) 22.4 - 24 16 0.59 0.60+ 16 23
IL-1b (pg/ml) 235.8 - 22 18 0.54 0.55+ 18 21
IL-10 (pg/ml) 520.9 - 22 18 0.54 0.55+ 18 21
OPG (pg/ml) 2.0 - 17 22 0.43 0.44+ 23 17
ICTP (ng/ml) 0.7 - 16 23 0.40 0.41+ 24 16
T. denticola (%) 0.2 - 33 7 0.82 0.83+ 7 32
T. forsythia (%) 0.1 - 32 8 0.80 0.80+ 8 31
P. gingivalis (%) 0.1 - 31 8 0.78 0.80+ 9 31
P. intermedia (%) 0.4 - 29 11 0.72 0.73+ 11 28
C. rectus (%) 0.1 - 25 15 0.62 0.63+ 15 24
F. nucleatum (%) 2.8 - 24 16 0.59 0.60+ 16 23
E. corrodens (%) 0.0 - 35 31 0.62 0.53+ 5 8
PPV = positive predictive value; NPV = negative predictive value; - = no; + = yes.
Pathogen and Host-Response Profiling for Periodontitis Volume 80 • Number 3
444
CONCLUSIONS
These data support the pairing of microbial and host-response biomarker information for more accurateperiodontal diagnoses. Future clinical in-office appli-cations of rapid POC diagnostics that can measureproteins, genes, and biofilm pathogens in salivashould lead to the development of improved diseaseidentification and improved oral health. These studiesrequire the longitudinal validation of these cross-sec-tional approaches to determine the prediction of dis-ease activity. The patients in this trial are beingmonitored for the determination of disease progres-sion to better forecast clinical disease outcomes.
ACKNOWLEDGMENTS
This work was supported by the National Institute ofDental and Craniofacial Research (U01-DE014961)and the National Center for Research Resources(M01-RR000042), Bethesda, Maryland, and theSwiss Society of Periodontology, Brig, Switzerland.Dr. Singh is a manager and Dr. Tran is a principaltechnologist in the Biosystems Research Departmentat Sandia National Laboratories. Drs. Herr, Shelburne,Braun, Singh, and Giannobile hold intellectual prop-erty related to this article. This trial is registered onthe www.clinicaltrials.gov database (NCT00277745).The authors appreciate the clinical assistance of Drs.Thiago Morelli, Amy Kim, and Noah Smith, MichiganCenter for Oral Health Research.
REFERENCES1. Taubman MA, Kawai T, Han X. The new concept of
periodontal disease pathogenesis requires new andnovel therapeutic strategies. J Clin Periodontol 2007;34:367-369.
2. Offenbacher S, Barros SP, Beck JD. Rethinking peri-odontal inflammation. J Periodontol 2008;79(Suppl. 8):1577-1584.
3. Tabak LA. Point-of-care diagnostics enter the mouth.Ann N Y Acad Sci 2007;1098:7-14.
4. Chen Z, Mauk MG, Wang J, et al. A microfluidicsystem for saliva-based detection of infectious dis-eases. Ann N Y Acad Sci 2007;1098:429-436.
5. Mauk MG, Ziober BL, Chen Z, Thompson JA, Bau HH.Lab-on-a-chip technologies for oral-based cancerscreening and diagnostics: Capabilities, issues, andprospects. Ann N Y Acad Sci 2007;1098:467-475.
6. Herr AE, Hatch AV, Giannobile WV, et al. Microfluidicimmunoassays as rapid saliva-based clinical diagnos-tics. Proc Natl Acad Sci USA 2007;104:5268-5273.
7. Wong DT. Salivary diagnostics powered by nanotech-nologies, proteomics and genomics. J Am Dent Assoc2006;137:313-321.
8. Malamud D. Salivary diagnostics: The future is now.J Am Dent Assoc 2006;137: 284, 286.
9. Li Y, St John MA, Zhou X, et al. Salivary transcriptomediagnostics for oral cancer detection. Clin Cancer Res2004;10:8442-8450.
10. Zimmermann BG, Wong DT. Salivary mRNA targetsfor cancer diagnostics. Oral Oncol 2008;44:425-429.
11. Delaney KP, Branson BM, Uniyal A, et al. Performanceof an oral fluid rapid HIV-1/2 test: Experience fromfour CDC studies. AIDS 2006;20:1655-1660.
12. Yager P, Edwards T, Fu E, et al. Microfluidic diagnostictechnologies for global public health. Nature 2006;442:412-418.
13. Taba M Jr., Kinney J, Kim AS, Giannobile WV. Diag-nostic biomarkers for oral and periodontal diseases.Dent Clin North Am 2005;49:551-571.
14. Kinney JS, Ramseier CA, Giannobile WV. Oral fluid-based biomarkers of alveolar bone loss in periodonti-tis. Ann N Y Acad Sci 2007;1098:230-251.
15. Loos BG, Tjoa S. Host-derived diagnostic markers forperiodontitis: Do they exist in gingival crevice fluid?Periodontol 2000 2005;39:53-72.
16. Casanova JL, Abel L. The human model: A geneticdissection of immunity to infection in natural condi-tions. Nat Rev Immunol 2004;4:55-66.
17. Offenbacher S, Barros SP, Singer RE, Moss K, WilliamsRC, Beck JD. Periodontal disease at the biofilm-gingivalinterface. J Periodontol 2007;78:1911-1925.
18. Haffajee AD, Socransky SS, Goodson JM. Comparisonof different data analyses for detecting changes inattachment level. J Clin Periodontol 1983;10:298-310.
19. Shelburne CE, Shelburne PS, Dhople VM, et al. Serumantibodies to Porphyromonas gingivalis chaperoneHtpG predict health in periodontitis susceptible pa-tients. PLoS ONE 2008;3:e1984.
20. Mullally BH, Dace B, Shelburne CE, Wolff LF, CoulterWA. Prevalence of periodontal pathogens in localizedand generalized forms of early-onset periodontitis.J Periodontal Res 2000;35:232-241.
21. Shelburne CE, Prabhu A, Gleason RM, Mullally BH,Coulter WA. Quantitation of Bacteroides forsythus insubgingival plaque comparison of immunoassay andquantitative polymerase chain reaction. J MicrobiolMethods 2000;39:97-107.
22. Mandel ID, Wotman S. The salivary secretions inhealth and disease. Oral Sci Rev 1976;(8):25-47.
23. Bamber D. The area above the ordinal dominance graphand the area below the receiver operating characteristicgraph. J Math Psychol 1975;12:387-415.
24. Breiman L. Random forests. Mach Learn 2001;45:5-32.25. Borrell LN, Papapanou PN. Analytical epidemiology
of periodontitis. J Clin Periodontol 2005;32(Suppl. 6):132-158.
26. Tonetti MS, Claffey N. Advances in the progression ofperiodontitis and proposal of definitions of a peri-odontitis case and disease progression for use in riskfactor research. Group C consensus report of the 5thEuropean Workshop in Periodontology. J Clin Peri-odontol 2005;32(Suppl. 6):210-213.
27. Yager P, Domingo GJ, Gerdes J. Point-of-care diag-nostics for global health. Annu Rev Biomed Eng2008;10:107-144.
28. Beklen A, Tuter G, Sorsa T, et al. Gingival tissue andcrevicular fluid co-operation in adult periodontitis.J Dent Res 2006;85:59-63.
29. Soder B, Airila Mansson S, Soder PO, Kari K, MeurmanJ. Levels of matrix metalloproteinases-8 and -9 withsimultaneous presence of periodontal pathogens ingingival crevicular fluid as well as matrix metallopro-teinase-9 and cholesterol in blood. J Periodontal Res2006;41:411-417.
30. Bobetsis YA, Barros SP, Lin DM, et al. Bacterialinfection promotes DNA hypermethylation. J DentRes 2007;86:169-174.
J Periodontol • March 2009 Ramseier, Kinney, Herr, et al.
445
31. Kornman K, Duff G, Reilly P. Re: A critical assessmentof interleukin-1 (IL-1) genotyping when used in a geneticsusceptibility test for severe chronic periodontitis.Greenstein G, Hart TC (2002;73:231-247). J Periodontol2002;73:1553-1556.
32. Socransky SS, Haffajee AD, Cugini MA, Smith C, KentRL Jr. Microbial complexes in subgingival plaque.J Clin Periodontol 1998;25:134-144.
33. Christodoulides N, Floriano PN, Miller CS, et al. Lab-on-a-chip methods for point-of-care measurements ofsalivary biomarkers of periodontitis. Ann N Y Acad Sci2007;1098:411-428.
34. Golub LM, Lee HM, Greenwald RA, et al. A matrixmetalloproteinase inhibitor reduces bone-type colla-gen degradation fragments and specific collagenasesin gingival crevicular fluid during adult periodontitis.Inflamm Res 1997;46:310-319.
35. Kinane DF, Darby IB, Said S, et al. Changes in gingivalcrevicular fluid matrix metalloproteinase-8 levels dur-ing periodontal treatment and maintenance. J Peri-odontal Res 2003;38:400-404.
36. Prescher N, Maier K, Munjal SK, et al. Rapid quanti-tative chairside test for active MMP-8 in gingivalcrevicular fluid: First clinical data. Ann N Y Acad Sci2007;1098:493-495.
37. Oringer RJ, Palys MD, Iranmanesh A, et al. C-telopep-tide pyridinoline cross-links (ICTP) and periodontalpathogens associated with endosseous oral implants.Clin Oral Implants Res 1998;9:365-373.
38. Palys MD, Haffajee AD, Socransky SS, Giannobile WV.Relationship between C-telopeptide pyridinolinecross-links (ICTP) and putative periodontal patho-gens in periodontitis. J Clin Periodontol 1998;25:865-871.
39. Loesche WJ, Syed SA, Stoll J. Trypsin-like activity insubgingival plaque. A diagnostic marker for spiro-chetes and periodontal disease? J Periodontol 1987;58:266-273.
40. Ligtenberg AJ, de Soet JJ, Veerman EC, AmerongenAV. Oral diseases: From detection to diagnostics. AnnN Y Acad Sci 2007;1098:200-203.
Correspondence: Dr. William Giannobile, Michigan Centerfor Oral Health Research, University of Michigan School ofDentistry, 24 Frank Lloyd Wright Dr., Lobby M, Box 422,Ann Arbor, MI 48106. Fax: 734/998-7228; e-mail: [email protected].
Submitted September 18, 2008; accepted for publicationNovember 17, 2008.
Pathogen and Host-Response Profiling for Periodontitis Volume 80 • Number 3
446
Related Documents