RESEARCH ARTICLE Identification of oxidized proteins in rat plasma using avidin chromatography and tandem mass spectrometry Hamid Mirzaei 1 , Beatriz Baena 2 , Coral Barbas 2 and Fred Regnier 1 1 Department of Chemistry, Purdue University, West Lafayette, IN, USA 2 Pharmacy Faculty, Campus Monteprincipe, San Pablo-CEU University, Madrid, Spain The objective in much of the proteomics literature today is to establish the difference between healthy and disease states at the protein level using blood plasma. A critical component in this endeavor is to establish what is normal. The focus of the work reported here was to do this with oxidized proteins that might relate to oxidative stress and oxidative stress-related diseases. Oxida- tive stress is known to increase markedly in cancer, diabetes, heart disease, and neurodegenerative diseases. Since proteins are one of the targets of ROS, generated by oxidative stress, oxidized proteins are excellent biomarker candidates for these diseases. But first it is necessary to identify oxidized proteins that occur in the healthy state. Healthy rat plasma was used in this study as a source for the identification of naturally oxidized proteins. Freshly drawn blood was treated with biotin hydrazide to selectively derivatize carbonyl groups in oxidized proteins. Oxidized proteins thus biotinylated were separated from the other plasma proteins using avidin affinity chroma- tography. Affinity selected proteins were further fractionated on a C 8 RP column and fractions collected. The collected fractions were then tryptic digested and the peptides identified using a combination of LC/MS/MSand database searches. One hundred forty-six proteins were identified using 700 signature peptides from the tryptic digested chromatographic fractions. The most fre- quently encountered proteins in the samples were keratins. Brain and liver were among the organs contributing the most oxidized proteins to plasma followed by heart and kidney. Received: April 10, 2007 Revised: October 18, 2007 Accepted: December 7, 2007 Keywords: Carbonylation / Carbonylated proteins / Oxidized keratin / Plasma oxidized proteins 1516 Proteomics 2008, 8, 1516–1527 1 Introduction ROS are known to play an integral role in aging [1, 2] and oxidative stress diseases such as cancers, heart disease, Alz- heimer disease, and Parkinson disease [3–5]. Severe oxidative stress can even cause cell death. Although the mechanism for oxidative stress diseases is not well understood [6], irre- versible oxidative modification of proteins to the carbonyl level is central to their pathology. For this reason, introduc- tion of aldehyde and ketone groups into proteins through oxidation of amino acid side chains and polypeptide back- bone cleavage is being used increasingly to monitor the severity of oxidative stress [7–11]. Of the little known about ROS and protein carbonylation, ROS are of both internal and external origin. Normal cellular metabolism in eukaryotes produces ROS, generally in mito- chondria or through lipid peroxidation. External ROS in contrast come to cells through the circulatory system. The question being examined here is whether trafficking of ROS leads to the oxidation of circulatory proteins. Blood plasma is an exceptional proteome in that it contains blood specific proteins such as albumin, transferrin, ceruloplasmin, and Igs [12] in addition to a multitude of proteins arising from cell lysis and the shedding of proteins from cell surfaces. Correspondence: Professor Fred E. Regnier, Department of Chemistry, Purdue University, 560 Oval Drive, West Lafayette, IN 47907-2084, USA E-mail: [email protected] Fax: 11-765-494-0239 Abbreviations: CPP, carbonylated plasma proteome; GO, gene ontology; RPC, RP chromatography; TLCK, tosyl-L-lysine chloro- methyl ketone DOI 10.1002/pmic.200700363 © 2008 WILEY-VCH Verlag GmbH & Co. KGaA, Weinheim www.proteomics-journal.com

Welcome message from author
This document is posted to help you gain knowledge. Please leave a comment to let me know what you think about it! Share it to your friends and learn new things together.
Transcript
RESEARCH ARTICLE
Identification of oxidized proteins in rat plasma using
avidin chromatography and tandem mass spectrometry
Hamid Mirzaei1, Beatriz Baena2, Coral Barbas2 and Fred Regnier1
1 Department of Chemistry, Purdue University, West Lafayette, IN, USA2 Pharmacy Faculty, Campus Monteprincipe, San Pablo-CEU University, Madrid, Spain
The objective in much of the proteomics literature today is to establish the difference betweenhealthy and disease states at the protein level using blood plasma. A critical component in thisendeavor is to establish what is normal. The focus of the work reported here was to do this withoxidized proteins that might relate to oxidative stress and oxidative stress-related diseases. Oxida-tive stress is known to increase markedly in cancer, diabetes, heart disease, and neurodegenerativediseases. Since proteins are one of the targets of ROS, generated by oxidative stress, oxidizedproteins are excellent biomarker candidates for these diseases. But first it is necessary to identifyoxidized proteins that occur in the healthy state. Healthy rat plasma was used in this study as asource for the identification of naturally oxidized proteins. Freshly drawn blood was treated withbiotin hydrazide to selectively derivatize carbonyl groups in oxidized proteins. Oxidized proteinsthus biotinylated were separated from the other plasma proteins using avidin affinity chroma-tography. Affinity selected proteins were further fractionated on a C8 RP column and fractionscollected. The collected fractions were then tryptic digested and the peptides identified using acombination of LC/MS/MS and database searches. One hundred forty-six proteins were identifiedusing 700 signature peptides from the tryptic digested chromatographic fractions. The most fre-quently encountered proteins in the samples were keratins. Brain and liver were among theorgans contributing the most oxidized proteins to plasma followed by heart and kidney.
Received: April 10, 2007Revised: October 18, 2007
Accepted: December 7, 2007
Keywords:
Carbonylation / Carbonylated proteins / Oxidized keratin / Plasma oxidized proteins
1516 Proteomics 2008, 8, 1516–1527
1 Introduction
ROS are known to play an integral role in aging [1, 2] andoxidative stress diseases such as cancers, heart disease, Alz-heimer disease, and Parkinson disease [3–5]. Severe oxidativestress can even cause cell death. Although the mechanismfor oxidative stress diseases is not well understood [6], irre-
versible oxidative modification of proteins to the carbonyllevel is central to their pathology. For this reason, introduc-tion of aldehyde and ketone groups into proteins throughoxidation of amino acid side chains and polypeptide back-bone cleavage is being used increasingly to monitor theseverity of oxidative stress [7–11].
Of the little known about ROS and protein carbonylation,ROS are of both internal and external origin. Normal cellularmetabolism in eukaryotes produces ROS, generally in mito-chondria or through lipid peroxidation. External ROS incontrast come to cells through the circulatory system. Thequestion being examined here is whether trafficking of ROSleads to the oxidation of circulatory proteins. Blood plasma isan exceptional proteome in that it contains blood specificproteins such as albumin, transferrin, ceruloplasmin, andIgs [12] in addition to a multitude of proteins arising fromcell lysis and the shedding of proteins from cell surfaces.
Correspondence: Professor Fred E. Regnier, Department ofChemistry, Purdue University, 560 Oval Drive, West Lafayette, IN47907-2084, USAE-mail: [email protected]: 11-765-494-0239
Abbreviations: CPP, carbonylated plasma proteome; GO, geneontology; RPC, RP chromatography; TLCK, tosyl-L-lysine chloro-methyl ketone
DOI 10.1002/pmic.200700363
© 2008 WILEY-VCH Verlag GmbH & Co. KGaA, Weinheim www.proteomics-journal.com
Proteomics 2008, 8, 1516–1527 Animal Proteomics 1517
This means that the blood proteome is of substantial com-plexity.
The ease with which blood can be collected and the factthat it contains proteins from every organ in the body makesit an obvious choice to look for disease markers. The problemis that proteins that are found to vary in concentration in as-sociation with a disease may not be involved in the mechan-ism of the disease as we know from Alzheimer’s disease andcancer [13, 14]. Although fibrinogen and a-1-antitrypsin pre-cursor increase in carbonylation in association with Alzhei-mer’s disease [15], neither can be connected to diseasepathology. Moreover, it is not clear whether the observedincrease in carbonylation is due to a change in expression orPTM. Colon cancer provides a similar case. While there is asignificant increase in total carbonylated proteins associatedwith the disease [16] and surgical removal of the tumorrestores protein carbonylation to normal levels, chemother-apy and radiation therapy on the other hand increase carbo-nylation levels. So in the end it is not clear whether theincrease in carbonylation was caused by cancer or it was aside effect of treatment.
Similar observations have been made with other forms ofcancer but it is not known whether oxidized proteins accu-mulate as a result of cancer or whether they cause cancer.Also, there is not enough known about normal levels of pro-tein oxidation and the specific proteins involved in all theoxidative stress diseases. It is difficult to search for what isabnormal before knowing what is normal.
Because of the unique features of blood and the fact thatit is so widely used in biomarker discovery, there is a greatinterest in using blood to search for oxidized protein markersin the case of oxidative stress diseases. But before that ispossible it is necessary to determine whether there are oxi-dized proteins in plasma of normal individuals. Rats werechosen for study because of the genetic homogeneity of lab-oratory populations as oppose to the human population.Carbonylated proteins were avidin selected from plasmasamples following biotinylation of carbonyl groups with5 mM biotin hydrazide and reduction of the resulting Schiffbase. Oxidized proteins thus derivatized and selected werefurther fractionated by RP chromatography (RPC). RPCfractions were collected, tryptic digested, and the trypticpeptides sequenced by MS/MS.
2 Materials and methods
2.1 Materials
Biotin hydrazide, ultralinked immobilized monomeric avi-din, D-biotin, sodium cyanoborohydride, TFA, and Slide-A-Lyzer dialysis cassettes were purchased from Pierce (Rock-ford, IL, USA). Iodoacetamide, DTT, trypsin, and N-alpha-tosyl-L-lysine chloromethyl ketone (TLCK) were obtainedfrom Sigma Chemical (St. Louis, MO, USA). Sodium phos-phate, urea, sodium chloride, and calcium chloride were
purchased from Mallinkrodt (St. Louis, MO, USA). Proteaseinhibitor cocktail was purchased from Roche Diagnostics(Indianapolis, IN, USA). ZipTip pipette tips were purchasedfrom Millipore Corporation (Bedford, MA, USA). Vydac208TP54 RP C8 column were purchased from W. R. Grace(Columbia, MD, USA). The affinity selection and RPC anal-yses were done on an Integral Micro-Analytical Workstation(PE Biosystems, Framingham, MA, USA). Mass spectralanalyses were done using a PE Sciex QSTAR™ hybrid LC/MS/MS Quadrupole TOF mass spectrometer. All spectrawere obtained in the positive ion mode.
2.2 Preparation of plasma from healthy rats
Plasma samples were obtained from four female Sprague–Dawley rats (total of four), each weighing roughly 250 g.These samples were prepared and analyzed individually.Animals were anaesthetized with 75–100 mg/kg ketamine–2.5 mg/kg azepromacine and blood was withdrawn by car-diac puncture in EDTA. Blood was rapidly centrifugedimmediately after samples were drawn.
2.3 Biotinylation of carbonylated proteins in plasma
Immediately after centrifugation of plasma, 300 mL ofplasma was mixed with 300 mL of 10 mM biotin hydrazide toa final concentration of 5 mM biotin hydrazide and the mix-ture allowed to react for 2 h at room temperature. Afteraddition to the sample of an equal volume of 30 mM sodiumcyanoborohydride in PBS, the mixture was stored in an icebath for 45 min while reduction of the Schiff base proceeded.Excess reactants were remove after the reaction by dialysisagainst PBS.
2.4 Avidin affinity selection
Ultralinked immobilized monomeric avidin was packed intoa stainless steel column (4.6 mm6100 mm, 1.7 mL volume)at 100 psi. The packed column was washed with ten columnvolumes of PBS (0.1 M sodium phosphate, 0.15 M NaCl,pH 7.4) and five column volumes of biotin blocking andelution buffer (BBEB) (2 mM D-biotin in PBS) to block anynonreversible biotin-binding site on the column. Biotin wasremoved from reversible biotin binding sites by washingwith five column volumes of a regeneration buffer (0.1 Mglycine, pH 2.8). Finally, the column was re-equilibrated withten column volumes of PBS. Five hundred microliter ofsample (2 mg/mL) followed by 0.25 mL of PBS was loadedinto the column. The column was incubated at room tem-perature for 1 h and washed with ten column volumes ofPBS to remove all unbound proteins. Biotinylated proteinswere eluted with ten column volumes of BBEB, and the col-umn was regenerated with ten column volumes of columnregeneration buffer followed by ten column volumes of PBS.
© 2008 WILEY-VCH Verlag GmbH & Co. KGaA, Weinheim www.proteomics-journal.com
1518 H. Mirzaei et al. Proteomics 2008, 8, 1516–1527
2.5 RP separation of biotinylated proteins
A Vydac 208TP54 RP C8 column was used to desalt andfractionate biotinylated proteins. The RP column was equili-brated with five column volumes of buffer A (99.5% de-ionized H2O (dI H2O), 0.5% ACN, and 0.1% TFA). Six molarurea was added to further denature the selected proteinsbefore application to the RP column. After a five columnvolume wash a linear 60 min gradient was applied from100% buffer A to 60% buffer B (5% dI H2O, 95% ACN, and0.1% TFA) to elute proteins from the column. A total of 27fractions were collected. Collected fraction were vacuumdried and stored for digestion.
2.6 Proteolysis
Urea (6 M) and 10 mM DTT were added to protein fractions.After a 1 h incubation at 657C, iodoacetamide was added to afinal concentration of 10 mM and the reaction allowed toproceed for an additional 30 min at 47C. Samples were thendiluted six-fold by addition of 50 mM HEPES (pH 8.0) in10 mM CaCl2. Sequence grade trypsin (2%) was added andthe reaction mixture incubated at 377C for at least 8 h. Pro-teolysis was stopped by addition of TLCK (trypsin:TLCK ratioof 1:1 w/w).
2.7 LC/MS/MS of digested fractions and database
searches
Tryptic peptides were separated on an Agilent zorbax C18
column (0.5 mm6150 mm) using an Agilent 1100 seriesinstrument (Agilent Technologies, Palo Alto, CA, USA) at4 mL/min. Solvent A was 0.01% TFA in dI H2O and solvent Bwas 95% ACN/0.01% TFA in dI H2O. Flow from the columnwas directed to a Q-STAR workstation (Applied Biosystems,Framingham, MA) equipped with an ESI source. Peptideswere separated in a 60 min linear gradient (from 0% B to60% B). MS/MS spectra were obtained in the positive ionmode using 5400 volts of ionization voltage and 30 units ofcurtain gas at a sampling rate of one spectrum per second.The top three peptides with charges ranging from 21 to 41
were monitored by MS/MS. Previous ions were excluded for60 s. The centroid value of MS/MS peaks was determinedusing the following parameters. The merge distance was setat 100 ppm with minimum and maximum widths of 10 and500 ppm, respectively. The percentage height was set at 50and MASCOT was used for all searches. The followingsearch parameters were used for peptide identification: thedatabase was from ExPASy; the taxonomy was taken to beRattus norvegicus; proteolysis was achieved with trypsin; up tofour missed cleavages were allowed; carbamidomethylationof cysteine was considered in all cases as a fixed modifica-tion; biotinylation of carbonylated arginine, lysine, threo-nine, and proline in addition to oxidation of methionine,histidine, and tryptophan and nitrosylation of tyrosine wereconsidered as variable modifications [17], the peptide toler-
ance was set at 61.2 Da; MS/MS tolerance was 60.6 Da, thecharge was specified for each peptide; and monoisotopicpeaks were used for identification. The MASCOT scoringsystem was used as a measure of identification certainty. Adetailed description of the MASCOT scoring system can befound at http://www.matrixscience.com/help/scoring_help.The score threshold was adjusted to a 5% rate of false posi-tives.
2.8 Comparative analysis of oxidized proteins
identified from different samples
Proteins identified from all RPC fractions of a sample werepooled and compared against those from other samples tofind proteins common to all samples using Microsoft Excel.Excel spreadsheets were also used to determine the totalnumber of unique peptides identified, the number of carbo-nylated peptides, and other statistical analysis.
3 Results
3.1 Analytical strategies
The objective of these studies was to recognize and identifyproteins in plasma that had acquired aldehyde and ketonegroups through oxidation. This was achieved in a multiplestep process involving: (i) derivatization of carbonyl groupson oxidized proteins in freshly collected plasma with biotinhydrazide, (ii) reduction of the resulting –C=N– bond be-tween biotin hydrazide and the protein with sodium cyano-borohydride, (iii) affinity selection of biotinylated proteins byavidin affinity chromatography [17, 18], (iv) fractionation ofthe selected proteins on a C8 RP column, (v) trypsin digestionof the digested fractions, and (vi) identification of the trypticpeptides by MS/MS. The advantage of this approach is thatfractionation is occurring at the protein level and all trypticpeptides from a protein will be found in the same fraction.LC based proteomics is generally achieved by trypsin digest-ing the proteome before fractionation. This means that pep-tides from a proteins will be spread across multiple chro-matographic fractions and be more difficult to recognize ashaving come from a single protein [19].
Avidin shows such an enormous binding affinity forbiotin that recovery of biotinylated proteins from immobi-lized avidin columns is poor [20]. For this reason, immobi-lized monomeric avidin was used because it is easier to elutebound proteins. In fact, elution of biotinylated proteins fromthe monomeric avidin affinity column was achieved by dis-placement with 2 mM D-biotin in PBS (pH 7.4). Becausethese conditions are nearly physiological, complexes of pro-teins associated with biotinylated proteins are not likely to bedissociated. This means protein(s) in the complex that havenot been oxidized can be captured by the avidin affinity col-umn and identified as well.
© 2008 WILEY-VCH Verlag GmbH & Co. KGaA, Weinheim www.proteomics-journal.com
Proteomics 2008, 8, 1516–1527 Animal Proteomics 1519
3.2 Affinity selection of biotinylated proteins
Subsequent to biotinylation, there was sufficient unreactedbiotin hydrazide in samples to interfere with the binding ofbiotinylated proteins to avidin columns. Excess biotin hydra-zide was removed from plasma samples by dialysis. Biotiny-lated samples were then loaded on a 4.6 mm6100 mm col-umn at a linear velocity of 2 mm/sec using PBS as themobile phase followed by a ten column volume wash withthe loading buffer. The objective in using a large volume ofwashing buffer was to remove proteins weakly associatedwith biotinylated proteins. After elution of biotinylated pro-teins from the affinity column with 2 mM D-biotin in PBS(pH 7.4) the avidin column was recycled by washing with tencolumn volumes of regeneration buffer (0.1 M glycine,pH 2.8) and then with ten column volumes of loadingmobile phase.
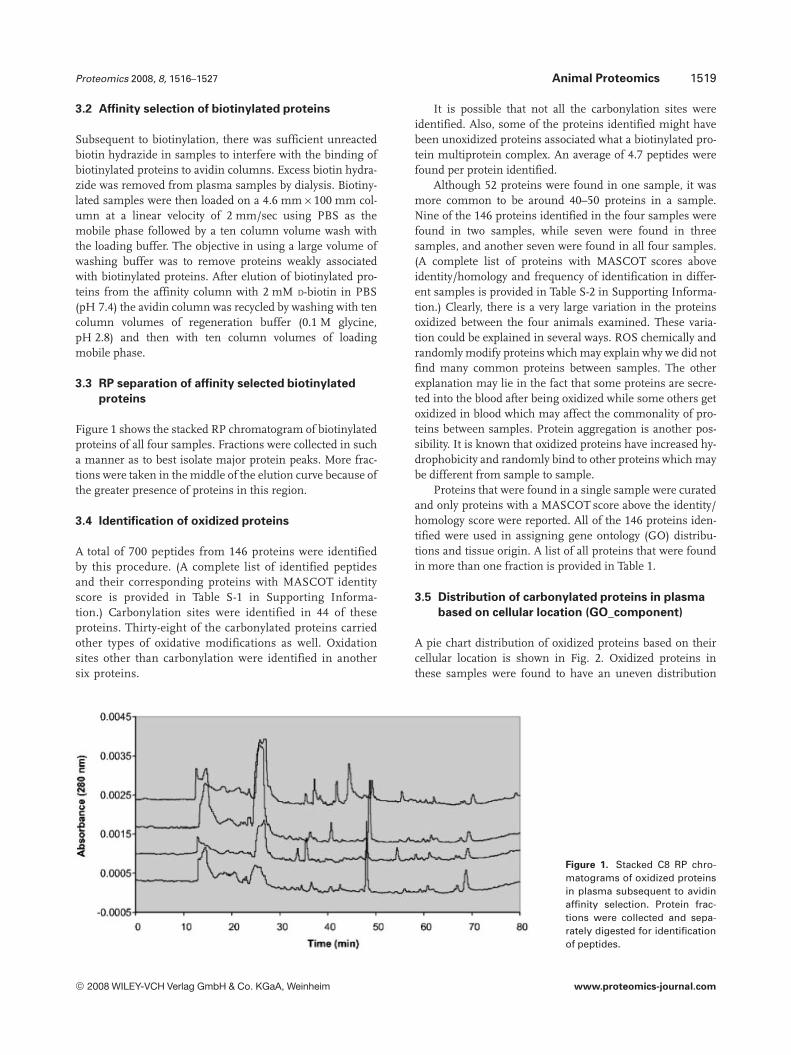
3.3 RP separation of affinity selected biotinylated
proteins
Figure 1 shows the stacked RP chromatogram of biotinylatedproteins of all four samples. Fractions were collected in sucha manner as to best isolate major protein peaks. More frac-tions were taken in the middle of the elution curve because ofthe greater presence of proteins in this region.
3.4 Identification of oxidized proteins
A total of 700 peptides from 146 proteins were identifiedby this procedure. (A complete list of identified peptidesand their corresponding proteins with MASCOT identityscore is provided in Table S-1 in Supporting Informa-tion.) Carbonylation sites were identified in 44 of theseproteins. Thirty-eight of the carbonylated proteins carriedother types of oxidative modifications as well. Oxidationsites other than carbonylation were identified in anothersix proteins.
It is possible that not all the carbonylation sites wereidentified. Also, some of the proteins identified might havebeen unoxidized proteins associated what a biotinylated pro-tein multiprotein complex. An average of 4.7 peptides werefound per protein identified.
Although 52 proteins were found in one sample, it wasmore common to be around 40–50 proteins in a sample.Nine of the 146 proteins identified in the four samples werefound in two samples, while seven were found in threesamples, and another seven were found in all four samples.(A complete list of proteins with MASCOT scores aboveidentity/homology and frequency of identification in differ-ent samples is provided in Table S-2 in Supporting Informa-tion.) Clearly, there is a very large variation in the proteinsoxidized between the four animals examined. These varia-tion could be explained in several ways. ROS chemically andrandomly modify proteins which may explain why we did notfind many common proteins between samples. The otherexplanation may lie in the fact that some proteins are secre-ted into the blood after being oxidized while some others getoxidized in blood which may affect the commonality of pro-teins between samples. Protein aggregation is another pos-sibility. It is known that oxidized proteins have increased hy-drophobicity and randomly bind to other proteins which maybe different from sample to sample.
Proteins that were found in a single sample were curatedand only proteins with a MASCOT score above the identity/homology score were reported. All of the 146 proteins iden-tified were used in assigning gene ontology (GO) distribu-tions and tissue origin. A list of all proteins that were foundin more than one fraction is provided in Table 1.
3.5 Distribution of carbonylated proteins in plasma
based on cellular location (GO_component)
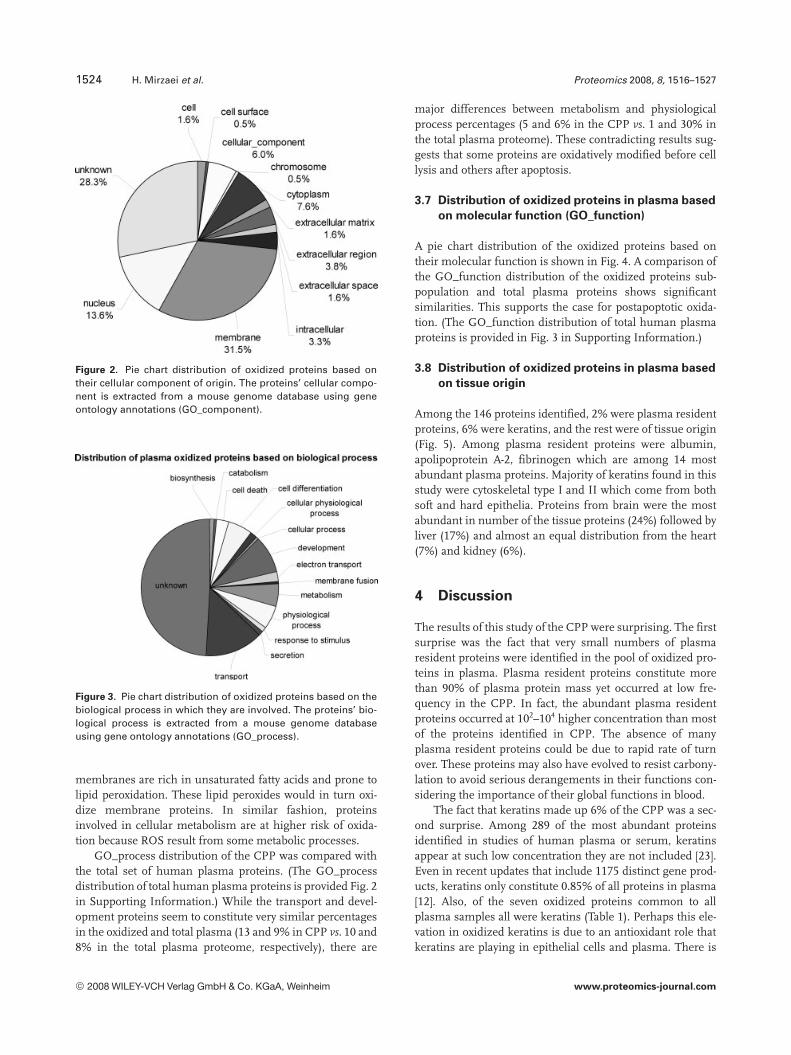
A pie chart distribution of oxidized proteins based on theircellular location is shown in Fig. 2. Oxidized proteins inthese samples were found to have an uneven distribution
Figure 1. Stacked C8 RP chro-matograms of oxidized proteinsin plasma subsequent to avidinaffinity selection. Protein frac-tions were collected and sepa-rately digested for identificationof peptides.
© 2008 WILEY-VCH Verlag GmbH & Co. KGaA, Weinheim www.proteomics-journal.com
1520 H. Mirzaei et al. Proteomics 2008, 8, 1516–1527
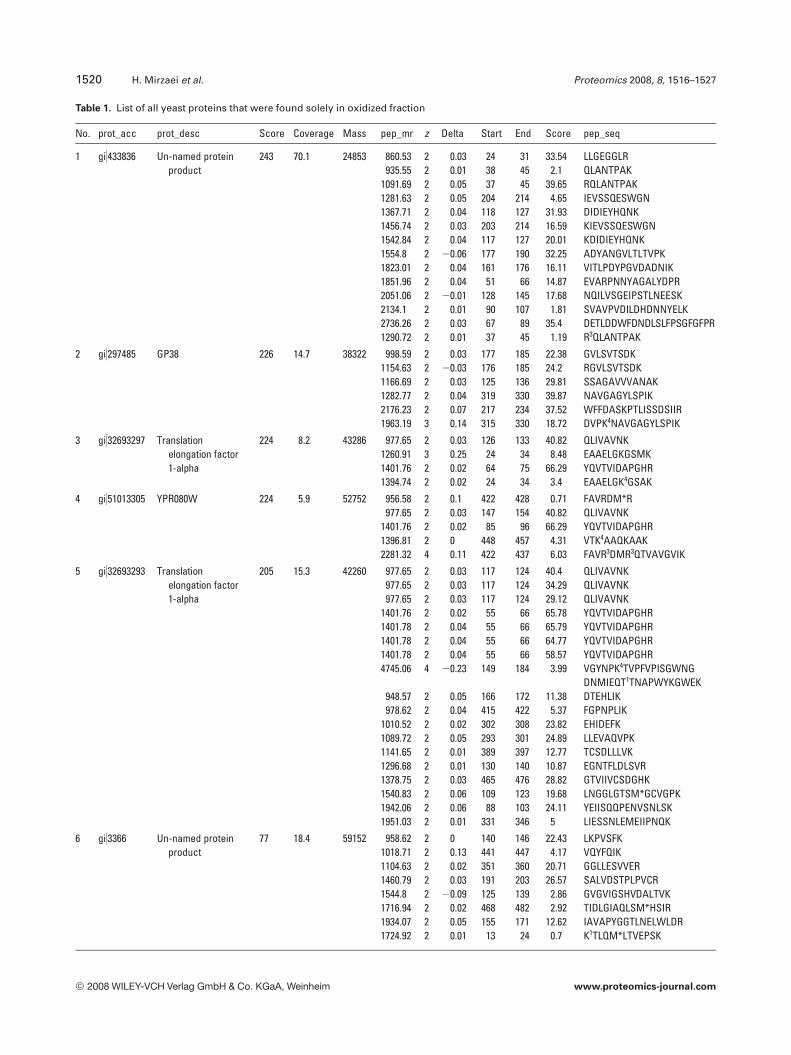
Table 1. List of all yeast proteins that were found solely in oxidized fraction
No. prot_acc prot_desc Score Coverage Mass pep_mr z Delta Start End Score pep_seq
1 gi)433836 Un-named proteinproduct
243 70.1 24853 860.53 2 0.03 24 31 33.54 LLGEGGLR935.55 2 0.01 38 45 2.1 QLANTPAK
1091.69 2 0.05 37 45 39.65 RQLANTPAK1281.63 2 0.05 204 214 4.65 IEVSSQESWGN1367.71 2 0.04 118 127 31.93 DIDIEYHQNK1456.74 2 0.03 203 214 16.59 KIEVSSQESWGN1542.84 2 0.04 117 127 20.01 KDIDIEYHQNK1554.8 2 20.06 177 190 32.25 ADYANGVLTLTVPK1823.01 2 0.04 161 176 16.11 VITLPDYPGVDADNIK1851.96 2 0.04 51 66 14.87 EVARPNNYAGALYDPR2051.06 2 20.01 128 145 17.68 NQILVSGEIPSTLNEESK2134.1 2 0.01 90 107 1.81 SVAVPVDILDHDNNYELK2736.26 2 0.03 67 89 35.4 DETLDDWFDNDLSLFPSGFGFPR1290.72 2 0.01 37 45 1.19 R3QLANTPAK
2 gi)297485 GP38 226 14.7 38322 998.59 2 0.03 177 185 22.38 GVLSVTSDK1154.63 2 20.03 176 185 24.2 RGVLSVTSDK1166.69 2 0.03 125 136 29.81 SSAGAVVVANAK1282.77 2 0.04 319 330 39.87 NAVGAGYLSPIK2176.23 2 0.07 217 234 37.52 WFFDASKPTLISSDSIIR1963.19 3 0.14 315 330 18.72 DVPK4NAVGAGYLSPIK
3 gi)32693297 Translationelongation factor1-alpha
224 8.2 43286 977.65 2 0.03 126 133 40.82 QLIVAVNK1260.91 3 0.25 24 34 8.48 EAAELGKGSMK1401.76 2 0.02 64 75 66.29 YQVTVIDAPGHR1394.74 2 0.02 24 34 3.4 EAAELGK4GSAK
4 gi)51013305 YPR080W 224 5.9 52752 956.58 2 0.1 422 428 0.71 FAVRDM*R977.65 2 0.03 147 154 40.82 QLIVAVNK
1401.76 2 0.02 85 96 66.29 YQVTVIDAPGHR1396.81 2 0 448 457 4.31 VTK4AAQKAAK2281.32 4 0.11 422 437 6.03 FAVR3DMR3QTVAVGVIK
5 gi)32693293 Translationelongation factor1-alpha
205 15.3 42260 977.65 2 0.03 117 124 40.4 QLIVAVNK977.65 2 0.03 117 124 34.29 QLIVAVNK977.65 2 0.03 117 124 29.12 QLIVAVNK
1401.76 2 0.02 55 66 65.78 YQVTVIDAPGHR1401.78 2 0.04 55 66 65.79 YQVTVIDAPGHR1401.78 2 0.04 55 66 64.77 YQVTVIDAPGHR1401.78 2 0.04 55 66 58.57 YQVTVIDAPGHR4745.06 4 20.23 149 184 3.99 VGYNPK4TVPFVPISGWNG
DNMIEQT1TNAPWYKGWEK948.57 2 0.05 166 172 11.38 DTEHLIK978.62 2 0.04 415 422 5.37 FGPNPLIK
1010.52 2 0.02 302 308 23.82 EHIDEFK1089.72 2 0.05 293 301 24.89 LLEVAQVPK1141.65 2 0.01 389 397 12.77 TCSDLLLVK1296.68 2 0.01 130 140 10.87 EGNTFLDLSVR1378.75 2 0.03 465 476 28.82 GTVIIVCSDGHK1540.83 2 0.06 109 123 19.68 LNGGLGTSM*GCVGPK1942.06 2 0.06 88 103 24.11 YEIISQQPENVSNLSK1951.03 2 0.01 331 346 5 LIESSNLEMEIIPNQK
6 gi)3366 Un-named proteinproduct
77 18.4 59152 958.62 2 0 140 146 22.43 LKPVSFK1018.71 2 0.13 441 447 4.17 VQYFQIK1104.63 2 0.02 351 360 20.71 GGLLESVVER1460.79 2 0.03 191 203 26.57 SALVDSTPLPVCR1544.8 2 20.09 125 139 2.86 GVGVIGSHVDALTVK1716.94 2 0.02 468 482 2.92 TIDLGIAQLSM*HSIR1934.07 2 0.05 155 171 12.62 IAVAPYGGTLNELWLDR1724.92 2 0.01 13 24 0.7 K1TLQM*LTVEPSK
© 2008 WILEY-VCH Verlag GmbH & Co. KGaA, Weinheim www.proteomics-journal.com
Proteomics 2008, 8, 1516–1527 Animal Proteomics 1521
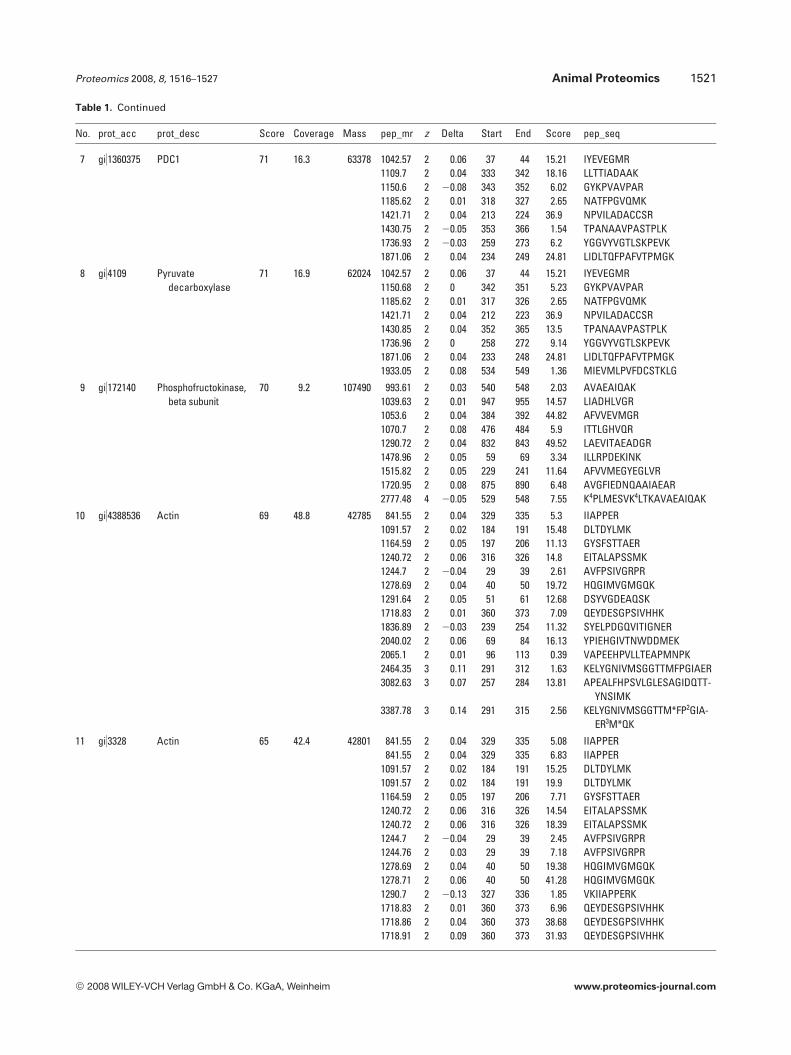
Table 1. Continued
No. prot_acc prot_desc Score Coverage Mass pep_mr z Delta Start End Score pep_seq
7 gi)1360375 PDC1 71 16.3 63378 1042.57 2 0.06 37 44 15.21 IYEVEGMR1109.7 2 0.04 333 342 18.16 LLTTIADAAK1150.6 2 20.08 343 352 6.02 GYKPVAVPAR1185.62 2 0.01 318 327 2.65 NATFPGVQMK1421.71 2 0.04 213 224 36.9 NPVILADACCSR1430.75 2 20.05 353 366 1.54 TPANAAVPASTPLK1736.93 2 20.03 259 273 6.2 YGGVYVGTLSKPEVK1871.06 2 0.04 234 249 24.81 LIDLTQFPAFVTPMGK
8 gi)4109 Pyruvatedecarboxylase
71 16.9 62024 1042.57 2 0.06 37 44 15.21 IYEVEGMR1150.68 2 0 342 351 5.23 GYKPVAVPAR1185.62 2 0.01 317 326 2.65 NATFPGVQMK1421.71 2 0.04 212 223 36.9 NPVILADACCSR1430.85 2 0.04 352 365 13.5 TPANAAVPASTPLK1736.96 2 0 258 272 9.14 YGGVYVGTLSKPEVK1871.06 2 0.04 233 248 24.81 LIDLTQFPAFVTPMGK1933.05 2 0.08 534 549 1.36 MIEVMLPVFDCSTKLG
9 gi)172140 Phosphofructokinase,beta subunit
70 9.2 107490 993.61 2 0.03 540 548 2.03 AVAEAIQAK1039.63 2 0.01 947 955 14.57 LIADHLVGR1053.6 2 0.04 384 392 44.82 AFVVEVMGR1070.7 2 0.08 476 484 5.9 ITTLGHVQR1290.72 2 0.04 832 843 49.52 LAEVITAEADGR1478.96 2 0.05 59 69 3.34 ILLRPDEKINK1515.82 2 0.05 229 241 11.64 AFVVMEGYEGLVR1720.95 2 0.08 875 890 6.48 AVGFIEDNQAAIAEAR2777.48 4 20.05 529 548 7.55 K4PLMESVK4LTKAVAEAIQAK
10 gi)4388536 Actin 69 48.8 42785 841.55 2 0.04 329 335 5.3 IIAPPER1091.57 2 0.02 184 191 15.48 DLTDYLMK1164.59 2 0.05 197 206 11.13 GYSFSTTAER1240.72 2 0.06 316 326 14.8 EITALAPSSMK1244.7 2 20.04 29 39 2.61 AVFPSIVGRPR1278.69 2 0.04 40 50 19.72 HQGIMVGMGQK1291.64 2 0.05 51 61 12.68 DSYVGDEAQSK1718.83 2 0.01 360 373 7.09 QEYDESGPSIVHHK1836.89 2 20.03 239 254 11.32 SYELPDGQVITIGNER2040.02 2 0.06 69 84 16.13 YPIEHGIVTNWDDMEK2065.1 2 0.01 96 113 0.39 VAPEEHPVLLTEAPMNPK2464.35 3 0.11 291 312 1.63 KELYGNIVMSGGTTMFPGIAER3082.63 3 0.07 257 284 13.81 APEALFHPSVLGLESAGIDQTT-
YNSIMK3387.78 3 0.14 291 315 2.56 KELYGNIVMSGGTTM*FP2GIA-
ER3M*QK
11 gi)3328 Actin 65 42.4 42801 841.55 2 0.04 329 335 5.08 IIAPPER841.55 2 0.04 329 335 6.83 IIAPPER
1091.57 2 0.02 184 191 15.25 DLTDYLMK1091.57 2 0.02 184 191 19.9 DLTDYLMK1164.59 2 0.05 197 206 7.71 GYSFSTTAER1240.72 2 0.06 316 326 14.54 EITALAPSSMK1240.72 2 0.06 316 326 18.39 EITALAPSSMK1244.7 2 20.04 29 39 2.45 AVFPSIVGRPR1244.76 2 0.03 29 39 7.18 AVFPSIVGRPR1278.69 2 0.04 40 50 19.38 HQGIMVGMGQK1278.71 2 0.06 40 50 41.28 HQGIMVGMGQK1290.7 2 20.13 327 336 1.85 VKIIAPPERK1718.83 2 0.01 360 373 6.96 QEYDESGPSIVHHK1718.86 2 0.04 360 373 38.68 QEYDESGPSIVHHK1718.91 2 0.09 360 373 31.93 QEYDESGPSIVHHK
© 2008 WILEY-VCH Verlag GmbH & Co. KGaA, Weinheim www.proteomics-journal.com
1522 H. Mirzaei et al. Proteomics 2008, 8, 1516–1527
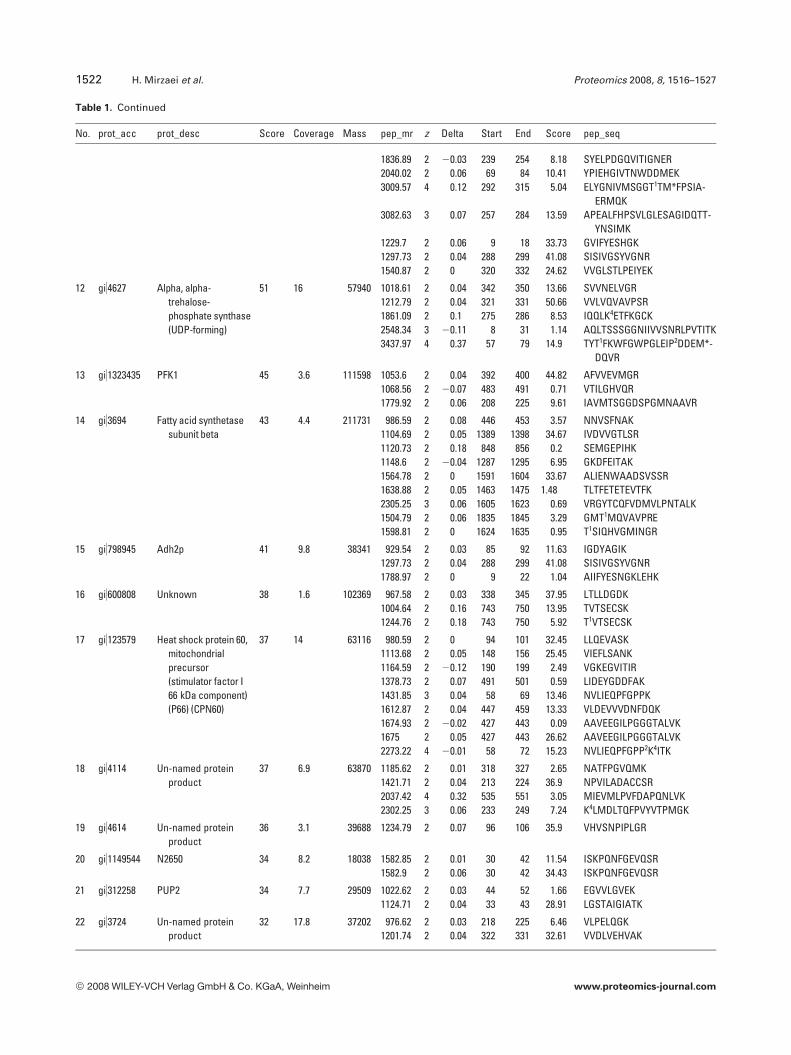
Table 1. Continued
No. prot_acc prot_desc Score Coverage Mass pep_mr z Delta Start End Score pep_seq
1836.89 2 20.03 239 254 8.18 SYELPDGQVITIGNER2040.02 2 0.06 69 84 10.41 YPIEHGIVTNWDDMEK3009.57 4 0.12 292 315 5.04 ELYGNIVMSGGT1TM*FPSIA-
ERMQK3082.63 3 0.07 257 284 13.59 APEALFHPSVLGLESAGIDQTT-
YNSIMK1229.7 2 0.06 9 18 33.73 GVIFYESHGK1297.73 2 0.04 288 299 41.08 SISIVGSYVGNR1540.87 2 0 320 332 24.62 VVGLSTLPEIYEK
12 gi)4627 Alpha, alpha-trehalose-phosphate synthase(UDP-forming)
51 16 57940 1018.61 2 0.04 342 350 13.66 SVVNELVGR1212.79 2 0.04 321 331 50.66 VVLVQVAVPSR1861.09 2 0.1 275 286 8.53 IQQLK4ETFKGCK2548.34 3 20.11 8 31 1.14 AQLTSSSGGNIIVVSNRLPVTITK3437.97 4 0.37 57 79 14.9 TYT1FKWFGWPGLEIP2DDEM*-
DQVR
13 gi)1323435 PFK1 45 3.6 111598 1053.6 2 0.04 392 400 44.82 AFVVEVMGR1068.56 2 20.07 483 491 0.71 VTILGHVQR1779.92 2 0.06 208 225 9.61 IAVMTSGGDSPGMNAAVR
14 gi)3694 Fatty acid synthetasesubunit beta
43 4.4 211731 986.59 2 0.08 446 453 3.57 NNVSFNAK1104.69 2 0.05 1389 1398 34.67 IVDVVGTLSR1120.73 2 0.18 848 856 0.2 SEMGEPIHK1148.6 2 20.04 1287 1295 6.95 GKDFEITAK1564.78 2 0 1591 1604 33.67 ALIENWAADSVSSR1638.88 2 0.05 1463 1475 1.48 TLTFETETEVTFK2305.25 3 0.06 1605 1623 0.69 VRGYTCQFVDMVLPNTALK1504.79 2 0.06 1835 1845 3.29 GMT1MQVAVPRE1598.81 2 0 1624 1635 0.95 T1SIQHVGMINGR
15 gi)798945 Adh2p 41 9.8 38341 929.54 2 0.03 85 92 11.63 IGDYAGIK1297.73 2 0.04 288 299 41.08 SISIVGSYVGNR1788.97 2 0 9 22 1.04 AIIFYESNGKLEHK
16 gi)600808 Unknown 38 1.6 102369 967.58 2 0.03 338 345 37.95 LTLLDGDK1004.64 2 0.16 743 750 13.95 TVTSECSK1244.76 2 0.18 743 750 5.92 T1VTSECSK
17 gi)123579 Heat shock protein 60,mitochondrialprecursor(stimulator factor I66 kDa component)(P66) (CPN60)
37 14 63116 980.59 2 0 94 101 32.45 LLQEVASK1113.68 2 0.05 148 156 25.45 VIEFLSANK1164.59 2 20.12 190 199 2.49 VGKEGVITIR1378.73 2 0.07 491 501 0.59 LIDEYGDDFAK1431.85 3 0.04 58 69 13.46 NVLIEQPFGPPK1612.87 2 0.04 447 459 13.33 VLDEVVVDNFDQK1674.93 2 20.02 427 443 0.09 AAVEEGILPGGGTALVK1675 2 0.05 427 443 26.62 AAVEEGILPGGGTALVK2273.22 4 20.01 58 72 15.23 NVLIEQPFGPP2K4ITK
18 gi)4114 Un-named proteinproduct
37 6.9 63870 1185.62 2 0.01 318 327 2.65 NATFPGVQMK1421.71 2 0.04 213 224 36.9 NPVILADACCSR2037.42 4 0.32 535 551 3.05 MIEVMLPVFDAPQNLVK2302.25 3 0.06 233 249 7.24 K4LMDLTQFPVYVTPMGK
19 gi)4614 Un-named proteinproduct
36 3.1 39688 1234.79 2 0.07 96 106 35.9 VHVSNPIPLGR
20 gi)1149544 N2650 34 8.2 18038 1582.85 2 0.01 30 42 11.54 ISKPQNFGEVQSR1582.9 2 0.06 30 42 34.43 ISKPQNFGEVQSR
21 gi)312258 PUP2 34 7.7 29509 1022.62 2 0.03 44 52 1.66 EGVVLGVEK1124.71 2 0.04 33 43 28.91 LGSTAIGIATK
22 gi)3724 Un-named proteinproduct
32 17.8 37202 976.62 2 0.03 218 225 6.46 VLPELQGK1201.74 2 0.04 322 331 32.61 VVDLVEHVAK
© 2008 WILEY-VCH Verlag GmbH & Co. KGaA, Weinheim www.proteomics-journal.com
Proteomics 2008, 8, 1516–1527 Animal Proteomics 1523
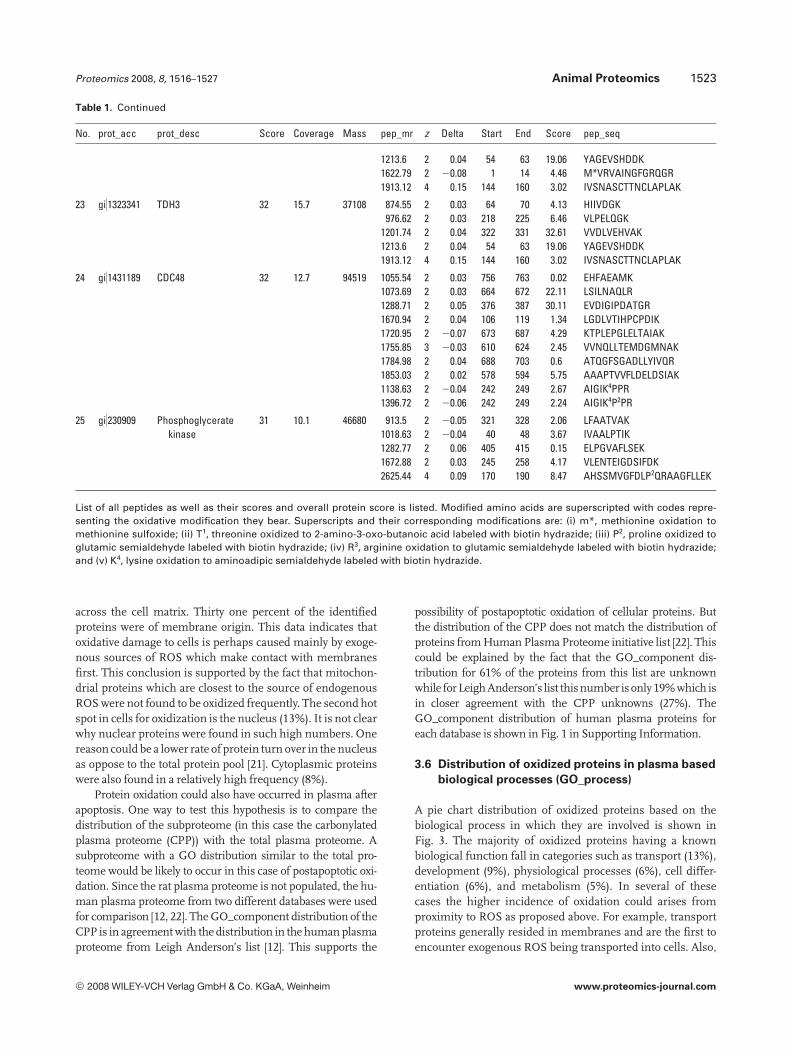
Table 1. Continued
No. prot_acc prot_desc Score Coverage Mass pep_mr z Delta Start End Score pep_seq
1213.6 2 0.04 54 63 19.06 YAGEVSHDDK1622.79 2 20.08 1 14 4.46 M*VRVAINGFGRQGR1913.12 4 0.15 144 160 3.02 IVSNASCTTNCLAPLAK
23 gi)1323341 TDH3 32 15.7 37108 874.55 2 0.03 64 70 4.13 HIIVDGK976.62 2 0.03 218 225 6.46 VLPELQGK
1201.74 2 0.04 322 331 32.61 VVDLVEHVAK1213.6 2 0.04 54 63 19.06 YAGEVSHDDK1913.12 4 0.15 144 160 3.02 IVSNASCTTNCLAPLAK
24 gi)1431189 CDC48 32 12.7 94519 1055.54 2 0.03 756 763 0.02 EHFAEAMK1073.69 2 0.03 664 672 22.11 LSILNAQLR1288.71 2 0.05 376 387 30.11 EVDIGIPDATGR1670.94 2 0.04 106 119 1.34 LGDLVTIHPCPDIK1720.95 2 20.07 673 687 4.29 KTPLEPGLELTAIAK1755.85 3 20.03 610 624 2.45 VVNQLLTEMDGMNAK1784.98 2 0.04 688 703 0.6 ATQGFSGADLLYIVQR1853.03 2 0.02 578 594 5.75 AAAPTVVFLDELDSIAK1138.63 2 20.04 242 249 2.67 AIGIK4PPR1396.72 2 20.06 242 249 2.24 AIGIK4P2PR
25 gi)230909 Phosphoglyceratekinase
31 10.1 46680 913.5 2 20.05 321 328 2.06 LFAATVAK1018.63 2 20.04 40 48 3.67 IVAALPTIK1282.77 2 0.06 405 415 0.15 ELPGVAFLSEK1672.88 2 0.03 245 258 4.17 VLENTEIGDSIFDK2625.44 4 0.09 170 190 8.47 AHSSMVGFDLP2QRAAGFLLEK
List of all peptides as well as their scores and overall protein score is listed. Modified amino acids are superscripted with codes repre-senting the oxidative modification they bear. Superscripts and their corresponding modifications are: (i) m*, methionine oxidation tomethionine sulfoxide; (ii) T1, threonine oxidized to 2-amino-3-oxo-butanoic acid labeled with biotin hydrazide; (iii) P2, proline oxidized toglutamic semialdehyde labeled with biotin hydrazide; (iv) R3, arginine oxidation to glutamic semialdehyde labeled with biotin hydrazide;and (v) K4, lysine oxidation to aminoadipic semialdehyde labeled with biotin hydrazide.
across the cell matrix. Thirty one percent of the identifiedproteins were of membrane origin. This data indicates thatoxidative damage to cells is perhaps caused mainly by exoge-nous sources of ROS which make contact with membranesfirst. This conclusion is supported by the fact that mitochon-drial proteins which are closest to the source of endogenousROS were not found to be oxidized frequently. The second hotspot in cells for oxidization is the nucleus (13%). It is not clearwhy nuclear proteins were found in such high numbers. Onereason could be a lower rate of protein turn over in the nucleusas oppose to the total protein pool [21]. Cytoplasmic proteinswere also found in a relatively high frequency (8%).
Protein oxidation could also have occurred in plasma afterapoptosis. One way to test this hypothesis is to compare thedistribution of the subproteome (in this case the carbonylatedplasma proteome (CPP)) with the total plasma proteome. Asubproteome with a GO distribution similar to the total pro-teome would be likely to occur in this case of postapoptotic oxi-dation. Since the rat plasma proteome is not populated, the hu-man plasma proteome from two different databases were usedfor comparison [12, 22]. The GO_component distribution of theCPP is in agreement with the distribution in the human plasmaproteome from Leigh Anderson’s list [12]. This supports the
possibility of postapoptotic oxidation of cellular proteins. Butthe distribution of the CPP does not match the distribution ofproteins from Human Plasma Proteome initiative list [22]. Thiscould be explained by the fact that the GO_component dis-tribution for 61% of the proteins from this list are unknownwhile for Leigh Anderson’s list this number is only 19% which isin closer agreement with the CPP unknowns (27%). TheGO_component distribution of human plasma proteins foreach database is shown in Fig. 1 in Supporting Information.
3.6 Distribution of oxidized proteins in plasma based
biological processes (GO_process)
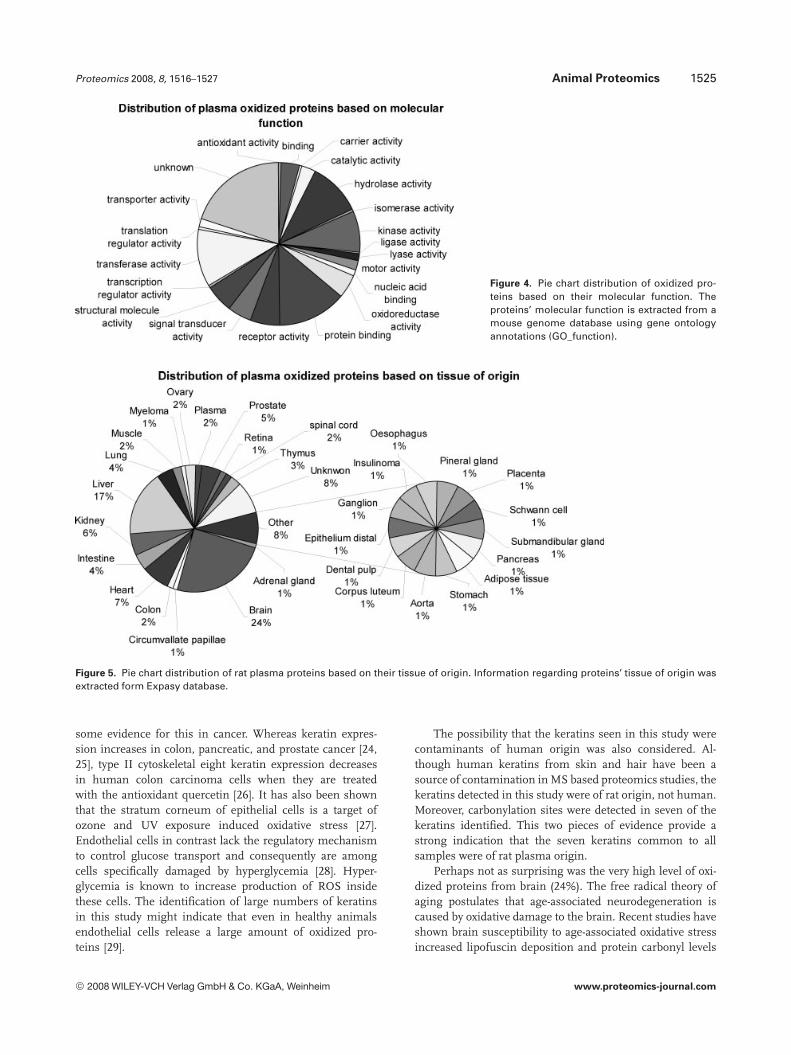
A pie chart distribution of oxidized proteins based on thebiological process in which they are involved is shown inFig. 3. The majority of oxidized proteins having a knownbiological function fall in categories such as transport (13%),development (9%), physiological processes (6%), cell differ-entiation (6%), and metabolism (5%). In several of thesecases the higher incidence of oxidation could arises fromproximity to ROS as proposed above. For example, transportproteins generally resided in membranes and are the first toencounter exogenous ROS being transported into cells. Also,
© 2008 WILEY-VCH Verlag GmbH & Co. KGaA, Weinheim www.proteomics-journal.com
1524 H. Mirzaei et al. Proteomics 2008, 8, 1516–1527
Figure 2. Pie chart distribution of oxidized proteins based ontheir cellular component of origin. The proteins’ cellular compo-nent is extracted from a mouse genome database using geneontology annotations (GO_component).
Figure 3. Pie chart distribution of oxidized proteins based on thebiological process in which they are involved. The proteins’ bio-logical process is extracted from a mouse genome databaseusing gene ontology annotations (GO_process).
membranes are rich in unsaturated fatty acids and prone tolipid peroxidation. These lipid peroxides would in turn oxi-dize membrane proteins. In similar fashion, proteinsinvolved in cellular metabolism are at higher risk of oxida-tion because ROS result from some metabolic processes.
GO_process distribution of the CPP was compared withthe total set of human plasma proteins. (The GO_processdistribution of total human plasma proteins is provided Fig. 2in Supporting Information.) While the transport and devel-opment proteins seem to constitute very similar percentagesin the oxidized and total plasma (13 and 9% in CPP vs. 10 and8% in the total plasma proteome, respectively), there are
major differences between metabolism and physiologicalprocess percentages (5 and 6% in the CPP vs. 1 and 30% inthe total plasma proteome). These contradicting results sug-gests that some proteins are oxidatively modified before celllysis and others after apoptosis.
3.7 Distribution of oxidized proteins in plasma based
on molecular function (GO_function)
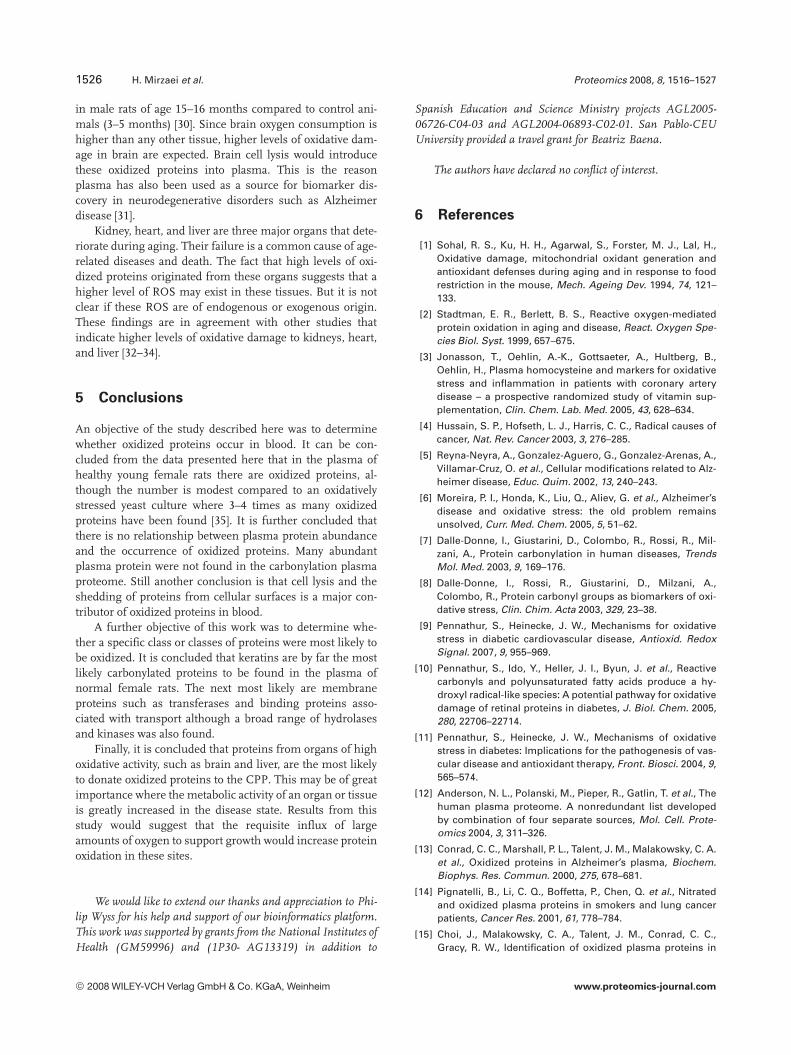
A pie chart distribution of the oxidized proteins based ontheir molecular function is shown in Fig. 4. A comparison ofthe GO_function distribution of the oxidized proteins sub-population and total plasma proteins shows significantsimilarities. This supports the case for postapoptotic oxida-tion. (The GO_function distribution of total human plasmaproteins is provided in Fig. 3 in Supporting Information.)
3.8 Distribution of oxidized proteins in plasma based
on tissue origin
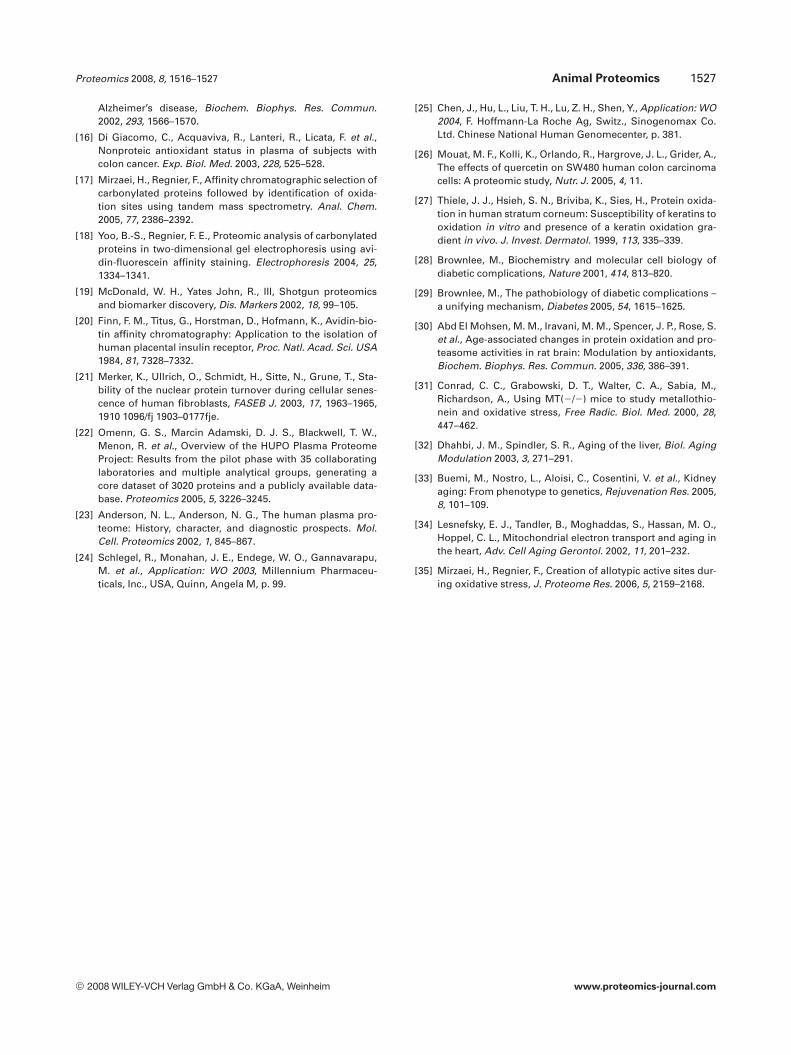
Among the 146 proteins identified, 2% were plasma residentproteins, 6% were keratins, and the rest were of tissue origin(Fig. 5). Among plasma resident proteins were albumin,apolipoprotein A-2, fibrinogen which are among 14 mostabundant plasma proteins. Majority of keratins found in thisstudy were cytoskeletal type I and II which come from bothsoft and hard epithelia. Proteins from brain were the mostabundant in number of the tissue proteins (24%) followed byliver (17%) and almost an equal distribution from the heart(7%) and kidney (6%).
4 Discussion
The results of this study of the CPP were surprising. The firstsurprise was the fact that very small numbers of plasmaresident proteins were identified in the pool of oxidized pro-teins in plasma. Plasma resident proteins constitute morethan 90% of plasma protein mass yet occurred at low fre-quency in the CPP. In fact, the abundant plasma residentproteins occurred at 102–104 higher concentration than mostof the proteins identified in CPP. The absence of manyplasma resident proteins could be due to rapid rate of turnover. These proteins may also have evolved to resist carbony-lation to avoid serious derangements in their functions con-sidering the importance of their global functions in blood.
The fact that keratins made up 6% of the CPP was a sec-ond surprise. Among 289 of the most abundant proteinsidentified in studies of human plasma or serum, keratinsappear at such low concentration they are not included [23].Even in recent updates that include 1175 distinct gene prod-ucts, keratins only constitute 0.85% of all proteins in plasma[12]. Also, of the seven oxidized proteins common to allplasma samples all were keratins (Table 1). Perhaps this ele-vation in oxidized keratins is due to an antioxidant role thatkeratins are playing in epithelial cells and plasma. There is
© 2008 WILEY-VCH Verlag GmbH & Co. KGaA, Weinheim www.proteomics-journal.com
Proteomics 2008, 8, 1516–1527 Animal Proteomics 1525
Figure 4. Pie chart distribution of oxidized pro-teins based on their molecular function. Theproteins’ molecular function is extracted from amouse genome database using gene ontologyannotations (GO_function).
Figure 5. Pie chart distribution of rat plasma proteins based on their tissue of origin. Information regarding proteins’ tissue of origin wasextracted form Expasy database.
some evidence for this in cancer. Whereas keratin expres-sion increases in colon, pancreatic, and prostate cancer [24,25], type II cytoskeletal eight keratin expression decreasesin human colon carcinoma cells when they are treatedwith the antioxidant quercetin [26]. It has also been shownthat the stratum corneum of epithelial cells is a target ofozone and UV exposure induced oxidative stress [27].Endothelial cells in contrast lack the regulatory mechanismto control glucose transport and consequently are amongcells specifically damaged by hyperglycemia [28]. Hyper-glycemia is known to increase production of ROS insidethese cells. The identification of large numbers of keratinsin this study might indicate that even in healthy animalsendothelial cells release a large amount of oxidized pro-teins [29].
The possibility that the keratins seen in this study werecontaminants of human origin was also considered. Al-though human keratins from skin and hair have been asource of contamination in MS based proteomics studies, thekeratins detected in this study were of rat origin, not human.Moreover, carbonylation sites were detected in seven of thekeratins identified. This two pieces of evidence provide astrong indication that the seven keratins common to allsamples were of rat plasma origin.
Perhaps not as surprising was the very high level of oxi-dized proteins from brain (24%). The free radical theory ofaging postulates that age-associated neurodegeneration iscaused by oxidative damage to the brain. Recent studies haveshown brain susceptibility to age-associated oxidative stressincreased lipofuscin deposition and protein carbonyl levels
© 2008 WILEY-VCH Verlag GmbH & Co. KGaA, Weinheim www.proteomics-journal.com
1526 H. Mirzaei et al. Proteomics 2008, 8, 1516–1527
in male rats of age 15–16 months compared to control ani-mals (3–5 months) [30]. Since brain oxygen consumption ishigher than any other tissue, higher levels of oxidative dam-age in brain are expected. Brain cell lysis would introducethese oxidized proteins into plasma. This is the reasonplasma has also been used as a source for biomarker dis-covery in neurodegenerative disorders such as Alzheimerdisease [31].
Kidney, heart, and liver are three major organs that dete-riorate during aging. Their failure is a common cause of age-related diseases and death. The fact that high levels of oxi-dized proteins originated from these organs suggests that ahigher level of ROS may exist in these tissues. But it is notclear if these ROS are of endogenous or exogenous origin.These findings are in agreement with other studies thatindicate higher levels of oxidative damage to kidneys, heart,and liver [32–34].
5 Conclusions
An objective of the study described here was to determinewhether oxidized proteins occur in blood. It can be con-cluded from the data presented here that in the plasma ofhealthy young female rats there are oxidized proteins, al-though the number is modest compared to an oxidativelystressed yeast culture where 3–4 times as many oxidizedproteins have been found [35]. It is further concluded thatthere is no relationship between plasma protein abundanceand the occurrence of oxidized proteins. Many abundantplasma protein were not found in the carbonylation plasmaproteome. Still another conclusion is that cell lysis and theshedding of proteins from cellular surfaces is a major con-tributor of oxidized proteins in blood.
A further objective of this work was to determine whe-ther a specific class or classes of proteins were most likely tobe oxidized. It is concluded that keratins are by far the mostlikely carbonylated proteins to be found in the plasma ofnormal female rats. The next most likely are membraneproteins such as transferases and binding proteins asso-ciated with transport although a broad range of hydrolasesand kinases was also found.
Finally, it is concluded that proteins from organs of highoxidative activity, such as brain and liver, are the most likelyto donate oxidized proteins to the CPP. This may be of greatimportance where the metabolic activity of an organ or tissueis greatly increased in the disease state. Results from thisstudy would suggest that the requisite influx of largeamounts of oxygen to support growth would increase proteinoxidation in these sites.
We would like to extend our thanks and appreciation to Phi-lip Wyss for his help and support of our bioinformatics platform.This work was supported by grants from the National Institutes ofHealth (GM59996) and (1P30- AG13319) in addition to
Spanish Education and Science Ministry projects AGL2005-06726-C04-03 and AGL2004-06893-C02-01. San Pablo-CEUUniversity provided a travel grant for Beatriz Baena.
The authors have declared no conflict of interest.
6 References
[1] Sohal, R. S., Ku, H. H., Agarwal, S., Forster, M. J., Lal, H.,Oxidative damage, mitochondrial oxidant generation andantioxidant defenses during aging and in response to foodrestriction in the mouse, Mech. Ageing Dev. 1994, 74, 121–133.
[2] Stadtman, E. R., Berlett, B. S., Reactive oxygen-mediatedprotein oxidation in aging and disease, React. Oxygen Spe-cies Biol. Syst. 1999, 657–675.
[3] Jonasson, T., Oehlin, A.-K., Gottsaeter, A., Hultberg, B.,Oehlin, H., Plasma homocysteine and markers for oxidativestress and inflammation in patients with coronary arterydisease – a prospective randomized study of vitamin sup-plementation, Clin. Chem. Lab. Med. 2005, 43, 628–634.
[4] Hussain, S. P., Hofseth, L. J., Harris, C. C., Radical causes ofcancer, Nat. Rev. Cancer 2003, 3, 276–285.
[5] Reyna-Neyra, A., Gonzalez-Aguero, G., Gonzalez-Arenas, A.,Villamar-Cruz, O. et al., Cellular modifications related to Alz-heimer disease, Educ. Quim. 2002, 13, 240–243.
[6] Moreira, P. I., Honda, K., Liu, Q., Aliev, G. et al., Alzheimer’sdisease and oxidative stress: the old problem remainsunsolved, Curr. Med. Chem. 2005, 5, 51–62.
[7] Dalle-Donne, I., Giustarini, D., Colombo, R., Rossi, R., Mil-zani, A., Protein carbonylation in human diseases, TrendsMol. Med. 2003, 9, 169–176.
[8] Dalle-Donne, I., Rossi, R., Giustarini, D., Milzani, A.,Colombo, R., Protein carbonyl groups as biomarkers of oxi-dative stress, Clin. Chim. Acta 2003, 329, 23–38.
[9] Pennathur, S., Heinecke, J. W., Mechanisms for oxidativestress in diabetic cardiovascular disease, Antioxid. RedoxSignal. 2007, 9, 955–969.
[10] Pennathur, S., Ido, Y., Heller, J. I., Byun, J. et al., Reactivecarbonyls and polyunsaturated fatty acids produce a hy-droxyl radical-like species: A potential pathway for oxidativedamage of retinal proteins in diabetes, J. Biol. Chem. 2005,280, 22706–22714.
[11] Pennathur, S., Heinecke, J. W., Mechanisms of oxidativestress in diabetes: Implications for the pathogenesis of vas-cular disease and antioxidant therapy, Front. Biosci. 2004, 9,565–574.
[12] Anderson, N. L., Polanski, M., Pieper, R., Gatlin, T. et al., Thehuman plasma proteome. A nonredundant list developedby combination of four separate sources, Mol. Cell. Prote-omics 2004, 3, 311–326.
[13] Conrad, C. C., Marshall, P. L., Talent, J. M., Malakowsky, C. A.et al., Oxidized proteins in Alzheimer’s plasma, Biochem.Biophys. Res. Commun. 2000, 275, 678–681.
[14] Pignatelli, B., Li, C. Q., Boffetta, P., Chen, Q. et al., Nitratedand oxidized plasma proteins in smokers and lung cancerpatients, Cancer Res. 2001, 61, 778–784.
[15] Choi, J., Malakowsky, C. A., Talent, J. M., Conrad, C. C.,Gracy, R. W., Identification of oxidized plasma proteins in
© 2008 WILEY-VCH Verlag GmbH & Co. KGaA, Weinheim www.proteomics-journal.com
Proteomics 2008, 8, 1516–1527 Animal Proteomics 1527
Alzheimer’s disease, Biochem. Biophys. Res. Commun.2002, 293, 1566–1570.
[16] Di Giacomo, C., Acquaviva, R., Lanteri, R., Licata, F. et al.,Nonproteic antioxidant status in plasma of subjects withcolon cancer. Exp. Biol. Med. 2003, 228, 525–528.
[17] Mirzaei, H., Regnier, F., Affinity chromatographic selection ofcarbonylated proteins followed by identification of oxida-tion sites using tandem mass spectrometry. Anal. Chem.2005, 77, 2386–2392.
[18] Yoo, B.-S., Regnier, F. E., Proteomic analysis of carbonylatedproteins in two-dimensional gel electrophoresis using avi-din-fluorescein affinity staining. Electrophoresis 2004, 25,1334–1341.
[19] McDonald, W. H., Yates John, R., III, Shotgun proteomicsand biomarker discovery, Dis. Markers 2002, 18, 99–105.
[20] Finn, F. M., Titus, G., Horstman, D., Hofmann, K., Avidin-bio-tin affinity chromatography: Application to the isolation ofhuman placental insulin receptor, Proc. Natl. Acad. Sci. USA1984, 81, 7328–7332.
[21] Merker, K., Ullrich, O., Schmidt, H., Sitte, N., Grune, T., Sta-bility of the nuclear protein turnover during cellular senes-cence of human fibroblasts, FASEB J. 2003, 17, 1963–1965,1910 1096/fj 1903–0177fje.
[22] Omenn, G. S., Marcin Adamski, D. J. S., Blackwell, T. W.,Menon, R. et al., Overview of the HUPO Plasma ProteomeProject: Results from the pilot phase with 35 collaboratinglaboratories and multiple analytical groups, generating acore dataset of 3020 proteins and a publicly available data-base. Proteomics 2005, 5, 3226–3245.
[23] Anderson, N. L., Anderson, N. G., The human plasma pro-teome: History, character, and diagnostic prospects. Mol.Cell. Proteomics 2002, 1, 845–867.
[24] Schlegel, R., Monahan, J. E., Endege, W. O., Gannavarapu,M. et al., Application: WO 2003, Millennium Pharmaceu-ticals, Inc., USA, Quinn, Angela M, p. 99.
[25] Chen, J., Hu, L., Liu, T. H., Lu, Z. H., Shen, Y., Application: WO2004, F. Hoffmann-La Roche Ag, Switz., Sinogenomax Co.Ltd. Chinese National Human Genomecenter, p. 381.
[26] Mouat, M. F., Kolli, K., Orlando, R., Hargrove, J. L., Grider, A.,The effects of quercetin on SW480 human colon carcinomacells: A proteomic study, Nutr. J. 2005, 4, 11.
[27] Thiele, J. J., Hsieh, S. N., Briviba, K., Sies, H., Protein oxida-tion in human stratum corneum: Susceptibility of keratins tooxidation in vitro and presence of a keratin oxidation gra-dient in vivo. J. Invest. Dermatol. 1999, 113, 335–339.
[28] Brownlee, M., Biochemistry and molecular cell biology ofdiabetic complications, Nature 2001, 414, 813–820.
[29] Brownlee, M., The pathobiology of diabetic complications –a unifying mechanism, Diabetes 2005, 54, 1615–1625.
[30] Abd El Mohsen, M. M., Iravani, M. M., Spencer, J. P., Rose, S.et al., Age-associated changes in protein oxidation and pro-teasome activities in rat brain: Modulation by antioxidants,Biochem. Biophys. Res. Commun. 2005, 336, 386–391.
[31] Conrad, C. C., Grabowski, D. T., Walter, C. A., Sabia, M.,Richardson, A., Using MT(2/2) mice to study metallothio-nein and oxidative stress, Free Radic. Biol. Med. 2000, 28,447–462.
[32] Dhahbi, J. M., Spindler, S. R., Aging of the liver, Biol. AgingModulation 2003, 3, 271–291.
[33] Buemi, M., Nostro, L., Aloisi, C., Cosentini, V. et al., Kidneyaging: From phenotype to genetics, Rejuvenation Res. 2005,8, 101–109.
[34] Lesnefsky, E. J., Tandler, B., Moghaddas, S., Hassan, M. O.,Hoppel, C. L., Mitochondrial electron transport and aging inthe heart, Adv. Cell Aging Gerontol. 2002, 11, 201–232.
[35] Mirzaei, H., Regnier, F., Creation of allotypic active sites dur-ing oxidative stress, J. Proteome Res. 2006, 5, 2159–2168.
© 2008 WILEY-VCH Verlag GmbH & Co. KGaA, Weinheim www.proteomics-journal.com
Related Documents


