BioMed Central Page 1 of 12 (page number not for citation purposes) Molecular Cancer Open Access Research Identification of novel candidate target genes in amplicons of Glioblastoma multiforme tumors detected by expression and CGH microarray profiling Yolanda Ruano 1 , Manuela Mollejo 2 , Teresa Ribalta 3 , Concepción Fiaño 4 , Francisca I Camacho 2 , Elena Gómez 5 , Angel Rodríguez de Lope 6 , Jose- Luis Hernández-Moneo 6 , Pedro Martínez 1 and Bárbara Meléndez* 1 Address: 1 Genetics Department, Hospital Virgen de la Salud, Avda. Barber 30, 45004-Toledo, Spain, 2 Department of Pathology, Hospital Virgen de la Salud, Avda. Barber 30, 45004-Toledo, Spain, 3 Department of Pathology, Hospital Clinic, Barcelona, C/Villarroel, 170, 08036-Barcelona, Spain, 4 Department of Pathology, Complejo Hospitalario Xeral-Cies, C/Pizarro, 22, 36204-Vigo, Spain, 5 Banco de Tumores, Spanish National Cancer Centre (CNIO), c/Melchor Fernéndez Almagro 6, 28029-Madrid, Spain and 6 Neurosurgery, Hospital Virgen de la Salud, Avda. Barber 30, 45004-Toledo, Spain Email: Yolanda Ruano - [email protected]; Manuela Mollejo - [email protected]; Teresa Ribalta - [email protected]; Concepción Fiaño - [email protected]; Francisca I Camacho - [email protected]; Elena Gómez - [email protected]; Angel Rodríguez de Lope - [email protected]; Jose-Luis Hernández-Moneo - [email protected]; Pedro Martínez - [email protected]; Bárbara Meléndez* - [email protected] * Corresponding author Abstract Background: Conventional cytogenetic and comparative genomic hybridization (CGH) studies in brain malignancies have shown that glioblastoma multiforme (GBM) is characterized by complex structural and numerical alterations. However, the limited resolution of these techniques has precluded the precise identification of detailed specific gene copy number alterations. Results: We performed a genome-wide survey of gene copy number changes in 20 primary GBMs by CGH on cDNA microarrays. A novel amplicon at 4p15, and previously uncharacterized amplicons at 13q32-34 and 1q32 were detected and are analyzed here. These amplicons contained amplified genes not previously reported. Other amplified regions containg well- known oncogenes in GBMs were also detected at 7p12 (EGFR), 7q21 (CDK6), 4q12 (PDGFRA), and 12q13-15 (MDM2 and CDK4). In order to identify the putative target genes of the amplifications, and to determine the changes in gene expression levels associated with copy number change events, we carried out parallel gene expression profiling analyses using the same cDNA microarrays. We detected overexpression of the novel amplified genes SLA/LP and STIM2 (4p15), and TNFSF13B and COL4A2 (13q32-34). Some of the candidate target genes of amplification (EGFR, CDK6, MDM2, CDK4, and TNFSF13B) were tested in an independent set of 111 primary GBMs by using FISH and immunohistological assays. The novel candidate 13q-amplification target TNFSF13B was amplified in 8% of the tumors, and showed protein expression in 20% of the GBMs. Conclusion: This high-resolution analysis allowed us to propose novel candidate target genes such as STIM2 at 4p15, and TNFSF13B or COL4A2 at 13q32-34 that could potentially contribute to the pathogenesis of these tumors and which would require futher investigations. We showed that overexpression of the amplified genes could be attributable to gene dosage and speculate that deregulation of those genes could be important in the development and progression of GBM. Our findings highlight the important influence in GBM of signaling pathways such as the PI3K/AKT, consistent with the invasive features of this tumor. Published: 26 September 2006 Molecular Cancer 2006, 5:39 doi:10.1186/1476-4598-5-39 Received: 08 September 2006 Accepted: 26 September 2006 This article is available from: http://www.molecular-cancer.com/content/5/1/39 © 2006 Ruano et al; licensee BioMed Central Ltd. This is an Open Access article distributed under the terms of the Creative Commons Attribution License (http://creativecommons.org/licenses/by/2.0 ), which permits unrestricted use, distribution, and reproduction in any medium, provided the original work is properly cited.

Welcome message from author
This document is posted to help you gain knowledge. Please leave a comment to let me know what you think about it! Share it to your friends and learn new things together.
Transcript
BioMed CentralMolecular Cancer
ss
Open AcceResearchIdentification of novel candidate target genes in amplicons of Glioblastoma multiforme tumors detected by expression and CGH microarray profilingYolanda Ruano1, Manuela Mollejo2, Teresa Ribalta3, Concepción Fiaño4, Francisca I Camacho2, Elena Gómez5, Angel Rodríguez de Lope6, Jose-Luis Hernández-Moneo6, Pedro Martínez1 and Bárbara Meléndez*1Address: 1Genetics Department, Hospital Virgen de la Salud, Avda. Barber 30, 45004-Toledo, Spain, 2Department of Pathology, Hospital Virgen de la Salud, Avda. Barber 30, 45004-Toledo, Spain, 3Department of Pathology, Hospital Clinic, Barcelona, C/Villarroel, 170, 08036-Barcelona, Spain, 4Department of Pathology, Complejo Hospitalario Xeral-Cies, C/Pizarro, 22, 36204-Vigo, Spain, 5Banco de Tumores, Spanish National Cancer Centre (CNIO), c/Melchor Fernéndez Almagro 6, 28029-Madrid, Spain and 6Neurosurgery, Hospital Virgen de la Salud, Avda. Barber 30, 45004-Toledo, Spain
Email: Yolanda Ruano - [email protected]; Manuela Mollejo - [email protected]; Teresa Ribalta - [email protected]; Concepción Fiaño - [email protected]; Francisca I Camacho - [email protected]; Elena Gómez - [email protected]; Angel Rodríguez de Lope - [email protected]; Jose-Luis Hernández-Moneo - [email protected]; Pedro Martínez - [email protected]; Bárbara Meléndez* - [email protected]
* Corresponding author
AbstractBackground: Conventional cytogenetic and comparative genomic hybridization (CGH) studies in brain malignancies haveshown that glioblastoma multiforme (GBM) is characterized by complex structural and numerical alterations. However, thelimited resolution of these techniques has precluded the precise identification of detailed specific gene copy number alterations.
Results: We performed a genome-wide survey of gene copy number changes in 20 primary GBMs by CGH on cDNAmicroarrays. A novel amplicon at 4p15, and previously uncharacterized amplicons at 13q32-34 and 1q32 were detected and areanalyzed here. These amplicons contained amplified genes not previously reported. Other amplified regions containg well-known oncogenes in GBMs were also detected at 7p12 (EGFR), 7q21 (CDK6), 4q12 (PDGFRA), and 12q13-15 (MDM2 and CDK4).In order to identify the putative target genes of the amplifications, and to determine the changes in gene expression levelsassociated with copy number change events, we carried out parallel gene expression profiling analyses using the same cDNAmicroarrays. We detected overexpression of the novel amplified genes SLA/LP and STIM2 (4p15), and TNFSF13B and COL4A2(13q32-34). Some of the candidate target genes of amplification (EGFR, CDK6, MDM2, CDK4, and TNFSF13B) were tested in anindependent set of 111 primary GBMs by using FISH and immunohistological assays. The novel candidate 13q-amplification targetTNFSF13B was amplified in 8% of the tumors, and showed protein expression in 20% of the GBMs.
Conclusion: This high-resolution analysis allowed us to propose novel candidate target genes such as STIM2 at 4p15, andTNFSF13B or COL4A2 at 13q32-34 that could potentially contribute to the pathogenesis of these tumors and which wouldrequire futher investigations. We showed that overexpression of the amplified genes could be attributable to gene dosage andspeculate that deregulation of those genes could be important in the development and progression of GBM. Our findingshighlight the important influence in GBM of signaling pathways such as the PI3K/AKT, consistent with the invasive features ofthis tumor.
Published: 26 September 2006
Molecular Cancer 2006, 5:39 doi:10.1186/1476-4598-5-39
Received: 08 September 2006Accepted: 26 September 2006
This article is available from: http://www.molecular-cancer.com/content/5/1/39
© 2006 Ruano et al; licensee BioMed Central Ltd.This is an Open Access article distributed under the terms of the Creative Commons Attribution License (http://creativecommons.org/licenses/by/2.0), which permits unrestricted use, distribution, and reproduction in any medium, provided the original work is properly cited.
Page 1 of 12(page number not for citation purposes)
Molecular Cancer 2006, 5:39 http://www.molecular-cancer.com/content/5/1/39
BackgroundGlioblastoma multiforme (GBM) is the commonest andmost malignant of the primary central nervous systemtumors in the human adult. Mean survival of GBMpatients treated with the current standard therapy isapproximately one year [1].
Glioblastomas, like other solid tumors, are characterizedby changes in the expression of oncogenes and tumor sup-pressor genes, often as a consequence of numerical chro-mosomal abnormalities (genomic amplifications, gains,and losses) that occur during the tumoral process. Con-ventional and molecular cytogenetic techniques, such ascomparative genomic hybridization (CGH), have led tothe identification of recurrent genomic copy numberchanges that play an important role in the malignancy ofGBM. Aberrations that occur with high frequency includegains of chromosomes 7, 19, and 20, and losses of chro-mosomes 6q, 9p, 10, 13q, and 14q [2,3]. Nevertheless,the low resolution of these techniques, which is restrictedto the chromosome level, together with the large numberof genes located within these regions, makes difficult theidentification of candidate genes.
High-level DNA copy number changes in tumors arerestricted to chromosome regions that show more than 5-to 10-fold copy number increases (regions of amplifica-tion, or amplicons). Some of these amplicons containwell-known oncogenes that are also overexpressed. Whilethis is the case for oncogenes associated with the develop-ment of GBM, such as Epidermal Growth Factor Receptor(EGFR) (7p12), Cyclin-Dependent Kinase 4 (CDK4)(12q14), and the human homolog of the Mouse DoubleMinute 2 (MDM2) (12q15) [2-4], other regions of ampli-fication and/or other relevant genes located within theseor other regions remain unknown or incompletelydescribed.
New high-throughput genomic technologies, such ascDNA microarray CGH [5], use conventional cDNAmicroarrays that are normally used in expression profil-ing, to examine genomic copy number imbalances. In thisway, thousands of genes can be reviewed in a high-resolu-tion analysis to define amplicons and identify candidategenes showing recurrent genomic copy number changes.Parallel expression profiling experiments then allows theidentification of relevant target genes whose aberrantexpression could suggest its involvement in the pathogen-esis of the tumors [6-10].
The objective of our study was to define at high resolutionregions of amplification in GBMs, and through integra-tion of copy number and gene expression data, to identifypossible candidate target genes that could give insightsinto the pathology of GBM. In addition, we also aimed to
analyze in detail the gene copy number changes associ-ated with these tumors, since this is not feasible using clas-sic chromosomal CGH.
For that purpose, we surveyed for changes in DNA copynumber and expression levels throughout the genomes of20 primary GBMs by using cDNA microarray CGH andexpression profiling experiments. The most significantalterations found were validated in additional series ofprimary GBMs using locus-specific fluorescence in situhybridization (FISH), and immunohistochemical analy-ses.
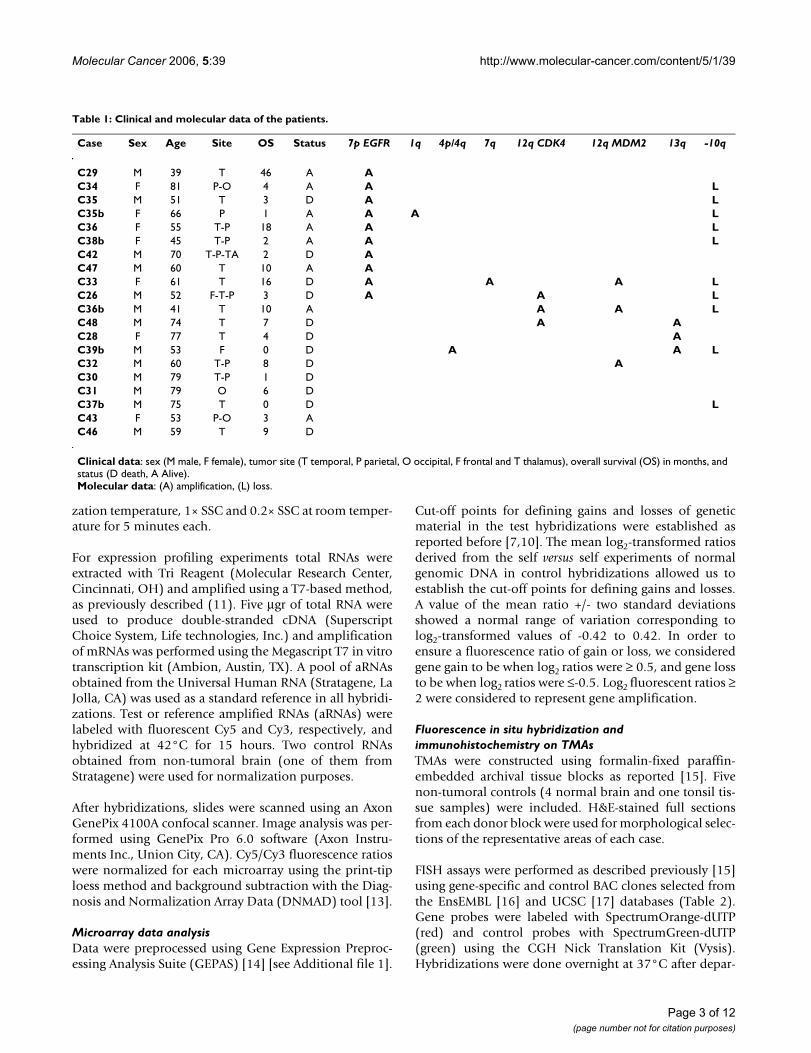
MethodsPatients and tissue samplesThe genomic-profiling study involved 20 cases of primaryGBMs. Expression profiling experiments were carried outin 17 of the GBMs for which RNA material was available.Thirteen of the patients were males and 7 were femaleswith a mean age of 61 years (range, 39 to 81 years). Theclinical information of the patients is summarized inTable 1.
To validate our results, 111 primary GBMs were arrayed intissue microarrays (TMAs) and subjected to immunohis-tochemical and FISH analyses. Samples were collectedfrom Virgen de la Salud Hospital (Toledo, Spain), ClinicHospital (Barcelona, Spain) and Xeral-Cies Hospital(Vigo, Spain). All samples were reviewed by means of tis-sue sections stained with hematoxylin and eosin (H&E) toverify tumor viability and confirm the diagnosis accordingto the WHO guidelines by M.M., T.R., C.F., and F.-I.C.
cDNA microarray CGH and expression profilingThe cDNA microarrays used in this study (Oncochip v2.0)were purchased from Centro Nacional de InvestigacionesOncológicas [11]. These microarrays contained 27,454cDNA clones, including 9,900 known genes and unchar-acterized ESTs related to tumorigenesis.
High molecular weight genomic DNA from tumors andnormal human lymphocytes (used as reference DNA)were extracted following standard phenol/chloroformpurification protocols. CGH experiments on cDNA micro-arrays were performed as described [5,10,12]. Briefly, 20μg of genomic tumoral and reference DNAs were digestedfor 14–18 hours with AluI and RsaI (Life Technologies,Inc., Rockville, MD) and purified by phenol-chloroformextraction. Six μg of purified digested tumor DNA and ref-erence DNA were labeled with Cy5-dUTP and Cy3-dUTP(Amersham Biosciences, Piscataway, NJ), respectively,using the Bioprime Labeling Kit (Life Technologies, Inc.).Labeled tumor and sex-matched reference DNA were co-hybridized at 58°C for 14–16 hours. Post-hybridizationwashes were carried out in 2×S SC/0.03% SDS at hybridi-
Page 2 of 12(page number not for citation purposes)
Molecular Cancer 2006, 5:39 http://www.molecular-cancer.com/content/5/1/39
zation temperature, 1× SSC and 0.2× SSC at room temper-ature for 5 minutes each.
For expression profiling experiments total RNAs wereextracted with Tri Reagent (Molecular Research Center,Cincinnati, OH) and amplified using a T7-based method,as previously described (11). Five μgr of total RNA wereused to produce double-stranded cDNA (SuperscriptChoice System, Life technologies, Inc.) and amplificationof mRNAs was performed using the Megascript T7 in vitrotranscription kit (Ambion, Austin, TX). A pool of aRNAsobtained from the Universal Human RNA (Stratagene, LaJolla, CA) was used as a standard reference in all hybridi-zations. Test or reference amplified RNAs (aRNAs) werelabeled with fluorescent Cy5 and Cy3, respectively, andhybridized at 42°C for 15 hours. Two control RNAsobtained from non-tumoral brain (one of them fromStratagene) were used for normalization purposes.
After hybridizations, slides were scanned using an AxonGenePix 4100A confocal scanner. Image analysis was per-formed using GenePix Pro 6.0 software (Axon Instru-ments Inc., Union City, CA). Cy5/Cy3 fluorescence ratioswere normalized for each microarray using the print-tiploess method and background subtraction with the Diag-nosis and Normalization Array Data (DNMAD) tool [13].
Microarray data analysisData were preprocessed using Gene Expression Preproc-essing Analysis Suite (GEPAS) [14] [see Additional file 1].
Cut-off points for defining gains and losses of geneticmaterial in the test hybridizations were established asreported before [7,10]. The mean log2-transformed ratiosderived from the self versus self experiments of normalgenomic DNA in control hybridizations allowed us toestablish the cut-off points for defining gains and losses.A value of the mean ratio +/- two standard deviationsshowed a normal range of variation corresponding tolog2-transformed values of -0.42 to 0.42. In order toensure a fluorescence ratio of gain or loss, we consideredgene gain to be when log2 ratios were ≥ 0.5, and gene lossto be when log2 ratios were ≤-0.5. Log2 fluorescent ratios ≥2 were considered to represent gene amplification.
Fluorescence in situ hybridization and immunohistochemistry on TMAsTMAs were constructed using formalin-fixed paraffin-embedded archival tissue blocks as reported [15]. Fivenon-tumoral controls (4 normal brain and one tonsil tis-sue samples) were included. H&E-stained full sectionsfrom each donor block were used for morphological selec-tions of the representative areas of each case.
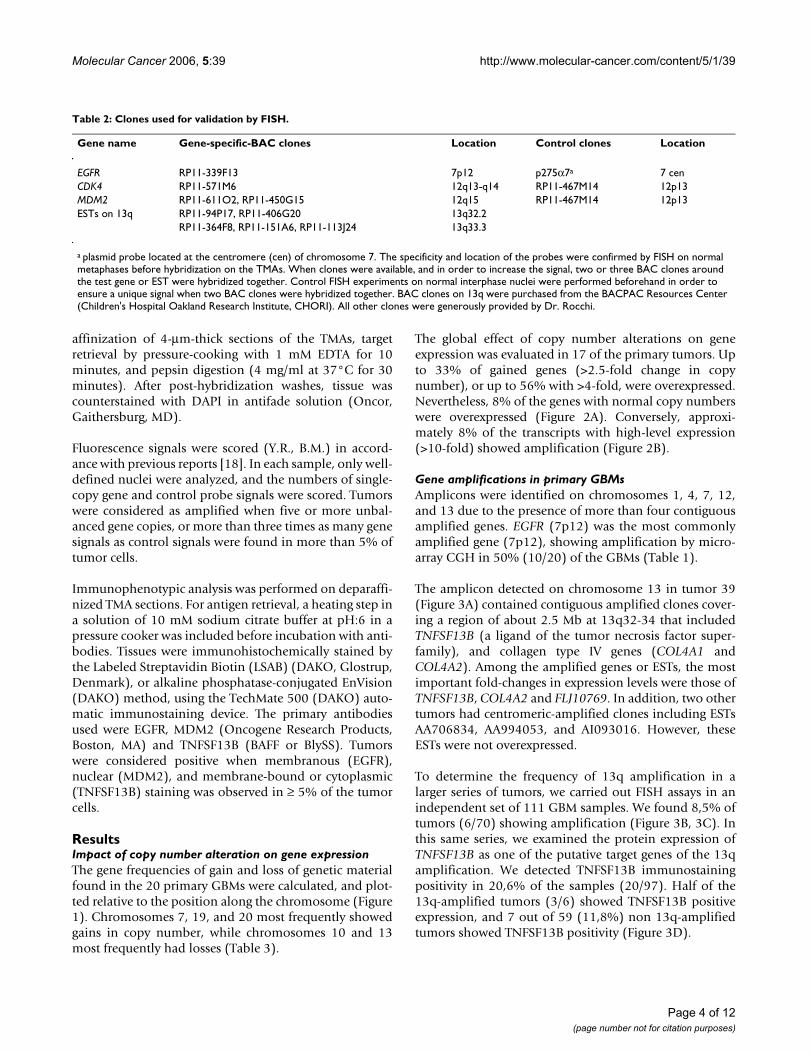
FISH assays were performed as described previously [15]using gene-specific and control BAC clones selected fromthe EnsEMBL [16] and UCSC [17] databases (Table 2).Gene probes were labeled with SpectrumOrange-dUTP(red) and control probes with SpectrumGreen-dUTP(green) using the CGH Nick Translation Kit (Vysis).Hybridizations were done overnight at 37°C after depar-
Table 1: Clinical and molecular data of the patients.
Case Sex Age Site OS Status 7p EGFR 1q 4p/4q 7q 12q CDK4 12q MDM2 13q -10q
C29 M 39 T 46 A AC34 F 81 P-O 4 A A LC35 M 51 T 3 D A LC35b F 66 P 1 A A A LC36 F 55 T-P 18 A A LC38b F 45 T-P 2 A A LC42 M 70 T-P-TA 2 D AC47 M 60 T 10 A AC33 F 61 T 16 D A A A LC26 M 52 F-T-P 3 D A A LC36b M 41 T 10 A A A LC48 M 74 T 7 D A AC28 F 77 T 4 D AC39b M 53 F 0 D A A LC32 M 60 T-P 8 D AC30 M 79 T-P 1 DC31 M 79 O 6 DC37b M 75 T 0 D LC43 F 53 P-O 3 AC46 M 59 T 9 D
Clinical data: sex (M male, F female), tumor site (T temporal, P parietal, O occipital, F frontal and T thalamus), overall survival (OS) in months, and status (D death, A Alive).Molecular data: (A) amplification, (L) loss.
Page 3 of 12(page number not for citation purposes)
Molecular Cancer 2006, 5:39 http://www.molecular-cancer.com/content/5/1/39
affinization of 4-μm-thick sections of the TMAs, targetretrieval by pressure-cooking with 1 mM EDTA for 10minutes, and pepsin digestion (4 mg/ml at 37°C for 30minutes). After post-hybridization washes, tissue wascounterstained with DAPI in antifade solution (Oncor,Gaithersburg, MD).
Fluorescence signals were scored (Y.R., B.M.) in accord-ance with previous reports [18]. In each sample, only well-defined nuclei were analyzed, and the numbers of single-copy gene and control probe signals were scored. Tumorswere considered as amplified when five or more unbal-anced gene copies, or more than three times as many genesignals as control signals were found in more than 5% oftumor cells.
Immunophenotypic analysis was performed on deparaffi-nized TMA sections. For antigen retrieval, a heating step ina solution of 10 mM sodium citrate buffer at pH:6 in apressure cooker was included before incubation with anti-bodies. Tissues were immunohistochemically stained bythe Labeled Streptavidin Biotin (LSAB) (DAKO, Glostrup,Denmark), or alkaline phosphatase-conjugated EnVision(DAKO) method, using the TechMate 500 (DAKO) auto-matic immunostaining device. The primary antibodiesused were EGFR, MDM2 (Oncogene Research Products,Boston, MA) and TNFSF13B (BAFF or BlySS). Tumorswere considered positive when membranous (EGFR),nuclear (MDM2), and membrane-bound or cytoplasmic(TNFSF13B) staining was observed in ≥ 5% of the tumorcells.
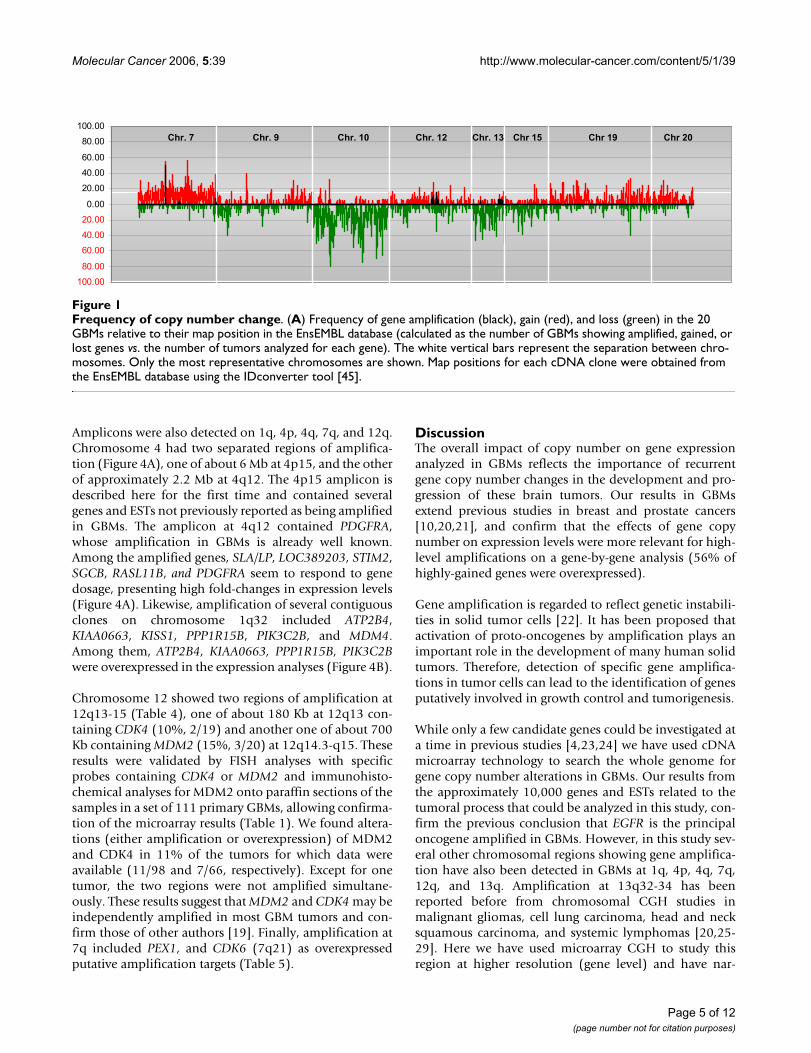
ResultsImpact of copy number alteration on gene expressionThe gene frequencies of gain and loss of genetic materialfound in the 20 primary GBMs were calculated, and plot-ted relative to the position along the chromosome (Figure1). Chromosomes 7, 19, and 20 most frequently showedgains in copy number, while chromosomes 10 and 13most frequently had losses (Table 3).
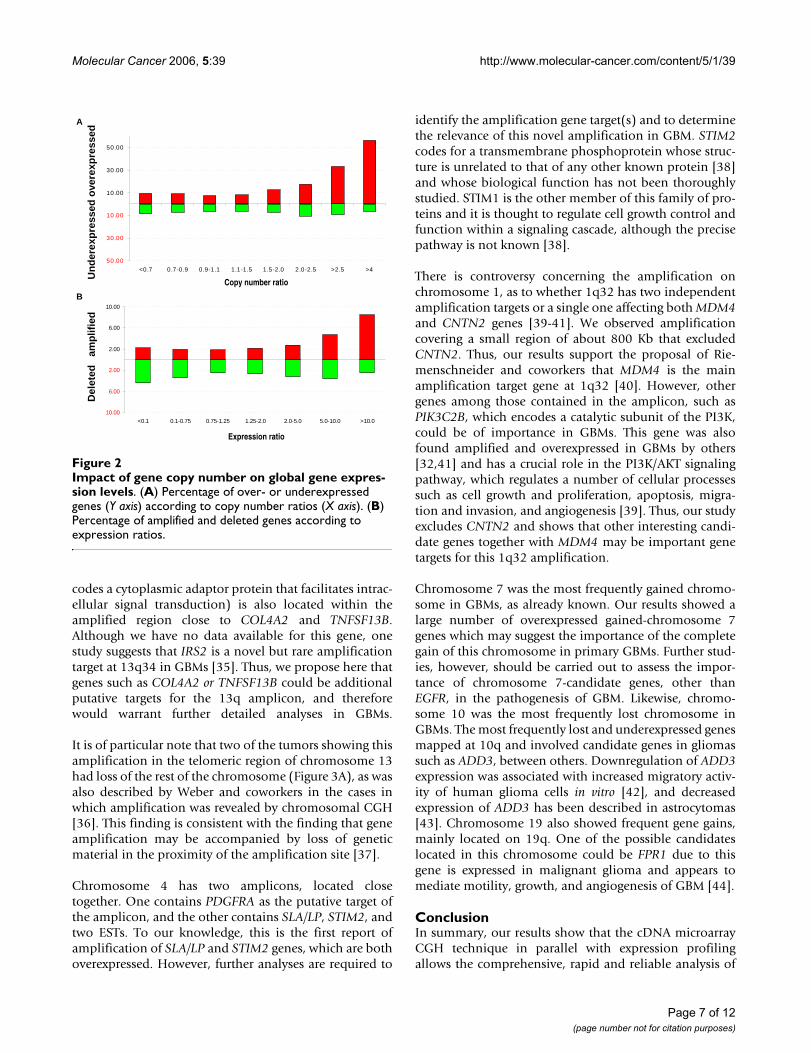
The global effect of copy number alterations on geneexpression was evaluated in 17 of the primary tumors. Upto 33% of gained genes (>2.5-fold change in copynumber), or up to 56% with >4-fold, were overexpressed.Nevertheless, 8% of the genes with normal copy numberswere overexpressed (Figure 2A). Conversely, approxi-mately 8% of the transcripts with high-level expression(>10-fold) showed amplification (Figure 2B).
Gene amplifications in primary GBMsAmplicons were identified on chromosomes 1, 4, 7, 12,and 13 due to the presence of more than four contiguousamplified genes. EGFR (7p12) was the most commonlyamplified gene (7p12), showing amplification by micro-array CGH in 50% (10/20) of the GBMs (Table 1).
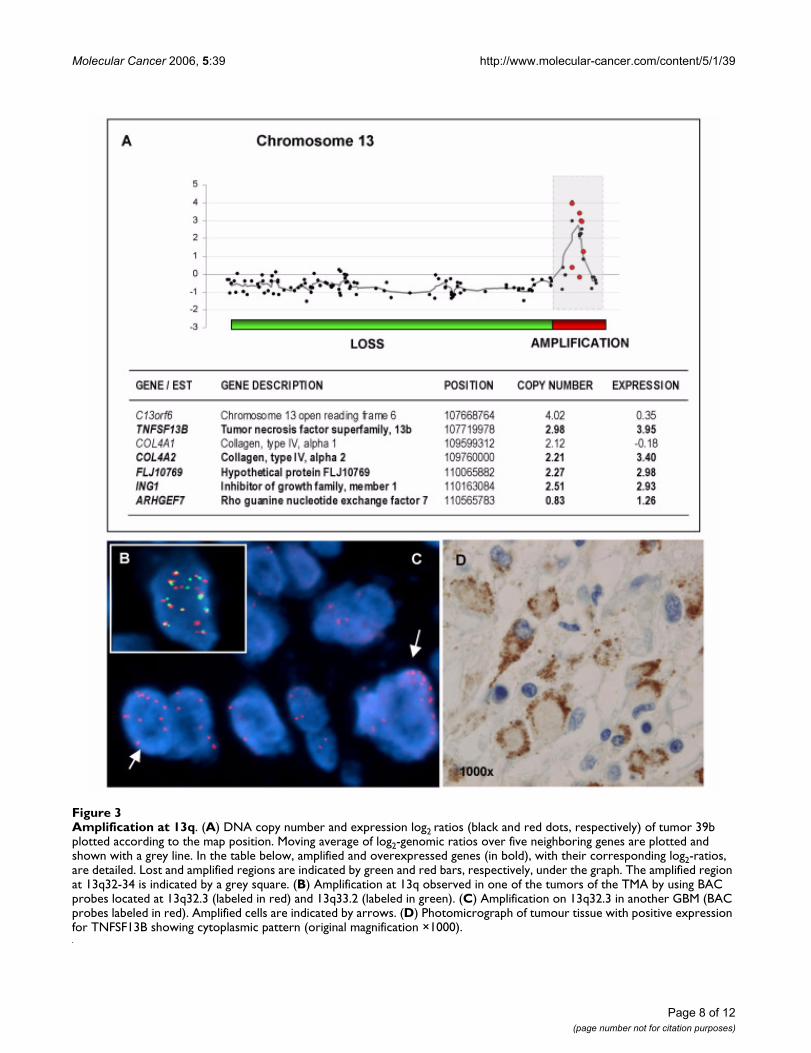
The amplicon detected on chromosome 13 in tumor 39(Figure 3A) contained contiguous amplified clones cover-ing a region of about 2.5 Mb at 13q32-34 that includedTNFSF13B (a ligand of the tumor necrosis factor super-family), and collagen type IV genes (COL4A1 andCOL4A2). Among the amplified genes or ESTs, the mostimportant fold-changes in expression levels were those ofTNFSF13B, COL4A2 and FLJ10769. In addition, two othertumors had centromeric-amplified clones including ESTsAA706834, AA994053, and AI093016. However, theseESTs were not overexpressed.
To determine the frequency of 13q amplification in alarger series of tumors, we carried out FISH assays in anindependent set of 111 GBM samples. We found 8,5% oftumors (6/70) showing amplification (Figure 3B, 3C). Inthis same series, we examined the protein expression ofTNFSF13B as one of the putative target genes of the 13qamplification. We detected TNFSF13B immunostainingpositivity in 20,6% of the samples (20/97). Half of the13q-amplified tumors (3/6) showed TNFSF13B positiveexpression, and 7 out of 59 (11,8%) non 13q-amplifiedtumors showed TNFSF13B positivity (Figure 3D).
Table 2: Clones used for validation by FISH.
Gene name Gene-specific-BAC clones Location Control clones Location
EGFR RP11-339F13 7p12 p275α7a 7 cenCDK4 RP11-571M6 12q13-q14 RP11-467M14 12p13MDM2 RP11-611O2, RP11-450G15 12q15 RP11-467M14 12p13ESTs on 13q RP11-94P17, RP11-406G20 13q32.2
RP11-364F8, RP11-151A6, RP11-113J24 13q33.3
a plasmid probe located at the centromere (cen) of chromosome 7. The specificity and location of the probes were confirmed by FISH on normal metaphases before hybridization on the TMAs. When clones were available, and in order to increase the signal, two or three BAC clones around the test gene or EST were hybridized together. Control FISH experiments on normal interphase nuclei were performed beforehand in order to ensure a unique signal when two BAC clones were hybridized together. BAC clones on 13q were purchased from the BACPAC Resources Center (Children's Hospital Oakland Research Institute, CHORI). All other clones were generously provided by Dr. Rocchi.
Page 4 of 12(page number not for citation purposes)
Molecular Cancer 2006, 5:39 http://www.molecular-cancer.com/content/5/1/39
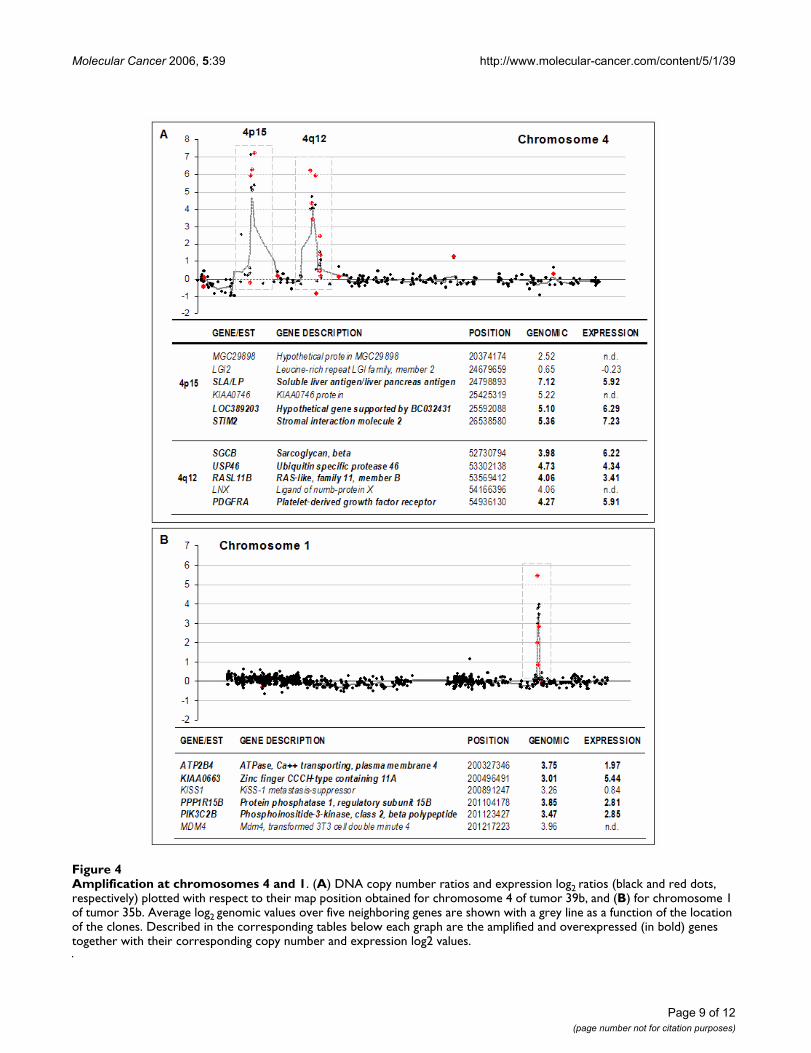
Amplicons were also detected on 1q, 4p, 4q, 7q, and 12q.Chromosome 4 had two separated regions of amplifica-tion (Figure 4A), one of about 6 Mb at 4p15, and the otherof approximately 2.2 Mb at 4q12. The 4p15 amplicon isdescribed here for the first time and contained severalgenes and ESTs not previously reported as being amplifiedin GBMs. The amplicon at 4q12 contained PDGFRA,whose amplification in GBMs is already well known.Among the amplified genes, SLA/LP, LOC389203, STIM2,SGCB, RASL11B, and PDGFRA seem to respond to genedosage, presenting high fold-changes in expression levels(Figure 4A). Likewise, amplification of several contiguousclones on chromosome 1q32 included ATP2B4,KIAA0663, KISS1, PPP1R15B, PIK3C2B, and MDM4.Among them, ATP2B4, KIAA0663, PPP1R15B, PIK3C2Bwere overexpressed in the expression analyses (Figure 4B).
Chromosome 12 showed two regions of amplification at12q13-15 (Table 4), one of about 180 Kb at 12q13 con-taining CDK4 (10%, 2/19) and another one of about 700Kb containing MDM2 (15%, 3/20) at 12q14.3-q15. Theseresults were validated by FISH analyses with specificprobes containing CDK4 or MDM2 and immunohisto-chemical analyses for MDM2 onto paraffin sections of thesamples in a set of 111 primary GBMs, allowing confirma-tion of the microarray results (Table 1). We found altera-tions (either amplification or overexpression) of MDM2and CDK4 in 11% of the tumors for which data wereavailable (11/98 and 7/66, respectively). Except for onetumor, the two regions were not amplified simultane-ously. These results suggest that MDM2 and CDK4 may beindependently amplified in most GBM tumors and con-firm those of other authors [19]. Finally, amplification at7q included PEX1, and CDK6 (7q21) as overexpressedputative amplification targets (Table 5).
DiscussionThe overall impact of copy number on gene expressionanalyzed in GBMs reflects the importance of recurrentgene copy number changes in the development and pro-gression of these brain tumors. Our results in GBMsextend previous studies in breast and prostate cancers[10,20,21], and confirm that the effects of gene copynumber on expression levels were more relevant for high-level amplifications on a gene-by-gene analysis (56% ofhighly-gained genes were overexpressed).
Gene amplification is regarded to reflect genetic instabili-ties in solid tumor cells [22]. It has been proposed thatactivation of proto-oncogenes by amplification plays animportant role in the development of many human solidtumors. Therefore, detection of specific gene amplifica-tions in tumor cells can lead to the identification of genesputatively involved in growth control and tumorigenesis.
While only a few candidate genes could be investigated ata time in previous studies [4,23,24] we have used cDNAmicroarray technology to search the whole genome forgene copy number alterations in GBMs. Our results fromthe approximately 10,000 genes and ESTs related to thetumoral process that could be analyzed in this study, con-firm the previous conclusion that EGFR is the principaloncogene amplified in GBMs. However, in this study sev-eral other chromosomal regions showing gene amplifica-tion have also been detected in GBMs at 1q, 4p, 4q, 7q,12q, and 13q. Amplification at 13q32-34 has beenreported before from chromosomal CGH studies inmalignant gliomas, cell lung carcinoma, head and necksquamous carcinoma, and systemic lymphomas [20,25-29]. Here we have used microarray CGH to study thisregion at higher resolution (gene level) and have nar-
Frequency of copy number changeFigure 1Frequency of copy number change. (A) Frequency of gene amplification (black), gain (red), and loss (green) in the 20 GBMs relative to their map position in the EnsEMBL database (calculated as the number of GBMs showing amplified, gained, or lost genes vs. the number of tumors analyzed for each gene). The white vertical bars represent the separation between chro-mosomes. Only the most representative chromosomes are shown. Map positions for each cDNA clone were obtained from the EnsEMBL database using the IDconverter tool [45].
100.00
80.00
60.00
40.00
20.00
0.00
20.00
40.00
60.00
80.00
100.00
Chr. 7 Chr. 9 Chr. 10 Chr. 12 Chr. 13 Chr 15 Chr 19 Chr 20
Page 5 of 12(page number not for citation purposes)
Molecular Cancer 2006, 5:39 http://www.molecular-cancer.com/content/5/1/39
rowed down the region to 2.5 Mb, showing that thisamplification could affect a small fraction of GBMs (8%).Several known genes and uncharacterized ESTs are con-tained in the 13q amplicon. Among these, COL4A2 hasalso been found to be overexpressed in our study and inother microarray expression-profiling studies of GBMbiopsies and GBM cell lines [30-32]. We speculate thatthis overexpression may have been caused by amplifica-tion of COL4A2, which may be a putative target of theamplicon. In agreement with this hypothesis, veryrecently, Tso and coworkers [33] have shown thatCOL4A2 is one of 15 highly expressed genes that is sharedbetween primary and secondary GBMs. In addition, thisgene was found to be involved in glioma progression andassociated with vascular proliferation. However, immu-
nohistochemical analyses revealed that collagen IV ismainly expressed in association with the tumor blood ves-sels and not from the tumor cells [32], suggesting that theCOL4A2 overexpression detected in GBMs may not be asa result of gene amplification in tumoral cells. This maypoint out to TNFSF13B as a likely candidate for the targetof amplification. Immunohistochemical analyses of 111primary GBMs revealed that TNFSF13B could be affectedin about 20% of the tumors. The TNFSF13B ligand (orBAFF) is a member of the TNF cytokine family that acti-vates nuclear factor (NF)-κB, phosphatidylinositol-3kinase (PI3K)/AKT, and mitogen-activated protein kinase(MAPK) pathways in myeloma multiple cells, and inducestrong up-regulation of Mcl-1 and Bcl-2 antiapoptoticproteins [34].On another hand, the gene IRS2 (which
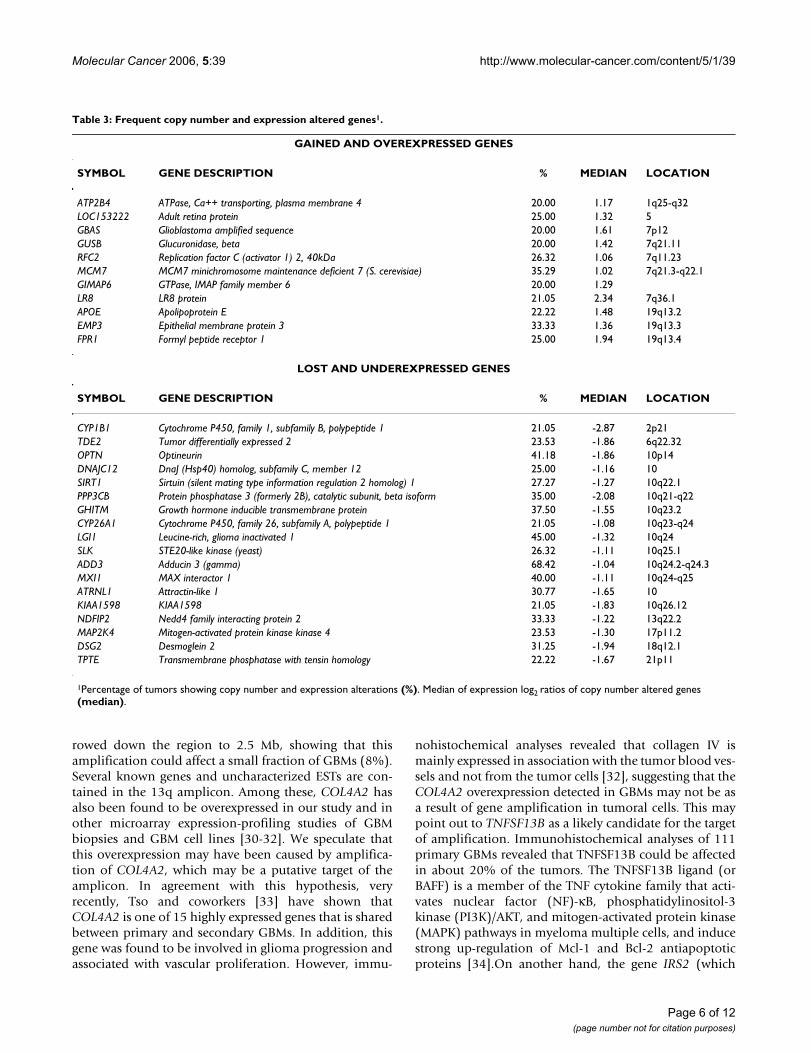
Table 3: Frequent copy number and expression altered genes1.
GAINED AND OVEREXPRESSED GENES
SYMBOL GENE DESCRIPTION % MEDIAN LOCATION
ATP2B4 ATPase, Ca++ transporting, plasma membrane 4 20.00 1.17 1q25-q32LOC153222 Adult retina protein 25.00 1.32 5GBAS Glioblastoma amplified sequence 20.00 1.61 7p12GUSB Glucuronidase, beta 20.00 1.42 7q21.11RFC2 Replication factor C (activator 1) 2, 40kDa 26.32 1.06 7q11.23MCM7 MCM7 minichromosome maintenance deficient 7 (S. cerevisiae) 35.29 1.02 7q21.3-q22.1GIMAP6 GTPase, IMAP family member 6 20.00 1.29LR8 LR8 protein 21.05 2.34 7q36.1APOE Apolipoprotein E 22.22 1.48 19q13.2EMP3 Epithelial membrane protein 3 33.33 1.36 19q13.3FPR1 Formyl peptide receptor 1 25.00 1.94 19q13.4
LOST AND UNDEREXPRESSED GENES
SYMBOL GENE DESCRIPTION % MEDIAN LOCATION
CYP1B1 Cytochrome P450, family 1, subfamily B, polypeptide 1 21.05 -2.87 2p21TDE2 Tumor differentially expressed 2 23.53 -1.86 6q22.32OPTN Optineurin 41.18 -1.86 10p14DNAJC12 DnaJ (Hsp40) homolog, subfamily C, member 12 25.00 -1.16 10SIRT1 Sirtuin (silent mating type information regulation 2 homolog) 1 27.27 -1.27 10q22.1PPP3CB Protein phosphatase 3 (formerly 2B), catalytic subunit, beta isoform 35.00 -2.08 10q21-q22GHITM Growth hormone inducible transmembrane protein 37.50 -1.55 10q23.2CYP26A1 Cytochrome P450, family 26, subfamily A, polypeptide 1 21.05 -1.08 10q23-q24LGI1 Leucine-rich, glioma inactivated 1 45.00 -1.32 10q24SLK STE20-like kinase (yeast) 26.32 -1.11 10q25.1ADD3 Adducin 3 (gamma) 68.42 -1.04 10q24.2-q24.3MXI1 MAX interactor 1 40.00 -1.11 10q24-q25ATRNL1 Attractin-like 1 30.77 -1.65 10KIAA1598 KIAA1598 21.05 -1.83 10q26.12NDFIP2 Nedd4 family interacting protein 2 33.33 -1.22 13q22.2MAP2K4 Mitogen-activated protein kinase kinase 4 23.53 -1.30 17p11.2DSG2 Desmoglein 2 31.25 -1.94 18q12.1TPTE Transmembrane phosphatase with tensin homology 22.22 -1.67 21p11
1Percentage of tumors showing copy number and expression alterations (%). Median of expression log2 ratios of copy number altered genes (median).
Page 6 of 12(page number not for citation purposes)
Molecular Cancer 2006, 5:39 http://www.molecular-cancer.com/content/5/1/39
codes a cytoplasmic adaptor protein that facilitates intrac-ellular signal transduction) is also located within theamplified region close to COL4A2 and TNFSF13B.Although we have no data available for this gene, onestudy suggests that IRS2 is a novel but rare amplificationtarget at 13q34 in GBMs [35]. Thus, we propose here thatgenes such as COL4A2 or TNFSF13B could be additionalputative targets for the 13q amplicon, and thereforewould warrant further detailed analyses in GBMs.
It is of particular note that two of the tumors showing thisamplification in the telomeric region of chromosome 13had loss of the rest of the chromosome (Figure 3A), as wasalso described by Weber and coworkers in the cases inwhich amplification was revealed by chromosomal CGH[36]. This finding is consistent with the finding that geneamplification may be accompanied by loss of geneticmaterial in the proximity of the amplification site [37].
Chromosome 4 has two amplicons, located closetogether. One contains PDGFRA as the putative target ofthe amplicon, and the other contains SLA/LP, STIM2, andtwo ESTs. To our knowledge, this is the first report ofamplification of SLA/LP and STIM2 genes, which are bothoverexpressed. However, further analyses are required to
identify the amplification gene target(s) and to determinethe relevance of this novel amplification in GBM. STIM2codes for a transmembrane phosphoprotein whose struc-ture is unrelated to that of any other known protein [38]and whose biological function has not been thoroughlystudied. STIM1 is the other member of this family of pro-teins and it is thought to regulate cell growth control andfunction within a signaling cascade, although the precisepathway is not known [38].
There is controversy concerning the amplification onchromosome 1, as to whether 1q32 has two independentamplification targets or a single one affecting both MDM4and CNTN2 genes [39-41]. We observed amplificationcovering a small region of about 800 Kb that excludedCNTN2. Thus, our results support the proposal of Rie-menschneider and coworkers that MDM4 is the mainamplification target gene at 1q32 [40]. However, othergenes among those contained in the amplicon, such asPIK3C2B, which encodes a catalytic subunit of the PI3K,could be of importance in GBMs. This gene was alsofound amplified and overexpressed in GBMs by others[32,41] and has a crucial role in the PI3K/AKT signalingpathway, which regulates a number of cellular processessuch as cell growth and proliferation, apoptosis, migra-tion and invasion, and angiogenesis [39]. Thus, our studyexcludes CNTN2 and shows that other interesting candi-date genes together with MDM4 may be important genetargets for this 1q32 amplification.
Chromosome 7 was the most frequently gained chromo-some in GBMs, as already known. Our results showed alarge number of overexpressed gained-chromosome 7genes which may suggest the importance of the completegain of this chromosome in primary GBMs. Further stud-ies, however, should be carried out to assess the impor-tance of chromosome 7-candidate genes, other thanEGFR, in the pathogenesis of GBM. Likewise, chromo-some 10 was the most frequently lost chromosome inGBMs. The most frequently lost and underexpressed genesmapped at 10q and involved candidate genes in gliomassuch as ADD3, between others. Downregulation of ADD3expression was associated with increased migratory activ-ity of human glioma cells in vitro [42], and decreasedexpression of ADD3 has been described in astrocytomas[43]. Chromosome 19 also showed frequent gene gains,mainly located on 19q. One of the possible candidateslocated in this chromosome could be FPR1 due to thisgene is expressed in malignant glioma and appears tomediate motility, growth, and angiogenesis of GBM [44].
ConclusionIn summary, our results show that the cDNA microarrayCGH technique in parallel with expression profilingallows the comprehensive, rapid and reliable analysis of
Impact of gene copy number on global gene expression levelsFigure 2Impact of gene copy number on global gene expres-sion levels. (A) Percentage of over- or underexpressed genes (Y axis) according to copy number ratios (X axis). (B) Percentage of amplified and deleted genes according to expression ratios.
A
Copy number ratio
Expression ratio
B
50.00
30.00
10.00
10.00
30.00
50.00
<0.7 0.7-0.9 0.9-1.1 1.1-1.5 1.5-2.0 2.0-2.5 >2.5 >4
10.00
6.00
2.00
2.00
6.00
10.00
<0.1 0.1-0.75 0.75-1.25 1.25-2.0 2.0-5.0 5.0-10.0 >10.0
Un
der
exp
ress
edo
vere
xpre
ssed
Del
eted
amp
lifie
d
Page 7 of 12(page number not for citation purposes)
Molecular Cancer 2006, 5:39 http://www.molecular-cancer.com/content/5/1/39
Page 8 of 12(page number not for citation purposes)
Amplification at 13qFigure 3Amplification at 13q. (A) DNA copy number and expression log2 ratios (black and red dots, respectively) of tumor 39b plotted according to the map position. Moving average of log2-genomic ratios over five neighboring genes are plotted and shown with a grey line. In the table below, amplified and overexpressed genes (in bold), with their corresponding log2-ratios, are detailed. Lost and amplified regions are indicated by green and red bars, respectively, under the graph. The amplified region at 13q32-34 is indicated by a grey square. (B) Amplification at 13q observed in one of the tumors of the TMA by using BAC probes located at 13q32.3 (labeled in red) and 13q33.2 (labeled in green). (C) Amplification on 13q32.3 in another GBM (BAC probes labeled in red). Amplified cells are indicated by arrows. (D) Photomicrograph of tumour tissue with positive expression for TNFSF13B showing cytoplasmic pattern (original magnification ×1000).
Molecular Cancer 2006, 5:39 http://www.molecular-cancer.com/content/5/1/39
Page 9 of 12(page number not for citation purposes)
Amplification at chromosomes 4 and 1Figure 4Amplification at chromosomes 4 and 1. (A) DNA copy number ratios and expression log2 ratios (black and red dots, respectively) plotted with respect to their map position obtained for chromosome 4 of tumor 39b, and (B) for chromosome 1 of tumor 35b. Average log2 genomic values over five neighboring genes are shown with a grey line as a function of the location of the clones. Described in the corresponding tables below each graph are the amplified and overexpressed (in bold) genes together with their corresponding copy number and expression log2 values.

Molecular Cancer 2006, 5:39 http://www.molecular-cancer.com/content/5/1/39
the whole genome in GBM tumors and enables therefined and detailed study of amplicons and regions ofrecurrent copy number change. This approach makes itpossible to identify putative glioma oncogenes/tumor-suppressor genes that may deserve further investigation.Our findings highlight the important influence in GBM ofsignaling pathways such as the PI3K/AKT, consistent withthe invasive features of this tumor. In this context, weidentify candidate target genes of amplification that mayhelp to direct therapeutics for the treatment of GBM.
Authors' contributionsYR carried out selection of the GBM samples, performednucleic acid extraction, DNA and RNA hybridizationsonto the microarrays, FISH experiments, and participatedin the discussion of the results. MM, TR, CF, and FIC car-ried out histopathological analyses and pathological diag-nosis. MM and FIC participated in the design of the study,and in the analysis and discussion of the results. EG par-ticipated in selection of the samples, DNA and RNAextraction, and carried out construction of the tissuearrays. AR-L and J-LH-M recovered clinical data of thepatients and carried out clinical diagnostics. PM partici-pated in the design and discussion of the results BM car-ried out statistical analysis of the microarray results,conceived of the study, drafted the manuscript, partici-
pated in its design, and carried out coordination. Allauthors read and approved the final manuscript.
Additional material
AcknowledgementsWe would like to acknowledge the assistance of Lydia Sanchez (CNIO) with the immunohistochemical studies. Some of the BAC clones were gen-erously provided by Dr. Mariano Rocchi (University of Bari, Italy).
This work was partially supported by grants from the Fondo de Investiga-ciones Sanitarias FIS 02/3006 and FIS 03/0727, and from the Consejería de Sanidad Junta de Comunidades de Castilla-La Mancha SESCAM GC3011 and SESCAM 04032.
References1. Gudinaviciene I, Pranys D, Juozaityte E: Impact of morphology
and biology on the prognosis of patients with gliomas. Medic-ina (Kaunas) 2004, 40:112-120.
Additional file 1Genomic and expression row data. Genomic and expression row data of the GBM tumors. Gene symbol, gene description and localization are pro-vided.Click here for file[http://www.biomedcentral.com/content/supplementary/1476-4598-5-39-S1.xls]
Table 4: Amplicon at 12q.
SYMBOL GENE NAME POSITION MEDIAN* GENOMIC
MEDIAN* EXPRESSION
AMPLICON 1 SLC26A10 Solute carrier family 26, member 10 56290368 0.49 0.44GALGT UDP-N-acetyl-alpha-D-galactosamine 56305945 1.73 0.33SAS Sarcoma amplified sequence 56425051 0.49 2.92CDK4 Cyclin-dependent kinase 4 56428272 2.44 4.12CYP27B1 Cytochrome P450, family 27, subfamily B, polypeptide 1 56442389 2.35 1.93TSFM Ts translation elongation factor, mitochondrial 56462849 1.02 -0.26AVIL Advillin 56477704 1.84 0.53
AMPLICON 2 GNS Glucosamine (N-acetyl)-6-sulfatase 63393491 0.48 0.47CGI-119 CGI-119 protein 64817459 0.94 5.38IFNG Interferon, gamma 66834816 0.76 -0.02MDM2 Mdm2, transformed 3T3 cell double minute 2 67488247 2.72 1.64
* Median of genomic or expression log2 ratios of gained genes.
Table 5: Amplicon at 7q.
SYMBOL GENE DESCRIPTION POSITION GENOMIC EXPRESSION
PFTK1 PFTAIRE protein kinase 1 89870462 1.68 -0.58FZD1 Frizzled homolog 1 (Drosophila) 90538434 3.05 2.91PEX1 Peroxisome biogenesis factor 1 91760991 3.13 4.04CDK6 Cyclin-dependent kinase 6 91878888 1.53 0.43
Genomic and expression log2 ratios of gained genes.
Page 10 of 12(page number not for citation purposes)

Molecular Cancer 2006, 5:39 http://www.molecular-cancer.com/content/5/1/39
2. Burton EC, Lamborn KR, Feuerstein BG, Prados M, Scott J, Forsyth P,Passe S, Jenkins RB, Aldape KD: Genetic aberrations defined bycomparative genomic hybridization distinguish long-termfrom typical survivors of glioblastoma. Cancer Res 2002,62:6205-6210.
3. Inda MM, Fan X, Munoz J, Perot C, Fauvet D, Danglot G, Palacio A,Madero P, Zazpe I, Portillo E, Tunon T, Martinez-Penuela JM, AlfaroJ, Eiras J, Bernheim A, Castresana JS: Chromosomal abnormalitiesin human glioblastomas gain in chromosome 7p correlatingwith loss in chromosome 10q. Mol Carcinog 2003, 36:6-14.
4. Hui AB, Lo KW, Yin XL, Poon WS, Ng HK: Detection of multiplegene amplifications in glioblastoma multiforme using array-based comparative genomic hybridization. Lab Invest 2001,81:717-723.
5. Pollack JR, Perou CM, Alizadeh AA, Eisen MB, Pergamenschikov A,Williams CF, Jeffrey SS, Botstein D, Brown PO: Genome-wideanalysis of DNA copy-number changes using cDNA microar-rays. Nat Genet 1999, 23:41-46.
6. Beheshti B, Braude I, Marrano P, Thorner P, Zielenska M, Squire JA:Chromosomal localization of DNA amplifications in neurob-lastoma tumors using cDNA microarray comparativegenomic hybridization. Neoplasia 2003, 5:53-62.
7. Jiang F, Yin Z, Caraway NP, Li R, Katz RL: Genomic profiles instage I primary non small cell lung cancer using comparativegenomic hybridization analysis of cDNA microarrays. Neo-plasia 2004, 6:623-635.
8. Mahlamaki EH, Kauraniemi P, Monni O, Wolf M, Hautaniemi S, Kallio-niemi A: High-resolution genomic and expression profilingreveals 105 putative amplification target genes in pancreaticcancer. Neoplasia 2004, 6:432-439.
9. Pollack JR, Sorlie T, Perou CM, Rees CA, Jeffrey SS, Lonning PE, Tib-shirani R, Botstein D, Borresen-Dale AL, Brown PO: Microarrayanalysis reveals a major direct role of DNA copy numberalteration in the transcriptional program of human breasttumors. Proc Natl Acad Sci USA 2002, 99:12963-12968.
10. Wolf M, Mousses S, Hautaniemi S, Karhu R, Huusko P, Allinen M,Elkahloun A, Monni O, Chen Y, Kallioniemi A, Kallioniemi OP: High-resolution analysis of gene copy number alterations inhuman prostate cancer using CGH on cDNA micro arrays,impact of copy number on gene expression. Neoplasia 2004,6:240-7.
11. Tracey L, Villuendas R, Ortiz P, Dopazo A, Spiteri I, Lombardia L,Rodriguez-Peralto JL, Fernandez-Herrera J, Hernandez A, Fraga J,Dominguez O, Herrero J, Alonso MA, Dopazo J, Piris MA: Identifi-cation of genes involved in resistance to interferon-alpha incutaneous T-cell lymphoma. Am J Pathol 2002, 161:1825-1837.
12. Monni O, Barlund M, Mousses S, Kononen J, Sauter G, Heiskanen M,Paavola P, Avela K, Chen Y, Bittner ML, Kallioniemi A: Comprehen-sive copy number and gene expression profiling of the 17q23amplicon in human breast cancer. Proc Natl Acad Sci USA 2001,98:5711-5716.
13. Vaquerizas JM, Dopazo J, Diaz-Uriarte R: DNMAD, web-baseddiagnosis and normalization for microarray data. Bioinformat-ics 2004, 20:3656-3658.
14. Herrero J, Diaz-Uriarte R, Dopazo J: Gene expression data pre-processing. Bioinformatics 2003, 19:655-656.
15. Palacios J, Honrado E, Osorio A, Cazorla A, Sarrio D, Barroso A,Rodríguez S, Cigudosa JC, Diez O, Alonso C, Lerma E, Sanchez L,Rivas C, Benitez J: Immunohistochemical characteristicsdefined by tissue microarray of hereditary breast cancer notattributable to BRCA1 or BRCA2 mutations, differencesfrom breast carcinomas arising in BRCA1 and BRCA2 muta-tion carriers. Clin Cancer Res 2003, 9:3606-3614.
16. The Ensembl database [http://www.ensembl.org]17. The UCSC Genome Bioinformatics Site [http://
genome.ucsc.edu]18. Schraml P, Kononen J, Bubendorf L, Moch H, Bissig H, Nocito A,
Mihatsch MJ, Kallioniemi OP, Sauter G: Tissue microarrays forgene amplification surveys in many different tumor types.Clin Cancer Res 1999, 5:1966-1975.
19. Reifenberger G, Ichimura K, Reifenberger J, Elkahloun AG, MeltzerPS, Collins VP: Refined mapping of 12q13-q15 amplicons inhuman malignant gliomas suggests CDK4/SAS and MDM2 asindependent amplification targets. Cancer Res 1996,56:5141-5145.
20. Pollack JR, Sorlie T, Perou CM, Rees CA, Jeffrey SS, Lonning PE, Tib-shirani R, Botstein D, Borresen-Dale AL, Brown PO: Microarrayanalysis reveals a major direct role of DNA copy numberalteration in the transcriptional program of human breasttumors. Proc Natl Acad Sci U S A 2002, 99:12963-12968.
21. Hyman E, Kauraniemi P, Hautaniemi S, Wolf M, Mousses S, Rozen-blum E, Ringner M, Sauter G, Monni O, Elkahloun A, Kallioniemi OP,Kallioniemi A: Impact of DNA amplification on gene expres-sionpatterns in breast cancer. Cancer Res 2002, 62:6240-6245.
22. Schwab M: Oncogene amplification in solid tumors. Semin Can-cer Biol 1999, 9:319-325.
23. Galanis E, Buckner J, Kimmel D, Jenkins R, Alderete B, O'Fallon J,Wang CH, Scheithauer BW, James CD: Gene amplification as aprognostic factor in primary and secondary high-grademalignant gliomas. Int J Oncol 1998, 13(4):717-724.
24. Olson JJ, Barnett D, Yang J, Assietti R, Cotsonis G, James CD: Geneamplification as a prognostic factor in primary brain tumors.Clin Cancer Res 1998, 4:215-222.
25. Mehra S, Messner H, Minden M, Chaganti RS: Molecular cytoge-netic characterization of non-Hodgkin lymphoma cell lines.Genes Chromosomes Cancer 2002, 33:225-234.
26. Neat MJ, Foot N, Jenner M, Goff L, Ashcroft K, Burford D, DunhamA, Norton A, Lister TA, Fitzgibbon J: Localisation of a novelregion of recurrent amplification in follicular lymphoma toan approximately 6.8 Mb region of 13q32-33. Genes Chromo-somes Cancer 2001, 32:236-243.
27. Rao PH, Houldsworth J, Dyomina K, Parsa NZ, Cigudosa JC, LouieDC, Popplewell L, Offit K, Jhanwar SC, Chaganti RS: Chromosomaland gene amplification in diffuse large B-cell lymphoma.Blood 1998, 92:234-240.
28. Ried T, Petersen I, Holtgreve-Grez H, Speicher MR, Schrock E, duManoir S, Cremer T: Mapping of multiple DNA gains and lossesin primary small cell lung carcinomas by comparativegenomic hybridization. Cancer Res 1994, 54:1801-1806.
29. Speicher MR, Howe C, Crotty P, du Manoir S, Costa J, Ward DC:Comparative genomic hybridization detects novel deletionsand amplifications in head and neck squamous cell carcino-mas. Cancer Res 1995, 55:1010-1013.
30. Nigro JM, Misra A, Zhang L, Smirnov I, Colman H, Griffin C, OzburnN, Chen M, Pan E, Koul D, Yung WK, Feuerstein BG, Aldape KD:Integrated array-comparative genomic hybridization andexpression array profiles identify clinically relevant molecu-lar subtypes of glioblastoma. Cancer Res 2005, 65:1678-1686.
31. Ross DT, Scherf U, Eisen MB, Perou CM, Rees C, Spellman P, Iyer V,Jeffrey SS, Van de Rijn M, Waltham M, Pergamenschikov A, Lee JC,Lashkari D, Shalon D, Myers TG, Weinstein JN, Botstein D, BrownPO: Systematic variation in gene expression patterns inhuman cancer cell lines. Nat Genet 2000, 24(3):227-235.
32. van den Boom J, Wolter M, Kuick R, Misek DE, Youkilis AS, WechslerDS, Sommer C, Reifenberger G, Hanash SM: Characterization ofgene expression profiles associated with glioma progressionusing oligonucleotide-based microarray analysis and real-time reverse transcription-polymerase chain reaction. Am JPathol 2003, 163:1033-1043.
33. Tso CL, Freije WA, Day A, Chen Z, Merriman B, Perlina A, Lee Y, DiaEQ, Yoshimoto K, Mischel PS, Liau LM, Cloughesy TF, Nelson SF:Distinct transcription profiles of primary and secondaryglioblastoma subgroups. Cancer Res 2006, 66:159-167.
34. Moreaux J, Legouffe E, Jourdan E, Quittet P, Reme T, Lugagne C,Moine P, Rossi JF, Klein B, Tarte K: BAFF and APRIL protectmyeloma cells from apoptosis induced by interleukin 6 dep-rivation and dexamethasone. Blood 2004, 103:3148-3157.
35. Knobbe CB, Reifenberger G: Genetic alterations and aberrantexpression of genes related to the phosphatidyl-inositol-3'-kinase/protein kinase B (Akt) signal transduction pathway inglioblastomas. Brain Pathol 2003, 13:507-518.
36. Weber RG, Sabel M, Reifenberger J, Sommer C, Oberstrass J, Reifen-berger G, Kiessling M, Cremer T: Characterization of genomicalterations associated with glioma progression by compara-tive genomic hybridization. Oncogene 1996, 13(5):983-94.
37. Reifenberger G, Reifenberger J, Ichimura K, Collins VP: Amplifica-tion at 12q13-14 in human malignant gliomas is frequentlyaccompanied by loss of heterozygosity at loci proximal anddistal to the amplification site. Cancer Res 1995, 55:731-734.
38. Williams RT, Manji SS, Parker NJ, Hancock MS, Van Stekelenburg L,Eid JP, Senior PV, Kazenwadel JS, Shandala T, Saint R, Smith PJ, Dzia-
Page 11 of 12(page number not for citation purposes)
http://www.ncbi.nlm.nih.gov/entrez/query.fcgi?cmd=Retrieve&db=PubMed&dopt=Abstract&list_uids=8912848
http://www.ncbi.nlm.nih.gov/entrez/query.fcgi?cmd=Retrieve&db=PubMed&dopt=Abstract&list_uids=8912848
http://www.ncbi.nlm.nih.gov/entrez/query.fcgi?cmd=Retrieve&db=PubMed&dopt=Abstract&list_uids=8912848
http://www.ncbi.nlm.nih.gov/entrez/query.fcgi?cmd=Retrieve&db=PubMed&dopt=Abstract&list_uids=9735401
http://www.ncbi.nlm.nih.gov/entrez/query.fcgi?cmd=Retrieve&db=PubMed&dopt=Abstract&list_uids=9735401
http://www.ncbi.nlm.nih.gov/entrez/query.fcgi?cmd=Retrieve&db=PubMed&dopt=Abstract&list_uids=9735401
http://www.ncbi.nlm.nih.gov/entrez/query.fcgi?cmd=Retrieve&db=PubMed&dopt=Abstract&list_uids=9516974
http://www.ncbi.nlm.nih.gov/entrez/query.fcgi?cmd=Retrieve&db=PubMed&dopt=Abstract&list_uids=9516974
http://www.ncbi.nlm.nih.gov/entrez/query.fcgi?cmd=Retrieve&db=PubMed&dopt=Abstract&list_uids=9639522
http://www.ncbi.nlm.nih.gov/entrez/query.fcgi?cmd=Retrieve&db=PubMed&dopt=Abstract&list_uids=9639522
http://www.ncbi.nlm.nih.gov/entrez/query.fcgi?cmd=Retrieve&db=PubMed&dopt=Abstract&list_uids=8137295
http://www.ncbi.nlm.nih.gov/entrez/query.fcgi?cmd=Retrieve&db=PubMed&dopt=Abstract&list_uids=8137295
http://www.ncbi.nlm.nih.gov/entrez/query.fcgi?cmd=Retrieve&db=PubMed&dopt=Abstract&list_uids=8137295
http://www.ncbi.nlm.nih.gov/entrez/query.fcgi?cmd=Retrieve&db=PubMed&dopt=Abstract&list_uids=7866983
http://www.ncbi.nlm.nih.gov/entrez/query.fcgi?cmd=Retrieve&db=PubMed&dopt=Abstract&list_uids=7866983
http://www.ncbi.nlm.nih.gov/entrez/query.fcgi?cmd=Retrieve&db=PubMed&dopt=Abstract&list_uids=7866983
http://www.ncbi.nlm.nih.gov/entrez/query.fcgi?cmd=Retrieve&db=PubMed&dopt=Abstract&list_uids=8806688
http://www.ncbi.nlm.nih.gov/entrez/query.fcgi?cmd=Retrieve&db=PubMed&dopt=Abstract&list_uids=8806688
http://www.ncbi.nlm.nih.gov/entrez/query.fcgi?cmd=Retrieve&db=PubMed&dopt=Abstract&list_uids=8806688
http://www.ncbi.nlm.nih.gov/entrez/query.fcgi?cmd=Retrieve&db=PubMed&dopt=Abstract&list_uids=7850781
Molecular Cancer 2006, 5:39 http://www.molecular-cancer.com/content/5/1/39
Publish with BioMed Central and every scientist can read your work free of charge
"BioMed Central will be the most significant development for disseminating the results of biomedical research in our lifetime."
Sir Paul Nurse, Cancer Research UK
Your research papers will be:
available free of charge to the entire biomedical community
peer reviewed and published immediately upon acceptance
cited in PubMed and archived on PubMed Central
yours — you keep the copyright
Submit your manuscript here:http://www.biomedcentral.com/info/publishing_adv.asp
BioMedcentral
dek MA: Identification and characterization of the STIM(stromal interaction molecule) gene family, coding for anovel class of transmembrane proteins. Biochem J 2001,357:673-685.
39. Knobbe CB, Merlo A, Reifenberger G: Pten signaling in gliomas.Neuro-oncol 2002, 4(3):196-211.
40. Riemenschneider MJ, Buschges R, Wolter M, Reifenberger J, BostromJ, Kraus JA, Schlegel U, Reifenberger G: Amplification and overex-pression of the MDM4 (MDMX) gene from 1q32 in a subsetof malignant gliomas without TP53 mutation or MDM2amplification. Cancer Res 1999, 59:6091-6096.
41. Riemenschneider MJ, Knobbe CB, Reifenberger G: Refined map-ping of 1q32 amplicons in malignant gliomas confirms MDM4as the main amplification target. Int J Cancer 2003, 104:752-757.
42. Mariani L, Beaudry C, McDonough WS, Hoelzinger DB, Demuth T,Ross KR, Berens T, Coons SW, Watts G, Trent JM, Wei JS, Giese A,Berens ME: Glioma cell motility is associated with reducedtranscription of proapoptotic and proliferation genes, acDNA microarray analysis. J Neurooncol 2001, 53:161-176.
43. Huang H, Colella S, Kurrer M, Yonekawa Y, Kleihues P, Ohgaki H:Gene expression profiling of low-grade diffuse astrocytomas bycDNA arrays. Cancer Res 2000, 60:6868-6874.
44. Zhou Y, Bian X, Le Y, Gong W, Hu J, Zhang X, Wang L, Iribarren P,Salcedo R, Howard OMZ, Farrar W, Wang JM: FormylpeptideReceptor FPR and the Rapid Growth of Malignant HumanGliomas. J Natl Cancer Inst 2005, 97:823-835.
45. Gene Expression Pattern Analysis Suite [http://idconverter.bioinfo.cipf.es]
Page 12 of 12(page number not for citation purposes)
Related Documents