Identification of Human Plasma Metabolites Exhibiting Time-of-Day Variation Using an Untargeted Liquid Chromatography–Mass Spectrometry Metabolomic Approach Joo Ern Ang, 1 Victoria Revell, 2 Anuska Mann, 2 Simone Mäntele, 2 Daniella T. Otway, 2 Jonathan D. Johnston, 2 Alfred E. Thumser, 2 Debra J. Skene, 2 and Florence Raynaud 1 1 Cancer Research UK Cancer Therapeutics Unit, Division of Cancer Therapeutics, The Institute of Cancer Research, Sutton, Surrey, UK, 2 Faculty of Health and Medical Sciences, University of Surrey, Guildford, Surrey, UK Although daily rhythms regulate multiple aspects of human physiology, rhythmic control of the metabolome remains poorly understood. The primary objective of this proof-of-concept study was identification of metabolites in human plasma that exhibit significant 24-h variation. This was assessed via an untargeted metabolomic approach using liquid chromatography–mass spectrometry (LC-MS). Eight lean, healthy, and unmedicated men, mean age 53.6 (SD ± 6.0) yrs, maintained a fixed sleep/wake schedule and dietary regime for 1 wk at home prior to an adaptation night and followed by a 25-h experimental session in the laboratory where the light/dark cycle, sleep/wake, posture, and calorific intake were strictly controlled. Plasma samples from each individual at selected time points were prepared using liquid-phase extraction followed by reverse-phase LC coupled to quadrupole time-of-flight MS analysis in positive ionization mode. Time-of-day variation in the metabolites was screened for using orthogonal partial least square discrimination between selected time points of 10:00 vs. 22:00 h, 16:00 vs. 04:00 h, and 07:00 (d 1) vs. 16:00 h, as well as repeated-measures analysis of variance with time as an independent variable. Subsequently, cosinor analysis was performed on all the sampled time points across the 24-h day to assess for significant daily variation. In this study, analytical variability, assessed using known internal standards, was low with coefficients of variation <10%. A total of 1069 metabolite features were detected and 203 (19%) showed significant time-of-day variation. Of these, 34 metabolites were identified using a combination of accurate mass, tandem MS, and online database searches. These metabolites include corticosteroids, bilirubin, amino acids, acylcarnitines, and phospholipids; of note, the magnitude of the 24-h variation of these identified metabolites was large, with the mean ratio of oscillation range over MESOR (24-h time series mean) of 65% (95% confidence interval [CI]: 49–81%). Importantly, several of these human plasma metabolites, including specific acylcarnitines and phospholipids, were hitherto not known to be 24-h variant. These findings represent an important baseline and will be useful in guiding the design and interpretation of future metabolite-based studies. (Author correspondence: [email protected] or [email protected]) Keywords: Acylcarnitines, Daily variation, Human, Liquid chromatography–mass spectrometry, Metabolomics, Plasma metabolites INTRODUCTION Metabolomics is the study of small molecule (<1 kDa) metabolic profiles in biological systems, and comp- lements genomic and proteomic approaches in providing global views of biological processes. Metabolic profiles capture endogenous and exogenous influences on a living organism and may provide better representation of its functional phenotype than changes in DNA, RNA, and proteins (Allen et al., 2003; Nicholson et al., 2002). Hence, metabolic perturbations caused by such disparate factors as genetic changes, microbes, diseases, food, and therapeutic interventions may be investigated using a metabolomic approach (Allen et al., 2003; Nicholson et al., 2002). Recently published studies have identified clear and pervasive circadian influence on the murine hepatic metabolome (Eckel-Mahan et al., 2012; Fustin et al., 2012). Plasma metabolites in a mouse model that vary significantly with time-of-day have crucially been Address correspondence to Dr. Joo Ern Ang or Dr. Florence Raynaud, Drug Metabolism, Pharmacokinetics & Metabolomics Team, Cancer Research UK Cancer Therapeutics Unit, Division of Cancer Therapeutics, The Institute of Cancer Research, Sutton, Surrey SM2 5NG, United Kingdom. Tel.: +44 (0)2087224383; Fax: +44 (0)2087224309; E-mail: [email protected](Joo Ern Ang) or [email protected] (Florence Raynaud) Submitted January 12, 2012, Returned for revision February 16, 2012, Accepted May 22, 2012 Chronobiology International, 29(7): 868–881, (2012) Copyright © Informa Healthcare USA, Inc. ISSN 0742-0528 print/1525-6073 online DOI: 10.3109/07420528.2012.699122 Chronobiol Int Downloaded from informahealthcare.com by 77.96.98.185 on 07/25/12 For personal use only.

Welcome message from author
This document is posted to help you gain knowledge. Please leave a comment to let me know what you think about it! Share it to your friends and learn new things together.
Transcript

Identification of Human Plasma Metabolites Exhibiting Time-of-DayVariation Using an Untargeted Liquid Chromatography–MassSpectrometry Metabolomic Approach
Joo Ern Ang,1 Victoria Revell,2 Anuska Mann,2 Simone Mäntele,2 Daniella T. Otway,2
Jonathan D. Johnston,2 Alfred E. Thumser,2 Debra J. Skene,2 and Florence Raynaud1
1Cancer Research UK Cancer Therapeutics Unit, Division of Cancer Therapeutics, The Institute of Cancer Research, Sutton,Surrey, UK, 2Faculty of Health and Medical Sciences, University of Surrey, Guildford, Surrey, UK
Although daily rhythms regulate multiple aspects of human physiology, rhythmic control of the metabolome remainspoorly understood. The primary objective of this proof-of-concept study was identification of metabolites in humanplasma that exhibit significant 24-h variation. This was assessed via an untargeted metabolomic approach using liquidchromatography–mass spectrometry (LC-MS). Eight lean, healthy, and unmedicated men, mean age 53.6 (SD ± 6.0) yrs,maintained a fixed sleep/wake schedule and dietary regime for 1 wk at home prior to an adaptation night andfollowed by a 25-h experimental session in the laboratory where the light/dark cycle, sleep/wake, posture, and calorificintake were strictly controlled. Plasma samples from each individual at selected time points were prepared usingliquid-phase extraction followed by reverse-phase LC coupled to quadrupole time-of-flight MS analysis in positiveionization mode. Time-of-day variation in the metabolites was screened for using orthogonal partial least squarediscrimination between selected time points of 10:00 vs. 22:00 h, 16:00 vs. 04:00 h, and 07:00 (d 1) vs. 16:00 h, as wellas repeated-measures analysis of variance with time as an independent variable. Subsequently, cosinor analysis wasperformed on all the sampled time points across the 24-h day to assess for significant daily variation. In this study,analytical variability, assessed using known internal standards, was low with coefficients of variation <10%. A total of1069 metabolite features were detected and 203 (19%) showed significant time-of-day variation. Of these, 34metabolites were identified using a combination of accurate mass, tandem MS, and online database searches. Thesemetabolites include corticosteroids, bilirubin, amino acids, acylcarnitines, and phospholipids; of note, the magnitude ofthe 24-h variation of these identified metabolites was large, with the mean ratio of oscillation range over MESOR (24-htime series mean) of 65% (95% confidence interval [CI]: 49–81%). Importantly, several of these human plasmametabolites, including specific acylcarnitines and phospholipids, were hitherto not known to be 24-h variant. Thesefindings represent an important baseline and will be useful in guiding the design and interpretation of futuremetabolite-based studies. (Author correspondence: [email protected] or [email protected])
Keywords: Acylcarnitines, Daily variation, Human, Liquid chromatography–mass spectrometry, Metabolomics, Plasmametabolites
INTRODUCTION
Metabolomics is the study of small molecule (<1 kDa)metabolic profiles in biological systems, and comp-lements genomic and proteomic approaches in providingglobal views of biological processes. Metabolic profilescapture endogenous and exogenous influences on aliving organism and may provide better representationof its functional phenotype than changes in DNA, RNA,and proteins (Allen et al., 2003; Nicholson et al., 2002).
Hence,metabolic perturbations caused by such disparatefactors as genetic changes, microbes, diseases, food, andtherapeutic interventions may be investigated using ametabolomic approach (Allen et al., 2003; Nicholsonet al., 2002).
Recently published studies have identified clear andpervasive circadian influence on the murine hepaticmetabolome (Eckel-Mahan et al., 2012; Fustin et al.,2012). Plasma metabolites in a mouse model that varysignificantly with time-of-day have crucially been
Address correspondence to Dr. Joo Ern Ang or Dr. Florence Raynaud, Drug Metabolism, Pharmacokinetics & Metabolomics Team, CancerResearch UK Cancer Therapeutics Unit, Division of Cancer Therapeutics, The Institute of Cancer Research, Sutton, Surrey SM2 5NG, UnitedKingdom. Tel.: +44 (0)2087224383; Fax: +44 (0)2087224309; E-mail: [email protected](Joo Ern Ang) or [email protected](Florence Raynaud)
Submitted January 12, 2012, Returned for revision February 16, 2012, Accepted May 22, 2012
Chronobiology International, 29(7): 868–881, (2012)Copyright © Informa Healthcare USA, Inc.ISSN 0742-0528 print/1525-6073 onlineDOI: 10.3109/07420528.2012.699122
Chr
onob
iol I
nt D
ownl
oade
d fr
om in
form
ahea
lthca
re.c
om b
y 77
.96.
98.1
85 o
n 07
/25/
12Fo
r pe
rson
al u
se o
nly.

identified in a landmark study; 14 oscillating metaboliteswere identified by liquid chromatography–mass spec-trometry (LC-MS) and 28 by capillary electrophoresis–mass spectrometry (Minami et al., 2009). Direct trans-lation of these animal data to humans, however, cannotbe made. In addition to the obvious problem of compar-ing diurnal and nocturnal species, the timing andamount of feeding, activity, rest, sleep, and posturewere not controlled in these animal experiments.
Although daily rhythms regulate multiple aspects ofhuman physiology, rhythmic control of the plasmameta-bolome remains poorly understood. Previous studieshave investigated time-of-day variation in the humanme-tabolome by comparingmetabolomic profiles ofmorningwith early evening urine samples (Slupsky et al., 2007;Walsh et al., 2006). Although both studies identified sig-nificant changes in metabolite levels, such as increasedcreatinine and dimethylamine in the morning samples,comparison of samples collected at only two time pointsdoes not provide comprehensive overview of variationacross the 24-h day. Furthermore, these studies did notcontrol for sleep, activity, medication, alcohol/caffeineintake, or environmental lighting, and thus, the resultsobtained are extremely unlikely to show nonconfoundedtime-of-day variation. To overcome this, a recent studyemployed a targeted platform to study the humanplasma metabolome under controlled laboratory con-ditions (Dallmann et al., 2012). The analytical platform,however, was limited to 281 metabolites, and plasmasamples from all subjects were pooled at each timepoint, precluding analyses of intersubject variability andintrasubject daily variation and potentially reducingthe sensitivity of this methodology. The current studycircumvented these limitations by the use of a global,untargetedmetabolomic approach in the analysis of indi-vidual plasma samples collected fromhealthy human vol-unteers at different time points. The aim of this proof-of-concept study was characterization of 24-h variation ofthe plasma metabolome in human subjects maintainedunder highly controlled conditions of food, posture,light/dark cycle, sleep/wake schedule, and prior exposureto pharmacologic agents. The technological platformwithLC-MSused in this study has been previously validated byour group with over a thousand metabolites in plasmabeing reproducibly detected (Pandher et al., 2009, 2012).
MATERIALS AND METHODS
All aspects of the study were conducted in accordancewith the Declaration of Helsinki and conformed tointernational ethical standards (Portaluppi et al., 2010).A favorable ethical opinion was obtained from theSurrey Research Ethics Committee and the University ofSurrey Ethics Committee. Written informed consentwas obtained from all participants.
Eligibility for the study was determined via self-completed questionnaires, including General HealthQuestionnaire, General Sleep Questionnaire, Horne-Östberg
Questionnaire, Pittsburgh Sleep Quality Index, BeckDepression Inventory, and Epworth Sleepiness Scale,to assess general health, sleep patterns, and diurnal pre-ference. Full details of the screening process have beenpreviously presented (Otway et al., 2011). To be in-cluded, subjects needed to report a regular sleep sche-dule of between 6 and 8 h in duration and not beextreme morning or evening chronotype according tothe Horne-Östberg Questionnaire (Horne & Östberg,1976). Subjects were excluded if they were takingregular medication or food supplements known to influ-ence metabolism, inflammatory markers, endothelialmarkers, sleep, or the circadian system, or if they con-sumed more than four caffeinated beverages per day.Subjects with a history of any of the following werealso excluded: (a) circadian or sleep disorder; (b)metabolic, cardiovascular, or chronic infectious/inflam-matory disease; (c) psychiatric or neurological disease;and (d) drug and alcohol abuse.
Eight lean, male volunteers were recruited with amean age of 53.6 (SD ±6.0) yrs, mean body mass index(BMI) of 23.2 kg/m2 (SD ±1.4), and fasting glucose of4.2 mmol/L (SD ±.7). One participant was a smoker,but refrained from smoking for 1 wk prior to study. Noparticipant had undertaken shiftwork within 5 yrs orcrossed any time zones within 1 mo of the study. For 1wk prior to the laboratory study, volunteers were requiredto maintain scheduled daily meal times (monitored byfood diaries) and a fixed sleep/wake schedule (23:00–07:00 h), confirmed via wrist actigraphy (Actiwatch-L;Cambridge Neurotechnology, Cambridge, UK), sleepdiaries, and calling a time-stamped voicemail (Otwayet al., 2011). Participants also abstained from eatingfatty or sugary foods and drinking alcohol or caffeinethroughout this baseline week. For the final 3 d of thisweek, participants were provided with meals of specificnutritional content: the daily calorific content was 1.5-fold the basal metabolic rate (estimated in calories =11.5 × body weight [kg] + 873), with ∼35% of energyderived from fat (Schofield, 1985).
In-laboratory SessionThe in-laboratory session was conducted at the SurreyClinical Research Centre. Following an adaptation nightin the laboratory, subjects were woken at 06:30 h andcommenced a 25-h experimental session throughoutwhich they maintained a semi-recumbent posture tominimize the impact of exogenous factors on themeasured parameters. Subjects remained awake innormal room lighting (range 440–825 lux in the directionof gaze) between 06:30 and 22:30 h and were allowed tosleep between 22:30 and 06:30 h in 0 lux. During thewaking period, participants were provided with hourlynutritional drinks (Fortisip; Nutricia, Schiphol, TheNetherlands) and were allowed to drink water adlibitum. The hourly consumption of this drink met theprotein, carbohydrate, fat, and fiber requirements ofeach participant. Daily energy intake was 1.1-fold basal
Time-of-Day Variation in Human Plasma Metabolites
© Informa Healthcare USA, Inc.
Chr
onob
iol I
nt D
ownl
oade
d fr
om in
form
ahea
lthca
re.c
om b
y 77
.96.
98.1
85 o
n 07
/25/
12Fo
r pe
rson
al u
se o
nly.

metabolic rate spread equally over the waking hours.Throughout the protocol, including overnight, bloodsamples were collected via an indwelling cannula by aqualified person, and attempts were made to minimizeany disruption of the participants’ sleep. Blood sampleswere collected at selected time points (.5 mL/time pointfor metabolomic analysis) into lithium heparin tubes,and the plasma fraction was separated by centrifugation(3000 × g, 10 min, 4°C) and stored at −80°C.
Reagents and SolutionsWater (LC-MS grade), acetonitrile (LC-MS grade), andformic acid (Aristar grade) were purchased from FisherScientific (Loughborough, UK), and leucine enkephalinwas purchased from Sigma (Poole, UK). External stan-dards, creatine (CAS number: 57-00-1), and colchicine(CAS number: 64-86-8), were purchased from Sigma.
Plasma PreparationSamples from selected time points (07:00, 10:00, 16:00,22:00, 04:00, and 07:00 h [d 2]) were extracted bymixing 1 volume of heparinized plasma with 4 volumesof methanol/ethanol 1:1, followed by centrifugation at18 000 × g for 15 min at 4°C.
Assessment of Analytical VariabilityPooled plasma from the eight human subjects from allthe sampled time points (i.e., 48 samples) served asquality controls and was analyzed throughout the exper-imental batch to continuously monitor the analyticalvariability of the system. These quality-control samples(1/10 injections) were spiked with 1 mM colchicine andcreatine. Variability of these spiked compounds andendogenous metabolites, including carnitine, phenyl-alanine, and lysophosphatidylcholine (lysoPC(16:0)),were evaluated.
LC-MSExperiments were carried out on two LC-MS systems,namely Acquity UPLC coupled to QTOF Premier massspectrometer (Waters Corporation, Manchester, UK) andAgilent 1290 Series UPLC connected to a hybrid quadru-pole-time-of-flight Agilent 6510 mass spectrometer(Agilent, Waldbronn, Germany); the first system was usedfor full-scan analysis and the second system for MS/MS.The robustness, reproducibility, and cross-platform vali-dation of the two systems in studying the exo-metabolome,including plasma, have been previously published(Pandher et al., 2009, 2012). To minimize systematicanalytical drift from use of large sample numbers and asthe analytical reproducibility of the system is high, oneanalytical replicate from each individual per time pointwas used. An electrospray ionization source in positivemode was used for both LC-MS setups in this proof-of-concept study, as the ions detected in the positive modeare known to represent a large proportion of the exo-meta-bolome in our analytical system (Pandher et al., 2009).
Briefly, chromatographic separation was performedon a Waters Acquity HSS T3 C18 (100 × 2.1 mm, internaldiameter [I.D.] 1.8 µm) column. Mobile phase A was LC-MS-grade water containing .1% formic acid and mobilephase B was LC-MS-grade acetonitrile containing .1%formic acid. The column and the autosampler weremaintained at a temperature of 50°C and 4°C, respect-ively. A 13-min linear gradient elution was performedas follows: 100%mobile phase A for the first .5 min, chan-ging to 100% B over 7.5 min, holding at 100% B up to 9.5min, and finally back to 100% A at 10 min and holding for3 min. The flow rate was .6 mL/min, with an injectionvolume of 10 µL. TheMS instrument and data acquisitionparameters were as previously described (Pandher et al.,2009, 2012).
Data Handling and Statistical ConsiderationsRaw data were detected, aligned, and processed usingMarkerLynx application manager software (version 4.1;Waters, Milford, MA, USA), with parameters documentedpreviously (Pandher et al., 2009). Each metabolitefeature was characterized by a unique combination ofmass/charge ratio and retention time. The data matrixobtained was subsequently subjected tomultivariate stat-istical analysis using (i) SIMCA-P v11.0 software (Ume-trics AB, Umeå, Sweden): metabolite features that weredifferentially expressed in one or more of three chosensets of selected time points—10:00 vs. 22:00 h, 16:00 hvs. 04:00 h, and 07:00 h (d 1) vs. 16:00 h—were identifiedusing orthogonal partial least squares-discriminantanalysis (OPLS-DA) with a low threshold of |p(corr)| > .5on the OPLS-DA S-plot (Wiklund et al., 2008); and (ii)repeated-measures analysis of variance (ANOVA) withtime as an independent variable; statistical significancewas deemed to be achieved at p < .05. Extracted ion chro-matograms (EICs) of the selected metabolite featureswere then generated using QuanLynx applicationmanager software (version 4.1; Waters). Finally, cosinoranalysis using the mean peak height of EICs of all metab-olite features of interest at each time point by the methodof least squares (period of 24 h) was carried out to deriveestimates by the cosine curve approximation ofMESOR (24-h time series mean), amplitude (one-halfpeak-to-trough variation), acrophase (peak) time, andp value for test of the null hypothesis that the amplitudeof the fitted curve was 0; (Nelson et al., 1979); rhythmdetection was considered statistically significant whenp < .05 for the zero-amplitude test.
Metabolite IdentificationThe accurate mass and tandem MS fragmentationpattern of each metabolite feature of interest wasascertained and identification performed by databasesearching (including Human Metabolome Database,Lipid maps, and Metlin) and/or comparison with purecommercial standards. MS/MS was performed on theAgilent system with a default iso-width (width half-maximum of the quadrupole mass bandpass used
J. E. Ang et al.
Chronobiology International
Chr
onob
iol I
nt D
ownl
oade
d fr
om in
form
ahea
lthca
re.c
om b
y 77
.96.
98.1
85 o
n 07
/25/
12Fo
r pe
rson
al u
se o
nly.

during MS/MS precursor isolation) of 4m/z using a fixedcollision energy of 15V and data acquired in the range of50 to 800 Da.
RESULTS
Analytical ReproducibilityWithin the pooled plasma quality-control samples, coef-ficients of variation for endogenous metabolites (carni-tine, phenylalanine, and lysoPC(16:0)) were 1.7%, 3.0%,and 8%, respectively, whereas that of spiked exogenouscompounds (creatine and colchicine) were 3.6% and7.7%, respectively.
Details of WorkflowFigure 1 summarizes our data analysis workflow. In thepresent study, a total of 1069 metabolite features weredetected across all analyzed plasma samples. Of these,318 features passed the OPLS-DA filter using three pair-wise comparisons of 10:00 vs. 22:00 h, 16:00 vs. 04:00 h,and 07:00 vs. 16:00 h. Subsequently, 167 features wereconfirmed to be significantly 24-h variant using cosinoranalysis of EIC data ( p < .05). In parallel, using repeated-measures ANOVA, 254 putative features were detected,and 203 were confirmed to exhibit 24-h variation. The203 confirmed features detected by repeated-measuresANOVA represented the sum total of all the temporallyvariant features detected in this study (19% of all detectedfeatures in this study) and included all 167 features ident-ified by OPLS-DA and 36 features additionally identifiedby repeated-measures ANOVA.
Of a total of 203 24-h variant features, the levels of 110(54%) were significantly different between 16:00 and04:00 h, whereas those of 68 (33%) and 65 (32%) were sig-nificantly different between 10:00 and 22:00 h, and 07:00and 16:00 h, respectively. Repeated-measures ANOVAdetected 36 features unique to those obtained from thestated paired comparisons. These results are summar-ized in Supplementary Figure 1 and SupplementaryTable 1. Using a combination of accurate mass, tandemMS, and online database searches, the identities of 34metabolites were determined from the 203 rhythmicfeatures. Fragmentation patterns and properties ofthese compounds on our LC-MS system are summarizedin Table 1.
Variation of Human Plasma Metabolite Levels AcrossTime-of-DayMetabolites showing significant 24-h variation were froma variety of chemical classes and included acylcarnitines,lysophospholipids, bilirubin, corticosteroids, and aminoacids. For these identified compounds, the mean ratioof oscillation range relative to the MESOR was 65%(95% confidence interval [CI]: 49–81%). Biological varia-bility was consistently greater than analytical variability;the mean analytical coefficient of variation of these ionswas 8% (95% CI: 6–10%).
The fitted peak times of the identified 24-h varyingplasma metabolites were spread across the day, butappeared to be clustered around early morning, after-noon, and evening (Table 1). Levels of long-chain un-saturated acylcarnitines (C14:1, C14:2, and C18:1)peaked before the long-chain saturated acylcarnitines(C10, C12, C14, C16, and C18) in the morning,whereas the acrophases of short-chain acylcarnitineswere observed at radically different times across theday (C2 at 4.9 h, C6 at 5.4 h, C3 at 14.3 h, and C4 at17.7 h). Bilirubin and cortisol peaked after the startof the light phase, whereas the levels of detectedamino acids, such as methionine, tyrosine, proline,lysine, phenylalanine, and leucine, were highest frommid- to late afternoon. By contrast, levels of carnitine,alanine, arginine, tryptophan, and valine (Supplemen-tary Table 1) did not vary significantly over the 24 h.Of the detected phospholipids, lysophosphatidyletha-nolamines (lysoPEs) peaked in the late afternoonand early evening, followed by the phosphatidyl-cholines (PCs), which peaked later in the evening.In contrast, two other phosphocholines (lysoPC(16:0)and lysoPC(18:1)) (Supplementary Table 2) detectedin our analytical system had levels that did notchange significantly over the day.
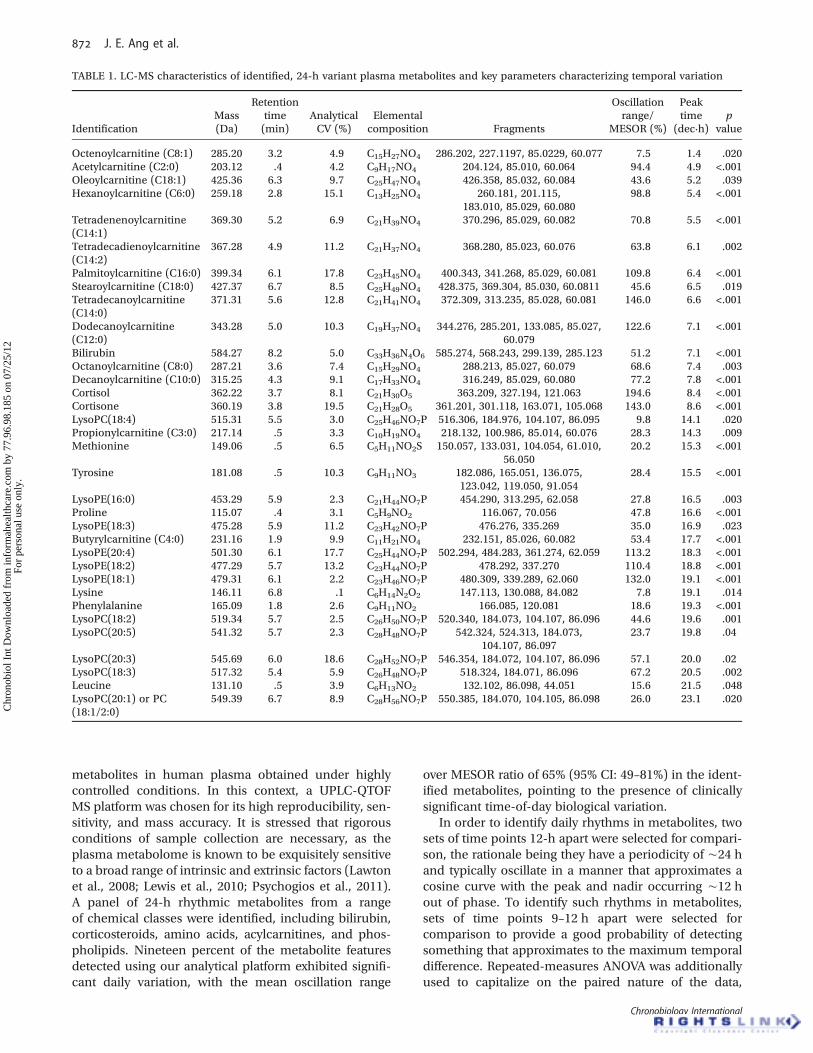
The peak height versus time profiles of four selectedmetabolites are presented in Figure 2, whereas Figure 3additionally shows the timeprofile of oneof themetabolitesof interest, acetylcarnitine, in each of the eight subjects.
DISCUSSION
In this study, an untargeted, global metabolomicapproach was employed to discover novel 24-h rhythmic
FIGURE 1. Flowchart summarizing data analysis workflow.
Time-of-Day Variation in Human Plasma Metabolites
© Informa Healthcare USA, Inc.
Chr
onob
iol I
nt D
ownl
oade
d fr
om in
form
ahea
lthca
re.c
om b
y 77
.96.
98.1
85 o
n 07
/25/
12Fo
r pe
rson
al u
se o
nly.
metabolites in human plasma obtained under highlycontrolled conditions. In this context, a UPLC-QTOFMS platform was chosen for its high reproducibility, sen-sitivity, and mass accuracy. It is stressed that rigorousconditions of sample collection are necessary, as theplasma metabolome is known to be exquisitely sensitiveto a broad range of intrinsic and extrinsic factors (Lawtonet al., 2008; Lewis et al., 2010; Psychogios et al., 2011).A panel of 24-h rhythmic metabolites from a rangeof chemical classes were identified, including bilirubin,corticosteroids, amino acids, acylcarnitines, and phos-pholipids. Nineteen percent of the metabolite featuresdetected using our analytical platform exhibited signifi-cant daily variation, with the mean oscillation range
over MESOR ratio of 65% (95% CI: 49–81%) in the ident-ified metabolites, pointing to the presence of clinicallysignificant time-of-day biological variation.
In order to identify daily rhythms in metabolites, twosets of time points 12-h apart were selected for compari-son, the rationale being they have a periodicity of ∼24 hand typically oscillate in a manner that approximates acosine curve with the peak and nadir occurring ∼12 hout of phase. To identify such rhythms in metabolites,sets of time points 9–12 h apart were selected forcomparison to provide a good probability of detectingsomething that approximates to the maximum temporaldifference. Repeated-measures ANOVA was additionallyused to capitalize on the paired nature of the data,
TABLE 1. LC-MS characteristics of identified, 24-h variant plasma metabolites and key parameters characterizing temporal variation
IdentificationMass(Da)
Retentiontime(min)
AnalyticalCV (%)
Elementalcomposition Fragments
Oscillationrange/
MESOR (%)
Peaktime
(dec·h)p
value
Octenoylcarnitine (C8:1) 285.20 3.2 4.9 C15H27NO4 286.202, 227.1197, 85.0229, 60.077 7.5 1.4 .020Acetylcarnitine (C2:0) 203.12 .4 4.2 C9H17NO4 204.124, 85.010, 60.064 94.4 4.9 <.001Oleoylcarnitine (C18:1) 425.36 6.3 9.7 C25H47NO4 426.358, 85.032, 60.084 43.6 5.2 .039Hexanoylcarnitine (C6:0) 259.18 2.8 15.1 C13H25NO4 260.181, 201.115,
183.010, 85.029, 60.08098.8 5.4 <.001
Tetradenenoylcarnitine(C14:1)
369.30 5.2 6.9 C21H39NO4 370.296, 85.029, 60.082 70.8 5.5 <.001
Tetradecadienoylcarnitine(C14:2)
367.28 4.9 11.2 C21H37NO4 368.280, 85.023, 60.076 63.8 6.1 .002
Palmitoylcarnitine (C16:0) 399.34 6.1 17.8 C23H45NO4 400.343, 341.268, 85.029, 60.081 109.8 6.4 <.001Stearoylcarnitine (C18:0) 427.37 6.7 8.5 C25H49NO4 428.375, 369.304, 85.030, 60.0811 45.6 6.5 .019Tetradecanoylcarnitine(C14:0)
371.31 5.6 12.8 C21H41NO4 372.309, 313.235, 85.028, 60.081 146.0 6.6 <.001
Dodecanoylcarnitine(C12:0)
343.28 5.0 10.3 C19H37NO4 344.276, 285.201, 133.085, 85.027,60.079
122.6 7.1 <.001
Bilirubin 584.27 8.2 5.0 C33H36N4O6 585.274, 568.243, 299.139, 285.123 51.2 7.1 <.001Octanoylcarnitine (C8:0) 287.21 3.6 7.4 C15H29NO4 288.213, 85.027, 60.079 68.6 7.4 .003Decanoylcarnitine (C10:0) 315.25 4.3 9.1 C17H33NO4 316.249, 85.029, 60.080 77.2 7.8 <.001Cortisol 362.22 3.7 8.1 C21H30O5 363.209, 327.194, 121.063 194.6 8.4 <.001Cortisone 360.19 3.8 19.5 C21H28O5 361.201, 301.118, 163.071, 105.068 143.0 8.6 <.001LysoPC(18:4) 515.31 5.5 3.0 C25H46NO7P 516.306, 184.976, 104.107, 86.095 9.8 14.1 .020Propionylcarnitine (C3:0) 217.14 .5 3.3 C10H19NO4 218.132, 100.986, 85.014, 60.076 28.3 14.3 .009Methionine 149.06 .5 6.5 C5H11NO2S 150.057, 133.031, 104.054, 61.010,
56.05020.2 15.3 <.001
Tyrosine 181.08 .5 10.3 C9H11NO3 182.086, 165.051, 136.075,123.042, 119.050, 91.054
28.4 15.5 <.001
LysoPE(16:0) 453.29 5.9 2.3 C21H44NO7P 454.290, 313.295, 62.058 27.8 16.5 .003Proline 115.07 .4 3.1 C5H9NO2 116.067, 70.056 47.8 16.6 <.001LysoPE(18:3) 475.28 5.9 11.2 C23H42NO7P 476.276, 335.269 35.0 16.9 .023Butyrylcarnitine (C4:0) 231.16 1.9 9.9 C11H21NO4 232.151, 85.026, 60.082 53.4 17.7 <.001LysoPE(20:4) 501.30 6.1 17.7 C25H44NO7P 502.294, 484.283, 361.274, 62.059 113.2 18.3 <.001LysoPE(18:2) 477.29 5.7 13.2 C23H44NO7P 478.292, 337.270 110.4 18.8 <.001LysoPE(18:1) 479.31 6.1 2.2 C23H46NO7P 480.309, 339.289, 62.060 132.0 19.1 <.001Lysine 146.11 6.8 .1 C6H14N2O2 147.113, 130.088, 84.082 7.8 19.1 .014Phenylalanine 165.09 1.8 2.6 C9H11NO2 166.085, 120.081 18.6 19.3 <.001LysoPC(18:2) 519.34 5.7 2.5 C26H50NO7P 520.340, 184.073, 104.107, 86.096 44.6 19.6 .001LysoPC(20:5) 541.32 5.7 2.3 C28H48NO7P 542.324, 524.313, 184.073,
104.107, 86.09723.7 19.8 .04
LysoPC(20:3) 545.69 6.0 18.6 C28H52NO7P 546.354, 184.072, 104.107, 86.096 57.1 20.0 .02LysoPC(18:3) 517.32 5.4 5.9 C26H48NO7P 518.324, 184.071, 86.096 67.2 20.5 .002Leucine 131.10 .5 3.9 C6H13NO2 132.102, 86.098, 44.051 15.6 21.5 .048LysoPC(20:1) or PC(18:1/2:0)
549.39 6.7 8.9 C28H56NO7P 550.385, 184.070, 104.105, 86.098 26.0 23.1 .020
J. E. Ang et al.
Chronobiology International
Chr
onob
iol I
nt D
ownl
oade
d fr
om in
form
ahea
lthca
re.c
om b
y 77
.96.
98.1
85 o
n 07
/25/
12Fo
r pe
rson
al u
se o
nly.
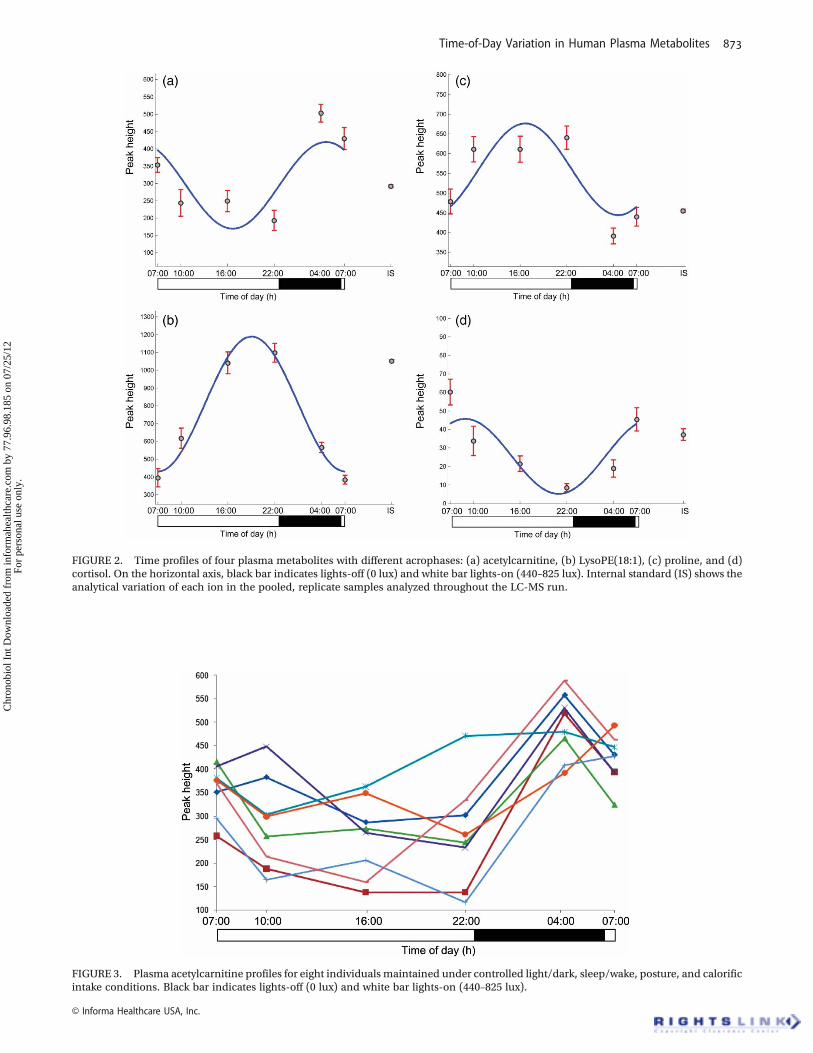
FIGURE 2. Time profiles of four plasma metabolites with different acrophases: (a) acetylcarnitine, (b) LysoPE(18:1), (c) proline, and (d)cortisol. On the horizontal axis, black bar indicates lights-off (0 lux) and white bar lights-on (440–825 lux). Internal standard (IS) shows theanalytical variation of each ion in the pooled, replicate samples analyzed throughout the LC-MS run.
FIGURE 3. Plasma acetylcarnitine profiles for eight individuals maintained under controlled light/dark, sleep/wake, posture, and calorificintake conditions. Black bar indicates lights-off (0 lux) and white bar lights-on (440–825 lux).
Time-of-Day Variation in Human Plasma Metabolites
© Informa Healthcare USA, Inc.
Chr
onob
iol I
nt D
ownl
oade
d fr
om in
form
ahea
lthca
re.c
om b
y 77
.96.
98.1
85 o
n 07
/25/
12Fo
r pe
rson
al u
se o
nly.

i.e., plasma was collected from eight individuals acrosstime. This latter method was the most sensitive andyielded 36 features in addition to OPLS-DA comparisons(Supplementary Figure 1). Not only did this validateresults already obtained by OPLS-DA, but it also demon-strated the effect of intersubject variability as well as therelatively higher sensitivity of this approach (Supplemen-tary Figure 1). To illustrate this point, the 24-h temporalprofile of a metabolite feature is presented in Sup-plementary Figure 2, which highlights the significantintersubject variation in this ion compared to intrasub-ject time-of-day changes. In principle, other multivariatetools, such as the multilevel partial least square projec-tion to latent structures (PLS), could be used instead ofOPLS-DA for each pairwise comparison in the screeningstep, as it offers greater statistical power (Westerhuiset al., 2010). In this study, multilevel PLS was notcarried out; instead, repeated-measures ANOVAwas per-formed, making use of all data across all time points.
Our data extend previous findings that an unbiasedmetabolomic platform may be used to identify 24-hvariant metabolites (Dallmann et al., 2012; Eckel-Mahan et al., 2012; Fustin et al., 2012; Minami et al.,2009; Slupsky et al., 2007; Walsh et al., 2006); some ofthe 24-h variant plasma metabolites detected in thisstudy are already known to show such variation, includ-ing bilirubin, cortisol, and several amino acids (Erikssonet al., 1989; Feigin et al., 1967, 1968; Larsson et al., 2009;Selmaoui & Touitou, 2003; Wurtman et al., 1968), andthis provides further validation of this approach. It isalso noteworthy that numerous metabolites linked tomajor metabolic pathways were identified in this study;the 24-h variant nature of these metabolites has notbeen previously demonstrated.
Rhythms in human plasma levels of amino acids havebeen previously reported (Eriksson et al., 1989; Feiginet al., 1967, 1968; Wurtman et al., 1968). Typically,maximal concentrations were observed in the afternoon/evening, and minimal concentrations in the early hoursof the morning before waking. Our results are in keepingwith these findings: of the detected amino acids, lysine,proline, leucine, methionine, phenylalanine, and tyrosineexhibited significant day/night variation with similarpeak/trough temporal changes. The mechanisms regulat-ing this 24-h rhythmicity remain obscure, and they maybe related to the periodicity of many other metabolic pro-cesses (Eckel-Mahanet al., 2012; Feigin et al., 1971). For in-stance, the tricarboxylic acid cycle, gluconeogenesis, andlipogenesis utilize amino acid carbon backbones andmay be important in this context.
The present study identified numerous plasma acyl-carnitines that demonstrated significant time-of-day vari-ation; only a subset of these has thus far been reported(Dallmann et al., 2012). Acylcarnitines are key intermedi-ates in the β-oxidation of fatty acids in mitochondria(Kompare & Rizzo, 2008), and abnormal levels of thesemetabolites have been linked to errors of metabolisminvolving fatty acid oxidation and carnitine cycle
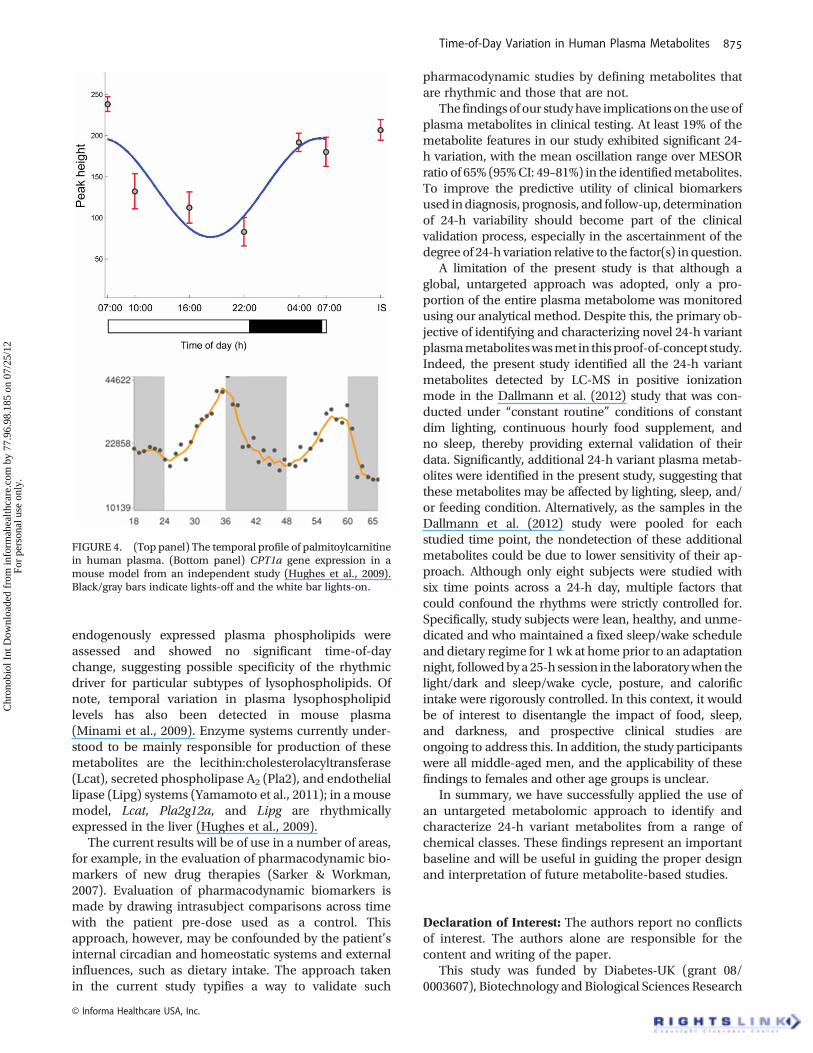
(Pasquali et al., 2006). Costa et al. (1999) reported pre-ferential increase in levels of specific mono-unsaturatedacylcarnitines in fasting individuals, who generallydisplay increased levels of blood unesterified fattyacids and hepatic β-oxidation. Fasting alone, however,is unlikely to account for the changes observed in thecurrent study, as levels of many of these metabolitespeaked and started to decrease in the morning beforelights were switched on and feeding of hourly caloricdrinks recommenced. Critical components of the bio-logical system regulating the levels of acylcarnitinesalso demonstrate 24-h variation. For instance, usinggene expression profiling data of liver enzymes acrossthe time-of-day in a mouse model, mRNA levels of keytransporters of long-chain acylcarnitines, including car-nitine palmitoyltransferase (CPT) 1a and 2, were shownto exhibit clear day/night oscillation (Hughes et al.,2009).
It is interesting to note that the time-of-day pattern ofvariation differs between short-chain, unsaturated long-chain, and saturated long-chain acylcarnitines. Levels oflong-chain unsaturated acylcarnitines (C18:1, C14:1, andC14:2) peaked early in the morning before the long-chain saturated acylcarnitines (C10, C12, C14, C16, andC18), whereas the acrophases of short-chain acylcarni-tines were observed at radically different times, i.e., C2 at4.9 h, C6 at 5.4 h, C3 at 14.3 h, and C4 at 17.7 h. Abnorm-alities in particular enzyme and membrane transportersystems have already been associated with pathognomo-nic changes in acylcarnitine subtypes in well-defined sub-types of inborn errors of metabolism (Santra & Hendriksz2010).Hence, it is plausible that short- and long-chain acyldehydrogenases and transporters are regulated differentlyacross time. Indeed, preliminary evidence suggests thepresence of such a specific regulatory process. WhereasmRNA levels of CPT1a are rhythmic with an acrophasejust before lights-off in the mouse—end of the inactivityspan, levels of long-chain acylcarnitines transported bythis mitochondrial membrane enzyme peak at the endof the dark phase in human subjects—also the end ofinactivity span (selected profiles are juxtaposed in timerelative to the activity/rest rhythm of the respectivespecies in Figure 4). Given that humans and mice arediurnal and nocturnal species, respectively, agreementof these patterns of temporal change suggest that (CPT)1a may be responsible for the 24-h variation observed inlong-chain acylcarnitines. By contrast, expression profilesof (CPT) 1b and (CPT) 1c did not show significant time-of-day difference in the mouse, lending additional supportfor the hypothesis that (CPT) 1a may be the specificrhythmic driver of long-chain acylcarnitines (Hugheset al., 2009). It is important to point out that these cross-species associations, although interesting, are tentativeand require further biological validation.
In this study, acrophases of specific C16, C18, and C20lysoPCs and lysoPEs clustered in the afternoon andevening; no clear exogenous factor related to this couldbe identified, including food consumption. Two other
J. E. Ang et al.
Chronobiology International
Chr
onob
iol I
nt D
ownl
oade
d fr
om in
form
ahea
lthca
re.c
om b
y 77
.96.
98.1
85 o
n 07
/25/
12Fo
r pe
rson
al u
se o
nly.
endogenously expressed plasma phospholipids wereassessed and showed no significant time-of-daychange, suggesting possible specificity of the rhythmicdriver for particular subtypes of lysophospholipids. Ofnote, temporal variation in plasma lysophospholipidlevels has also been detected in mouse plasma(Minami et al., 2009). Enzyme systems currently under-stood to be mainly responsible for production of thesemetabolites are the lecithin:cholesterolacyltransferase(Lcat), secreted phospholipase A2 (Pla2), and endotheliallipase (Lipg) systems (Yamamoto et al., 2011); in amousemodel, Lcat, Pla2g12a, and Lipg are rhythmicallyexpressed in the liver (Hughes et al., 2009).
The current results will be of use in a number of areas,for example, in the evaluation of pharmacodynamic bio-markers of new drug therapies (Sarker & Workman,2007). Evaluation of pharmacodynamic biomarkers ismade by drawing intrasubject comparisons across timewith the patient pre-dose used as a control. Thisapproach, however, may be confounded by the patient’sinternal circadian and homeostatic systems and externalinfluences, such as dietary intake. The approach takenin the current study typifies a way to validate such
pharmacodynamic studies by defining metabolites thatare rhythmic and those that are not.
The findingsof our studyhave implications on theuseofplasma metabolites in clinical testing. At least 19% of themetabolite features in our study exhibited significant 24-h variation, with the mean oscillation range over MESORratio of 65% (95%CI: 49–81%) in the identifiedmetabolites.To improve the predictive utility of clinical biomarkersused indiagnosis, prognosis, and follow-up,determinationof 24-h variability should become part of the clinicalvalidation process, especially in the ascertainment of thedegree of 24-h variation relative to the factor(s) in question.
A limitation of the present study is that although aglobal, untargeted approach was adopted, only a pro-portion of the entire plasma metabolome was monitoredusing our analytical method. Despite this, the primary ob-jective of identifying and characterizing novel 24-h variantplasmametaboliteswasmet in thisproof-of-concept study.Indeed, the present study identified all the 24-h variantmetabolites detected by LC-MS in positive ionizationmode in the Dallmann et al. (2012) study that was con-ducted under “constant routine” conditions of constantdim lighting, continuous hourly food supplement, andno sleep, thereby providing external validation of theirdata. Significantly, additional 24-h variant plasma metab-olites were identified in the present study, suggesting thatthese metabolites may be affected by lighting, sleep, and/or feeding condition. Alternatively, as the samples in theDallmann et al. (2012) study were pooled for eachstudied time point, the nondetection of these additionalmetabolites could be due to lower sensitivity of their ap-proach. Although only eight subjects were studied withsix time points across a 24-h day, multiple factors thatcould confound the rhythms were strictly controlled for.Specifically, study subjects were lean, healthy, and unme-dicated and who maintained a fixed sleep/wake scheduleand dietary regime for 1 wk at home prior to an adaptationnight, followedbya 25-h session in the laboratorywhen thelight/dark and sleep/wake cycle, posture, and calorificintake were rigorously controlled. In this context, it wouldbe of interest to disentangle the impact of food, sleep,and darkness, and prospective clinical studies areongoing to address this. In addition, the study participantswere all middle-aged men, and the applicability of thesefindings to females and other age groups is unclear.
In summary, we have successfully applied the use ofan untargeted metabolomic approach to identify andcharacterize 24-h variant metabolites from a range ofchemical classes. These findings represent an importantbaseline and will be useful in guiding the proper designand interpretation of future metabolite-based studies.
Declaration of Interest: The authors report no conflictsof interest. The authors alone are responsible for thecontent and writing of the paper.
This study was funded by Diabetes-UK (grant 08/0003607), Biotechnology and Biological Sciences Research
FIGURE 4. (Top panel) The temporal profile of palmitoylcarnitinein human plasma. (Bottom panel) CPT1a gene expression in amouse model from an independent study (Hughes et al., 2009).Black/gray bars indicate lights-off and the white bar lights-on.
Time-of-Day Variation in Human Plasma Metabolites
© Informa Healthcare USA, Inc.
Chr
onob
iol I
nt D
ownl
oade
d fr
om in
form
ahea
lthca
re.c
om b
y 77
.96.
98.1
85 o
n 07
/25/
12Fo
r pe
rson
al u
se o
nly.
Council (grants BB/D526853/1 and BB/I019405/1) andCancer Research UK (grants C309/A8274 and C309/A2187). J.E.A. receives funding support from theWellcomeTrust (grant 090952/Z/09/Z) and D.J.S. is a Royal SocietyWolfson Research Merit Award holder. The funders hadno role in study design, data collection and analysis,decision to publish, or preparation of the manuscript.
REFERENCES
Allen J, Davey HM, Broadhurst D, Heald JK, Rowland JJ, Oliver SG, KellDB. (2003). High-throughput classification of yeast mutants forfunctional genomics usingmetabolic footprinting.Nat. Biotechnol.21:692–696.
Costa CC, de Almeida IT, Jakobs C, Poll-The BT, Duran M. (1999).Dynamic changes of plasma acylcarnitine levels induced byfasting and sunflower oil challenge test in children. Pediatr. Res.46:440–444.
Dallmann R, Viola AU, Tarokh L, Cajochen C, Brown SA. (2012). Thehuman circadian metabolome. Proc. Natl. Acad. Sci. U. S. A.109:2625–2629.
Eckel-Mahan KL, Patel VR, Mohney RP, Vignola KS, Baldi P, Sassone-Corsi P. (2012). Coordination of the transcriptome and metabo-lome by the circadian clock. Proc. Natl. Acad. Sci. U. S. A.109:5541–5546.
Eriksson T, Voog L, Walinder J, Eriksson TE. (1989). Diurnal rhythm inabsolute and relative concentrations of large neutral amino acidsin human plasma. J. Psychiatr. Res. 23:241–249.
Feigin RD, Klainer AS, Beisel WR. (1967). Circadian periodicity ofblood amino-acids in adult men. Nature 215:512–514.
Feigin RD, Klainer AS, Beisel WR. (1968). Factors affecting circadianperiodicity of blood amino acids in man. Metabolism 17:764–775.
Feigin RD, Beisel WR, Wannemacher RW (1971). Rhythmicity ofplasma amino acids and relation to dietary intake. Am. J. Clin.Nutr. 24:329–341.
Fustin M, Doi M, Yamada H, Komatsu R, Shimba S, Okamura H.(2012). Rhythmic nucleotide synthesis in the liver: temporal segre-gation of metabolites. Cell Reports 1:341–349.
Horne JA, Östberg O. (1976). A self-assessment questionnaire todetermine morningness-eveningness in human circadian rhythms.Int. J. Chronobiol 4:97–110.
HughesME, DiTacchio L, Hayes KR, Vollmers C, Pulivarthy S, Baggs JE,Panda S, Hogenesch JB. (2009). Harmonics of circadian genetranscription in mammals. PLoS Genet. 5:e1000442.
Kompare M, Rizzo WB. (2008). Mitochondrial fatty acid oxidationdisorders. Semin. Pediatr. Neurol. 15:140–149.
Larsson A, HassanM, Ridefelt P, Axelsson J. (2009). Circadian variabil-ity of bilirubin in healthy men during normal sleep and after anacute shift of sleep. Chronobiol. Int. 26:1613–1621.
Lawton KA, Berger A,Mitchell M,MilgramKE, Evans AM, Guo L, HansonRW, Kalhan SC, Ryals JA, Milburn MV. (2008). Analysis of the adulthuman plasma metabolome. Pharmacogenomics 9:383–397.
Lewis GD, Farrell L, WoodMJ, Martinovic M, Arany Z, Rowe GC, SouzaA, Cheng S, McCabe EL, Yang E, Shi X, Deo R, Roth FP, Asnani A,Rhee EP, Systrom DM, Semigran MJ, Vasan RS, Carr SA, Wang TJ,Sabatine MS, Clish CB, Gerszten RE. (2010). Metabolic signaturesof exercise in human plasma. Sci. Transl. Med. 2:33ra37.
Minami Y, Kasukawa T, Kakazu Y, Iigo M, Sugimoto M, Ikeda S, YasuiA, van der Horst GT, Soga T, Ueda HR. (2009). Measurement ofinternal body time by blood metabolomics. Proc. Natl. Acad.Sci. U. S. A. 106:9890–9895.
Nelson W, Tong YL, Lee JK, Halberg F. (1979). Methods for cosinor-rhythmometry. Chronobiologia 6:305–323.
Nicholson JK, Connelly J, Lindon JC, Holmes E. (2002).Metabonomics:a platform for studying drug toxicity and gene function. Nat. Rev.Drug Discov. 1:153–161.
Otway DT, Mantele S, Bretschneider S, Wright J, Trayhurn P, Skene DJ,Robertson MD, Johnston JD. (2011). Rhythmic diurnal geneexpression in human adipose tissue from individuals who arelean, overweight, and type 2 diabetic. Diabetes 60:1577–1581.
Pandher R, Ducruix C, Eccles SA, Raynaud FI. (2009). Cross-platformQ-TOF validation of global exo-metabolomic analysis: applicationto human glioblastoma cells treated with the standard PI 3-Kinase inhibitor LY294002. J. Chromatogr. B Analyt. Technol.Biomed. Life Sci. 877:1352–1358.
Pandher R, Naegele E, Fischer SM, Raynaud FI. (2012). Improvementin the number of analytic features detected by non-targeted meta-bolomic analysis: influence of the chromatographic system andionisation technique. In Metabolomics. Rijeka, Croatia: InTechEurope, 317–328
Pasquali M, Monsen G, Richardson L, Alston M, Longo N. (2006). Bio-chemical findings in common inborn errors of metabolism.Am. J. Med. Genet. C Semin. Med. Genet. 142C:64–76.
Portaluppi F, Smolensky MH, Touitou Y. (2010). Ethics and methodsfor biological rhythm research on animals and human beings.Chronobiol. Int. 27:1911–1929.
Psychogios N, Hau DD, Peng J, Guo AC, Mandal R, Bouatra S, Sinelni-kov I, Krishnamurthy R, Eisner R, Gautam B, Young N, Xia J, KnoxC, Dong E, Huang P, Hollander Z, Pedersen TL, Smith SR, BamforthF, Greiner R, McManus B, Newman JW, Goodfriend T, Wishart DS.(2011). The human serum metabolome. PLoS ONE 6:e16957.
Santra S, Hendriksz C. (2010). How to use acylcarnitine profiles to helpdiagnose inborn errors of metabolism. Arch. Dis. Child Educ. Pract.Ed. 95:151–156.
Sarker D, Workman P. (2007). Pharmacodynamic biomarkers for mol-ecular cancer therapeutics. Adv. Cancer Res. 96:213–268.
Schofield WN. (1985). Predicting basal metabolic rate, new standardsandreviewofpreviouswork.Hum.Nutr.Clin.Nutr.39(Suppl1):5–41.
Selmaoui B, Touitou Y. (2003). Reproducibility of the circadianrhythms of serum cortisol and melatonin in healthy subjects: astudy of three different 24-h cycles over six weeks. Life Sci.73:3339–3349.
Slupsky CM, Rankin KN, Wagner J, Fu H, Chang D, Weljie AM, SaudeEJ, Lix B, Adamko DJ, Shah S, Greiner R, Sykes BD, Marrie TJ.(2007). Investigations of the effects of gender, diurnal variation,and age in human urinary metabolomic profiles. Anal. Chem.79:6995–7004.
Walsh MC, Brennan L, Malthouse JP, Roche HM, Gibney MJ. (2006).Effect of acute dietary standardization on the urinary, plasma,and salivary metabolomic profiles of healthy humans.Am. J. Clin. Nutr. 84:531–539.
Westerhuis JA, van Velzen EJ, Hoefsloot HC, Smilde AK. (2010).Multivariate paired data analysis: multilevel PLSDA versusOPLSDA. Metabolomics 6:119–128.
Wiklund S, Johansson E, Sjostrom L, Mellerowicz EJ, Edlund U,Shockcor JP, Gottfries J, Moritz T, Trygg J. (2008). Visualization ofGC/TOF-MS-based metabolomics data for identification ofbiochemically interesting compounds using OPLS class models.Anal. Chem. 80:115–122.
Wurtman RJ, Rose CM, Chou C, Larin FF. (1968). Daily rhythms inthe concentrations of various amino acids in human plasma.N. Engl. J. Med. 279:171–175.
Yamamoto K, Isogai Y, Sato H, Taketomi Y, Murakami M. (2011).Secreted phospholipase A2, lipoprotein hydrolysis, and athero-sclerosis: integration with lipidomics. Anal. Bioanal. Chem.400:1829–1842.
J. E. Ang et al.
Chronobiology International
Chr
onob
iol I
nt D
ownl
oade
d fr
om in
form
ahea
lthca
re.c
om b
y 77
.96.
98.1
85 o
n 07
/25/
12Fo
r pe
rson
al u
se o
nly.

SUPPLEMENTARY FIGURE 1. Venn diagram showing overlapping sets of metabolite features detected by OPLS-DA of paired time pointsand repeated-measures ANOVA across all time points.
SUPPLEMENTARY FIGURE 2. Plasma profiles of metabolite feature with mass/charge 455.19 Da and retention time 5.7 min for eight indi-viduals detected by repeated-measures ANOVA but not pairwise OPLS-DA comparisons, illustrating higher intersubject variability relativeto intrasubject time-of-day variation. All participants weremaintained under controlled light/dark, sleep/wake, posture, and calorific intakeconditions. Black bar indicates lights-off (0 lux) and white bar lights-on (440–825 lux).
Time-of-Day Variation in Human Plasma Metabolites
© Informa Healthcare USA, Inc.
Chr
onob
iol I
nt D
ownl
oade
d fr
om in
form
ahea
lthca
re.c
om b
y 77
.96.
98.1
85 o
n 07
/25/
12Fo
r pe
rson
al u
se o
nly.

SUPPLEMENTARY TABLE 1. List of metabolite features detected in the screening process and considered for tandem MS
Metabolite feature Comparison madeRetention time (min) Mass/charge (Da) 16h vs. 04h 10h vs. 22h 07h vs. 16h Repeated-measures ANOVA
.31 198.94 0 1 0 1
.31 200.97 1 0 0 1
.33 288.92 0 1 0 1
.34 327.05 1 0 0 1
.34 566.89 0 1 0 1
.34 634.88 1 0 0 1
.34 498.90 1 0 0 1
.38 200.86 0 0 0 1
.38 134.02 1 0 0 1
.39 164.03 0 1 0 1
.41 103.01 1 0 0 1
.41 116.07 1 0 0 1
.41 117.08 0 0 0 1
.41 219.03 0 0 0 1
.41 221.01 0 0 0 1
.41 365.11 1 0 1 1
.41 430.70 1 0 0 1
.41 204.12 1 0 1 1
.43 218.14 1 0 0 1
.43 229.16 1 0 1 1
.43 335.92 0 0 1 1
.44 133.00 1 0 0 1
.44 194.02 1 0 0 1
.46 135.00 1 0 0 1
.46 150.06 1 0 0 1
.47 182.08 1 0 0 1
.49 149.02 1 0 1 1
.49 132.10 0 1 0 1
.50 337.02 1 0 0 1
.55 226.05 1 0 0 1
.57 254.16 0 0 1 1
.62 168.99 1 0 0 11.66 254.16 0 1 1 11.81 103.05 1 0 0 11.81 107.05 1 0 0 11.81 120.08 0 1 0 11.81 131.05 1 1 0 11.81 149.06 0 1 0 11.81 166.09 1 1 0 11.93 232.16 1 0 0 12.57 257.17 1 1 1 12.58 235.18 1 1 1 12.82 260.18 1 0 0 12.85 251.18 1 0 1 13.12 185.12 1 0 0 13.23 286.20 1 0 0 13.59 310.20 0 1 0 13.62 288.22 0 0 1 13.66 363.22 0 1 1 13.80 361.20 0 1 1 14.17 585.27 0 1 1 14.20 243.63 0 0 0 14.21 464.28 0 0 0 14.24 252.63 0 0 0 14.24 412.28 1 0 0 14.24 430.30 1 0 0 14.24 448.31 0 0 0 14.24 488.30 1 0 0 14.24 504.27 0 0 0 14.24 510.28 0 0 0 14.32 316.25 0 0 1 14.46 416.32 1 0 0 14.46 552.24 0 0 0 14.56 470.29 0 0 0 1
J. E. Ang et al.
Chronobiology International
Chr
onob
iol I
nt D
ownl
oade
d fr
om in
form
ahea
lthca
re.c
om b
y 77
.96.
98.1
85 o
n 07
/25/
12Fo
r pe
rson
al u
se o
nly.

4.75 583.26 0 0 1 14.79 244.27 0 0 0 14.81 207.62 0 0 0 14.81 226.63 1 0 0 14.81 235.63 0 0 0 14.81 244.63 1 0 0 14.81 414.30 1 0 0 14.81 432.31 1 0 0 14.81 450.32 0 0 0 14.81 472.30 0 0 0 14.81 488.27 1 0 0 14.81 494.29 1 0 0 14.81 504.24 1 0 0 14.82 368.28 0 0 1 14.84 344.28 0 0 1 14.88 251.12 0 0 0 14.92 450.32 1 0 0 14.92 472.30 1 0 0 14.98 415.21 1 1 0 14.99 286.14 1 0 0 14.99 437.19 1 0 0 14.99 453.17 1 1 0 15.16 387.19 0 0 1 15.16 409.18 0 0 1 15.16 425.15 0 0 0 15.18 370.29 0 0 1 15.22 432.24 1 1 0 15.24 107.09 0 1 0 15.24 119.09 1 1 0 15.24 135.08 1 1 0 15.24 160.04 1 1 0 15.24 227.08 1 1 0 15.24 233.06 0 1 0 15.24 281.14 1 1 0 15.24 295.12 1 1 0 15.24 300.11 1 1 0 15.24 367.14 1 1 0 15.24 380.25 0 0 0 15.24 397.20 1 0 0 15.24 415.21 1 1 0 15.24 434.18 1 1 0 15.24 437.19 1 1 0 15.24 453.17 1 0 0 15.24 499.17 1 1 0 15.24 129.05 1 0 0 15.29 253.63 1 0 0 15.29 468.31 0 0 0 15.29 490.29 0 0 0 15.30 299.14 1 1 1 15.30 585.27 1 0 1 15.36 476.28 1 1 1 15.39 278.64 0 1 0 15.39 500.28 1 0 0 15.39 518.32 0 1 0 15.39 540.31 0 0 0 15.42 290.64 1 0 0 15.42 564.31 1 0 0 15.48 299.14 0 0 1 15.48 585.27 0 0 1 15.49 494.32 0 1 0 15.49 516.31 1 0 0 15.49 513.29 1 0 0 15.52 643.28 0 1 0 15.52 603.30 0 0 1 15.55 372.31 1 0 1 15.57 337.27 0 0 0 15.59 475.79 1 0 0 1
Continued
Time-of-Day Variation in Human Plasma Metabolites
© Informa Healthcare USA, Inc.
Chr
onob
iol I
nt D
ownl
oade
d fr
om in
form
ahea
lthca
re.c
om b
y 77
.96.
98.1
85 o
n 07
/25/
12Fo
r pe
rson
al u
se o
nly.

SUPPLEMENTARY TABLE 1. Continued
Metabolite feature Comparison madeRetention time (min) Mass/charge (Da) 16h vs. 04h 10h vs. 22h 07h vs. 16h Repeated-measures ANOVA
5.61 184.07 0 1 0 15.61 385.28 0 0 0 15.65 398.33 0 0 0 15.67 284.23 0 0 0 15.67 516.24 1 1 0 15.67 497.24 1 1 1 15.68 455.19 0 0 0 15.68 460.28 1 1 1 15.68 473.20 1 1 1 15.68 478.30 1 1 1 15.68 500.28 1 1 1 15.68 526.30 0 0 0 15.68 471.16 0 0 1 15.69 548.28 0 0 0 15.71 520.34 1 1 1 15.71 542.32 0 0 1 15.71 590.33 1 0 1 15.71 798.97 0 1 0 15.71 799.47 0 0 0 15.71 279.64 1 0 0 15.77 580.30 0 0 1 15.85 318.24 0 0 1 15.88 313.27 0 0 0 15.88 436.28 1 0 0 15.88 454.29 1 0 0 15.88 476.28 1 0 0 15.95 546.36 0 0 0 15.96 339.29 1 1 1 15.98 400.34 1 1 1 16.07 457.20 1 0 1 16.07 462.30 1 1 1 16.07 475.22 1 1 1 16.07 480.32 1 1 1 16.07 502.30 1 1 1 16.08 520.30 0 0 1 16.23 405.26 1 0 0 16.27 426.35 1 0 1 16.47 428.37 0 0 1 16.51 459.32 1 0 0 16.54 504.31 0 0 0 16.56 273.67 0 0 1 16.64 419.28 1 0 0 16.71 294.67 0 1 0 16.72 550.39 0 1 0 16.72 572.37 0 1 0 16.82 147.11 0 0 1 16.83 650.44 1 1 0 16.87 672.42 1 1 0 16.93 268.26 1 0 0 16.98 279.23 1 1 0 17.17 329.25 1 0 1 17.27 285.93 0 1 0 17.29 350.25 0 1 1 17.40 563.55 0 0 0 17.54 163.15 0 1 0 17.59 455.34 0 0 1 17.59 354.20 1 0 1 17.59 395.22 0 0 1 17.59 561.41 0 0 1 17.69 339.18 1 0 1 17.70 669.50 1 0 0 17.74 284.30 1 0 0 17.84 381.30 0 0 1 17.92 298.31 0 0 0 1
J. E. Ang et al.
Chronobiology International
Chr
onob
iol I
nt D
ownl
oade
d fr
om in
form
ahea
lthca
re.c
om b
y 77
.96.
98.1
85 o
n 07
/25/
12Fo
r pe
rson
al u
se o
nly.

8.08 780.55 1 0 0 18.20 299.14 1 1 1 18.20 584.26 0 1 1 18.20 585.27 0 1 1 18.20 583.26 0 0 1 18.21 581.25 0 0 1 18.25 389.25 0 1 0 18.37 312.33 0 1 1 1
When the feature is significant in a comparison, it is denoted “1” and when it is not, it is denoted “0”.
SUPPLEMENTARY TABLE 2. LC-MS features of metabolites of interest that did not exhibit significant 24-h variation ( p > .05)
Identification Retention time (min) Mass (Da) Elemental composition Fragments
Arginine .39 174.112 C6H14N4O2 175.120, 158.070, 116.050, 70.100Valine .41 117.079 C5H11NO2 118.087, 72.070, 55.040Carnitine .42 161.105 C7H15NO3 162.113, 103.040, 85.030, 60.080Alanine .42 89.048 C3H7NO2 90.056, 44.050Tryptophan 2.03 204.090 C11H12N2O2 205.098, 188.069, 146.059, 118.064LysoPC(16:0) 5.90 495.333 C24H50NO7P 496.340, 184.074, 104.105, 86.097LysoPC(18:1) 6.09 521.348 C26H52NO7P 522.356, 184.073, 104.107, 86.095
Time-of-Day Variation in Human Plasma Metabolites
© Informa Healthcare USA, Inc.
Chr
onob
iol I
nt D
ownl
oade
d fr
om in
form
ahea
lthca
re.c
om b
y 77
.96.
98.1
85 o
n 07
/25/
12Fo
r pe
rson
al u
se o
nly.
Related Documents