IDENTIFICATION OF CuCl in Si by XRD-XRF ANALYSIS Chi-Tang Li and Leo Tarhay Dow Corning Corporation, Midland, MI 48686-0994 ABSTRACT The mixture of CuCl in Si was found at Dow Corning during the production of either polycrystalline Si or chlorosilanes by direct process. It is difficult to identify this mixture due to the isostructure between CuCl @3M) and Si (Fd3M). The objective of this study is to overcome this difficulty by developing a method in X-ray diffraction (XRD) or X- ray fluorescence m) analysis for the accurate determination of CuCl in Si. A series of 9 binary standard mixtures were prepared from Si and CuCl, having a range from 1% to 99% Si or CuCl. These mixtures and the two pure components were then analyzed by both XRD & XRF technique. Good correlation was found between the mixture composition and XRD data (correlation coefficient up to .994), and XRF data (up to .999). Based upon a regression analysis, the binary mixture composition can be accurately determined from either XRD data (avg. error = 6%) or XRF data (avg. error = 3%). The possible accuracy improvement in the binary mixture as well as the expected accuracy in a multiple mixture for these two methods will be discussed. INTRODUCTION The mixture of CuCl in Si was produced (1,2) at Dow Corning Corporation during the production of polycrystalline Si where CuCl may be formed by reacting trichlorosilane with the Cu-electrode, or during the production of chlorosilanes by the direct process between Si and chloromethane where the Cu-catalyst may react with chloromethane to form CuCl. The identification of the mixture of CuCl in Si is essential for the effective production of Si and chlorosilanes. This paper will describe the reason why it is difficult to identify CuCl from Si, and the development of a method for the accurate identification of the mixture. Copyright(c)JCPDS-International Centre for Diffraction Data 2000,Advances in X-ray Analysis,Vol.43 366 ISSN 1097-0002

Welcome message from author
This document is posted to help you gain knowledge. Please leave a comment to let me know what you think about it! Share it to your friends and learn new things together.
Transcript
IDENTIFICATION OF CuCl in Si by XRD-XRF ANALYSIS
Chi-Tang Li and Leo Tarhay
Dow Corning Corporation, Midland, MI 48686-0994
ABSTRACT
The mixture of CuCl in Si was found at Dow Corning during the production of either polycrystalline Si or chlorosilanes by direct process. It is difficult to identify this mixture due to the isostructure between CuCl @3M) and Si (Fd3M). The objective of this study is to overcome this difficulty by developing a method in X-ray diffraction (XRD) or X- ray fluorescence m) analysis for the accurate determination of CuCl in Si. A series of 9 binary standard mixtures were prepared from Si and CuCl, having a range from 1% to 99% Si or CuCl. These mixtures and the two pure components were then analyzed by both XRD & XRF technique. Good correlation was found between the mixture composition and XRD data (correlation coefficient up to .994), and XRF data (up to .999). Based upon a regression analysis, the binary mixture composition can be accurately determined from either XRD data (avg. error = 6%) or XRF data (avg. error = 3%). The possible accuracy improvement in the binary mixture as well as the expected accuracy in a multiple mixture for these two methods will be discussed.
INTRODUCTION
The mixture of CuCl in Si was produced (1,2) at Dow Corning Corporation during the production of polycrystalline Si where CuCl may be formed by reacting trichlorosilane with the Cu-electrode, or during the production of chlorosilanes by the direct process between Si and chloromethane where the Cu-catalyst may react with chloromethane to form CuCl. The identification of the mixture of CuCl in Si is essential for the effective production of Si and chlorosilanes. This paper will describe the reason why it is difficult to identify CuCl from Si, and the development of a method for the accurate identification of the mixture.
Copyright(c)JCPDS-International Centre for Diffraction Data 2000,Advances in X-ray Analysis,Vol.43 366ISSN 1097-0002

This document was presented at the Denver X-ray Conference (DXC) on Applications of X-ray Analysis. Sponsored by the International Centre for Diffraction Data (ICDD). This document is provided by ICDD in cooperation with the authors and presenters of the DXC for the express purpose of educating the scientific community. All copyrights for the document are retained by ICDD. Usage is restricted for the purposes of education and scientific research. DXC Website – www.dxcicdd.com
ICDD Website - www.icdd.com
ISSN 1097-0002

IDENTIFICATION PROBLEM
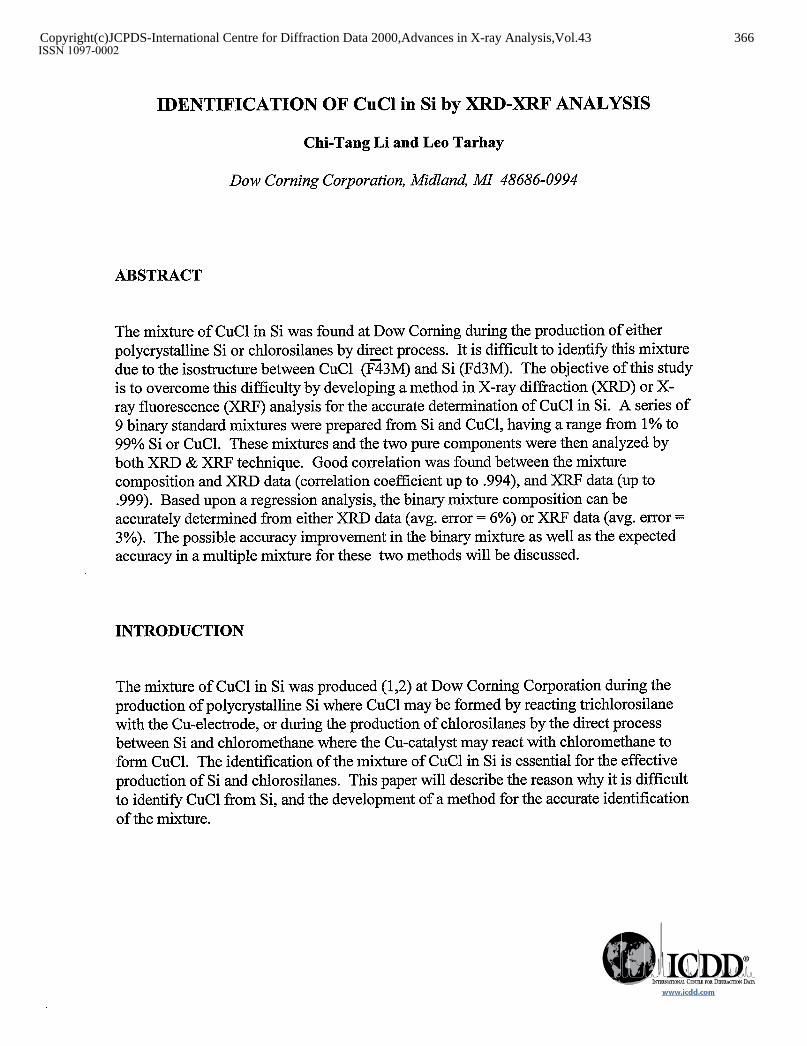
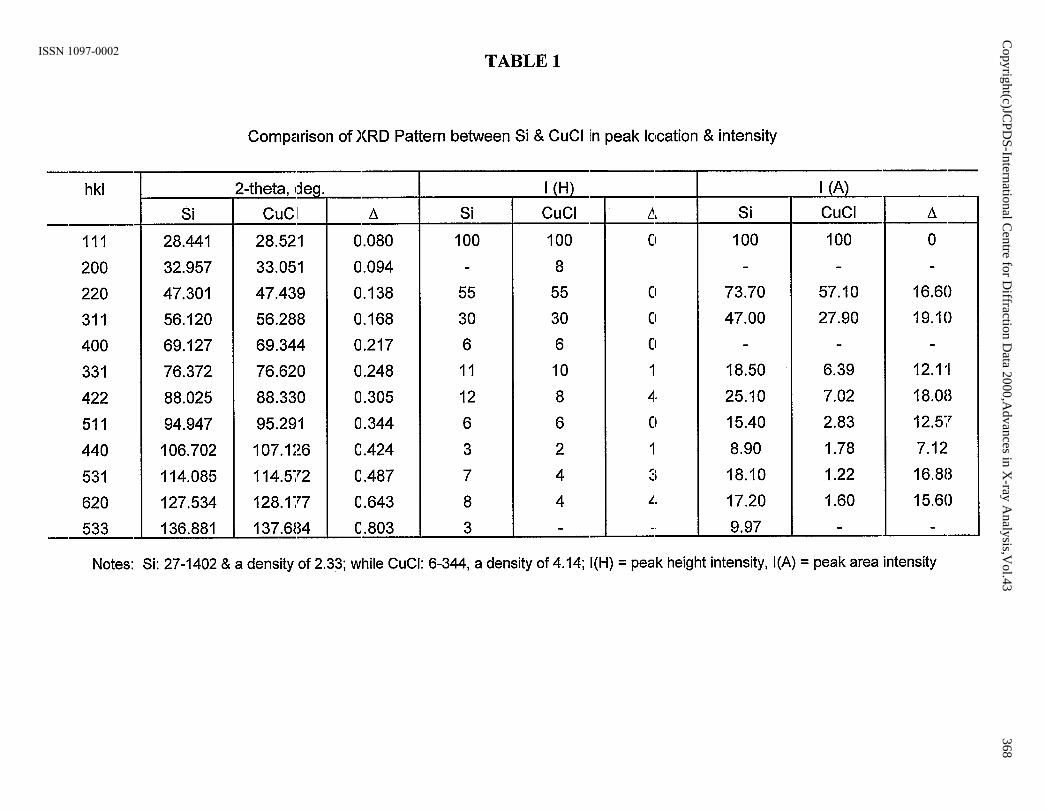
The difficulty to identify the mixture of CuCl in Si is mainly due to the iso-structure between CuCl (F43M, 5.416A) and Si (Fd3M, 5.431A). These iso-structures have produced a range of small deviation, including .08-.80 in 2-theta, O-4 in peak height intensity, I(H), and O-19 in peak area intensity, I(A), as shown in Table 1 and Figure 1.
EXPERIMENTAL
A. Raw Materials
1. Si From Hemlock Semiconductor Plant, 99.9+%, IVXTBS sample of 4 406-l 739, wt = 17Og. 2. CuCl From Fisher / Acres Organ& 95+%, Lot = A01 1303601, wt=5OOg.
B. Preparation of binary standards
,1846 &
The CuCl purchased from Fisher is a very fine powder of -325 mesh, while the polycrystalline Si produced from Hemlock Semiconductor Plant was ground by a B& grinder also to -325 mesh in order to minimize the orientation effects. After the grinding, the two pure components were mixed to make the many binary standards with the particular caution to reduce both the mixing error (by mixing 5 minutes by hand and 30 minutes by a shaker) and the weighting error (by using a minimum weight of 0.49g for each component and a total weight of 2g or more for each standard). The nine binary standard mixtures such prepared plus the two pure components, all in the form of powder (but none in the form of pressed pellet), were then analyzed by both XRD and XRF techniques as described below.
c. XRDunit
The XRD is a Siemens D5000 theta-theta automated powder diffractometer, having a diameter of 4Olmm, and equipped with a Cu tube (2.2kW), a graphite monochromator, a scintillation counter with pulse height analyzer, a sample spinner of 50mm diameter, and a homemade sample holder of Si( 100) having a diameter of 25mm and a cavity of 48mm3(3). The XRD unit was operated at 40kV and 3OmA, scan speed of ldeg/min (step time of 2.4S, and step size of 0.04 deg.), scan range of 25-140 degree 2- theta, sample spin rate of 30 rpm, and collimation slits of 2-n-m divergence, 2-mm scatter, 0.2mm detector, and 0.6~mm monochromator.
Copyright(c)JCPDS-International Centre for Diffraction Data 2000,Advances in X-ray Analysis,Vol.43 367ISSN 1097-0002
d .- WI
0 000~*0~c9*’
c3~~~r-2om~*bo~
-d-Od-cvo3bC
00~~cY
0400d-d-cD~
d d
d d
d d
d d
d d
d c
Copyright(c)JC
PDS-International C
entre for Diffraction D
ata 2000,Advances in X
-ray Analysis,V
ol.43368
ISSN 1097-0002
Copyright(c)JC
PDS-International C
entre for Diffraction D
ata 2000,Advances in X
-ray Analysis,V
ol.43369
ISSN 1097-0002
D. XRFunit
The XRF unit is a KEVEX 770/8000 energy dispersive x-ray fluorescence (EDXRF) instrument whose software was upgraded in 12/97. All 11 samples were analyzed via XRF by using the direct target of Rh, lOKV, .OlmA, 35% Dead-Time, Vacuum (50-150), filter2 (Mylar), 500 set, program of loop-SiClCu, and sample wt. of .972-.975g.
E. Regression analysis
All regression analyses between composition and XRD or XRF data were performed by using Sigma Plot 4.0.
METHOD DEVLOPMENT
A method was developed to identify the mixture of CuCl in Si. This method involves the preparation of a series of binary standards from Si and CuCl, the chemical analysis by XRD or XRF technique, and the regression analysis between composition and XRD or XRF data. Nine such binary standards were prepared, having a range from 1% to 99% Si or CuCl, which covers a broad range of composition, but contains more compositions near both ends of the range. It was found that the weight ratio between Si and CuCl is proportional to either the normalized area, but not the peals, intensity in XRD analysis, having a correlation coefficient up to -994 as shown in Table 2 & Figure 2, or the count ratio of Si/Cu, CuBi, Si/Cl, or Cl/Si in XRF analysis, having a correlation coeffkients up to .999, as shown in Table 3 & Figure 3. For each of the 11 samples analyzed via XRD by using Si(100) holder and similar sample weight, the area intensity, I(A) was first measured for all peaks and then all the intensity data were normalized by taking the maximum I(A) as 100. For each corresponding peak, the normalized intensity was found to have good correlation with the composition of the 11 samples. There are a total of 11 peaks between the range of 2-theta from 25 to 140 degrees for both Si and CuCl. Even after sub&acting those peaks of superimposing with the peaks of Si( 100) sample holder (69.1 and maybe 33.0) and the maximum peak taken as 100 (28.4), there are still 9 peaks left, all of which can be used to achieve a good correlation. On the other hand, the 11 samples were analyzed via XRF by using almost the same sample weight and a direct target of Rh for the determination of Si, Cl, and Cu. The weight (wt) ratio of Si/CuCl was found to have good correlation with the count ratio of either Si/Cu or Si/Cl(.9980), while the wt. ratio of CuCl/Si has good correlation with CuBi or Cl/Si (.9996). For obvious reason, poor correlation will be obtained if correlation is attempted between two non-compatible subjects, e.g. wt% Si vs. Si/Cu or WC1 (.83 1 or .815), and wt% CuCl vs. Cu/Si or Cl/Si (.616 or .605). Sometimes, even good correlation between compatible subjects may produce meaningless results. For example, for the 11 samples, wtO/o Si vs. Si counts, or wt% CuCl vs. counts of Cl or Cu have produced good correlation from .975 to .996, but they are meaningless, because they have little or no bearing on identifying and determining the mixture composition.
Copyright(c)JCPDS-International Centre for Diffraction Data 2000,Advances in X-ray Analysis,Vol.43 370ISSN 1097-0002

Si %
100 310/100 228.6173.7 145.7/47.0 57.5118.5
99 258.8/100 189.8173.3 123/47.5 49.7/l 9.2
95 286.3/100 212.1/74.1 129.2/45.1 52.2118.2
90 '281.7/100 209.8174.5 125/44.4 44.8115.9
70 286.8/100 195.2168.1 112/39.1 37.6/13-l
50 310.5/100 196.4163.3 109.9/35.4 32.OAO.3
30 309.61100 185.1/598 104.2133.7 26/8.40
10 306.91100 169.5/55.2 90.4/29.5 22.317.27
5 309.7/l 00 168.4/54.4 91.2/29.4 21.4/6.96
1 287.8/100 166.8158 86.2129.9 20.1/6.98
0 331.7/100 189.3/57.1 92.7127.9 21.2/6.39
Corr. Coeff.
Integrated intensity / ratio
28.4431100 47.303155 56.122/30 76.379/l 1 88.028112 94.950/6 106.718/3 114.091/7 127.545/8 136.89613
TABLE 2
Mixture of Si and CuCl analyzed by XRD: 4OkV/3OmA, 30rpm, 1 deglmin., 25140 degree, Si (100) holder
78.3125.1 48.2115.4 27.618.90 56.3A8.1 53.3/17.2 30.919.97
68126.3 37.lPl4.3 24.1/9.31 52.1/20.1 45.4117.5 27.0/10.4
70.5124.6 38.8113.6 24.818.66 53.3118.6 47.1/16.5 23.418.17
62.3/22.1 36.5H3.0 22.117.85 47.2116.8 44.2/15.7 21.817.74
48.9/17.1 34.1/12.9 15.9/5.55 36.3/12.7 36.3/12.7 18.716.52
44.6114.4 23.117.44 11.5/3.70 27.418.82 23.517.57 9.2/2.96
33.4/10.8 16.2/5.23 7.912.55 11.5/3.71 1314.20 4.2/l-36
26.918.77 16.4/5.34 7.612.48 9.813.19 9.012.93 2.81.91
22.517.27 9.1/2.94 3.811.23 6.0/1.94 5.2/1.68 1.31.42
22.617.85 10.4/3.62 5.4/1.88 3.611.25 4.2/1.46 1.0/.35
23.317.02 9.412.83 5.9/1.78 4.0/1.22 5.3/1.60
-- 0.980 0.990 0.980 0.988 0.981 0.976 0.991 0.994 0.977
Copyright(c)JCPDS-International Centre for Diffraction Data 2000,Advances in X-ray Analysis,Vol.43 371ISSN 1097-0002

120
100
80
60 .- ul s
40
20
0
Figure 2
Si vs CuCl Correlation by XRD data2 (high angle at 127-deg)
b[O]-4.4893153739 b[l]6.0519231534 r 2 0.9877462702
.
0 2 4 6 8 10 12 14 16 18 20
CuCI-Si Intensity
Copyright(c)JCPDS-International Centre for Diffraction Data 2000,Advances in X-ray Analysis,Vol.43 372ISSN 1097-0002

wt% Si CLlCl
wt ratio Si / CuCl CuCl / Si
counts Si Cl cu Count ratio
Si/Cu Cu/Si Si/Cl Cl I Si
TABLE 3
Mixture of Si & CuCl analyzed by XRF: direct target (Rh), lOkV, O.OlmA, 35% deadtime, vacuum (50-150), filter 2 (Mylar), 500 set, program loop-SiClCu, sample w-t = .972-,975 g
100 99 95 90 70 50 0 1 5 10 30 50
30 70
10 90
5 95
-- 99 19 0 .OlOlO .05263
833822 840877 765178 6414 16949 37895 987 20527 67597
.00118 --
.00769
40.964 11.32 .02441 a08834 49.612 20.19 .02016 .04952
9 2.333 1.0 .llll .4286 1.0
690718 533775 330344 76313 146351 265057 125865 250014 359987
5.488 2.135 .9177 .1822 .4684 1.089 9.051 3.647 1.246 .1105 .2742 .8024
.4286 .llll .05263 .OlOlO 0 2.333 9.0 19.0 99.0 --
188047 63637 348146 472556 419496 471012
.4483 .1351 .07771 .01607 0 .9980 2.23 1 7.402 12.87 62.22 -- .9996 .5401 .1347 .08401 .01568 0 .9980 1.851 7.426 11.9 63.79 -- .9996
36334 432519 467566
1 0 99 100
7780 0 49321 455737
484072 469599
corr. Coeff
Copyright(c)JCPDS-International Centre for Diffraction Data 2000,Advances in X-ray Analysis,Vol.43 373ISSN 1097-0002

I .2e+5
1 .Oe+5
8.0e+4
6.0e+4
4.0e+4
2.0e+4
0.0
-2.Oe+4
Figure 3
Si vs CuCl Correlation By XRF DataZA (WSi, 1 OkV,.Ol mA)
0 10000 20000 30000 40000 50000
Count Ratio, CI/Si, xl000
60000 70000
Copyright(c)JCPDS-International Centre for Diffraction Data 2000,Advances in X-ray Analysis,Vol.43 374ISSN 1097-0002
RESULT AND DISCUSSION
Based upon the XRD or XRF method developed during this study, we are successful in reaching an average accuracy of 3-6% error for the determination of wt”/o CuCl or Si in a binary mixture. However, the higher error was found to take place between a composition of 30-70% Si. This is likely caused by the fact that the binary standards were made at 20% intervals between 30-70% Si vs. l-5% intervals on the two ends of less than 10% and greater than 90% Si. Thus, it is highly likely that the preparation and usage of more binary standards such as 80,60,40, and 20% Si or CuCl would improve the accuracy for measuring and identifying CuCl in Si. For the binary mixture, the XRF method appears to be slightly better than the XRD method (3 vs. 6% error) for identifying the mixture of CuCl in Si. However, it is expected that the XRD method will be far better than the XRF method for multiple mixture that contains Si-compounds other than Si, or Cu- and Cl- compounds other than CuCl. These additional Si-, Cu-, and Cl- compounds would have little effect on the XRD method, but would have detrimental effect on the validity of the XRF method. The only compounds that could affect the validity of XRD method are those iso-structures of Si such as CaF2.
REFERENCES
1. Stark, F.O., Falender, J.R., Wright, A.D., Comprehensive Organometallic Chemistry, Pergamon Press, Oxford & New York, 1982,305-360.
2. Kirk-Othmer Encyclopedia of Chemical Technology, Wiley, New York, 198 1, Vo1.13,624.
3. Li, CT. and Albe, W.R., “Development of an improved XRD Sample holder”, powder Diffraction 8 (2), June 1993, 118-121.
ACKNOWLEDGMENTS
The authors would like to acknowledge Scott Clemons for helping with both XRF and regression analysis and Ronda Grosse for her encouragement and support.
Copyright(c)JCPDS-International Centre for Diffraction Data 2000,Advances in X-ray Analysis,Vol.43 375ISSN 1097-0002
Related Documents