An ASABE Meeting Presentation Paper Number: 131591910 Identification of citrus greening disease using a visible band image analysis Alireza Pourreza, Ph.D. Student Agricultural and Biological Engineering, University of Florida, Gainesville, FL 32611, [email protected] Won Suk (Daniel) Lee, Associate Professor Agricultural and Biological Engineering, University of Florida, Gainesville, FL 32611, [email protected] Eran Raveh, Researcher Department of Fruit Trees Sciences, Institute of Plant Sciences, A.R.O. Gilat Research Center, [email protected] Youngki Hong, Agricultural Engineer Farming Automation Division, Department of Agricultural Engineering, National Academy of Agricultural Science, [email protected] Hyuck-Joo Kim, Agricultural Engineer Farming Automation Division, Department of Agricultural Engineering, National Academy of Agricultural Science, [email protected] Written for presentation at the 2013 ASABE Annual International Meeting Sponsored by ASABE Kansas City, Missouri July 21 – 24, 2013 The authors are solely responsible for the content of this meeting presentation. The presentation does not necessarily reflect the official position of the American Society of Agricultural and Biological Engineers (ASABE), and its printing and distribution does not constitute an endorsement of views which may be expressed. Meeting presentations are not subject to the formal peer review process by ASABE editorial committees; therefore, they are not to be presented as refereed publications. Citation of this work should state that it is from an ASABE meeting paper. EXAMPLE: Author’s Last Name, Initials. 2013. Title of Presentation. ASABE Paper No. ---. St. Joseph, Mich.: ASABE. For information about securing permission to reprint or reproduce a meeting presentation, please contact ASABE at [email protected] or 269-932-7004 (2950 Niles Road, St. Joseph, MI 49085-9659 USA).

Welcome message from author
This document is posted to help you gain knowledge. Please leave a comment to let me know what you think about it! Share it to your friends and learn new things together.
Transcript

An ASABE Meeting Presentation
Paper Number: 131591910
Identification of citrus greening disease using a visible band image analysis
Alireza Pourreza, Ph.D. Student Agricultural and Biological Engineering, University of Florida, Gainesville, FL 32611,
Won Suk (Daniel) Lee, Associate Professor Agricultural and Biological Engineering, University of Florida, Gainesville, FL 32611, [email protected]
Eran Raveh, Researcher Department of Fruit Trees Sciences, Institute of Plant Sciences, A.R.O. Gilat Research Center,
Youngki Hong, Agricultural Engineer Farming Automation Division, Department of Agricultural Engineering, National Academy of
Agricultural Science, [email protected]
Hyuck-Joo Kim, Agricultural Engineer Farming Automation Division, Department of Agricultural Engineering, National Academy of
Agricultural Science, [email protected]
Written for presentation at the
2013 ASABE Annual International Meeting
Sponsored by ASABE
Kansas City, Missouri
July 21 – 24, 2013
The authors are solely responsible for the content of this meeting presentation. The presentation does not necessarily reflect the officialposition of the American Society of Agricultural and Biological Engineers (ASABE), and its printing and distribution does not constitute an endorsement of views which may be expressed. Meeting presentations are not subject to the formal peer review process by ASABEeditorial committees; therefore, they are not to be presented as refereed publications. Citation of this work should state that it is from an ASABE meeting paper. EXAMPLE: Author’s Last Name, Initials. 2013. Title of Presentation. ASABE Paper No. ---. St. Joseph, Mich.: ASABE. For information about securing permission to reprint or reproduce a meeting presentation, please contact ASABE at [email protected] or 269-932-7004 (2950 Niles Road, St. Joseph, MI 49085-9659 USA).
2013 ASABE Annual International Meeting Paper Page 2
Abstract. Huanglongbing (HLB) or citrus greening is an extremely severe disease in citrus trees which is incurable and causing a huge loss in the citrus industry in Florida. However, early detection and removal of the infected canopies may decrease spreading of the disease and avoid an enormous loss. The disease symptoms are not clear in the early stages of infection. Subjective disease detection methods such as ground scouting and other objective means are also either inaccurate or costly and time consuming. This paper introduced an easy, inexpensive, fast, and accurate method of HLB detection which is more applicable and affordable for citrus growers. A customized image acquisition system was developed to acquire images of citrus leaves (Valencia) at a waveband of 591 nm. Polarized filters were used in both illumination and imaging system to highlight the HLB disease symptoms. Several types of textural features were extracted from the leaf images and the best sets of features which could describe the infection characteristics were ranked using five different feature selection methods. The performances of seven classifiers were evaluated in a step by step classification approach. Since HLB symptoms are similar to some nutrient deficiencies, magnesium and zinc deficient samples were also included in the classification process. Healthy and HLB symptomatic samples were identified with an accuracy of 100%; however, some of the nutrient deficient samples were misclassified into other classes using this method. The overall accuracies of 86.5% and 89.6% were achieved in five-class identification and two-class (healthy or HLB) detection, respectively.
Keywords. Classification, HLB, Image Processing, Polarized Light, Textural Features.
The authors are solely responsible for the content of this meeting presentation. The presentation does not necessarily reflect the official position of the American Society of Agricultural and Biological Engineers (ASABE), and its printing and distribution does not constitute anendorsement of views which may be expressed. Meeting presentations are not subject to the formal peer review process by ASABEeditorial committees; therefore, they are not to be presented as refereed publications. Citation of this work should state that it is from anASABE meeting paper. EXAMPLE: Author’s Last Name, Initials. 2013. Title of Presentation. ASABE Paper No. ---. St. Joseph, Mich.: ASABE. For information about securing permission to reprint or reproduce a meeting presentation, please contact ASABE [email protected] or 269-932-7004 (2950 Niles Road, St. Joseph, MI 49085-9659 USA).

2013 ASABE Annual International Meeting Paper Page 3
Introduction Citrus is a very important crop in Florida. In the 2010-2011 season, 7.4 million tons of citrus were produced in Florida which included 63 percent of the total United States citrus production (Putnam, 2012). Citrus greening or Huanglongbing (HLB) is a very severe disease which has decreased the citrus production in Florida. The disease is caused by the insect-vectored α-protobacterium Candidiatus Liberibacter Asiaticus (Mishra et al., 2007). Blotchy mottle on leaf, yellow shoots, inverted color, and uneven fruits are some of the disease symptoms; however, it is unlikely that they would appear altogether in the same tree. The disease reduces the production, degrades the fruit quality and finally destroys the tree (Gonzalez et al., 2012). Although, no practical treatment has been reported for the disease yet, detecting and removing the infected trees can avoid spreading the infection to the other trees.
Many studies have focused on HLB detection and several methods have been tried for this purpose. In 1996, polymerase chain reaction (PCR) method was proven to be an effective HLB detection method (Hocquellet et al., 1999). Li et al. (2006) also developed a real-time and quantitative PCR assay method and examined it successfully for HLB confirmation in Florida. However, the PCR method is a laboratory based approach which is expensive and time consuming, and so cannot be used in a real-time in-field application. Currently, growers try to find noticeable HLB symptoms to identify the infected trees. However, it is not easy to differentiate the symptoms resulting from nutrient deficiency and HLB. Therefore, a portable and real-time sensing system is needed, which is able to identify the HLB symptoms and differentiate them from nutrient deficiencies. This paper presents an applicable detection approach for this purpose.
Early and quick detection has been considered widely in recent studies. The use of near-infrared and mid-infrared spectroscopy, for example, has been investigated to identify the HLB infected trees from healthy or nutrient deficient ones under laboratory and field conditions (Mishra et al., 2007; Mishra et al., 2011; Mishra et al., 2012; Sankaran and Ehsani, 2011; Sankaran et al., 2010; Sankaran et al., 2011).
Airborne hyperspectral and multispectral imaging approaches have also been employed in HLB disease detection (Kumar et al., 2012; Li et al., 2012a; Li et al., 2011; Li et al., 2012b). Based on their results, the difference between the reflectance signatures of HLB and healthy trees can be used to highlight the severely symptomatic areas. Some researchers examined the capability of laser-induced fluorescence spectroscopy and imaging for citrus disease identification (Belasque Jr. et al., 2008; Lins et al., 2009; Marcassa et al., 2006). Pereira et al. (2011), for instance, achieved an accuracy of 95% for detection of HLB symptomatic in early stages from healthy samples. Microscopic image from the citrus leaf turned out to be a capable method to identify the HLB symptoms from nutrient deficiencies by Kim et al. (2009). They extracted color co-occurrence features from the leaf images and obtained the overall accuracy of 97% using a selected feature-set and a discriminant classifier.
Gonzalez et al. (2012) proved that the starch content in HLB-infected leaves increases compared to the healthy ones. Their results indicated that the accumulated starch in HLB symptomatic leaves were not biochemically similar to the healthy leaves’ starch which was accumulated as a result of a mechanical injury. Therefore, the starch measurement in citrus leaves can be considered as a HLB detection method. Furthermore, starch was determined to be able to rotate the polarization planer of light (McMahon, 2004). This capability of starch on polarized light was previously evaluated by the authors and an imaging system which was able to highlight the starch accumulated on HLB leaf was developed. The system was examined for Hamlin variety of citrus in four classes of healthy, HLB symptomatic, zinc deficient, and HLB symptomatic-zinc deficient samples and the overall accuracy of 90% was achieved. The classification rate increased to 93% when the HLB detection was considered as the purpose of the classification.
In this study, we evaluated the same method for another citrus variety (Valencia) to confirm the robustness of our proposed system. We also added one more class of magnesium deficient samples to test our system in a more challenging situation.
The main objective of this study was to evaluate a machine vision based sensing system for identification of HLB symptomatic citrus leaves from healthy and nutrient deficient samples. The particular objectives were:
To compare the performance of the proposed method for two different varieties of citrus. To evaluate the system capability of discriminating between HLB and nutrient deficiency symptoms. To assess the capabilities of image textural features for HLB detection.
Materials and Methods The starch accumulation in the HLB symptomatic leaves can be emphasized in images captured with a narrow band illumination and a polarizing filter. Because starch rotates the polarization planer of the light, this effect
2013 ASABE Annual International Meeting Paper Page 4
can be used to differentiate between HLB symptoms and nutrient deficiency symptoms. In May 2010, a preliminarily experiment was conducted in the Citrus Research and Education Center (CREC) in Lake Alfred and it was determined that the maximum and minimum polarization rotation caused by accumulated starch in HLB symptomatic leaves mostly happened at 600 nm and 400 nm wavebands, respectively. Based on these results, an imaging system was designed and tested for the Hamlin variety of citrus. The classification results showed that the proposed system is able to differentiate HLB symptomatic leaves from healthy and zinc deficient leaves. In order to confirm the reliability of the proposed method, it was examined with a different citrus variety (Valencia) and also additional nutrient deficiency classes.
Data Collection
A total of 96 citrus leaf samples of the Valencia variety in four classes of healthy, HLB symptomatic, zinc deficient, and magnesium deficient leaves were collected from the CREC grove in December, 2012. In order to identify the HLB infected samples, a PCR test (Sankaran et al., 2010) was conducted for each individual leaf in the diagnostic laboratory of the United States Sugar Corporation (USSC)/Southern Gardens located in Clewiston, Florida. The starch concentration for each leaf was also measured in µg starch/mm2 based on the method introduced by Gonzalez et al. (2012). The starch concentration value of 5 µg/mm2 was defined as the threshold to evaluate the HLB infection status of samples, as it was suggested by them.
Image Acquisition
An image acquisition system was designed to take citrus leaf images in a controlled illumination system. Four high power LEDs (LZ1-00A100, LED Engine, San Jose, California) at 591 nm were used for illumination purpose. A monochrome camera (EBC-B100G, EZ SPY CAM, Los Angeles, California) was also used to capture the leaf reflectance with a good spectral sensitivity characteristic at 591 nm (Sony CCD image sensors, ICX404AL) and a horizontal resolution of 420 TV lines. Since the camera output was analog, a USB frame grabber (Model 2255, Sensory, Tigard, Oregon) was employed to produce digital images with a 640×480 pixel resolution. Two polarizing filters (Visible linear polarizing laminated film, Edmund Optics, Barrington, New Jersey) in perpendicular directions were employed; one was placed in front of the LEDs and the other was mounted in front of the camera lens. Therefore, the camera was able to capture the minimum reflectance of the leaf; however, since the HLB symptomatic leaves contained starch accumulation, which rotates the polarization planer of the light, the HLB symptomatic areas were expected to be highlighted with brighter gray levels. The imaging and illumination components were assembled in a wooden box with 16 cm length, 14 cm width, and 47.5 cm height. The distance between the camera lens and the leaf was 39 cm.
Preprocessing
Automatic gain control (AGC) is a camera capability which increases the average gain if the image is too dim and reduces the gain if the image is too bright (Fowler, 2004). AGC is typically a non-deactivatable feature for the commercial cameras. Since the real reflectance of the leaf was required for this study, the AGC effect was not favorable. In order to cancel the AGC effect on the images, a similar background was used in all the images. Then, they were calibrated using a ratio of an average of background gray values in all the images to an average of those in each image, as a gain multiplier for each individual image.
Feature Extraction
MATLAB (version R2011a, MathWorks, Natick, MA, USA) software was used for all steps of feature extraction, features selection, data analysis, and classification. A total of 30 textural features in four groups were extracted from the images. The features included statistical histogram features from gray level, local binary pattern (LBP), and local similarity pattern (LSP) matrices as well as gray level cooccurrence matrix (GLCM) features. Equations 1 through 8 show the formulas which were used to extract the statistical features from the normalized histogram ( ) of each image’s gray level matrix when the gray level (ranged from 0 to 255) was shown with .
Mean ∑ (1)
Standard Deviation (STD) ∑ (2)
Third Moment ∑ (3)
Smoothness 1 1/ 1 (4)
Uniformity ∑ (5)
Entropy ∑ log (6)

2013 ASABE Annual International Meeting Paper Page 5
Maximum Gray Level Probability | (7)
Range max | 0 min | 0 (8)
LBP is an innovative image textural descriptor which was first introduced by Ojala et al. (1996). In this method each matrix element in a 3×3 neighborhood is compared to the central element and substituted by 1 if it is greater than the value of the central element, and by 0 if it is smaller than the central element. The thresholded values are then assumed to be an 8-bit binary number and its corresponding decimal number substitutes the central element. Similarly, in LSP the neighborhood elements are compared with the central element; however, the relation between each neighbor element and the central element is described with a 2-bit code. In this method the neighborhood elements are substituted with 00, 01, or 10 if they are below, within or above a defined similarity range, respectively. Then each element code is multiplied by its respective weight (Pourreza et al., 2011). LBP and LSB employ the same approach to prevent the variation caused by code rotation. The rotational invariance is obtained by rotating the codes to achieve their least possible decimal values. The equations 1 through 6 were also used to extract the statistical features from the normalized histogram of LBP and LSP matrices.
GLCM is a 256×256 matrix (for an 8-bit gray level image) in which each , element shows the number of times that two gray values of and were adjacent in any of four principal directions (0°, 45°, 90°, and 135°). Equations 9 through 18 show the formulas which were used to extract the textural features from the normalized GLCM matrix (Pourreza et al., 2012).
Mean ∑ ,, (9)
Variance ∑ ,, (10)
Entropy ∑ , log ,, (11)
Uniformity ∑ ,, (12)
Homogeneity ∑ , / 1 , (13)
Inertia ∑ ,, (14)
Cluster Shade ∑ 2 ,, (15)
Cluster Prominence ∑ 2 ,, (16)
Maximum Probability max , (17)
Correlation ∑ / ,, (18)
When , was the normalized GLCM matrix and and were the indices of each normalized GLCM matrix element.
Data Analysis and the Classification Model
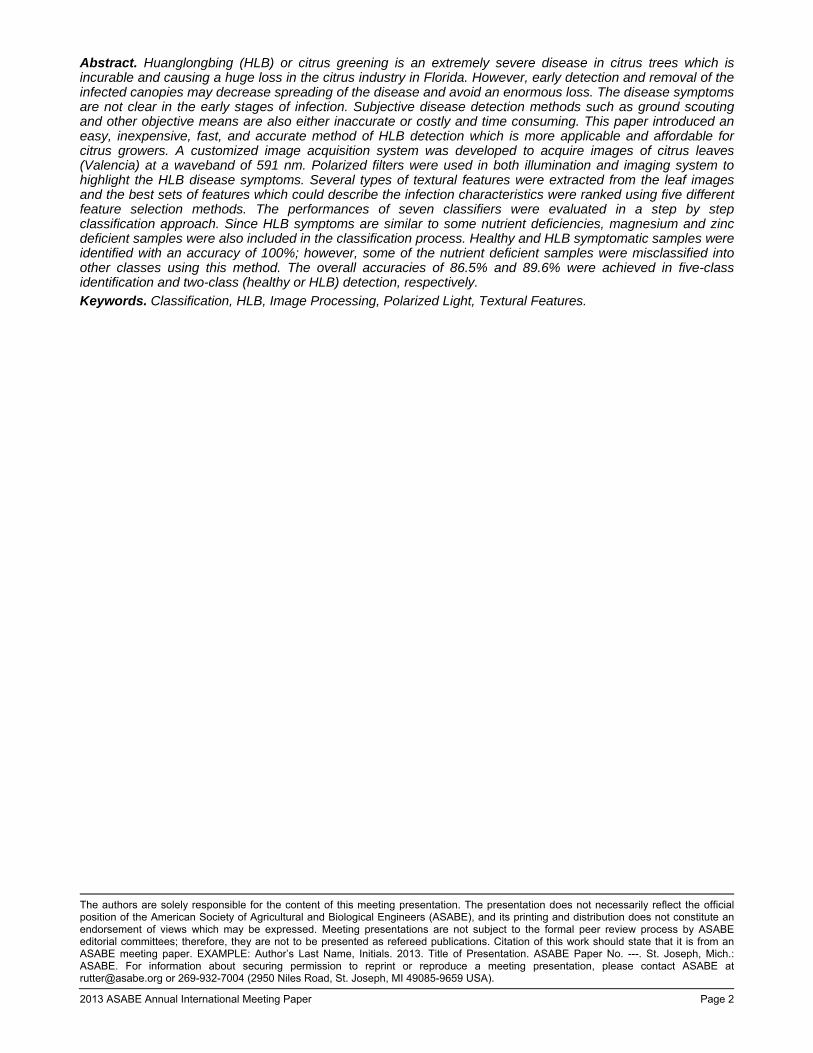
Based on the PCR results, all samples were categorized into five classes of healthy, HLB symptomatic, magnesium deficient, zinc deficient, and zinc deficient & HLB symptomatic samples. Then a principal component analysis (PCA) was performed on the data and all 96 samples were plotted using the first two principal components to visualize them in a two dimensional scatter plot. It was inferred from this scatter plot that the classification can be done in several 2-class identifications steps. Figure 1 illustrates the classification model which was designed based on the principal component analysis. At the first step, all samples were classified into two merged classes of healthy or magnesium deficient samples, and HLB symptomatic and zinc deficient samples. Then the samples at the left side of the model were classified into healthy and magnesium deficient classes. Samples at the right side of the model were also classified into two classes of HLB symptomatic and zinc deficient. Finally at the last step, HLB symptomatic samples were detected within the zinc deficient class.
The performances of seven classifiers including linear, naive Bayes linear, Mahalanobis, quadratic, naive Bayes quadratic, support vector machine (SVM), and K-nearest neighbors (KNN) were evaluated in this study. To prove that the obtained classification results do not depend on the validation and training sets, a K-fold cross validation approach (Huang and Chang, 2007) with five folds was used in all classification steps. For this purpose, the dataset in each step was randomly separated in five folds; one for validation and four for training.
In order to find the best set of features for each step of the classification model, five different feature ranking methods containing t-test, entropy (or Kullback-Leibler distance), Bhattacharyya distance (or Chernoff bound),

2013 ASABE Annual International Meeting Paper Page 6
ROC (receiver operating characteristic), and Wilcoxon test (or Mann-Whitney) were conducted using rankfeatures.m function in Matlab and evaluated. Then, all seven classifiers were trained using different number of top features which were ranked with each of the five ranking methods to determine the best set of features and classifier with the highest accuracy. Therefore, a total of 1050 different features-classifier sets (30 different number of top features × five ranking methods × seven classifiers) were compared to each other and the classifier which employed the minimum number of top features to yield the most accurate rate was selected for each step.
Figure 1. The step by step classification model which was designed based on the principal component analysis.
Classification
In this part, the whole classification model was run for each sample to classify it in each of five classes. For this purpose, all the data-set was divided randomly into two equal sets. Then the whole classification model was performed on the first half while the second half was used as the training set. The classification model was repeated for the second half, and this time the first half was used as the training set. Therefore, the results were available for all 96 samples. The best set of features and classifiers which were determined in the previous part were used in each step of the classification.
Results
PCR test and Starch Measurement Results
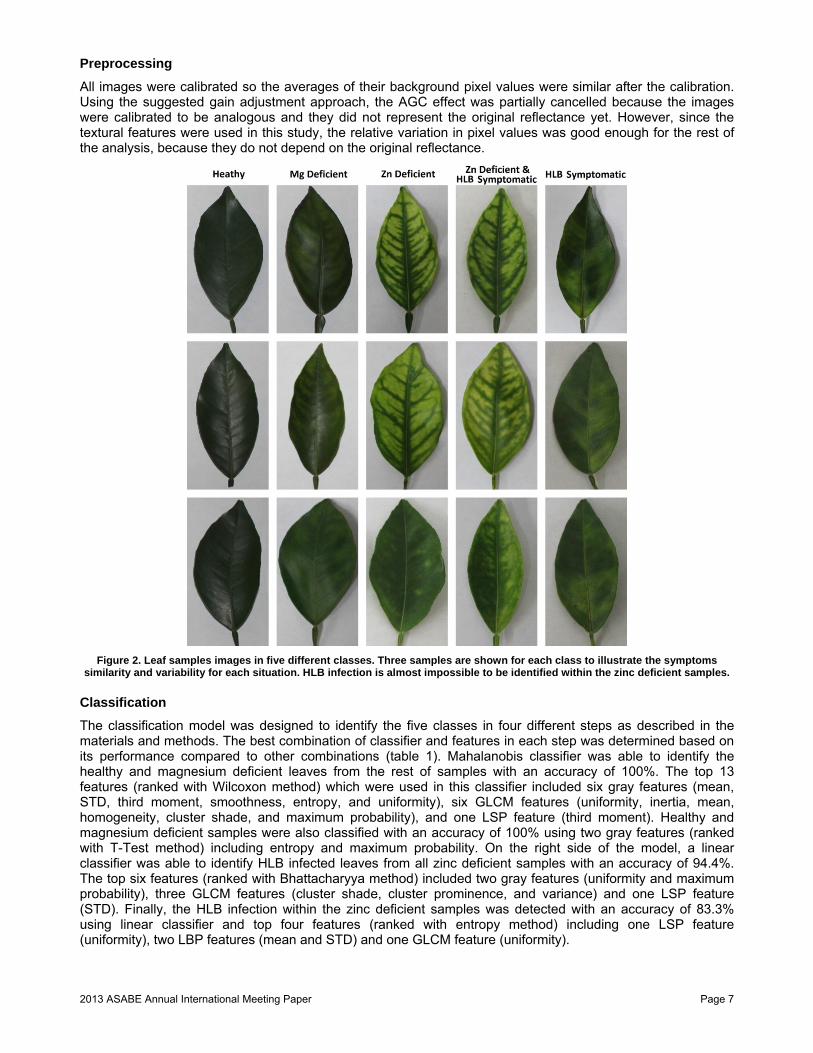
The PCR results were used to confirm the HLB infection of samples as a reference for creating the training and validation sets in the classification steps. Five different classes including healthy (20 samples), HLB symptomatic (20 samples), magnesium deficient (20 samples), zinc deficient (6 samples), and zinc deficient-HLB symptomatic (30 samples) leaves were defined based on the PCR results. Figure 2 shows some samples of each class. The starch measurement was also conducted for all samples. The results showed that the starch concentration in all healthy samples was below the defined threshold with an average of 1.48 µg/mm2. All samples except healthy class samples contained some yellow or light green areas and usually with similar patterns. For example, HLB symptomatic and magnesium deficient classes included an analogous light green symptom. However, the starch measurement results confirmed that the starch concentration in all magnesium deficient leaves was below 2 µg/mm2 (with an average of 0.78 µg/mm2), while the starch level in all HLB symptomatic samples exceeded the defined threshold (with an average of 37.46 µg/mm2). It can be concluded that the light green symptom in the magnesium deficient class was not due to the starch concentration despite the fact that it looked similar to HLB symptom. The HLB infection within the zinc deficient samples was also extremely difficult to identify, since the zinc deficiency symptoms buried the HLB symptoms. Although the PCR results did not identify any HLB infection in six zinc deficient samples, the starch concentration exceeded the defined threshold in all six samples of this class with an average of 20.58 µg/mm2. However, it was still less than the starch concentration average in HLB symptomatic leaves within the zinc deficient class which was 29.71 µg/mm2.
Healthy Mg deficient1
HLB SymptomaticZn deficient2
HLB & Zn deficient3
Healthy Mg deficient HLB Symptomatic HLB & Zn deficientZn deficient
Zn deficient HLB & Zn deficient
All Samples
1. Mg deficient: Magnesium deficient 2. Zn deficient: Zinc deficient 3. HLB & Zn deficient: HLB symptomatic and zinc deficient
2013 ASABE Annual International Meeting Paper Page 7
Preprocessing
All images were calibrated so the averages of their background pixel values were similar after the calibration. Using the suggested gain adjustment approach, the AGC effect was partially cancelled because the images were calibrated to be analogous and they did not represent the original reflectance yet. However, since the textural features were used in this study, the relative variation in pixel values was good enough for the rest of the analysis, because they do not depend on the original reflectance.
Figure 2. Leaf samples images in five different classes. Three samples are shown for each class to illustrate the symptoms
similarity and variability for each situation. HLB infection is almost impossible to be identified within the zinc deficient samples.
Classification
The classification model was designed to identify the five classes in four different steps as described in the materials and methods. The best combination of classifier and features in each step was determined based on its performance compared to other combinations (table 1). Mahalanobis classifier was able to identify the healthy and magnesium deficient leaves from the rest of samples with an accuracy of 100%. The top 13 features (ranked with Wilcoxon method) which were used in this classifier included six gray features (mean, STD, third moment, smoothness, entropy, and uniformity), six GLCM features (uniformity, inertia, mean, homogeneity, cluster shade, and maximum probability), and one LSP feature (third moment). Healthy and magnesium deficient samples were also classified with an accuracy of 100% using two gray features (ranked with T-Test method) including entropy and maximum probability. On the right side of the model, a linear classifier was able to identify HLB infected leaves from all zinc deficient samples with an accuracy of 94.4%. The top six features (ranked with Bhattacharyya method) included two gray features (uniformity and maximum probability), three GLCM features (cluster shade, cluster prominence, and variance) and one LSP feature (STD). Finally, the HLB infection within the zinc deficient samples was detected with an accuracy of 83.3% using linear classifier and top four features (ranked with entropy method) including one LSP feature (uniformity), two LBP features (mean and STD) and one GLCM feature (uniformity).

2013 ASABE Annual International Meeting Paper Page 8
Table 1. The best combinations of features and classifier in each step of the classification model.
Step Class 1 Class 2 Classifier Number of top Features Rank Method Accuracy
1 - Healthy - Magnesium deficient
- HLB symptomatic - HLB symptomatic & Zinc deficient - Zinc deficient
Mahalanobis 13 Wilcoxon 100%
2 Healthy Magnesium deficient SVM 2 T-Test 100%
3 - Zinc deficient - HLB symptomatic & Zinc deficient
HLB symptomatic Linear 6 Bhattacharyya 94.4%
4 Zinc deficient HLB symptomatic & Zinc deficient
Linear 4 Entropy 83.3%
The best combinations of classifier and features which were determined in the previous phase were employed to run the whole classification model on the dataset. Table 2 illustrates the classification results of the proposed model. The classification rates were shown in the diagonal of the table, and the rest of the grids demonstrated misclassification errors. Healthy and HLB symptomatic samples were identified correctly with the maximum accuracy of 100%. Magnesium deficiency was identified with an accuracy of 95% and only one sample of this class was misclassified in the HLB symptomatic class. Zinc deficiency was also identified with an accuracy of 88.9%, however, 66.7% of those zinc deficient samples which were not HLB infected based on the PCR result, were misclassified into either HLB symptomatic or zinc deficient & HLB symptomatic classes. The high misclassification error in the non-HLB symptomatic zinc deficient class was probably because of the high level of starch concentration (20.58 µg/mm2 in average) in the samples, and since the proposed method was designed to highlight the starch in the leaf; their misclassification in the HLB symptomatic classes was expected. They can also be justified as HLB symptomatic samples which were not identified by PCR test because of the several inconsistencies caused by internal biotic conditions (Gottwald, 2010). The comparably high classification rate in magnesium deficient class also supported this idea, since the starch concentration levels in this class were considerably below the threshold (0.78 µg/mm2 in average) and the PCR results confirmed that as well.
Table 2. Number of samples classified into each of five classes and their corresponding classification accuracies or misclassification errors.
Actual class
Healthy Magnesium
deficient Zinc
deficient Zinc deficient &
HLB symptomatic HLB
symptomatic Sum
Pre
dict
ion
Healthy 20
(100%) 0 0 0 0 20
Magnesium deficient
0 19
(95%) 0 0 0 19
Zinc deficient 0 0 2
(33.3%) 5
(16.7%) 0 7
Zinc deficient & HLB symptomatic
0 0 3
(50%) 22
(73.3%) 0 25
HLB symptomatic 0 1
(5%) 1
(16.7%) 3
(10%) 20
(100%) 25
Sum 20 20 6 30 20 96
The main purpose of this study was to identify the HLB symptomatic samples, and so in another evaluation, the nutrient deficiency of samples was disregarded and the results in the table 2 was merged into only two main classes of healthy and HLB symptomatic. Table 3 shows the classification accuracies and misclassification errors as well as the number of samples identified in each class, while only HLB detection was considered. The results showed that only five samples of each class were misclassified in the other class. The overall accuracy of 89.6% was achieved when only HLB detection was considered which included the accuracies of 90% for HLB class and 89.1% for healthy class. Four out of five false positive samples were actually zinc deficient leaves which were identified as the non-HLB symptomatic by PCR test but contained high level of starch accumulation. Since the starch measurement results contradicted the PCR results for these samples, their infection status could be considered questionable. All false negative samples were also zinc deficient leaves which their HLB infection was not identified using this method. Training the classifier using these zinc deficient samples with questionable HLB statuses might be another factor which decreased the overall accuracy.

2013 ASABE Annual International Meeting Paper Page 9
Table 3. Number of samples classified into each of healthy or HLB symptomatic classes and their corresponding classification accuracies and misclassification errors (%), the nutrient deficiency was disregarded in this table.
Actual class
Pre
dict
ion
HLB Healthy sum
HLB 45
(90%) 5
(10.9%) 50
Healthy 5
(10%) 41
(89.1%) 46
sum 50 46 96
Diagnostic approaches such as PCR test, starch measurement, and crop scouting are not absolutely accurate, and there is no 100% precise detection method that has been reported yet. Therefore, the assessment of the suggested method was definitely affected by this imprecision.
Combination of polarizing filters and narrow band imaging was confirmed to be able to highlight the HLB infection symptom (starch accumulation) in the citrus leaf. In the previous study, the same method was applied to the Hamlin variety of citrus and the overall accuracy of 91% was achieved for four-class identification. We added one more class of magnesium deficiency in this study and applied the method on the Valencia variety and obtained the overall accuracy of 86.5%. The zinc deficient classes in both studies decreased the overall accuracy because either the zinc deficiency symptoms buried the HLB symptoms or their HLB statuses were questionable. If the zinc deficiency classes were disregarded in this study, the overall accuracy would increase to 98.3% for three-class (healthy, HLB symptomatic, and magnesium deficient) identification.
Conclusion The results of this study suggested that the polarization planer rotation caused by the starch accumulated in the HLB infected citrus leaf can be effectively used for HLB detection. They also confirmed the results of the previous study which was conducted with a different variety of citrus. The wavelength of 591 nm was determined as a potential waveband in the visible range for the disease detection. Textural descriptors such as gray, GLCM, LBP, and LSP features were determined powerful tools to detect the polarization planer rotation caused by starch accumulation. However, gray and GLCM features contributed more effectively to the classification steps compared to the LBP and LSP descriptors. The magnesium deficiency which caused similar symptoms to HLB infection was identified with an excellent accuracy. It was determined that the HLB detection within the zinc deficient samples was not as accurate as the other classes, mostly because their HLB infection statuses were not confirmed precisely. However, it can be inferred from the overall accuracy that this method can be successfully employed in a fast and easy HLB detection application.
References Belasque Jr., J., M. Gasparoto, and L. Marcassa. 2008. Detection of mechanical and disease stresses in citrus plants by
fluorescence spectroscopy. Applied Optics 47(11): 1922-1926.
Fowler, K. R. 2004. Automatic gain control for image-intensified camera. Instrumentation and Measurement, IEEE Transactions on 53(4): 1057-1064.
Gonzalez, P., J. Reyes-De-Corcuera, and E. Etxeberria. 2012. Characterization of leaf starch from HLB-affected and unaffected-girdled citrus trees. Physiological and Molecular Plant Pathology 79: 71-78.
Gottwald, T. R. 2010. Current Epidemiological Understanding of Citrus Huanglongbing. Annual Review of Phytopathology 48: 119-139.
Hocquellet, A., P. Toorawa, J. M. Bove, and M. Garnier. 1999. Detection and identification of the two Candidatus Liberobacter species associated with citrus huanglongbing by PCR amplification of ribosomal protein genes of the beta operon. In Mol Cell Probes, 373-379. England: 1999 Academic Press.
Huang, H.-L., and F.-L. Chang. 2007. ESVM: Evolutionary support vector machine for automatic feature selection and classification of microarray data. Biosystems 90(2): 516-528.
Kim, D. G., T. F. Burks, A. W. Schumann, M. Zekri, X. Zhao, and Q. Jianwei. 2009. Detection of Citrus Greening Using Microscopic Imaging. Agricultural Engineering International: the CIGR Ejournal.
Kumar, A., W. S. Lee, R. J. Ehsani, L. G. Albrigo, C. H. Yang, and R. L. Mangan. 2012. Citrus greening disease detection using aerial hyperspectral and multispectral imaging techniques. Journal of Applied Remote Sensing 6(1).
Li, H., W. S. Lee, R. Wang, R. Ehsani, and C. Yang. 2012a. Spectral angle mapper (SAM) based citrus greening disease detection using airborne hyperspectral imaging. In 11th Inernational Conference on Precision Agriculture. Indianapolis, Indiana.

2013 ASABE Annual International Meeting Paper Page 10
Li, W., J. S. Hartung, and L. Levy. 2006. Quantitative real-time PCR for detection and identification of Candidatus Liberibacter species associated with citrus huanglongbing. Journal of Microbiological Methods 66(1): 104-115.
Li, X., W. S. Lee, M. Li, R. Ehsani, A. R. Mishra, C. Yang, and R. L. Mangan. 2011. Comparison of different detection methods for citrus greening disease based on airborne multispectral and hyperspectral imagery. ASABE Paper No. 1110570. Louisville, Kentucky: ASABE.
Li, X. H., W. S. Lee, M. Z. Li, R. Ehsani, A. R. Mishra, C. H. Yang, and R. L. Mangan. 2012b. Spectral difference analysis and airborne imaging classification for citrus greening infected trees. Computers and Electronics in Agriculture 83: 32-46.
Lins, E. C., J. Belasque Jr, and L. G. Marcassa. 2009. Detection of citrus canker in citrus plants using laser induced fluorescence spectroscopy. Precision Agriculture 10(4): 319-330.
Marcassa, L., M. Gasparoto, J. Belasque Jr, E. Lins, F. D. Nunes, and V. Bagnato. 2006. Fluorescence spectroscopy applied to orange trees. Laser physics 16(5): 884-888.
McMahon, K. A. 2004. Practical botany - the Maltese cross. Tested Studies for Laboratory Teaching 25: 352-357.
Mishra, A., R. Ehsani, G. Albrigo, and W. S. Lee. 2007. Spectral Characteristics of Citrus Greening (Huanglongbing). ASABE Paper No. 073056. Minneapolis, Minnesota: ASABE.
Mishra, A., D. Karimi, R. Ehsani, and L. G. Albrigo. 2011. Evaluation of an active optical sensor for detection of Huanglongbing (HLB) disease. Biosystems Engineering 110: 302-309.
Mishra, A. R., D. Karimi, R. Ehsani, and W. S. Lee. 2012. Identification of citrus greening (HLB) using a VIS-NIR spectroscopy technique. Trans. ASABE 55(2): 711-720.
Ojala, T., M. Pietikäinen, and D. Harwood. 1996. A comparative study of texture measures with classification based on featured distributions. Pattern Recognition 29(1): 51-59.
Pereira, F. M. V., D. M. B. P. Milori, E. R. Pereira-Filho, A. L. Veníncio, M. d. S. T. Russo, M. C. d. B. Cardinali, P. K. Martins, and J. Freitas-Astúa. 2011. Laser-induced fluorescence imaging method to monitor citrus greening disease. Computers and Electronics in Agriculture 79: 90-93.
Pourreza, A., H. Pourreza, M.-H. Abbaspour-Fard, and H. Sadrnia. 2012. Identification of nine Iranian wheat seed varieties by textural analysis with image processing. Computers and Electronics in Agriculture 83: 102-108.
Pourreza, H. R., M. Masoudifar, and M. ManafZade. 2011. LSP: Local similarity pattern, a new approach for rotation invariant noisy texture analysis. In 18th IEEE International Conference on Image Processing (ICIP), 837-840. Brussels, Belgium: IEEE.
Putnam, A. H. 2012. Florida Agriculture by the Numbers. Florida Department of Agriculture and Consumer Services. Tallahassee, FL.
Sankaran, S., and R. Ehsani. 2011. Visible-near infrared spectroscopy based citrus greening detection: Evaluation of spectral feature extraction techniques. Crop Protection 30: 1508-1513.
Sankaran, S., R. Ehsani, and E. Etxeberria. 2010. Mid-infrared spectroscopy for detection of Huanglongbing (greening) in citrus leaves. Talanta 83: 574-581.
Sankaran, S., A. Mishra, J. M. Maja, and R. Ehsani. 2011. Visible-near infrared spectroscopy for detection of Huanglongbing in citrus orchards. Computers and Electronics in Agriculture 77(2): 127-134.
Related Documents