Brigham Young University BYU ScholarsArchive All eses and Dissertations 2016-03-01 Identification and Characterization of Serum Biomarkers Associated with Breast Cancer Progression Adhari Abdullah Alzaabi Brigham Young University Follow this and additional works at: hps://scholarsarchive.byu.edu/etd Part of the Physiology Commons is Dissertation is brought to you for free and open access by BYU ScholarsArchive. It has been accepted for inclusion in All eses and Dissertations by an authorized administrator of BYU ScholarsArchive. For more information, please contact [email protected], [email protected]. BYU ScholarsArchive Citation Alzaabi, Adhari Abdullah, "Identification and Characterization of Serum Biomarkers Associated with Breast Cancer Progression" (2016). All eses and Dissertations. 6452. hps://scholarsarchive.byu.edu/etd/6452

Welcome message from author
This document is posted to help you gain knowledge. Please leave a comment to let me know what you think about it! Share it to your friends and learn new things together.
Transcript

Brigham Young UniversityBYU ScholarsArchive
All Theses and Dissertations
2016-03-01
Identification and Characterization of SerumBiomarkers Associated with Breast CancerProgressionAdhari Abdullah AlzaabiBrigham Young University
Follow this and additional works at: https://scholarsarchive.byu.edu/etd
Part of the Physiology Commons
This Dissertation is brought to you for free and open access by BYU ScholarsArchive. It has been accepted for inclusion in All Theses and Dissertationsby an authorized administrator of BYU ScholarsArchive. For more information, please contact [email protected], [email protected].
BYU ScholarsArchive CitationAlzaabi, Adhari Abdullah, "Identification and Characterization of Serum Biomarkers Associated with Breast Cancer Progression"(2016). All Theses and Dissertations. 6452.https://scholarsarchive.byu.edu/etd/6452

Identification and Characterization of Serum Biomarkers
Associated with Breast Cancer Progression
Adhari Abdullah Al Zaabi
A dissertation submitted to the faculty ofBrigham Young University
in partial fulfillment of the requirements for the degree of
Doctor of Philosophy
Marc D. Hansen, ChairSteven W. Graves
Dixon J. WoodburyStephen R. PiccoloJonathen K. Alder
Department of Physiology and Develomental Biology
Brigham Young University
March 2016
Copyright © 2016 Adhari Abdullah Al Zaabi
All Rights Reserved
ABSTRACT
Identification and Characterization of Serum BiomarkersAssociated with Breast Cancer Progression
Adhari Abdullah Al ZaabiDepartment of Physiology and Develomental Biology, BYU
Doctor of Philosophy
Despite the recognized advances in the treatment of breast cancer, it still accountsfor 15% of all cancer-related deaths. 90% of breast cancer deaths are due to unpredictedmetastasis. There is neither successful treatment for metastatic patients nor a specific testto predict or detect secondary lesions. Patients with primary tumor will be either over-treated with cytotoxic side effects or under-treated and risk recurrence. This necessitatesthe need for personalized treatment, which is hard to offer for such heterogeneous disease.Obstacles in treating breast cancer metastasis are mainly due to the gaps exist in the un-derstanding of the molecular mechanism of metastasis. The linear model of metastasisis supported by several observations that reflect an early crosstalk between the primaryand secondary tumor, which in turn makes the secondary microenvironment fertile for thegrowth of disseminated cells. This communication occurs through circulation and utilizesmolecules which have not been identified to date. Identifying such molecules may help indetecting initial stages of tumor colonization and predict the target organ of metastasis.
Furthermore, these molecules may help to provide a personalized therapy that aimsto tailor treatment according to the biology of the individual tumor. Advances in pro-teomics allows for more reproducible and sensitive biomarker discovery. Proteomic biomark-ers are often more translatable to the clinic compared to biomarkers identified using otheromics approaches. Further, protein biomarkers can be found in biological fluids makingthem a non-invasive way to treat or investigate cancer patients. We present in this manuscriptour study of the use of a proteomic approach on blood serum samples of metastatic andnon-metastatic patients using LC-MS/MS quantitative analysis machine to identify moleculesthat could be associated with different stages of breast cancer metastasis. We focused onthe deferential expression of low molecular weight biomolecules known to reflect disease-specific signatures. We manually analyzed 2500 individual small biomolecules in each serumsample of total of 51 samples. Comparisons between different sample types (from stage Iand III Breast Cancer patients in this case) allows for the detection of unique short pep-tide biomarkers present in one sample type. We built a multi-biomarker model with moresensitivity and specificity to identify the stage of the tumor and applied them on blindedset of samples to validate prediction power. We hope that our study will provide insightsfor future work on the collection, analysis, and understanding of role of molecules in metastaticbreast cancer.
Keywords: breast cancer, metastasis, low-molecular weight, serum peptidome, biomarkers,multimarker model, cLC-MS/MS

ACKNOWLEDGMENTS
First and foremost, all praise and gratitude to our lord ALLAH for everything.
Words can not express how grateful I am to my loving, supportive, encouraging, and pa-
tient husband. Special thanks for him, my daughter and son for all of the sacrifices that
they have made on my behalf. I am very grateful to all of my extended family; especially
my mother, father, sisters and brothers for their prayers that sustained me thus far.
I would like to express my special appreciation and gratitude to my adviser Dr.
Marc Hansen for being supportive since day one of my arrival to the USA. Many thanks
for his priceless support not only in my scientific project but also emotionally by support-
ing me and my family through the hard and tough time during my PhD study. I would
like to thank Dr. Graves for being there whenever I have queries and need advice. Spe-
cial thanks to Dr. Piccolo for sharing his expertise and doing all the statistics of my re-
search. My project would not progress as it did without his contribution. I would also like
to thank Dr. Woodbury and Dr. Alder for their kind support. Last but not least, many
thanks to all of my colleagues, Dipti, Komal, Swati and Mathew for their patience and
willingness to help all the time.

TABLE OF CONTENTS
TITLE PAGE . . . . . . . . . . . . . . . . . . . . . . . . . . . . . . . . . . . . . . . . i
ABSTRACT . . . . . . . . . . . . . . . . . . . . . . . . . . . . . . . . . . . . . . . . ii
ACKNOWLEDGMENTS . . . . . . . . . . . . . . . . . . . . . . . . . . . . . . . . . iii
TABLE OF CONTENTS . . . . . . . . . . . . . . . . . . . . . . . . . . . . . . . . . iv
LIST OF TABLES . . . . . . . . . . . . . . . . . . . . . . . . . . . . . . . . . . . . . vii
LIST OF FIGURES . . . . . . . . . . . . . . . . . . . . . . . . . . . . . . . . . . . . viii
CHAPTER 1: Introduction and Background . . . . . . . . . . . . . . . . . . . . . . . 1
Cancer Metastasis . . . . . . . . . . . . . . . . . . . . . . . . . . . . . . . . . . . 1
Breast Cancer Metastasis . . . . . . . . . . . . . . . . . . . . . . . . . . . . . . . 1
Diagnosis of Breast Cancer Metastasis . . . . . . . . . . . . . . . . . . . . . 2
Treatment of Breast Cancer Metastasis . . . . . . . . . . . . . . . . . . . . . 3
Prognostic Indicators of Metastatic Breast Cancer . . . . . . . . . . . . . . . 4
History of Metastasis . . . . . . . . . . . . . . . . . . . . . . . . . . . . . . . . . . 6
Molecular Mechanism Underlying Metastasis . . . . . . . . . . . . . . . . . . . . . 7
Is Metastasis a Late or Early Event? . . . . . . . . . . . . . . . . . . . . . . 8
The Parallel (Stromal) Model of Metastasis . . . . . . . . . . . . . . . . . . . 8
Premetastatic Niches . . . . . . . . . . . . . . . . . . . . . . . . . . . . . . . 9
Microenvironmental Responses to TDSFs . . . . . . . . . . . . . . . . . . . . 10
Liquid Versus Tissue Biopsy . . . . . . . . . . . . . . . . . . . . . . . . . . . . . . 10
Definition of Biomarker . . . . . . . . . . . . . . . . . . . . . . . . . . . . . . . . 12
Cancer Biomarkers . . . . . . . . . . . . . . . . . . . . . . . . . . . . . . . . 12
Biomarker Assay Clinical Validation . . . . . . . . . . . . . . . . . . . . . . 13
Genomic Versus Proteomic Biomarkers . . . . . . . . . . . . . . . . . . . . . 13
Clinical Proteomics in Biomarker Discovery . . . . . . . . . . . . . . . . . . . . . 15
Techniques of Proteomics . . . . . . . . . . . . . . . . . . . . . . . . . . . . . 15
Quantitative Analysis by Mass Spectroscopy . . . . . . . . . . . . . . . . . . 16
iv

Bottom Up vs Top Down Proteomics . . . . . . . . . . . . . . . . . . . . . . 17
Mass Spectrometry-Based Biomarker Discovery Workflow . . . . . . . . . . . 17
Low Molecular Weight Peptides as Disease Signature . . . . . . . . . . . . . . . . 19
Challenges in Serum Proteomics . . . . . . . . . . . . . . . . . . . . . . . . . . . . 20
Acetonitrile Precipitation . . . . . . . . . . . . . . . . . . . . . . . . . . . . . 21
CHAPTER 2: Literature Review . . . . . . . . . . . . . . . . . . . . . . . . . . . . . 22
Biomarkers for BC Progression . . . . . . . . . . . . . . . . . . . . . . . . . . . . 22
Organ Specific Distant Metastasis . . . . . . . . . . . . . . . . . . . . . . . . . . . 27
Biomarker Associated with Bone Metastasis . . . . . . . . . . . . . . . . . . 27
Biomarker Associated with Lung Metastasis . . . . . . . . . . . . . . . . . . 27
Multiple Markers Reflect Complicated Pathway . . . . . . . . . . . . . . . . 28
Conclusion . . . . . . . . . . . . . . . . . . . . . . . . . . . . . . . . . . . . . . . . 29
CHAPTER 3: Methods . . . . . . . . . . . . . . . . . . . . . . . . . . . . . . . . . . 30
Study Population . . . . . . . . . . . . . . . . . . . . . . . . . . . . . . . . . . . . 30
Experimental Pipeline . . . . . . . . . . . . . . . . . . . . . . . . . . . . . . . . . 30
Initial Study . . . . . . . . . . . . . . . . . . . . . . . . . . . . . . . . . . . . . . . 33
Confirmatory Study . . . . . . . . . . . . . . . . . . . . . . . . . . . . . . . . . . 33
Samples Preparation . . . . . . . . . . . . . . . . . . . . . . . . . . . . . . . . . . 33
ACN Precipitation . . . . . . . . . . . . . . . . . . . . . . . . . . . . . . . . . . . 37
Liquid Chromatography Mass Spectroscopy . . . . . . . . . . . . . . . . . . . . . 37
MS Data Analysis and Time Normalization . . . . . . . . . . . . . . . . . . . . . 38
Data Normalization and Initial Marker Filtering . . . . . . . . . . . . . . . . . . . 39
Evaluation of Potential Batch Effect . . . . . . . . . . . . . . . . . . . . . . . . . 42
Confirmatory Study Workflow . . . . . . . . . . . . . . . . . . . . . . . . . . . . . 42
Multi-marker Model . . . . . . . . . . . . . . . . . . . . . . . . . . . . . . . . . . 43
Statistical Analysis . . . . . . . . . . . . . . . . . . . . . . . . . . . . . . . . . . . 43
Identification of Significant Markers . . . . . . . . . . . . . . . . . . . . . . . . . . 45
v

CHAPTER 4: Results . . . . . . . . . . . . . . . . . . . . . . . . . . . . . . . . . . . 48
Preliminary Study: Significant Biomarkers . . . . . . . . . . . . . . . . . . . . . . 48
Confirmatory Study . . . . . . . . . . . . . . . . . . . . . . . . . . . . . . . . . . 49
Multi-Marker Model Construction . . . . . . . . . . . . . . . . . . . . . . . . . . . 53
Multi-Marker Model Validation . . . . . . . . . . . . . . . . . . . . . . . . . . . . 53
Biomarker Identification . . . . . . . . . . . . . . . . . . . . . . . . . . . . . . . . 56
CHAPTER 5: Discussion . . . . . . . . . . . . . . . . . . . . . . . . . . . . . . . . . . 76
Downregulated Metastatic Biomolecules Identified in Virto . . . . . . . . . . . . . 77
Metastatic Suppressors . . . . . . . . . . . . . . . . . . . . . . . . . . . . . . . . . 78
Metastatic Suppressor Genes . . . . . . . . . . . . . . . . . . . . . . . . . . . 79
Peak Overlapping in Mass Spectroscopy . . . . . . . . . . . . . . . . . . . . . . . 79
Sphingomyelin Species are Potential Biomarkers for Cancer . . . . . . . . . . . . . 80
Upregulation of Ceramide in Cancer . . . . . . . . . . . . . . . . . . . . . . . 81
Upregulation of Sphingosine-1-phosphate (S1P) . . . . . . . . . . . . . . . . 83
Lipid Raft-associated SM . . . . . . . . . . . . . . . . . . . . . . . . . . . . . 84
Extracellular Membrane Vesicles from Tumor Cells (EMVTCs) . . . . . . . . 84
Oxydated Sphingomyelin in Cancer . . . . . . . . . . . . . . . . . . . . . . . . . . 85
Fibrinogen Physiological Function . . . . . . . . . . . . . . . . . . . . . . . . . . . 85
Fibrinogen and Fibrin in Metastasis . . . . . . . . . . . . . . . . . . . . . . . . . . 87
Limitations . . . . . . . . . . . . . . . . . . . . . . . . . . . . . . . . . . . . . . . 88
Future Research . . . . . . . . . . . . . . . . . . . . . . . . . . . . . . . . . . . . . 92
REFERENCES . . . . . . . . . . . . . . . . . . . . . . . . . . . . . . . . . . . . . . . 94
CURRICULUM VITAE . . . . . . . . . . . . . . . . . . . . . . . . . . . . . . . . . . 116
vi

LIST OF TABLES
1.1 Intrinsic Subtypes of Breast Cancer . . . . . . . . . . . . . . . . . . . . . . . 5
1.2 Summary of the Quantitative MS Approaches . . . . . . . . . . . . . . . . . 18
2.1 List of Most Recent Protoemics Studies on Breast Cancer Progression. . . . 23
3.1 Summery of Sources of Biomarkers for Discovery Platforms . . . . . . . . . . 31
3.2 Clinical staging of Breast Cancer . . . . . . . . . . . . . . . . . . . . . . . . 32
3.3 Demographics of the Initial Study Samples . . . . . . . . . . . . . . . . . . 34
3.4 Demographics of the Confirmatory Study samples . . . . . . . . . . . . . . . 35
3.5 Details of the 10 Time Markers . . . . . . . . . . . . . . . . . . . . . . . . . 41
4.1 Details of the Most Significant Markers in the Initial Study . . . . . . . . . . 50
4.2 List of Markers that Attained an AUC > 0.65 in the Training Data Set . . . 54
4.3 Performance of the Top 5 Multimarker Models in Training Data Set . . . . . 55
4.4 Performance of the Top 5 Multimarker Models in Testing Data Set . . . . . 57
vii

LIST OF FIGURES
3.1 Visual Assessment of the Mass Spectra . . . . . . . . . . . . . . . . . . . . . 40
3.2 ROC Curve Improvement by Multimarker Model . . . . . . . . . . . . . . . 44
3.3 Pipeline Used in the Laboratory Experiments. . . . . . . . . . . . . . . . . . 47
4.1 Performance of the Top 5 Multimarker Models in Testing Data Set . . . . . 58
4.2 Box Plot of Biomarker with m/z 497.26 . . . . . . . . . . . . . . . . . . . . . 59
4.3 Box Plot of Biomarker with m/z 458.25 . . . . . . . . . . . . . . . . . . . . . 60
4.4 Box Plot of Biomarker with m/z 585.28 . . . . . . . . . . . . . . . . . . . . . 61
4.5 Box Plot of Biomarker with m/z 722.37 . . . . . . . . . . . . . . . . . . . . . 62
4.6 Box Plot of Biomarker with m/z 923.45 . . . . . . . . . . . . . . . . . . . . . 63
4.7 Overlapping Peaks at m/z 497.27. . . . . . . . . . . . . . . . . . . . . . . . . 65
4.8 The Fragmentation Spectra of Biomarker with m/z 497.27. . . . . . . . . . . 67
4.9 Overlapping Peaks at m/z 425.25 . . . . . . . . . . . . . . . . . . . . . . . . 69
4.10 Overlapping Peaks at m/z 458.25 . . . . . . . . . . . . . . . . . . . . . . . . 70
4.11 Overlapping Peaks at m/z 923.45 . . . . . . . . . . . . . . . . . . . . . . . . 71
4.12 Overlapping Peaks at m/z 722.37 . . . . . . . . . . . . . . . . . . . . . . . . 72
4.13 Overlapping Peaks at m/z 761.38 . . . . . . . . . . . . . . . . . . . . . . . . 73
4.14 Ms/Ms of m/z 761.38 . . . . . . . . . . . . . . . . . . . . . . . . . . . . . . 74
4.15 Fragment Ion Calculator Result . . . . . . . . . . . . . . . . . . . . . . . . . 75
5.1 Chemical Structure of Sphingomyelin . . . . . . . . . . . . . . . . . . . . . . 82
5.2 Sphingomyeline Hydrolysis. . . . . . . . . . . . . . . . . . . . . . . . . . . . 86
5.3 Primary Structure of the Fibrinogen Chains up to the First Disulphide Bond. 89
5.4 Full Length Sequence of Fibrinogen Alpha Chain . . . . . . . . . . . . . . . 90
viii

CHAPTER 1: Introduction and Background
Cancer Metastasis
Cancer is considered the second leading cause of death in the united state after
heart diseases. It is expected to overtake the heart disease death rate imminently. Ap-
proximately, 90% of human cancer deaths are due to metastasis [1]. The survival rate of
almost all cancer types drops dramatically once the tumor disseminates and establish a
secondary growth at distant organs. Therefore, metastasis is considered the most determi-
nant prognostic factor in cancer [1, 2]. The mystery surrounding metastasis makes it hard
to predict, diagnose and treat. Despite all the advancement in early cancer detection and
treatment, metastasis remains a complicated puzzle with no foreseeable solution. The cur-
rent clinical practice to diagnose and treat metastasis are mainly to prolong patients life as
much as possible regardless of the quality of patients life [3].
Breast Cancer Metastasis
Maymuna is a 35-year old assistant professor of clinical anatomy at the College of
Medicine at Sultan Qaboos University in Oman. She has a happy, social and optimistic
personality. She is a mother of five kids; the youngest is 6 months old. Her life dramat-
ically changed after she has been diagnosed with Breast Cancer. Luckily she was at stage
II and the tumor was positive to estrogen receptor. She was treated according to the guide-
line, where she underwent surgery and received hormonal therapy with adjuvant chemother-
apy. She got back to her normal life after a long period of hospital admission, pain and
chemotherapy-induced side effects. The doctors assured her that she has a very low risk
of relapse or metastasis because of her age, multi-parity, negative family history of tumor
and her hormone sensitive tumor. Unfortunately, a year later, she started to have short-
ness of breath and high fever. She has been admitted in intensive care unit because of her
rapidly deteriorating health. Within 10 days of these symptoms she passed away due to
1

lung and pleural metastasis leaving a husband and 5 kids with tearful memories. This is
a true story of my friend, who, unfortunately, was not the first nor the last to suffer this
fate. According to the American Cancer Society, one woman in the U.S. will lose her life
to Breast Cancer every 13 minutes [4].
Breast Cancer (BC) is the second leading cause of all cancer deaths among women
worldwide. In the United States, about 40,000 women succumb to Breast Cancer annu-
ally. 90% of deaths from Breast Cancer occur in patients with advanced, metastatic dis-
ease. Five year survival rates of Breast Cancer patients drop from 99% for women treated
in early stage cancer to 25% for women treated in later stages [5, 6]. Treatment costs in-
crease as the disease progresses and furthermore the intent of treatment becomes more of
controlling the disease as long as possible rather than cure [7].
Diagnosis of Breast Cancer Metastasis
The mystery of Breast Cancer metastasis is that it is unpredictable, can remain
dormant for several decades, and is far less responsive to available cancer therapy [8]. Un-
fortunately, there is no accurate method to measure or monitor metastatic disease at very
early stages of the metastatic spread. Monitoring of metastatic disease is performed by
time consuming, costly, invasive and complicated radiological studies that suffer from low
sensitivities and specificities [5, 8]. Once suspected, diagnosis of Breast Cancer for local or
distant recurrence is accompanied by invasive, and painful biopsies of the affected organs
[9]. As a result, assessment of whether Breast Cancer patients are at risk for recurrence
due to early metastatic spread or whether treatments have been successful in eliminat-
ing residual metastatic disease remain inconclusive and inaccurate. The ability to detect
metastatic disease is a critical driver in whether continued gains in Breast Cancer treat-
ment can be achieved. Therefore, the identification of each individual tumor’s metastatic
potential is required to personalize treatment protocol for each patient [9, 10, 11, 12, 13,
14].
2

Treatment of Breast Cancer Metastasis
Transcriptomic studies divided primary Breast Cancer into five subtypes; Table
1.1 [15]. The most common and least invasive Breast Cancer subtype is the luminal type.
This tumor type expresses estrogen receptors (ER) and usually responds to tamoxefin (an
estrogen receptor inhibitor) and/or aromatase inhibitors with a good prognosis. The sec-
ond subtype over-expresses human epidermal receptor (HER-2) and behaves more aggres-
sively, but responds well to targeted therapy with trastuzumab, a monoclonal antibody
against HER-2. The third and a more aggressive subtype is the basal subtype, which does
not express any key hormonal receptors. Thus, Breast Cancers of this subtype are referred
to as triple negative tumors for their lack of estrogen, progesterone and HER-2 receptors
[16]. This tumor subtype does not respond to any targeted therapy and therefore needs
a broad spectrum chemotherapy, which has unpleasant short and long term side effects
that impair the patient’s quality of life. Despite reliance on broad spectrum chemother-
apy, triple negative breast cancer (TNBC) also has the worst prognosis among all Breast
Cancer subtypes [17, 18].
It is very straightforward to identify subtypes by determining the hormone status
of the patient’s tumor and thus predict the patient’s prognosis and response to treatment.
However, in the real world, scenarios are completely different. Breast Cancer patients with
identical tumor histopathology will respond differently to the same treatment. This can be
explained by the molecular heterogeneity between the tumors that challenges development
of personalized therapy for Breast Cancer [19, 20, 21].
Despite the use of tamoxefin and trastuzumab which are considered as targeted
treatment, American society of Clinical Oncology (ASCO) latest recommendation is to
use adjuvant chemotherapy as a precaution to eradicate escaped tumor cells, even if un-
detectable, and thus reduce risk of recurrence. This is because tumor aggressiveness can-
not be easily assessed and there is currently no test that can evaluate patient’s risk of lo-
cal or distant recurrence. It has been estimated that almost 80% of primary BC patients
3

are receiving adjuvant therapy although 50% of those patient will never get progressed to
an advance stage and they will benefit from local treatment alone [3]. Metastatic lesions,
when identified, are usually not treated by surgical resection, but rather by a more sys-
temic therapy. This is because the presence of a metastatic lesions often indicate a more
systemic disease that needs to be attacked [21].
Prognostic Indicators of Metastatic Breast Cancer
Every Breast Cancer patient will be evaluated comprehensively to determine her
metastatic risk and whether she requires for only local or more aggressive systemic ther-
apy. The prognostic factors that are currently used are mainly clinicopathological parame-
ters, such as patient’s age at diagnosis, lymph node status, grade of malignancy, and hor-
mone receptor status by focusing on Estrogen receptor (ER), Progesterone receptor (PgR),
and human epidermal growth factor receptor (HER-2). The grade of malignancy predicts
metastasis with circular logic as it is generally determined by the extent of invasion and
metastasis observed [22]. The only molecular prognostic biomarker used is hormonal re-
ceptor status. These three proteins biomarkers have been widely utilized in the clinic,
both for prognosis and for determining treatment options. Although these biomarker pro-
vide partial insight on the risk of metastasis, they are generally considered to be insuffi-
cient and might result in mistreatment. This is because about 15% of patient within the
lower risk group (i.e. ER and PgR +ve) will recur and die of metastasis and paradoxically
about 15% of patient in the high risk group (i.e. Triple negative tumor) will have a favor-
able outcome. No studies have demonstrated clinical utility of other molecular biomarkers
beyond the expression of these three receptors [18]. The complexity and massive molecu-
lar heterogeneity of primary and secondary Breast Cancers are major reasons for failure
to find other potential biomarkers [20, 23]. There is a hope that recent advancement in
“omics” studies would decipher the complexity of Breast Cancer and reveal genotypic and
phenotypic signatures underlying tumor heterogeneity. The promise of this approach is
4

Table 1.1: Intrinsic Subtypes of Breast Cancer.Surrogate definitions of intrinsic subtypes of Breast Cancer according to the 2015 St.Gallen Consensus Conference and the ESMO Clinical Practice Guidelines. Reprinted from[24].
Intrinsic Subtype Clinicopathologic Surrogate Definition
Luminal A ER-positiveHER2-negativeKi67 lowPgR higLow risk molecular signature (if available)
Luminal B ER-positiveHER2-negativeither Ki67 high or PgR lowlow high-risk molecular signature (if available)
HER2 over-expression HER2-positiveER and PgR absent
Basal-like Triple-negative (ductal) ER and PgR absent HER2-negative
5

that the molecular profile of each tumor can be determined and then categorized into a
larger array of subtypes, each with its own molecular biomarker, which when detected will
identify the most successful treatment regimen.
History of Metastasis
The term metastasis is originally from the Greek and means “change of place” [25].
Cancer metastasis, as a medical term, was first recorded by a famous French physician,
Recamier, in 1829 more than 150 years ago [26]. Metastasis refers to the establishment of
a secondary growth in a body organ other than the site of the primary tumor and that
is not directly connected to it [21]. Despite the clinical significance of metastasis, its ge-
netic and biomolecular basis is not yet well understood [1]. In fact, tremendous efforts
have been undertaken in order to understand the cell biology of metastasis. One of the
earliest theories is “seed and soil” theory proposed by the British physician, Paget, in
1889. He stated, “When a plant goes to seed, its seeds are carried in all directions; but
they can only live and grow if they fall on congenial soil”. His theory simply equalizes the
contribution of primary tumor cells (he referred to them as seeds) and the potential sec-
ondary sites microenvironment (he referred to them as soil) in the establishment of the
metastatic growth [27] . This theory was dormant till 1980 when Hart and Fidler found
that intravenously injected radio-labeled melanoma cells metastasized to orthotopically
grafted lungs and ovaries but not to the grafted kidneys in a synergetic mice [28]. Their
findings demonstrate that tumor cells only colonize specific organs that have “fertile soil”
for the corresponding mature “seeds”. Subsequent to their work, a plethora of theories and
models have been proposed to explain the process of metastasis [1, 3, 14, 29, 30, 31, 32,
33, 34, 35, 36]
6

Molecular Mechanism Underlying Metastasis
Interestingly, almost all proposed models agree on the complexity of metastasis
and that it is composed of sequential steps, where each step is considered crucial to es-
tablish metastatic growth. Arrest at any step will prevent completion of the process. In
the current view, the metastatic process starts at the primary tumor site, where a genetic
alteration leads to initiation of the steps of metasatasis. Sub-populations of tumor cells
gain an invasive genotype that enables them to escape the confines of the primary tumor
and start the journey toward secondary colonization. These cells will detach from neigh-
boring cells and invade the local stroma by secreting enzymes such as collagenase and
other proteases. Then they will penetrate the nearby lymphatic or blood vessels and in-
travasate. These disseminated cells must overcome the turbulence of circulation and evade
immune cells in order to survive and continue the journey to the ultimate site of metas-
tasis. Cells that survive circulation will stop at the capillary bed of the host organ and
then extravasate. Once they are in the secondary site, they start to proliferate and estab-
lish micro-metastasis [36, 37, 30, 38, 39, 31, 40]. Although primary tumors shed million of
cells per day for every gram of primary tumor into circulation, only a very small fraction
(0.01%) of shed cells successfully establish secondary growths. Metastasis is thus a highly
inefficient process [1, 36, 31].
Despite great advancements in molecular biology and the understanding of human
genome, metastasis remains a mysterious process [41, 31]. To tackle metastasis, we need
to define target systems that are critical to steps in this process. According to postulated
model, two critical components (targets) of metastasis are unique: 1) the primary tumor-
derived cells that have full metastatic potential (seeds) and 2) the microenvironment of
the host organ (soil). The seeds, either circulating tumor cells (CTC) or disseminated tu-
mor cells (DTC), have been thoroughly isolated and examined using bioinformatics ap-
proaches. However, there are no conclusive findings yet because of their unstable genetic
profile [42, 43, 44]. Recently, the host tissue microenvironment (the soil) has become a fo-
7

cus of attention and studies reveal that it is a more stable therapeutic target, though it is
much more poorly understood [40, 36, 45].
Is Metastasis a Late or Early Event?
Metastasis was originally believed to be a linear process. In this model, primary tu-
mor cells undergo rounds of mutations that create genetically heterogeneous clones of cells
where some clones acquire ability to metastasize. Since a series of mutations is required,
cells randomly accrue the correct series of mutations only with time and as the primary
tumor reaches a considerable size. Scientists adopted this linear model when they noticed
a correlation between the size of the primary tumor and frequency of metastasis. Further
supporting the linear model, resecting small primary tumors was found to limit chances of
metastasis [46]. More recently, a newly proposed parallel model has gained favor over the
linear model in explaining cellular events of cancer metastasis. It is based on studies that
concluded that metastatic lesions are too big to have been initiated late in cancer progres-
sion. The parallel model states that cells start to disseminate from the primary tumor and
settle in multiple secondary organs very early in the disease progression. Only at a later
stage subsequent genetic mutations occur. Each model has strong supportive evidence, but
recent findings favor the parallel model [47, 35, 33, 36].
The Parallel (Stromal) Model of Metastasis
In 2012, Sleeman and his colleges built a more comprehensive model of metastasis
[47, 33]. This “stromal model” combines aspects of both the parallel and the linear model.
The stromal model says that there is very early crosstalk between the primary tumor and
the host organ through secreted biomolecules, which they called pre-metastatic microen-
vironment conditioning factors. Researchers have alluded to the hypothetical presence of
factors derived from the primary tumor for many years. Initially such tumor-derived fac-
tors were envisioned when researchers believed that cancer spread through a poisonous or
8

an infected juice that drained from the primary tumor [48]. Since we learned body circula-
tion, the idea was abandoned with the conclusion that tumor-derived factors were instead
the common elements of body circulation (blood and lymph). Scientists turned their fo-
cus to the seed and soil as the main elements driving cancer metastasis and the idea of
circulating tumor factors promoting metastasis was forgotten. Sleeman pointed out that
such factors might enable communication between primary and secondary sites, thus ac-
counting for issues with the parallel and linear models and helping to uncover puzzle of
metastasis at the molecular level [47, 33]. Sleemans model allows for bidirectional commu-
nication using tumor-derived factors in circulation, suggesting that there are signals from
the secondary site that are delivered back to the primary tumor via circulation, and hence
stimulate or facilitate a re-seeding process [47, 33].
With communication occurring through circulation, blood is considered as a reser-
voir of many biological molecules that are potentially involved in cancer growth and pro-
gression [49, 50, 51]. Analyzing cancer patients blood components (serum/ plasma) may
allow identifications of molecules that can be a signature of a particular cancer type or
cancer stage. From the standpoint of prognosis, such factors could be used to screen for
patient metastasis in a clinical setting or even be targeted to arrest microenvironment fer-
tilization.
Premetastatic Niches
Tremendous research efforts focused on the seeds (metastatic cells in transit) and
their genotypic and phenotypic signatures. The secondary site microenvironment’s role
(the soil) in disease progression has been given less attention until recently [40, 52, 3, 53,
38, 33]. The prepared soil at a secondary site was referred to as a pre/pro metastatic niche
by Kaplan and colleagues in 2005 [54, 55]. Subsequent studies found that microenviron-
ments at metastatic sites undergo significant molecular changes in response to factors se-
creted by the primary tumor and that the condition of the premetastatic niche will either
9

support or suppress the growth of the DTCs [56, 57, 58, 59]. As a result, escaped DTCs
will either proliferate to establish a secondary growth, stay dormant as a micrometasta-
sis, or die without producing metastatic disease [52, 59, 47]. The main contributors to the
formation of premetastatic niches are tumor-derived secreted factors (TDSFs) and bone
marrow derived cells (BMDCs) [60]. TDSFs recruit BMDCs from bone marrow, which
subsequently start conditioning the secondary organ to build the fertile niche [60].
Microenvironmental Responses to TDSFs
The distant site microenvironment responds to TDSFs by increasing or decreas-
ing the expression of certain extracellular matrix proteins and recruits accessory cell types
that will help to condition the environment [30, 36, 55]. For example, matrix metallopro-
teinase 9 (MMP-9) is upregulated in premetastatic lungs in mice [61]. The increase in
MMP-9 expression is stimulated by activation of vascular endothelial growth factor re-
ceptor 1 (VEGFR1). Furthermore, BDMCs recruited into the lung niche were found to
be VEGFR1 positive. Surprisingly, challenging mice with tumor conditioned media (con-
taining TDSFs) prior to tail vein injection of metastatic tumor cells resulted in formation
of the premetastatic niche in the lung. These findings support the significance of TDSFs in
conditioning the distant microenvironment and initiation of subsequent metastasis. Since
these factors are circulating in the body, they can be identified in the blood or the lymph
[62, 61, 63, 36].
Liquid Versus Tissue Biopsy
In 2012, Gerlinger and his team published a very shocking finding after they se-
quenced DNA from kidney tumors [64]. They found that intra-tumor heterogeneity is
significantly more extensive than previously believed. Within one single tumor, cells ex-
pressed a variety of mutations and only one third of the studied mutations were shared
across the entire mass. If this much of heterogeneity accumulates in one single mass of pri-
10

mary tumor, then secondary site tumors are expected to have a completely different and
highly varied mutational genotype [64]. The use of a single treatment modality that tar-
gets primary and/or secondary cells with a particular genotype would therefore miss other
cells with accumulations of different mutational signatures [64, 21, 49, 65]. For example,
Gefitinib is an epidermal growth factor receptor (EGFR) inhibitor that is used in different
chemotherapy combinations [66]. Although patients initially respond very well to Gefi-
tinib, resistance eventually develops and the tumor evolves to be more aggressive. This
response results from new mutations occurring inside the tumor where cells continue to
accumulate mutational diversity that results in new phenotypes allowing them to survive
treatment [64].
Considering cancer as a static mutational environment is an obstacle to cancer
cure. Patients instead need to be frequently monitored for dynamic changes that emerge
as a response to treatment or other factors. Monitoring requires tissue samples, which is a
very invasive process, and since samples only represent a small portion of the tumor mass,
it can miss some mutations due to heterogeneity and its localization within the tumor.
Furthermore, the patient may have multiple site secondary growths that are inaccessible
for biopsy exacerbating this problem. Finding biomarkers in the blood that reflect the sta-
tus of the tumor as it progress is a promising step towards overcoming some of the obsta-
cles in cancer therapy. Considering the uniformity of the contents of the serum and being
a readily available specimen makes it appealing medium for clinical investigations.
In the clinic, cancer patients are exposed to different treatment regimens. Most
guidelines support the use of combination therapy such as surgery followed by adjuvant
chemo-radiotherapy [67, 68]. Chemotherapy by itself is usually composed of two or more
drug combinations. Cancer patients also often receive sequential cycles of chemotherapy
and need to be evaluated for response after almost every cycle. The current evaluation and
assessment of patients to determine the next course of treatment is either through biopsy
or radiological imaging, which lack sensitivity, are invasive, and cannot be done frequently.
11

Detecting circulating biomarkers that reflect response to treatment would be a watershed
development in non-invasive treatment monitoring [69, 70, 71, 72].
Definition of Biomarker
There are several definitions for the term biomarker. World Health Organization
(WHO) and in coordination with the United Nations and the International Labor Or-
ganization, has defined a biomarker as “any substance, structure, or process that can be
measured in the body or its products and influence or predict the incidence of outcome or
disease” [73]. Biomarkers can be one of or a combination of nucleic acids (DNA, RNA or
miRNA), proteins, peptides, sugars, lipids, or whole cells (such as CTCs or DTCs) [74].
Different types of human biospecimens can be used to detect biomarkers, such as blood or
its components (plasma or serum), body secretions (sputum, urine, saliva, stool), or tissue
from organs [75].
Cancer Biomarkers
Cancer biomarkers have been studied intensively and are divided into prognostic,
predictive, and pharmacodynamic biomarkers according to their clinical uses. Prognos-
tic biomarkers are the ones that predict the course of particular tumor. Their level can
distinguish patients with poor prognosis from those with good prognosis. The presence
or absence of prognostic biomarkers is useful to determine the treatment options for the
patient, but they do not predict response [76]. Oncotype DX, a series of Breast Cancer
gene-expression signatures, is a good example of a prognostic biomarker. It is used to pre-
dict the recurrence rate of the primary tumor after surgical removal. It also can determine
which patients will benefit from adjuvant chemotherapy after surgical resection and who
will not [77]. Another Breast Cancer prognostic biomarker is BRCA1, where high expres-
sion of BRCA1 is linked with poor prognosis in untreated patients [76].
12

Predictive biomarkers are the biomarkers that predict patient response to a partic-
ular therapy. For example, Breast Cancer patient are tested for tumor hormone receptor
status because that will determine the treatment to which the patient will respond [77].
Breast Cancer primary tumors that express estrogen receptor will respond to tamoxifen,
but not necessarily to trastuzumab that will only benefit patients who are HER2 receptor
positive [76, 67].
The third biomarker category is the the pharmacodynamic biomarkers that are
mainly used in clinical trials to adjust the dose of new drugs, to measure drug activity on
biological targets, and to calculate their maximum tolerated dose. They are subsequently
used to calculate the immediate effect of a treatment on the tumor [77].
Biomarker Assay Clinical Validation
Once an empirical biomarker is identified, a clinical assay for that marker needs to
be constructed. In order to implement any biomarker assay for clinical use, it should be
tested in term of its analytic validity, clinical utility and clinical validity. First, the ana-
lytic validity is usually evaluated after the biomarker assay is commercially manufactured.
It is evaluated by the assay accuracy, reliability, and reproducibility. The clinical valid-
ity of a biomarker assay refers to the ability of the marker to further divide the group of
patients into subtype according to its level of expression. Finally, a biomarker assay will
be considered for clinical utility only if its application will results in clinical benefits more
than harm when compared to clinical practice without its use. Benefits here means a bet-
ter clinical decision making than other practice or the same decision at a lower cost, less
invasive or lower risk. [18].
Genomic Versus Proteomic Biomarkers
Advancements in -omics (genomics, proteomics, lipidomics and metabolomics) al-
lowed for high throughput studies to mine for specific cancer biomarkers circulation [78,
13

79, 80]. Each of the -omics field has advantages and limitations for biomarker develop-
ment. Genomics and proteomics complement each other, though proteomics is consid-
ered theoretically superior. Although genomics provides the blueprint of life, proteins are
the ones that enact cellular functions and better reflect body physiology [81]. Although
nucleotide-based approaches can be used to assess mRNA levels in order to gauge the lev-
els of their products, the abundance of proteins in the body often does not correlate with
corresponding mRNA levels. Therefore, protein concentration can not be determined by
studying the level of mRNA alone because the translation rate varies among different mR-
NAs. Beyond this, there are different isoforms of proteins generated from the same gene; it
has been estimated that almost 100,000 proteins are encoded by only 20,235 genes in hu-
man [82]. Furthermore, translated proteins undergo post-translational modifications that
creates further complexities to the protein structure that do not exist at the mRNA level.
Post translational modifications, such as phosphorylation, acetylation and glycosylation,
result in different copies of the same protein having its own physiological function. There-
fore, in order to study a rapidly changing physiology, we need to examine proteins directly
in laboratory experiments [81, 83, 80].
The study of proteins is complicated by the complex network of interaction between
them. Scientists were surprised with the complexity of protein interactions found in yeast
Saccharomyces cerevisiae, despite it being a simple model organism. One study revealed
the presence of a single large network of 2,358 interactions between 1,548 proteins [84].
The human protein interaction network cannot be uncovered by genomic studies [81, 85].
Therefore, proteomic studies provide a wider understanding of molecular pathways and
interactions in physiological systems than genomics. Fortunately, proteomic studies are
increasingly prevalent due to rapid advancement in high throughput technology and in
response to the sore need for disease specific biomarkers [86].
14

Clinical Proteomics in Biomarker Discovery
The goal of clinical proteomics is to characterize protein pathways, interactions,
localization, and signaling events that are relevant in disease. It have been applied exten-
sively in BC research and provide a treasure of information that explain or partially define
cellular pathways. Recently BC metastasis has gained a focused attention and efforts were
directed towards completing the molecular picture of metastatic process. Here, we focus on
the proteomic analysis of Breast Cancer progression and discuss some of the key issues.
Techniques of Proteomics
Proteomic studies are divided into many categories such as expression, functional,
modification, localization and protein-protein interaction depending on the aim of the
study. They complement each other to provide the complete picture of a particular pro-
tein or a cellular pathway. Here, we focus on the expression proteomics that aims to quan-
tify the protein content in the biospecimens that represent BC metastasis. Expression pro-
teomics studies encompasses different techniques with distinct advantages and limitations.
The choice of the proteomic techniques depends on the biological system under study and
the aim of the study (quantitative or qualitative). In fact, some proteomic techniques can
only be applied in specific biological samples but not in others. For example SILAC needs
a prior culture of the studied protein with isotopically labeled amino acids which makes it
impractical in human bio-fluid [87].
In general, proteomic analyses are divided into Mass Spectroscopy (MS)-based and
non-MS based techniques [88]. The non-MS proteomic approaches—also called targeted
proteomics— use specific antibodies or other ligands against a particular, and known, pro-
tein, requiring prior knowledge of the protein under study. This can be done by enzyme-
linked immuno sorbent assay (ELISA), immunohistochemistry (IHC), Western blotting,
tissue microarray (TMA) and Protein microarray (PMA) [89]. On the other hand, in MS
based proteomics there is no need for foreknowledge of proteins under study. It is more
15

informative as it might reveal previously unstudied proteins and even show unexpected
interactions despite being technically challenging [90].
Previously, proteomic studies were only capable of analyzing few samples and there-
fore could not provide an accurate protein quantification. The recent advancement in mass
spectroscopy (MS) based proteomics greatly improved protein quantitation even in com-
plex samples such as human specimens. The innovations in sample preparation, sepa-
ration, and computational proteomics together with the implementation of hybrid mass
spectrometers that combine high resolution, high mass accuracy and wide dynamic range
all enable more confident protein identification and quantification at a large scale. As a re-
sult, the MS-based proteome analysis has grown exponentially in the last decade yielding
plethora of identified proteins (biomarkers) that represent different diseases [86].
Quantitative Analysis by Mass Spectroscopy
Mass spectroscopy based proteomics are capable of providing absolute and rela-
tive quantitation of proteins in samples under study. The quantitative MS approaches are
either labeled or label free (Table 1.2). The label free quantitation methods includes the
spectral counting approach and the Peptide peak intensity approach. In spectral counting,
proteins are quanrified according to the number and abundance of MS/MS spectra that is
produced by the fragmentation. This is based on the concept that highly abundant protein
will provide more spectra with higher intensities than less abundant proteins. Compar-
ing the number and intensity of the MS/MS spectra of a particular protein between sam-
ples will provide relative quantitation. Peptide peak intensity measurements could provide
quantitation of the protein under study through the extraction of the chromatographic
peak of the corresponding peptide in the ion chromatograms from a capilary Liquid Chro-
matography Mass Spectrum (cLC-MS). Comparing the peak areas of the same ion/peptide
between different runs and samples will provide a relative quantitation. The labeled quan-
titation methods include the use of multiple labeling methods such as metabolic labeling
16

(e.g SILAC), isotopic labeling (e.g.ICAT) and isobaric labeling(e.g. iTRAQ). They provide
relative or absolute quantitation and vary in their proteomic coverage as described in table
1.2.
Bottom Up vs Top Down Proteomics
There are two types of MS-based proteomics, referred to as bottom up and top
down approaches. In the bottom up, or shotgun approach, a protein is identified through
detection of peptides that result from the proteolytic breakdown of that particular protein
[91, 92, 93]. In a typical bottom up proteomic experiment, specimens containing intact
proteins are treated with a proteolytic enzyme to break them into their corresponding pep-
tides and then loaded into cLC-MS/MS. The proteins are later identified by comparing the
fragmentation pattern of the daughter peptides with a protein database. This approach
does not identify post-translational modifications and is complicated when a single pep-
tide is shared by more than one parent protein [82, 94]. These limitations are overcome
by top down proteomics, where intact proteins are analyzed. Therefore, top-down has the
advantage of being able to detect post translational modification and distinguish between
protein isoforms. A further advantage over the bottom up approach is its ability to char-
acterize small low molecular weight (LMW) proteins [95, 96, 94, 97]. The major challenge
in the top down approach is the wide dynamic range of protein abundance in human sam-
ples. This has been overcome by the implementation of multiple separation steps prior to
introducing the samples into the instrument [95, 96], as well as by enrichment of LMW
during precipitation of high abundance proteins [97, 96, 94, 98].
Mass Spectrometry-Based Biomarker Discovery Workflow
With advances in proteomics techniques, it is becoming more feasible to study hun-
dreds or even thousands of proteins in a single experiment [85, 99]. High throughput pro-
teomic studies usually involve mass spectrometry (MS) or microarray technology [86]. The
17

Table 1.2: Summery of the Quantitative MS Approaches.Reprinted with permission from [100].
Quantitationmethod
Dynamic rangeQuantitation
Nature
Numberof
samples
ProteomicCoverage
LabeledSILAC 12 Relative 2 to 3 MediumICAT 12 Relative 2 Poor
ITRAQ 2 Relative/Absolute 2 to 8 Medium
Label-free
2D gels1 to 4 (staindependent)
Relative many Medium
Ion intensities 3 Relative many GoodSpectrum count 3 Relative many Good
18

general workflow of a global mass spectrometry-based biomarker discovery experiment oc-
curs in 4 steps [86]. The first step is choosing the most appropriate disease-related sam-
ples, which are then processed to deplete the high abundance large MW proteins. Next,
processed samples undergo a pre-fractionation step, using either gel electrophoresis or
chromatography. At this stage, samples are then loaded into the MS instrument and the
levels of individual proteins are quantitatively assessed for comparison between sample
groups. The last step is validation of identified proteins or protein panels using indepen-
dent analytical approaches.
Low Molecular Weight Peptides as Disease Signature
Recently, proteomic studies have been directed toward the low abundance and low
molecular weight (LMW) proteins that are less than 30KDa [98]. It has been found that
disease specific molecular signatures, including central regulators of biological pathways,
are usually of low MW and present at low concentration [101]. Furthermore, It has been
estimated that almost 50% of the human peptidome is composed of peptides that are less
than 26.5 kDa [102]. Low MW proteins are categorized into cytokines, peptide hormones,
small signaling proteins, or fragments of a larger cellular proteins. Previously, these low
MW proteins were considered as cellular trash, though they are now known to have phys-
iological significance [103, 81, 104]. Low MW proteins were hard to detect in gel-based
proteomic studies because they stain very poorly and they migrate rapidly during elec-
trophoresis [102].
The potential diagnostic significance of these molecules was revealed when the serum
proteome of ovarian cancer was examined using MALDI-MS and significant biomarkers
were detected in the Low MW range [105, 106]. Discovering the low MW range of human
proteome is ongoing, but is incomplete and no examples of low MW biomarkers have yet
reached diagnostic utility in clinical settings.
19

Challenges in Serum Proteomics
Proteomics can be applied to any biological samples: cell lines, clinical tissue sam-
ples and biofluids such as serum, tears, urine and organ aspirates. The complexity of the
human proteome depends on the samples used for the study. Body fluids, such as blood,
urine and saliva, are the most complicated and challenging samples for proteomic study,
but are also the most clinically relevant [86]. Human serum/plasma is considered the most
accessible body sample for clinical biomarker investigation; and therefore it is appealing
clinically as a minimally invasive source for diagnosis and screening. It contains a vast
number of molecules that are shed out from almost every tissue of the body, all of which
vary in their molecular weight. This makes the serum a vast and diverse reservoir of sig-
nals that reflect body physiology [107, 108].
Despite being readily accessible, human serum proteomics is technically challeng-
ing. The biggest challenge is the wide dynamic range of proteins in human serum, which
reaches a magnitude as high as 12 units. This is because more than 90% of serum pro-
teins are of large molecular weight and these mask the visualization of more divers low
MW proteins that are believed to be disease specific. These low MW serum proteins are
called the “hidden proteome” for this reason. The hidden proteome is mainly composed
of proteins of less than 50 kDa, which are either small circulating proteins or fragments of
cellular proteins that have diffused into circulation. Low MW protein fragments in serum
have their own physiologic function and the diagnostic impact can be very different than
the parent protein. Data contradict the original belief that circulating protein fragments
represent the level and function of their parent [104]. For example, low MW hyaluronan
(LMW-HA) levels in serum, but not the parent HA levels, were found to correlate with
Breast Cancer metastasis. Although total HA levels are elevated in primary Breast Can-
cer, it has no role in Breast Cancer progression. [109].
In order to uncover these low MW proteins in serum, we need either to carefully
separate them from the large MW or to deplete the large MW from the sample before
20

conducting proteomic study. Large MW protein in human samples suppress the low MW
protein signals in the MS and makes them difficult to quantitate [110, 111, 112, 113, 114].
Several separation methods, such as gel electrophoresis [115, 116, 117], immunodepletion
[118, 117], and chromatography [119, 117] have been implemented and all give a better
sensitivity in mass spectrometry analysis. Furthermore, the use of enrichment strategies
have been shown to be effective in depleting the large MW serum proteins. Enrichment
strategies could be through organic solvents precipitation, ultrafiltration, solid phase ex-
traction and others [120, 121, 122, 123, 124, 125, 126, 120, 110, 127, 111, 128]. Acetonitrile
precipitation is considered superior to other enrichment approaches [122, 128, 127, 110].
Acetonitrile Precipitation
Acetonitrile is an organic solvent that has been used to precipitate high abundance,
large MW proteins. It has been found that it also dissociate the low MW protein from
their carrier proteins making them available for proteomic study [110]. When cLC-MS
chromatogram of acetonitrile treated serum sample compared with untreated serum sam-
ple cLC-MS chromatogram, the total-ion chromatogram (TIC) of the treated sample had
more numbers of molecular species than the untreated samples [128]. This reflect the power
of acetonitrile precipitation in enriching the low MW proteins pool for further proteomic
study.
21

CHAPTER 2: Literature Review
Biomarkers for BC Progression
The application of the high throughput screening techniques in BC cancer research
provided several putative biomarkers that needs further evaluation for their analytical va-
lidity, clinical validity and clinical utility. Table 2.1 summarizes the most recent potential
proteomic biomarkers that have been identified and found to play a role at one or more
stages of BC progression and invasiveness. The list is providing examples of the most re-
cent identified proteins and it is not an exhaustive list.
Metaphorically speaking, “the water is everywhere, but little is yet ready to drink”,
describes the current state of the amount of identified proteins that are associated with
BC progression but are not yet ready for clinical utility. Despite the long list of empiri-
cal proteins that claims success, FDA has not yet approved the use of any MS-based pro-
tein biomarker in the clinic [86, 18]. It is worth mentioning here that there are some BC
metastasis empirical biomarkers are in their way toward the clinic. For example, there
are accumulating evidences toward the use of Ki67 as a prognostic indicator for the pro-
gression of BC but not as a predictor of treatment benefit as indicated in Table 1.1 [129].
Additionally, urokinase-plasminogen activator (uPA) and plasminogen activator inhibitor
(PAI-1) have been recently recommended by the ASCO for the determination of progno-
sis in lymph node negative Breast Cancer [130]. The proposed biomarkers are promising
and even if they are not sensitive to predict outcome, they might add an important piece
of information towards the understanding of BC metastasis.
22

23
Table 2.1: List of Most Recent Protoemics Studies on Breast Cancer Progression.
Experimental methodology Proteomic technique Findings Reference
Breast cancer tissues LC-MS/MS Significant up-regulation of PDI A3 was detected only inthe metastasized breast cancer
[135]
Breast cancer cell lines Nano-UPLC-MS-MS EDIL3 on exosomes promotes breast cancer invasion viaintegrin-FAK signaling
[136]
Breast cancer cell lines iTRAQ-nano-HPLC-MS/MS, IHC in tissue
RAB1B is significantly down-regulated in highlymetastatic breast cancer cells
[137]
Breast cancer cell lines 2DE-MALDI-TOF/TOF,Wastern blot
Downregulation of RhoGDI in MCF7 and MDA-MB-231cells increased the invasion and migration of BC cells
[138]
Breast cancer cell lines, animalstudy
2DE-MALDI-TOF/TOFWastern blot
STC1 is positively associated with the development, pro-gression and metastasis of BC especifically to the lung
[139]
Breast cancer cell lines, animalstudy
nano LC-MS/MS High expression of LTBP3 and SNED1 correlates withpoor outcome for ER(-)/PR(-)breast cancer patients
[140]
Breast cancer cell lines andanimal study
SILAC-LC-MS/MS, IHC LRRC59 positively correlate with BC aggressiveness andmetastasis, CD59 and CSPG4 inversely correlate withmetastasis
[141]
Breast cancer cell lines andanimal study
LC-MS/MS , IHC hnRNPM is associated with aggressive BC [142]
Breast cancer cell lines andtissues
SILAC-LC-MS-MS, IHC Reduction of lung metastasis when CYB5R3 expressionwas significantly reduced
[143]

24
Experimental methodology Proteomic technique Findings Reference
Breast cancer cell lines andtissues
HPLC- LTQ-Orbitrap High levels of IDH2 and CRABP2 and low levels ofSEC14L2 are prognostic markers for overall breast can-cer survival
[144]
Breast cancer cell lines andtissue
Discovery: 2D-DIGE-LC/MS/MS, validation:IHC
composite biomarker comprising CAPG and GIPC1 wasassociated with development of bone metastasis and re-duced survival
[132]
Breast cancer serum samples Recombinant antibodymicroarray platform
21-candidate protein biomarker signature associated withmetastasis, included cytokines (IL-6, IL-18) involved withcell migration, infiltration and angiogenesis
[145]
Breast cancer serum samples Chemiluminescent assay,IHC
High serum HER-2 extracellular domain (ECD) levelsassociated with a worse disease-free survival and overallsurvival in primary operable BC patients
[146]
Breast cancer serum samples SELDI-TOF-MS,Wastern blot
High expression levels of SAA in sera of almost alladvanced-stage cancer patients
[147]
Breast cancer serum samples Luminex liquid proteinchip
Decreased expression of CP-1 and IP- 10 significantlycorrelated with patients who had more positive lymphnodes
[148]
Breast cancer serum samples ELISA Serum amyloid A (SAA) protein indicated presence oflymph node metastases and distant metastases
[149]
Breast cancer serum samples ELISA Serum cadherin-5 discriminated patients with recurrentBC from those with no sign of recurrence (90% speci-ficity)
[150]

25
Experimental methodology Proteomic technique Findings Reference
Breast cancer serum samplesand cell lines
HPLC followed byUV/refractive index dualdetection
Elevated serum levels of LMW-HA, but not total HA,correlate with BC metastasis
[109]
Breast cancer serum samplesand cell lines
ELISA Higher serum CIP2A levels positively associated with theaggressive BC in vivo and ivitro
[151]
Breast cancer tissues iTRAQ-2DLC-MS/MS,IHC
CPB1, PDLIM2, RNF25, RELA, STMN1, TMSB10,TRAF3IP2, and YWHAH as proteins correlating withlymph node positivity of low grade breast cancer
[152]
Breast cancer tissues HPLC- ESI-LTQ-Orbitrap screen, IHCvalidation
ATPIF1, CK17, thrombomodulin and tubulin -chain arepart pathways involved in cell adhesion, migration path-ways and immune response
[153]
Breast cancer tissues 2DE-MALDI-TOF/TOF/MS/MS
1433G, 1433T, K1C19, K2C8, PSME2, SNAA, TPM4,TRFE and VIME were up-regulated in PBT whileALDH2, GDIR2 and K1C19 were up-regulated in LNM
[154]
Breast cancer tissues iTRAQ sets for LC-MS/MS , SRM, IHC
High expression of DCN was associated with higher riskfor lymph node metastasis, high expression of HSP90B1was correlated with higher risk of developing distantmetastasis
[155]
Breast cancer tissues 2DGE- MALDI-TOF,wastern blot
Deregulation of multiple S100 protein members is associ-ated with breast cancer progression
[155]
Breast cancer tissues 2D-PAGE-LC-MS/MS Higher expression of Stat1 and the HLA II gamma sub-unit CD74in LN +ve tumor
[135]

26
Experimental methodology Proteomic technique Findings Reference
Breast cancer tissues nLC-MS/MS 10 proteins were downreg- ulated (CMPK1, AIFM1,FTH1, EML4, GANAB, CTNNA1, AP1G1, STX12,AP1M1, and CAPZB), whereas one protein was upreg-ulated (MTHFD1) in TNBC
[156]
Breast cancer tissues IHC Significant correlation between the cytoplasmic expressionof VCP and adverse prognosis in breast carcinoma
[157]
Breast cancer tissues IHC C6orf106 promote tumor progression in the invasivebreast cancer
[158]
Breast cancer tissues IHC Data support a role of SIRT1 protein as tumor suppressorin luminal A breast cancer
[159]
Breast cancer tissues IHC Overexpression of G6PD protein predicted a high risk ofrecurrent metastasis and poor PFS during follow-up
[160]
Breast cancer tissues Western blotting, IHC Down-regulated CDK10 expression frequently occurs inBC and correlates with disease progression and poor sur-vival
[161]
Breast cancer tissues TMA CCR7 and CXCR4 were expressed more often in BC bonemetastases than in visceral metastases
[131]

Organ Specific Distant Metastasis
Biomarker Associated with Bone Metastasis
We notice from the above list in table 2.1 that in general, couple of studies were fo-
cusing in organ specific BC metastasis while others were mining for protein that associate
with BC progression and invasiveness in general. Liu found that the expression of CCR7
and CXCR4 combinedly is more predictive of bone metastasis than their sole expression
[131]. Another composite biomarker comprising of CAPG and GIPC1 has been implicated
to the development of BC induced bone metastasis as well [132]. Bone is a common des-
tination for BC tumor. It has been estimated that up to 75% of patients with metastatic
BC will have a bone metastasis [133]. Bone metastasis is considered a sign of poor progno-
sis because of the severe skeletal complication that impact patients life [134]. Developing a
signature biomarker to predict the risk of developing bone metastasis will help to improve
BC patient management and prognosis.
Biomarker Associated with Lung Metastasis
The second common destination for BC metastasis is the lung. Approximately
60% of Breast Cancer patients have secondary growth in the lung. In fact, about 21% of
BC patient have lung metastasis as the sole secondary growth. Several biomarkers have
been proposed to associate with lung metastasis in BC. For example, CYB5R3, LDHA,
NPC1, NRH2 protein expression has been linked to lung metastasis. Moreover, inhibition
of CYB5R3 was highly associated with reduction in lung metastasis [143]. In addition,
Olkhanud suggested that CCR4 is a metastasis-associated receptor that when targeted,
it decreases lung metastasis [162]. Furthermore, STC1 as a single biomarker found to pos-
itively associate with BC metastasis to the lung. [131]. The role of MMP9 on metastasis
was examined using an animal study. It showed that suppression of MMP9 markedly re-
duced lung metastasis [61].
27

There are other proteins that are associated with BC aggressiveness and metasta-
sis in general with no organ preference. For example serum amyloid A (SAA) protein was
highly expressed in sera of BC metastatic patients with a metastasis in multiple distant
sites [149]. Interestingly, Carlsson conducted a longitudinal study where he screened BC
sera at different intervals of the disease for a period of 3 years to identify proteins that can
predict recurrence. He built a serum protein signature, which contain couple of cytokines
and are involved in cell migration, infiltration and angiogenesis [145]. It is very important
to stress that previously mentioned protein biomarkers are not an exclusive list but rather
reflects the most recent published studies in literature.
Multiple Markers Reflect Complicated Pathway
The striking observation here is that vast number of proteins have been identified
to be associated with BC progression. This might reflect the complex pathway and pro-
tein interaction involved in this process. Therefore, all the identified markers could add
a new understanding to the mechanism of metastasis and if they are not good biomark-
ers per se, they could direct further research to reach a better biomarker model. In ad-
dition, the study findings are highly dependent on the used specimen and the proteomic
techniques utilized. An ample number of cell types, BC tissues, and biological fluids have
been studied in an effort to identify biomarkers that can cross their way to the clinic. The
specimen used in proteomic studies has a critical role in determining the clinical relevance
of the detected protein. As a matter of fact, the proteomic profile complexity is increasing
as we move from cell lines study, animal studies, tissue biopsy to blood and biofluid. Al-
though human blood and biofluid are the most challenging and their proteomic profile is
very complicated, they are providing the most clinically relevant findings [86].
28

Conclusion
The use of biomarkers could only replace other practiced diagnostic and prognostic
guidelines if they only provide better insight towards the disease progression or the similar
insight at a lower cost and less invasiveness. BC metastasis biomarker studies will be eas-
ier if a comprehensive understanding of the metastatic process exists. Since Breast Cancer
is very dynamic and heterogeneous, there are always emerging new molecular mechanism
and pathway. Therefore any identified potential marker will need continuous re-evaluation
to get the best practice [163].
29

CHAPTER 3: Methods
Study Population
Proteomic studies can be applied in any biological specimen. The most commonly
used samples for cancer research are cell lines, tissue biopsies, animal model and biofluids.
The study of any of these samples can uncover a molecular aspect related to cancer ini-
tiation, cancer progression or response to therapy which can be considered as biomarkers
for clinical use. Technically, biomarkers that are identified and validated in a less invasive
samples are more enviable [164]. Serum/plasma are the least invasive and readily available
samples and therefore considered as optimum biospecimens for biomarker discovery (see
Table 3.1). In our project, we used commercial serum samples that represent metastatic
and non-metastatic stages of BC for both the initial and confirmatory studies. Table 3.2
is showing the clinical stages of Breast Cancer and at which stages it is considered metas-
tasized. For our study samples, we considered all patients classified in stages 0, I, IIa with
no local (lymph node) or distant organ metastasis as Non-metastatic, and all patients in
other stages as metastatic.
Experimental Pipeline
This study was conducted through 3 phases, the discovery phase, training phase
and testing phase. The biomarkes that have been discovered in the serum samples in the
initial discovery study were tested for persistent significance in independent serum samples
set in the training set. A confirmatory testing set were then conducted using a new serum
sample to further confirm and validate the findings. We aimed to get more confidence that
the peaks identified are truly associated with the experimental condition, rather than a
statistical expectation from having a lot of peaks to examine.
30

Table 3.1: Summery of Sources of Biomarkers for Discovery Platforms. Reprinted withpermission from [86].
Sample Advantage Disadvantage
In vitro cell culture Easy to obtain; no ethics;abundant sample quan-tity; good for characteriz-ing cell-specific responses
Lack of heterogeneity; maynot represent clinically rel-evant results
Tissue biopsy/core sample Accessibility to samplesstored, long term; directcomparison to standarddiagnosis; tissue-level rep-resentative profiling
Potential for sample degra-dation; require large val-idation datasets; invasivesample collection
Urine/blood Easy to obtain; expressrepresentative protein andgene expression of a largenumber of cell types
Low marker concentration;high sample complexity;technically difficult to de-tect
31

Table 3.2: Clinical staging of Breast Cancer.Reprinted with permission from American Joint Committee on Cancer 7th edition, BCstaging.N1: Metastasis to movable ipsilateral level I, II axillary lymph nodes.N2: Metastases in ipsilateral level I, II axillary lymph nodes that are fixed or matted.N3: Metastases in ipsilateral infraclavicular (level III axillary) lymph nodes.
Stage Primary tumor Lymph node Distant metastasis Survival rate
0 ≤2 cm None None 100%
I ≤2 cm None None 98%
IIa ≤2 cm N1 None 88%
IIb >2 cm,≤5 cm N1 None 88%
IIa >2 cm,≤5 cm N2 None 52%
IIb >5 cm N2 None 52%
IIc Any size N3 None 52%
IV Any size Any involvement Detectable 16%
32

Initial Study
For the initial study, six samples of each stage (stage I and stage III) were pur-
chased from Proteogenex. We used the following criteria to match these patients as closely
as possible between the two groups: race, age and absence of comorbid diseases and tumor
subtype. The provided serum samples lacked vital information such as time of sample col-
lection (whether pre or post cancer therapy). Table 3.3 shows demographic, clinical history
and diagnosis of patients in the the initial study.
Confirmatory Study
For the confirmatory study, we purchased serum samples from Conversent Bio. It
included 19 samples in stage I and 20 samples in stage III. A variety of sample types were
included, as we aimed to detect biomarkers of metastasis in a way that is not dependent
on factors such as treatment regimens, race or age. Table 3.4 demonstrate the demograph-
ics, diagnosis and treatment of the patients used in the confirmatory study. All samples
in both studies were coded without personal information. According to our conversations
with both companies, samples in both studies were exposed to the same environment from
collection to storage with no prior thaw and freeze cycle. Specimens were maintained at
-80 C during pre-processing and post-processing.
Samples Preparation
Despite the high clinical prevalence of serum/plasma proteomics and its easy acces-
sibility, it is technically challenging. The challenges in serum proteome is due to the wide
dynamic range (upto 12 orders of magnitude) of its protein content [165] which can not
be covered by the current available proteomic approaches that are limited to linearity of
just over 3 orders of magnitude [166]. It has been very confronting to uncover this hidden
serum proteome because of the masking effect of the high abundance low MW which con-
stitute more than 90% of serum proteome [104]. Identification of these cancer-causing pro-
33

Table 3.3: Demographics of the Initial Study Samples.IDC: Infiltrating ductal carcinoma, ILC: Infiltrating lobular carcinoma.
StageHistologicalDiagnosis
Age EthnicityFamilyHistory
Personal History
I IDC 63 Caucasian No No
I IDC 63 Caucasian NoIschemia;
hypertension
I IDC 67 caucasian No Ischemia
I IDC 46 Caucasian No No
I ILC 46 Caucasian No Chronic cholecystitis
IIA IDC 51 Caucasian No No
IIIA IDC 46 Caucasian No No
IIIA IDC 51 Caucasian No No
IIIA IDC 55 Caucasian No No
IIIA IDC 39 CaucasianUterus Cancer(Grandmother)
No
IIIC IDC 60 Caucasian No Chronic Cholecystitis
IIIC ILC 45 Caucasian No No
34

Table 3.4: Demographics of the Confirmatory Study Samples.IDC: Infiltrating ductal carcinoma; ILC: Infiltrating lobular carcinoma; Tx:Treatement history, TAC: Taxotere+Adriamycin+Cyclophosphamide, AC: Adri-amycin+Cyclophosphamide.
StageHistological
DiagnosisTreatment Status Age Race Ethnicity
I IDC Taxol 54 Black Non-Hispanic
I IDC Taxol 77 White Non-Hispanic
I IDCTaxotere; Herceptin;
Carboplatin53 White Non-Hispanic
I Undefined TAC 56 White Non-Hispanic
I IDC Reclast 70 White Non-Hispanic
I IDC Post Tx 80 Black Non-Hispanic
I Undefined Post Tx 56 White Non-Hispanic
I IDC Active Hormone Tx 85 White Non-Hispanic
I IDC Active Hormone Tx 65 White Non-Hispanic
I ILC Active Hormone Tx 66 White Non-Hispanic
I Undefined Active Hormone Tx 42 White Non-Hispanic
I IDC Active Hormone Tx 64 White Non-Hispanic
I Undefined Active Hormone Tx 75 White Non-Hispanic
I IDC Active Hormone Tx 53 Black Non-Hispanic
I IDC Active Hormone Tx 72 White Non-Hispanic
I IDC Active Hormone Tx 59 White Non-Hispanic
I Undefined Active Hormone Tx 60 White Non-Hispanic
I-A IDC Taxotere; Cytoxan 55 Black Non-Hispanic
I-A IDC Cytoxan; Taxotere 71 White Non-Hispanic
35

I-A IDC AC; Taxotere 73 White Non-Hispanic
III IDC Active Hormone Tx 36 White Non-Hispanic
III IDCAdriamycin; Cytoxan;
Taxotere65 White Non-Hispanic
III IDC Taxotere; Cytoxan 69 White Non-Hispanic
III IDCAdrimyacin;
Cytotoxan; Taxotere49 Black Non-Hispanic
III IDC Carboplatin/Taxol 54 White Non-Hispanic
III IDCTaxol; Adriamycin;
Cytoxan75 White Non-Hispanic
III IDC Taxotere 65 White Non-Hispanic
III ILCDoxorubicin;
Cyclophosphamide63 White Non-Hispanic
III IDC Active Herceptin 56 White Non-Hispanic
III Undefined Active Hormone Tx 47 Black Non-Hispanic
III-A IDC Active Hormone Tx 55 Black Non-Hispanic
III-A IDC Active Hormone Tx 53 White Non-Hispanic
III-A IDC Unknown 30 Black Non-Hispanic
III-A IDC Unknown 60 White Non-Hispanic
III-A Undefined Active Hormone Tx 56 White Non-Hispanic
III-A ILC Unknown 71 White Non-Hispanic
III-A Undefined Active Hormone Tx 82 White Non-Hispanic
III-A IDC Herceptin; Tamoxifen 48 Black Non-Hispanic
III-C IDC Unknown 75 White Non-Hispanic
36

tein biomarkers in the human serum proteome is like “looking for a needle in a haystack”.
One of the strategies designed to overcome the issue of dynamic range involved the use of
protein pre-fractionation coupled with depletion methods to remove abundant proteins in
the plasma proteomes. Different methods have been used for sample pre-fractionation and
biomolecule separation such as immobilized dyes (cibacron blue), immunoaffinity-based
techniques, solid phase fractionation, liquid chromatography, or low-molecular weight frac-
tion enrichment [167, 168, 169, 170, 171, 172, 165]. In our study, we applied a unique pro-
teomic approach that composed of a simple depletion method by acetonitrile (ACN) cou-
pled with a liquid chromatography separation interfaced with Quadropole Time of Flight
Mass Spectroscopy (Q-TOF/MS).
ACN Precipitation
We washed out the high-abundance proteins (those with MW less than 20 kDa) by
adding acetonitrile in a ratio to serum of 2:1; following an established acetonitrile precipi-
tation protocol [173, 127, 122]. Although acetonitrile precipitation sacrifices most proteins,
it does dissociate the small unobservable peptides from their carriers making them avail-
able for MS analysis [110, 111]. A BCA Protein Assay (Pierce Microplate BCA Protein
Assay Kit; Thermo Scientific) was used to determine the apparent protein concentration of
ACN treated samples. An aliquot containing 4 µg protein was lyophilized to 10 µL (Cen-
triVap Concentrator Labconco Corporation, MO, USA) and then acidified by adding equal
volume (10 µL) of 88% Formic acid. The samples then were loaded into capillary liquid
chromatography mass spectroscopy ( cLC-MS).
Liquid Chromatography Mass Spectroscopy
Several proteomic approches have been applied for biomarkers dicovery including
two-dimensional (2D) gel-electrophoresis, liquid chromatography coupled with mass spec-
trometry (cLC-MS), and protein- and antibody-based microarray. In fact, cLC-MS based
37

proteomic technologies is considered the method of choice for proteomic profiling of hu-
man complex biospecimens [174] because of its highly sensitive analytical capabilities and
a relatively large dynamic range of detection. The Chromatographic Reversed-phase cap-
illary liquid chromatography (cLC) was operated with an LC Packings Ultimate Capillary
(HPLC) pump system, with a Famos autosampler (Dionex, Sunnyvale, CA, USA). The
cLC system composed of a 1 mm (16.2 µL) dry packed MicroBore guard column (IDEX
Health and Science, Oak Harbor, WA, USA), coupled to a 15 cm×250 µm i.d. capillary
column, slurry-packed in-house with Poros R1 reversed-phase medium (Applied Biosys-
tems, Foster City, CA, USA). To generate a gradient mobile phase, we used 98% HPLC-
grade water, 2% acetonitrile, 0.1% formic acid as an aqueous phase and 98% acetonitrile,
2% HPLC-grade water, 0.1% formic acid as an organic phase. The gradient was set as fol-
lows: 3 min of 95% aqueous and 5% organic phase, followed by a linear increase in organic
phase to 60% over the next 24 minutes. The gradient was then increased linearly to 95%
organic phase–5% aqueous phase over the next 7 minutes, held at 95% organic phase for 7
minutes and returned to 95% aqueous phase.
The cLC system was interfaced to Agilent 6530 Accurate-Mass Q-TOF LC/MS
system. The ESI source was operated in positive ion mode. The scans were collected at
8 spectra/s and the mass spectra were within the range of m/z 500 to m/z 2500. The sam-
ples were run in sets that are randomly assigned with an approximately equal number of
stage I and stage III samples. The same instrument was used for tandem MS in order to
identify the promising markers where we used targeted MS/MS, and scans were collected
at 1 spectra/s. Agilent MassHunter Qualitative Analysis B.06.00 software was used to ex-
tract the data and ion intensities.
MS Data Analysis and Time Normalization
In any proteomic study there are several biological and non-biological variations in
mass spectra that are not reflective of disease status. One way to minimize elution time
38

variability between samples is through normalizing time markers and peak alignments
[122, 173, 127]. The time-marker normalization concept assumes the existence of ten en-
dogenous species that elute every 2-3 minutes in the cLC chromatogram of human sera.
The compounds in the series elute at approximately two-minute intervals from each other.
This allowed for the same time windows to be considered for each specimen run. Data
were organized in two-minute windows centroided on each marker or where there were
gaps between two time markers. The time markers allowed for time normalization, provid-
ing uniformity in chromatographic elution windows over the important chromatographic
region (˜15 to ˜35 minutes) as described in detail in [128]. We applied the time-marker
normalization to our data and created 10 2-minute time windows for each sample. The
m/z of the ten time markers were: 733.3 (z = +2), 721.3 (z = +2), 1006.0 (z = +2), 1013
(z = +5), 547.3 (monoisotopic) (z = +1), 547.3 (z = +1), 1047.7 (z = +1), 637.3 (z =
+1), 781.5 (z = +1), and 1620.2 (z = +1), details are in Table 3.5. Then, the samples’
mass spectra were overlaid after we color-coded them. Interesting peaks were picked upon
visual assessment of the difference in their heights between stage I and stage III samples
(Figure 3.1). Then peak heights were extracted from the ion count using the instrument
software.
Data Normalization and Initial Marker Filtering
Peaks that appeared quantitatively different between stage I and stage III were
considered for further analysis. We extracted their ion counts in every sample and recorded
the peak height that corresponds to the marker intensity in each sample. To minimize
non-biological variation that may arise from different runs on the instrument, we normal-
ized the extracted intensities by calculating the ratio of each intensity value to the mean
across all samples for the same marker. Normalized intensities were evaluated statistically
using Students t-test. All markers with a p-value less than 0.05 in the initial study were
evaluated for their predictive power in the confirmatory study. We assumed that some
39

(a) (b)
Figure 3.1: Visual Assessment of the Mass Spectra.Different colors indicate sample stage (blue for I and red for III). (a) m/z 819.43 is a po-tential marker; (b) m/z 439.25 shows no visually significant difference.
40

Table 3.5: Details of the 10 time markers.Reprinted with permission from [128].
41

markers might have modest predictive power in isolation but that this predictive power
would increase when combined with other markers in our subsequent machine learning
analysis.
Evaluation of Potential Batch Effect
It is almost inevitable in a high throughput study to introduce batch effect due to
the splitting of samples into batches that are run under different conditions [175]. This
may lead to biases that confound with the original study design [176]. We used two ap-
proaches to minimize such biases: 1) we analyzed data from the initial study (first 12 sam-
ples) separately from the data from the confirmatory study, and 2) we applied the ComBat
algorithm [177] to data from the confirmatory study, which had been loaded into the MS
on sequential days due to the long run time in the mass spectroscopy (one hour run per
sample followed by 45 minutes wash).
Confirmatory Study Workflow
An arbiter who was not part of the analysis team blinded the 39 samples from the
confirmatory study by assigning generic labels to each sample. These labels did not indi-
cate whether the samples were stage I or stage III samples. The samples were processed on
cLC-MS in batches that included an approximately equal number of stage I and stage III
samples, according to the order created by the arbiter. Candidate markers intensities were
extracted, normalized by the mean marker value and then evaluated by the analysis team.
At this stage, the 39 samples were randomly divided into training (n = 24) and testing (n
= 15) sets, each with an approximately equal number of stage I and III samples. At this
point in time, the analysis team was made aware of the stage status of the training sam-
ples but not of the testing samples.
42

Multi-marker Model
The previously believed concept that the risk of metastasis can be determined by
the presence or absence of one particular molecular marker is far from reality [178]. The
very complicated interaction between several different molecules within a single pathway
and the overlap between different molecular pathway within the same cells can explain the
single marker concept incompetence [90]. Additionally, histo-pathologically identical tu-
mors might express different biological behaviors, they respond differently to treatment
and they progress at variable rates. This has been explained by the tumor heterogeneity
at different levels such as molecular heterogeneity from patient to patient, intra-tumor het-
erogeneity where a single tumor mass found to contain cells at different proliferation stage,
and the patient immune reaction to the tumor [104, 179]. Recent studies showed that can-
cer cells utilize multiple pathways to maintain their uncontrolled growth [180]. Therefore
targeting one pathway might slow down their growth but will never stop them. Therefore,
future cancer therapy should target combined pathways to arrest cancer cell growth. This
is vital in particular due to the fact that some pathways are common among different can-
cer types. Hence, studies showed that combined biomarker expression increased the ac-
curacy of the prediction. For instance, CCR7 expression has been related to lymph node
metastasis prediction, however, combined CCR7, CXCR4 and HER2-neu biomarkers ex-
pression was more accurate in predicting lymph node metastasis than CCR7 expression
alone [131]. Panels of protein biomarkers typically will transcend the tumor heterogeneity
and have higher sensitivity and/or specificity for population-based screenings compared to
a single biomarker model [178]; see figure 3.2 for illustrations.
Statistical Analysis
We used machine learning algorithms to derive multivariate models that predicted
whether each sample was stage I or stage III sample. We applied two-fold cross valida-
tion to the training data (to avoid over-fitting) and used a forward-selection approach to
43

Figure 3.2: ROC Curve Improvement by Multimarker Model.The performance of A+C markers combined is better than the performance of biomarkerA alone.Red line: marker A performance, green line: markers A+B performance, blue line: mark-ers A+C performance.
44

identify combinations of markers that were most predictive of cancer stage. Initially, we
identified individual markers that attained an area under the receiver operating charac-
teristic curve (AUC) greater than 0.65. We then evaluated each pairwise combination of
these markers and identified combinations that attained an AUC greater than 0.70. We
continued adding one marker at a time to the model, only considering markers that in-
creased the AUC value at each step. We used AUC thresholds of 0.75, 0.85, 0.90, and 0.95
for 3-way, 4-way, 5-way, and 6-way marker combinations, respectively. We incremented
the number of markers in our models until adding more markers no longer exceeded these
thresholds. Based on these results on the training data, we selected five marker combi-
nations, which we further verified using the blinded samples from the testing set. We ap-
plied the following classification algorithms to the training data: Support Vector Machine
(SVM), Random Forests, k-nearest neighbors, Naive Bayes classifier, and logistic regres-
sion. [181, 182, 183]. Random Forests gave the most consistent and robust results; there-
fore we used this algorithm exclusively in our analysis of the testing data. For our testing
data analysis, we trained the Random Forests algorithm on the full training set and ap-
plied the resulting multimarker combinations to the full testing set. After un-blinding the
class labels, we used receiver operator characteristic (ROC) curves and AUC metrics to
assess sensitivity and specificity.
Identification of Significant Markers
The markers that showed consistent significance across the studies were further
evaluated through tandem mass spectroscopy with collision-induced energy (CID). We
took 7 µL of the sample that had high concentration of the marker to be identified, and
treated it with 3 µL 88% formic acid, then injected it into the tandem MS with different
collision energy. The fragmentation was produced by ion collisions with nitrogen or ar-
gon. The fragment patterns of every marker at different collision energy were summed for
a complete fragmentation coverage. The fragmentation spectrum was inspected visually
45

for any mis-assigned charge state. Peak charges were corrected to their +1 m/z values us-
ing the formula
+1 mass = m/z value× charge− (charge− 1H+)
The corrected charge peaks were submitted to a Mascot database search to determine the
amino acid sequence of the protein and the parent protein. Some of the markers were of
very low abundance despite serum lyophylization and therefore they did not provide an
informative fragmentation pattern.
46

Figure 3.3: Pipeline Used in the Laboratory Experiments.
47

CHAPTER 4: Results
Preliminary Study: Significant Biomarkers
The goal of our study is to identify novel biomarkers in human serum that would
indicate the presence of metastatic disease for patients of Breast Cancer. We used our
serum proteomics approach to analyze low abundance low molecular weight (LMW) species,
primarily peptides, in serum samples from Breast Cancer patients. The high diversity of
these species gives a high probability of identifying biomarkers whose expression is specif-
ically associated with the presence of metastasis. In order to determine differential ex-
pression, we compared serum samples from stage I and II Breast Cancer patients with no
metastatic disease to patients with stage III disease and documented metastasis. For this
preliminary study we used commercially available samples for which there is limited pa-
tient information, but we sought to avoid samples where there was co-morbidity. Though
the serum samples in each group could not be matched perfectly, the diversity in each
group is expected to be sufficient to eliminate many biomarkers that are associated with
some unrelated trait in one group.
Serum samples were all processed simultaneously and then frozen prior to analysis
using mass spectrometry (MS) instrumentation. Each sample was then separated by re-
verse phase chromatography (the liquid chromatography or LC step) and subsequent MS
analysis, referred to as LC-MS. Separation of individual species in the sample is achieved
using the chromatography step, while the subsequent MS analysis provides mass informa-
tion of separated species, including the relative abundance of each species. For each data
set, sample processing was performed to align species between different samples and to
determine the relative abundance of each species within that sample. Thus, the relative
abundance of individual species in each sample could be directly compared to those in all
other samples subjected to LC-MS instrumentation.
48

With data generated for each sample, we then directly compared the abundance
of each species detected across all samples. Our preliminary study revealed the feasibility
of identifying candidate markers using this peptidomic approach on BC serum samples.
Interestingly, the results from this study showed also that some biomolecules could differ-
entiate the stages of Breast Cancer. About 2500 peaks were visually examined in every
time window (total=25,000 peaks in 10 time windows), and their intensities were extracted
across all the samples. Students t-tests on the total mean normalized intensities identified
65 candidate biomarkers with statistically significant (p-value less than 0.05) differences
between stage I and III samples (Table 4.1) and another 21 biomarkers that had a nearly
significant statistical difference (0.05 < p-value < 0.10). Among the significant markers
(n=65), 9 markers were up regulated in the metastatic sera, while 56 were unexpectedly
and surprisingly down-regulated. According to the proposed stromal model by [47], freely
circulating factors (tumor-derived serum factors, or TDSFs) are released by the primary
tumor as the tumor progress. They proposed that the TDSFs levels increases with time.
Conversely, our study showed that most differentially expresses LMW peptides are down
regulated as disease progression occurs. Nonetheless, our preliminary study of small groups
reveals that proteomic analysis of highly divers and low abundance species in serum could
yield biomarkers or biomarker profiles that indicate the presence of metastatic disease in
Breast Cancer patients.
Confirmatory Study
We used data from our preliminary study to evaluate the predictive power of candi-
date biomarkers for detecting Breast Cancer metastasis. We procured an additional set
of 39 samples (24 used for training; and 15 used for testing) of Breast Cancer patients
with either stage I/II disease with no metastasis or with stage III disease and documented
metastasis. In order to prevent any bias in our evaluation of these samples, we had a third
party give new identification numbers to the samples, such that the patient status of each
49

Table 4.1: Details of the Most Significant Markers in the Initial Study.Markers are defined by their m/z and charge status. P-value is calculated using the mark-ers intensities following normalization with the overall mean calculated across all the sam-ples. Markers status describes the level of the marker as the disease progress. D: downreg-ulated in stage III; U: upregulated in stage III.
Serial # Marker (m/z) Charge (z) P-value Marker Status
1 403.23 2 0.008 D
2 409.2 2 0.04 D
3 414.23 2 0.003 D
4 415.67 2 0.01 U
5 421.22 2 0.002 D
6 425.25 2 0.002 D
7 430.28 1 0.01 D
8 436.24 2 0.004 D
9 442.23 2 0.001 D
10 443.23 2 0.01 D
11 447.26 2 0.012 D
12 450.3 1 0.007 D
13 451.2 2 0.006 D
14 458.25 2 0.004 D
15 459.24 1 0.03 U
16 464.31 1 0.03 U
17 465.74 2 0.014 D
18 472.3 1 0.007 D
19 473.21 2 0.029 D
20 482.29 1 0.005 D
21 487.25 2 0.003 D
22 488.29 1 0.017 D
50

23 494.3 1 0.006 D
24 495.23 2 0.014 D
25 497.26 1 0.006 D
26 522.28 1 0.03 D
27 524.26 2 0.01 D
28 537.27 1 0.03 D
29 541.29 1 0.01 D
30 543.31 3 0.019 D
31 546.27 2 0.004 D
32 555.27 1 0.0002 D
33 568.27 2 0.001 D
34 571.25 1 0.0014 D
35 572.63 3 0.008 D
36 575.33 1 0.04 D
37 582.3 2 0.03 U
38 585.3 1 0.006 D
39 590.3 2 0.007 D
40 599.29 1 0.002 D
41 605.28 2 0.03 D
42 629.3 1 0.003 D
43 643.3 1 0.003 D
44 649.32 2 0.01 D
45 656.33 2 0.008 D
46 673.33 1 0.0018 D
47 687.35 1 0.002 D
48 700.36 2 0.003 D
49 709.4 1 0.02 U
51

50 713.47 1 0.02 U
51 717.35 1 0.002 D
52 721.37 2 0.005 D
53 721.42 1 0.008 U
54 722.37 2 0.002 D
55 731.37 1 0.002 D
56 743.37 2 0.02 D
57 744.3 2 0.04 U
58 747.3 1 0.02 D
59 761.37 1 0.004 D
60 792.58 1 0.019 U
61 819.43 1 0.003 D
62 835.38 1 0.005 D
63 863.43 1 0.002 D
64 879.43 1 0.015 D
65 923.45 1 0.0085 D
52

samples was blinded during processing, instrumentation, and analysis. We processed all
the samples for LC-MS instrumentation in parallel and froze all samples prior to instru-
mentation. During LC-MS instrumentation we only detected the species that were differ-
entially expressed in metastatic and non-metastatic groups in the preliminary study with
at least near statistical significance (p < 0.10), yielding a total of 86 species. The peaks
representing these species were aligned and the relative abundance determined to allow
comparison between each sample. Then, the differential expression between all samples
was determined. We applied the Random Forests algorithm (using a two-fold cross valida-
tion design) to the 24 training samples. Initially, using a single-marker approach, we con-
firmed that 12 of the 86 candidate markers provide a relatively high predictive accuracy
(AUC > 0.65; see Table 4.2). The best serum biomarker was of m/z 497.26 with an AUC
of 0.79, sensitivity of 0.79 and specificity of 0.64 as shown in Table 4.2.
Multi-Marker Model Construction
Given that individual species have limited statistical power to predict the stage
of metastasis, we sought to assess how evaluation of multiple markers in a single evalua-
tion would improve predictive power. Using these 18 individual markers we constructed a
number of multimarker models using the Random Forests algorithm. We used a forward-
selection approach as described in the methods chapter to identify marker combinations
that provided the best accuracy in the training set. In short, we randomly combined 2 or
more species together into all possible combinations and assessed how the predictive power
of the combination improved over any individual species. The best five multimarker panels
are shown in Table 4.3, with their respective AUC values.
Multi-Marker Model Validation
With partially developed multi-marker models in hand, we sought to assess their
predictive power on a set of samples that had not been previously analyzed. We procured
53

Table 4.2: List of Markers that Attained an AUC > 0.65 in the Training Data Set.425.25a is marked with * because there is another marker with m/z 425.25 but differentcharge state and different elution time.
Serial # m/z Sensitivity Specificity AUC1 497.26 0.79 0.64 0.792 923.45 0.65 0.66 0.723 761.37 0.63 0.7 0.74 425.25a* 0.66 0.66 0.695 722.37 0.58 0.6 0.666 585.3 0.59 0.55 0.657 458.25 0.55 0.64 0.658 747.3 0.67 0.63 0.639 555.27 0.63 0.6 0.6310 442.23 0.59 0.7 0.6211 546.27 0.56 0.56 0.6212 879.43 0.5 0.56 0.61
54

Table 4.3: Performance of the Top 5 Multimarker Models in Training Data Set.
m/z AUC497.26 585.3 722.37 923.45 0.915425.25a 497.26 585.3 722.37 923.45 0.919458.25 497.26 585.3 722.37 923.45 0.913497.26 585.3 722.37 761.33 923.45 0.912425.25a 497.26 585.3 722.37 761.37 923.45 0.915
55

15 serum samples from the confirmatory study (the test set). We got relatively equal num-
ber of both stages (8 of stage I/II serum and 7 of stage III). The stage of the serum sam-
ple was blinded by an arbitrator who is not involved in the study. All samples were pro-
cessed in parallel in the same day. They were run in the cLC-MS in a random manner.
Evaluation of the predictive power of the best 5 Multi-marker models on the 15 blinded
samples in the testing set is outlined in Table 4.4. As might be expected, accuracy levels
on the testing set were lower than were obtained with the training set. However, the mul-
timarker models still attain accuracy levels that indicate promise for further evaluation as
predictive biomarkers in a clinical setting. For example, the best-performing model which
consisted of markers with m/z 497.26; z = +1, 458.25; z = +2, m/z 585.3; z = +1, m/z
722; z = +2 and m/z 923.45; z= +1 attained an AUC of 0.84, a sensitivity of 43% and a
specificity of 88% as shown in Figure 4.1. The box plots for each biomarker in this model
across the confirmatory dataset are plotted below (Figures 4.2–4.6). In summary, develop-
ment of the multimarker models described here have been validated with a small blinded
test set and are ready for a more robust validation with a very large sample set.
Biomarker Identification
We sought to identify the species found in peaks used in the multuimarker models.
To do this, individual peaks are subjected to LC-MS under conditions where the species
is fragmented into smaller species whose individual masses are measured by the MS in-
strument. For peptides, fragmentation usually occurs between individual amino acids and
allow for the determination of the precise sequence. This approach is particularly challeng-
ing for low abundance species. A species that is low in abundance could by suppressed by
other species and not be picked by the instrument for fragmentation. We used a concen-
trated serum for those species that appear low in abundance in the sample. Furthermore,
low MW species especially those with +1 charge will provide a very short combination of
amino acid that could be shared by several parent proteins. However, they could give hints
56
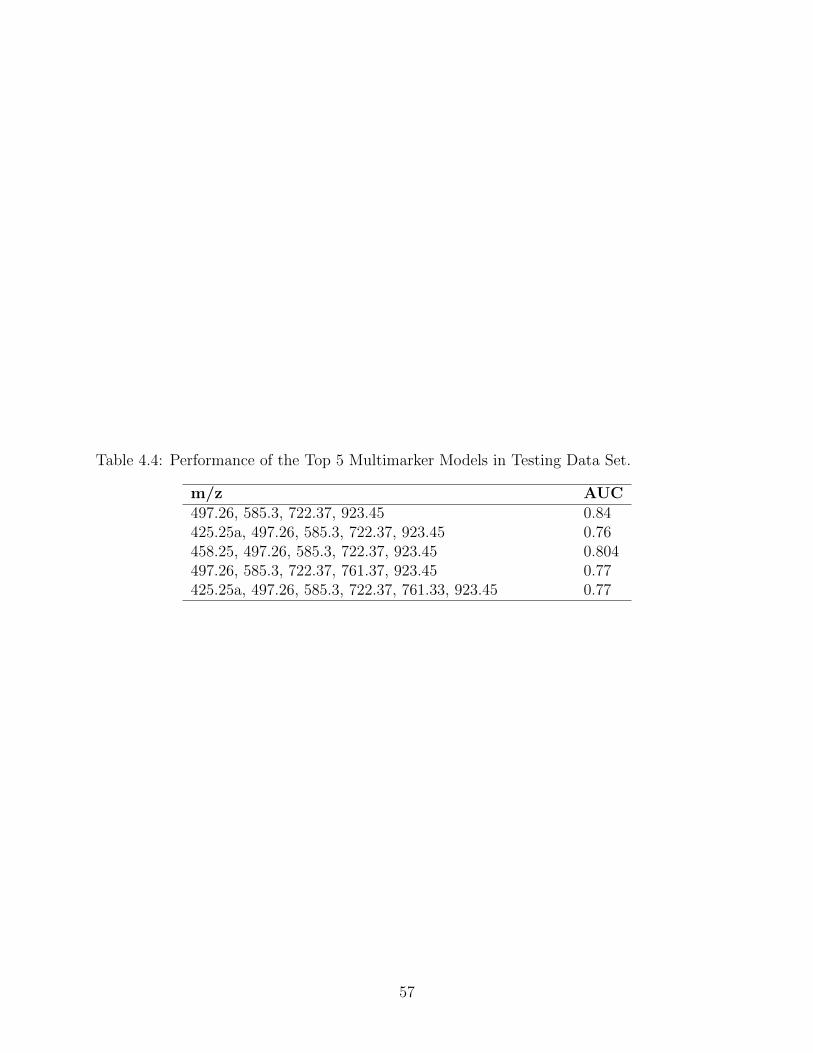
Table 4.4: Performance of the Top 5 Multimarker Models in Testing Data Set.
m/z AUC497.26, 585.3, 722.37, 923.45 0.84425.25a, 497.26, 585.3, 722.37, 923.45 0.76458.25, 497.26, 585.3, 722.37, 923.45 0.804497.26, 585.3, 722.37, 761.37, 923.45 0.77425.25a, 497.26, 585.3, 722.37, 761.33, 923.45 0.77
57

Figure 4.1: Performance of the Top 5 Multimarker Models in Testing Data Set.M: Metastatic, P: Pre-metastatic.
58

Figure 4.2: Box Plot of Biomarker with m/z 497.26
59

Figure 4.3: Box Plot of Biomarker with m/z 458.25
60

Figure 4.4: Box Plot of Biomarker with m/z 585.28
61

Figure 4.5: Box Plot of Biomarker with m/z 722.37
62

Figure 4.6: Box Plot of Biomarker with m/z 923.45
63

to the identity of the parent protein and therefore exclude other possibilities. Most of the
biomarkers that built the multimarkers models were having an adjacent overlapped peak.
Therefore, the fragmentation pattern of these biomarkers might contain fragments of both
peaks that were hard for the system to distinguish. We tried to fragment the biomarker
m/z 497.26 which was showing a consistent significance across the initial and confirmatory
data set. Its mass spectrum is showing a overlapped peak with m/z 497.24 (Figure 4.7).
Surprisingly, its fragmentation profile did not appear to be consistent with the
species being a peptide because there was no evidence of immonium ions and no fragments
occurred at intervals consistent with amino acids, with or without modifications. Instead,
the fragmentation spectrum of this biomarker was consistent with choline containing lipid
species, primarily due to the presence of a high abundant peak at m/z 184.07 that indi-
cates the presence of a phosphocholine head group. We tried to fragment this biomarker
with collision energies that range from 15 to 35 V and we noticed that the fragmentation
spectrum of this particular species yielded a consistent fragmentation profiles with differ-
ent intensities. In addition, the m/z 184.07 fragment was always observed as the collision
energy changed. In general, the fragmentation profile of phosphocholine lipid species such
as phosphatidylcholine (PC) , sphyngomyeline (SM) and lyso PC display the product ion
with either m/z 59, 104 or 184 corresponding to trimethylamine, choline and phospho-
choline moieties, respectively. The m/z 104 and m/z 184 fragments are displayed in the
m/z 497.27 fragmentation spectra (Figure 4.8). The complete structure of the phospho-
choline species could not be determined but the nitrogen rule can suggest what species
it is. The nitrogen rule states that, if M+H+ has an even m/z (i.e., having odd neutral
mass), then it should correspond to the presence of odd number of nitrogen atoms. Con-
versely, if M+H+ has an odd m/z (i.e., having even neutral mass) then it should repre-
sent even numbered nitrogen atom containing species. In other words, protonated PC
molecules appear at even m/z values, whereas protonated molecules of SM exhibit odd
m/z values. This is due to the presence of an additional nitrogen atom in SM. The appli-
64

Figure 4.7: Overlapping Peaks at m/z 497.27.
65

cation of this rule suggests that 497.27 is a SM species of lipid. Further supporting this,
we observed a peak of m/z 69 that is indicative of sphyngomyelin lipid group. Taken to-
gether, this biomarker fragmentation profile indicates that this critical biomarker is a SM
lipid species. Alternately, the consistent presence of the fragment with m/z 479 indicates
water loss is occurring in this molecule. Therefore, this SM species could be oxidated.
On the other hand, the product ion at m/z 147 corresponds to sodiated five-member cy-
clophosphane [184], which is displayed in the m/z 497.27 fragmentation spectra. Therefore,
this biomarker could also be a sodiated SM. In fact, fragment ion of m/z 147 has been
seen in the fragmentation profile of non-sodiated SM, which results from some overlap.
Despite the ability to identify this molecule as an oxidated SM, we can not be sure
that it is corresponding to m/z 497.27 because of the co-eluting peak with m/z 497.24
that is more prominent as shown in Figure 4.7. Unfortunately, all the other biomarkers
that built the multimarker model were having an overlapping peak that is interfering with
the fragmentation profile of the biomarker of interest (Figures 4.9–4.13). Therefore, they
did not yield interpretable MS/MS fragmentation spectra. There are several factors con-
tributed to the difficulty in identifying these other biomarkers using the fragmentation ap-
proach. The use of the microcapillary column for peptide separation, which is packed with
POROS R1 slurry of 10 µm particle size could be one of the main factor because it gave
wide peaks and overlapped spectra. Other factors that could be responsible for the low
resolution will be discussed in the discussion.
We tried a new run where we changed the flow rate in the experiment from 5.0
µL/min to 10 µL/min and we were able to get a better resolution for the biomarker with
m/z 761.38. Fragmentation of this biomarkers was possible because of the absence of co-
eluting peaks.
The fragmentation profile of the marker with m/z 761.38 was showing immonium
ions of some amino acids. Through scanning of the fragmentation profile we could see
66

Figure 4.8: The Fragmentation Spectra of Biomarker with m/z497.27.
67

some mass differences that correspond to the mass of amino acids and the proposed se-
quence is DLVPGNF, see Figure 4.14.
Doing a blast search for this sequence showed some suggested proteins that have
DLVPGNF partial sequence. Using Fragment Ion Formula Calculator, we got a list of ex-
pected b and y ions series that should be seen in the ms/ms spectra of m/z 761.38 accord-
ing to the proposed protein. It turned out to be a fibrinogen alpha chain (FAC) isomer 2
as the proposed b and y ions corresponding to the FAC by Fragment ion formula calcula-
tor were all present in the m/z 761.38 fragmentation profile, see Figure 4.15.
68

Figure 4.9: Overlapping Peaks at m/z 425.25
69

Figure 4.10: Overlapping Peaks at m/z 458.25
70

Figure 4.11: Overlapping Peaks at m/z 923.45
71

Figure 4.12: Overlapping Peaks at m/z 722.37
72

Figure 4.13: Overlapping Peaks at m/z 761.38
73

Figure 4.14: Ms/Ms of m/z 761.38
74

Figure 4.15: Fragment Ion Calculator Result
75

CHAPTER 5: Discussion
The advancement in early Breast Cancer detection led to a 16% increase in early
diagnoses, while the mortality rate of BC remained unchanged [5]. Metastasis is the main
cause of death among Breast Cancer patients. Therefore, determining the tumor potential
to spread before the onset of metastasis will pave the road toward personalized therapy
and save many patient from being overtreated and improve their quality of life [185].
Breast Cancer metastasis is currently monitored by radiological imaging that suf-
fers from detection limitations [9]. While tumor metastatic potential is largely determined
by evaluating the tumor size, grade and involvement of regional lymph nodes, molecular
biomarkers are currently used in this evaluation. The complementary effect of the biolog-
ical markers such as estrogen and progesterone hormone receptors, HER-2, and plasmino-
gen activator inhibitor 1 should not be underestimated [9, 18]. It is worth mentioning that
all of these prognostic factors rely on tissue specimens from primary or secondary site, ob-
tained either by biopsy or surgical resection. Therefore, they can not by definition be used
for a inexpensive, reproducible and noninvasive screening assay [186]. Ca 15-3 and CEA
are the two serum markers that are widely used to predict recurrence and metastatic po-
tential of breast, ovarian, and uterine cancers. [18]. These serum markers suffer from low
sensitivity and specificity that necessitates the search for a more powerful prognostic and
metastasis predictive approach [187]. There is a soaring need for more robust markers that
have diagnostic and predictive power across Breast Cancer subtypes [11] and circulating
markers are more clinically desirable [188].
The rapid advancement of high throughput proteomics in recent decades have not
uncovered any novel serum biomarkers that can displace currently used tissue or replace
existing low-predictive serum markers. This is a result of the inherent limitation of the
conventional ‘bottom-up’ approach and the complexity of human serum. In addition, sub-
types and subpopulation heterogeneities of tumors complicates markers discovery, which
76

could be overcome by combining markers, as proposed by some researchers [189]. Our goal
was to evaluate the applicability of a proteomic approach in BC serum samples and its
quantitative power to differentiate between metastatic and non-metastatic Breast Can-
cer. The proteomic approach we have applied in this project showed success in previous
studies done on preterm birth [190], preeclampsia [173, 191] and Alzheimer’s disease [192].
The uniqueness of this approach is its capability to detect biomarkers from an array of low
abundance but highly divers species found in different human biospecimens. This study
demonstrated that this ‘top-down’ approach is effective in identifying differentially ex-
pressed biomarkers from low abundance low molecular weight (LMW) molecules in serum.
We were able to detect biomolecules in serum samples that significantly differenti-
ate between the two serum sample groups. Surprisingly, the majority of identified molecules
were down-regulated in stage III sera, rather than upregaultes, as expected. Previously
identified circulating peptides were mostly up-regulated with disease progression. Lv et.
al. studied the role of circulating cytokine in BC metastasis and found multiple cytokines
that are positively associated with BC progression. However, they also found two serum
cytokines, MCP-1 and IP- 10, that were down-regulated with disease progression. Their
decreased expression levels were significantly and inversely correlated with patients who
had more positive lymph nodes[148].
Downregulated Metastatic Biomolecules Identified in Virto
There are other peptides that are found to be downregulated in BC tissues and cell
lines studies. For example, RAB1B expression was low in highly metastatic cells and could
be considered as a metastasis suppressor in triple negative BC (TNBC) [137]. In another
study, the migration and invasion of a highly metastatic BC cell line were dramatically
reduced by RhoGDIα upregulation [138]. Furthermore, CD59 and CSPG4 were found
to be inversely correlated with BC metastasis [141]. Li et. al. looked at the BC cell line
secretome using a bottom up approach and all the identified peptides were upregulated
77

in the metastatic cell line secretome compared to the non-metastatic ones. Mesothelin
(MSLN) was the only peptide found to be inversely correlated with tumor aggressiveness
[11]. LIFR is an example of a metastatic suppressor that is found to be down-regulated
in Breast Cancer tissue [193]. As an alternate theory to explain the large number of pep-
tides whose expression is down-regulated in metastatic patients, perhaps the presence
of metastatic cells results in the depletion of specific peptides and proteins from serum.
Torosian detected some circulating peptides that were suppressing tumor metastasis which
could not be synthesized by tumor-bearing animals on protein depleted diet due to ab-
sence of amino acids subunits [194].
Metastatic Suppressors
Metastasis suppressors are molecules that prevent the dissemination and growth
of tumor cells in the secondary organ but has no or minimal effect on the primary tumor
[195]. The first identified metastatic suppressor was Nm23 where it provided functional
evidence for the existence of specific genes that control metastasis [32]. Today, more than
thirty metastasis suppressors have been identified [196] that vary widely in term of cellu-
lar localization where some are produced intracellular and some are in the extracellular
matrix. They vary in their mechanism of action, some promote cell-to-cell adhesion that
will slow cell migration out of the primary tumor such as E-cadherin. Other metastasis
suppressors act by inhibiting cell motility and invasion such as Nm23, tissue inhibitors of
metalloproteinases (TIMP), SseCKS, caspase-8, BRMS1, KAI1 inhibit metastasis by re-
ducing cells survival while they are in the way toward the secondary site. KISS1, MKK4,
p38, MKK7 act on the disseminated cells at the secondary site to prevent their prolifera-
tion [196, 195, 197, 198].
78

Metastatic Suppressor Genes
It is likely that the discovered metastatic suppressor genes did not provide a com-
plete understanding of the mechanism of metastatic and its suppression [197]. That is be-
cause the protein products of these genes varies and each will have a different mechanism
of action. For example, serum kisspeptin levels (product of metastatic suppressor gene
KISS1) were significantly lower in the infertile male compared to fertile male who have
no malignancy [199]. Therefore, identifying metastatic suppressor proteins will be more
functional and applicable. Since the downregulated biomarkers that we detected were asso-
ciated with invasive stage of BC, further understanding of their identities, origin, and fate
during cancer progression is clearly needed.
Peak Overlapping in Mass Spectroscopy
Mass spectroscopy based serum proteomic studies are prone to show ion suppres-
sion due to the variation of the serum peptide MW despite the use of acetonitrile precip-
itation. Isobaric species tend to co-elute and provide a convoluted mass spectrum. This
could affect the quantitation of the co-eluted species and more importantly interfere with
fragmentation profile of the peak of interest because the eluted peaks will be fragmented
together. The identification of the biomarker that built the multimarker model was chal-
lenging because of the existence of overlapping peaks. Several technical parameters of the
chromatographic methods could contribute to these findings which can be summarized in
the resolution equation
Rs = 1/4 [k/(1 + k)] (1− α) (N)1/2
where Rs is the resolution of two closely eluting peaks, k represents retention; α
is the ratio of the retention for closely eluting peaks; and N represent column efficiency
(plate number). These three parameters need to be adjusted in order to get a better peak
79

spacing. For example, increasing column efficiency could solve moderately overlapped
peaks. Column efficiency could be enhanced by increasing the column plate number that
is a achieved by increasing the column length or the use of smaller particles. Columns with
smaller particle sizes results in a higher plate numbers which subsequently give sharper
peaks. The size of the particles also depends on the size of the studied molecules because
large MW species dont show a good separation in the small pore size packings [200]. Due
to financial constraints, we could not replace the column we implemented in our studies
with a longer column or using different packings. Another way to improve column effi-
ciency is to elevate column temperature. Higher column temperatures lead to reduce mo-
bile phase viscosity that subsequently increase column efficiency due to increase solvent
diffusion [200]. Since we are dealing with proteins which are thermolabile, increasing col-
umn temperature might degrade them.
Changing the strength of the mobile phase has been found to solve minor overlaps.
What could be seen in our mass spectra is that we have major overlap that would be un-
likely to be solved by this intervention. Additionally, it has been shown that changing the
mobile phase will not help to solve the co-elution if the sample has a large number of com-
ponents or if the co-eluted peaks are isomers that crowd the chromatograph which is the
case with human serum samples that we study [201]. In fact, we did several runs with dif-
ferent mobile phase gradient and were unlucky getting the overlap solved.
Flow rate is another factor that could exert a change in the peak signals as increas-
ing the flow rate results in large signals and therefore a greater amount of sample mass is
reaching the instrument per unit. We noticed biomarker m/z 761.38 was represented with
a very clear peak when we increased the flow rate from 5 µL/minutes to 10 µL/minutes.
Sphingomyelin Species are Potential Biomarkers for Cancer
It is worth mentioning here that the fragmentation of one of the best markers in
our study was somehow consistent with oxidated sphingomyelin (SM). SM is a polar lipid
80

which is composed of an alcohol portion (sphingosine), a long-chain fatty acid that is con-
nected by an amide bond to the amino group and a phosphorylcholine head group. The
combination of a fatty acid and sphingosine is called ceramide, see Figure 5.1.
Sphingomyelins are one of the major membrane phospholipids that are mainly lo-
calized to the outer leaflet of the plasma membrane. Several studies link SM to multi-
ple cellular pathways such as cell migration, cell proliferation, apoptosis, autophagy and
growth arrest [202]. In fact and to be more specific, it is SM metabolites, such as sphingo-
sine, sphingosine 1-phosphate (S1P), and ceramide, that control these pathways. Ceramide
has a pro-apoptotic property while S1P has anti-apoptotic property and it induces cell
proliferation and growth [184]. The dynamic balance between these two SM metabolites
usually determines cell behavior.
Cancer cells exhibit altered metabolic activity that aims to maintain the rapid
proliferation of cancer cells [203]. SM is one of the lipids that is highly involved in can-
cer development and progression. SM levels are found to be significantly higher in highly
metastatic cancer cells compared to those in less metastatic cells [204]. Unexpectedly, in
our study, we found that this specific SM lipid is down-regulated in metastatic serum sam-
ples. We propose four possible explanations for the reduction of serum SM in the metastatic
stage: 1) the up-regulation of Ceramide SM metabolites, 2) up-regulation of sphingosine-
1-phosphate SM metabolites, 3) the high prevalence of lipid rafts in cancer and 4) the pro-
duction of extracellular membrane vesicles from tumor cells.
Upregulation of Ceramide in Cancer
Ceramide is a sphingolipid with sphingosine backbone that is generated de novo by
condensation of serine and palmitoyl-CoA or through hydrolysis of sphingomyelin by sph-
ingomyelinases, known as the “sphingomyelin cycle”. Ceramide is a pro-apoptotic molecule;
it induces cell death and arrests growth. Doria et al. found that regular intake of SM was
associated with a reduction in colon cancer in animals [205]. Researchers proposed that
81

Figure 5.1: Chemical Structure of Sphingomyelin.SM is comprised of sphingosine backbone (mainly C-18). (A) A long chain fatty acid at-tached to sphingosine through amide linkage forms ceramide. (B) SM is produced by re-placement of hydrogen group of ceramide (H*) with various functional head groups phos-phocholine in (C) and phosphor-ethanolamine in (D).
82

one possible mechanism for this inhibition is through the generation of ceramide from SM
hydrolysis, which will exert an apoptotic effect on colon cancer cells [206].
Several studies revealed high expression of different species of ceramide in differ-
ent cancers, such as nodal positive pancreatic cancer, squamous cell carcinoma of the head
and neck, BC and prostate cancer. Theoretically, ceramide should be down-regulated in
cancer [206]. The up-regulation of ceramide was explained by the presence of several dis-
tinct species of ceramides, which differ according to length of fatty acid chain, saturation
level, and sites of double bonds. Different ceramide species also differ in their functionality.
For example, the accumulation of C16-ceramides found to have a proliferative properties
whereas C18-ceramides have apoptotic/growth arresting properties. Thus, up-regulation
of some ceramides could be associated with cancer progression. The generation of such
species necessitates increased SM hydrolysis, which could explain low levels of serum SM
in metastatic patients.
Upregulation of Sphingosine-1-phosphate (S1P)
S1P is produced by phosphorylation of sphingosine by sphingosine kinases, see Fig-
ure 5.2. It can be produced either in the inner part of the plasma membrane and then
transported elsewhere or in the plasma. Plasma production may occur by either the same
biochemical steps as occur in the membranes of cells [207] or by the hydrolysis of sphingosyl-
phosphorylcholine by the enzyme autotaxin [208]. S1P is well known to induce cell migra-
tion, proliferation, invasion, and angiogenesis [209, 210]. Analysis of plasma from nodal
positive pancreatic cancer patients reveals high expression of S1P compared to nodal neg-
ative pancreatic cancer patients [211]. Additionally, it is up-regulated in BC and is as-
sociated with poor prognosis and resistance to chemotherapy [212]. Further, Ogretmen
et. al. found that disseminated cancer cells into the blood stream induce the elevation
of serum S1P. They found that systemic S1P generated in circulation, but not primary
83

tumor-derived S1P, controls cancer metastasis. Clearly serum SM is utilized extensively in
order to produce more S1P, which in turn drives cell proliferation and migration.
Lipid Raft-associated SM
Lipid rafts are specialized cholesterol-enriched microdomains of the plasma mem-
brane that are formed by the assembly of cholesterol, sphingolipids and certain types of
proteins. They have been implicated to play a role in different cellular pathways needed
for cell survival, proliferation, and migration [213, 214, 215, 216]. The composition of lipid
rafts differs from that of the surrounding bilayer membrane. Studies show that they con-
tain 3-5 fold more cholesterol than the plasma membrane. The sphingomyelin content of
the lipid raft is 50% more than that of the adjacent part of the plasma membrane. Since
rapidly proliferating tumor cells have more rafts and require cholesterol for new membrane
synthesis, their need for SM and cholesterol is highly elevated [213]. In fact, researchers
found that patients with advanced cancer have hypocholesterolemia that is associated with
hyposphingomyelinemia [217].
Extracellular Membrane Vesicles from Tumor Cells (EMVTCs)
Studies showed that the level of extracellular membrane vesicles are elevated by five
times in cancer patients compared to levels in normal patients [218]. Their number in the
blood is positively correlated to the invasiveness of the tumor [219, 220]. EMVTCs are be-
lieved to have angiogenic activity, which can promote the growth of disseminated cancer
cells. These EMVTCs are enriched with SM, which is considered the active component
that stimulates angiogenesis. As the tumor progress, angiogenesis increases and could de-
plete the plasma of EMVTCs that contain SM. It is worth mentioning that cancer tissues
need more cholesterol and SM than they are capable of generating by their own lipid syn-
thesis pathways. In fact adipocytes were found to enhance cancer cell migration and inva-
sion through the continuous supply of lipids, which cancer cells use for structural assembly
84

and energy for rapid growth [221]. Several studies showed that cancer mortality increases
if the patient has low plasma cholesterol [222]. Whether low cholesterol drives cancer ag-
gressiveness or the progression of cancer results in low plasma cholesterol is unclear and
needs further study.
Oxydated Sphingomyelin in Cancer
It is well known that cancer cells experience a metabolic shift from oxidative phos-
phorylation to aerobic glycolysis, which is known as Warburg effect [223]. They use dif-
ferent metabolic pathways to meet their increased energy demands. Lipid metabolism is a
vital source of energy for cancer cells and results in changes in lipid synthesis, lipid degra-
dation and catabolism, and fatty acid (FA) oxidation [224]. It has been estimated that al-
most all tumors will gain lipogenesis capability, meaning cancer cell are able to the synthe-
size fatty acids de novo in a rate comparable to liver cells. The increase in FA oxidization
in cancer cells could explain the detection of oxidated SM in the serum of BC patients.
Despite the evidence linking SM to cancer initiation and progression, it is too early
to speculate as to the physiological significance of downregulation of circulating SM species
as a predictor of tumor progression. However, coupling this marker with other clinico-
pathological parameters might increase the predictive power of these combined markers.
Fibrinogen Physiological Function
The fragmentation profile of the biomarker with m/z 761.38 was consistent with
fibrinogen α chain (FAC). FAC is one of the chains that build up fibrinogen molecule.
Fibrinogen is a plasma protein produced by hepatocyte with a molecular weight of 340-
kDa. It consists of two pairs of three polypeptide chains α, β, and γ that are connected by
disulfide bonds. It is involved in the last phase of the coagulation process. It circulates in
the blood in insoluble form and need to be activated into its active form by the protease
thrombin. Thrombin cleaves four specific Arg-Gly bonds at the N termini of both the α
85

Figure 5.2: Sphingomyeline Hydrolysis.
86

and β chains, releasing fibrinopeptides A (FpA) and B (FpB) respectively, see Figure 5.3
[225]. These cleavages result in further arrangement of the molecule chains forming a net-
work of fibres that stabilise the clot [226]. In fibrinolysis, fibrin will be cleaved by plasmin
at two different sites to break down the clot. Fig 5.4 shows the cleavage sites of FAC by
the three enzymes: thrombin, plasmin and hementin that are involved in coagulation pro-
cess.
Fibrinogen and Fibrin in Metastasis
The relationship between tumor metastasis and coagulation process has been widely
studied. Fibrin and fibrinogen in particular gained more focused interest. Cleavages of fib-
rinogen and fibrin yield various products that have been found to regulate several critical
cellular pathways and functions such as chemotachtic activities, cell adhesion and vasocon-
striction. For example, fibrin A (a cleavage product of fibrin clot formation), fibrinopep-
tide A and fibrinogen α found to be associated with the initiation of multiple solid tumor
[227, 228]. Furthermore, Fibrinogen/fibrin have been found to play a role in tumor pro-
gression. Collectively, studies found that fibrin and fibrinogen products enhance tumor
progression through three proposed mechanisms, inducing angiogenesis, protecting the tu-
mour cells from the natural killer cell and serving as a bridging molecule between tumor
cells and the surrounding micro-environment [229]. Studies found that breast cancer, lung
carcinoma and malignant melanoma metastasis but not primary tumor growth was sig-
nificantly reduced in fibrinogen deficient mice [230]. These findings suggest that therapy
targeting the fibrinogen system might prevent or treat metastasis. In fact recent studies
showed that anticoagulant therapy resulted in diminished metastasis and improved cancer
outcome [229]. We found a decrease in the serum level of a fragment of fibrinogen α chain
in the metastatic group. This fragment is not related to physiological cleavages of fibrino-
gen α chain by any of the enzymes thrombin, plasmin and hementin that are involved in
coagulation, see Figure 5.4. There might be another break down mechanism of fibrinogen
87

α chain that release such fragment in malignency. Further studies are needed to under-
stand the mechanism and regulation of the reduction of this fibrinogen α chain fragment
in metastatic breast cancer.
Limitations
Potential pitfalls usually exist in any scientific approach and we faced several chal-
lenges which accounted for a number of limitations in this project. Starting with the de-
sign of our study and due to financial constraints, we used small numbers of samples in
each experimental group. In our preliminary study, in which we identified initial peaks and
validated the approach for use in differentiating between metastatic and non-metastatic
patients, we only used 6 samples of stage I and 6 samples of stage III BC. The use of small
numbers of samples reduces the ability to identify highly predictive biomarkers or biomarker
profiles. Further complicating this issue is the fact that serum samples are considered a
major source of false discovery despite the fact that they are more attractive for biomark-
ers studies. Variability in serum samples exists at different levels of collection and storage.
Standardization of collection techniques, handling and storage will eliminate the non bi-
ological quantitative differences. We tried to confirm this with both companies for both
samples sets. One of the inevitable factors is that these samples are collected at different
phase of the tumor development and collected at different clinic visit so they reflect differ-
ent points along the the course of the tumor development. We tried to get the best match-
ing sample sets in every study, but we could not get the full details of each patients such
as menopause, genetic subtypes and stage of treatment. All these factors make it very
challenging to label an identified protein as BC specific marker that is produced by tumor
secreted protease. They will need further validation studies that follow a rigorous sample
collection protocols and using different methodology.
The subsequent validation of the preliminary biomarkers in a set of blinded and
independent serum samples (our confirmatory study with 39 total samples) showed the
88

Figure 5.3: Primary Structure of the Fibrinogen Chains up to theFirst Disulphide Bond.
Shaded sequence: thrombin binding site, sequence with boldcharacters: fibrinopeptide A and B
89

Figure 5.4: Full Length Sequence of Fibrinogen Alpha Chain.Yellow: Thrombin cleavage site to release fibrinopeptide A.
Green: Plasmin cleavage site to break down fibrin clot.Red: Hementin cleavage site to prevent coagulation.
Blue: Sequence of novel fragment (m/z 761.38).
90

potential significance of some of these biomarkers. The ability to replicate results in a
blinded test set suggests that the use of best multimarker models could differentiate be-
tween samples based on the metastatic status and not based on artifacts of processing or
on other confounding factors.
An additional issue comes from biomarker quantitation. Several factors should be
considered that might contribute to the quantitative difference in proteins levels in any
clinical samples [231]. Cancer heterogeneity and clinical samples variabilities are the two
main critical and contributing factors that should be considered [231]. Breast cancer in
particular is among the most heterogeneous cancer types. There is a complex heterogene-
ity at the inter- and intra-tumor levels. It is hard to predict that the same type of BC will
have the same alteration in protein level. Furthermore, proteins undergo cancer specific
posttranslational modification that are reflective of the tumor cells physiology and might
interfere with analysis and identification of detected serum markers [232].
Additionally, the approach we used in this study was mainly built for the study
of low M.W. peptides in biospecimens. However, the tandem MS studies that were de-
signed to identify the potential biomarkers revealed that there are lipids components ( m/z
497.27). The protocol calls for normalization of biomarker levels across all samples, but
uses a bicinchoninic acid (BCA) protein assay that quantitates protein levels but does not
detect lipids. Therefore, it is uncertain if the amount of each sample loaded into the MS
was normalized for lipid levels. It will only become accurate if the levels of lipids relative
to protein were constant.
Furthermore, the mass spectrum of the samples regularly showed overlapping or
wide peaks. This can be explained by effects from the microcapillary column that we used
for peptide separation, which is packed with POROS R1 slurry of 10 µm particle size.
This effect results in difficulty in the identification of most of the biomarkers which have
an overlapping peak adjacent to them. Therefore, their fragmentation spectrum included
fragments from the overlapping peaks as well, making conclusions from the post collision
91

spectrum very challenging. For example, the fragmentation spectrum of biomarker m/z
497.27 displayed a product ion at m/z 184.06 that indicates a phosphocholine group, but
this peak could be a fragmentation product of either the peak of interest or to the overlap-
ping peak with equal probability.
Another challenge we faced is in lipid identification. Despite that the presence of a
polar group that could hint at the lipid class, the complete structure of the identified lipid
class could not be determined. Available databases, such as lipid map, do not not provide
fragmentation data for comparison with fragmentation spectra generated from our exper-
iment. Instead it only provides list of matches according to the accurate m/z. Therefore,
further challenging lipid identification is the lack of a lipid database that includes any oxi-
dized lipids.
One of the most challenging and tedious part of our study is the data analysis,
which was performed manually. The output of LC-MS/MS of serum is very complicated,
commonly has overlaps, and ion suppression must be accounted for during the visual anal-
ysis. The size of the file from one sample spectra is between 1 to 5 GB (2500 peaks in 10
time windows = 25000 total peaks), which makes it a tedious job in the absence of an au-
tomated software. Though we tried several software programs for automated analysis, it
missed almost 80% of the potential biomarker that were detected manually. Technically,
the development of computer programs that could allow faster and accurate data analy-
sis will increase the efficiency and productiveness of analyzing many more samples within
reasonable time. Efforts could be made in this direction in the future in developing soft-
ware that can discriminate peaks, compare them and calculate the statistical differences
between cases and controls automatically.
Future Research
In this study we were able to partially identify two of the low molecular weight
serum biomarker for Breast Cancer that were detected through protoemics-based approach.
92

Further work focusing on identifying other biomolecules that are consistently present in
our high performing multimarker models, such as m/z 458.25, 722.37, 923.45 and m/z
425.25, will be valuable. In addition, running an MS/MS experiment to fragment the marker
m/z 497.27 at different chromatographic parameters to separate it from the co-eluting
peaks would help to figure out if a reduction in serum SM could reflect the stage of Breast
Cancer. It would also be very interesting to evaluate the performance of the detected mark-
ers in stage IV (distant metastatic) Breast Cancer sera. This will provide more details on
the role of these molecules in distant metastasis and if cancer cell use different metabo-
lites for their distant colonization. The proteomic evaluation of the changes in circulat-
ing molecules from stage I to stage II, stage III and stage IV could uncover the ongoing
metabolism in the progression of the Breast Cancer.
93

REFERENCES
[1] Patrick Mehlen and Alain Puisieux. Metastasis: a question of life or death. Naturereviews. Cancer, 6(6):449–58, jun 2006.
[2] Elitza Germanov, Jason N Berman, and Duane L Guernsey. Current and future ap-proaches for the therapeutic targeting of metastasis (Review). International Journalof Molecular Medicine, 18(6):1025–1036, dec 2006.
[3] Bethan Psaila, Rosandra N Kaplan, Elisa R Port, and David Lyden. Priming the’Soil’ for Breast Cancer Metastasis: The Pre-Metastatic Niche. 2007.
[4] American Cancer Society. Breast Cancer Facts and Figures 2015 - 2016. 2015.
[5] Charles Harding, Francesco Pompei, Dmitriy Burmistrov, H. Gilbert Welch, RedietAbebe, and Richard Wilson. Breast Cancer Screening, Incidence, and MortalityAcross US Counties. JAMA Internal Medicine, 175(9):1483–1489, jul 2015.
[6] Michael Alvarado, Elissa Ozanne, and Laura Esserman. Overdiagnosis and overtreat-ment of breast cancer. American Society of Clinical Oncology educational book /ASCO. American Society of Clinical Oncology. Meeting, pages e40–5, jan 2012.
[7] Jeffrey M. Allen. Economic/societal burden of metastatic breast cancer: A US per-spective. American Journal of Managed Care, 16(9):697–704, sep 2010.
[8] Ana Maria Gonzalez-Angulo, Flavia Morales-Vasquez, and Gabriel N Hortobagyi.Overview of resistance to systemic therapy in patients with breast cancer. Advancesin experimental medicine and biology, 608:1–22, jan 2007.
[9] Olivia Jane Scully, Boon-Huat Bay, George Yip, and Yingnan Yu. Breast CancerMetastasis. Cancer Genomics Proteomics, 9(5):311–320, sep 2012.
[10] Jiapei Ho, Jacklyn-Wai-Fun Kong, Lee-Yee Choong, Marie-Chiew-Shia Loh, WeiyiToy, Poh-Kuan Chong, Chee-Hong Wong, Chow-Yin Wong, Nilesh Shah, and Yoon-Pin Lim. Novel breast cancer metastasis-associated proteins. Journal of proteomeresearch, 8(2):583–94, feb 2009.
[11] Da-Qiang Li, Lei Wang, Fei Fei, Yi-Feng Hou, Jian-Min Luo, Rong Zeng, Jiong Wu,Jin-Song Lu, Gen-Hong Di, Zhou-Luo Ou, Qi-Chang Xia, Zhen-Zhou Shen, and Zhi-Min Shao. Identification of breast cancer metastasis-associated proteins in an iso-genic tumor metastasis model using two-dimensional gel electrophoresis and liquidchromatography-ion trap-mass spectrometry. Proteomics, 6(11):3352–68, jun 2006.
[12] Thomas E Rohan, Xiaonan Xue, Hung-Mo Lin, Timothy M D’Alfonso, Paula S Gin-ter, Maja H Oktay, Brian D Robinson, Mindy Ginsberg, Frank B Gertler, Andrew GGlass, Joseph A Sparano, John S Condeelis, and Joan G Jones. Tumor microenvi-ronment of metastasis and risk of distant metastasis of breast cancer. Journal of theNational Cancer Institute, 106(8):dju136—-, aug 2014.
94

[13] Z Chen, S Xu, D Su, W Liu, H Yang, S Xie, X Meng, L Lei, and X Wang. A newtumor biomarker, serum protein peak at 3,144 m/z, in patients with node-positivebreast cancer. Clinical {&} translational oncology : official publication of the Feder-ation of Spanish Oncology Societies and of the National Cancer Institute of Mexico,17(6):486–494, jun 2015.
[14] Britta Weigelt, Johannes L Peterse, and Laura J van ’t Veer. Breast cancer metasta-sis: markers and models. Nature reviews. Cancer, 5(8):591–602, aug 2005.
[15] C M Perou, T Sørlie, M B Eisen, M van de Rijn, S S Jeffrey, C a Rees, J R Pollack,D T Ross, H Johnsen, L a Akslen, O Fluge, a Pergamenschikov, C Williams, S XZhu, P E Lønning, a L Børresen-Dale, P O Brown, and D Botstein. Molecular por-traits of human breast tumours. Nature, 406(6797):747–752, aug 2000.
[16] Bedrich L Eckhardt, Prudence a Francis, Belinda S Parker, and Robin L Anderson.Strategies for the discovery and development of therapies for metastatic breast can-cer. Nature reviews. Drug discovery, 11(6):479–97, jun 2012.
[17] C. Van Poznak, M. R. Somerfield, R. C. Bast, M. Cristofanilli, M. P. Goetz, A. M.Gonzalez-Angulo, D. G. Hicks, E. G. Hill, M. C. Liu, W. Lucas, I. A. Mayer, R. G.Mennel, W. F. Symmans, D. F. Hayes, and L. N. Harris. Use of Biomarkers to GuideDecisions on Systemic Therapy for Women With Metastatic Breast Cancer: Ameri-can Society of Clinical Oncology Clinical Practice Guideline. Journal of ClinicalOncology, 33(24):2695–2704, jul 2015.
[18] Lyndsay N Harris, Nofisat Ismaila, Lisa M McShane, Fabrice Andre, Deborah ECollyar, Ana M Gonzalez-Angulo, Elizabeth H Hammond, Nicole M Kuderer,Minetta C Liu, Robert G Mennel, Cathy van Poznak, Robert C Bast, and Daniel FHayes. Use of Biomarkers to Guide Decisions on Adjuvant Systemic Therapy forWomen With Early-Stage Invasive Breast Cancer: American Society of Clinical On-cology Clinical Practice Guideline. Journal of clinical oncology : official journal ofthe American Society of Clinical Oncology, pages JCO.2015.65.2289–, feb 2016.
[19] S.W. Lam, C.R. Jimenez, and E. Boven. Breast cancer classification by proteomictechnologies: Current state of knowledge. Cancer Treatment Reviews, 40(1):129–138,feb 2014.
[20] Robert T Lawrence, Elizabeth M Perez, Daniel Hernandez, Chris P Miller, Kelsey MHaas, Hanna Y Irie, Su-In Lee, C Anthony Blau, and Judit Villen. The ProteomicLandscape of Triple-Negative Breast Cancer. Cell reports, 11(4):630–44, apr 2015.
[21] Isaiah J Fidler and Margaret L Kripke. The challenge of targeting metastasis. Can-cer metastasis reviews, 34(4):635–41, dec 2015.
[22] Yun Gao, ShenHua Xu, Wenming Cao, Zhanhong Chen, Xiaojia Wang, and De-hong Zou. Serum biomarker 3144 m/z for prognostic detection in Chinese post-menopausal breast cancer patients. Journal of cancer research and therapeutics, 11Suppl 1(5):C68–73, aug 2015.
95

[23] Yanzhi Zhang, Jiali Dai, Keely M McNamara, Bing Bai, Mumu Shi, Monica S MChan, Ming Liu, Hironobu Sasano, Xiuli Wang, Xiaolei Li, Lijuan Liu, Ying Ma,Shuwen Cao, Yanchun Xing, Baoshan Zhao, Yinli Song, and Lin Wang. Prognos-tic significance of proline, glutamic acid, leucine rich protein 1 (PELP1) in triple-negative breast cancer: a retrospective study on 129 cases. BMC cancer, 15:699, jan2015.
[24] E Senkus, S Kyriakides, F Penault-Llorca, P Poortmans, A Thompson, S Zackrisson,and F Cardoso. Primary breast cancer: ESMO Clinical Practice Guidelines for diag-nosis, treatment and follow-up. Annals of oncology : official journal of the EuropeanSociety for Medical Oncology / ESMO, 24 Suppl 6:vi7–23, oct 2013.
[25] Lucille Leong. Clinical Relevance of Targeting Cancer Metastases, 2000.
[26] Ian Carr and Jean Carr. The Origin of Cancer Metastasis., jan 2005.
[27] S Paget. The distribution of secondary growths in cancer of the breast. 1889. Cancermetastasis reviews, 8(2):98–101, aug 1989.
[28] I R Hart and I J Fidler. Role of organ selectivity in the determination of metastaticpatterns of B16 melanoma. Cancer research, 40(7):2281–7, jul 1980.
[29] Josef Maryas, Jakub Faktor, Monika Dvoakova, Iva Struharova, Peter Grell, andPavel Bouchal. Proteomics in investigation of cancer metastasis: functional and clin-ical consequences and methodological challenges. Proteomics, 14(4-5):426–40, mar2014.
[30] L Borsig, M J Wolf, M Roblek, A Lorentzen, and M Heikenwalder. Inflammatorychemokines and metastasis–tracing the accessory. Oncogene, 33(25):3217–24, jun2014.
[31] Kent W Hunter, Nigel P S Crawford, and Jude Alsarraj. Mechanisms of metastasis.Breast cancer research : BCR, 10 Suppl 1:S2, jan 2008.
[32] Patricia S Steeg. Tumor metastasis: mechanistic insights and clinical challenges.Nature medicine, 12(8):895–904, aug 2006.
[33] Jonathan P Sleeman, Gerhard Christofori, Riccardo Fodde, John G Collard, GeertBerx, Charles Decraene, and Curzio Ruegg. Concepts of metastasis in flux: the stro-mal progression model. Seminars in cancer biology, 22(3):174–186, jun 2012.
[34] Sergej Skvortsov, Christoph R Arnold, Paul Debbage, Peter Lukas, and IraSkvortsova. Proteomic approach to understand metastatic spread. Proteomics. Clini-cal applications, 9(11-12):1069–77, dec 2015.
[35] Christoph A Klein. Parallel progression of primary tumours and metastases. Naturereviews. Cancer, 9(4):302–12, apr 2009.
96

[36] Scott Valastyan and Robert A Weinberg. Tumor metastasis: molecular insights andevolving paradigms. Cell, 147(2):275–92, oct 2011.
[37] Yun-Fan Sun, Xin-Rong Yang, Jian Zhou, Shuang-Jian Qiu, Jia Fan, and Yang Xu.Circulating tumor cells: advances in detection methods, biological issues, and clinicalrelevance. Journal of cancer research and clinical oncology, 137(8):1151–73, aug 2011.
[38] Johanna A Joyce and Jeffrey W Pollard. Microenvironmental regulation of metasta-sis. Nature reviews. Cancer, 9(4):239–252, apr 2009.
[39] Hector Peinado, Simon Lavotshkin, and David Lyden. The secreted factors respon-sible for pre-metastatic niche formation: old sayings and new thoughts. Seminars incancer biology, 21(2):139–146, apr 2011.
[40] Lucy Mathot and Johan Stenninger. Behavior of seeds and soil in the mechanism ofmetastasis: a deeper understanding. Cancer science, 103(4):626–31, apr 2012.
[41] Lisa Hutchinson. Understanding metastasis. Nature reviews. Clinical oncology,12(5):247, may 2015.
[42] Stephan Braun and Bjørn Naume. Circulating and disseminated tumor cells. Journalof clinical oncology : official journal of the American Society of Clinical Oncology,23(8):1623–6, mar 2005.
[43] Elen K Møller, Parveen Kumar, Thierry Voet, April Peterson, Peter Van Loo,Randi R Mathiesen, Renathe Fjelldal, Jason Grundstad, Elin Borgen, Lars O Baum-busch, Bjørn Naume, Anne-Lise Børresen-Dale, Kevin P White, Silje Nord, and Ves-sela N Kristensen. Next-generation sequencing of disseminated tumor cells. Frontiersin oncology, 3:320, jan 2013.
[44] Daniela F Quail and Johanna A Joyce. Microenvironmental regulation of tumorprogression and metastasis. Nature medicine, 19(11):1423–37, nov 2013.
[45] Marc Lacroix. Significance, detection and markers of disseminated breast cancercells. Endocrine-related cancer, 13(4):1033–67, dec 2006.
[46] Nilay Sethi and Yibin Kang. Unravelling the complexity of metastasismolecular un-derstanding and targeted therapies. Nature Reviews Cancer, 11(10):735–748, 2011.
[47] Jonathan P Sleeman. The metastatic niche and stromal progression. Cancer metas-tasis reviews, 31(3-4):429–440, dec 2012.
[48] Alanna Skuse. Constructions of Cancer in Early Modern England: Ravenous Na-tures. Palgrave Macmillan, 2015.
[49] Fan Zhang and Jake Y Chen. Breast cancer subtyping from plasma proteins. BMCmedical genomics, 6 Suppl 1(Suppl 1):S6, jan 2013.
97

[50] Tieneke B M Schaaij-Visser, Meike De Wit, Siu W. Lam, and Connie R. Jimenez.The cancer secretome, current status and opportunities in the lung, breast and col-orectal cancer context. Biochimica et Biophysica Acta - Proteins and Proteomics,1834(11):2242–2258, nov 2013.
[51] Monika Pietrowska, Karol Jelonek, Malwina Michalak, Magorzata Ros, PaweRodziewicz, Klaudia Chmielewska, Krzysztof Polaski, Joanna Polaska, AgnieszkaGdowicz-Kosok, Monika Giglok, Rafa Suwiski, Rafa Tarnawski, Rafa Dziadziuszko,Witold Rzyman, and Piotr Widak. Identification of serum proteome components as-sociated with progression of non-small cell lung cancer. Acta biochimica Polonica,61(2):325–31, jan 2014.
[52] Bethan Psaila and David Lyden. The metastatic niche: adapting the foreign soil.Nature reviews. Cancer, 9(4):285–293, apr 2009.
[53] Daniela Spano, Chantal Heck, Pasqualino De Antonellis, Gerhard Christofori, andMassimo Zollo. Molecular networks that regulate cancer metastasis. Seminars incancer biology, 22(3):234–49, jun 2012.
[54] Rosandra N Kaplan, Rebecca D Riba, Stergios Zacharoulis, Anna H Bramley, LoıcVincent, Carla Costa, Daniel D MacDonald, David K Jin, Koji Shido, Scott AKerns, Zhenping Zhu, Daniel Hicklin, Yan Wu, Jeffrey L Port, Nasser Altorki,Elisa R Port, Davide Ruggero, Sergey V Shmelkov, Kristian K Jensen, Shahin Rafii,and David Lyden. VEGFR1-positive haematopoietic bone marrow progenitors initi-ate the pre-metastatic niche. Nature, 438(7069):820–827, dec 2005.
[55] Rosandra N Kaplan, Shahin Rafii, and David Lyden. Preparing the ”soil”: thepremetastatic niche. Cancer research, 66(23):11089–11093, dec 2006.
[56] Dan G Duda and Rakesh K Jain. Premetastatic lung ”niche”: is vascular endothelialgrowth factor receptor 1 activation required? Cancer research, 70(14):5670–3, jul2010.
[57] Johanna A Joyce and Jeffrey W Pollard. Microenvironmental regulation of metasta-sis. Nature reviews. Cancer, 9(4):239–52, apr 2009.
[58] Cyrus M Ghajar, Hector Peinado, Hidetoshi Mori, Irina R Matei, Kimberley J Eva-son, Helene Brazier, Dena Almeida, Antonius Koller, Katherine A Hajjar, DidierY R Stainier, Emily I Chen, David Lyden, and Mina J Bissell. The perivascularniche regulates breast tumour dormancy. Nature cell biology, 15(7):807–17, jul 2013.
[59] Alice Zoccoli, Michele Iuliani, Francesco Pantano, Marco Imperatori, Salvatore In-tagliata, Bruno Vincenzi, Paolo Marchetti, Nicola Papapietro, Vincenzo Denaro,Giuseppe Tonini, and Daniele Santini. Premetastatic niche: ready for new thera-peutic interventions? Expert opinion on therapeutic targets, 16 Suppl 2:S119–29, apr2012.
98

[60] Jaclyn Sceneay, Mark J. Smyth, and Andreas Moller. The pre-metastatic niche:Finding common ground. Cancer and Metastasis Reviews, 32(3-4):449–464, dec 2013.
[61] Sachie Hiratsuka, Kazuhiro Nakamura, Shinobu Iwai, Masato Murakami, TakeshiItoh, Hiroshi Kijima, J. Michael Shipley, Robert M. Senior, and Masabumi Shibuya.MMP9 induction by vascular endothelial growth factor receptor-1 is involved in lung-specific metastasis. Cancer Cell, 2(4):289–300, oct 2002.
[62] Fanghui Ren, Ruixue Tang, Xin Zhang, Wickramaarachchi Mihiranganee Madushi,Dianzhong Luo, Yiwu Dang, Zuyun Li, Kanglai Wei, and Gang Chen. Overexpres-sion of MMP Family Members Functions as Prognostic Biomarker for Breast CancerPatients: A Systematic Review and Meta-Analysis. PloS one, 10(8):e0135544, jan2015.
[63] Fanghui Ren, Ruixue Tang, Xin Zhang, Wickramaarachchi Mihiranganee Madushi,Dianzhong Luo, Yiwu Dang, Zuyun Li, Kanglai Wei, and Gang Chen. Overexpres-sion of MMP Family Members Functions as Prognostic Biomarker for Breast CancerPatients: A Systematic Review and Meta-Analysis. PloS one, 10(8):e0135544, jan2015.
[64] Marco Gerlinger, Andrew J Rowan, Stuart Horswell, James Larkin, David Endes-felder, Eva Gronroos, Pierre Martinez, Nicholas Matthews, Aengus Stewart, PatrickTarpey, Ignacio Varela, Benjamin Phillimore, Sharmin Begum, Neil Q McDonald,Adam Butler, David Jones, Keiran Raine, Calli Latimer, Claudio R Santos, MahrokhNohadani, Aron C Eklund, Bradley Spencer-Dene, Graham Clark, Lisa Pickering,Gordon Stamp, Martin Gore, Zoltan Szallasi, Julian Downward, P Andrew Futreal,and Charles Swanton. Intratumor heterogeneity and branched evolution revealed bymultiregion sequencing. The New England journal of medicine, 366(10):883–92, mar2012.
[65] Lisa Y Pang and David J Argyle. The evolving cancer stem cell paradigm: im-plications in veterinary oncology. Veterinary journal (London, England : 1997),205(2):154–60, aug 2015.
[66] P M Harari. Epidermal growth factor receptor inhibition strategies in oncology.Endocrine-related cancer, 11(4):689–708, dec 2004.
[67] Madhu Kalia. Biomarkers for personalized oncology: recent advances and futurechallenges. Metabolism: clinical and experimental, 64(3 Suppl 1):S16–21, mar 2015.
[68] Lyndsay Harris, Herbert Fritsche, Robert Mennel, Larry Norton, Peter Ravdin,Sheila Taube, Mark R Somerfield, Daniel F Hayes, and Robert C Bast. AmericanSociety of Clinical Oncology 2007 update of recommendations for the use of tumormarkers in breast cancer. Journal of clinical oncology : official journal of the Ameri-can Society of Clinical Oncology, 25(33):5287–312, nov 2007.
99

[69] Naren Ramakrishna, Sarah Temin, Sarat Chandarlapaty, Jennie R Crews, Nancy EDavidson, Francisco J Esteva, Sharon H Giordano, Ana M Gonzalez-Angulo, Jef-frey J Kirshner, Ian Krop, Jennifer Levinson, Shanu Modi, Debra A Patt, Edith APerez, Jane Perlmutter, Eric P Winer, and Nancy U Lin. Recommendations on dis-ease management for patients with advanced human epidermal growth factor recep-tor 2-positive breast cancer and brain metastases: American Society of Clinical On-cology clinical practice guideline. Journal of clinical oncology : official journal of theAmerican Society of Clinical Oncology, 32(19):2100–8, jul 2014.
[70] James L Khatcheressian, Patricia Hurley, Elissa Bantug, Laura J Esserman, EvaGrunfeld, Francine Halberg, Alexander Hantel, N Lynn Henry, Hyman B Muss,Thomas J Smith, Victor G Vogel, Antonio C Wolff, Mark R Somerfield, andNancy E Davidson. Breast cancer follow-up and management after primary treat-ment: American Society of Clinical Oncology clinical practice guideline update.Journal of clinical oncology : official journal of the American Society of Clinical On-cology, 31(7):961–5, mar 2013.
[71] Klaus Pantel and Catherine Alix-Panabieres. Liquid biopsy: Potential and chal-lenges. Molecular oncology, 10(3):371, 2016.
[72] Klaus Pantel and Catherine Alix-Panabieres. Real-time liquid biopsy in cancer pa-tients: fact or fiction? Cancer research, 73(21):6384–8, nov 2013.
[73] World Health Organization. Biomarkers In Risk Assessment: Validity And Valida-tion, 2001.
[74] Anant Narayan Bhatt, Rohit Mathur, Abdullah Farooque, Amit Verma, and B SDwarakanath. Cancer biomarkers - current perspectives. The Indian journal of med-ical research, 132:129–49, aug 2010.
[75] N Lynn Henry and Daniel F Hayes. Cancer biomarkers. Molecular oncology,6(2):140–146, apr 2012.
[76] Sunali Mehta, Andrew Shelling, Anita Muthukaruppan, Annette Lasham, CherieBlenkiron, George Laking, and Cristin Print. Predictive and prognostic molecularmarkers for cancer medicine. Therapeutic advances in medical oncology, 2(2):125–148, mar 2010.
[77] Charles L Sawyers. The cancer biomarker problem. Nature, 452(7187):548–552, 2008.
[78] Komal Kedia, Caitlin A. Nichols, Craig D. Thulin, and Steven W. Graves. Novelomics approach for study of low-abundance, low-molecular-weight components of acomplex biological tissue: regional differences between chorionic and basal plates ofthe human placenta. Analytical and Bioanalytical Chemistry, 407(28):8543–56, nov2015.
[79] Rui Chen and Michael Snyder. Systems biology: personalized medicine for the fu-ture? Current opinion in pharmacology, 12(5):623–628, oct 2012.
100

[80] M. Uhlen, L. Fagerberg, B. M. Hallstrom, C. Lindskog, P. Oksvold, A. Mardinoglu,A. Sivertsson, C. Kampf, E. Sjostedt, A. Asplund, I. Olsson, K. Edlund, E. Lund-berg, S. Navani, C. A.-K. Szigyarto, J. Odeberg, D. Djureinovic, J. O. Takanen,S. Hober, T. Alm, P.-H. Edqvist, H. Berling, H. Tegel, J. Mulder, J. Rockberg,P. Nilsson, J. M. Schwenk, M. Hamsten, K. von Feilitzen, M. Forsberg, L. Persson,F. Johansson, M. Zwahlen, G. von Heijne, J. Nielsen, and F. Ponten. Tissue-basedmap of the human proteome. Science, 347(6220):1260419–1260419, jan 2015.
[81] P C Herrmann, L A Liotta, and E F Petricoin. Cancer proteomics: the state of theart. Disease markers, 17(2):49–57, jan 2001.
[82] Yaoyang Zhang, Bryan R Fonslow, Bing Shan, Moon-Chang Baek, and John RYates. Protein analysis by shotgun/bottom-up proteomics. Chemical reviews,113(4):2343–2394, apr 2013.
[83] Hem D. Shukla, Javed Mahmood, and Zeljko Vujaskovic. Integrated proteo-genomicapproach for early diagnosis and prognosis of cancer. Cancer Letters, 369(1):28–36,dec 2015.
[84] B Schwikowski, P Uetz, and S Fields. A network of protein-protein interactions inyeast. Nature biotechnology, 18(12):1257–61, dec 2000.
[85] Lyris M F de Godoy, Jesper V Olsen, Jurgen Cox, Michael L Nielsen, Nina C Hub-ner, Florian Frohlich, Tobias C Walther, and Matthias Mann. Comprehensive mass-spectrometry-based proteome quantification of haploid versus diploid yeast. Nature,455(7217):1251–4, oct 2008.
[86] Dennis Orton and Alan Doucette. Proteomic Workflows for Biomarker IdentificationUsing Mass Spectrometry Technical and Statistical Considerations during InitialDiscovery. Proteomes, 1(2):109–127, aug 2013.
[87] Benjamin C Orsburn. SILAC in biomarker discovery. Methods in molecular biology(Clifton, N.J.), 1002:123–31, jan 2013.
[88] Guoan Zhang, Beatrix M Ueberheide, Sofia Waldemarson, Sunnie Myung, KellyMolloy, Jan Eriksson, Brian T Chait, Thomas A Neubert, and David Fenyo. Pro-tein quantitation using mass spectrometry. Methods in molecular biology (Clifton,N.J.), 673:211–222, jan 2010.
[89] Sander R Piersma, Ulrike Fiedler, Simone Span, Andreas Lingnau, Thang V Pham,Steffen Hoffmann, Michael H G Kubbutat, and Connie R Jimenez. Workflow com-parison for label-free, quantitative secretome proteomics for cancer biomarker discov-ery: method evaluation, differential analysis, and verification in serum. Journal ofproteome research, 9(4):1913–22, apr 2010.
[90] Steve Goodison and Virginia Urquidi. Breast tumor metastasis: analysis via pro-teomic profiling. Expert review of proteomics, 5(3):457–67, jun 2008.
101

[91] J R Yates. Mass spectrometry and the age of the proteome. Journal of mass spec-trometry : JMS, 33(1):1–19, jan 1998.
[92] A J Link, J Eng, D M Schieltz, E Carmack, G J Mize, D R Morris, B M Garvik, andJ R Yates. Direct analysis of protein complexes using mass spectrometry. Naturebiotechnology, 17(7):676–82, jul 1999.
[93] D A Wolters, M P Washburn, and J R Yates. An automated multidimensionalprotein identification technology for shotgun proteomics. Analytical chemistry,73(23):5683–90, dec 2001.
[94] Bogdan Bogdanov and Richard D Smith. Proteomics by FTICR mass spectrometry:top down and bottom up. Mass spectrometry reviews, 24(2):168–200, jan.
[95] Claudia Martelli, Federica Iavarone, Federica Vincenzoni, Tiziana Cabras, BarbaraManconi, Claudia Desiderio, Irene Messana, and Massimo Castagnola. Top-downpeptidomics of bodily fluids. Peptidomics, 1(1):47–64, 2014.
[96] Siu Kwan Sze, Ying Ge, HanBin Oh, and Fred W McLafferty. Top-down mass spec-trometry of a 29-kDa protein for characterization of any posttranslational modifica-tion to within one residue. Proceedings of the National Academy of Sciences of theUnited States of America, 99(4):1774–1779, feb 2002.
[97] John C Tran, Leonid Zamdborg, Dorothy R Ahlf, Ji Eun Lee, Adam D Catherman,Kenneth R Durbin, Jeremiah D Tipton, Adaikkalam Vellaichamy, John F Kellie,Mingxi Li, Cong Wu, Steve M M Sweet, Bryan P Early, Nertila Siuti, Richard DLeDuc, Philip D Compton, Paul M Thomas, and Neil L Kelleher. Mapping in-tact protein isoforms in discovery mode using top-down proteomics. Nature,480(7376):254–258, dec 2011.
[98] Dong Huey Cheon, Eun Ji Nam, Kyu Hyung Park, Se Joon Woo, Hye Jin Lee,Hee Cheol Kim, Eun Gyeong Yang, Cheolju Lee, and Ji Eun Lee. Comprehensiveanalysis of low-molecular-weight human plasma proteome using top-down mass spec-trometry. Journal of proteome research, 15(1):229–244, 2015.
[99] Leroi V DeSouza and K W Michael Siu. Mass spectrometry-based quantification.Clinical biochemistry, 46(6):421–31, apr 2013.
[100] Waltraud X Schulze and Bjorn Usadel. Quantitation in mass-spectrometry-basedproteomics. Annual review of plant biology, 61:491–516, jan 2010.
[101] Lance A Liotta and Emanuel F Petricoin. Serum peptidome for cancer detection:spinning biologic trash into diagnostic gold. The Journal of clinical investigation,116(1):26–30, jan 2006.
[102] Helena Backvall and Janne Lehtio. The Low Molecular Weight Proteome. 2013.
102

[103] Lance A Liotta and Emanuel F Petricoin. Serum peptidome for cancer detection:spinning biologic trash into diagnostic gold. The Journal of clinical investigation,116(1):26–30, jan 2006.
[104] Emanuel F Petricoin, Claudio Belluco, Robyn P Araujo, and Lance a Liotta. Theblood peptidome: a higher dimension of information content for cancer biomarkerdiscovery. Nature reviews. Cancer, 6(12):961–7, nov 2006.
[105] Mirre E de Noo, Andre Deelder, Martijn van der Werff, Aliye Ozalp, Bart Mertens,and Rob Tollenaar. MALDI-TOF Serum Protein Profiling for the Detection ofBreast Cancer. Onkologie, 29(11):501–506, nov 2006.
[106] Emanuel F Petricoin, Ali M Ardekani, Ben A Hitt, Peter J Levine, Vincent AFusaro, Seth M Steinberg, Gordon B Mills, Charles Simone, David A Fishman,Elise C Kohn, and Lance A Liotta. Use of proteomic patterns in serum to identifyovarian cancer. Lancet (London, England), 359(9306):572–7, feb 2002.
[107] N Leigh Anderson and Norman G Anderson. The human plasma proteome: his-tory, character, and diagnostic prospects. Molecular & cellular proteomics : MCP,1(11):845–67, nov 2002.
[108] Loıc Dayon and Martin Kussmann. Proteomics of human plasma: A critical compar-ison of analytical workflows in terms of effort, throughput and outcome. EuPA OpenProteomics, 1:8–16, 2013.
[109] Man Wu, Manlin Cao, Yiqing He, Yiwen Liu, Cuixia Yang, Yan Du, Wenjuan Wang,and Feng Gao. A novel role of low molecular weight hyaluronan in breast cancermetastasis. The FASEB Journal, 1(4):1–9, apr 2014.
[110] Richard Kay, Chris Barton, Lucy Ratcliffe, Balwir Matharoo-Ball, Pamela Brown,Jane Roberts, Phil Teale, and Colin Creaser. Enrichment of low molecular weightserum proteins using acetonitrile precipitation for mass spectrometry based pro-teomic analysis. Rapid Communications in Mass Spectrometry, 22(20):3255–3260,oct 2008.
[111] R. S. Tirumalai. Characterization of the Low Molecular Weight Human Serum Pro-teome. Molecular & Cellular Proteomics, 2(10):1096–1103, jul 2003.
[112] David W Greening, Rosemary L Sparrow, and Richard J Simpson. Serum/PlasmaProteomics, volume 728 of Methods in Molecular Biology. Humana Press, Totowa,NJ, 2011.
[113] R. S. Tirumalai. Characterization of the Low Molecular Weight Human Serum Pro-teome. Molecular & Cellular Proteomics, 2(10):1096–1103, jul 2003.
[114] Brian L Hood, David E Malehorn, Thomas P Conrads, and William L Bigbee. Tu-mor Biomarker Discovery. Methods in Molecular Biology, 520:107–128, 2009.
103

[115] Andrej Shevchenko, Henrik Tomas, Jan Havlis, Jesper V Olsen, and Matthias Mann.In-gel digestion for mass spectrometric characterization of proteins and proteomes.Nature protocols, 1(6):2856–60, jan 2006.
[116] P H O’Farrell. High resolution two-dimensional electrophoresis of proteins. TheJournal of biological chemistry, 250(10):4007–4021, may 1975.
[117] Rembert Pieper, Christine L Gatlin, Andrew M McGrath, Anthony J Makusky,Madhu Mondal, Michael Seonarain, Erin Field, Courtney R Schatz, Marla A Estock,Nasir Ahmed, Norman G Anderson, and Sandra Steiner. Characterization of thehuman urinary proteome: a method for high-resolution display of urinary proteinson two-dimensional electrophoresis gels with a yield of nearly 1400 distinct proteinspots. Proteomics, 4(4):1159–74, apr 2004.
[118] Matthew P Welberry Smith, Steven L Wood, Alexandre Zougman, Jenny T C Ho,Jianhe Peng, David Jackson, David A Cairns, Andrew J P Lewington, Peter J Selby,and Rosamonde E Banks. A systematic analysis of the effects of increasing degreesof serum immunodepletion in terms of depth of coverage and other key aspects intop-down and bottom-up proteomic analyses. Proteomics, 11(11):2222–2235, jun2011.
[119] James Martosella, Nina Zolotarjova, Hongbin Liu, Gordon Nicol, and Barry E.Boyes. Reversed-phase high-performance liquid chromatographic prefractionationof immunodepleted human serum proteins to enhance mass spectrometry identifica-tion of lower-abundant proteins. Journal of Proteome Research, 4(5):1522–1537, jan2005.
[120] Anna Laura Capriotti, Giuseppe Caruso, Chiara Cavaliere, Susy Piovesana, RobertoSamperi, and Aldo Lagana. Comparison of three different enrichment strategiesfor serum low molecular weight protein identification using shotgun proteomics ap-proach. Analytica chimica acta, 740:58–65, aug 2012.
[121] N. L. Anderson. The Human Plasma Proteome: History, Character, and DiagnosticProspects. Molecular & Cellular Proteomics, 2(1):50–50, jan 2003.
[122] Karen Merrell, Katie Southwick, Steven W Graves, M Sean Esplin, Nathan E Lewis,and Craig D Thulin. Analysis of low-abundance, low-molecular-weight serum pro-teins using mass spectrometry. Journal of biomolecular techniques : JBT, 15(4):238–248, dec 2004.
[123] Ruijun Tian, He Zhang, Mingliang Ye, Xiaogang Jiang, Lianghai Hu, Xin Li, XinheBao, and Hanfa Zou. Selective extraction of peptides from human plasma by highlyordered mesoporous silica particles for peptidome analysis. Angewandte Chemie (In-ternational ed. in English), 46(6):962–5, jan 2007.
[124] John M Koomen, Donghui Li, Lian-chun Xiao, Thomas C Liu, Kevin R Coombes,James Abbruzzese, and Ryuji Kobayashi. Direct tandem mass spectrometry reveals
104

limitations in protein profiling experiments for plasma biomarker discovery. Journalof proteome research, 4(3):972–81, jan 2005.
[125] Xiaoyang Zheng, Haven Baker, and William S Hancock. Analysis of the low molecu-lar weight serum peptidome using ultrafiltration and a hybrid ion trap-Fourier trans-form mass spectrometer. Journal of chromatography. A, 1120(1-2):173–84, jul 2006.
[126] Oleg Chertov, Arya Biragyn, Larry W Kwak, John T Simpson, Tatiana Boronina,Van M Hoang, DaRue A Prieto, Thomas P Conrads, Timothy D Veenstra, andRobert J Fisher. Organic solvent extraction of proteins and peptides from serumas an effective sample preparation for detection and identification of biomarkers bymass spectrometry. Proteomics, 4(4):1195–203, apr 2004.
[127] MeiHwa Tanielle Bench Alvarez, Dipti Jigar Shah, Craig D Thulin, and Steven WGraves. Tissue proteomics of the low-molecular weight proteome using an integratedcLC-ESI-QTOFMS approach. Proteomics, 13(9):1400–11, may 2013.
[128] Karen Merrell, Craig D Thulin, M Sean Esplin, and Steven W Graves. An integratedserum proteomic approach capable of monitoring the low molecular weight proteomewith sequencing of intermediate to large peptides. Rapid communications in massspectrometry : RCM, 23(17):2685–96, sep 2009.
[129] Mitch Dowsett, Torsten O Nielsen, Roger A’Hern, John Bartlett, R CharlesCoombes, Jack Cuzick, Matthew Ellis, N Lynn Henry, Judith C Hugh, Tracy Lively,Lisa McShane, Soon Paik, Frederique Penault-Llorca, Ljudmila Prudkin, MeredithRegan, Janine Salter, Christos Sotiriou, Ian E Smith, Giuseppe Viale, Jo Anne Zu-jewski, and Daniel F Hayes. Assessment of Ki67 in breast cancer: recommendationsfrom the International Ki67 in Breast Cancer working group. Journal of the NationalCancer Institute, 103(22):1656–1664, nov 2011.
[130] N Harbeck, M Schmitt, C Meisner, C Friedel, M Untch, M Schmidt, C G JSweep, B W Lisboa, M P Lux, T Beck, S Hasmuller, M Kiechle, F Janicke, andC Thomssen. Ten-year analysis of the prospective multicentre Chemo-N0 trial val-idates American Society of Clinical Oncology (ASCO)-recommended biomarkers uPAand PAI-1 for therapy decision making in node-negative breast cancer patients. Eu-ropean journal of cancer (Oxford, England : 1990), 49(8):1825–35, may 2013.
[131] Yixin Liu, Ru Ji, Jingyong Li, Qiang Gu, Xiulan Zhao, Tao Sun, Jinjing Wang,Jiangbo Li, Qiuyue Du, and Baocun Sun. Correlation effect of EGFR and CXCR4and CCR7 chemokine receptors in predicting breast cancer metastasis and prognosis.Journal of experimental {&} clinical cancer research : CR, 29:16, jan 2010.
[132] Jules A Westbrook, David A Cairns, Jianhe Peng, Valerie Speirs, Andrew M Hanby,Ingunn Holen, Steven L Wood, Penelope D Ottewell, Helen Marshall, Rozalind EBanks, Peter J Selby, Robert E Coleman, and Janet E Brown. CAPG and GIPC1:Breast Cancer Biomarkers for Bone Metastasis Development and Treatment. Journalof the National Cancer Institute, 108(4):djv360–, apr 2016.
105

[133] R.E. Coleman. Metastatic bone disease: clinical features, pathophysiology and treat-ment strategies. Cancer Treatment Reviews, 27(3):165–176, jun 2001.
[134] E F Solomayer, I J Diel, G C Meyberg, C Gollan, and G Bastert. Metastatic breastcancer: clinical course, prognosis and therapy related to the first site of metastasis.Breast cancer research and treatment, 59(3):271–8, feb 2000.
[135] Hui-Hua Lee, Chu-Ai Lim, Yew-Teik Cheong, Manjit Singh, and Lay-Harn Gam.Comparison of protein expression profiles of different stages of lymph nodes metasta-sis in breast cancer. Int J Biol Sci, 8(3):353–362, 2012.
[136] Jeong-Eun Lee, Pyong-Gon Moon, Young-Eun Cho, Young-Bum Kim, In-San Kim,Hoyong Park, and Moon-Chang Baek. Identification of EDIL3 on extracellular vesi-cles involved in breast cancer cell invasion. Journal of proteomics, 131:17–28, jan2016.
[137] Hong-Lin Jiang, He-Fen Sun, Shui-Ping Gao, Liang-Dong Li, Xin Hu, Jiong Wu, andWei Jin. Loss of RAB1B promotes triple-negative breast cancer metastasis by acti-vating TGF-β/SMAD signaling. Oncotarget, 6(18):16352–65, jun 2015.
[138] Somayeh Hooshmand, Abbas Ghaderi, Khatijah Yusoff, Thilakavathy Karrupiah,Rozita Rosli, and Zahra Mojtahedi. Downregulation of RhoGDI?? increased migra-tion and invasion of ER + MCF7 and ER- MDA-MB-231 breast cancer cells. CellAdhesion and Migration, 7(3):297–303, jan 2013.
[139] LI Jia-tao, LI Hui, and HU Guo-hong. STC1 expression in breast cancer is corre-lated with breast cancer lung metastasis. Fudan Xuebao (Yixueban), 2015.
[140] Alexandra Naba, Karl R Clauser, John M Lamar, Steven A Carr, and Richard OHynes. Extracellular matrix signatures of human mammary carcinoma identify novelmetastasis promoters. eLife, 3:e01308, jan 2014.
[141] Mikkel G. Terp, Rikke R. Lund, Ole N. Jensen, Rikke Leth-Larsen, and Henrik J.Ditzel. Identification of markers associated with highly aggressive metastatic pheno-types using quantitative comparative proteomics. Cancer Genomics and Proteomics,9(5):265–273, jan 2012.
[142] Yilin Xu, Xin D Gao, Jae-Hyung Lee, Huilin Huang, Haiyan Tan, Jaegyoon Ahn,Lauren M Reinke, Marcus E Peter, Yue Feng, David Gius, Kalliopi P Siziopikou,Junmin Peng, Xinshu Xiao, and Chonghui Cheng. Cell type-restricted activity of hn-RNPM promotes breast cancer metastasis via regulating alternative splicing. Genes& development, 28(11):1191–203, jun 2014.
[143] Rikke R Lund, Rikke Leth-Larsen, Tina Di Caterino, Mikkel G Terp, JeanetteNissen, Anne-Vibeke Lænkholm, Ole N Jensen, and Henrik J Ditzel. NADH-Cytochrome b5 Reductase 3 Promotes Colonization and Metastasis Formation andIs a Prognostic Marker of Disease-Free and Overall Survival in Estrogen Receptor-Negative Breast Cancer. Molecular & cellular proteomics : MCP, 14(11):2988–99,nov 2015.
106

[144] Tamar Geiger, Stephen F. Madden, William M. Gallagher, Juergen Cox, andMatthias Mann. Proteomic portrait of human breast cancer progression identifiesnovel prognostic markers. Cancer Research, 72(9):2428–2439, may 2012.
[145] Anders Carlsson, Christer Wingren, Malin Kristensson, Carsten Rose, Marten Ferno,Hakan Olsson, Helena Jernstrom, Sara Ek, Elin Gustavsson, Christian Ingvar, Mat-tias Ohlsson, Carsten Peterson, and Carl A K Borrebaeck. Molecular serum portraitsin patients with primary breast cancer predict the development of distant metas-tases. Proceedings of the National Academy of Sciences of the United States of Amer-ica, 108(34):14252–7, aug 2011.
[146] Yanan Kong, Shuqin Dai, Xinhua Xie, Xiangsheng Xiao, Ning Lv, Jiaoli Guo,Laisheng Li, Weihua Jia, Yin Zhang, Wanli Liu, Weidong Wei, and Xiaoming Xie.High serum HER2 extracellular domain levels: correlation with a worse disease-freesurvival and overall survival in primary operable breast cancer patients. Journal ofcancer research and clinical oncology, 138(2):275–84, feb 2012.
[147] Jing Li, Zhensheng Xie, Linan Shi, Zhiqiang Zhao, Junjie Hou, Xiulan Chen, ZiyouCui, Peng Xue, Tanxi Cai, Peng Wu, Sutang Guo, and Fuquan Yang. Purifica-tion, identification and profiling of serum amyloid A proteins from sera of advanced-stage cancer patients. Journal of Chromatography B: Analytical Technologies in theBiomedical and Life Sciences, 889-890:3–9, mar 2012.
[148] Mingli Lv, Xiaoping Xiaoping, Haidong Cai, Dang Li, Jian Wang, Xingjian Fu, FeiYu, Ming Sun, and Zhongwei Lv. Cytokines as prognstic tool in breast carcinoma.Frontiers in bioscience : a journal and virtual library, 17(1):2515–26, jan 2011.
[149] Guojun Zhang, Xudong Sun, Hong Lv, Xiaolin Yang, and Xixiong Kang. Serumamyloid A: A new potential serum marker correlated with the stage of breast cancer.Oncology letters, 3(4):940–944, apr 2012.
[150] Simon A Fry, John Sinclair, John F Timms, Anthony J Leathem, and Miriam VDwek. A targeted glycoproteomic approach identifies cadherin-5 as a novelbiomarker of metastatic breast cancer. Cancer letters, 328(2):335–44, jan 2013.
[151] M-L Xing, Y-F Lu, D-F Wang, X-Y Zou, S-X Zhang, and Z Yun. Clinical signifi-cance of sCIP2A levels in breast cancer. European review for medical and pharmaco-logical sciences, 20(1):82–91, jan 2016.
[152] Pavel Bouchal, Monika Dvoakova, Theodoros Roumeliotis, Zbynek Bortlıcek, IvanaIhnatova, Iva Prochazkova, Jenny T C Ho, Josef Maryas, Hana Imrichova, EvaBudinska, Rostislav Vyzula, Spiros D Garbis, Boivoj Vojtesek, and Rudolf Nenutil.Combined Proteomics and Transcriptomics Identifies Carboxypeptidase B1 and Nu-clear Factor κB (NF-κB) Associated Proteins as Putative Biomarkers of Metastasisin Low Grade Breast Cancer. Molecular & cellular proteomics : MCP, 14(7):1814–30, jul 2015.
107

[153] Emila Kurbasic, Martin Sjostrom, Morten Krogh, Elin Folkesson, Dorthe Grabau,Karin Hansson, Lisa Ryden, Sofia Waldemarson, Peter James, and Emma Nimeus.Changes in glycoprotein expression between primary breast tumour and synchronouslymph node metastases or asynchronous distant metastases. Clinical proteomics,12(1):13, jan 2015.
[154] Heloisa Helena Milioli, Karla Santos Sousa, Rodrigo Kaviski, Nayara Cristina DosSantos Oliveira, Cıcero De Andrade Urban, Rubens Silveira De Lima, Iglenir JoaoCavalli, and Enilze Maria De Souza Fonseca Ribeiro. Comparative proteomics ofprimary breast carcinomas and lymph node metastases outlining markers of tumorinvasion. Cancer genomics & proteomics, 12(2):89–101, jan 2015.
[155] Thomas R Cawthorn, Juan C Moreno, Moyez Dharsee, Danh Tran-Thanh, SuzanneAckloo, Pei Hong Zhu, Girish Sardana, Jian Chen, Peter Kupchak, Lindsay M Jacks,Naomi A Miller, Bruce J Youngson, Vladimir Iakovlev, Cynthia J Guidos, Kather-ine A Vallis, Kenneth R Evans, David McCready, Wey L Leong, and Susan J Done.Proteomic analyses reveal high expression of decorin and endoplasmin (HSP90B1)are associated with breast cancer metastasis and decreased survival. PloS one,7(2):e30992, jan 2012.
[156] Ning Qing Liu, Christoph Stingl, Maxime P Look, Marcel Smid, Rene B H Braak-man, Tommaso De Marchi, Anieta M Sieuwerts, Paul N Span, Fred C G J Sweep,Barbro K Linderholm, Anita Mangia, Angelo Paradiso, Luc Y Dirix, Steven J VanLaere, Theo M Luider, John W M Martens, John A Foekens, and Arzu Umar. Com-parative proteome analysis revealing an 11-protein signature for aggressive triple-negative breast cancer. Journal of the National Cancer Institute, 106(2):djt376, feb2014.
[157] Yan Cui, Ming Niu, Xianyu Zhang, Zhenbin Zhong, Ji Wang, and Da Pang. High ex-pression of valosin-containing protein predicts poor prognosis in patients with breastcarcinoma. Tumour biology : the journal of the International Society for Oncodevel-opmental Biology and Medicine, 36(12):9919–27, dec 2015.
[158] Guiyang Jiang, Xiupeng Zhang, Yong Zhang, Liang Wang, Chuifeng Fan, HongtaoXu, Yuan Miao, and Enhua Wang. A novel biomarker C6orf106 promotes the malig-nant progression of breast cancer. Tumour biology : the journal of the InternationalSociety for Oncodevelopmental Biology and Medicine, 36(10):7881–9, sep 2015.
[159] Hyojin Kim, Kyung-Hun Lee, In Ae Park, Yul Ri Chung, Seock-Ah Im, Dong-YoungNoh, Wonshik Han, Hyeong-Gon Moon, Yoon Yang Jung, and Han Suk Ryu. Ex-pression of SIRT1 and apoptosis-related proteins is predictive for lymph node metas-tasis and disease-free survival in luminal A breast cancer. Virchows Archiv : an in-ternational journal of pathology, 467(5):563–70, nov 2015.
[160] Haihong Pu, Qingyuan Zhang, Chunbo Zhao, Lei Shi, Yan Wang, Jingxuan Wang,and Minghui Zhang. Overexpression of G6PD is associated with high risks of re-current metastasis and poor progression-free survival in primary breast carcinoma.World journal of surgical oncology, 13:323, jan 2015.
108

[161] Yanjie You, Haijun Li, Xin Qin, Yinpo Zhang, Wengang Song, Yonggang Ran, andFenglan Gao. Decreased CDK10 expression correlates with lymph node metastasisand predicts poor outcome in breast cancer patients - a short report. Cellular Oncol-ogy, 38(6):485–491, dec 2015.
[162] Purevdorj B Olkhanud, Dolgor Baatar, Monica Bodogai, Fran Hakim, Ronald Gress,Robin L Anderson, Jie Deng, Mai Xu, Susanne Briest, and Arya Biragyn. Breastcancer lung metastasis requires expression of chemokine receptor CCR4 and regula-tory T cells. Cancer research, 69(14):5996–6004, jul 2009.
[163] Kyle Strimbu and Jorge A Tavel. What are biomarkers? Current opinion in HIVand AIDS, 5(6):463–466, nov 2010.
[164] Shen Hu, Joseph A Loo, and David T Wong. Human body fluid proteome analysis.Proteomics, 6(23):6326–6353, 2006.
[165] Alessandra Tessitore, Agata Gaggiano, Germana Cicciarelli, Daniela Verzella, DariaCapece, Mariafausta Fischietti, Francesca Zazzeroni, and Edoardo Alesse. Serumbiomarkers identification by mass spectrometry in high-mortality tumors., 2013.
[166] Glen L. Hortin, Saeed A. Jortani, James C. Ritchie, Roland Valdes, and Daniel W.Chan. Proteomics: A new diagnostic frontier. Clinical Chemistry, 52(7):1218–1222,jul 2006.
[167] Serena Camerini, Maria Letizia Polci, Lance A Liotta, Emanuel F Petricoin, andWeidong Zhou. A method for the selective isolation and enrichment of carrierprotein-bound low-molecular weight proteins and peptides in the blood. Proteomics.Clinical applications, 1(2):176–84, feb 2007.
[168] Eduard Orvisky, Steven K Drake, Brian M Martin, Mohamed Abdel-Hamid,Habtom W Ressom, Rency S Varghese, Yanming An, Daniel Saha, Glen L Hortin,Christopher A Loffredo, and Radoslav Goldman. Enrichment of low molecularweight fraction of serum for MS analysis of peptides associated with hepatocellularcarcinoma. Proteomics, 6(9):2895–902, may 2006.
[169] L Guerrier, L Lomas, and E Boschetti. A simplified monobuffer multidimensionalchromatography for high-throughput proteome fractionation. Journal of chromatog-raphy. A, 1073(1-2):25–33, may 2005.
[170] Luc Guerrier, Frederic Fortis, and Egisto Boschetti. Solid-phase fractionation strate-gies applied to proteomics investigations. Methods in molecular biology (Clifton,N.J.), 818:11–33, jan 2012.
[171] Karin Bjorhall, Tasso Miliotis, and Pia Davidsson. Comparison of different depletionstrategies for improved resolution in proteomic analysis of human serum samples.Proteomics, 5(1):307–17, jan 2005.
109

[172] R J Leatherbarrow and P D Dean. Studies on the mechanism of binding of serumalbumins to immobilized cibacron blue F3G A. The Biochemical journal, 189(1):27–34, jul 1980.
[173] Swati Anand, Tanielle Mei Bench Alvarez, W Evan Johnson, M Sean Esplin, KarenMerrell, T Flint Porter, and Steven W Graves. Serum biomarkers predictive of pre-eclampsia. Biomarkers in medicine, 9(6):563–75, jan 2015.
[174] Wei-Jun Qian, Jon M Jacobs, Tao Liu, David G Camp, and Richard D Smith.Advances and challenges in liquid chromatography-mass spectrometry-based pro-teomics profiling for clinical applications. Molecular & cellular proteomics : MCP,5(10):1727–44, oct 2006.
[175] Jeffrey T Leek, Robert B Scharpf, Hector Corrada Bravo, David Simcha, BenjaminLangmead, W Evan Johnson, Donald Geman, Keith Baggerly, and Rafael A Irizarry.Tackling the widespread and critical impact of batch effects in high-throughput data.Nature reviews. Genetics, 11(10):733–739, oct 2010.
[176] Chao Chen, Kay Grennan, Judith Badner, Dandan Zhang, Elliot Gershon, Li Jin,and Chunyu Liu. Removing batch effects in analysis of expression microarray data:an evaluation of six batch adjustment methods. PloS one, 6(2):e17238, jan 2011.
[177] W Evan Johnson, Cheng Li, and Ariel Rabinovic. Adjusting batch effects in microar-ray expression data using empirical Bayes methods. Biostatistics (Oxford, England),8(1):118–127, jan 2007.
[178] Hwee Tong Tan, Yie Hou Lee, and Maxey C M Chung. Cancer proteomics. MassSpectrometry Reviews, 31(5):583–605, jan 2012.
[179] Laura J van’t Veer, Hongyue Dai, Marc J van de Vijver, Yudong D He, Augusti-nus A M Hart, Mao Mao, Hans L Peterse, Karin van der Kooy, Matthew J Marton,Anke T Witteveen, George J Schreiber, Ron M Kerkhoven, Chris Roberts, Peter SLinsley, Rene Bernards, and Stephen H Friend. Gene expression profiling predictsclinical outcome of breast cancer. Nature, 415(6871):530–6, jan 2002.
[180] Yvonne S Ziegler, James J Moresco, Patricia G Tu, John R Yates, and Ann M Nar-dulli. Plasma membrane proteomics of human breast cancer cell lines identifies po-tential targets for breast cancer diagnosis and treatment. PloS one, 9(7):e102341, jan2014.
[181] Vladimir Vapnik. Statistical learning theory. 1998. 1998.
[182] N. S. Altman. An Introduction to Kernel and Nearest-Neighbor Nonparametric Re-gression. The American Statistician, feb 2012.
[183] Leo Breiman. Random Forests. Machine Learning, 45(1):5–32.
110

[184] F F Hsu and J Turk. Structural determination of sphingomyelin by tandem massspectrometry with electrospray ionization. Journal of the American Society for MassSpectrometry, 11(5):437–449, may 2000.
[185] Lindsey T. Brinton, Teresa A. Brentnall, Jeffrey A. Smith, and Kimberly A. Kelly.Metastatic Biomarker Discovery Through Proteomics. Cancer Genomics Proteomics,9(6):345–355, nov 2012.
[186] Cheryl Herman. What makes a screening exam ”good”? The virtual mentor : VM,8(1):34–37, jan 2006.
[187] Vincent M Asiago, Leiddy Z Alvarado, Narasimhamurthy Shanaiah, G A NaganaGowda, Kwadwo Owusu-Sarfo, Robert A Ballas, and Daniel Raftery. Early detectionof recurrent breast cancer using metabolite profiling. Cancer research, 70(21):8309–8318, nov 2010.
[188] Michael J Duffy. Serum tumor markers in breast cancer: are they of clinical value?Clinical chemistry, 52(3):345–51, mar 2006.
[189] Yufeng Shen, Nikola Tolic, Tao Liu, Rui Zhao, Brianne O Petritis, Marina A Grit-senko, David G Camp, Ronald J Moore, Samuel O Purvine, Francisco J Esteva, andRichard D Smith. Blood peptidome-degradome profile of breast cancer. PloS one,5(10):e13133, jan 2010.
[190] M Sean Esplin, Karen Merrell, Robert Goldenberg, Yinglei Lai, Jay D Iams, BrianMercer, Catherine Y Spong, Menachem Miodovnik, Hygriv N Simhan, Peter vanDorsten, and Mitchell Dombrowski. Proteomic identification of serum peptides pre-dicting subsequent spontaneous preterm birth. American journal of obstetrics andgynecology, 204(5):391.e1–8, may 2011.
[191] Komal Kedia, Caitlin A. Nichols, Craig D. Thulin, and Steven W. Graves. Novelomics approach for study of low-abundance, low-molecular-weight components of acomplex biological tissue: regional differences between chorionic and basal plates ofthe human placenta. Analytical and Bioanalytical Chemistry, 407(28):8543–56, nov2015.
[192] Dipti Jigar Shah, Frederick Rohlfing, Swati Anand, W Evan Johnson, MeiHwaTanielle Bench Alvarez, Jesse Cobell, Jackson King, Sydney A Young, John SKKauwe, and Steven W Graves. Discovery and subsequent confirmation of novelserum biomarkers diagnosing alzheimers disease. Journal of Alzheimer’s Disease,49(2):317–327, 2015.
[193] Dahu Chen, Yutong Sun, Yongkun Wei, Peijing Zhang, Abdol Hossein Rezaeian,Julie Teruya-Feldstein, Sumeet Gupta, Han Liang, Hui-Kuan Lin, Mien-Chie Hung,and Li Ma. LIFR is a breast cancer metastasis suppressor upstream of the Hippo-YAP pathway and a prognostic marker. Nature medicine, 18(10):1511–1517, oct2012.
111

[194] Michael H Torosian and David L Bartlett. Inhibition of tumor metastasis by a circu-lating suppressor factor. Journal of Surgical Research, 55(1):74–79, 1993.
[195] Kedar S Vaidya and Danny R Welch. Metastasis suppressors and their roles inbreast carcinoma. Journal of mammary gland biology and neoplasia, 12(2-3):175–190,sep 2007.
[196] Leah M Cook, Douglas R Hurst, and Danny R Welch. Metastasis suppressors andthe tumor microenvironment. Seminars in cancer biology, 21(2):113–22, apr 2011.
[197] Sait Ozturk, Panagiotis Papageorgis, Chen Khuan, Arthur W Lambert, andHamid M Abdolmaleky. SDPR functions as a metastasis suppressor in breast can-cer by promoting apoptosis. Proceedings of the National Academy of Sciences of theUnited States of America, pages 4–9, 2015.
[198] Carrie W Rinker-Schaeffer, James P O’Keefe, Danny R Welch, and Dan Theodor-escu. Metastasis suppressor proteins: discovery, molecular mechanisms, and clinicalapplication. Clinical cancer research : an official journal of the American Associa-tion for Cancer Research, 12(13):3882–3889, jul 2006.
[199] Muhammad Haris Ramzan, Muhammad Ramzan, Faiqah Ramzan, Fazal Wahab,Musharraf Jelani, Muhammad Aslam Khan, and Mohsin Shah. Insight into theserum kisspeptin levels in infertile males. Archives of Iranian medicine, 18(1):12–7, jan 2015.
[200] Xiaoli Wang, William E Barber, and Peter W Carr. A practical approach to maxi-mizing peak capacity by using long columns packed with pellicular stationary phasesfor proteomic research. Journal of chromatography. A, 1107(1-2):139–51, feb 2006.
[201] Willaim.L Et Al DeStefano, Joseph.J, Johnson. Methods for Changing Peak Res-olution in HPCL; advantages and limitations. Chromatographyonline, 31(4):10–18,2015.
[202] Nana Bartke and Yusuf A Hannun. Bioactive sphingolipids: metabolism and func-tion. Journal of lipid research, 50 Suppl:S91–6, apr 2009.
[203] Franziska Baenke, Barrie Peck, Heike Miess, and Almut Schulze. Hooked on fat:the role of lipid synthesis in cancer metabolism and tumour development. DiseaseModels & Mechanisms, 6(6):1353–1363, dec 2013.
[204] R Dahiya, B Boyle, B C Goldberg, W H Yoon, B Konety, K Chen, T S Yen, W Blu-menfeld, and P Narayan. Metastasis-associated alterations in phospholipids andfatty acids of human prostatic adenocarcinoma cell lines. Biochemistry and cell bi-ology = Biochimie et biologie cellulaire, 70(7):548–54, jul 1992.
[205] M Luısa Doria, Candida Z Cotrim, Claudia Simoes, Barbara Macedo, PedroDomingues, M Rosario Domingues, and Luisa A Helguero. Lipidomic analysis ofphospholipids from human mammary epithelial and breast cancer cell lines. Journalof Cellular Physiology, 228(2):457–468, feb 2013.
112

[206] Makoto Taniguchi and Toshiro Okazaki. The role of sphingomyelin and sphin-gomyelin synthases in cell death, proliferation and migration-from cell and animalmodels to human disorders. Biochimica et biophysica acta, 1841(5):692–703, may2014.
[207] Suriyan Ponnusamy, Shanmugam Panneer Selvam, Shikhar Mehrotra, ToshihikoKawamori, Ashley J Snider, Lina M Obeid, Yuan Shao, Roger Sabbadini, and BesimOgretmen. Communication between host organism and cancer cells is transduced bysystemic sphingosine kinase 1/sphingosine 1-phosphate signalling to regulate tumourmetastasis. EMBO molecular medicine, 4(8):761–75, aug 2012.
[208] Hong-Wei Yue, Qing-Chuan Jing, Ping-Ping Liu, Jing Liu, Wen-Jing Li, and JingZhao. Sphingosylphosphorylcholine in cancer progress. International journal of clini-cal and experimental medicine, 8(8):11913–21, jan 2015.
[209] Kazuaki Takabe, Steven W Paugh, Sheldon Milstien, and Sarah Spiegel. ”Inside-out”signaling of sphingosine-1-phosphate: therapeutic targets. Pharmacological reviews,60(2):181–95, jun 2008.
[210] Nigel J Pyne and Susan Pyne. Sphingosine 1-phosphate and cancer. Nature reviews.Cancer, 10(7):489–503, jul 2010.
[211] Yixing Jiang, Nicole A DiVittore, Megan M Young, Zhiliang Jia, Keping Xie, Tim-othy M Ritty, Mark Kester, and Todd E Fox. Altered sphingolipid metabolism inpatients with metastatic pancreatic cancer. Biomolecules, 3(3):435–448, 2013.
[212] Masayuki Nagahashi, Subramaniam Ramachandran, Eugene Y Kim, Jeremy C Alle-good, Omar M Rashid, Akimitsu Yamada, Renping Zhao, Sheldon Milstien, HuipingZhou, Sarah Spiegel, and Kazuaki Takabe. Sphingosine-1-phosphate produced bysphingosine kinase 1 promotes breast cancer progression by stimulating angiogenesisand lymphangiogenesis. Cancer research, 72(3):726–35, feb 2012.
[213] Ying Chun Li, Mi Jung Park, Sang-Kyu Ye, Chul-Woo Kim, and Yong-Nyun Kim.Elevated levels of cholesterol-rich lipid rafts in cancer cells are correlated with apop-tosis sensitivity induced by cholesterol-depleting agents. The American journal ofpathology, 168(4):1107–18; quiz 1404–5, apr 2006.
[214] Sreenivasa R Chinni, Hamilto Yamamoto, Zhong Dong, Aaron Sabbota, R DanielBonfil, and Michael L Cher. CXCL12/CXCR4 transactivates HER2 in lipid rafts ofprostate cancer cells and promotes growth of metastatic deposits in bone. Molecularcancer research : MCR, 6(3):446–57, mar 2008.
[215] Shirley S Arielly, Matty Ariel, Rivka Yehuda, Michaela Scigelova, Galit Yehezkel,and Isam Khalaila. Quantitative analysis of caveolin-rich lipid raft proteins fromprimary and metastatic colorectal cancer clones. Journal of proteomics, 75(9):2629–37, may 2012.
113

[216] Aurelie Chantome, Marie Potier-Cartereau, Lucie Clarysse, Gaelle Fromont, SeverineMarionneau-Lambot, Maxime Gueguinou, Jean-Christophe Pages, Christine Collin,Thibauld Oullier, Alban Girault, et al. Pivotal role of the lipid raft sk3–orai1complex in human cancer cell migration and bone metastases. Cancer research,73(15):4852–4861, 2013.
[217] A Lazzarini, A Floridi, L Pugliese, M Villani, S Cataldi, Michela Codini, R Laz-zarini, T Beccari, FS Ambesi-Impiombato, F Curcio, et al. Analysis of serum sph-ingomyelin species by uflc-ms/ms in patients affected with monoclonal gammopathy.Journal of Chromatography & Separation Techniques, 5(5):1, 2014.
[218] Chan Woo Kim, Hwan Myung Lee, Tae Hoon Lee, Chulhun Kang, Hynda K Klein-man, and Yong Song Gho. Extracellular Membrane Vesicles from Tumor Cells Pro-mote. Cancer research, 62(21):6312–6317, nov 2002.
[219] V Dolo, S D’Ascenzo, S Violini, L Pompucci, C Festuccia, A Ginestra, M L Vit-torelli, S Canevari, and A Pavan. Matrix-degrading proteinases are shed in mem-brane vesicles by ovarian cancer cells in vivo and in vitro. Clinical & experimentalmetastasis, 17(2):131–40, mar 1999.
[220] A Ginestra, M D La Placa, F Saladino, D Cassara, H Nagase, and M L Vittorelli.The amount and proteolytic content of vesicles shed by human cancer cell lines cor-relates with their in vitro invasiveness. Anticancer research, 18(5A):3433–7, jan.
[221] Wael Al-Zoughbi, Wael Al-Zhoughbi, Jianfeng Huang, Ganapathy S Paramasivan,Holger Till, Martin Pichler, Barbara Guertl-Lackner, and Gerald Hoefler. Tumormacroenvironment and metabolism. Seminars in oncology, 41(2):281–95, apr 2014.
[222] Sandeep A Bailwad, Navneet Singh, Dhaval R Jani, Prashant Patil, Manas Singh,Gagan Deep, and Simranjit Singh. Alterations in serum lipid profile patterns in oralcancer: correlation with histological grading and tobacco abuse. Oral Health DentManag, 13:573–579, 2014.
[223] O. Warburg. On the Origin of Cancer Cells. Science, 123(3191):309–314, feb 1956.
[224] Yoon Yang Jung, Hye Min Kim, and Ja Seung Koo. Expression of LipidMetabolism-Related Proteins in Metastatic Breast Cancer. PloS one, 10(9):e0137204,jan 2015.
[225] C G Binnie and S T Lord. The fibrinogen sequences that interact with thrombin.Blood, 81(12):3186–3192, 1993.
[226] J L Mullin, O V Gorkun, C G Binnie, and S T Lord. Recombinant fibrinogen studiesreveal that thrombin specificity dictates order of fibrinopeptide release. The Journalof biological chemistry, 275(33):25239–46, aug 2000.
[227] Annemieke W J Opstal-van Winden, Esmeralda J M Krop, Monica H Karedal,Marie-Christine W Gast, Christian H Lindh, Marina C Jeppsson, Bo A G Jonsson,
114

Diederick E Grobbee, Petra H M Peeters, Jos H Beijnen, Carla H van Gils, and RoelC H Vermeulen. Searching for early breast cancer biomarkers by serum protein pro-filing of pre-diagnostic serum; a nested case-control study. BMC cancer, 11(1):381,jan 2011.
[228] Nicholas P. Schaub, Kimberly J. Jones, Julius O. Nyalwidhe, Lisa H. Cazares,Izabela D. Karbassi, O. John Semmes, Eric C. Feliberti, Roger R. Perry, andRichard R. Drake. Serum Proteomic Biomarker Discovery Reflective of Stage andObesity in Breast Cancer Patients. Journal of the American College of Surgeons,208(5):970–978, 2009.
[229] Ana M Gil-Bernabe, Serena Lucotti, and Ruth J Muschel. Coagulation and metas-tasis: what does the experimental literature tell us? British journal of haematology,162(4):433–441, 2013.
[230] J S Palumbo, K W Kombrinck, A F Drew, T S Grimes, J H Kiser, J L Degen, andT H Bugge. Fibrinogen is an important determinant of the metastatic potential ofcirculating tumor cells. Blood, 96(10):3302–9, nov 2000.
[231] Radu Albulescua & Monica Neagu Cristiana Tanaseab. Proteomic Approachesfor Biomarker Panels in Cancer. Journal of Immunoassay and Immunochemistry,37(1):1–15, 2016.
[232] Richard R Drake, Lisa H Cazares, E Ellen Jones, Thomas W Fuller, O JohnSemmes, and Christine Laronga. Challenges to developing proteomic-based breastcancer diagnostics. Omics : a journal of integrative biology, 15(5):251–9, may 2011.
115

CURRICULUM VITAE
Adhari Abdullah AlZaabi
Sultan Qaboos Univeristy
College of Medicine
Department of Anatomy
P.O. Box 123
Muscat Governorate, Sultanate of Oman
Mobile: (801) 932-4274
Phone: +968 2414-1175
Email: [email protected]
Education
Brigham Young University, Ph.D. in Physiology and Developmental Biology, 2016
Sultan Qaboos University, Medical Doctor (MD), 2007
Employment
Lecturer, Sultan Qaboos University, Department of Clinical & Human Anatomy. (Novem-
ber 2008–August 2011).
General Practitioner, GP, Sohar Health Center. (August 2008–October 2008).
Internship & Training
Padiatrics, Sultan Qaboos University Hospital. (April 2008–July 2008).
Surgery, Sultan Qaboos University Hospital. (December 2007–March 2008).
Inetrnal Medicine, Sohar Hospital. (August 2007–November 2007).
Padiatrics, International Medical University, Malaysia. (May 2006).
Medicine, Sohar Hospital. (June 2006).
Urology, Urology Center, Egypt. (June 2005).
116

Conferences & Seminars
Identification and characterization of serum proteomic markers associated with Breast
Cancer progression. A.Al Zaabi , M.Hansen. AACR, 2013
Identification and characterization of serum proteomic markers associated with Breast
Cancer progression. A.Al Zaabi , M.Hansen. AACR, 2012
Conventional vs. PBL Curriculum: StudentTeacher Prespective. A. Al Zaabi. V. Taranikanti.
International Journal of Arts and Science Conference (Poster Session ). Germany, Novem-
ber 2010.
Do Histpathological Features of Breast Cancer Differ between Young and Old Patients?
A. Al Shehi. A. Al Zaabi. Sultan Qaboos University Hospital Research Day, April
2010.
5-Year Survival of Hodgkins Lymphoma in Oman: Single Institution Experience. A.
Al Zaabi, I. A. Burney, M. Al Moundhri, S. Al Kindi, S. Ganguly, S. Kumar. Sultan
Qaboos University Medical Treat, March 2010.
Management and Prognosis of Hodgkins Lymphoma in Oman. I. A. Burney, A. Al Za-
abi. The 4th Scientific Conference for the GCC Medical Students, Sultan Qaboos Uni-
versity, July 2006.
117
Related Documents


