Asia Pacific Journal of Molecular Biology and Biotechnology, 2008 Vol. 16 (3) : 53-63 *Author for Correspondence. Mailing address: Advanced Biotechnology and Breeding Centre, Malaysian Palm Oil Board (MPOB), P.O Box 10620, 50720 Kuala Lumpur. Tel: 603: 8769 4501; Fax : 603-8926 1995; Email: [email protected] Identification of cDNA-RFLP Markers and Their Use for Molecular Mapping in Oil Palm (Elaeis guineensis) Rajinder Singh 1 *, Tan Soon-Guan, 2 , Jothi Panandam 3 , Rahimah A. Rahman 1 and Suan-Choo, Cheah 1,4 1 Advanced Biotechnology and Breeding Centre, Malaysian Palm Oil Board (MPOB), P.O Box 10620, 50720 Kuala Lumpur 2 Department of Cell and Molecular Biology, Faculty of Biotechnology and Biomolecular Sciences, 3 Department of Animal Sciences, Faculty of Science, Universiti Putra Malaysia, 43400 UPM Serdang 4 Present address: Asiatic Centre for Genome Technology Sdn Bhd (ACGT), Lot L3-I-1, Enterprise 4, Technology Park Malaysia, 57000 Kuala Lumpur, Malaysia Received 20 July 2007 / Accepted 20 May 2008 Abstract. Restriction fragment length polymorphic (RFLP) probes derived from complementary DNA (cDNA) clones were developed for oil palm genome analysis. A total of 321 cDNA-RFLP probes were evaluated for their ability to detect polymorphism in a mapping family derived from the selfing of a Tenera guineensis palm (palm T128). Approximately 38% (123 probes) revealed polymorphism with at least one restriction enzyme. All the 123 informative probes were used to genotype the mapping family. Majority of the markers (80%) showed expected segregation ratios, indicating that most of the RFLP markers were inherited in a Mendelian manner. A total of 116 segregating markers were assigned to 20 linkage groups spanning 693cM. The RFLP markers were found to be largely well distributed and did not show excessive clustering in any particular region. This is the first published map for oil palm containing gene specific markers. The cDNA-RFLP probes mapped will not be merely anonymous markers with symbols, but point to the actual location of specific genes. The map also proved useful in revealing QTL associated with oil to wet mesocarp (O/WM) content. Keywords. Oil palm, cDNA-RFLP, linkage map, molecular markers INTRODUCTION The commercial oil palm (Elaeis guineensis Jacq.) is an out breeding, diploid (2n=32) species of West African origin. It is one of the most important perennial crops in South- East Asia, particularly in Malaysia and Indonesia. Palm oil is versatile oil, used for both edible (90%) and non-edible (10%) purposes (Rajanaidu et al., 2000). Currently, the main products of interest are palm oil and palm kernel oil from the mesocarp and kernel, respectively. The planting of oil palm and the utilisation of the oil is steadily increasing. In Malaysia alone, oil palm planted areas have grown from 0.64 million hectare in 1975 to nearly 4.05 million hectares in 2005 (MPOB., 2006). The rapid growth of the oil palm industry was partly stimulated by progress in breeding research. Oil palm breeders have traditionally depended on the conventional methods of hybridization and selection to insert new genes into plants. This method has several limitations, such as desirable genes being linked to undesirable traits like low yield. Moreover the sorting and selection of a genetically new genotype is extremely slow. The advent of molecular marker technology has provided an opportunity for accelerating breeding research in crops to improve productivity through marker-assisted selection (MAS). Knowledge about the inheritance and the linkage relationships of molecular markers and traits of economic interest provide breeders with powerful molecular tools that can be used to improve the efficiency of crop improvement (Shappley et al., 1996). For the oil palm, the availability of markers or probes, for traits of interest will enable selection at the nursery stage, thereby reducing cost and time required for breeding programmes. The aim of the present work was to construct an oil palm linkage map based on homologous coding sequences through the use of cDNA-RFLP markers. The ability of the genetic map to reveal quantitative trait loci (QTL) associated with yield components in oil palm was also investigated. The RFLP

Welcome message from author
This document is posted to help you gain knowledge. Please leave a comment to let me know what you think about it! Share it to your friends and learn new things together.
Transcript
AsPac J. Mol. Biol. Biotechnol., Vol. 16 (3), 2008 53 cDNA-RFLP Markers and Molecular Mapping in Oil Palm Asia Pacific Journal of Molecular Biology and Biotechnology, 2008Vol. 16 (3) : 53-63
*Author for Correspondence.Mailing address: Advanced Biotechnology and Breeding Centre, Malaysian Palm Oil Board (MPOB), P.O Box 10620, 50720 Kuala Lumpur. Tel: 603: 8769 4501; Fax : 603-8926 1995; Email: [email protected]
Identification of cDNA-RFLP Markers and Their Use for Molecular Mapping in Oil Palm (Elaeis guineensis)
Rajinder Singh1*, Tan Soon-Guan,2, Jothi Panandam3, Rahimah A. Rahman1 and Suan-Choo, Cheah1,4
1Advanced Biotechnology and Breeding Centre, Malaysian Palm Oil Board (MPOB), P.O Box 10620, 50720 Kuala Lumpur2Department of Cell and Molecular Biology, Faculty of Biotechnology and Biomolecular Sciences, 3Department of
Animal Sciences, Faculty of Science, Universiti Putra Malaysia, 43400 UPM Serdang4Present address: Asiatic Centre for Genome Technology Sdn Bhd (ACGT), Lot L3-I-1,
Enterprise 4, Technology Park Malaysia, 57000 Kuala Lumpur, Malaysia
Received 20 July 2007 / Accepted 20 May 2008
Abstract. Restriction fragment length polymorphic (RFLP) probes derived from complementary DNA (cDNA) clones were developed for oil palm genome analysis. A total of 321 cDNA-RFLP probes were evaluated for their ability to detect polymorphism in a mapping family derived from the selfing of a Tenera guineensis palm (palm T128). Approximately 38% (123 probes) revealed polymorphism with at least one restriction enzyme. All the 123 informative probes were used to genotype the mapping family. Majority of the markers (80%) showed expected segregation ratios, indicating that most of the RFLP markers were inherited in a Mendelian manner. A total of 116 segregating markers were assigned to 20 linkage groups spanning 693cM. The RFLP markers were found to be largely well distributed and did not show excessive clustering in any particular region. This is the first published map for oil palm containing gene specific markers. The cDNA-RFLP probes mapped will not be merely anonymous markers with symbols, but point to the actual location of specific genes. The map also proved useful in revealing QTL associated with oil to wet mesocarp (O/WM) content.
Keywords. Oil palm, cDNA-RFLP, linkage map, molecular markers
INTRODUCTION
The commercial oil palm (Elaeis guineensis Jacq.) is an out breeding, diploid (2n=32) species of West African origin. It is one of the most important perennial crops in South-East Asia, particularly in Malaysia and Indonesia. Palm oil is versatile oil, used for both edible (90%) and non-edible (10%) purposes (Rajanaidu et al., 2000). Currently, the main products of interest are palm oil and palm kernel oil from the mesocarp and kernel, respectively.
The planting of oil palm and the utilisation of the oil is steadily increasing. In Malaysia alone, oil palm planted areas have grown from 0.64 million hectare in 1975 to nearly 4.05 million hectares in 2005 (MPOB., 2006). The rapid growth of the oil palm industry was partly stimulated by progress in breeding research. Oil palm breeders have traditionally depended on the conventional methods of hybridization and selection to insert new genes into plants. This method has several limitations, such as desirable genes being linked to undesirable traits like low yield. Moreover the sorting and selection of a genetically new genotype is extremely slow.
The advent of molecular marker technology has provided an opportunity for accelerating breeding research in crops to improve productivity through marker-assisted selection (MAS). Knowledge about the inheritance and the linkage relationships of molecular markers and traits of economic interest provide breeders with powerful molecular tools that can be used to improve the efficiency of crop improvement (Shappley et al., 1996). For the oil palm, the availability of markers or probes, for traits of interest will enable selection at the nursery stage, thereby reducing cost and time required for breeding programmes.
The aim of the present work was to construct an oil palm linkage map based on homologous coding sequences through the use of cDNA-RFLP markers. The ability of the genetic map to reveal quantitative trait loci (QTL) associated with yield components in oil palm was also investigated. The RFLP
54 AsPac J. Mol. Biol. Biotechnol., Vol. 16 (3), 2008 cDNA-RFLP Markers and Molecular Mapping in Oil Palm
probes used in this study were obtained from complementary DNA (cDNA) libraries from various tissues constructed at the Malaysian Palm Oil Board (MPOB). They are known to be an excellent source for probes, and as cDNAs cor-respond to a particular gene in the genome, molecular maps generated using these probes are of known genes. The use of cDNA-RFLP probes especially those related to tissue specificity and developmental phases, can eventually lead to a better understanding of how genome organization affects gene expression during development.
MATERIALS AND METHODS Plant materials. The mapping family used for generating the genetic linkage map was derived from the selfing of the high iodine value (IV) tenera palm, T128, from MPOB’s Nigerian germplasm collection (Rajanaidu 1990; Cheah et al., 1999). Controlled self-pollination was used to generate the mapping family. A total of 136 palms planted at the MPOB-UKM Re-search Station at Bangi, Selangor, Ulu Paka Research Station at Terengganu and United Plantations, Teluk Intan, Perak were used for the purpose of genetic linkage mapping.
DNA extraction. Unopened leaf samples (spear leaf) were collected from individual palms and immediately frozen under liquid nitrogen and then stored at -80°C until DNA preparation. DNA from the leaf samples was extracted and purified using the method described by Doyle and Doyle (1990).
Restriction enzyme (RE) digestion of DNA. For standard RFLP analysis, 20 µg of genomic DNA was transferred into a 1.5 ml microcentrifuge tube and sterile water was added to a final volume of 100 µl, to form the first master mix. A second master mix consisting of the following was prepared: 20 µl of appropriate 10x restriction buffer (supplied with the respective enzyme), 4 µl of 0.1 M spermidine trihydrochloride (pH 7.0), 2 µl of 100x Bovine Serum Albumin (BSA), the appropriate concentration of enzyme (varied according to the restriction enzyme used, as recommended by the manu-facturer) and sterile water to a final volume of 100 µl. The second master mix was transferred to the microcentrifuge tube containing the first master mix, to give a final volume of 200 µl of digestion mix. The digestion mix was incubated overnight at the optimum temperature, as recommended by the manufacturer of the respective enzymes. Subsequently 20 µl of 3 M sodium acetate (pH 4.8) and 440 µl of ice-cold absolute ethanol was added to the digested DNA and allowed to precipitate at -20°C overnight. The DNA was recovered by centrifuging at 14,000 rpm, at 4°C for 45 min, by using a high speed centrifuge (Eppendorf 5810R). The supernatant was aspirated out and the resulting DNA pellet washed with 70% ice-cold ethanol by centrifuging at 14,000 rpm, 4°C for
15 min. The DNA pellet was then dried by using a speed vac centrifuge (Savant Oligo PrepTM OP120) for 10 min. The dried DNA pellet was then dissolved in 35 µl of TE buffer and this was followed by the addition of 5 µl of loading dye, FOG ( 0.1 M EDTA, 25% Ficoll, 0.1% Orange G, 50% glycerol). The samples were stored at 4°C (not longer than 72 hours) until required.
Electrophoresis of genomic DNA for Southern analysis. Gel electrophoresis was carried out by using agarose gels. The percentage of the agarose gel used varied depending on the restriction enzymes used. A 0.9% agarose gel was used for enzymes having six base pair recognition sites (BamHI, BclI, BglII, DraI, EcoRI, HincII, HindIII, ScaI, SstI, XbaI), while a 1.0% agarose gel was used for enzymes with four and five base pair recognition sites (HaeIII, RsaI, TaqI, BstNI).
Electrophoresis was carried out by using the horizontal gel electrophoresis system (Horizon 20-25, GIBCO BRL), at 120 V for 5 min, followed by 25 V overnight. All gels contained 5 ng of 1 kb ladder (New England Biolabs) and 10 µl of gel tracking dye in separate wells. The gels were then stained with 20 µl of ethidium bromide (10 mg/ml) in 200 ml of electrophoresis buffer (1x TAE) for 30 min. The stained gel was viewed under UV light and photographed by using a Polaroid camera. Prior to blotting, the gels were briefly washed with distilled water.
Southern blotting was carried out by using the Vacuum Gene XL blotting set (GE Healthcare Biosciences). The DNA was transferred onto nylon membranes (Hybond N+, GE Healthcare Biosciences, 15 cm x 20 cm) at 50 cm H2O (mbar) for 30 min, using 0.4 M sodium hydroxide (NaOH) as the transfer buffer. The blotted membranes were washed with 2x SSC buffer (diluted 10 fold from 20x SSC stock solution) before being fixed for 20 s at 254 nm, by using a UV-crosslinker (Spectrolink XL-1000, Spectronics Corpora-tion). The membranes were left to air dry and stored at 4°C until required.
RFLP probes. The RFLP probes used in this study were complementary DNA (cDNA) clones obtained from various cDNA libraries (young etiolated seedling, mesocarp, kernel and root) constructed previously as described by Cheah et al. (1996). cDNA clones from a subtracted flower library (Cheah and Rajinder, 1998) were also used to screen the mapping family.
The cDNA clones were picked at random from the vari-ous libraries. Plasmid DNA was prepared from individual clones by using column purification, with Qiagen-tip 20 (QIAGEN) as described by the manufacturer.
The presence of DNA insert was examined by restric-tion digestion of 1 µg of plasmid DNA with 10 U of the appropriate restriction enzyme for 3 hours, to release the insert DNA. One fifth (1/5) volume of loading buffer, FOG, was added to the digestion mix and the fragments were separated by electrophoresis through a 1.5% agarose
AsPac J. Mol. Biol. Biotechnol., Vol. 16 (3), 2008 55 cDNA-RFLP Markers and Molecular Mapping in Oil Palm
gel. cDNA clones with insert size larger than 500 base-pairs (bp) were selected to screen for their ability to detect RFLP in the mapping family.
Probes for mapping were derived from the selected plas-mids as polymerase chain reaction (PCR) amplified DNA fragments, as described by Cheah et al. (1996). Bacterial clones containing selected probes were maintained as frozen glycerol stocks at -80°C.
Labeling of selected DNA probes. The DNA probe to be labeled was diluted to a concentration of 5 ng/µl in TE buffer. The DNA probe was then labeled by using the Megaprime DNA Labelling system (GE Healthcare Biosci-ences) as recommended by the manufacturer. The labeled probe was separated from the unincorporated nucleotides by purification through a Sephadex column as described in Sambrook et al. (1989).
Southern hybridization. Initially DNA from a sample of 10 palms was each digested separately with 14 restriction enzymes (BamHI, BclI, BglII, DraI, EcoRI, HincII, HindIII, ScaI, SstI, XbaI, BstNI, HaeIII, RsaI and TaqI). The restricted DNA fragments were separated by electrophoresis in agarose gel and transferred onto nylon membranes (Hybond N+, GE Healthcare Biosciences) as described above.
The set of 140 restricted DNA samples were then hy-bridized in turn with each candidate probe to identify the probe/restriction enzyme combination that gave a segrega-tion profile. In the case of more than one enzyme showing polymorphisms with a particular probe, the probe/enzyme combination that gave a single/low copy clear co-dominant profile was selected for screening the entire mapping fam-ily.
Pre-hybridization and hybridization were carried out in glass tubes in a rotisserie oven at 65°C. Membranes were pre-hybridized for about 3 hours in a solution containing 25 ml pre-hybridization buffer : 5x SSPE solution (3 M NaCl, 0.2 M sodium phosphate, 20 mM EDTA pH 8.0), 0.5% SDS, 5x Denhardt’s solution (0.1% Ficoll, 0.1% polyvinylpyrolidone, 0.1% Albumin Bovine Fraction V) and 100 µg/ml denatured herring sperm DNA. The pre-hybridization buffer was removed and replaced with 25 ml of hybridization solution consisting of 5x SSPE (3 M NaCl, 0.2 M sodium phosphate, 20 mM EDTA pH 8.0), 0.5% SDS and 100 µg/ml denatured herring sperm DNA. Labeled probes were denatured by heat-ing in a boiling water bath for 10 min and plunging into ice water, before addition to the hybridization buffer. The probe was added to a concentration of about 1-3 x 10⁶ cpm/ml. Hybridization was carried out overnight at 65°C.
Hybridized membranes were washed twice in 2x SSC (0.3 M NaCl, 30 mM tri-sodium citrate, pH 7.0), 0.1% SDS at 65°C for 15 min each time, followed by once in 1x SSC (0.15 M NaCl, 15 mM tri-sodium citrate pH 7.0), 0.1% SDS at 65°C for 15 min. The membranes were then autoradiographed at -80°C using X-ray films with intensifying screens for 7 to 10
days. X-ray films were developed using 0.22x Kodak’s GBX developer for 5 min, rinsed in distilled water, followed by a final wash with 0.2x Kodak’s GBX fixer for 5 min.
The membranes hybridized with a particular probe could be reused at least 3 more times with probe removal. The probes were removed by washing the membranes in 0.1 M sodium hydroxide (NaOH) at 42°C for 20 min followed by a solution containing 0.1 M Tris-HCl pH 7.5, 0.1x SSC (0.015 M NaCl, 1.5 mM tri-sodium citrate pH 7.0), 0.1% SDS at 42°C for 20 min and finally using a solution containing 0.1x SSC, 0.1% SDS at room temperature for 30 min. The membranes were exposed to X-Ray film as described above for 7 days, to make sure that probe removal was complete.
Data analysis. The RFLP bands were scored as co-dominant markers and, for this selfed cross, loci segregating in the 1:2:1 ratio were scored. Some RFLP probes revealed complex patterns, for which the alleles were difficult to determine. For such cases, segregating bands were individually scored as being absent or present (Table 1).
Map construction. Map construction was carried out by us-ing the Joinmap ver. 3.0 computer programme (Ooijen and Voorrips, 2001). The oil palm is an out-breeding species, and the genome of the T128 parent is a mix of fixed and heterozygous parts (i.e obtained from successive intercross-ing, back-crossing or selfing generations from its ancestors). Therefore its progenies by selfing are considered as a F2 mapping family.
Markers were first divided into linkage groups using a LOD score threshold of 4.0. After being divided into linkage groups, stringent parameters were applied for map construc-tion that is a recombination value of 0.32 and LOD score of 1.0. A ripple was performed after the addition of every three markers and map distances were calculated using the Kosambi map function. JoinMap constructs maps in three cycles. In the first two cycles, the markers which exceeded the JUMP threshold are excluded. In the third cycle, mark-ers excluded are inserted, with no restriction on the JUMP threshold. In this study, the ordering produced in the second cycle was taken. Markers which caused inconsistencies in the second cycle map were discarded.
Parent genotype
Progeny genotype
Genotype ratio in the
progeny
Loci defined by a single band
Loci defined by 2 allelic bands
3 : 1
1 : 2 : 1
Table 1. The two different types of segregation patterns observed in the mapping family from RFLP markers
56 AsPac J. Mol. Biol. Biotechnol., Vol. 16 (3), 2008 cDNA-RFLP Markers and Molecular Mapping in Oil Palm
Quantitative Trait Analysis. Quantitative trait associated with oil to wet mesocarp (O/WM) content was of interest in this study. Bunches after harvesting were carefully tagged and brought back to the laboratory. O/WM content of the bunch was determined as described by Rao et al. (1983). QTL mapping analysis was performed by using interval mapping as implemented in MapQTL version 4.0 (Ooijen 2002). The empirical thresholds for QTL detection were calculated using the permutation test, also implemented via MapQTL version 4.0 (Ooijen 2002). The Rank Sum test of Kruskal-Wallis was also used to detect markers with linkages to QTL. The Kruskal-Wallis test was also carried out using the MapQTL software.
RESULTS
DNA extraction. A suitable DNA extraction method was employed in this study (described in Methodology) with the main goal being simplicity and to provide a sufficient amount of DNA for RFLP analysis. Typically in this study, the DNA extraction protocol yielded about 0.7 mg DNA/g leaf tissue.
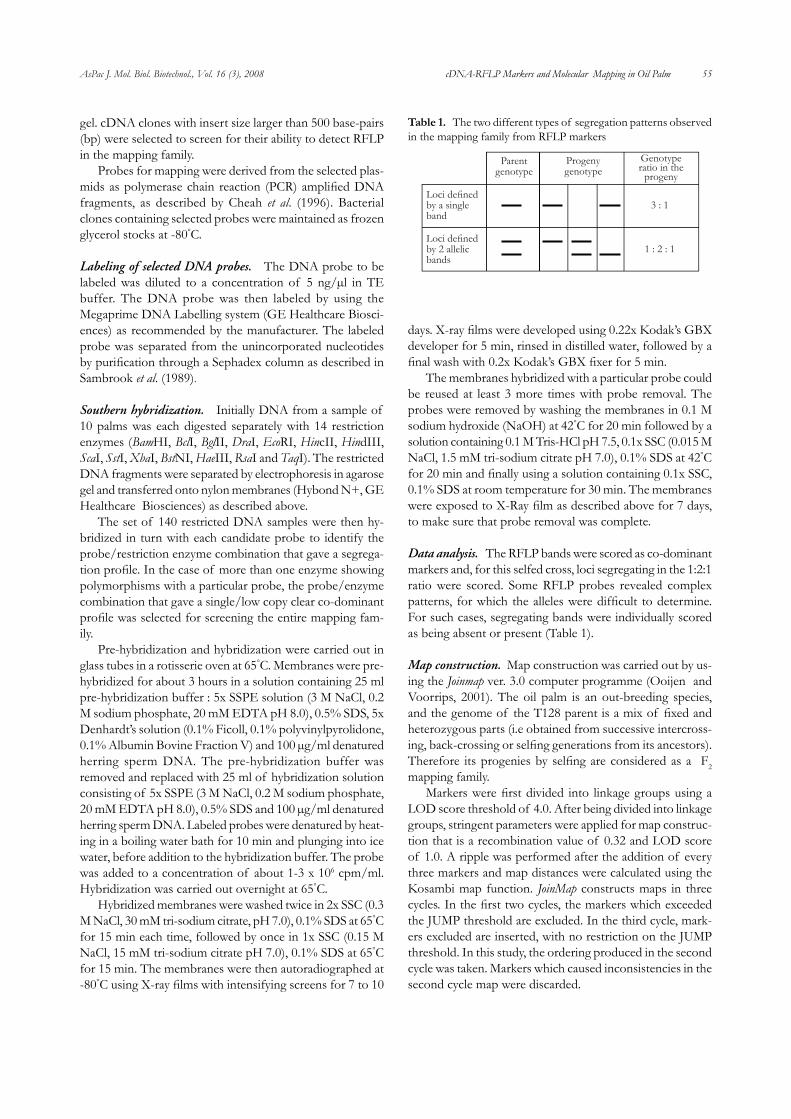
Prior to RFLP analysis trial digestion was carried out for each batch of DNA. A small amount of DNA (5 µg) was digested with a 4 bp cutter (HaeIII) and a 6 bp cutter (EcoRI), to ensure that there were no local impurities inhibiting the restriction enzyme activity. The results from a trial digestion are presented in Figure 1. The DNA was found to be satisfac-tory if: i) the undigested DNA showed a clear and compact band at the high molecular weight range and ii) the DNA digested with 4 bp cutter showed a lower mobility range than the 6 bp cutter (because of more frequent restriction sites, resulting in smaller fragments). This actually saved any un-necessary wastage and ensured minimal loss of data in the subsequent analysis.
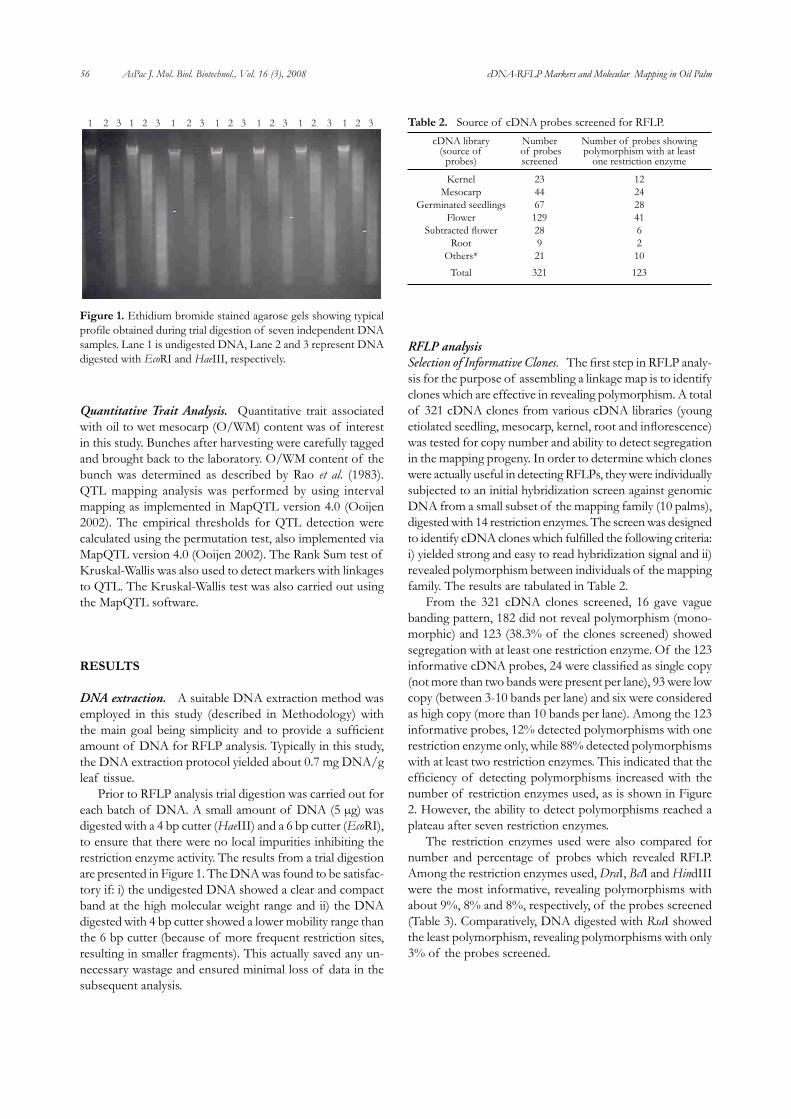
RFLP analysisSelection of Informative Clones. The first step in RFLP analy-sis for the purpose of assembling a linkage map is to identify clones which are effective in revealing polymorphism. A total of 321 cDNA clones from various cDNA libraries (young etiolated seedling, mesocarp, kernel, root and inflorescence) was tested for copy number and ability to detect segregation in the mapping progeny. In order to determine which clones were actually useful in detecting RFLPs, they were individually subjected to an initial hybridization screen against genomic DNA from a small subset of the mapping family (10 palms), digested with 14 restriction enzymes. The screen was designed to identify cDNA clones which fulfilled the following criteria: i) yielded strong and easy to read hybridization signal and ii) revealed polymorphism between individuals of the mapping family. The results are tabulated in Table 2.
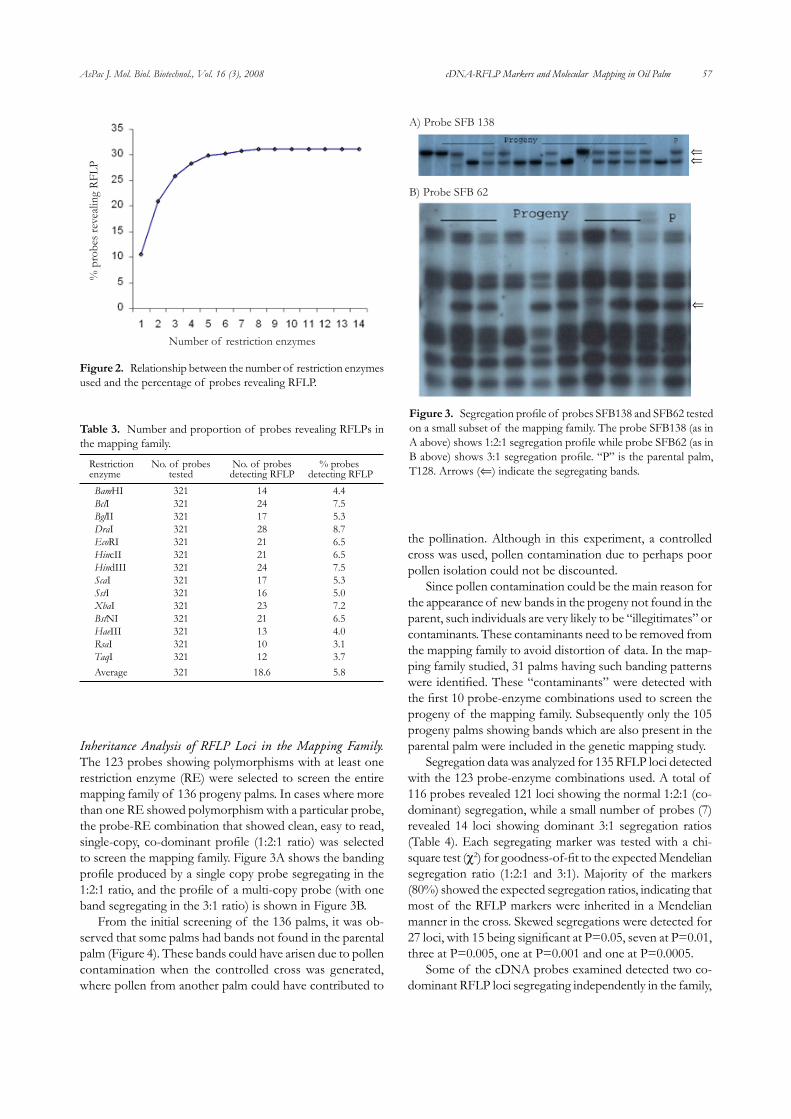
From the 321 cDNA clones screened, 16 gave vague banding pattern, 182 did not reveal polymorphism (mono-morphic) and 123 (38.3% of the clones screened) showed segregation with at least one restriction enzyme. Of the 123 informative cDNA probes, 24 were classified as single copy (not more than two bands were present per lane), 93 were low copy (between 3-10 bands per lane) and six were considered as high copy (more than 10 bands per lane). Among the 123 informative probes, 12% detected polymorphisms with one restriction enzyme only, while 88% detected polymorphisms with at least two restriction enzymes. This indicated that the efficiency of detecting polymorphisms increased with the number of restriction enzymes used, as is shown in Figure 2. However, the ability to detect polymorphisms reached a plateau after seven restriction enzymes.
The restriction enzymes used were also compared for number and percentage of probes which revealed RFLP. Among the restriction enzymes used, DraI, BclI and HindIII were the most informative, revealing polymorphisms with about 9%, 8% and 8%, respectively, of the probes screened (Table 3). Comparatively, DNA digested with RsaI showed the least polymorphism, revealing polymorphisms with only 3% of the probes screened.
1 2 3 1 2 3 1 2 3 1 2 3 1 2 3 1 2 3 1 2 3
Figure 1. Ethidium bromide stained agarose gels showing typical profile obtained during trial digestion of seven independent DNA samples. Lane 1 is undigested DNA, Lane 2 and 3 represent DNA digested with EcoRI and HaeIII, respectively.
cDNA library Number Number of probes showing (source of of probes polymorphism with at least probes) screened one restriction enzyme Kernel 23 12 Mesocarp 44 24 Germinated seedlings 67 28 Flower 129 41 Subtracted flower 28 6 Root 9 2 Others* 21 10
Total 321 123
Table 2. Source of cDNA probes screened for RFLP.
AsPac J. Mol. Biol. Biotechnol., Vol. 16 (3), 2008 57 cDNA-RFLP Markers and Molecular Mapping in Oil Palm
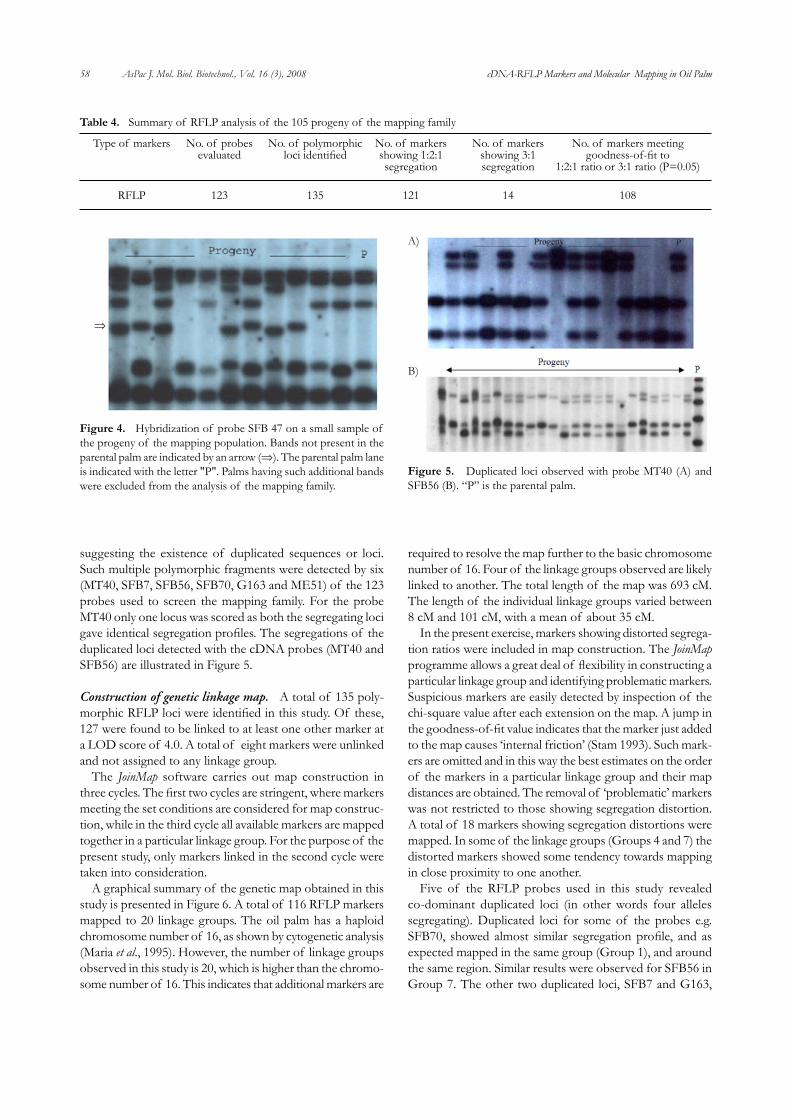
Inheritance Analysis of RFLP Loci in the Mapping Family. The 123 probes showing polymorphisms with at least one restriction enzyme (RE) were selected to screen the entire mapping family of 136 progeny palms. In cases where more than one RE showed polymorphism with a particular probe, the probe-RE combination that showed clean, easy to read, single-copy, co-dominant profile (1:2:1 ratio) was selected to screen the mapping family. Figure 3A shows the banding profile produced by a single copy probe segregating in the 1:2:1 ratio, and the profile of a multi-copy probe (with one band segregating in the 3:1 ratio) is shown in Figure 3B.
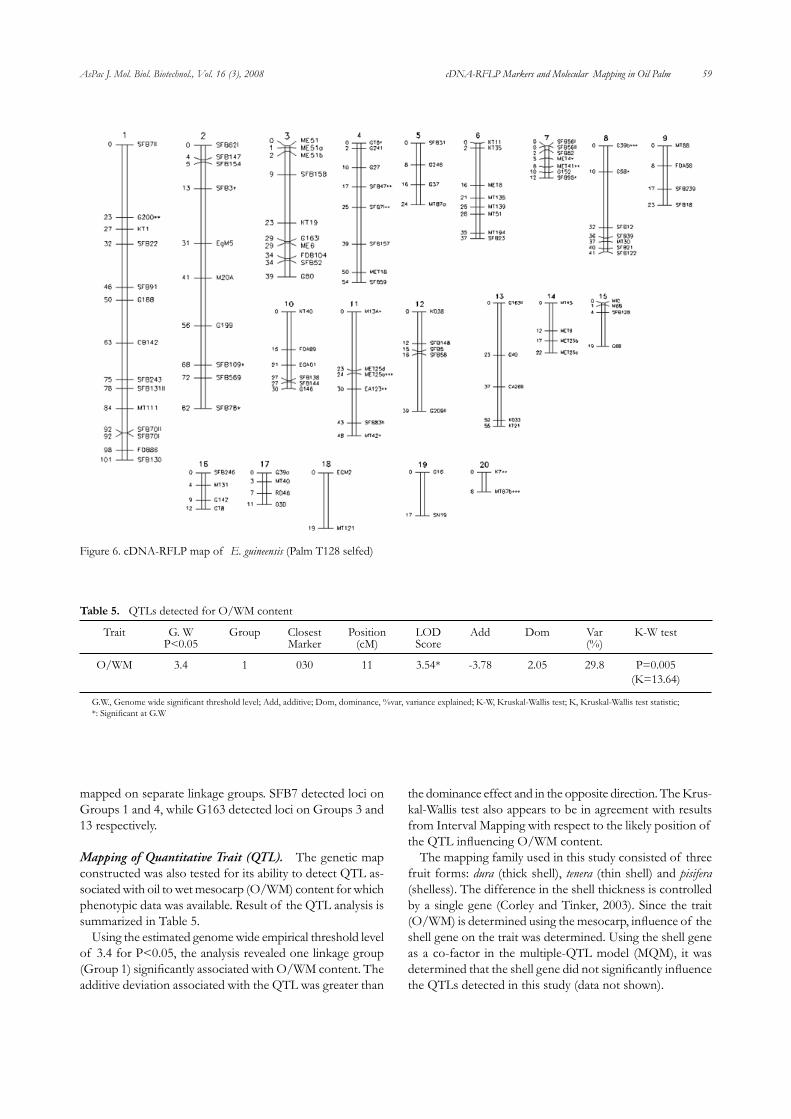
From the initial screening of the 136 palms, it was ob-served that some palms had bands not found in the parental palm (Figure 4). These bands could have arisen due to pollen contamination when the controlled cross was generated, where pollen from another palm could have contributed to
the pollination. Although in this experiment, a controlled cross was used, pollen contamination due to perhaps poor pollen isolation could not be discounted.
Since pollen contamination could be the main reason for the appearance of new bands in the progeny not found in the parent, such individuals are very likely to be “illegitimates” or contaminants. These contaminants need to be removed from the mapping family to avoid distortion of data. In the map-ping family studied, 31 palms having such banding patterns were identified. These “contaminants” were detected with the first 10 probe-enzyme combinations used to screen the progeny of the mapping family. Subsequently only the 105 progeny palms showing bands which are also present in the parental palm were included in the genetic mapping study.
Segregation data was analyzed for 135 RFLP loci detected with the 123 probe-enzyme combinations used. A total of 116 probes revealed 121 loci showing the normal 1:2:1 (co-dominant) segregation, while a small number of probes (7) revealed 14 loci showing dominant 3:1 segregation ratios (Table 4). Each segregating marker was tested with a chi-square test (χ2) for goodness-of-fit to the expected Mendelian segregation ratio (1:2:1 and 3:1). Majority of the markers (80%) showed the expected segregation ratios, indicating that most of the RFLP markers were inherited in a Mendelian manner in the cross. Skewed segregations were detected for 27 loci, with 15 being significant at P=0.05, seven at P=0.01, three at P=0.005, one at P=0.001 and one at P=0.0005.
Some of the cDNA probes examined detected two co-dominant RFLP loci segregating independently in the family,
Restriction No. of probes No. of probes % probes enzyme tested detecting RFLP detecting RFLP
BamHI 321 14 4.4 BclI 321 24 7.5 BglII 321 17 5.3 DraI 321 28 8.7 EcoRI 321 21 6.5 HincII 321 21 6.5 HindIII 321 24 7.5 ScaI 321 17 5.3 SstI 321 16 5.0 XbaI 321 23 7.2 BstNI 321 21 6.5 HaeIII 321 13 4.0 RsaI 321 10 3.1 TaqI 321 12 3.7 Average 321 18.6 5.8
Table 3. Number and proportion of probes revealing RFLPs in the mapping family.
% p
robe
s rev
ealin
g RF
LP
Number of restriction enzymes
Figure 2. Relationship between the number of restriction enzymes used and the percentage of probes revealing RFLP.
A) Probe SFB 138
B) Probe SFB 62
Figure 3. Segregation profile of probes SFB138 and SFB62 tested on a small subset of the mapping family. The probe SFB138 (as in A above) shows 1:2:1 segregation profile while probe SFB62 (as in B above) shows 3:1 segregation profile. “P” is the parental palm, T128. Arrows (⇐) indicate the segregating bands.
⇐
⇐⇐
58 AsPac J. Mol. Biol. Biotechnol., Vol. 16 (3), 2008 cDNA-RFLP Markers and Molecular Mapping in Oil Palm
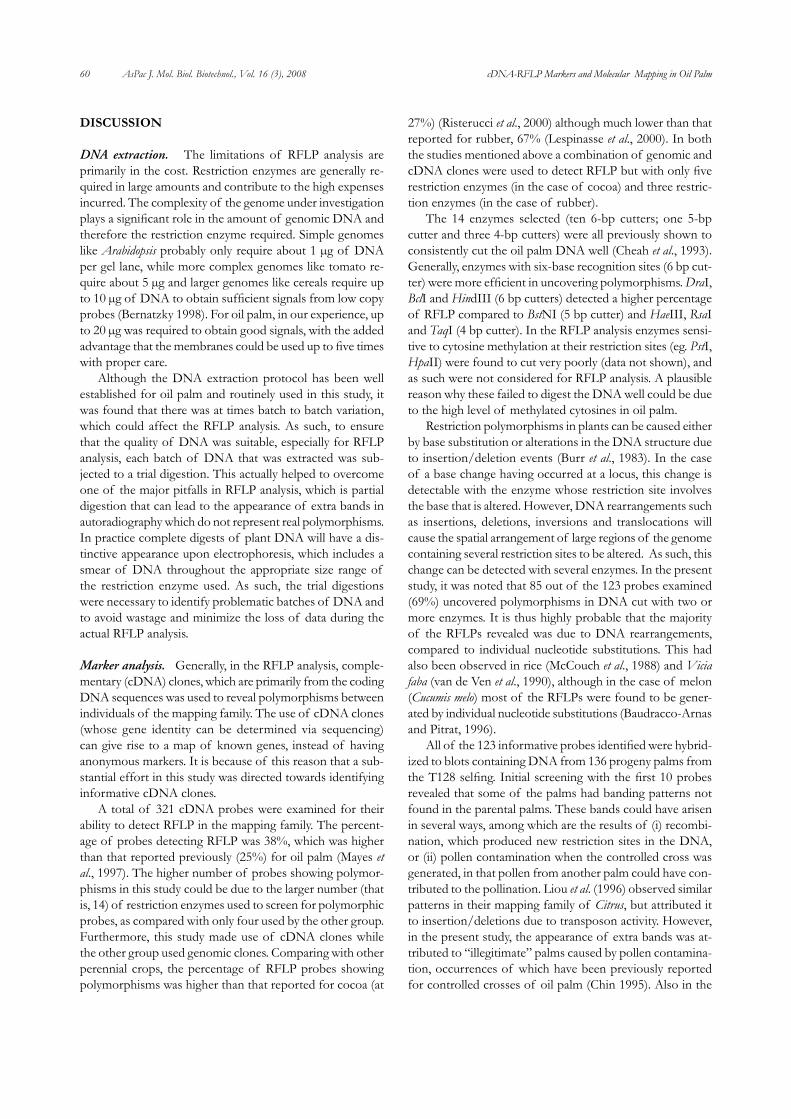
suggesting the existence of duplicated sequences or loci. Such multiple polymorphic fragments were detected by six (MT40, SFB7, SFB56, SFB70, G163 and ME51) of the 123 probes used to screen the mapping family. For the probe MT40 only one locus was scored as both the segregating loci gave identical segregation profiles. The segregations of the duplicated loci detected with the cDNA probes (MT40 and SFB56) are illustrated in Figure 5.
Construction of genetic linkage map. A total of 135 poly-morphic RFLP loci were identified in this study. Of these, 127 were found to be linked to at least one other marker at a LOD score of 4.0. A total of eight markers were unlinked and not assigned to any linkage group.
The JoinMap software carries out map construction in three cycles. The first two cycles are stringent, where markers meeting the set conditions are considered for map construc-tion, while in the third cycle all available markers are mapped together in a particular linkage group. For the purpose of the present study, only markers linked in the second cycle were taken into consideration.
A graphical summary of the genetic map obtained in this study is presented in Figure 6. A total of 116 RFLP markers mapped to 20 linkage groups. The oil palm has a haploid chromosome number of 16, as shown by cytogenetic analysis (Maria et al., 1995). However, the number of linkage groups observed in this study is 20, which is higher than the chromo-some number of 16. This indicates that additional markers are
required to resolve the map further to the basic chromosome number of 16. Four of the linkage groups observed are likely linked to another. The total length of the map was 693 cM. The length of the individual linkage groups varied between 8 cM and 101 cM, with a mean of about 35 cM.
In the present exercise, markers showing distorted segrega-tion ratios were included in map construction. The JoinMap programme allows a great deal of flexibility in constructing a particular linkage group and identifying problematic markers. Suspicious markers are easily detected by inspection of the chi-square value after each extension on the map. A jump in the goodness-of-fit value indicates that the marker just added to the map causes ‘internal friction’ (Stam 1993). Such mark-ers are omitted and in this way the best estimates on the order of the markers in a particular linkage group and their map distances are obtained. The removal of ‘problematic’ markers was not restricted to those showing segregation distortion. A total of 18 markers showing segregation distortions were mapped. In some of the linkage groups (Groups 4 and 7) the distorted markers showed some tendency towards mapping in close proximity to one another.
Five of the RFLP probes used in this study revealed co-dominant duplicated loci (in other words four alleles segregating). Duplicated loci for some of the probes e.g. SFB70, showed almost similar segregation profile, and as expected mapped in the same group (Group 1), and around the same region. Similar results were observed for SFB56 in Group 7. The other two duplicated loci, SFB7 and G163,
⇒
Figure 4. Hybridization of probe SFB 47 on a small sample of the progeny of the mapping population. Bands not present in the parental palm are indicated by an arrow (⇒). The parental palm lane is indicated with the letter "P". Palms having such additional bands were excluded from the analysis of the mapping family.
A)
B)
Figure 5. Duplicated loci observed with probe MT40 (A) and SFB56 (B). “P” is the parental palm.
Type of markers No. of probes No. of polymorphic No. of markers No. of markers No. of markers meeting evaluated loci identified showing 1:2:1 showing 3:1 goodness-of-fit to segregation segregation 1:2:1 ratio or 3:1 ratio (P=0.05) RFLP 123 135 121 14 108
Table 4. Summary of RFLP analysis of the 105 progeny of the mapping family
AsPac J. Mol. Biol. Biotechnol., Vol. 16 (3), 2008 59 cDNA-RFLP Markers and Molecular Mapping in Oil Palm
mapped on separate linkage groups. SFB7 detected loci on Groups 1 and 4, while G163 detected loci on Groups 3 and 13 respectively.
Mapping of Quantitative Trait (QTL). The genetic map constructed was also tested for its ability to detect QTL as-sociated with oil to wet mesocarp (O/WM) content for which phenotypic data was available. Result of the QTL analysis is summarized in Table 5.
Using the estimated genome wide empirical threshold level of 3.4 for P<0.05, the analysis revealed one linkage group (Group 1) significantly associated with O/WM content. The additive deviation associated with the QTL was greater than
the dominance effect and in the opposite direction. The Krus-kal-Wallis test also appears to be in agreement with results from Interval Mapping with respect to the likely position of the QTL influencing O/WM content.
The mapping family used in this study consisted of three fruit forms: dura (thick shell), tenera (thin shell) and pisifera (shelless). The difference in the shell thickness is controlled by a single gene (Corley and Tinker, 2003). Since the trait (O/WM) is determined using the mesocarp, influence of the shell gene on the trait was determined. Using the shell gene as a co-factor in the multiple-QTL model (MQM), it was determined that the shell gene did not significantly influence the QTLs detected in this study (data not shown).
Trait G. W Group Closest Position LOD Add Dom Var K-W test P<0.05 Marker (cM) Score (%)
O/WM 3.4 1 030 11 3.54* -3.78 2.05 29.8 P=0.005 (K=13.64)
Table 5. QTLs detected for O/WM content
G.W., Genome wide significant threshold level; Add, additive; Dom, dominance, %var, variance explained; K-W, Kruskal-Wallis test; K, Kruskal-Wallis test statistic; *: Significant at G.W
Figure 6. cDNA-RFLP map of E. guineensis (Palm T128 selfed)
60 AsPac J. Mol. Biol. Biotechnol., Vol. 16 (3), 2008 cDNA-RFLP Markers and Molecular Mapping in Oil Palm
DISCUSSION
DNA extraction. The limitations of RFLP analysis are primarily in the cost. Restriction enzymes are generally re-quired in large amounts and contribute to the high expenses incurred. The complexity of the genome under investigation plays a significant role in the amount of genomic DNA and therefore the restriction enzyme required. Simple genomes like Arabidopsis probably only require about 1 µg of DNA per gel lane, while more complex genomes like tomato re-quire about 5 µg and larger genomes like cereals require up to 10 µg of DNA to obtain sufficient signals from low copy probes (Bernatzky 1998). For oil palm, in our experience, up to 20 µg was required to obtain good signals, with the added advantage that the membranes could be used up to five times with proper care.
Although the DNA extraction protocol has been well established for oil palm and routinely used in this study, it was found that there was at times batch to batch variation, which could affect the RFLP analysis. As such, to ensure that the quality of DNA was suitable, especially for RFLP analysis, each batch of DNA that was extracted was sub-jected to a trial digestion. This actually helped to overcome one of the major pitfalls in RFLP analysis, which is partial digestion that can lead to the appearance of extra bands in autoradiography which do not represent real polymorphisms. In practice complete digests of plant DNA will have a dis-tinctive appearance upon electrophoresis, which includes a smear of DNA throughout the appropriate size range of the restriction enzyme used. As such, the trial digestions were necessary to identify problematic batches of DNA and to avoid wastage and minimize the loss of data during the actual RFLP analysis.
Marker analysis. Generally, in the RFLP analysis, comple-mentary (cDNA) clones, which are primarily from the coding DNA sequences was used to reveal polymorphisms between individuals of the mapping family. The use of cDNA clones (whose gene identity can be determined via sequencing) can give rise to a map of known genes, instead of having anonymous markers. It is because of this reason that a sub-stantial effort in this study was directed towards identifying informative cDNA clones.
A total of 321 cDNA probes were examined for their ability to detect RFLP in the mapping family. The percent-age of probes detecting RFLP was 38%, which was higher than that reported previously (25%) for oil palm (Mayes et al., 1997). The higher number of probes showing polymor-phisms in this study could be due to the larger number (that is, 14) of restriction enzymes used to screen for polymorphic probes, as compared with only four used by the other group. Furthermore, this study made use of cDNA clones while the other group used genomic clones. Comparing with other perennial crops, the percentage of RFLP probes showing polymorphisms was higher than that reported for cocoa (at
27%) (Risterucci et al., 2000) although much lower than that reported for rubber, 67% (Lespinasse et al., 2000). In both the studies mentioned above a combination of genomic and cDNA clones were used to detect RFLP but with only five restriction enzymes (in the case of cocoa) and three restric-tion enzymes (in the case of rubber).
The 14 enzymes selected (ten 6-bp cutters; one 5-bp cutter and three 4-bp cutters) were all previously shown to consistently cut the oil palm DNA well (Cheah et al., 1993). Generally, enzymes with six-base recognition sites (6 bp cut-ter) were more efficient in uncovering polymorphisms. DraI, BclI and HindIII (6 bp cutters) detected a higher percentage of RFLP compared to BstNI (5 bp cutter) and HaeIII, RsaI and TaqI (4 bp cutter). In the RFLP analysis enzymes sensi-tive to cytosine methylation at their restriction sites (eg. PstI, HpaII) were found to cut very poorly (data not shown), and as such were not considered for RFLP analysis. A plausible reason why these failed to digest the DNA well could be due to the high level of methylated cytosines in oil palm.
Restriction polymorphisms in plants can be caused either by base substitution or alterations in the DNA structure due to insertion/deletion events (Burr et al., 1983). In the case of a base change having occurred at a locus, this change is detectable with the enzyme whose restriction site involves the base that is altered. However, DNA rearrangements such as insertions, deletions, inversions and translocations will cause the spatial arrangement of large regions of the genome containing several restriction sites to be altered. As such, this change can be detected with several enzymes. In the present study, it was noted that 85 out of the 123 probes examined (69%) uncovered polymorphisms in DNA cut with two or more enzymes. It is thus highly probable that the majority of the RFLPs revealed was due to DNA rearrangements, compared to individual nucleotide substitutions. This had also been observed in rice (McCouch et al., 1988) and Vicia faba (van de Ven et al., 1990), although in the case of melon (Cucumis melo) most of the RFLPs were found to be gener-ated by individual nucleotide substitutions (Baudracco-Arnas and Pitrat, 1996).
All of the 123 informative probes identified were hybrid-ized to blots containing DNA from 136 progeny palms from the T128 selfing. Initial screening with the first 10 probes revealed that some of the palms had banding patterns not found in the parental palms. These bands could have arisen in several ways, among which are the results of (i) recombi-nation, which produced new restriction sites in the DNA, or (ii) pollen contamination when the controlled cross was generated, in that pollen from another palm could have con-tributed to the pollination. Liou et al. (1996) observed similar patterns in their mapping family of Citrus, but attributed it to insertion/deletions due to transposon activity. However, in the present study, the appearance of extra bands was at-tributed to “illegitimate” palms caused by pollen contamina-tion, occurrences of which have been previously reported for controlled crosses of oil palm (Chin 1995). Also in the
AsPac J. Mol. Biol. Biotechnol., Vol. 16 (3), 2008 61 cDNA-RFLP Markers and Molecular Mapping in Oil Palm
previous report on the genetic mapping of oil palm using a controlled cross, similar observation were made and was also attributed to pollen contamination (Mayes et al., 1997). The results here showed that the cDNA probes, in addition to being used for generating segregating RFLP markers for mapping, could also be useful in assessing the fidelity of controlled crosses or in conducting paternity tests in the oil palm. The possibility of having contaminant individuals even in controlled crosses shows the importance of making available molecular or biochemical markers to monitor the identity of pedigree material within the framework of a tree improvement programme.
The 105 “legitimate” palms were subjected to RFLP analysis. Majority of the RFLP markers (90%) showed co-dominant 1:2:1 segregation with a small number (10%) show-ing 3:1 dominant segregation. It was also interesting to note that some of the RFLP probes revealed more than one seg-regating locus. In soyabean (Keim et al., 1990) and sunflower (Jan et al., 1998), duplicated loci detected using RFLP markers were attributed to ancestral polyploidy state of the plants. As such, the appearance of RFLP duplicated loci indicates a possible tetraploid ancestry for the largely diploid oil palm. In this study, only a limited number of duplicated loci were detected, probably due to the preferential use of single and low copy probes in screening the mapping family.
The results from this study have shown that by utiliz-ing cDNA clones, relatively large sets of RFLP loci can be produced with moderate effort. Nevertheless, the major obstacle in RFLP analysis, at least in our experience was the cost involved.
Genetic map construction and QTL analysis. The genetic map obtained in this study consists of 116 RFLP markers assigned to 20 linkage groups. The present map is the first for oil palm containing gene specific markers. The number of markers mapped is higher than that reported previously for oil palm by Mayes et al. (1997), Moretzsohn et al. (2000), Rance et al. (2001), but lower than that reported by Billotte et al. (2005) . Since the number of linkage groups obtained in this study is higher than the number of chromosomes in oil palm (n=16), and there are several unassigned loci, it can be concluded that the number of markers was not yet sufficient to resolve the map to the basic chromosome number of 16. Each linkage group should ideally be assigned to one pair of chromosome. At present for the oil palm it is not yet possible to assign specific linkage groups to particular chromosomes or chromosome arms. This will be possible when landmark markers, such as RFLP can be assigned cytologically to chromosomes through in situ hybridization.
The duplication of some RFLP loci supports the polyploid origin of oil palm. The distribution of some of these dupli-cated loci on separate linkage groups is probably explained by the frequent chromosomal rearrangements during the course of oil palm evolution. Duplicated loci in some crops have been associated with chromosomal translocations and
inversions (Ellis et al., 1992) or with sequence transpositions (Lark et al., 1993).
In the present study 18 distorted markers were mapped. The removal or addition of these markers did not cause any disturbance in marker order or distances between the markers in a particular linkage group. Neither did the addition of these markers cause a significant jump in the goodness-of-fit value, indicating that they were not causing any ‘internal friction’ in the map order. Some markers will have distorted segre-gation ratios by chance (5% at P=0.05). At the same time, transmission of genetic markers and chromosomes from one generation to another could also be distorted by lethal genes or chromosomal rearrangements that alter segregation ratios (Causse et al., 1994; Foolad et al., 1995). In this study there was however, some tendency towards clustering of distorted markers on the linkage groups. This had also been reported in linkage maps of other crop species (Marques et al., 1998), and is expected if some chromosomes contain genes that alter segregation ratios.
In order for the map to be useful for locating traits asso-ciated with agricultural productivity, it is important to have a large number of molecular markers evenly distributed throughout the genome. The RFLP markers were found to be largely well distributed and did not show excessive clustering in any particular region. It is also important to note that by mapping genes such as cDNA RFLPs rather than only relying on anonymous markers (such as amplified fragment length polymorphism, AFLPs), the study has made it possible for the first time to determine the genomic location of function-ally related genes in the oil palm genome. The establishment of such gene-specific markers on a genetic map could be useful for marker-assisted selection and possible cloning of agriculturally important genes in oil palm. This also facilitates the analysis of candidate genes underlying quantitative traits associated with agricultural productivity (Faris et al., 1999; Pfaff and Kahl, 2003). Furthermore, RFLP markers being largely co-dominant and locus specific can and will play an important role in integrating the various oil palm linkage maps, in order to get a more comprehensive coverage of the oil palm genome.
Efforts are currently underway to sequence the cDNA clones used as RFLP probes. This is part of a larger pro-gramme to sequence the cDNA clones from various librar-ies as expressed sequence tags (ESTs). With the increase in sequence information on oil palm genes, especially through the generation of ESTs, a special effort is also being made to mine the sequences for presence of simple sequence repeats (SSR). This is to exploit the EST-SSRs as source of markers for oil palm genomics, in order to get a better coverage of the whole genome. Marker systems such as AFLPs are also being employed to generate a new set of markers for map-ping. Such markers will be useful in filling the gaps on the map where cDNA markers are rare or absent.
Nevertheless the genetic map constructed in this study in itself proved to be suitable for QTL analysis. QTL associated
62 AsPac J. Mol. Biol. Biotechnol., Vol. 16 (3), 2008 cDNA-RFLP Markers and Molecular Mapping in Oil Palm
with a yield component of oil palm (O/WM) was revealed. O/WM is considered an important selection factor in oil palm breeding (Hartley, 1988). No significant QTLs were found to be associated with this trait in the only other previous study carried out on QTL analysis for yield component in oil palm (Rance et al., 2001). The further development of the existing map will lead to the identification of additional QTLs for oil palm and help pave the way for marker assisted selection in this perennial crop.
ACKNOWLEDGEMENTS.
The authors would like to thank the Director-General of MPOB for permission to publish the manuscript.
REFERENCES
Baudracco-Arnas, S. and Pitrat, M. 1996. A genetic map of melon (Cucumis melo L.) with RFLP, RAPD, isozyme, disease resistance and morphological markers. Theoretical and Applied Genetics 93: 57-64.
Bernatzky, R. 1998. Restriction fragment length polymor-phism. Plant Molecular Biology Manual C2: 1-18.
Billotte, N., Marseillac, N., Risterucci, A.M., Adon, B., Brot-teir, P., Baurens, F. C., Singh, R., Herran, A., Asmady, H., Billot, C., Amblard, P Durrand-Gasselin, T., Courtois, B., Asmono, D., Cheah, S.C., Rohde, W and Charrier, A. 2005. Microsatellite-based high density linkage map in oil palm (Elaeis guineensis Jacq.). Theoretical and Applied Genetics 110: 754-765.
Burr, B., Evola, E., Burr, F. A. and Beckman, J. S. 1983. The application of restriction fragment length polymorphism to plant breeding. In Genetic Engineering. Principles and Methods, ed. J. K. Setlow and A. Hollaender, Volume 5, pp 45-59. New York and London : Plenum Press.
Causse, M., Fulton, T., Ahn, N., Wang, Z., Wu, K., Ronald, P. C., Xiao, J., Yu, Z., Second, G., McCouch, S. R and Tanksley, S. D. 1994. Saturated molecular map of the rice genome based on an interspecific backcross population. Genetics 138: 1251-1274.
Cheah, S. C., Siti Nor Akmar, A., Ooi, L. C. L., Rahimah, A. R and Maria, M. 1993. Detection of DNA variability in the oil palm using RFLP probes. In Proceedings of the PORIM International Palm Oil Conference- Agricul-ture, ed. Y. Basiron and B. S. Jalani, pp 144-150. Palm Oil Research Institute of Malaysia (PORIM), Bangi, Malaysia.
Cheah, S. C., Ooi, L. C. L. and Rahimah, A. R. 1996. Quality
control process for oil palm tissue culture using DNA probes. PORIM Information Series, Issue No.40. Palm Oil Research Institute of Malaysia (PORIM), Bangi, Malaysia.
Cheah, S. C., Singh, R. and Maria, M. 1999. Generating molecular tools for oil palm improvement through the genomics approach. In Proc. PORIM International Palm Oil Conference, Bangi, Malaysia, ed. A. Darus, K. W. Chan and. S.S.R.A Sharifah, pp 297-320. Palm Oil Research Institute of Malaysia (PORIM), Malaysia.
Cheah, S. C. and Rajinder, S. 1998. Gene expression during flower development in the oil palm. Project Completion Report No. 0057/98, Palm Oil Research Institute of Malaysia (PORIM), Bangi, Malaysia.
Chin, C. W. 1995. Oil Palm planting materials and quality control. In: Technologies in the Plantation- ‘The Way Forward’. Proc PORIM National Oil Palm Confer-ence, ed. N. Rajanaidu and B.S. Jalani, pp 38-47. Palm Oil Research Institute of Malaysia (PORIM), Bangi, Malaysia.
Corley, R. H. V. and Tinker, P. B. 2003. Selection and Breeding. In: The Oil Palm, 4th edition. Blackwell Science.
Doyle, J. J. and Doyle, J. L. 1990. Isolation of plant DNA
from fresh tissue. FOCUS 12: 13-15.
Ellis, T. H. N., Turner, L., Hellens, R. P., Lee, D., Harker, C. L., Enard, C., Domoney, C. and Davies, D. R. 1992. Linkage maps in pea. Genetics 130: 649-663.
Faris, J. D., Li, W. L., Liu, D., Chen, P. D. and Gill, B.S. 1999. Candidate gene analysis of quantitative disease resistance in wheat. Theoretical and Applied Genetics 98: 219-225.
Foolad, M. R., Arulsekar, S., Becerra, V. and Bliss, F. A. 1995. A genetic map of Prunus based on an interspecific cross between peach and almond. Theoretical and Applied Genet-ics 91: 262-269.
Hartley, C.W.S. 1988. The oil palm (Elaeis guineensis Jacq.). Longman Scientific and Technical Publ., New York.
Jan, C. C., Vick, B. A., Miller, J. F., Kahler, A. L. and Butler, E. T. 1998. Construction of RFLP linkage map of cultivated sunflower. Theoretical and Applied Genetics 96: 15-22.
Keim, P., Diers, B. W., Olson, T. C. and Shoemaker, R. C. 1990. RFLP Mapping in Soybean: Association between Marker Loci and variation in Quantitative Traits. Genetics 126 : 735-742.
AsPac J. Mol. Biol. Biotechnol., Vol. 16 (3), 2008 63 cDNA-RFLP Markers and Molecular Mapping in Oil Palm
Lark, K. G., Weisemann, J. M., Matthews, B. F., Palmer, R., Chase, K. and Macalma, T. 1993. A genetic map of soybean (Glycine max L.) using an intraspecific cross of two cultivars: ‘Minsoy’ and “Noir 1’. Theoretical and Ap-plied Genetics 86: 901-906.
Lespinasse, D., Rodier-Goud, M., Grivet, L., Leconte, A., Legnate, H. and Seguin, M. A. 2000. Saturated genetic linkage map of rubber tree (Hevea spp.) based on RFLP, AFLP, microsatellite, and isozyme markers. Theoretical and Applied Genetics 100: 127-138.
Liou, P. C., Gmitter, F. G. and Moore, G. A. 1996. Char-acterization of the Citrus genome through analysis of restriction fragment length polymorphisms. Theoretical and Applied Genetics 92: 425-435.
Maria, M., Clyde, M. M. and Cheah, S. C. 1995. Cytological analysis of Elaeis guineensis (tenera) chromosomes. ElaeisElaeis 7: 122-134.
Marques, C. M., Araujo, J. A., Ferreira, J. A., Whetten, R., O’ Malley, D. M., Liu, B. H. and Sederoff, R. 1998. AFLPAFLP genetic maps of Eucalyptus globules and E. tereticornis. Theoretical and Applied Genetics 96: 727-737.
Mayes, S., Jack, P. L., Marshall, D. F. and Corley, R. H. V. 1997. Construction of a RFLP genetic linkage map for oil palm (Elaeis guineensis Jacq.). Genome 40: 116-122.
McCouch, S. R., Kochert, G., Yu, Z. H., Wang, Z. Y., Khush, G. S., Coffman, W. R. and Tanksley, S. D. 1988. Molecular mapping of rice chromosomes. Theoretical and Applied Genetics 76: 815-829.
Moretzsohn, M. C., Nunes, C. D. M., Ferreira, M. E. and Grattapaglia, D. 2000. RAPD linkage mapping of the shell thickness locus in oil palm (Elaeis guineensis Jacq.). Theoretical and Applied Genetics 100: 63-70.
MPOB.2006. Statistics compiled by Malaysian Palm Oil Board (MPOB). http://www.mpob.gov.my.
Ooijen, J. W. V. and Voorrips, R. E. 2001. JoinMap 3.0:JoinMap 3.0: Soft-ware for calculation of genetic linkage maps. Plant Re-search International, Wageningen, The Netherlands.
Ooijen, J. W. V. 2002. MapQTL 4.0: Software for the calcula-tion of QTLs position on genetic map. Plant Research International, Wageningen, The Netherlands.
Pfaff, T. and Kahl, G. 2003. Mapping of gene-specific mark-ers on the genetic map of chickpea (Cicer arietinum L.) Molecular Genetics and Genomics 269: 243-251.
Rajanaidu, N. 1990. Major developments in oil palm (Elaeis guineensis) breeding. Proceedings of the12th Plenary Meeting of Association for the Taxonomic Study of the Flora of Tropical Africa (AETFAT), pp 39-52, Mit-teilungen Inst. Allg. Bot. Hamburg, Germany.
Rajanaidu, N., Kushairi, A., Rafii, M. Mohd Din, A., Maizura, I. and Jalani, B. S. 2000. Oil palm breeding and geneticOil palm breeding and genetic resources. In Advances in Oil Palm Research, ed. Y. Ba-siron, B. S. Jalani and K. W Chan., Volume 1 pp 171-237, Malaysian Palm Oil Board (MPOB), Bangi, Selangor.
Rance, K. A., Mayes, S., Price, Z., Jack, P. L. and Corley, R. H. V. 2001. Quantitative trait loci for yield components in oil palm (Elaeis guineensis Jacq.). Theoretical and Applied Genetics 103: 1302-1310.
Rao, V., Soh, A.C., Corley, R. H. V., Lee, C. H., Rajanaidu, N., Tan, Y.P., Chin, C. W., Lim, K. C., Tan, S. T., Lee T. P and Ngui, M. 1983. A critical reexamination of the method of bunch quality analysis in oil palm breeding. PORIM Occasional Paper 9: 1-28.
Risterucci, A. M., Grivet, L., N’Goran, J. A. K., Pieretti, I., Flament, M. H. and Lanaud, C. 2000. A high density linkage map of Theobroma cacao L. Theoretical and Applied Genetics 101: 948-955.
Sambrook, J., Fritsch, E. F. and Maniatis, T. 1989. In: Mo-lecular cloning: A Laboratory manual, 2nd edition. New York: Cold Spring Harbor Laboratory Press.
Shappley, Z. W., Jenkins, J. N., Watson, C. E., Kahler, A. L. and Meredith, W. R. 1996. Establishment of molecular mark-ers and linkage groups in two F2 populations of Upland Cotton. Theoretical and Applied Genetics 92: 915-919.
Stam, P. 1993. Construction of integrated genetic linkage maps by means of a new computer package: JoinMap. The Plant Journal 3: 739-744.
van de Ven, M., Powell, W., Ramsay, G. and Waugh, R. 1990. Restriction fragment length polymorphisms as genetic markers in Vicia. Heredity 65: 329-342.
Related Documents


