IDC Results 2004/05 Geoffrey Qhena Chief Executive Officer 26 October 2005

IDC Results 2004/05 Geoffrey Qhena Chief Executive Officer 26 October 2005.
Jan 01, 2016
Welcome message from author
This document is posted to help you gain knowledge. Please leave a comment to let me know what you think about it! Share it to your friends and learn new things together.
Transcript
IDC Results 2004/05
Geoffrey QhenaChief Executive Officer
26 October 2005
Mission
“To be the primary driving force of commercially sustainable industrial
development and innovation to the benefit of South Africa and the rest of
the African continent”
• Contribute to the generation of balanced, sustainable economic growth in South Africa and Africa
• Economically empower the South African population
• Promote entrepreneurship through the building of competitive industries and enterprises based on sound business principles
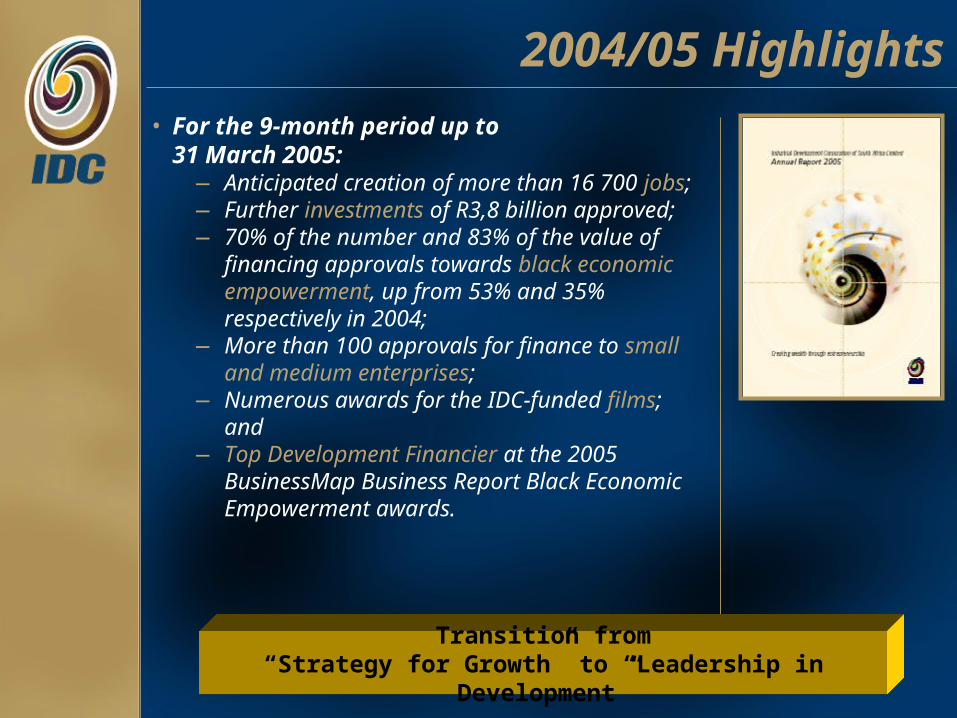
2004/05 Highlights• For the 9-month period up to
31 March 2005:— Anticipated creation of more than 16 700
jobs;— Further investments of R3,8 billion
approved;— 70% of the number and 83% of the value
of financing approvals towards black economic empowerment, up from 53% and 35% respectively in 2004;
— More than 100 approvals for finance to small and medium enterprises;
— Numerous awards for the IDC-funded films; and
— Top Development Financier at the 2005 BusinessMap Business Report Black Economic Empowerment awards.
Transition from“Strategy for Growth” to “Leadership in Development”

IDC’s Investment Activity
Net Value and Number of Approvals
0
1
2
3
4
5
6
7
8
1995
/96
1996
/97
1997
/98
1998
/99
1999
/00
2000
/01
2001
/02
2002
/03
2003
/04
2004
/05*
Val
ue
(R'b
n)
0
100
200
300
400
500
600
700
800
Nu
mb
er
Value of approvals (R'bn)
Number of approvals
Mozal I
Mozal II
• Approvals of more than R46 billion over the 10 year period, involving more than 3 300 deals;
* 9 month period
Shaded areas indicate annualised figures
Development - SMEs
0%
20%
40%
60%
80%
100%
120%
1995
/96
1996
/97
1997
/98
1998
/99
1999
/00
2000
/01
2001
/02
2002
/03
2003
/04
2004
/05*
% o
f to
tal
nu
mb
er
0
100
200
300
400
500
600
Nu
mb
er
% of total number of approvals
Number of approvals to SMEs
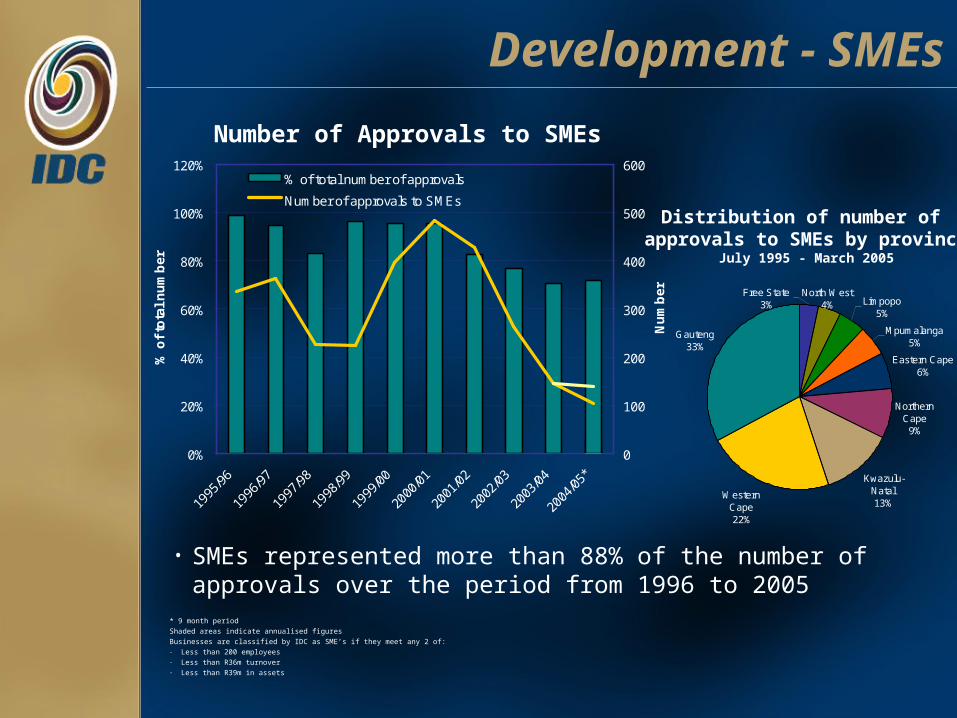
Number of Approvals to SMEs
• SMEs represented more than 88% of the number of approvals over the period from 1996 to 2005
* 9 month period
Shaded areas indicate annualised figures
Businesses are classified by IDC as SME’s if they meet any 2 of:- Less than 200 employees- Less than R36m turnover- Less than R39m in assets
Limpopo 5%
Mpumalanga 5%
Eastern Cape 6%
Northern Cape
9%
Kwazulu-Natal 13%
Western Cape 22%
Gauteng 33%
North West 4%
Free State 3%
Distribution of number of approvals to SMEs by province
July 1995 - March 2005
Development - SMEs
0% 2% 4% 6% 8% 10% 12% 14% 16% 18% 20%
Electricity, gas & water supply
Construction
Hotels & restaurants etc
Transport, storage & communication
Healthcare, education, media, etc
Electrical & electronic products
Financial, insurance and business services
Mining & quarrying
Wood, paper & printing Furniture, jewellery and other manufacturing
Wholesale & retail trade
Clothing, textiles & leather products
Machinery & metals products
Food, beverages & tobacco
Chemicals & other mineral products
Agriculture, forestry & fishing
% of Total
% of Total Value
% of Total Number
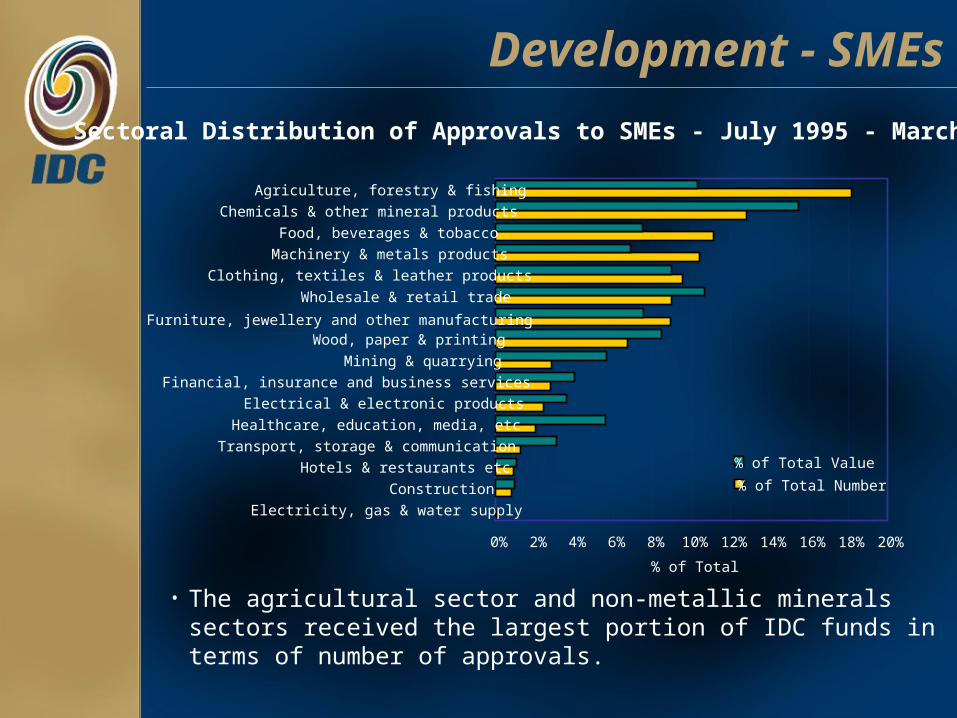
Sectoral Distribution of Approvals to SMEs - July 1995 - March 2005
• The agricultural sector and non-metallic minerals sectors received the largest portion of IDC funds in terms of number of approvals.
Investment Examples
Supported franchisees in townships such as Soweto, Tembisa, Taung, Mabopane, Vryburg, Lusikisiki, Mtubatuba, etc;
With support of European Union funds, invested in the development of cherry production in the Free State;
Supported the production of Kenaf fibre in Winterton in KwaZulu-Natal, for use in the global automotive industry;
Supported a call centre operation in the Eastern Cape;
Financed a new hospital in Lebowakgomo in Limpopo;
Supported a timber harvesting service provider in Mpumalanga;
Invested in an abalone aquaculture business in Hawston in the Western Cape.
Development - Regional
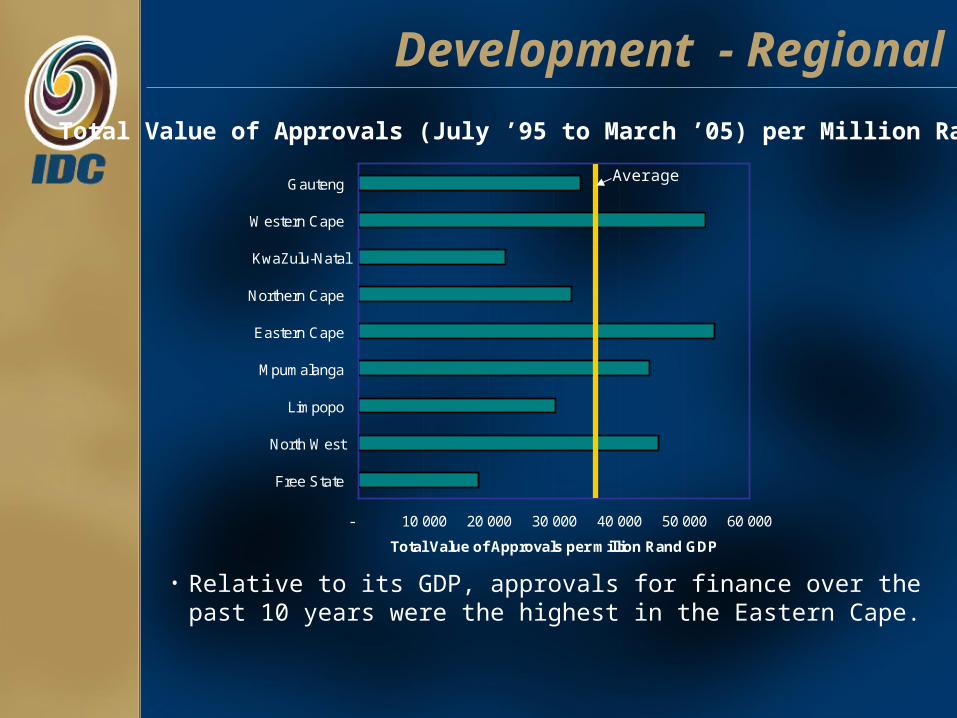
• Relative to its GDP, approvals for finance over the past 10 years were the highest in the Eastern Cape.
Total Value of Approvals (July ’95 to March ’05) per Million Rand GDP
- 10 000 20 000 30 000 40 000 50 000 60 000
Free State
North West
Limpopo
Mpumalanga
Eastern Cape
Northern Cape
KwaZulu-Natal
Western Cape
Gauteng
Total Value of Approvals per million Rand GDP
Average
Provincial engagement initiatives
Initiated process of provincial engagement to support Provincial Growth and Development Strategies
Started with Limpopo Province: – Investment Conference; and– Memorandum of Understanding with LimDev
Following-up in current year:– Investment conferences in, and MOUs with, North
West, Free State and Mpumalanga (planned)– Meetings with Premiers and Executive Councils of
Eastern Cape and Northern Cape (planned)
Local Development Agencies
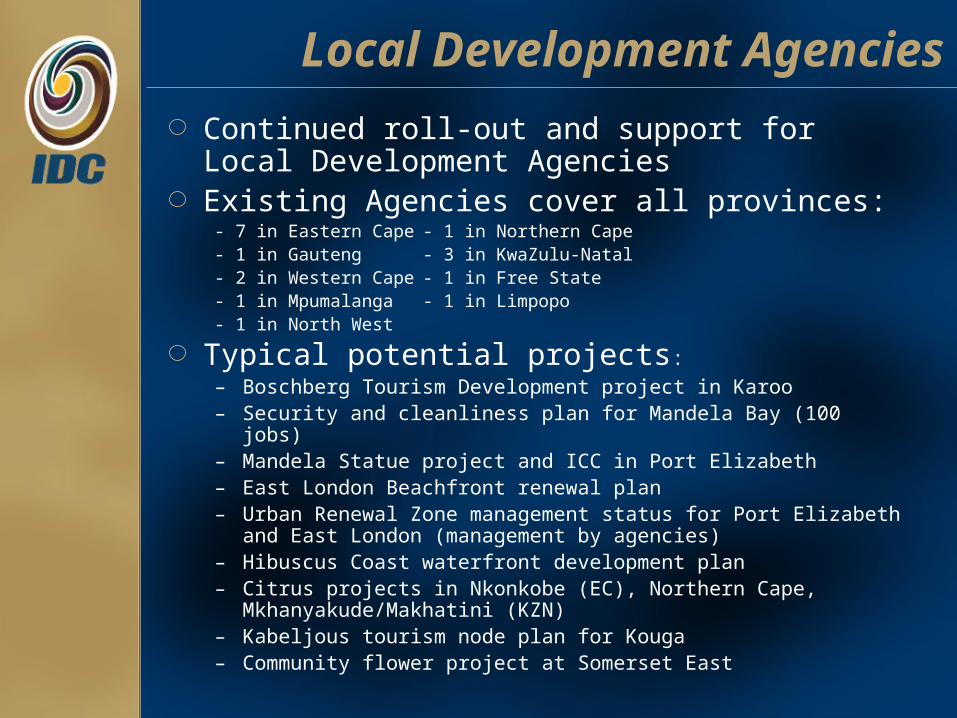
Continued roll-out and support for Local Development AgenciesExisting Agencies cover all provinces:
- 7 in Eastern Cape - 1 in Northern Cape- 1 in Gauteng - 3 in KwaZulu-Natal- 2 in Western Cape - 1 in Free State- 1 in Mpumalanga - 1 in Limpopo- 1 in North West
Typical potential projects:– Boschberg Tourism Development project in Karoo– Security and cleanliness plan for Mandela Bay (100 jobs)– Mandela Statue project and ICC in Port Elizabeth– East London Beachfront renewal plan– Urban Renewal Zone management status for Port Elizabeth and East
London (management by agencies)– Hibuscus Coast waterfront development plan– Citrus projects in Nkonkobe (EC), Northern Cape,
Mkhanyakude/Makhatini (KZN)– Kabeljous tourism node plan for Kouga– Community flower project at Somerset East
Development - BEE
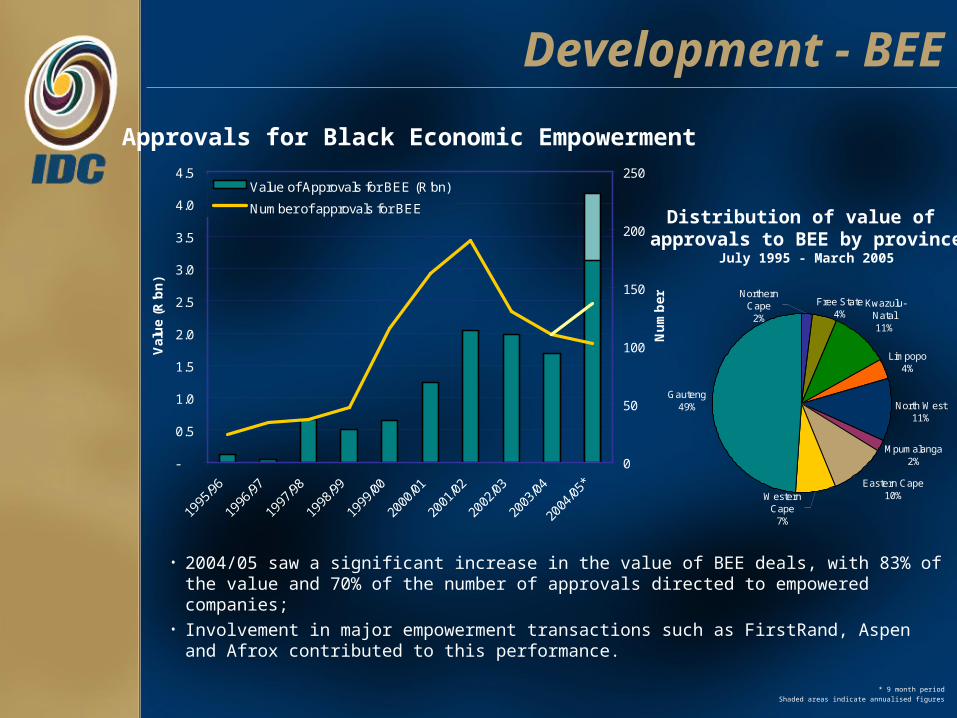
Approvals for Black Economic Empowerment
-
0.5
1.0
1.5
2.0
2.5
3.0
3.5
4.0
4.5
1995
/96
1996
/97
1997
/98
1998
/99
1999
/00
2000
/01
2001
/02
2002
/03
2003
/04
2004
/05*
Val
ue
(R'b
n)
0
50
100
150
200
250
Nu
mb
er
Value of Approvals for BEE (R'bn)
Number of approvals for BEE
• 2004/05 saw a significant increase in the value of BEE deals, with 83% of the value and 70% of the number of approvals directed to empowered companies;
• Involvement in major empowerment transactions such as FirstRand, Aspen and Afrox contributed to this performance.
* 9 month period
Shaded areas indicate annualised figures
Kwazulu-Natal 11%
Limpopo 4%
North West 11%
Mpumalanga 2%
Eastern Cape 10%
Gauteng 49%
Western Cape
7%
Northern Cape
2%
Free State 4%
Distribution of value of approvals to BEE by province
July 1995 - March 2005
Development - Job Creation
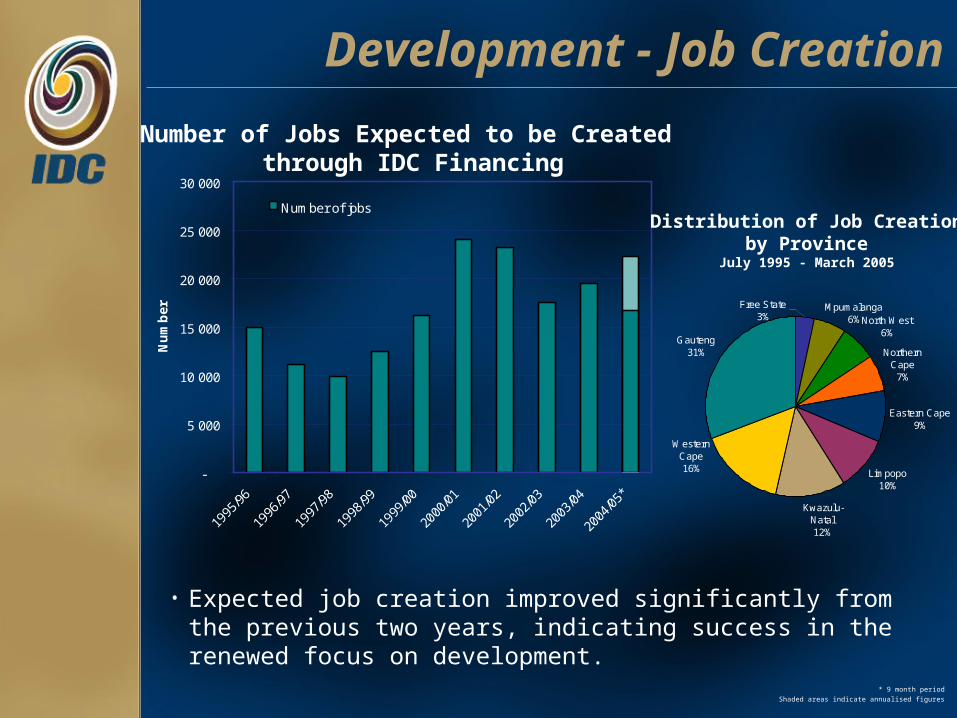
Number of Jobs Expected to be Created through IDC Financing
-
5 000
10 000
15 000
20 000
25 000
30 000
1995
/96
1996
/97
1997
/98
1998
/99
1999
/00
2000
/01
2001
/02
2002
/03
2003
/04
2004
/05*
Nu
mb
er
Number of jobs
• Expected job creation improved significantly from the previous two years, indicating success in the renewed focus on development.
* 9 month period
Shaded areas indicate annualised figures
North West 6%
Northern Cape
7%
Eastern Cape 9%
Limpopo 10%
Kwazulu-Natal 12%
Gauteng 31%
Mpumalanga 6%
Free State 3%
Western Cape 16%
Distribution of Job Creationby Province
July 1995 - March 2005

Development - Job Creation
- 10 20 30 40 50 60
Eastern Cape
Free State
Gauteng
KwaZulu-Natal
Limpopo
Mpumalanga
North West
Northern Cape
Western Cape
Number of IDC jobs per 1 000 people employed in the province
Number of IDC related jobs created per 1 000 people employed in each province
(July ’95 to March ’05)
Average
• Job creation in the Northern Cape benefited significantly over the past 10 years, through the implementation of high value added agricultural projects.

-0.5
-
0.5
1.0
1.5
2.0
2.5
3.0
1995
/96
1996
/97
1997
/98
1998
/99
1999
/00
2000
/01
2001
/02
2002
/03
2003
/04
2004
/05*
Val
ue
(R'b
n)
Value of approvals (R'bn)
Involvement in Africa
Net Value of Approvals
• Approvals for investments in Africa vary depending on opportunities – with large transactions such as Mozal and infrastructure related investments leading to higher investments in 2001 and 2003
* 9 month period
Shaded areas indicate annualised figures
“Leadership in Development”
Job creation in priority areas through:
• Active identification and development of investment opportunities in targeted areas
• Sectoral development strategies
• Targeted pricing discounts
• Focused service delivery
• Supporting expansionary and broad-based BEE
• Providing support for entrepreneurs
• Providing support for community groups
• Expanding IDC’s reach/presence
• Leveraging outside resources
• Identification of opportunities arising from the Soccer World Cup 2010
• Expanding the role of the IDC Training Academy outside IDC
IDC’s Goals for the Future
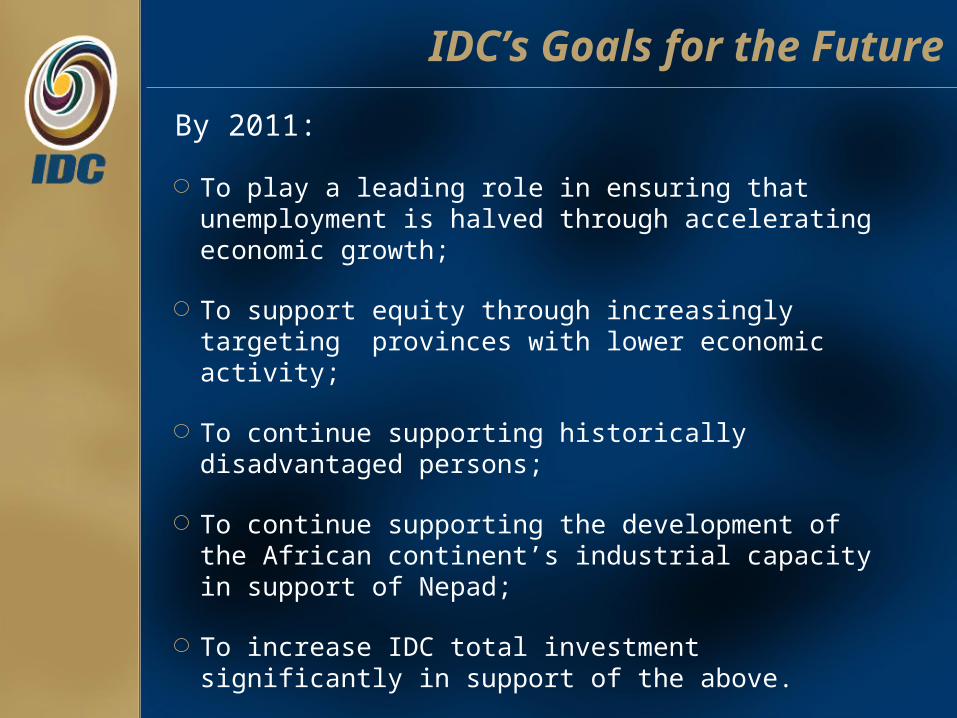
By 2011:
To play a leading role in ensuring that unemployment is halved through accelerating economic growth;
To support equity through increasingly targeting provinces with lower economic activity;
To continue supporting historically disadvantaged persons;
To continue supporting the development of the African continent’s industrial capacity in support of Nepad;
To increase IDC total investment significantly in support of the above.

Thank You
Gert GouwsChief Financial Officer
2004/2005Financial Results
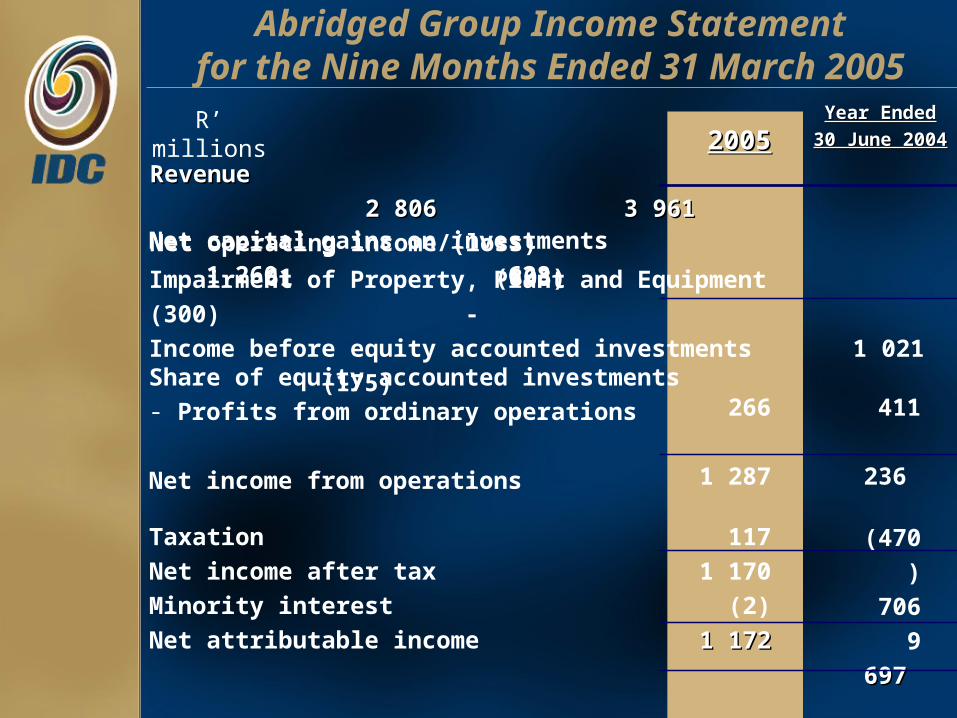
Abridged Group Income Statementfor the Nine Months Ended 31 March 2005
Share of equity accounted investments- Profits from ordinary operations
Net income from operations
266
1 287
411
236
20052005Year Ended Year Ended
30 June 30 June
20042004Revenue 2 806 Revenue 2 806
3 9613 961Net operating income/(loss) 61 (803)
TaxationNet income after taxMinority interestNet attributable income
1171 170
(2)
1 1721 172
(470)
7069
697697
R’ millions
Net capital gains on investments 1 260 628 Impairment of Property, Plant and Equipment (300) -Income before equity accounted investments 1 021 (175)

Analysis of Income Statement Itemsfor the Nine Months Ended 31 March 2005
200200
55
Year Ended Year Ended
30 June 200430 June 2004
1 2601 372 174
2 8062 806
1 564
2 053
344
3 3
961961
RevenueRevenue
Financing Activities FoskorOther subsidiaries
R’ millions %%
7(11)(33)
(6)
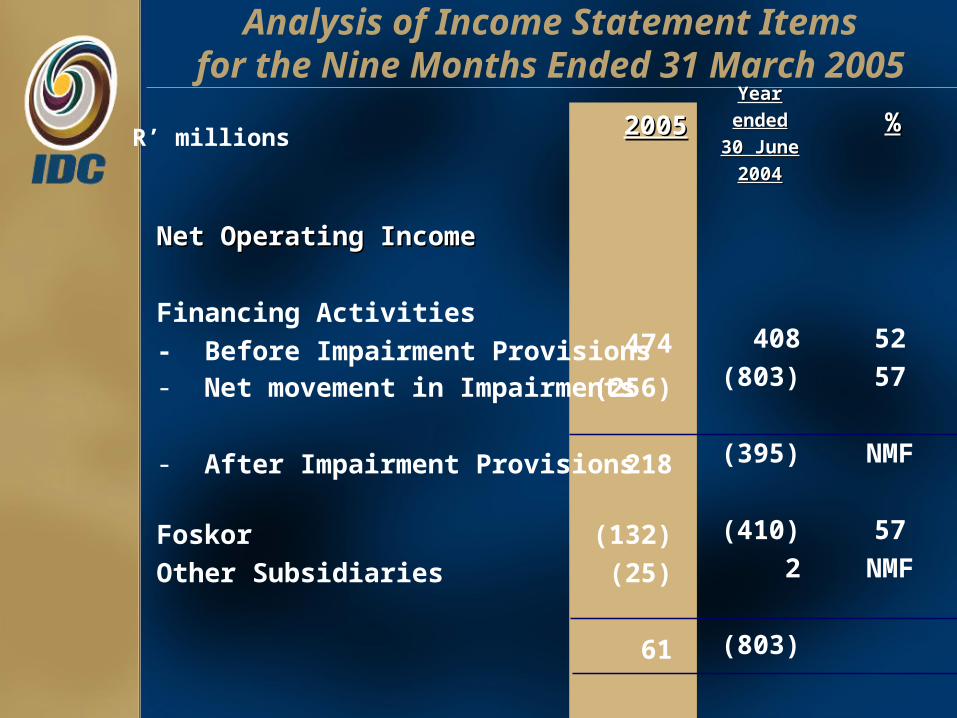
(256)
218
- Net movement in Impairments
- After Impairment Provisions
20052005
474
Net Operating IncomeNet Operating Income
Financing Activities- Before Impairment Provisions
FoskorOther Subsidiaries
Analysis of Income Statement Itemsfor the Nine Months Ended 31 March 2005
R’ millions
(132)(25)
61
Year Year
ended ended
30 June 30 June
20042004
%%
408(803)
(395)
(410)2
(803)
5257
NMF
57NMF
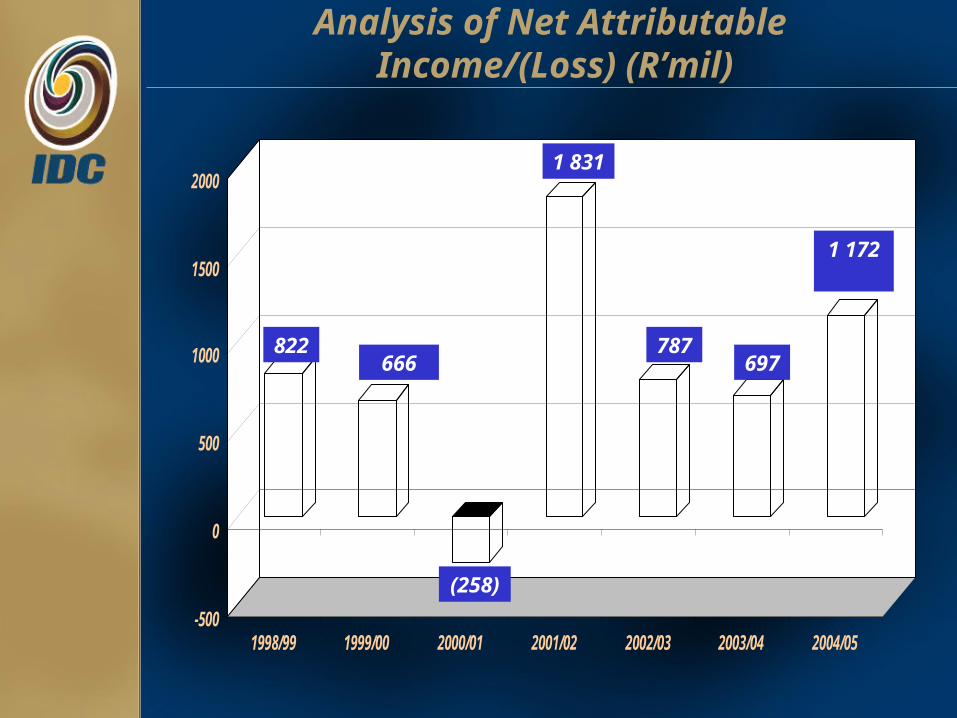
Analysis of Net Attributable Income/(Loss) (R’mil)
-500
0
500
1000
1500
2000
1998/99 1999/00 2000/01 2001/02 2002/03 2003/04 2004/05
1 172
822666
(258)
1 831
787697

Abridged Group Balance Sheetas at 31 March 2005
2005
2 08130
5922 7751 145
36 36
593593
1 666
25 059
3 1741 041
30 30
940940
AssetsAssets
Cash and cash equivalentsLoans, advances and investmentsProperty, plant & equipment & InventoriesOther assets
Debt/Equity Ratio 16%16% 21%21%
Equity and LiabilitiesEquity and Liabilities
Capital and reservesLong-term loansDeferred taxationOther liabilities
29 806
4 803643
1 341
36 36
593593
24
5415 038
-1 361
30 30
940940
30 June 30 June 20042004
R’ millions
Thank You
Related Documents