ICT ENTERTAINMENT APPLIANCES’ IMPACT ON DOMESTIC ELECTRICITY CONSUMPTION Mary Pothitou 1,* , Richard F. Hanna 2 , Konstantinos J. Chalvatzis 3,4 1 Cranfield Energy, School of Energy, Environment and Agrifood (SEEA), Cranfield University, MK43 0AL, UK 2 School of Construction Management and Engineering, University of Reading, RG6 6AH, UK 3 Norwich Business School, University of East Anglia, NR4 7TJ, UK 4 Tyndall Centre for Climate Change Research, University of East Anglia, NR4 7TJ, UK ABSTRACT Increased electricity consumption and environmental impacts of Information Communication Technology (ICT) have been subjects of research since the 1990s. This paper focuses on consumer electronics in households, in particular TVs, computers and their peripherals. ICT accounts for almost 15% of global domestic electricity use, including waste energy from devices left on standby which is estimated in the EU-27 to contribute 6% of residential energy demand. In Europe, the household electricity consumption from small electronic appliances, including ICT, increased by 2.5 times in 2011 compared to 1990. Similarly, in the UK, energy demand from electronic devices accounted for 23% of total household electricity use in 2012, compared to 12% in 1990. This is an outcome of the market saturation of new, cheaper ICT entertainment devices, facilitated by marketing strategies which identify new needs for consumers, as charted by the review of market growth in this paper. New increasingly portable laptops, smart phones and tablets with wireless connectivity allow householders to perform a wider range of activities in a wider range of locations throughout the home, such as social networking while the television is active. We suggest that policies which consider how to increase the energy efficiency of ICT devices alone are unlikely to be successful since effective strategies need to address how the drivers which have developed around the use of ICT can be adapted in order to conserve electricity in households. A range of policy solutions are discussed, including feedback, public information campaigns, environmental

Welcome message from author
This document is posted to help you gain knowledge. Please leave a comment to let me know what you think about it! Share it to your friends and learn new things together.
Transcript
ICT ENTERTAINMENT APPLIANCES’ IMPACT ON DOMESTIC ELECTRICITY CONSUMPTION
Mary Pothitou1,*, Richard F. Hanna2, Konstantinos J. Chalvatzis3,4
1Cranfield Energy, School of Energy, Environment and Agrifood (SEEA), Cranfield University, MK43 0AL, UK 2School of Construction Management and Engineering, University of Reading, RG6 6AH, UK 3Norwich Business School, University of East Anglia, NR4 7TJ, UK 4Tyndall Centre for Climate Change Research, University of East Anglia, NR4 7TJ, UK
ABSTRACT
Increased electricity consumption and environmental impacts of Information Communication Technology (ICT) have been subjects of
research since the 1990s. This paper focuses on consumer electronics in households, in particular TVs, computers and their peripherals.
ICT accounts for almost 15% of global domestic electricity use, including waste energy from devices left on standby which is estimated in
the EU-27 to contribute 6% of residential energy demand. In Europe, the household electricity consumption from small electronic
appliances, including ICT, increased by 2.5 times in 2011 compared to 1990. Similarly, in the UK, energy demand from electronic devices
accounted for 23% of total household electricity use in 2012, compared to 12% in 1990. This is an outcome of the market saturation of
new, cheaper ICT entertainment devices, facilitated by marketing strategies which identify new needs for consumers, as charted by the
review of market growth in this paper. New increasingly portable laptops, smart phones and tablets with wireless connectivity allow
householders to perform a wider range of activities in a wider range of locations throughout the home, such as social networking while the
television is active.
We suggest that policies which consider how to increase the energy efficiency of ICT devices alone are unlikely to be successful since
effective strategies need to address how the drivers which have developed around the use of ICT can be adapted in order to conserve
electricity in households. A range of policy solutions are discussed, including feedback, public information campaigns, environmental
2
education, energy labelling, bans of, or taxation on the least efficient products as well as the use of a TV as central hub to perform the
existing functions of multiple devices.
Keywords: ICT devices, TVs, computers, social practices, household energy savings
*Corresponding author: E-mail address: [email protected]; [email protected] (M. Pothitou). Current Address: Technologies for
Sustainable Built Environments (TSBE) Centre, University of Reading, United Kingdom.
1. INTRODUCTION
Since the early 1990s, Information and Communication Technology (ICT) has been studied owing to its environmental
implications (e.g. raw materials’ extraction, use of chemical materials and their electronic waste disposal) and impact on
electricity consumption. Extensive research on energy impacts specifically has been carried out since these studies generally
indicate the environmental effects and the direct impact of ICT equipment on electricity consumption, considering also
standby energy use [1]. The International Energy Agency (IEA) [2], argues that between 1990 and 2008, electricity
consumption with regard to ICT (including consumer electronics), in the residential sector, increased globally by
approximately 7% per annum. Future trends foresee a further 250% growth in ICT electricity use by 2030, despite
enhancements predicted in the energy efficiency of electronic equipment [2, p. 237]. Therefore, the environmental implications
from ICT equipment were a focus for research, particularly from the late 1990s to the early 2000s, when the rise of the internet
created a ‘new economy’. An interest of more recent empirical studies has been motivated by the potential reduction of
greenhouse gas emissions which ICT could induce [3].
3
According to Ropke and Christensen [1], the concept of ICT, despite its wider applicability, is usually associated with
products and services relevant to entertainment (e.g. consumer electronics such as TVs, computers, radios, music, and console
games), communication (e.g. mobile phones) and administrative tasks (e.g. word-processing and calculations). The integration
of entertainment devices into a broad variety of social practices in daily life, and the implications for domestic electricity
demand, is reviewed in this paper. Currently, ICT is responsible for nearly 15% of global electricity consumption in the
residential sector [2]. IEA [2] anticipates that electricity consumption from these products will double by 2022 and triple by
2030, which corresponds to 1700 TWh by 2030, under a business as usual (BAU) scenario.
The ICT sector is contributing significantly to economies worldwide though increased ownership of personal computers,
mobile phones and, in turn, connection to the internet. Between 2000 and 2010, the number of internet users per 100
inhabitants doubled in developed countries and increased by 153% globally, respectively, while 62% of households had
internet access in developed countries, compared to 75% for the world as a whole [1].
The aim of this paper is to critically review the role of television and computers in increasing electricity consumption in
households, and discuss strategies to address key challenges with reducing residential electricity use from ICT. To achieve
this, different perspectives are integrated from market economics, psychology, social practice theory, and empirical energy
monitoring studies.
Section 2 sets out the methodological approach for conducting a literature review based on different disciplinary
perspectives. The findings of the literature review are presented in Sections 3 to 5. The first output from the review discussed
in Sections 3.1 to 3.3 draws upon a comparison of literature on domestic entertainment appliances’ energy use at a European
scale and studies conducted at a country scale, in particular the United Kingdom, the United States and Australia. Sections 3.4
4
details further distinct output from the review, chronicling the history of the market growth of ICT entertainment appliances.
Section 4 considers drivers of ICT energy use in households, and specifically the social practices that have developed around
these new technologies. Section 5 forms the final component of the review, presenting a critique of the relative strengths and
weaknesses of existing and potential strategies aimed at addressing increased electricity usage from ICT devices in the
residential sector. The final section interprets the findings with respect to interdisciplinary perspectives considered in this
review.
2. METHODOLOGY
This review follows a systematic, rapid evidence assessment approach, which reflects the standard methodology
adopted by the UK Energy Research Centre for technology and policy assessments (Speirs et al., 2015), and recent guidance
by Defra on the production of more efficient systematic reviews for the environmental sciences (Defra, 2015). In our study,
relevant literature was identified in the field of domestic energy demand for ICT entertainment appliances, following a three-
step procedure similar to Kamilaris et al. [4], comprising successive stages of (1) conducting a keyword search; (2) identifying
common themes and grouping relevant literature by theme; and (3) selecting a final sample of research studies for detailed
review.
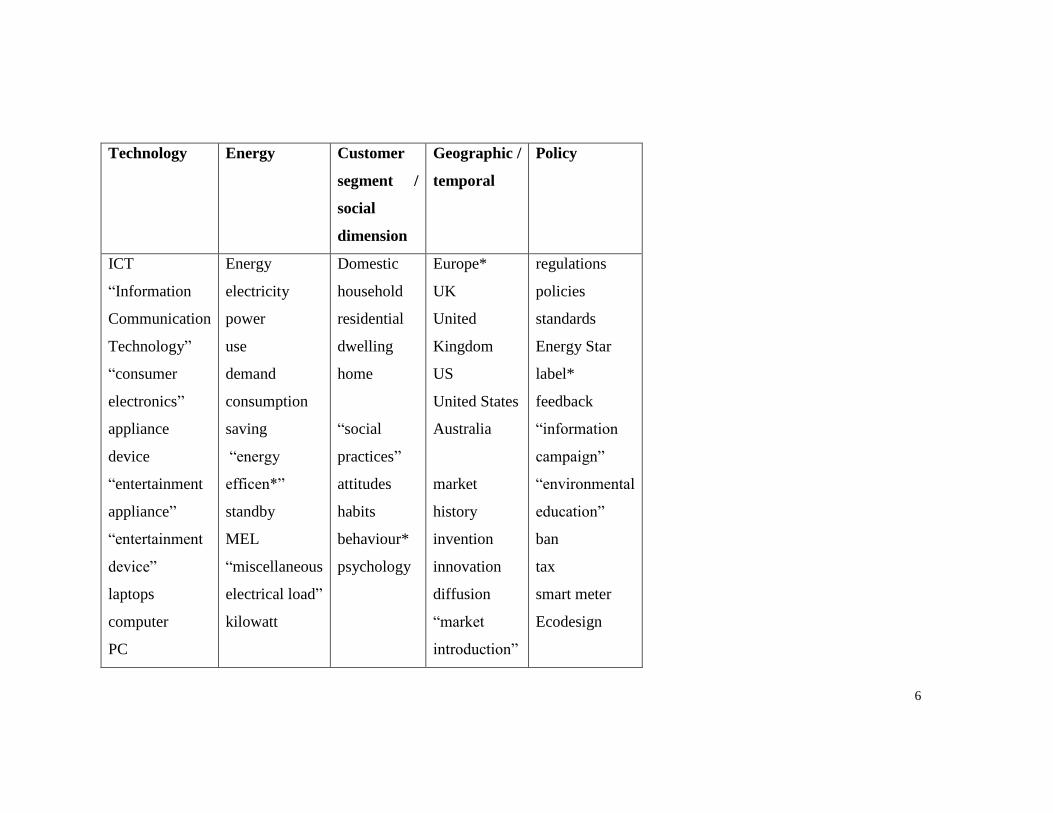
Initially, keywords grouped under different categories related to the research topic (Table 1) were combined with
Boolean operators to identify relevant academic papers in Science Direct and Web of Knowledge, while relevant grey
literature was extracted from Google Scholar and Scopus using identical keyword searches [4,5]. The criteria for extracting
5
relevant literature was that retrieved documents should be available online, written in English, focus on the UK, European
countries, the US or Australia, and contain material on ICT appliances, specifically televisions or the personal computer. In
addition, articles were considered relevant if they pertained to one or more of the following: (1) the energy consumption or
demand of these appliances in the residential sector; (2) social practices or behavioural aspects pertaining to ICT in
households; (3) the market development and innovation history of the TV and personal computer; (4) policy recommendations
on how to manage energy demand from domestic ICT use.
The second stage was to group the extracted documents according to four broad categories: technology, economics,
psychological perspectives and social practices. These categories are based on the viewpoints that the level of household
energy consumption is embedded in a complex system which involves technology adoption, behavioural economics, and social
as well as psycho-social elements [6,7]. Similar themes were then identified based on this categorization, which had relevance
to the research aims, namely: the impact of ICT entertainment devices on residential electricity demand; the influence of
market factors on the proliferation of these technologies; the shaping of household energy demanding practices which have
emerged through ICT; and regulations and policies aiming to enhance technological efficiency and reduce electricity demand
from home entertainment devices; and theoretical perspectives applied to the study of ICT at home.
Table 1. Keywords used to identify relevant literature
Keyword categories
6
Technology Energy Customer
segment /
social
dimension
Geographic /
temporal
Policy
ICT
“Information
Communication
Technology”
“consumer
electronics”
appliance
device
“entertainment
appliance”
“entertainment
device”
laptops
computer
PC
Energy
electricity
power
use
demand
consumption
saving
“energy
efficen*”
standby
MEL
“miscellaneous
electrical load”
kilowatt
Domestic
household
residential
dwelling
home
“social
practices”
attitudes
habits
behaviour*
psychology
Europe*
UK
United
Kingdom
US
United States
Australia
market
history
invention
innovation
diffusion
“market
introduction”
regulations
policies
standards
Energy Star
label*
feedback
“information
campaign”
“environmental
education”
ban
tax
smart meter
Ecodesign
7
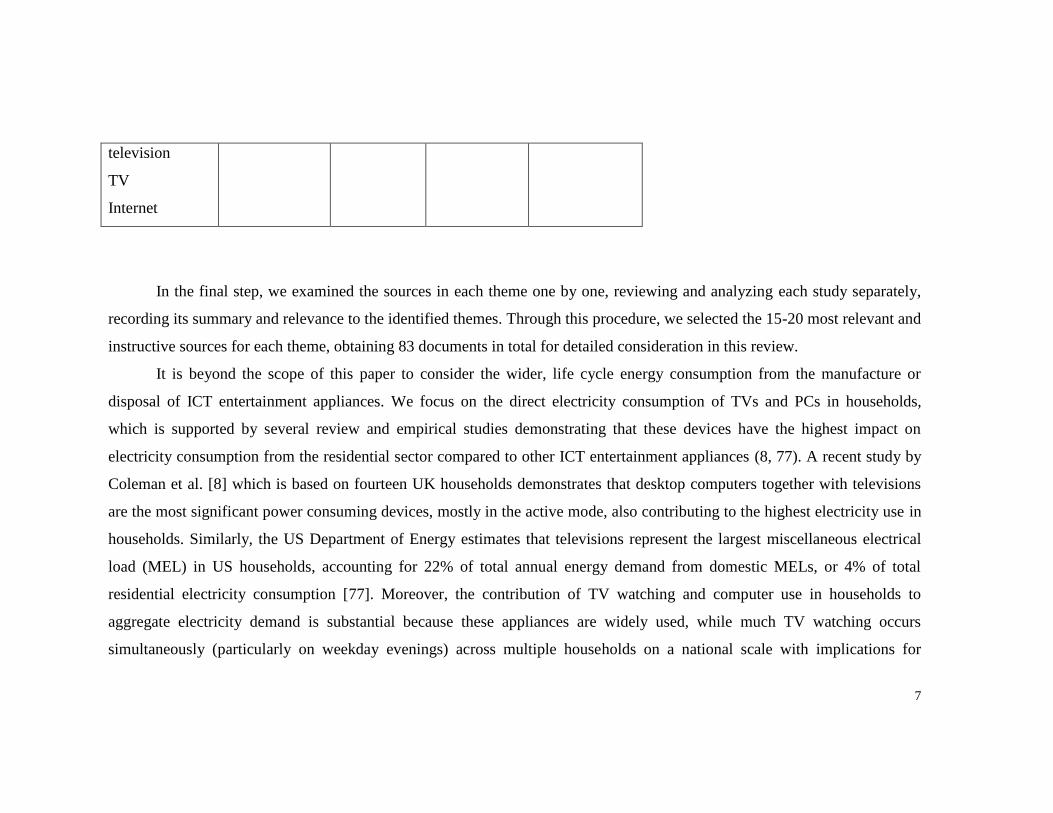
television
TV
Internet
In the final step, we examined the sources in each theme one by one, reviewing and analyzing each study separately,
recording its summary and relevance to the identified themes. Through this procedure, we selected the 15-20 most relevant and
instructive sources for each theme, obtaining 83 documents in total for detailed consideration in this review.
It is beyond the scope of this paper to consider the wider, life cycle energy consumption from the manufacture or
disposal of ICT entertainment appliances. We focus on the direct electricity consumption of TVs and PCs in households,
which is supported by several review and empirical studies demonstrating that these devices have the highest impact on
electricity consumption from the residential sector compared to other ICT entertainment appliances (8, 77). A recent study by
Coleman et al. [8] which is based on fourteen UK households demonstrates that desktop computers together with televisions
are the most significant power consuming devices, mostly in the active mode, also contributing to the highest electricity use in
households. Similarly, the US Department of Energy estimates that televisions represent the largest miscellaneous electrical
load (MEL) in US households, accounting for 22% of total annual energy demand from domestic MELs, or 4% of total
residential electricity consumption [77]. Moreover, the contribution of TV watching and computer use in households to
aggregate electricity demand is substantial because these appliances are widely used, while much TV watching occurs
simultaneously (particularly on weekday evenings) across multiple households on a national scale with implications for
8
system-wide demand management [9,10,11]. This aggregate affect is compounded by increasing rates of TV and computer
ownership per household [12,13,14].
3. HOUSEHOLD APPLIANCES AND ELECTRICITY CONSUMPTION
3.1 BACKGROUND: CLASSIFICATIONS AND MOST COMMON PATTERNS
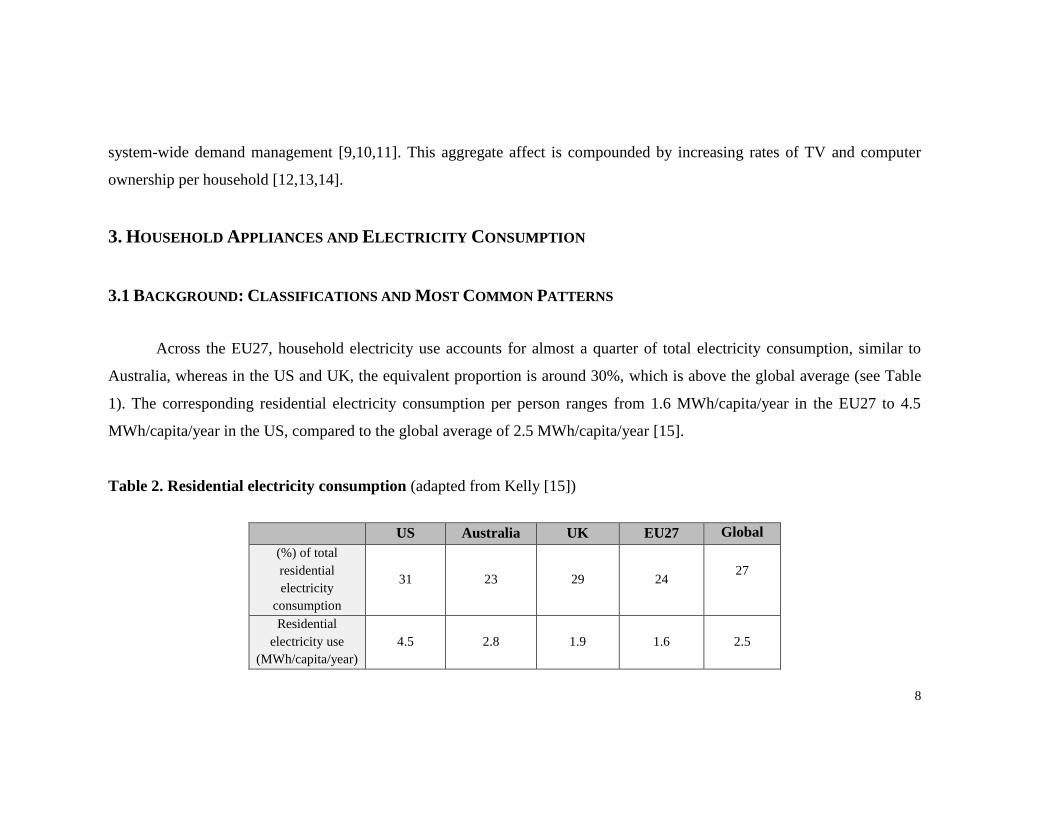
Across the EU27, household electricity use accounts for almost a quarter of total electricity consumption, similar to
Australia, whereas in the US and UK, the equivalent proportion is around 30%, which is above the global average (see Table
1). The corresponding residential electricity consumption per person ranges from 1.6 MWh/capita/year in the EU27 to 4.5
MWh/capita/year in the US, compared to the global average of 2.5 MWh/capita/year [15].
Table 2. Residential electricity consumption (adapted from Kelly [15])
US Australia UK EU27 Global
(%) of total
residential
electricity
consumption
31 23 29 24
27
Residential
electricity use
(MWh/capita/year)
4.5 2.8 1.9 1.6
2.5
9
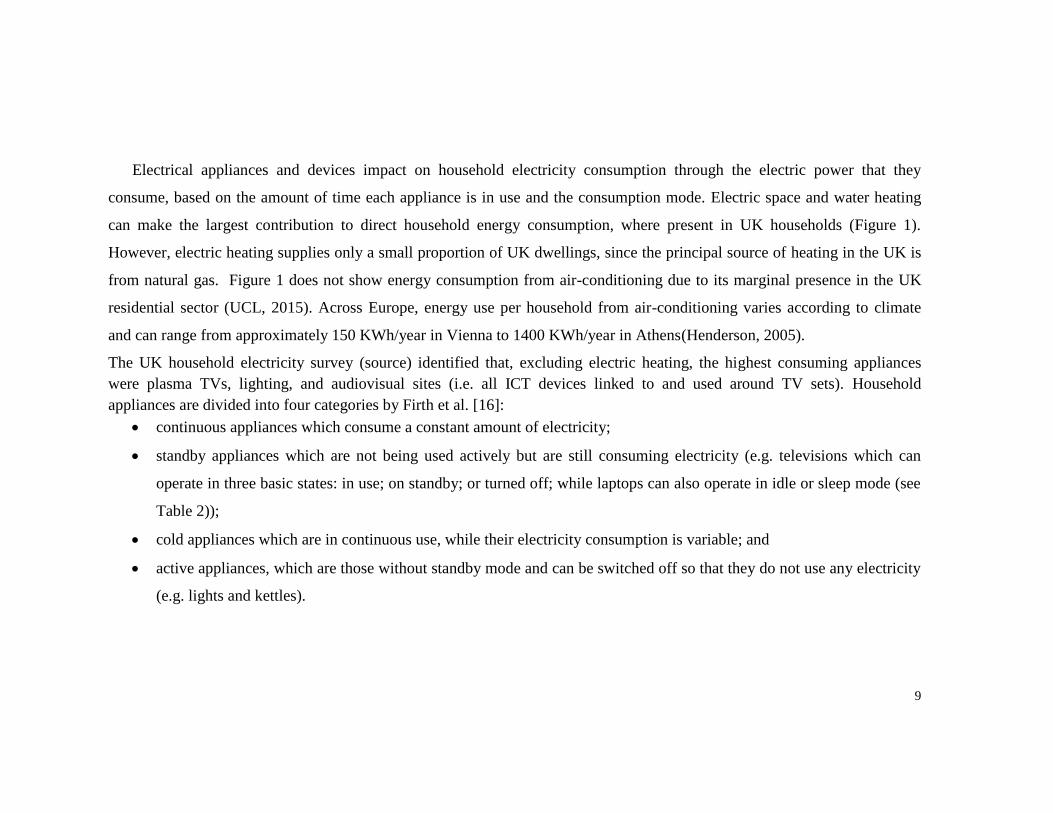
Electrical appliances and devices impact on household electricity consumption through the electric power that they
consume, based on the amount of time each appliance is in use and the consumption mode. Electric space and water heating
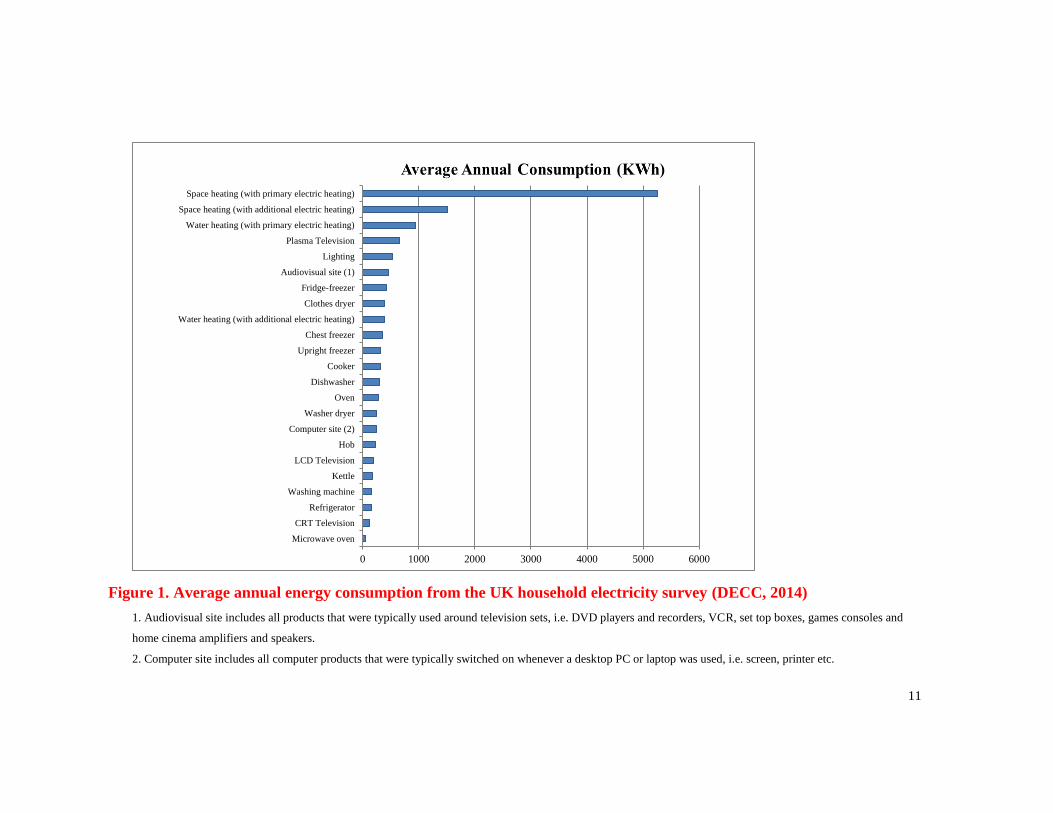
can make the largest contribution to direct household energy consumption, where present in UK households (Figure 1).
However, electric heating supplies only a small proportion of UK dwellings, since the principal source of heating in the UK is
from natural gas. Figure 1 does not show energy consumption from air-conditioning due to its marginal presence in the UK
residential sector (UCL, 2015). Across Europe, energy use per household from air-conditioning varies according to climate
and can range from approximately 150 KWh/year in Vienna to 1400 KWh/year in Athens(Henderson, 2005).
The UK household electricity survey (source) identified that, excluding electric heating, the highest consuming appliances
were plasma TVs, lighting, and audiovisual sites (i.e. all ICT devices linked to and used around TV sets). Household
appliances are divided into four categories by Firth et al. [16]:
continuous appliances which consume a constant amount of electricity;
standby appliances which are not being used actively but are still consuming electricity (e.g. televisions which can
operate in three basic states: in use; on standby; or turned off; while laptops can also operate in idle or sleep mode (see
Table 2));
cold appliances which are in continuous use, while their electricity consumption is variable; and
active appliances, which are those without standby mode and can be switched off so that they do not use any electricity
(e.g. lights and kettles).
10
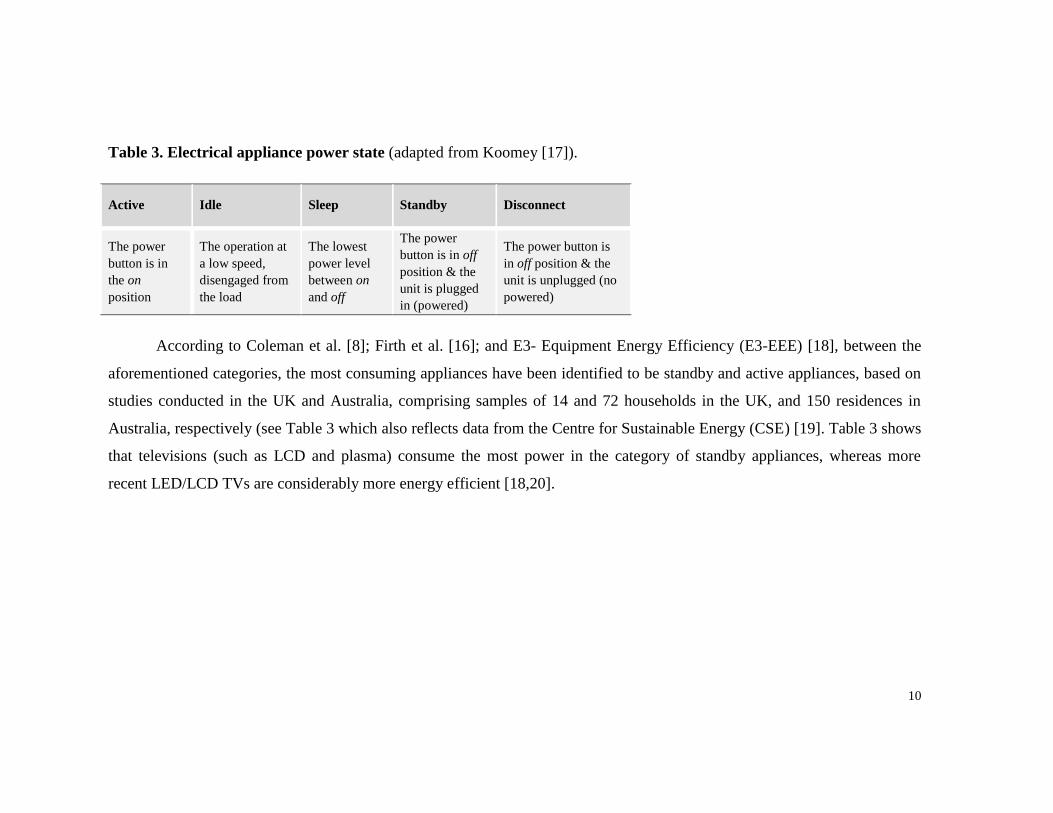
Table 3. Electrical appliance power state (adapted from Koomey [17]).
Active Idle Sleep Standby Disconnect
The power
button is in
the on
position
The operation at
a low speed,
disengaged from
the load
The lowest
power level
between on
and off
The power
button is in off
position & the
unit is plugged
in (powered)
The power button is
in off position & the
unit is unplugged (no
powered)
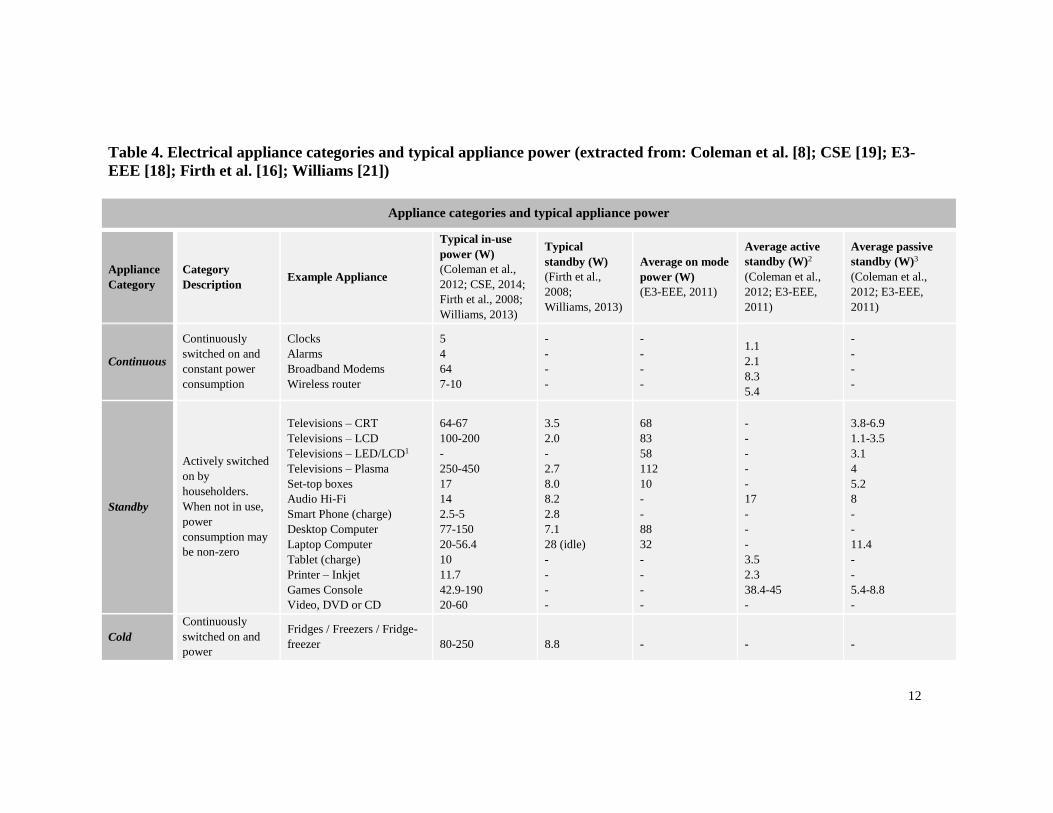
According to Coleman et al. [8]; Firth et al. [16]; and E3- Equipment Energy Efficiency (E3-EEE) [18], between the
aforementioned categories, the most consuming appliances have been identified to be standby and active appliances, based on
studies conducted in the UK and Australia, comprising samples of 14 and 72 households in the UK, and 150 residences in
Australia, respectively (see Table 3 which also reflects data from the Centre for Sustainable Energy (CSE) [19]. Table 3 shows
that televisions (such as LCD and plasma) consume the most power in the category of standby appliances, whereas more
recent LED/LCD TVs are considerably more energy efficient [18,20].
11
Figure 1. Average annual energy consumption from the UK household electricity survey (DECC, 2014)
1. Audiovisual site includes all products that were typically used around television sets, i.e. DVD players and recorders, VCR, set top boxes, games consoles and
home cinema amplifiers and speakers.
2. Computer site includes all computer products that were typically switched on whenever a desktop PC or laptop was used, i.e. screen, printer etc.
0 1000 2000 3000 4000 5000 6000
Microwave oven
CRT Television
Refrigerator
Washing machine
Kettle
LCD Television
Hob
Computer site (2)
Washer dryer
Oven
Dishwasher
Cooker
Upright freezer
Chest freezer
Water heating (with additional electric heating)
Clothes dryer
Fridge-freezer
Audiovisual site (1)
Lighting
Plasma Television
Water heating (with primary electric heating)
Space heating (with additional electric heating)
Space heating (with primary electric heating)
12
Table 4. Electrical appliance categories and typical appliance power (extracted from: Coleman et al. [8]; CSE [19]; E3-
EEE [18]; Firth et al. [16]; Williams [21])
Appliance categories and typical appliance power
Appliance
Category
Category
Description Example Appliance
Typical in-use
power (W)
(Coleman et al.,
2012; CSE, 2014;
Firth et al., 2008;
Williams, 2013)
Typical
standby (W)
(Firth et al.,
2008;
Williams, 2013)
Average on mode
power (W)
(E3-EEE, 2011)
Average active
standby (W)2
(Coleman et al.,
2012; E3-EEE,
2011)
Average passive
standby (W)3
(Coleman et al.,
2012; E3-EEE,
2011)
Continuous
Continuously
switched on and
constant power
consumption
Clocks
Alarms
Broadband Modems
Wireless router
5
4
64
7-10
-
-
-
-
-
-
-
-
1.1
2.1
8.3
5.4
-
-
-
-
Standby
Actively switched
on by
householders.
When not in use,
power
consumption may
be non-zero
Televisions – CRT
Televisions – LCD
Televisions – LED/LCD1
Televisions – Plasma
Set-top boxes
Audio Hi-Fi
Smart Phone (charge)
Desktop Computer
Laptop Computer
Tablet (charge)
Printer – Inkjet
Games Console
Video, DVD or CD
64-67
100-200
-
250-450
17
14
2.5-5
77-150
20-56.4
10
11.7
42.9-190
20-60
3.5
2.0
-
2.7
8.0
8.2
2.8
7.1
28 (idle)
-
-
-
-
68
83
58
112
10
-
-
88
32
-
-
-
-
-
-
-
-
-
17
-
-
-
3.5
2.3
38.4-45
-
3.8-6.9
1.1-3.5
3.1
4
5.2
8
-
-
11.4
-
-
5.4-8.8
-
Cold
Continuously
switched on and
power
Fridges / Freezers / Fridge-
freezer
80-250
8.8
-
-
-
13
consumption
cycles between
zero and a set
power level
Active Actively switched
on by
householders.
When not in use,
power
consumption is
zero.
Kettles
Electric hobs
Washing Machines
Electric Showers
Lighting – CFL
Lighting – Incandescent
2000–3000
2500
2000
4000–9000
9-13
60–100
-
-
-
-
-
-
-
-
-
-
-
-
-
-
5.9
-
-
-
-
-
-
-
-
-
1The most energy efficient LED/LCD TVs with an Energy Star label available in 2015 have lower power ratings ranging from 10W to 26W for screen
sizes of 16 to 32 inches, and from 30W to 42W for screen sizes of 39 to 50 inches [20].
2Active standby: “The power used when the appliance is on, but not performing its main function (e.g. when a DVD recorder is on but not recording or
playing)” [8, p.63]
3 Passive standby: “The power used when the appliance is not performing its main function, but is in a state waiting to be switched on or is performing a
secondary function (e.g. when a television has been switched off by the remote control)” [8, p.63]
14
3.2 HISTORICAL REVIEW OF EUROPEAN HOUSEHOLD ENTERTAINMENT
APPLIANCES’ CONSUMPTION
A chronological review of the electricity consumption from domestic appliances
in European countries tracks changes in household electricity consumption since
1973. In the early 1980s, the most consuming appliances were white goods (e.g.
washing machines and refrigerators), while nowadays the appliances which impact on
an increase of electricity usage are household ICT and small kitchen devices [22,23].
For example, the typical electricity use of a TV set-top box is similar to that of an
Energy Star rated refrigerator [24], while computing electricity consumption per
residence is usually greater than the total energy consumed by washing clothes/dishes
[25].
Between 1973 and 1998 residential electricity demand in the IEA-11 doubled:
two-thirds of this growth was due to electrical appliances. During the 2000s, the 2%
per annum growth in electricity consumption from electrical appliances and lighting
in half of the EU-27 countries (compared to 1.7% per annum on average for all of the
EU) has been attributed by Lapillonne et al. [26] to several factors across a number of
European countries, such as Estonia and Latvia, which experienced accelerated
economic growth and increased ownership of domestic appliances.
By 2009, typically in the EU, electrical appliances (e.g. cold appliances such as
fridges and freezers, and washing appliances; ICT equipment including TVs,
computers; and other small appliances) and lighting contributed over 60% of total
residential electricity demand. In particular, small appliances doubled their share of
household electricity consumption from 18% in 1990 to 39% in 2009. The electricity
consumed for small appliances per household is 2.5 times higher in 2011 (790
kWh/annum) than in 1990 (310 kWh/annum). While there was increased market
penetration of televisions over this time, electricity demand from TVs actually fell
gradually until the year 2000, prior to a growth in their contribution to electricity
demand caused by a proliferation in the purchase of larger TVs [26,27].
In 2007, electricity consumed by TVs in the member states of the EU-27 was
assessed by IEA [2] as 60TWh (54 TWh in on-mode and 6 TWh in stand-by/off-
mode). This level of energy use is attributed to the increased ownership of TVs per
household, without replacing old devices, as well as increases in viewing-time which
15
offset improvements in the efficiency of contemporary models. Indeed, from 2006 to
2010, there was a 21% reduction on average in the energy use per TV set from 219
kWh/year to 173kWh/year [28]. Savings from TVs are projected to be around 43
TWh/annum by 2020, due to energy labelling and requirements for improved
performance.
Nevertheless, TV screen size impacts on increased electricity consumption, as
larger screens are more energy intensive. Recently, there has been a strong demand
for larger TVs, with 54% of television purchases in 2013 being for screen sizes of 39
inches or greater [29]. Similarly, in the case of computers, larger screen sizes have
become more popular in OECD countries recently, following reductions in the cost of
larger LCD monitors (e.g. 19 to 30 inches) [2].
3.3 HISTORICAL REVIEW OF THE UK’S HOUSEHOLD ENTERTAINMENT
APPLIANCES’ CONSUMPTION
At a national scale, and specifically in the UK in 1990, domestic appliances
together with lighting, accounted for more than a fifth of annual electricity use, close
to a quarter of peak electricity demand, resulting in 40 million tonnes of CO2
emissions [14]. A historical review of household appliances in the UK showed that
electricity use in 2002 was 89TWh, twice the figure in 1972 [12]. Thus, increased
rates of electronic appliance ownership have led to energy demand from electronics
being equivalent to 23% of total household electricity use in 2012, rising from 12% in
1990 [73].
Televisions, specifically, accounted for 270KWh/household/year or 73% of total
consumption from residential consumer electronics in 2012, compared to
217KWh/household/year or 72% in 1990 [73]. While half of households in Great
Britain owned a colour TV set in 1976, the average ownership rate increased to 1.6
sets per home in 1994 [14] and 2.4 TVs per household in 2004 and in 2012 [12,73].
Altogether, electricity consumption from colour televisions was 5.3 TWh in 1987,
compared to 7.2 TWh in 1994. In all years, from 1975 to 2012, only 2% to 3% of all
UK households did not own a TV [73].
With respect to computers, the ownership of personal computers was very low in
1982, amounting to only 3% of the population in the UK. This proportion increased
16
sharply so that by 2004, 60% of UK households owned at least one PC. Following the
trend with computers, the ownership of printers increased enormously from 0.7% in
1983 to 58% in 2004 [13]. Data from DECC [73] reveals that from 2005 to 2012, the
number of laptops and printers owned in UK households increased by eight times and
two and a half times, respectively. By 2012, there was an average of one laptop and
one printer per household in the UK, while only 40% of households owned desktop
computers [73,74,75]. Consequently, between 2000 and 2012, the total energy
consumed by computers in the UK domestic sector approximately doubled, due to
rapid increases in laptop ownership and Internet access counteracting declining
ownership of more energy intensive desktop computers [75]. By 2014, entertainment
devices such as TVs and games consoles were responsible for 26% of domestic
electricity use with computing equipment contributing an additional 8% [36].
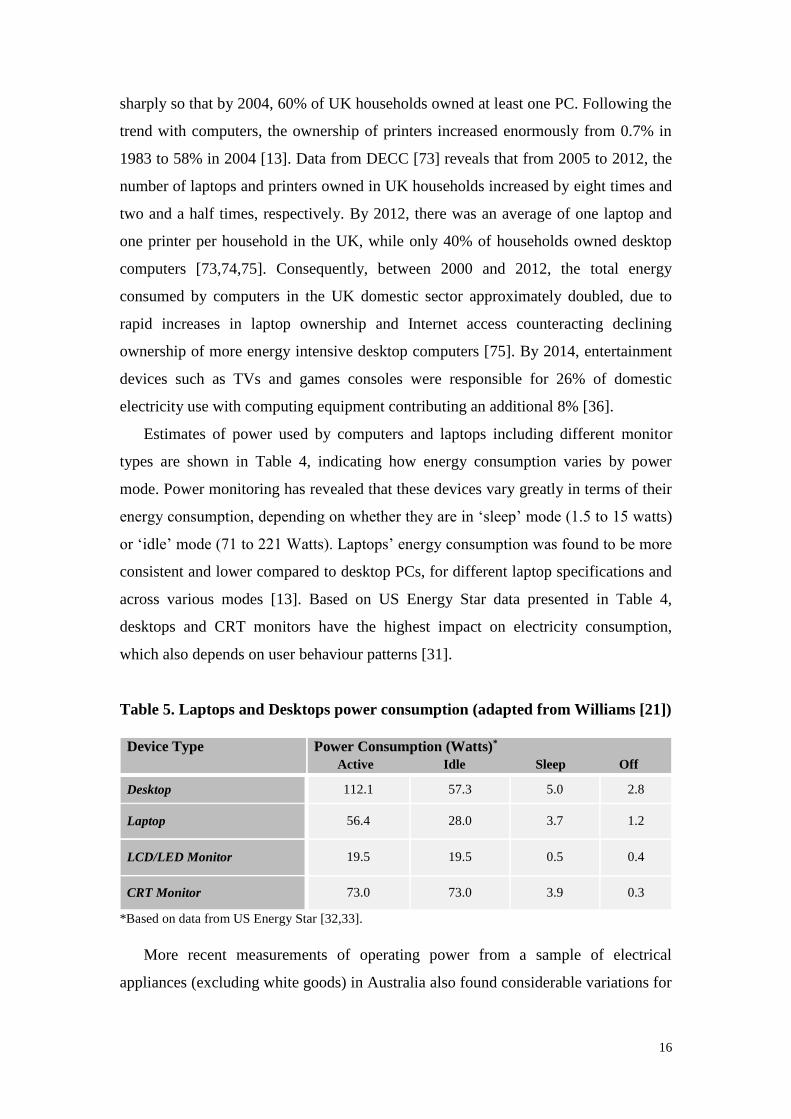
Estimates of power used by computers and laptops including different monitor
types are shown in Table 4, indicating how energy consumption varies by power
mode. Power monitoring has revealed that these devices vary greatly in terms of their
energy consumption, depending on whether they are in ‘sleep’ mode (1.5 to 15 watts)
or ‘idle’ mode (71 to 221 Watts). Laptops’ energy consumption was found to be more
consistent and lower compared to desktop PCs, for different laptop specifications and
across various modes [13]. Based on US Energy Star data presented in Table 4,
desktops and CRT monitors have the highest impact on electricity consumption,
which also depends on user behaviour patterns [31].
Table 5. Laptops and Desktops power consumption (adapted from Williams [21])
Device Type
Power Consumption (Watts)*
Active Idle Sleep Off
Desktop 112.1 57.3 5.0 2.8
Laptop 56.4 28.0 3.7 1.2
LCD/LED Monitor 19.5 19.5 0.5 0.4
CRT Monitor 73.0 73.0 3.9 0.3
*Based on data from US Energy Star [32,33].
More recent measurements of operating power from a sample of electrical
appliances (excluding white goods) in Australia also found considerable variations for
17
given devices, ranging from 24 to 36 watts for a laptop, compared to 20 to 320 watts
for LCD TV, and 215 to 613 watts for a plasma TV [34].
In addition to the operating power, household electrical appliances also contribute
significantly to waste energy through standby consumption. According to a study of
1,300 households conducted in 12 European countries1 by De Almeida et al. [35],
standby use corresponds to around 11% of the total energy consumption in the
residential sector (not including space and water heating), equivalent to approximately
40W per household. This is consistent with studies conducted in Germany, Holland,
the United States, and Australia which revealed that roughly 10% of domestic
electricity use in these countries is due to standby power [15,34].
In the UK, specifically, standby demand can range from 9% to 16% of residential
electricity consumption, based on the ‘Household Electricity Survey’ sample of 251
homes [36]. Another study sample of fourteen UK homes shows that on average, ICT
appliances in active mode accounted for around 23% of domestic electricity use,
while devices left on standby mode contributed an additional 7% of the total [8].
Whereas TVs consume less energy on standby mode (1 to 4 Watts) than when
they are in active use (100+ Watts), standby operation accounts for 9% of the total
electricity consumption from the whole UK television stock, due to devices
continuing to draw energy even when people are not watching [13]. EST [12] notes
that televisions and set top boxes are designed to be left on standby so that television
programmes may be recorded when residents are away from home, or for automatic
software downloads [12,13]. Similarly, a wide range of desktop computers do not
have a manual off button on their processor unit, and consequently, the only way to
turn them off completely is to unplug them [13]. Approximately 40% of British
households leave games consoles on or in standby mode when they are not using them
actively, while 75% of these households with a spare TV leave it on standby [36]. By
way of comparison, in another European country (Spain), standby losses, as a
proportion of the energy used by appliances in their active mode, accounted for
around 6.5% to 12.9% (equivalent to 216.2–240 GWh/year) for televisions and 22.8%
(equivalent to 96.3GWh/year) for computers, respectively, assuming that each device
used 1 Watt when on standby [11].
1 Belgium, Bulgaria, Czech Republic, Denmark, France, Germany, Greece, Hungary, Italy, Norway, Portugal and
Romania
18
3.4 THE MARKET GROWTH OF HOME ENTERTAINMENT APPLIANCES
Electrical appliances were first manufactured and distributed in the US and
Europe early in the 20th Century, but it was only after the Second World War that they
became widespread in households. In the US, these domestic technologies evolved
around the private suburban home, family life and telephone, radio and films. Across
countries in Europe, as well as US and Australia, televisions and computers have been
marketed in such a way as to promote their capacity to serve and sustain family unity,
to counteract initial fears that households may be divided by the new myriad practices
enabled by such devices [37].
Until recently, the predominant television technology has been the cathode ray
tube (CRT) which was invented around 1890. From the late 1930s black and white
televisions were available on the mass market, while colour broadcasting became
commonplace in the 1960s [2]. The rise of television in the 1950s and declining box
office takings in the cinema can be linked to the extensive promotion of television in
the USA and Great Britain as a way of bringing the cinematic experience into
households, so that advertisers used terms such as ‘home theatre’ [37,38]. This trend
has continued with the rise of large, flat screen TVs and surround-sound, for example.
Given the accelerating popularity of flat screen TVs with their enhanced picture
quality, and the availability of big screen sizes requiring much less depth, sales of
LCD TVs first exceeded those of their CRT counterparts in the UK in 2006 [13], and
in the EU in 2007 [39]. This was due to the advantages of LCD over plasma TV
screens of being considerably lighter, cheaper, with potentially longer lifetimes [13].
Flat screen TVs comprised 100% of all television sales in the EU-15 in 2010 [28].
Falling retail prices for flat TV screens have brought them into the affordability zone
of the typical consumer, who is more likely to purchase them for aspirational reasons
rather than considering how much they cost to run [13]. In 2007, small screen sizes
(14-26 inches) still comprised over half the EU market share, with medium screen
sizes (27-39 inches) approaching a third of the market [40].
Across the EU, the transition to flat screen TVs has been further consolidated
following the switch from terrestrial to digital transmission and high-resolution
television (HDTV) [40,41]. Modern, more energy intensive types of TV screens, the
provision of standby, linked devices, and the marketing accompanying these new
19
technologies and services, have all shaped increased electricity demand for home
entertainment [13,41].
TVs, computers and laptops have been manufactured with relatively short
lifespans, a phenomenon termed ‘product obsolescence’, through which advertising
strategies are used to persuade consumers to purchase new products in place of
appliances which may still be functioning or could still be repaired [42,43]. This is
achieved through a marketing mechanism known as ‘marketer-induced problem
recognition’, designed to activate dissatisfaction in customers and lead them to
perceive that new problems exist which need to be solved by purchasing their
products [43, p.28].
Initially, in the case of personal computers, potential customers did not understand
which needs could be addressed by owning these products. Subsequently, PC
manufacturers effectively induced problem recognition by marketing how computers
could improve children’s academic abilities and performance at school [43]. Further
to this, the laptop and the notebook2 computer are two more recent innovations with
the laptop first succeeding in the European market in 1985, followed by the US and
Japan, while the notebook achieved global success in 1989. Both innovations
benefited from a product design which considered what the requirements of the
market were, as opposed to the conventional approach of designing products from
Research and Development (R & D) without taking user needs into account. The
product design drew upon an entrepreneurial vision of miniaturised, compatible and
portable, personal computers which could be interconnected in a world of distributed
computing [82].
Technological improvements, falling prices of new ICT entertainment appliances
and greater demand for these products have led, through economies of scale, to
increased production volumes and competition, leading to further price reductions and
mass market saturation. This has resulted in the ownership of multiple entertainment
appliances per household, for example, it is typical for a family to own more than one
TV and computer, as well as more than one phone, DVD-player and games console
[43].
2The notebook was designed to have approximately 30% of the length of a laptop, 55% of the width
and less than half of the weight, while being completely compatible with IBM. With respect to
energy consumption, notebook computers were initially capable of starting up and shutting down
faster than laptops with the potential to save power [82].
20
4. UNDERSTANDING THE DRIVERS OF ICT ENERGY USE
ICT devices are purchased for use in households in order to contribute to
customers’ well-being by creating value in the form of knowledge or entertainment
[43]. Further to this, everyday activities, namely social practices, in the home have
evolved, associated with the use of TVs and computers and other ICT entertainment
devices [1,8]. Social practices refer to the coordinated and interdependent activities of
individuals across time and space, including cooking, eating, sleeping, caring for
children and others, leisure and work [78,81]. These practices imply energy
consumption through the use of resources, even if people are not conscious of the
consumption caused by their daily activities [81].
An empirical study carried out from 2007 to 2008, comprising interviews with 14
Denish households, demonstrates how use of computers and the internet has become
intertwined with a whole range of social practices in the home [1,71,72]. These
practices, categorised in the study by 48 activities across 10 groups3 [71,72], have
incorporated the new possibilities enabled by ICT, changing the nature of many
practices in the process.
‘Old ICTs’ such as telephone, radio, and television were originally designed for
practices whose purpose was defined by these technologies [72]. In contrast, newer
ICTs, particular smart phones and portable computers with internet connectivity, have
increased accessibility to a wider range of activities [72,79]. This can be exemplified
by the use of digital cameras or smart phones to capture pictures of social events,
which can then be uploaded and accessed through photo sharing albums on the
internet or social networking websites [72].
A more recent study conducted by Kawsar and Brush [84] on 86 households in
Belgium, combining monitoring of Internet use with interviews of 18 of these
househoulds, revealed that many social practices previously conducted using desktops
and laptops are now performed using mobile devices such as tablets and smartphones.
Notebly, the study participants favoured these mobile devices over desktops or
laptops in particular for social networking, while use of ICT devices was observed in
a wide range of locations in the home (including the kitchen and bathroom).
3 The 10 activity categories were: “communication, entertainment, information, purchase and sale,
work at home, education, hobbies and volunteer work, administration and finances, domestic work,
management of the dwelling, and health” [1, p.354].
21
Conversely, desktop computers are most likely to be used for special purposes
including working from home and Internet gaming [84].
These new ICTs also facilitate the simultaneous use of consumer electronic
devices for entertainment, social networking, or to pursue personal interests [8,44].
This multiple use of entertainment appliances may manifest itself in various forms,
including ‘social television’, for example, communicating with friends via social
networking websites while watching TV, which in turn is being augmented by new,
interactive offerings from service providers [8]. Conversely, another study has
identified that laptops and desktops are often used by students for watching films and
listening to music, therefore displacing the use of TV or hi-fi systems [70].
Important aspects of social practices have been identified with respect to ICT
devices in a study based on 14 household interviews in the UK [8]. This study found
that the highest electricity consumption from computer use tended to occur in those
households where at least one resident worked from home on a regular basis [8].
Since the introduction of the personal computer from the 1980s [72], the boundary
between work and leisure has become blurred, facilitated by the market growth of
portable and mobile devices [37] and the use of ICT equipment in the home which
previously would have been associated with office environments (e.g. printers and
scanners) [77]. While the proportion of people who work from home is increasing -
14% of the working age population in Great Britain in 2014 compared to 11% in 1998
[45] - only 4% of Europeans (EU-27) worked from home in 2010 [68]. Moreover, the
increased ownership of personal computers is fundamentally related to householders’
access to the Internet in the home [2].
In addition, the study by Coleman et al. [8] revealed how residents sometimes use
ICT appliances to create a comfortable background environment while they are doing
other activities, for example by listening to the radio on the television or leaving the
television on with the volume muted. According to tests by EST [13], the practice of
listening to the radio through a digital television can be 10 to 20 times more energy
intensive than listening to a typical digital radio, as it is necessary to keep the
television and set top box on (if the digital TV is not integrated). Employing screen
blanking, so that the signal for the selected channel is received exclusively in audio,
can reduce the electricity consumption of this activity by 75%.
The use of ICT in households varies depending upon whether individuals are
adults or children [30]. For example, a study from Denmark indicates that while
22
children typically learn how to use computers by playing games on them, adults most
often gain their knowledge of computers through their work. ICTs may fall out of
fashion quickly, such as games consoles and video players, so that they are rarely
used actively but may still be left consuming electricity in standby mode. Some
families may integrate more energy efficient, portable computers within household
entertainment or information searching activities by keeping them in the living room
or kitchen, which may have the effect of encouraging more energy intensive practices
involving multiple devices. Alternatively, families may separate desktop computers
from other household activities, by placing them in an office-like environment.
Considering that ICT devices offer completely new functionalities in households,
consumers have viewed such technologies with a greater interest than those which
conflict with or replace existing practices in the home, such as the introduction of
washing machines into households. While new technologies may be purchased
initially as a status symbol, ICT has reached the point where it is difficult for
households to live without these devices and gadgets [30].
Nevertheless, the television itself could actually provide a solution to energy
hungry practices which have developed around simultaneous activities using a
multiple devices [13]. For example, the TV could become the central device in a
household: a television screen can also be used as a computer monitor, for playing
computer games and potentially for viewing information from a household smart
meter and controlling other devices in the home. The television unit could incorporate
in one device additional functions currently provided through the DVD player, set top
box, games consoles and so on, to decrease waste energy from separate appliances,
each with their own standby modes. Such ‘smart’ televisions have been trialed by
eSESH [56] in 80 households in Moulins, France, where near real-time energy use
information is transmitted from a server to a TV Energy Display System. This
information is displayed on a dedicated channel and appears by default every time the
TV is turned on.
23
5. REDUCING ELECTRICITY USE FROM HOME ENTERTAINMENT
APPLIANCES: STRATEGIC APPROACHES
5.1 APPROACHES FROM PSYCHOLOGY
The effect of feedback on household electricity consumption has been extensively
researched, with estimates of energy savings typically range from 5% to 20%
[46,47,48,49,50]. Notwithstanding the impact of ICT entertainment devices, ICT may
itself provide solutions to managing and reducing residential electricity consumption.
Feedback systems based on ICT devices such as smart meters have most potential to
be effective in reducing energy use where information is accessible and appealing to
householders and provided at a disaggregated or appliance level (Ropke et al., 2010).
Mills & Schleich [51] and Steg [52] support the effectiveness of tailored feedback as a
potential measure to raise the quality of knowledge of household energy savings, and
the monetary and environmental implications of energy consumption. However, it has
been identified by Ellegard & Palm [53] and Mills & Schleich [51] that tailored
feedback might not alter energy behaviours from highly consuming to more
conservative practices, since the impact of householders’ energy use on the
environment is insufficiently transparent for them to reconsider the effect of their
energy practices.
According to EEA [54], the focus of residential energy demand reduction policies
(e.g. smart-meter rollout programmes) is mainly on the measure itself, rather than
addressing how individuals’ energy behaviour and consumption practices might be
altered. Achieving the latter could involve assessment of representative demographic
target groups for whom specific behavioural measures can be implemented. Such
tailored information considers how to better inform residents of their household
energy use and in turn reduction options, focusing on personalized advice based on
specific household demographics [53,55].
Beyond traditional forms of feedback, the Internet can be used as an alternative
medium to provide household energy awareness and management services. The
‘Saving Energy in Social Housing with ICT’ programme [56] has conducted pilot
projects in ten sites across Europe since 2010 with the objective of saving energy in
European social housing. The project’s Energy Awareness Services (EAS) provide
24
feedback on energy consumption so that tenants may have the opportunity to alter
their behaviour. For example, tenants in 77 pilot households in Catalonia can access
information on their monthly, weekly and hourly electricity use (direct feedback) via
an energy web portal, and can compare their energy use with that of other tenants and
the average consumption from households in their building (comparative feedback).
An additional tool piloted is an ‘Energy Management Service’ (EMS) which aims to
optimise the timing of residential electricity use, and reduce peaks of demand. This
has been attempted via mobile devices supplied to households in Linz, Austria, which
display energy consumption data in real time from adaptor plugs for each appliance,
providing a means for residents to actively manage their energy use by determining
which devices are the most consuming [56].
Feedback could be enhanced through public information campaigns, such as the
energy savings guide on home entertainment systems provided by the Australian
government, including advice for householders on purchase and use of TVs,
computers / tablets, games consoles and mobile phones [57]. In order to be successful,
public information campaigns aiming to reduce household energy consumption
should seek to influence attitudes and behaviour, which could be combined with
pricing incentives. Energy companies and government bodies have a role in such
campaigns to disseminate knowledge and information to enable householders to alter
the energy behaviours [58].
An alternative strategy for motivating households to reduce their energy use is
focused on the environmental education of householders involving both parents and
children [59]. For a given individual, education may be correlated with a high level of
environmental concern, which might in turn determine whether they behave in pro-
environmental ways [60]. This is in line with the study by Fell & Chiu [59] which
recommends that environmental education be usefully promoted by policymakers as
an instrument to engage communities in environmental issues and particularly to
enhance children’s role since previous findings from Uzzell [61] show them as
‘potential catalysts of environmental change’. However, the results from Fell &
Chiu’s [59] study reveal that children were not willing to reduce daily activities which
impact on household energy consumption directly (e.g. playing games and watching
TV), while the parents’ role to encourage their children to reduce home energy use
was outweighed by other factors such as their lack of time or concern about the
impact on their energy bill.
25
A recent analysis of the ‘Household Electricity Survey’, based on 250 residences
in the UK, found that households which were more concerned about climate change
actually consumed more electricity overall than those who were less concerned [62].
Furthermore, in a previous study by the same author [63], there does not seem to be
any clear relationship between environmental concern and TV ownership in terms of
the average number of units owned. For example, those who were ‘very concerned’
about the environment, owned 2.1 TVs on average, the same number as those who
were ‘not very concerned’.
5.2 THE ROLE OF REGULATION
Interventions targeted at the energy behaviour of householders alone may not be
successful in achieving electricity savings without regulations on product efficiency
standards. When designing electrical appliances, manufacturers of these products are
required by the Eco-design Directive (2005/32/EC), as introduced in August 2010, to
ensure that they limit energy consumption and harmful environmental effects
throughout the life cycle of the appliances [28,35].
The Ecodesign directive was widened in December 2008 to apply to, for example,
TVs, set top-boxes, standby and off-modes, and household lighting. Regulation No.
1275/2008 also extended the Ecodesign Directive to include energy consumption of
household ICT devices from standby and off-modes. This regulation sets out
maximum limits for the electricity use of these appliances when on standby or in off-
mode states, which were reduced in 2013 to no greater than 0.5Watt and 1Watt for
those devices with information or status display [28]. The latest European
Commission (EC) proposals4 for new Ecodesign regulations would require internet-
connected devices, including ‘smart’ televisions, printers and routers, to switch to a
low power standby mode automatically when they are not being used [64].
Nevertheless, the existing EU labelling directive of 1992 (92/75/EEC), updated by
the EU Parliament in December 2010, currently covers TVs, white goods, lighting
and air conditioning, but needs to be broadened to include other ICT devices, given
their substantially increased rates of ownership across EU households [35]. While
4These proposals are currently subject to scrutiny by Members of the European Parliament and
European Union government ministers (EC, 2015) [64].
26
voluntary energy labelling schemes exist such as Energy Star, an empirical study of
households by Coleman et al. [8] revealed that most respondents are not aware of
them. Residents in this study had little knowledge about how much energy appliances
actually use, but in some cases decisions to buy more energy efficient cold (e.g. fridge
and freezer) and wet (e.g. washing machine and dishwasher) appliances had been
influenced by an awareness of compulsory energy labels for these products.
Moreover, some respondents indicated that they would purchase lower energy
consuming ICT devices if mandatory energy labelling was introduced to apply to
them. EST [13] and Santiago et al. [10] suggest that sales staff could be trained
specifically to help raise consumer knowledge about Energy Star ratings, while
regulations could be introduced to make such voluntary schemes compulsory.
White goods have already been subject to more stringent product standards across
the EU, whereby the least efficient appliances have been banned. EST [12]
recommends that a similar approach could be implemented for ICT devices, for
example, the 25% least energy efficient products in the market could be prohibited at
regular intervals, e.g. every 3 to 5 years. This is exemplified by the progressive EU
bans of 25 to 100 Watt light bulbs in the EU from 2009 to 2012 [65]. Beyond
applying standards to existing products, the energy efficiency of ICT devices could be
accelerated through increased investment in Research and Development (R & D) into
these products [12].
Pricing strategies have been proposed that would raise the costs of electricity
during periods of peak demand, in order to create a disincentive against using
electricity-intensive devices such as TVs and computers at those times. However,
such measures are considered to be less effective than energy labelling schemes to
increase the quantity of energy efficient devices purchased, or directives which limit
how much energy such equipment is designed to consume [10].
Regardless of the contribution of regulations and policies to improving domestic
appliance efficiency, the rebound effect may constrain the potential for energy savings
through the purchase of efficient devices, either by increasing the quantity of
electricity consumed, or due to a higher quality of energy service [54]. Nevertheless,
Maxwell et al. [69] suggest that the rebound effect is not of sufficient magnitude to
support delays in energy efficiency investments or measures to change behaviour.
Moreover, energy efficiency measures can achieve economic, social and
environmental benefits beyond energy saving itself.
27
6. CONCLUSIONS
Household entertainment devices, as part of the ICT sector, present a challenging
area for policy research on EU countries due to their rapidly increasing impact on
household electricity consumption. This rising impact on energy demand at home can
be attributed to the increased ownership of affordable, higher performing ICT devices
such as TVs, computers and their peripherals. These new technologies, facilitated by
the availability of the Internet, have influenced and transformed householders’
practices with implications for domestic electricity demand. Smart phones and tablet
computers also constitute technologies with a high degree of portability upon which
practices in daily life have become dependent on active data connectivity, referred to
as the ‘always on’ society [80]. Since the iPhone was first introduced in 2007 [25],
there has been in the US from 2009 to 2013 a growth of 250% [66] in the number of
internet connected smart phones, and a doubling of laptop, tablet and modem
connections. This is associated with a 120% year on year increase in wireless data
traffic from smart phones, laptops and tablets between 2010 and 2013 [66]. The
energy impact of this internet traffic is considerable: for example, the annual
electricity use of streaming an hour of video every week on a smart phone or tablet is
equivalent to the yearly electricity use of two energy efficient refrigerators [25].
As a short term measure pending adoption of more energy efficient devices by
households over time, electricity use from ICT in the home could be decreased
significantly through basic behavioural change actions such as disconnecting devices
from their power source [8,11]. In particular, there is a need to address the social and
cultural causes of highly energy demanding practices linked to television watching,
which have been enabled by the acquisition of new internet-connected ICT devices
driven by marketing, social networks and the offers of service providers [41].
A key element in understanding residents’ energy practices is the need for
‘comfort’, as daily energy habits (e.g. cooking, cleaning, eating, and relaxing), linked
to various technologies, are performed to meet comfort levels in households. While
research has mainly focused on the technical and standardised concept of comfort (i.e.
‘thermal comfort’), this concept has not been applied to how the use of home
entertainment devices can satisfy residents’ comfort expectations while conserving
electricity in the home.
28
Reducing energy consumption from ICT devices in households requires the
combined intervention of various actors, including government, manufacturers,
retailers and consumers [13]. For example, the IEA [76] proposes that governments
should regularly update mandatory energy performance standards for electronic
appliances, which should accurately represent the actual energy use of a device and be
aligned with international test standards [83]. In addition, the introduction of a
compulsory Energy Star rating scheme would ensure that only products certified to be
energy efficient are sold by retailers [8]. Beyond governments, manufacturers have a
critical role to play in continually seeking to introduce new, more energy efficient
products into the market, in particular through increased research and development
into ‘smart appliances’, which utilise ICT within devices to maximise energy
efficiency and match product use with user needs (EST, 2007, POST, 2008). Retailers
should supply products with clear information on their power consumption, i.e.
through Energy Star or Energy Saving Recommended labels, and train staff to advise
customers how to interpret such labels and help them to make purchase decisions
based at least in part on the relative energy efficiency of items in their product range
(EST, 2007). An ongoing challenge in this respect is consumers’ poor understanding
of units of electricity use such as watts, and the difficulty of translating these units to
prices due to variable charges for electricity per household, dependent on the energy
supplier and fluctuating energy prices (POST, 2008). Consumers can contribute
themselves by seeking to purchase ICT entertainment appliances with the
aforementioned labels, and actively seeking to reduce the standby use of such
products, for example through power saving technology (EST, 2007). While energy
efficiency is important, there is also a need to educate consumers about the impact of
the number of devices they own on their energy consumption (Ropke et al, 2010).
In this paper, we also argue that certain policy interventions could be targeted at
residential consumers, which aim to reduce domestic electricity demand more
generally (i.e. not just from ICT), through feedback and environmental education for
household energy consumption. Certainly in the case of feedback, empirical studies
indicate that these strategies can achieve modest electricity savings. Nevertheless,
public information campaigns disseminating energy savings tips for the purchase and
use of entertainment appliances could help to make feedback approaches more
effective.
29
With respect to specific measures targeted at ICT equipment, regulations are in
place to continually improve their energy efficiency, in particular the Eco-design and
EU Labelling Directives. Additionally, voluntary schemes such as Energy Star
provide a standard for the most efficient electronic devices in the market which could
contribute even more effectively if all ICT products were required to comply with
such schemes. Nevertheless, efficiency gains may be compensated by the rebound
effect in the ICT sector, not least through the increased ownership and use of devices
[67,73,75].
However, policies which aim to increase ICT device efficiency are unlikely to be
effective on their own, unless they are supported by solutions which account for new
social practices related to the use of ICT so that residential electricity savings might
be achieved. One such approach could involve tailored feedback together with goal
setting for household electricity savings, considering specific consumption profiles
and the needs of occupants. An alternative technology-led solution could be the use of
ICT to help householders manage their energy consumption, while a ‘smart’ TV could
also act as a central hub to encourage practices which meet occupants’ comfort and
entertainment needs using fewer devices.
REFERENCES
[1] Røpke, I., & Christensen, T. H. Energy impacts of ICT – Insights from an
everyday life perspective. Telematics and Inform 2012; 29: 348–61.
[2] IEA – International Energy Agency. Gadgets and Gigawatts. Policies for Energy
Efficient Electronics; 2009. Report. International Energy Agency, Paris, France.
[3] Erdmann, L., Hilty, L. M. Scenario analysis: exploring the macroeconomic
impacts of information and communication technologies on greenhouse gas
emissions. J of Industrial Ecol 2010; 14: 826-43.
[4] Kalimaris, A., Kalluri, B., Kondepudi, S., Wai, T. K. A literature survey on
measuring energy usage for miscalleneous electric loads in offices and
commercial buildings. Renew and Sustain Energy Rev 2014; 34: 536-50.
[5] Bhandari, K.P., Collier, J.M., Ellingson, R.J., Apul, D.S. Energy payback time
(EPBT) and energy return on energy invested (EROI) of solar photovoltaic
30
systems: A systematic review and meta-analysis . Renew and Sustain Energy Rev
2015; 47: 133-41.
[6] Whitmarsh, L., Upham, P., Poortinga, W., McLachlan, C., Darnton, A., Devine-
Wright, P., Demski, C., et al. Public Attitudes, Understanding, and Engagement in
Relation to Low Carbon Energy: A Selective Review of Academic and Non
Academic Literatures; 2011. Report for Research Council UK (RCUK) Energy
Programme. Swindon: Research Councils UK.
[7] Stephenson, J., Barton, B., Carrington, G., Gnoth, D., Lawson, R., & Thorsnes, P.
Energy cultures: A framework for understanding energy behaviours. Energy
Policy 2010; 38, 6120–29.
[8] Coleman, M., Brown, N., Wright, A., Firth, S.K. Information, communication and
entertainment appliance use—Insights from a UK household study. Energy and
Build 2012; 54: 61–72.
[9] McNeil, M.A., Letschert, V.E. Modeling diffusion of electrical appliances in the
residential sector, Energy and Build 2010; 42: 783–90
[10] Santiago, I., Lopez-Rodriguez, M.A., Gil-de-Castro, A. Moreno-Munoz, A.,
Luna-Rodriguez, J.J. Energy consumption of audiovisual devices in the residential
sector: economic impact of harmonic losses. Energy 2013; 60: 292–301.
[11] Santiago, I., Lopez-Rodriguez, M. A., Trillo-Montero, D., Torriti, J., Moreno-
Munoz, A. Activities related with electricity consumption in the Spanish
residential sector: Variations between days of the week, Autonomous
Communities and size of towns. Energy and Build 2014; 79: 84–97.
[12] Energy Saving Trust (EST). The rise of the machines. A review of energy using
products in the home from the 1970s to today; 2006. Report by EST.
[13] Energy Saving Trust (EST). The ampere strikes back - How consumer
electronics are taking over the world report; 2007. Report by EST.
[14] Mansouri, I., Newborough, M., Probert, D. Energy Consumption in UK
Households: Impact of Domestic Electrical Appliances. Appl Energy 1996; 54(3):
211-85.
[15] Kelly, G. Sustainability at home: Policy measures for energy-efficient
appliances. Renew and Sustain Energy Rev 2012; 16: 6851-60.
[16] Firth, S., Lomas, K., Wright, A., Wall, R. Identifying trends in the use of
domestic appliances from household electricity consumption measurements.
Energy and Build 2008; 40 (5): 926–36.
31
[17] Koomey, J.G. Power levels in office equipment: Measurements of new monitors
and personal computers; 2002. American Council for an Energy-Efficient Economy
(ECEEE), Washington DC: US.
[18] E3-Equipment Energy Efficiency. Third Survey of Residential Standby Power
Consumption of Australian Homes; 2011. Prepared by Energy Efficient Strategies
Pty Ltd. Common wealth of Australia. ‹file:///C:/Users/dj837169/Downloads/E3-
2010-Intrusive-Survey-FINAL-Report.pdf› (Accessed on 26th December 2014).
[19] Centre for Sustainable Energy (CSE). Home energy advice; 2014.
‹http://www.cse.org.uk/downloads/advice-leaflets/energy-
advice/advice_leaflet_what_uses_watt.pdf› (Accessed on 15th May 2015)
[20] Energy Star. Energy Star Most Efficient 2015 — Televisions; 2015.
‹http://www.energystar.gov/index.cfm?c=most_efficient.me_tvs_under35_inches›
(Accessed on 7th January 2015).
[21] Williams, D. R. Modelling and assessing the environmental impacts of software.
Engineering Doctorate (EngD) Thesis. Technologies for Sustainable Built
Environments (TSBE) centre, University of Reading, Reading, UK; 2013.
[22] IEA – International Energy Agency. Energy Technology Perspectives: Scenarios
and Strategies to 2050; 2006. Report. International Energy Agency, Paris, France.
[23] Cabeza, L.F., Urge-Vorsatz, D., McNeil, M.A., Barreneche, C., Serrano, S.
Investigating greenhouse challenge from growing trends of electricity
consumption through home appliances in buildings. Renew and Sustain Energy
Rev 2014; 36: 188-93.
[24] Natural Resources Defense Council (NRDC). The impact of consumer
electronics on home electricity use; 2011. ‹https://www.energystar.gov/ia/
partners/downloads/meetings/2011/Market%20Trends%20for%20CE_Horowitz.p
df› (Accessed on 14th February 2015).
[25] Mills, M. The cloud begins with coal: Big data, big networks, big infrastructure,
and big power; 2013. An overview of the electricity used by the global digital
ecosystem. Report by the Digital Power Group. ‹http://www.tech-pundit.com/wp-
content/uploads/2013/07/Cloud_
Begins_With_Coal.pdf› (Accessed on 15th February 2015).
[26] Lapillonne, B., Sebi, C., Pollier, K., Mairet, N. Energy efficiency trends in
buildings in the EU; 2012. Lessons from the ODYSSEE MURE project.
Intelligent Energy Europe Programme of the European Union.
32
[27] Lapillonne, B., Pollier, K. Energy efficiency trends for households in the EU;
2014. Enerdata – ODYSSEE MURE project. Intelligent Energy Europe
Programme of the European Union.
[28] Bertoldi, P., Hirl, B., Labanca, N. Electricity Consumption and Efficiency Trends
in the EU-27. Energy Efficiency Status report; 2012. JRC Scientific and Policy
Reports.
[29] Energy Saving Trust (EST). Powering the Nation. Household electricity – using
habits revealed; 2014. Report by EST – Department of Energy & Climate Change
(DECC) – Department for Environment Food & Rural Affairs (DEFRA).
[30] Gram-Hanssen, K. Consuming technologies - developing routines. J of Clean
Product 2008; 16: 1181-89.
[31] Bray, M. Review of computer energy consumption and potential savings; 2006.
White paper.
[32] Energy Star. Computers for Consumers; 2011a. Washington, US.
[33] Energy Star. Displays Product List; 2011b. Washington, US.
[34] Guan, L., Berrill, T., Brown, R. J. Measurement of standby power for selected
electrical appliances in Australia. Energy and Build 2011; 43: 485-90.
[35] De Almeida, A., Fonseca, P., Schlomann, B., Feilberg, N. Characterization of the
household electricity consumption in the EU, potential energy savings and
specific policy recommendations. Energy and Build 2011; 43(8): 1884–94.
[36] Energy Saving Trust (EST). Brits could save £1.7 billion a year by switching
appliances off standby; 2014. ‹http://www.energysavingtrust.org.uk/news/brits-
could-save-%C2%A317-billion-year-switching-appliances-standby› (Accessed on
29th December 2014).
[37] Spigel, L. Domestic Technologies and the Modern Home. In: Smith, S. (Ed.)
International Encyclopedia of Housing and Home, Elsevier; 2012, p.383-98.
[38] Boddy, W. New Media and the Popular Imagination: Launching Television,
Radio, and Digital Media in the United States. Oxford University Press USA,
North Caroline & New York; 2004.
[39] FRA - Fraunhofer Institute for Reliability and Microintegration, IZM and Öko-
Institut. EuP Preparatory Studies Lot 5: Televisions; 2007. Final Report on Task
2: Economic and Market Analysis, Berlin.
[40] Bertoldi, P., Atanasiu, B. Electricity Consumption and Efficiency Trends in
European Union; 2009. Status Report.
33
[41] Crosbie, T. Household energy consumption and consumer electronics: The case
of television. Energy Policy 2008; 36: 2191–199.
[42] Cooper, T. Inadequate Life? Evidence of Consumer Attitudes to Product
Obsolescence. J of consum policy 2004; 27(4): 421-49.
[43] Mont, O., Power, K. Understanding factors that shape consumption; 2009.
ETC/SCP Working Paper No 1/2013. European Topic Centre on Sustainable
Consumption and Production, Copenhagen.
[44] Pantzar, M. Shove, E. Temporal rhythms as outcomes of social practices. A
speculative discussion. Ethnol Europaea 2010; 40: 19–29.
[45] Office for National Statistics (ONS). Record proportion of people in employment
are home workers; 2014. ‹http://www.ons.gov.uk/ons/rel/lmac/characteristics-of-
home-workers/2014/sty-home-workers.html› (Accessed on 15th December 2014).
[46] Abrahamse, W, Steg, L, Vlek, C, Rothengatter, T. A review of intervention
studies aimed at household energy conservation. J of Environ Psychol 2005; 25:
273–91.
[47] Darby, S. The effectiveness of feedback on energy consumption – A review for
DEFRA of the literature on metering, billing and direct displays; 2006.
Environmental Change Institute, University of Oxford.
[48] Fischer, C. Feedback on household electricity consumption: a tool for saving
energy? Energy Effic 2008; 1(1): 79–104.
[49] Roberts, S., Baker, W. Towards effective energy information: Improving
consumer feedback on energy consumption; 2003. A report to OFGEM
(www.cse.org.uk).
[50] Buchanan, K., Russo, R., Anderson, B. Feeding back about eco-feedback: How
do consumers use and respond to energy monitors? Energy Policy 2014; 73: 138–
46.
[51] Mills, B., Schleich, J. Residential energy-efficient technology adoption, energy
conservation, knowledge, and attitudes: An analysis of European countries.
Energy Policy 2012; 49: 616-628.
[52] Steg, L. Promoting household energy conservation. Energy Policy 2008; 36(12):
4449-53.
[53] Ellegard, K., Palm, J. Visualizing energy consumption activities as a tool for
making everyday life more sustainable. Appl Energy 2011; 88: 1920-26.
34
[54] European Environmental Agency (EEA). Achieving energy efficiency through
behaviour change: what does it take?; 2013. EEA Technical Report – No 5/2013.
Luxembourg.
[55] Pothitou, M., Kolios, A. J., Varga, L., Sai, G. A framework for targeting
household energy savings through habitual behavioural change. Intern J of Sustain
Energy 2014; 1-15. doi: 10.1080/14786451.2014.936867.
[56] eSESH. Saving Energy in Social Housing with ICT – Project Status Report;
2013.
‹http://esesh.eu/fileadmin/eSESH/download/documents/eSESH_Final_Report.pdf›
(Accessed on 5th February 2015).
[57] Australian Government. Your Energy Savings. Department of Industry and
Science; 2015. ‹http://yourenergysavings.gov.au/› (Accessed on 9th January 2015).
[58] Webb, D., Soutar, G.N., Mazzarol, T., Saldaris, P. Self-determination theory and
consumer behavioural change: Evidence from a household energy-saving
behaviour study. J of Environ Psycho 2013; 35: 59-66.
[59] Fell, M. J. Chiu, L. F. Children, parents and home energy use: Exploring
motivations and limits to energy demand reduction. Energy Policy 2014; 65: 351–
358.
[60] Vicente-Molina, M. A., Fernández-Sáinz, A., Izagirre-Olaizola, J. Environmental
knowledge and other variables affecting pro-environmental behaviour:
comparison of university students from emerging and advanced countries. J of
Clean Prod 2013; 61: 130–138.
[61] Uzzell, D. Children as Catalysts of Environmental Change; 1994. Brussels,
European Commission.
‹http://www.academia.edu/1131741/Children_as_Catalysts_
of_Environmental_Change› (Accessed on 20th November 2014).
[62] Palmer, J., Terry, N., Armitage, P., Godoy-Shimizu, D. Savings, beliefs and
demographic change - Further Analysis of the Household Electricity Survey;
2014: 4-69. Reference 475/09/2012.
[63] Palmer, J., Terry, N., Kane, T., Firth, S., Hughes, M., Pope, P., Young, J.,
Knight, D., Godoy-Shimizu, D. Electrical appliances at home: tuning in to energy
saving - Further Analysis of the Household Electricity Use Survey; 2013: 3-146.
Reference 475/09/2012.
35
[64] European Commission (EC). Helping consumers reduce energy bills and save
money; 2015.
‹http://ec.europa.eu/unitedkingdom/press/frontpage/2014/14_138_en.htm›
(Accessed on 11th February 2015).
[65] Parliament UK. Incandescent Light Bulbs. Daily Hansard; 2012.
‹http://www.publications.parliament.uk/pa/cm201213/cmhansrd/
cm120522/halltext/120522h0002.htm› (Accessed on 7th January 2015).
[66] CTIA. CTIA’s Wireless Industry Survey, year-end 2013; 2014.
‹http://www.ctia.org/docs/default-source/Facts-
Stats/ctia_survey_ye_2013_graphics-final.pdf?sfvrsn=2› (Accessed on 15th
February 2015).
[67] Organisation for Economic Co-operation and Development (OECD). Greener
and Smarter: ICTs, the Environment and Climate Change; 2010. Committee for
Information, Computer and Communications Policy (ICCP).
‹http://www.oecd.org/site/stitff/45983022.pdf› (Accessed on 25th January 2015).
[68] Eurofound. Fifth European Working Conditions Survey - Overview report; 2012.
Publications Office of the European Union, Luxembourg.
‹http://www.eurofound.europa.eu/publications/htmlfiles/ef1182.htm› (Accessed
on 22nd August 2014).
[69] Maxwell, D, Owen, P., McAndrew, L., Muehmel, K., Neubauer, A. Addressing
the Rebound Effect; 2011. A report for the European Commission DG
Environment.
[70] Bates, O., Hazas, M., Friday, A., Morley, J., Clear, A.K. Towards an holistic
view of the energy and environmental impacts of domestic media and IT.
Proceedings of the Conference on Human Factors in Computing, Toronto,
Canada, 26th April-1st May 2014, New York: ACM.
[71] Jensen, J.O., Gram-Hanssen, K., Røpke, I., Christensen, T.H. Households’ use of
information and communication technologies – A future challenge for energy
savings?; 2009. In: Proceedings of ECEEE Summer StudyCote d’Azur, France.
[72] Røpke, I., Christensen, T.H., Jensen, J.O. Information and communication
technologies – A new round of household electrification. Energy Policy 2010; 38:
1764–73.
[73] Department of Energy and Climate Change (DECC). Energy consumption in the
UK (ECUK) domestic data tables; 2014. London: DECC.
36
[74] Office for National Statistics (ONS). Families and Households; 2012.
‹http://www.ons.gov.uk/ons/rel/family-demography/families-and-
households/2012/stb-families-households.html› (Accessed on 5th June 2015).
[75] Terry, N., Palmer, J. Trends in home computing and energy demand. Build Res
and Inform 2015; doi: 10.1080/09613218.2015.1040284 (in press).
[76] IEA – International Energy Agency. 25 Energy Efficiency Policy
Recommendations: 2011 Update; 2011. International Energy Agency, Paris,
France.
[77] Kwatra, S., Amann, J., Sachs, H. Miscalleneous Energy Loads in Buildings;
2013. Report Number A133, American Council for an Energy-Efficient Economy
(ECEEE), Washington, DC: US.
[78] Schatzki, T.R. The site of the social. A philosophical account of the constitution
of social life and change. The Pennsylvania State University Press, University
Park, Pennsylvania; 2002.
[79] Kenyon, S. Internet use and time use. The importance of multitasking. Time and
Soc 2008; 17: 283-318.
[80] Lord, C., Hazas, M., Clear, A.K., Bates, O., Whittam, R., Morley, J., Friday, A.
Demand in my pocket: Mobile devices and the data connectivity marshalled in
support of everyday practice; 2015. CHI ’15 Proceedings of the 33rd Annual ACM
Conference on Human Factors in Computing Systems. Seoul, Korea.
[81] Ropke, I. Theories of practice - new inspiration for ecological economic studies
on consumption. Ecol Econ 2009; 68: 2490–97.
[82] Abetti, P. The birth and growth of Toshiba's laptop and notebook computers: A
case study in Japanese corporate venturing. J of Bus Venturing 1997; 12(6): 507–
29.
[83] Organisation for Economic Co-operation and Development (OECD). Can
energy-efficeint electrical appliances be considered “Environmental Goods”?;
2006. OECD Trade and Environment Working Paper No. 2006-04.
[84] Kawsar, F., Brush, A.J. Home computing unplugged: Why, where and when
people use different connected devices at home; 2013. Proceedings of the 2013
ACM International joint conference on Pervasive and ubiquitous computing,
Zurich, Switzerland.
Related Documents