1 Final Terms dated 4 April 2013 PERMANENT MASTER ISSUER PLC (Incorporated with limited liability in England and Wales with registered number 5922774) Mortgage Backed Note Programme 2013-1 Issue Series Class Interest rate Initial principal amount Issue price Scheduled redemption dates Final Maturity date 1 1A 0.45% over 3 month sterling LIBOR £1,250,000,000 100% N/A 15 July 2042 1 1M 1.10% over 3 month sterling LIBOR £500,000,000 100% N/A 15 July 2042 Terms used herein shall be deemed to be defined as such for the purposes of the conditions set forth in the base prospectus dated 28 March 2013 (the Base Prospectus) which constitutes a base prospectus for the purposes of Directive 2003/71/EC (the Prospectus Directive). This document constitutes the final terms (the Final Terms) of the series (each a Series) and classes (each a Class) of notes (the Notes) of Permanent Master Issuer PLC (the Master Issuer) described herein for the purposes of Article 5(4) of the Prospectus Directive (together, the Notes or the 2013-1 Notes) and must be read in conjunction with the Base Prospectus. Full information on the Master Issuer (also referred to as the issuing entity) and the offer of the 2013-1 Notes the subject thereof is only available on the basis of the combination of these Final Terms and the Base Prospectus. The Base Prospectus is available for viewing at the offices of the Principal Paying Agent at Citigroup Centre, Canada Square, Canary Wharf, London E14 5LB and copies may be obtained from the registered office of the Master Issuer at 35 Great St. Helen's, London, EC3A 6AP. Arranger for the programme Lead Manager

Welcome message from author
This document is posted to help you gain knowledge. Please leave a comment to let me know what you think about it! Share it to your friends and learn new things together.
Transcript

1
Final Terms dated 4 April 2013
PERMANENT MASTER ISSUER PLC (Incorporated with limited liability in England and Wales with registered number 5922774)
Mortgage Backed Note Programme
2013-1 Issue
Series Class Interest rate Initial principal
amount Issue price
Scheduled redemption
dates
Final Maturity
date 1 1A 0.45% over 3
month sterling LIBOR
£1,250,000,000 100% N/A 15 July 2042
1 1M 1.10% over 3 month sterling LIBOR
£500,000,000 100% N/A 15 July 2042
Terms used herein shall be deemed to be defined as such for the purposes of the conditions set forth in the base prospectus dated 28 March 2013 (the Base Prospectus) which constitutes a base prospectus for the purposes of Directive 2003/71/EC (the Prospectus Directive). This document constitutes the final terms (the Final Terms) of the series (each a Series) and classes (each a Class) of notes (the Notes) of Permanent Master Issuer PLC (the Master Issuer) described herein for the purposes of Article 5(4) of the Prospectus Directive (together, the Notes or the 2013-1 Notes) and must be read in conjunction with the Base Prospectus. Full information on the Master Issuer (also referred to as the issuing entity) and the offer of the 2013-1 Notes the subject thereof is only available on the basis of the combination of these Final Terms and the Base Prospectus. The Base Prospectus is available for viewing at the offices of the Principal Paying Agent at Citigroup Centre, Canada Square, Canary Wharf, London E14 5LB and copies may be obtained from the registered office of the Master Issuer at 35 Great St. Helen's, London, EC3A 6AP.
Arranger for the programme
Lead Manager

2
GENERAL PROVISIONS APPLICABLE TO THE NOTES
Class 1A Notes Class 1M Notes
(1) Issuer of the Notes: Permanent Master Issuer PLC Permanent Master Issuer PLC
(2) Series and Class: 2013-1 Series 1 Class 1A 2013-1 Series 1 Class 1M
(3) Specified Currency or Currencies:
Sterling Sterling
(4) Initial principal amount:
£1,250,000,000 £500,000,000
(5) (a) Issue price: 100% of the initial principal amount 100% of the initial principal amount
(b) Gross proceeds:
£1,250,000,000 £500,000,000
(6) Closing Date:
5th April 2013 5th April 2013
(7) Final Maturity Date: Interest Payment Date falling in July 2042
Interest Payment Date falling in July 2042
(8) Specified Denominations: £100,000 and integral multiples of £1,000 in excess thereof
£100,000 and integral multiples of £1,000 in excess thereof
(9) Interest basis: Three-month Sterling LIBOR Floating Rate
Three-month Sterling LIBOR Floating Rate
(further particulars specified below) (further particulars specified below)
(10) Change of interest basis:
Not Applicable Not Applicable
(11) Redemption/payment basis:
Pass-through Pass-through
(12) Change of redemption/payment basis:
Not Applicable Not Applicable
(13) Call Option Date:
Applicable Interest Payment Date occurring in January 2016 and each subsequent Interest Payment Date thereafter
Applicable Interest Payment Date occurring in January 2016 and each subsequent Interest Payment Date thereafter
(14) Step-Up Date: Interest Payment Date occurring in January 2016 (further particulars specified below)
Interest Payment Date occurring in January 2016 (further particulars specified below)
(15) Form of Notes:
Registered Notes: Reg S Global Note registered in the name of a nominee for a common depositary for Euroclear and Clearstream, Luxembourg
Registered Notes: Reg S Global Note registered in the name of a nominee for a common depositary for Euroclear and Clearstream, Luxembourg

3
(16) Expected Ratings (Standard & Poor's/Moody's/Fitch):
AAA(sf)/Aaa(sf)/AAA(sf) A(sf)/A2(sf)/A(sf)
(17) Post-enforcement call option/Limited recourse:
(a) Condition 10.2 (Post-Enforcement Call Option): Not Applicable Not Applicable
(b) Condition 10.3 (Limited Recourse):
Applicable Applicable
(18) (a) Listing and admission to trading:
Application has been made by the Master Issuer (or on its behalf) for the Notes to be admitted to trading on the London Stock Exchange's Regulated Market and listed on the Official List of the UK Listing Authority.
Application has been made by the Master Issuer (or on its behalf) for the Notes to be admitted to trading on the London Stock Exchange's Regulated Market and listed on the Official List of the UK Listing Authority.
(b) Estimate of total expenses related to admission to trading:
For all 2013-1 Notes, an aggregate amount of £12,450
(19) (a) Status of the Notes:
Direct, secured and unconditional obligation of the Master Issuer.
Direct, secured and unconditional obligation of the Master Issuer.
(b) Date of board approval for issuance of the Notes:
28 March 2013 28 March 2013
PROVISIONS RELATING TO INTEREST (IF ANY) PAYABLE
(20) Interest Commencement Date:
5th April 2013 5th April 2013
(21) Fixed Rate Note provisions:
Not Applicable Not Applicable
(22) Floating Rate Note provisions:
Applicable Applicable
(a) Interest Payment Dates:
15th January, 15th April, 15th July and 15th October in each year up to and including the Final Maturity Date). The first Interest Payment Date will be 15th July 2013.
15th January, 15th April, 15th July and 15th October in each year up to and including the Final Maturity Date). The first Interest Payment Date will be 15th July 2013.

4
(b) Business Day Convention:
Following Business Day Convention
Following Business Day Convention
(c) Additional Business Centre(s):
Not Applicable Not Applicable
(d) Manner in which the Rate of Interest and Interest Amount is to be determined:
Screen Rate Determination Screen Rate Determination
(e) Party responsible for calculating the Rate of Interest and Interest Amount (if not the Agent Bank)/Calculation Agent:
Not Applicable Not Applicable
(f) Screen Rate Determination:
Applicable Applicable
• Reference Rate:
Three month sterling LIBOR (or in respect of the first Interest Period, the linear interpolation of three month and four month sterling LIBOR)
Three month sterling LIBOR (or in respect of the first Interest Period, the linear interpolation of three month and four month sterling LIBOR)
• Determination Date(s):
First day of each Interest Period First day of each Interest Period
• Relevant Screen Page:
Reuters Monitor Money Rates Service at the page designated as LIBOR 01
Reuters Monitor Money Rates Service at the page designated as LIBOR 01
(g) ISDA Determination:
Not Applicable Not Applicable
(h) Margin(s):
+0.45% per annum +1.10% per annum
(i) Minimum Rate of Interest:
Not Applicable Not Applicable
(j) Maximum Rate of Interest:
Not Applicable Not Applicable
(k) Step-Up Date:
Interest Payment Date occurring in January 2016
Interest Payment Date occurring in January 2016

5
(l) Step-Up Margin(s):
+0.90% per annum +2.20% per annum
(m) Day Count Fraction:
Actual/365 Actual/365
(n) Fallback provisions, rounding provisions and any other terms relating to the method of calculating interest on Floating Rate Notes if different from those set out in the Conditions:
Not Applicable Not Applicable
(23) Zero Coupon Note Provisions:
Not Applicable Not Applicable
(24) Other special provisions relating to Interest Payment Dates:
Not Applicable
Not Applicable
(25) Talons for future coupons to be attached to Definitive Notes (and dates on which talons mature):
No No
PROVISIONS RELATING TO REPAYMENT
(26) Details relating to bullet redemption notes:
Not Applicable
Not Applicable
(27) Details relating to scheduled redemption notes:
Not Applicable
Not Applicable
(28) Details relating to pass-through notes:
Applicable
Applicable
(a) Pass-through repayment dates:
To be redeemed in full or in part on each Interest Payment Date falling on or after the Interest Payment Date in January 2016
To be redeemed in full or in part on each Interest Payment Date falling on or after the Interest Payment Date on which all the 2013-1 Series 1 Class 1A Notes have been redeemed in full

6
(29) Maturity Purchase Notes:
Not Applicable
Not Applicable
(30) Redemption Amount:
Condition 5.6 applies Condition 5.6 applies
(31) Early redemption amount per Specified Denomination payable on redemption for taxation reasons or an event of default or other early redemption and/or method of calculating the same (if required or if different from that set out in the Conditions):
Not Applicable Not Applicable
(32) Redenomination, renominalisation and reconventioning provisions applicable:
Redenomination not applicable
Redenomination not applicable
PROVISIONS RELATING TO MASTER ISSUER SWAPS
(33) Master Issuer Swap Provider(s):
Not Applicable Not Applicable
(a) Specified Currency Exchange Rate (Sterling/specified currency) specified in the Master Issuer Swap Agreement relating to the Notes:
Not Applicable Not Applicable
(b) Specified fixed/floating interest rate exchange rate specified in the Master Issuer Swap Agreement relating to the Notes:
Not Applicable Not Applicable
(c) Specified interest rate exchange rate specified in the Master Issuer Swap Agreement relating to the Notes:
Not Applicable Not Applicable

7
PROVISIONS RELATING TO SUBORDINATION/CREDIT ENHANCEMENT AT THE MASTER ISSUER LEVEL
(34) Issuing entity start-up loan to be advanced on the Closing Date:
Not Applicable Not Applicable
(35) Aggregate outstanding principal balance of all issuing entity start-up loans (including any issuing entity start-up loan to be advanced on the Closing Date) as at the Closing Date:
£0 £0
(36) Issuing entity subordinated loan to be advanced on the Closing Date:
Not Applicable Not Applicable
(37) Aggregate outstanding principal balance of all issuing entity subordinated loans (including any issuing entity subordinated loans to be advanced on the Closing Date) as at the Closing Date:
£0 £0
PROVISIONS RELATING TO SUBORDINATION/CREDIT ENHANCEMENT AT THE FUNDING 2 LEVEL
(38) Required subordinated loan tranche principal amount outstanding:1
£0 £0
(39) Aggregate outstanding principal balance of all subordinated loan tranches (including any subordinated loan tranches to be advanced on the Closing Date) as at the Closing Date:
£0 £0
(40) Funding 2 reserve required amount as at the Closing Date2:
For all Notes issued by the Master Issuer, £405,000,000
(41) Funding 2 start-up loan to be advanced on the Closing Date:
(a) Funding 2 start-up loan provider:
Bank of Scotland plc
(b) Initial outstanding principal balance:
£1,200,000
1 As set out in the base prospectus, this figure may be further adjusted in subsequent final terms or drawdown prospectuses. 2 As set out in the base prospectus, this figure may be further adjusted in subsequent final terms or drawdown prospectuses.

8
(c) Interest rate: (a) In the case of the rate of interest to the Funding 2 Interest Payment Date falling in July 2013 the linear interpolation of LIBOR for three month sterling deposits and LIBOR for four month sterling deposits plus a margin of 0.25% per cent. per annum and (b) thereafter three month sterling LIBOR plus 0.25% per annum.
(42) Aggregate outstanding principal balance of all Funding 2 start-up loans (including any Funding 2 start-up loans to be advanced on the Closing Date) as at the Closing Date
£644,222,352.20
(43) Funding 2 Z Loan required amount as at the Closing Date:3
£2,548,000,000
(44) Funding 2 Z loan to be advanced on the Closing Date:
Not Applicable
(45) Aggregate outstanding principal balance of all Funding 2 Z loans (including any Funding 2 Z loan to be advanced on the Closing Date) as at the Closing Date:
£2,978,000,000
(46) Funding 2 yield reserve required amount:
Not Applicable Not Applicable
(47) Funding 2 yield reserve reduction amount:
Not Applicable Not Applicable
(48) Funding 2 yield reserve reduction date:
Not Applicable Not Applicable
(49) Funding 2 Yield Reserve Notes to be issued on the Closing Date:
Not Applicable Not Applicable
PROVISIONS RELATING TO SELLING RESTRICTIONS AND US TAX
(50) Whether TEFRA D or TEFRA C rules applicable or TEFRA rules not applicable:
TEFRA not applicable TEFRA not applicable
(51) Additional selling restrictions:
Reg S Notes only Reg S Notes only
3 As set out in the base prospectus, this figure may be further adjusted in subsequent final terms or drawdown prospectuses.
9
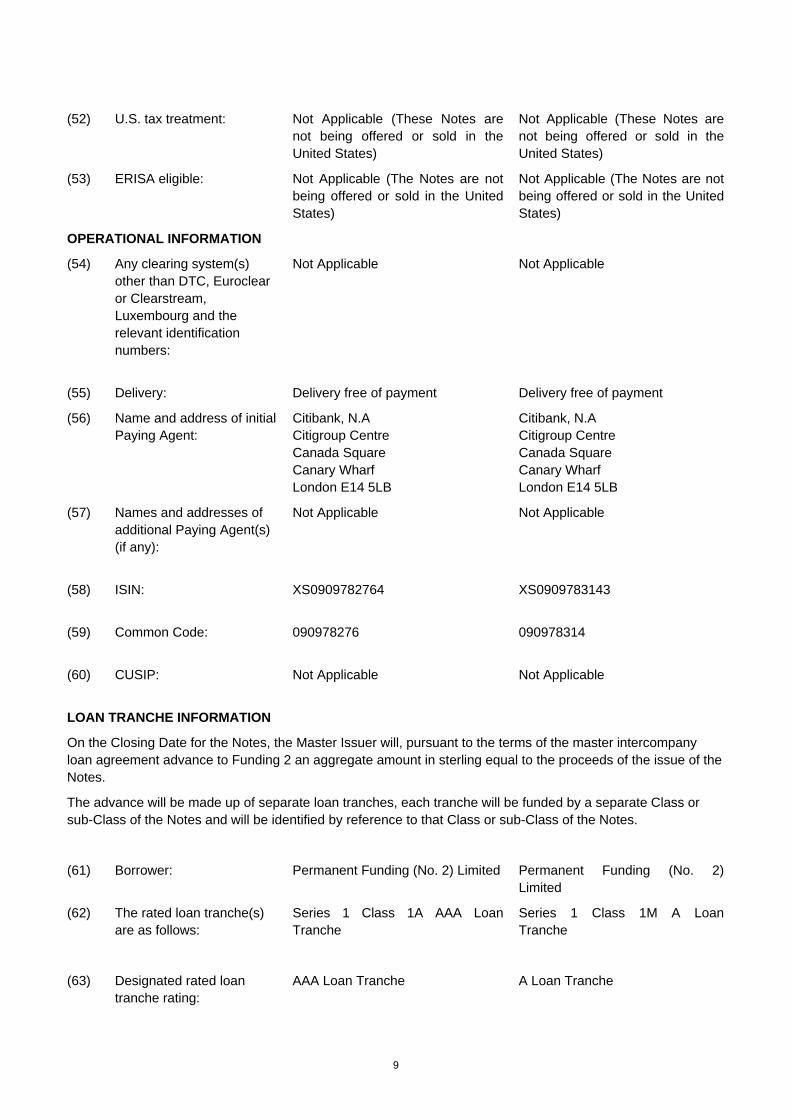
(52) U.S. tax treatment:
Not Applicable (These Notes are not being offered or sold in the United States)
Not Applicable (These Notes are not being offered or sold in the United States)
(53) ERISA eligible:
Not Applicable (The Notes are not being offered or sold in the United States)
Not Applicable (The Notes are not being offered or sold in the United States)
OPERATIONAL INFORMATION
(54) Any clearing system(s) other than DTC, Euroclear or Clearstream, Luxembourg and the relevant identification numbers:
Not Applicable Not Applicable
(55) Delivery: Delivery free of payment Delivery free of payment
(56) Name and address of initial Paying Agent:
Citibank, N.A Citigroup Centre Canada Square Canary Wharf London E14 5LB
Citibank, N.A Citigroup Centre Canada Square Canary Wharf London E14 5LB
(57) Names and addresses of additional Paying Agent(s) (if any):
Not Applicable Not Applicable
(58) ISIN:
XS0909782764 XS0909783143
(59) Common Code:
090978276 090978314
(60) CUSIP:
Not Applicable Not Applicable
LOAN TRANCHE INFORMATION
On the Closing Date for the Notes, the Master Issuer will, pursuant to the terms of the master intercompany loan agreement advance to Funding 2 an aggregate amount in sterling equal to the proceeds of the issue of the Notes.
The advance will be made up of separate loan tranches, each tranche will be funded by a separate Class or sub-Class of the Notes and will be identified by reference to that Class or sub-Class of the Notes.
(61) Borrower:
Permanent Funding (No. 2) Limited Permanent Funding (No. 2) Limited
(62) The rated loan tranche(s) are as follows:
Series 1 Class 1A AAA Loan Tranche
Series 1 Class 1M A Loan Tranche
(63) Designated rated loan tranche rating:
AAA Loan Tranche
A Loan Tranche

10
(64) Designation of rated loan tranche:
Pass-through Loan Tranche Pass-through Loan Tranche
(65) Initial principal amount:
£1,250,000,000 £500,000,000
(66) Closing Date:
5th April 2013 5th April 2013
(67) Interest commencement date:
5th April 2013 5th April 2013
(68) Rated loan tranche payment dates:
The pass-through loan tranche repayment dates
The pass-through loan tranche repayment dates
(69) Rated loan tranche rate:
Sum of (a), (b) and (c): Sum of (a), (b) and (c):
(a) Reuters Screen Page LIBOR01:
Reuters Monitor Money Rates Service at the page designated as LIBOR 01
Reuters Monitor Money Rates Service at the page designated as LIBOR 01
(b) Rated loan tranche rate margin:
+0.45% +1.10%
(c) Funding 2 yield reserve primary revenue margin:
Not Applicable
Not Applicable
(70) Step-Up Date (if any):
The Funding 2 Interest Payment Date occurring in January 2016
The Funding 2 Interest Payment Date occurring in January 2016
(71) Stepped-up loan tranche rate:
+0.90% per annum +2.20% per annum
(72) Details relating to bullet loan tranches:
Not Applicable
Not Applicable
(73) Details relating to scheduled amortisation loan tranches:
Not Applicable
Not Applicable
(74) Details relating to pass-through loan tranches:
Applicable
Applicable
(a) Pass-through loan tranche repayment dates:
Pass-through Loan Tranches will be due and payable from, and including, the Funding 2 Interest Payment Date occurring on January 2016
Pass-through Loan Tranches will be due and payable from, and including, the Funding 2 Interest Payment Date occurring on and after repayment in full of the Series 1 Class 1A AAA Loan Tranche
(b) Final repayment date:
The Funding 2 Interest Payment Date falling in July 2042
The Funding 2 Interest Payment Date falling in July 2042
A13.4.9(ii)
Cat B
11
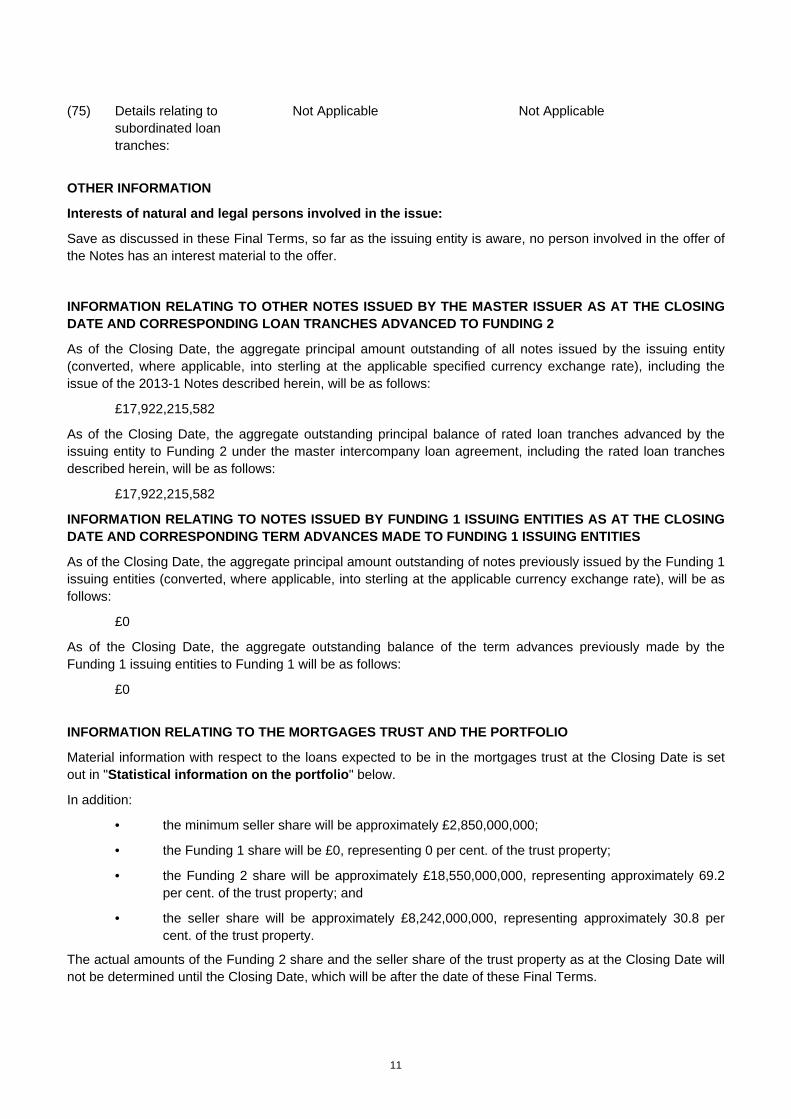
(75) Details relating to subordinated loan tranches:
Not Applicable Not Applicable
OTHER INFORMATION
Interests of natural and legal persons involved in the issue:
Save as discussed in these Final Terms, so far as the issuing entity is aware, no person involved in the offer of the Notes has an interest material to the offer.
INFORMATION RELATING TO OTHER NOTES ISSUED BY THE MASTER ISSUER AS AT THE CLOSING DATE AND CORRESPONDING LOAN TRANCHES ADVANCED TO FUNDING 2
As of the Closing Date, the aggregate principal amount outstanding of all notes issued by the issuing entity (converted, where applicable, into sterling at the applicable specified currency exchange rate), including the issue of the 2013-1 Notes described herein, will be as follows:
£17,922,215,582
As of the Closing Date, the aggregate outstanding principal balance of rated loan tranches advanced by the issuing entity to Funding 2 under the master intercompany loan agreement, including the rated loan tranches described herein, will be as follows:
£17,922,215,582
INFORMATION RELATING TO NOTES ISSUED BY FUNDING 1 ISSUING ENTITIES AS AT THE CLOSING DATE AND CORRESPONDING TERM ADVANCES MADE TO FUNDING 1 ISSUING ENTITIES
As of the Closing Date, the aggregate principal amount outstanding of notes previously issued by the Funding 1 issuing entities (converted, where applicable, into sterling at the applicable currency exchange rate), will be as follows:
£0
As of the Closing Date, the aggregate outstanding balance of the term advances previously made by the Funding 1 issuing entities to Funding 1 will be as follows:
£0
INFORMATION RELATING TO THE MORTGAGES TRUST AND THE PORTFOLIO
Material information with respect to the loans expected to be in the mortgages trust at the Closing Date is set out in "Statistical information on the portfolio" below.
In addition:
• the minimum seller share will be approximately £2,850,000,000;
• the Funding 1 share will be £0, representing 0 per cent. of the trust property;
• the Funding 2 share will be approximately £18,550,000,000, representing approximately 69.2 per cent. of the trust property; and
• the seller share will be approximately £8,242,000,000, representing approximately 30.8 per cent. of the trust property.
The actual amounts of the Funding 2 share and the seller share of the trust property as at the Closing Date will not be determined until the Closing Date, which will be after the date of these Final Terms.
12
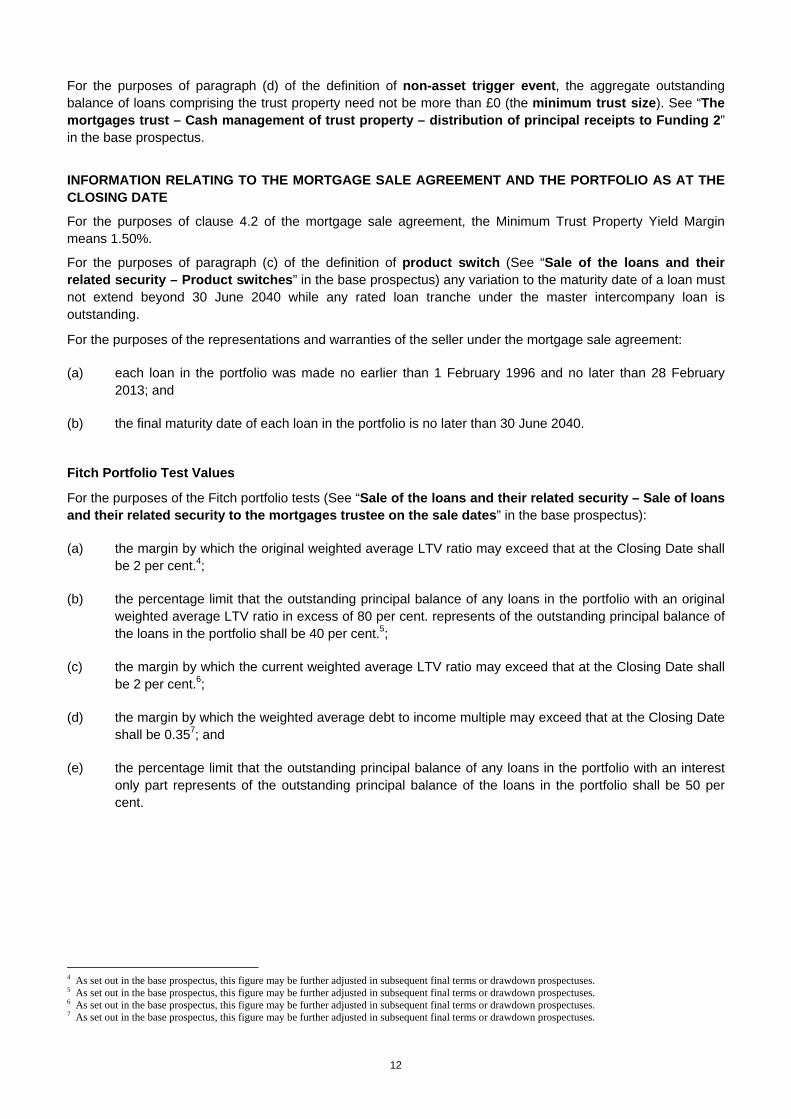
For the purposes of paragraph (d) of the definition of non-asset trigger event, the aggregate outstanding balance of loans comprising the trust property need not be more than £0 (the minimum trust size). See “The mortgages trust – Cash management of trust property – distribution of principal receipts to Funding 2” in the base prospectus.
INFORMATION RELATING TO THE MORTGAGE SALE AGREEMENT AND THE PORTFOLIO AS AT THE CLOSING DATE
For the purposes of clause 4.2 of the mortgage sale agreement, the Minimum Trust Property Yield Margin means 1.50%.
For the purposes of paragraph (c) of the definition of product switch (See “Sale of the loans and their related security – Product switches” in the base prospectus) any variation to the maturity date of a loan must not extend beyond 30 June 2040 while any rated loan tranche under the master intercompany loan is outstanding.
For the purposes of the representations and warranties of the seller under the mortgage sale agreement:
(a) each loan in the portfolio was made no earlier than 1 February 1996 and no later than 28 February 2013; and
(b) the final maturity date of each loan in the portfolio is no later than 30 June 2040.
Fitch Portfolio Test Values
For the purposes of the Fitch portfolio tests (See “Sale of the loans and their related security – Sale of loans and their related security to the mortgages trustee on the sale dates” in the base prospectus):
(a) the margin by which the original weighted average LTV ratio may exceed that at the Closing Date shall be 2 per cent.4;
(b) the percentage limit that the outstanding principal balance of any loans in the portfolio with an original weighted average LTV ratio in excess of 80 per cent. represents of the outstanding principal balance of the loans in the portfolio shall be 40 per cent.5;
(c) the margin by which the current weighted average LTV ratio may exceed that at the Closing Date shall be 2 per cent.6;
(d) the margin by which the weighted average debt to income multiple may exceed that at the Closing Date shall be 0.357; and
(e) the percentage limit that the outstanding principal balance of any loans in the portfolio with an interest only part represents of the outstanding principal balance of the loans in the portfolio shall be 50 per cent.
4 As set out in the base prospectus, this figure may be further adjusted in subsequent final terms or drawdown prospectuses. 5 As set out in the base prospectus, this figure may be further adjusted in subsequent final terms or drawdown prospectuses. 6 As set out in the base prospectus, this figure may be further adjusted in subsequent final terms or drawdown prospectuses. 7 As set out in the base prospectus, this figure may be further adjusted in subsequent final terms or drawdown prospectuses.

13
Use of proceeds
The gross proceeds from the issue of the 2013-1 Notes equal approximately £1,750,000,000 and (after exchanging, where applicable, the proceeds of the 2013-1 Notes for sterling, calculated by reference to the applicable specified currency exchange rate) will be used by the issuing entity to make available rated loan tranches to Funding 2 pursuant to the terms of the master intercompany loan agreement. Funding 2 will use the gross proceeds of each rated loan tranche to pay the purchase price to the seller for the sale of part of its share in the trust property to Funding 2 on the Closing Date.

14
Maturity and prepayment considerations
The average lives of any series and class of the 2013-1 Notes cannot be stated, as the actual rate of repayment of the loans and redemption of the mortgages and a number of other relevant factors are unknown. However, calculations of the possible average lives of each series and class of the 2013-1 Notes can be made based on certain assumptions. The assumptions used to calculate the possible average lives of each series and class of the 2013-1 Notes in the following table include that:
(1) neither the issuing entity security nor the Funding 2 security has been enforced;
(2) the seller is not in breach of the terms of the mortgage sale agreement;
(3) the seller sells no new loans to the mortgages trustee after the Closing Date and the loans are assumed to amortise in accordance with the assumed constant payment rate indicated in the table below;
(4) neither an asset trigger event nor a non-asset trigger event occurs;
(5) no event occurs that would cause payments on scheduled amortisation loan tranches or pass-through loan tranches to be deferred (unless such advances are deferred in accordance with Rule (1) (C) or Rule (1) (D) as set out in “Cashflows – Distribution of Funding 2 available principal receipts - Rule (1) – Repayment deferrals” in the base prospectus);
(6) the annualised CPR as at the Closing Date is assumed to be the same as the various assumed rates in the table below;
(7) there is a balance of £0 in the Funding 2 cash accumulation ledger at the Closing Date and a balance of £0 in the Funding 1 cash accumulation ledger at the Closing Date;
(8) the issuing entity exercises its option to redeem the 2013-1 Notes on the Step-Up Date, relating to the 2013-1 Notes; and
(9) the Closing Date is 5 April 2013.
CPR and possible average lives of each series and class of issue 2013-1 Notes (in years)
Based upon the foregoing assumptions, the approximate average life in years of each series and class of issue 2013-1 Notes, at various assumed rates of repayment of the loans, would be as follows:
Constant payment rate(1) (per annum)
series 1 class 1A
Notes
series 1 class 1M
Notes
5 per cent ........................................... 2.78 2.78 10 per cent ......................................... 2.78 2.78 15 per cent ......................................... 2.78 2.78 20 per cent ......................................... 2.78 2.78 25 per cent ......................................... 2.78 2.78 30 per cent ......................................... 2.78 2.78 35 per cent ......................................... 2.78 2.78
_______________________________
(1) Includes both scheduled and unscheduled payments.
Assumptions (1), (2), (3), (4), (5), (8) and (9) relate to circumstances which are not predictable. No assurance can be given that the issuing entity will be in a position to redeem the 2013-1 Notes on the Step-Up Date. If the issuing entity does not so exercise its option to redeem, then the average lives of the then outstanding 2013-1 Notes would be extended.
The average lives of the 2013-1 Notes are subject to factors largely outside the control of the issuing entity and consequently no assurance can be given that these assumptions and estimates will prove in any way to be realistic and they must therefore be viewed with considerable caution. For more information in relation to the risks involved in the use of these estimated average lives, see “Risk factors – The yield to maturity of

15
your notes may be adversely affected by prepayments or redemptions on the loans” in the base prospectus.

16
Statistical information on the portfolio
The cut-off date mortgage portfolio
For the purposes of this section entitled “Statistical information on the portfolio”, all references to “portfolio”, unless the context otherwise requires, include the loans and their related security currently comprising the mortgages trust.
The statistical and other information contained in these Final Terms has been compiled by reference to the loans in the portfolio as at the cut-off date that, subject as provided, are expected to indirectly secure the 2013-1 Notes and all other notes of the issuing entity as at 14 December 2012 (the cut-off date). Columns stating percentage amounts may not add up to 100% due to rounding. A loan will be removed from any new portfolio (which comprises a portion of the portfolio as at the cut-off date) if, in the period up to (and including) the assignment date relating to such new portfolio, the loan is repaid in full or if the loan does not comply with the terms of the mortgage sale agreement on or about the applicable assignment date. Once such loans are removed, the seller will then randomly select from the loans remaining in the new portfolio those loans to be assigned on the applicable assignment date once the determination has been made as to the anticipated principal balances of the notes to be issued and the corresponding size of the trust that would be required ultimately to support payments on the notes and all other notes of the issuing entity and the Funding 1 issuing entities. The loans in the mortgages trust are selected on the basis of the seller's selection criteria for inclusion in the mortgages trust. The material aspects of the seller's lending criteria are described under “The loans – Underwriting –“ and “The loans – Lending criteria” in the base prospectus. Standardised credit scoring is not used in the UK mortgage market. For an indication of the credit quality of borrowers in respect of the loans, investors may refer to such lending criteria and to the historical performance of the loans in the mortgages trust as set forth in these Final Terms. One significant indicator of obligor credit quality is arrears and losses. The information presented under “Delinquency and loss experience of the portfolio (including loans which and only whilst they previously formed part of the portfolio)” on page 23 in these Final Terms reflects the arrears and repossession experience for loans in the expected portfolio as at the cut-off date, including loans that were contained in the portfolio since the inception of the mortgages trust. All of the loans in the table were originated by Halifax or by Bank of Scotland under the “Halifax” brand (the Halifax loans), but not all of the loans form part of the portfolio. It is not expected that the characteristics of the portfolio as at the Closing Date will differ materially from the characteristics of the portfolio as at the cut-off date. These tables have been prepared using the current balance as at the cut-off date, which includes all principal and accrued interest for the loans in the portfolio.
The expected portfolio as at the cut-off date consisted of 353,776 mortgage accounts, comprising loans originated by Halifax or by Bank of Scotland under the “Halifax” brand and secured over properties located in England, Wales and Scotland and having an aggregate outstanding principal balance of £27,908,233,704.99 as at that date. The loans in the expected portfolio as at the cut-off date were originated between 1 February 1996 and 31 October 2010.
As at 1 March 2013, HVR 1 was 3.99% per annum, HVR 2 was 3.89% per annum, HHVR was 3.99% per annum and the Halifax flexible variable rate was 3.89% per annum.
Approximately 1.87% of the aggregate outstanding principal balance of the loans in the portfolio as at the cut-off date were extended to the relevant borrowers in connection with the purchase by those borrowers of properties from local authorities or certain other landlords under the right-to-buy schemes governed by the Housing Act 1985 (as amended by the Housing Act 2004 and the Housing (Scotland) Act 2010) or (as applicable) the Housing (Scotland) Act 1987 (as amended by the Housing (Scotland) Act 2001).
Outstanding balances as at the cut-off date
The following table shows the range of outstanding mortgage account balances (including capitalised interest, capitalised high LTV fees, insurance fees, booking fees and valuation fees) as at the cut-off date.

17
Range of outstanding balances as at the cut-off date*
Aggregate outstanding balance as at the cut-off date
(£) % of total
Number of mortgage accounts % of total
£0 – <£25,000 ................................. 926,217,018.04 3.32% 74,590 21.08% £25,000 – <£50,000........................ 2,655,568,611.17 9.52% 71,687 20.26% £50,000 – <£75,000........................ 3,729,241,432.76 13.36% 60,091 16.99% £75,000 – <£100,000...................... 4,052,136,077.73 14.52% 46,657 13.19% £100,000 – <£125,000.................... 3,692,439,912.69 13.23% 33,050 9.34% £125,000 – <£150,000.................... 3,115,327,727.62 11.16% 22,779 6.44% £150,000 – <£175,000.................... 2,396,099,898.27 8.59% 14,844 4.20% £175,000 – <£200,000.................... 1,798,223,861.98 6.44% 9,639 2.72% £200,000 – <£225,000.................... 1,332,967,270.32 4.78% 6,304 1.78% £225,000 – <£250,000.................... 967,667,775.23 3.47% 4,089 1.16% £250,000 – <£275,000.................... 719,857,801.59 2.58% 2,755 0.78% £275,000 – <£300,000.................... 567,149,834.09 2.03% 1,977 0.56% £300,000 – <£350,000.................... 779,064,114.45 2.79% 2,422 0.68% £350,000 – <£400,000.................... 533,870,166.52 1.91% 1,434 0.41% £400,000 – <£450,000.................... 394,281,510.54 1.41% 932 0.26% £450,000 – <£500,000.................... 248,120,692.00 0.89% 526 0.15% >=£500,000..................................... - 0.00% - 0.00% Total................................................ £ 27,908,233,704.99 100.00% 353,776 100.00%
___________________________________________
* Including capitalised interest, capitalised high LTV fees, insurance fees, booking fees and valuation fees.
The largest mortgage account (including capitalised interest, capitalised high LTV fees, insurance fees, booking fees and valuation fees) had an outstanding current balance as at the cut-off date of £499,682.87 and the smallest mortgage account had an outstanding current balance as at the cut-off date of £0.01. The weighted average current balance (including capitalised interest, capitalised high LTV fees, insurance fees, booking fees and valuation fees) as at the cut-off date was £138,627.57.
LTV ratios at origination
The following table shows the range of LTV ratios, which express the outstanding balance of the aggregate of loans in a mortgage account (excluding capitalised interest, capitalised high LTV fees, insurance fees, booking fees and valuation fees) as at the date of the initial loan origination divided by the value of the property securing the loans in that mortgage account at the same date. The seller has not revalued any of the mortgaged properties since the date of the origination of the related loan other than where an additional lending or certain product transfer has been applied for or granted on an account since origination, in which case the original valuation may have been updated with a more recent valuation. Where this is the case, this revised valuation has been used in formulating this data.
Range of LTV Ratios at origination*
Aggregate outstanding balance as at the cut-off
date (£) % of total
Number of mortgage accounts % of total
0% – <25%............................ 503,944,140.18 1.81% 20,443 5.78% 25% – <50%.......................... 3,246,326,166.88 11.63% 70,122 19.82% 50% – <75%.......................... 9,904,322,138.18 35.49% 119,311 33.73% 75% – <80%.......................... 2,974,979,265.26 10.66% 28,055 7.93% 80% – <85%.......................... 2,287,393,259.25 8.20% 22,231 6.28% 85% – <90%.......................... 3,276,293,363.50 11.74% 30,799 8.71% 90% – <95%.......................... 3,585,166,492.64 12.85% 35,730 10.10% 95% – <=97% ....................... 1,464,413,842.18 5.25% 18,379 5.20% >97%..................................... 665,395,036.92 2.38% 8,706 2.46%

18
Range of LTV Ratios at origination*
Aggregate outstanding balance as at the cut-off
date (£) % of total
Number of mortgage accounts % of total
Total...................................... 27,908,233,704.99 100.00% 353,776 100.00%
____________________________________________
* Excluding capitalised interest, capitalised high LTV fees, insurance fees, booking fees and valuation fees.
The weighted average LTV ratio of the mortgage accounts (excluding any capitalised interest, capitalised high LTV fees, insurance fees, booking fees and valuation fees) at origination was 72.26%. The highest LTV ratio of any mortgage account (excluding any capitalised interest, capitalised high LTV fees, insurance fees, booking fees and valuation fees) at origination was 97.00% and the lowest was 0.12%.
Cut-off date LTV ratios
The following table shows the range of LTV ratios, which express the outstanding balance of the aggregate of loans in a mortgage account (including capitalised interest, capitalised high LTV fees, insurance fees, booking fees and valuation fees) as at the cut-off date divided by the indexed valuation of the property securing the loans in that mortgage account at the same date.
Range of LTV Ratios as at the cut-off date*
Aggregate outstanding balance at the cut-off date
(£) % of total
Number of mortgage accounts % of total
0% – <25%............................ 2,125,451,081.51 7.62% 94,687 26.76% 25% – <50%.......................... 5,816,136,993.07 20.84% 93,510 26.43% 50% – <75%.......................... 8,961,741,312.41 32.11% 82,005 23.18% 75% – <80%.......................... 2,185,021,236.23 7.83% 17,185 4.86% 80% – <85%.......................... 2,208,610,326.15 7.91% 17,118 4.84% 85% – <90%.......................... 2,086,424,755.53 7.48% 15,958 4.51% 90% – <95%.......................... 1,616,157,561.89 5.79% 12,399 3.50% 95% – <100%........................ 1,177,007,332.87 4.22% 8,558 2.42% 100% – <105%...................... 822,697,058.81 2.95% 5,805 1.64% 105% – <110%...................... 466,440,951.24 1.67% 3,339 0.94% 110% – <115%...................... 262,119,271.11 0.94% 1,888 0.53% 115% – <120%...................... 121,207,109.78 0.43% 872 0.25% 120% – <125%...................... 39,213,476.03 0.14% 301 0.09% >=125%................................. 20,005,238.35 0.07% 151 0.04% Total...................................... 27,908,233,704.99 100.00% 353,776 100.00%
____________________________________________
* Including capitalised interest, capitalised high LTV fees, insurance fees, booking fees and valuation fees.
The weighted average LTV ratio of the mortgage accounts (including any capitalised interest, capitalised high LTV fees, insurance fees, booking fees and valuation fees) as at the cut-off date was 64.94%. The highest LTV ratio of any mortgage account (including any capitalised interest, capitalised high LTV fees, insurance fees, booking fees and valuation fees) was 149.79% and the lowest was 0%.
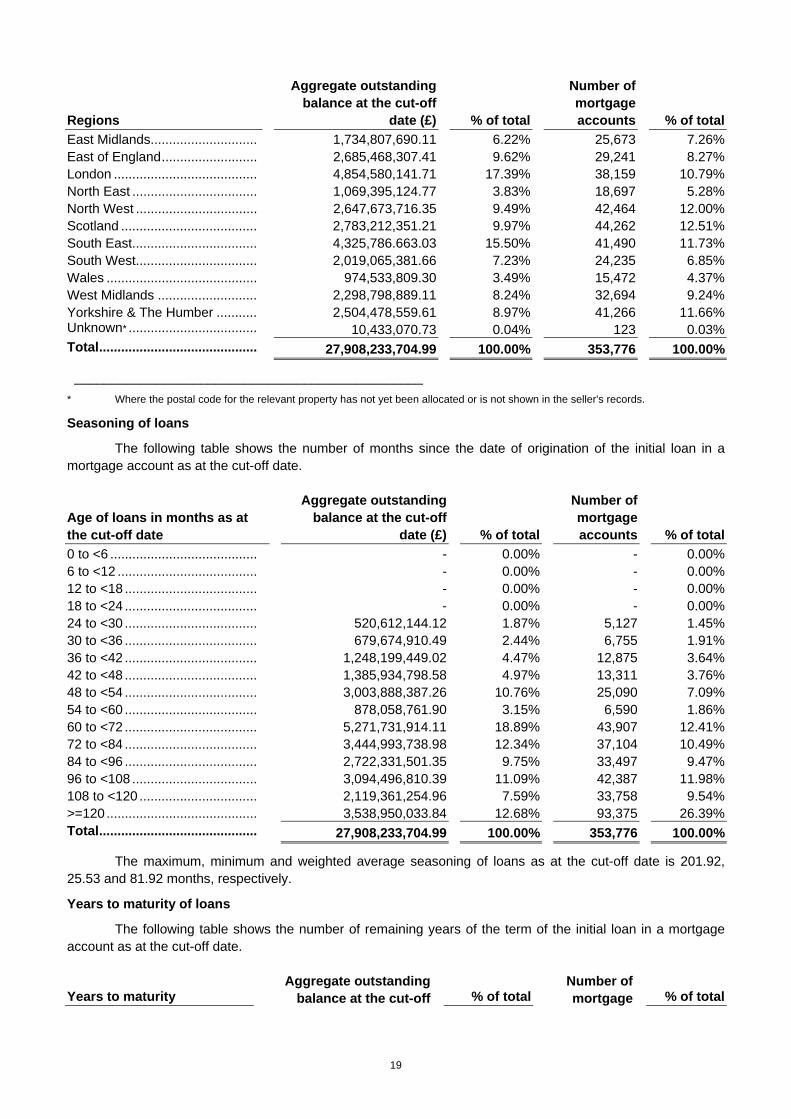
Geographical distribution
The following table shows the distribution of properties securing the loans throughout England, Wales and Scotland as at the cut-off date. No such properties are situated outside England, Wales or Scotland. The seller's lending criteria and current credit scoring tests do not take into account the geographical location of the property securing a loan.
Regions
Aggregate outstanding balance at the cut-off
date (£) % of total
Number of mortgage accounts % of total
19
Regions
Aggregate outstanding balance at the cut-off
date (£) % of total
Number of mortgage accounts % of total
East Midlands............................. 1,734,807,690.11 6.22% 25,673 7.26% East of England.......................... 2,685,468,307.41 9.62% 29,241 8.27% London ....................................... 4,854,580,141.71 17.39% 38,159 10.79% North East .................................. 1,069,395,124.77 3.83% 18,697 5.28% North West ................................. 2,647,673,716.35 9.49% 42,464 12.00% Scotland ..................................... 2,783,212,351.21 9.97% 44,262 12.51% South East.................................. 4,325,786.663.03 15.50% 41,490 11.73% South West................................. 2,019,065,381.66 7.23% 24,235 6.85% Wales ......................................... 974,533,809.30 3.49% 15,472 4.37% West Midlands ........................... 2,298,798,889.11 8.24% 32,694 9.24% Yorkshire & The Humber ........... 2,504,478,559.61 8.97% 41,266 11.66% Unknown* ................................... 10,433,070.73 0.04% 123 0.03% Total........................................... 27,908,233,704.99 100.00% 353,776 100.00%
_______________________________________________
* Where the postal code for the relevant property has not yet been allocated or is not shown in the seller's records.
Seasoning of loans
The following table shows the number of months since the date of origination of the initial loan in a mortgage account as at the cut-off date.
Age of loans in months as at the cut-off date
Aggregate outstanding balance at the cut-off
date (£) % of total
Number of mortgage accounts % of total
0 to <6 ........................................ - 0.00% - 0.00% 6 to <12 ...................................... - 0.00% - 0.00% 12 to <18 .................................... - 0.00% - 0.00% 18 to <24 .................................... - 0.00% - 0.00% 24 to <30 .................................... 520,612,144.12 1.87% 5,127 1.45% 30 to <36 .................................... 679,674,910.49 2.44% 6,755 1.91% 36 to <42 .................................... 1,248,199,449.02 4.47% 12,875 3.64% 42 to <48 .................................... 1,385,934,798.58 4.97% 13,311 3.76% 48 to <54 .................................... 3,003,888,387.26 10.76% 25,090 7.09% 54 to <60 .................................... 878,058,761.90 3.15% 6,590 1.86% 60 to <72 .................................... 5,271,731,914.11 18.89% 43,907 12.41% 72 to <84 .................................... 3,444,993,738.98 12.34% 37,104 10.49% 84 to <96 .................................... 2,722,331,501.35 9.75% 33,497 9.47% 96 to <108 .................................. 3,094,496,810.39 11.09% 42,387 11.98% 108 to <120 ................................ 2,119,361,254.96 7.59% 33,758 9.54% >=120......................................... 3,538,950,033.84 12.68% 93,375 26.39% Total........................................... 27,908,233,704.99 100.00% 353,776 100.00%
The maximum, minimum and weighted average seasoning of loans as at the cut-off date is 201.92, 25.53 and 81.92 months, respectively.
Years to maturity of loans
The following table shows the number of remaining years of the term of the initial loan in a mortgage account as at the cut-off date.
Years to maturity Aggregate outstanding
balance at the cut-off % of total Number of mortgage % of total

20
date (£) accounts
<5 ............................................ 1,621,315,507.31 5.81% 48,346 13.67% 5 to <10 ................................... 3,405,133,867.54 12.20% 63,702 18.01% 10 to <15 ................................. 6,121,319,054.43 21.93% 84,718 23.95% 15 to <20 ................................. 10,388,451,767.37 37.22% 99,628 28.16% 20 to <25 ................................. 5,146,036,004.52 18.44% 45,442 12.84% 25 to <30 ................................. 1,225,977,503.82 4.39% 11,940 3.38% >=30 ........................................ - 0.00% - 0.00% Total........................................ 27,908,233,704.99 100.00% 353,776 100.00%
The maximum, minimum and weighted average remaining term of the loans as at the cut-off date was 27.58, 15.64 and 0 years, respectively.
Purpose of loan
The following table shows whether the purpose of the initial loan in a mortgage account on origination was to finance the purchase of a new property or to remortgage a property already owned by the borrower.
Use of proceeds
Aggregate outstanding balance at the cut-off date (£) % of total
Number of mortgage accounts % of total
Purchase.................................... 17,700,851,270.41 63.43% 234,271 66.22% Remortgage ............................... 10,207,382,434.58 36.57% 119,505 33.78% Total........................................... 27,908,233,704.99 100.00% 353,776 100.00%
As at the cut-off date, the weighted average balance of loans used to finance the purchase of a new property was £131,807.60 and the weighted average balance of loans used to remortgage a property already owned by the borrower was £150,454.24.
Property type
The following table shows the types of properties to which the mortgage accounts relate.
Property type
Aggregate outstanding balance at the cut-off
date (£) % of total
Number of mortgage accounts % of total
Detached house................. 4,625,929,986.44 16.58% 32,984 9.32% Semi-detached house ........ 5,479,523,642.08 19.63% 56,955 16.10% Terraced house.................. 5,482,634,471.99 19.65% 60,202 17.02% House – detachment type unknown1 ...........................
44,077,856.68 0.16% 397 0.11%
Flat or maisonette .............. 3,270,312,456.36 11.72% 32,852 9.29% Bungalow ........................... 952,266,367.52 3.41% 10,287 2.91% Unknown2........................... 8,053,488,923.92 28.86% 160,099 45.25%
Total................................... 27,908,233,704.99 100.00% 353,776 100.00%
Detachment type of Unknown property type
Aggregate outstanding balance at the cut-off
date (£) % of total
Number of mortgage accounts % of total
Detached............................ 2,306,491,900.35 8.26% 36,337 10.27% Semi-detached................... 2,600,862,810.37 9.32% 56,646 16.01% Terraced............................. 2,482,322,610.00 8.89% 54,541 15.42% Other3................................. 663,811,603.20 2.38% 12,575 3.55%
Total Unknown ................. 8,053,488,923.92 28.86% 160,099 45.25%
____________________________________________

21
1 Where the detachment type of the house is not shown in the seller's records.
2 Where the property type is not shown in the seller's records.
3 Primarily flats or maisonettes.
As at the cut-off date, the weighted average balance of loans secured by detached houses, semi-detached houses, terraced houses and flats was £203,659.01, £138,060.62, £130,835.06 and £148,271.70, respectively.
Origination channel
The following table shows the origination channel for the initial loan in a mortgage account.
Origination channel
Aggregate outstanding balance at the cut-off date (£) % of total
Number of mortgage accounts % of total
Direct............................................... 11,189,603,407.36 40.09% 173,304 48.99% Intermediary / Other ........................ 16,718,630,297.62 59.91% 180,472 51.01%
Total................................................ 27,908,233,704.99 100.00% 353,776 100.00%
The direct origination includes former Halifax estate agency branches, direct internet applications and telephone sales.
As at the cut-off date, the weighted average balance of loans originated through direct origination and intermediaries and other channels was £113,537.58 and £155,420.04, respectively.
Repayment terms
The following table shows the repayment terms for the loans in the mortgage accounts as at the cut-off date. Where any loan in a mortgage account is interest-only, then that entire mortgage account is classified as interest-only.
Repayment terms
Aggregate outstanding balance at the cut-off
date (£) % of total
Number of mortgage accounts % of total
Repayment............................ 15,290,893,738.80 54.79% 240,880 68.09% Interest Only.......................... 12,617,339,966.18 45.21% 112,896 31.91% Total...................................... 27,908,233,704.99 100.00% 353,776 100.00%
As at the cut-off date, the weighted average balance of repayment loans and interest-only loans was £105,589.20 and £178,666.61, respectively.
Payment methods
The following table shows the payment methods for the mortgage accounts as at the cut-off date.
Payment method
Aggregate outstanding balance at the cut-off date (£) % of total
Number of mortgage accounts % of total
Direct debit .................................... 25,528,267,157.29 91.47% 320,073 90.47% Other ............................................. 2,379,966,547.70 8.53% 33,703 9.53% Total.............................................. 27,908,233,704.99 100.00% 353,776 100.00%
____________________________________________
* External standing orders, internal standing orders and payments made over the counter at a branch.
22
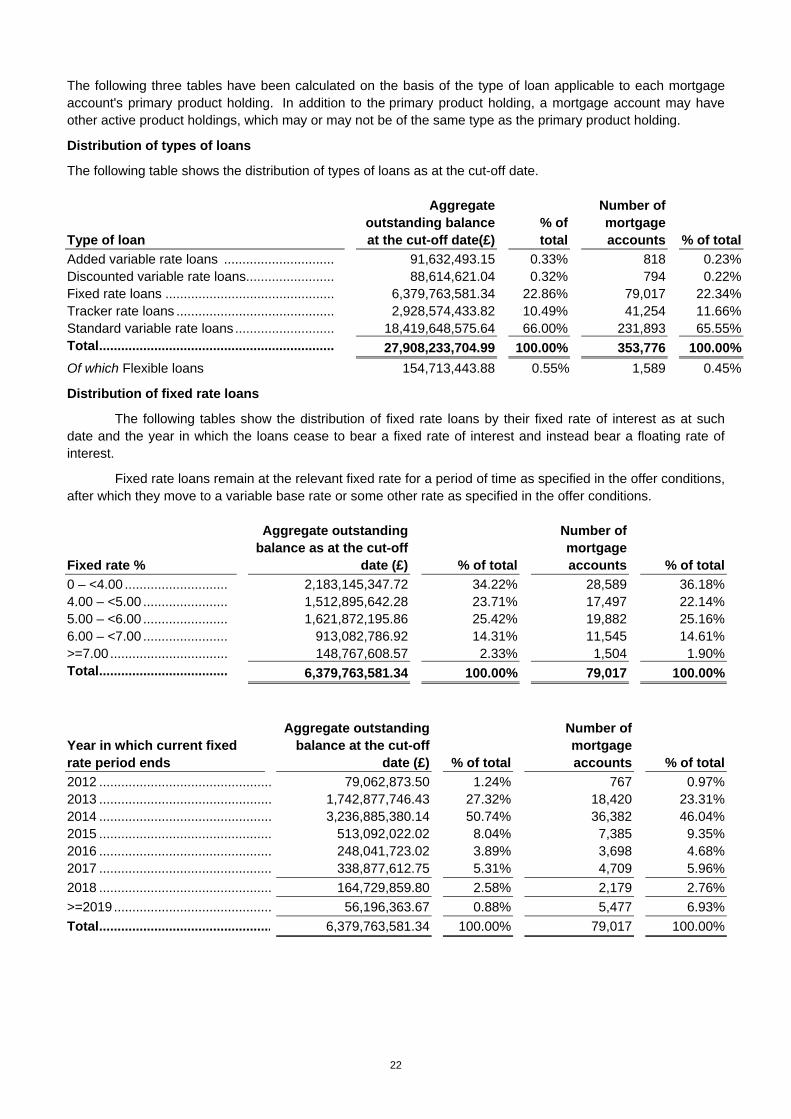
The following three tables have been calculated on the basis of the type of loan applicable to each mortgage account's primary product holding. In addition to the primary product holding, a mortgage account may have other active product holdings, which may or may not be of the same type as the primary product holding.
Distribution of types of loans
The following table shows the distribution of types of loans as at the cut-off date.
Type of loan
Aggregate outstanding balance at the cut-off date(£)
% of total
Number of mortgage accounts % of total
Added variable rate loans .............................. 91,632,493.15 0.33% 818 0.23% Discounted variable rate loans........................ 88,614,621.04 0.32% 794 0.22% Fixed rate loans .............................................. 6,379,763,581.34 22.86% 79,017 22.34% Tracker rate loans ........................................... 2,928,574,433.82 10.49% 41,254 11.66% Standard variable rate loans........................... 18,419,648,575.64 66.00% 231,893 65.55% Total................................................................ 27,908,233,704.99 100.00% 353,776 100.00%
Of which Flexible loans 154,713,443.88 0.55% 1,589 0.45%
Distribution of fixed rate loans
The following tables show the distribution of fixed rate loans by their fixed rate of interest as at such date and the year in which the loans cease to bear a fixed rate of interest and instead bear a floating rate of interest.
Fixed rate loans remain at the relevant fixed rate for a period of time as specified in the offer conditions, after which they move to a variable base rate or some other rate as specified in the offer conditions.
Fixed rate %
Aggregate outstanding balance as at the cut-off
date (£) % of total
Number of mortgage accounts % of total
0 – <4.00 ............................ 2,183,145,347.72 34.22% 28,589 36.18% 4.00 – <5.00 ....................... 1,512,895,642.28 23.71% 17,497 22.14% 5.00 – <6.00 ....................... 1,621,872,195.86 25.42% 19,882 25.16% 6.00 – <7.00 ....................... 913,082,786.92 14.31% 11,545 14.61% >=7.00 ................................ 148,767,608.57 2.33% 1,504 1.90% Total................................... 6,379,763,581.34 100.00% 79,017 100.00%
Year in which current fixed rate period ends
Aggregate outstanding balance at the cut-off
date (£) % of total
Number of mortgage accounts % of total
2012 ............................................... 79,062,873.50 1.24% 767 0.97% 2013 ............................................... 1,742,877,746.43 27.32% 18,420 23.31% 2014 ............................................... 3,236,885,380.14 50.74% 36,382 46.04% 2015 ............................................... 513,092,022.02 8.04% 7,385 9.35% 2016 ............................................... 248,041,723.02 3.89% 3,698 4.68% 2017 ............................................... 338,877,612.75 5.31% 4,709 5.96%
2018 ............................................... 164,729,859.80 2.58% 2,179 2.76%
>=2019........................................... 56,196,363.67 0.88% 5,477 6.93%
Total............................................... 6,379,763,581.34 100.00% 79,017 100.00%
23
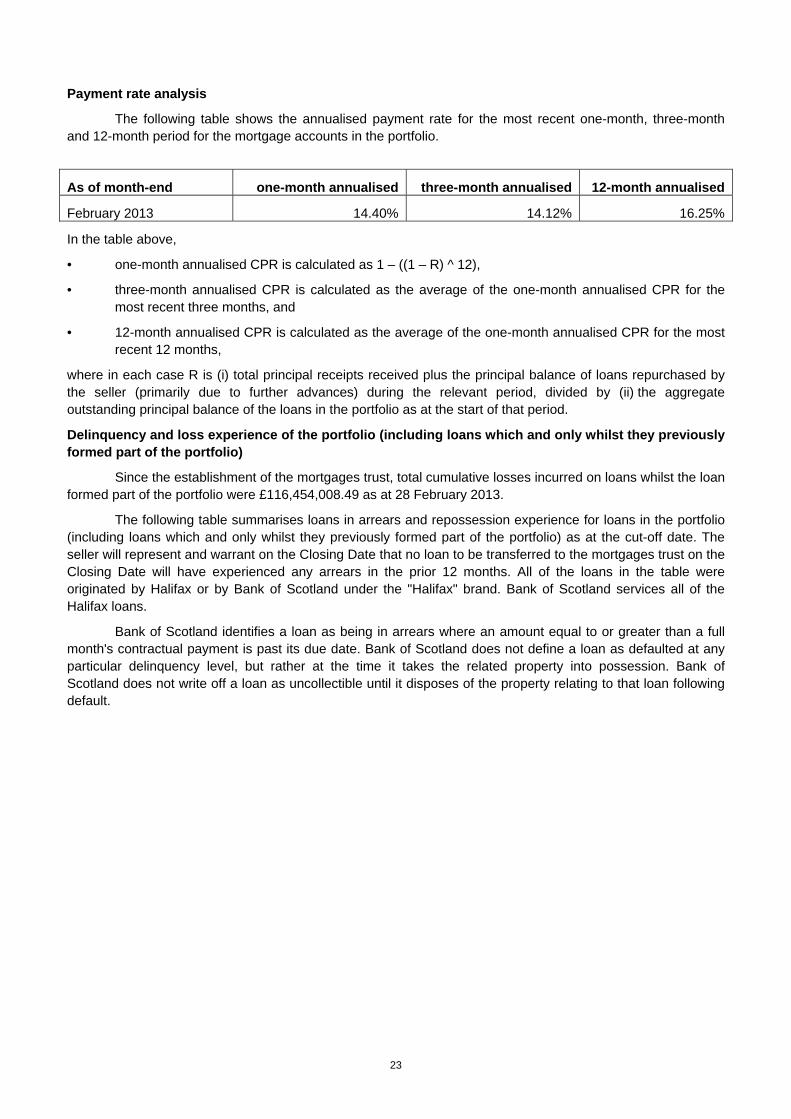
Payment rate analysis
The following table shows the annualised payment rate for the most recent one-month, three-month and 12-month period for the mortgage accounts in the portfolio.
As of month-end one-month annualised three-month annualised 12-month annualised
February 2013 14.40% 14.12% 16.25%
In the table above,
• one-month annualised CPR is calculated as 1 – ((1 – R) ^ 12),
• three-month annualised CPR is calculated as the average of the one-month annualised CPR for the most recent three months, and
• 12-month annualised CPR is calculated as the average of the one-month annualised CPR for the most recent 12 months,
where in each case R is (i) total principal receipts received plus the principal balance of loans repurchased by the seller (primarily due to further advances) during the relevant period, divided by (ii) the aggregate outstanding principal balance of the loans in the portfolio as at the start of that period.
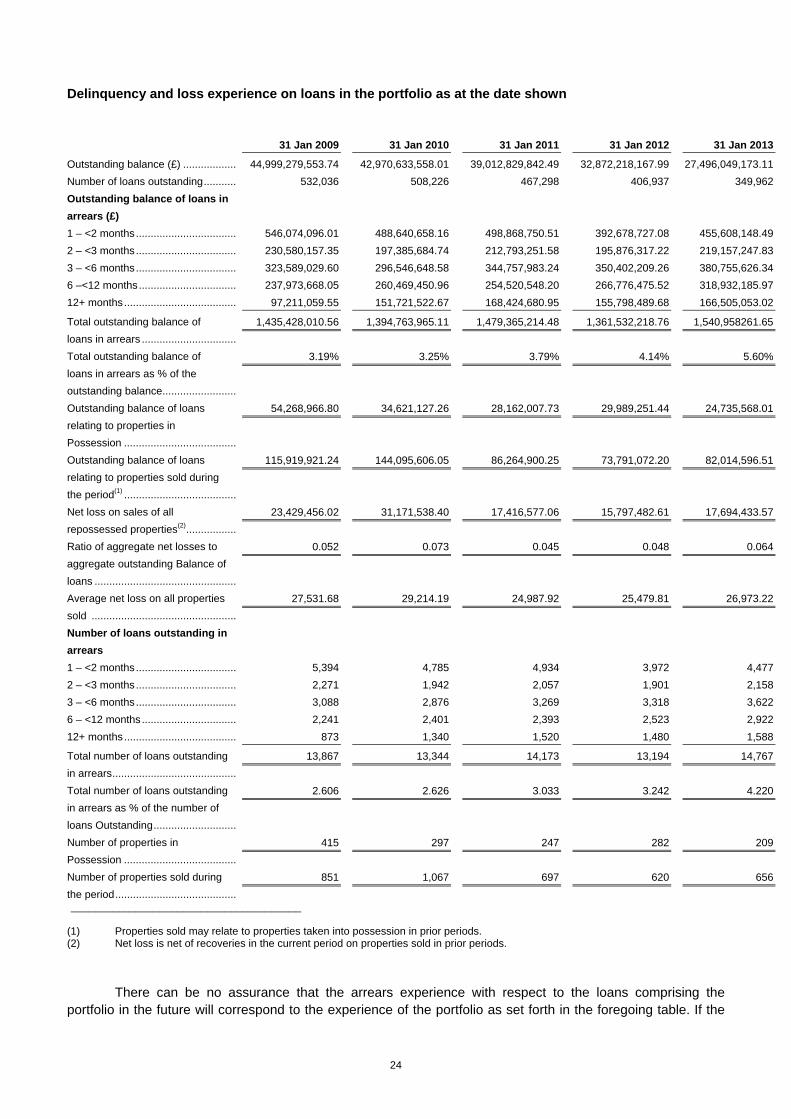
Delinquency and loss experience of the portfolio (including loans which and only whilst they previously formed part of the portfolio)
Since the establishment of the mortgages trust, total cumulative losses incurred on loans whilst the loan formed part of the portfolio were £116,454,008.49 as at 28 February 2013.
The following table summarises loans in arrears and repossession experience for loans in the portfolio (including loans which and only whilst they previously formed part of the portfolio) as at the cut-off date. The seller will represent and warrant on the Closing Date that no loan to be transferred to the mortgages trust on the Closing Date will have experienced any arrears in the prior 12 months. All of the loans in the table were originated by Halifax or by Bank of Scotland under the "Halifax" brand. Bank of Scotland services all of the Halifax loans.
Bank of Scotland identifies a loan as being in arrears where an amount equal to or greater than a full month's contractual payment is past its due date. Bank of Scotland does not define a loan as defaulted at any particular delinquency level, but rather at the time it takes the related property into possession. Bank of Scotland does not write off a loan as uncollectible until it disposes of the property relating to that loan following default.
24
Delinquency and loss experience on loans in the portfolio as at the date shown
31 Jan 2009 31 Jan 2010 31 Jan 2011 31 Jan 2012 31 Jan 2013
Outstanding balance (£) .................. 44,999,279,553.74 42,970,633,558.01 39,012,829,842.49 32,872,218,167.99 27,496,049,173.11
Number of loans outstanding........... 532,036 508,226 467,298 406,937 349,962
Outstanding balance of loans in
arrears (£)
1 – <2 months.................................. 546,074,096.01 488,640,658.16 498,868,750.51 392,678,727.08 455,608,148.49
2 – <3 months.................................. 230,580,157.35 197,385,684.74 212,793,251.58 195,876,317.22 219,157,247.83
3 – <6 months.................................. 323,589,029.60 296,546,648.58 344,757,983.24 350,402,209.26 380,755,626.34
6 –<12 months................................. 237,973,668.05 260,469,450.96 254,520,548.20 266,776,475.52 318,932,185.97
12+ months...................................... 97,211,059.55 151,721,522.67 168,424,680.95 155,798,489.68 166,505,053.02
Total outstanding balance of
loans in arrears ................................
1,435,428,010.56 1,394,763,965.11 1,479,365,214.48 1,361,532,218.76 1,540,958261.65
Total outstanding balance of
loans in arrears as % of the
outstanding balance.........................
3.19% 3.25% 3.79% 4.14% 5.60%
Outstanding balance of loans
relating to properties in
Possession ......................................
54,268,966.80 34,621,127.26 28,162,007.73 29,989,251.44 24,735,568.01
Outstanding balance of loans
relating to properties sold during
the period(1) ......................................
115,919,921.24 144,095,606.05 86,264,900.25 73,791,072.20 82,014,596.51
Net loss on sales of all
repossessed properties(2).................
23,429,456.02 31,171,538.40 17,416,577.06 15,797,482.61 17,694,433.57
Ratio of aggregate net losses to
aggregate outstanding Balance of
loans ................................................
0.052 0.073 0.045 0.048 0.064
Average net loss on all properties
sold .................................................
27,531.68 29,214.19 24,987.92 25,479.81 26,973.22
Number of loans outstanding in
arrears
1 – <2 months.................................. 5,394 4,785 4,934 3,972 4,477
2 – <3 months.................................. 2,271 1,942 2,057 1,901 2,158
3 – <6 months.................................. 3,088 2,876 3,269 3,318 3,622
6 – <12 months................................ 2,241 2,401 2,393 2,523 2,922
12+ months...................................... 873 1,340 1,520 1,480 1,588
Total number of loans outstanding
in arrears..........................................
13,867 13,344 14,173 13,194 14,767
Total number of loans outstanding
in arrears as % of the number of
loans Outstanding............................
2.606 2.626 3.033 3.242 4.220
Number of properties in
Possession ......................................
415 297 247 282 209
Number of properties sold during
the period.........................................
851 1,067 697 620 656
_______________________________________ (1) Properties sold may relate to properties taken into possession in prior periods. (2) Net loss is net of recoveries in the current period on properties sold in prior periods.
There can be no assurance that the arrears experience with respect to the loans comprising the portfolio in the future will correspond to the experience of the portfolio as set forth in the foregoing table. If the
25
property market experiences a further decline in property values so that the value of the properties in the portfolio falls or (in the case of properties which are currently below the principal balance of the relevant loan) remains, below the principal balances of the loans, the actual rates of arrears and losses could be significantly higher than those previously experienced, as borrowers may no longer be able to refinance their loans or sell their properties and move to more affordable properties. In addition, other adverse economic conditions, whether or not they affect property values, may nonetheless affect the timely payment by borrowers of principal and interest and, accordingly, the rates of arrears and losses with respect to the loans in the portfolio. Noteholders should observe that the United Kingdom experienced relatively low and stable interest rates during the periods covered in the preceding table. If interest rates were to rise, it is likely that the rate of arrears would rise.
In the late 1980s house prices rose substantially faster than inflation as housing turnover increased to record levels. This was at a time when the economy grew rapidly, which led to falling unemployment and relatively high rates of real income growth. These fed into higher demand for housing, and house prices rose rapidly. Demand was further increased by changes in taxation legislation with regard to tax relief on mortgage payments in 1988. When monetary policy was subsequently tightened (in terms of both “locking in” sterling to the European Exchange Rate Mechanism and higher interest rates), the pace of economic activity first slowed and then turned into recession. Rising unemployment combined with high interest rates led to a fall in housing demand and increased default rates and repossessions. The ability of borrowers to refinance was limited as house prices began to fall and many were in a position of negative equity (borrowings greater than the resale value of the property) in relation to their mortgages.
The level of mortgage arrears on the Halifax loans reduced following the recession in the United Kingdom in the early nineties. The introduction of the scorecard in judging applications – and thus reducing discretion helped to keep the arrears level low, as did a healthy economic climate and low interest rates.
House price inflation has indirectly contributed to the improved arrears situation by enabling borrowers to sell at a profit if they encounter financial hardship.
The dislocation of financial markets in 2007 led to supply issues in the housing finance market while falling house prices and consumer confidence reduced demand for property. This has resulted in some borrowers being unable to sell their property or to refinance their loans due to either a lack of equity, in some instances negative equity, or the lack of available housing finance.
Whilst the economy slowed during 2008 and was in recession for the majority of 2009, during which time unemployment rose, interest rates fell to historically low levels, easing mortgage affordability. This easing of mortgage affordability combined with the use of the scorecard, referred to above, has meant that current arrears levels have not risen to the levels experienced in the early nineties.
Bank of Scotland regularly reviews its lending policies in the light of prevailing market conditions and reviews actions so as to mitigate possible problems. The performance of new business and the arrears profiles are continuously monitored in monthly reports. Any deterioration of the arrears level is investigated and the internal procedures are reviewed if necessary.
26
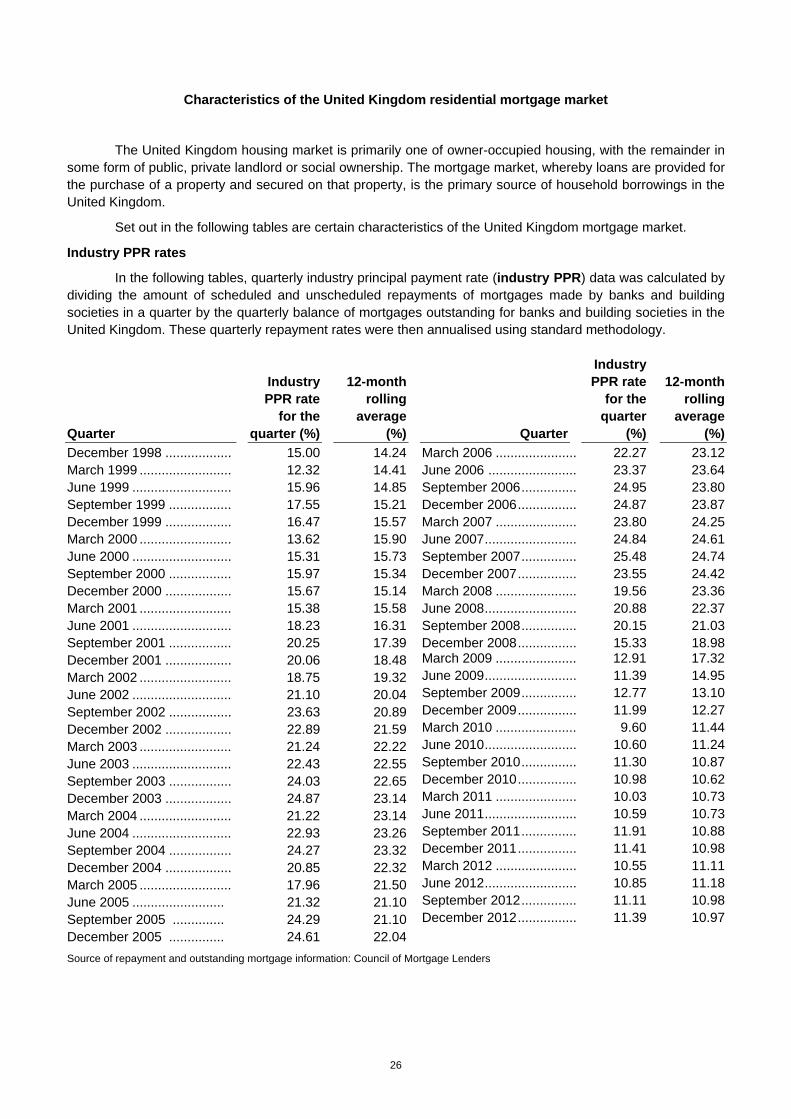
Characteristics of the United Kingdom residential mortgage market
The United Kingdom housing market is primarily one of owner-occupied housing, with the remainder in some form of public, private landlord or social ownership. The mortgage market, whereby loans are provided for the purchase of a property and secured on that property, is the primary source of household borrowings in the United Kingdom.
Set out in the following tables are certain characteristics of the United Kingdom mortgage market.
Industry PPR rates
In the following tables, quarterly industry principal payment rate (industry PPR) data was calculated by dividing the amount of scheduled and unscheduled repayments of mortgages made by banks and building societies in a quarter by the quarterly balance of mortgages outstanding for banks and building societies in the United Kingdom. These quarterly repayment rates were then annualised using standard methodology.
Quarter
Industry PPR rate
for the quarter (%)
12-month rolling
average (%) Quarter
Industry PPR rate
for the quarter
(%)
12-month rolling
average (%)
December 1998 .................. 15.00 14.24 March 2006 ...................... 22.27 23.12 March 1999 ......................... 12.32 14.41 June 2006 ........................ 23.37 23.64 June 1999 ........................... 15.96 14.85 September 2006............... 24.95 23.80 September 1999 ................. 17.55 15.21 December 2006................ 24.87 23.87 December 1999 .................. 16.47 15.57 March 2007 ...................... 23.80 24.25 March 2000 ......................... 13.62 15.90 June 2007......................... 24.84 24.61 June 2000 ........................... 15.31 15.73 September 2007............... 25.48 24.74 September 2000 ................. 15.97 15.34 December 2007................ 23.55 24.42 December 2000 .................. 15.67 15.14 March 2008 ...................... 19.56 23.36 March 2001 ......................... 15.38 15.58 June 2008......................... 20.88 22.37 June 2001 ........................... 18.23 16.31 September 2008............... 20.15 21.03 September 2001 ................. 20.25 17.39 December 2008................ 15.33 18.98 December 2001 .................. 20.06 18.48 March 2009 ...................... 12.91 17.32
March 2002 ......................... 18.75 19.32 June 2009......................... 11.39 14.95
June 2002 ........................... 21.10 20.04 September 2009............... 12.77 13.10
September 2002 ................. 23.63 20.89 December 2009................ 11.99 12.27
December 2002 .................. 22.89 21.59 March 2010 ...................... 9.60 11.44
March 2003 ......................... 21.24 22.22 June 2010......................... 10.60 11.24
June 2003 ........................... 22.43 22.55 September 2010............... 11.30 10.87
September 2003 ................. 24.03 22.65 December 2010................ 10.98 10.62
December 2003 .................. 24.87 23.14 March 2011 ...................... 10.03 10.73
March 2004 ......................... 21.22 23.14 June 2011......................... 10.59 10.73
June 2004 ........................... 22.93 23.26 September 2011............... 11.91 10.88
September 2004 ................. 24.27 23.32 December 2011................ 11.41 10.98
December 2004 .................. 20.85 22.32 March 2012 ...................... 10.55 11.11
March 2005 ......................... 17.96 21.50 June 2012......................... 10.85 11.18
June 2005 ......................... 21.32 21.10 September 2012............... 11.11 10.98
September 2005 .............. 24.29 21.10 December 2012................ 11.39 10.97
December 2005 ............... 24.61 22.04
Source of repayment and outstanding mortgage information: Council of Mortgage Lenders

27
Repossession rate
The table below sets out the repossession rate of residential properties in the United Kingdom since 1985.
Year Repossessions
(%) Year Repossessions
(%) Year Repossessions
(%)
1985 ..................... 0.25 1995............. 0.47 2005............... 0.12 1986 ..................... 0.30 1996............. 0.40 2006............... 0.18 1987 ..................... 0.32 1997............. 0.31 2007............... 0.22 1988 ..................... 0.22 1998............. 0.31 2008............... 0.34 1989 ..................... 0.17 1999............. 0.27 2009............... 0.43 1990 ..................... 0.47 2000............. 0.20 2010............... 0.34 1991 ..................... 0.77 2001............. 0.16 2011………….. 0.33 1992 ..................... 0.69 2002............. 0.11 2012………….. 0.30 1993 ..................... 0.58 2003............. 0.07 1994 ..................... 0.47 2004............. 0.07
Source: Council of Mortgage Lenders
All information contained in these Final Terms in respect of industry PPR rates and repossession rates has been reproduced from information published by the Council of Mortgage Lenders. The issuing entity confirms that all information in these Final Terms in respect of industry PPR rates and repossession rates has been accurately reproduced and that, so far as it is aware and is able to ascertain from information published by the Council of Mortgage Lenders, no facts have been omitted which would render the reproduced information inaccurate or misleading.
House price to earnings ratio
The following table shows the ratio for each year since 1994 of the average house price compared to the average annual income of borrowers in the United Kingdom.
Year Average annual
earnings (£) Average house
price(£) House price to earnings ratio
1994 ........................................................... 22,288 64,787 2.91 1995 ........................................................... 23,114 65,644 2.84 1996 ........................................................... 24,740 70,626 2.85 1997 ........................................................... 26,086 76,103 2.92 1998 ........................................................... 27,317 81,774 2.99 1999 ........................................................... 29,864 92,521 3.10 2000 ........................................................... 31,193 101,550 3.26 2001 ........................................................... 33,967 112,835 3.32 2002 ........................................................... 36,277 128,265 3.54 2003 ........................................................... 38,538 155,627 4.04 2004 ........................................................... 39,873 180,248 4.52 2005 ........................................................... 43,690 190,760 4.37 2006 ........................................................... 50,789 204,813 4.03 2007 ........................................................... 53,617 223,405 4.17 2008 ........................................................... 54,527 227,765 4.18 2009 ........................................................... 53,975 226,064 4.19 2010 ........................................................... 57,973 251,174 4.33 2011 ........................................................... 55,764 245,319 4.40
Source: Office for National Statistics

28
House prices and incomes vary throughout England, Wales and Scotland. The table below summarises the average house price and the average income of borrowers for each region for the year ended 31 December 2011 in order to produce a house price to earnings ratio for each region.
Regions Average annual
earnings (£) Average house
price(£) House price to earnings ratio
North ............................................................ 42,286 156,832 3.71 North West ................................................... 45,513 175,435 3.85 Yorkshire & Humberside .............................. 45,316 171,332 3.78 East Midlands............................................... 46,460 178,884 3.85 West Midlands ............................................. 46,935 189,054 4.03 East Anglia ................................................... 50,646 215,105 4.25 London ......................................................... 82,245 401,489 4.88 South East.................................................... 62,201 295,827 4.76 South West................................................... 51,583 232,171 4.50 Wales ........................................................... 45,165 164,572 3.64 Scotland ....................................................... 49,149 179,863 3.66
Source: Office for National Statistics
All information contained in these Final Terms in respect of average house prices and average earnings has been reproduced from information published by the Department for Communities and Local Government. The issuing entity confirms that all information in these Final Terms in respect of average house prices and average earnings has been accurately reproduced and that, so far as it is aware and is able to ascertain from information published by the Department for Communities and Local Government, no facts have been omitted which would render the reproduced information inaccurate or misleading.
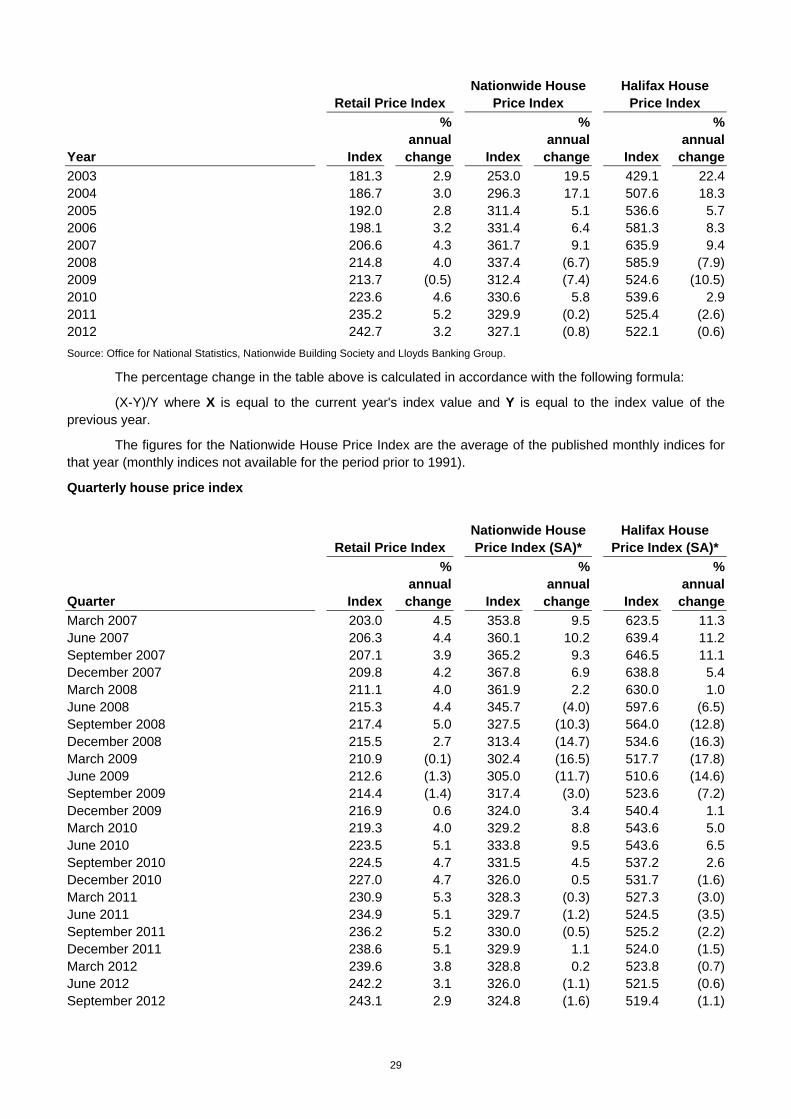
House price index
United Kingdom residential property prices, as measured by the Nationwide House Price Index and the Halifax House Price Index (collectively the Housing Indices), have generally outperformed the United Kingdom Retail Price Index in the recent past. (Nationwide is a United Kingdom building society and Halifax is a brand name of Bank of Scotland, a United Kingdom bank.)
The United Kingdom housing market has been through various economic cycles in the recent past, with large year-to-year increases in the Housing Indices occurring in the late 1980s and the mid 1990s through to mid 2007 and decreases occurring in the early 1990s and mid 2007 through late 2009.
Retail Price Index Nationwide House
Price Index Halifax House
Price Index
Year Index
% annual change Index
% annual change Index
% annual change
1988 106.9 4.9 . . 184.8 23.3 1989 115.2 7.8 . . 223.1 20.8 1990 126.1 9.5 . . 223.2 0.0 1991 133.5 5.9 107.1 . 220.5 (1.2) 1992 138.5 3.7 103.0 (3.8) 208.1 (5.6) 1993 140.7 1.6 102.1 (0.8) 202.1 (2.9) 1994 144.1 2.4 103.5 1.3 203.1 0.5 1995 149.1 3.5 102.3 (1.2) 199.6 (1.7) 1996 152.7 2.4 106.3 4.0 208.6 4.5 1997 157.5 3.1 117.9 10.9 221.7 6.3 1998 162.9 3.4 129.8 10.1 233.7 5.4 1999 165.4 1.5 141.7 9.2 250.5 7.2 2000 170.3 3.0 160.0 12.9 275.1 9.8 2001 173.3 1.8 177.0 10.6 298.6 8.5 2002 176.2 1.7 211.8 19.7 350.6 17.4
29
Retail Price Index Nationwide House
Price Index Halifax House
Price Index
Year Index
% annual change Index
% annual change Index
% annual change
2003 181.3 2.9 253.0 19.5 429.1 22.4 2004 186.7 3.0 296.3 17.1 507.6 18.3 2005 192.0 2.8 311.4 5.1 536.6 5.7 2006 198.1 3.2 331.4 6.4 581.3 8.3 2007 206.6 4.3 361.7 9.1 635.9 9.4 2008 214.8 4.0 337.4 (6.7) 585.9 (7.9) 2009 213.7 (0.5) 312.4 (7.4) 524.6 (10.5) 2010 223.6 4.6 330.6 5.8 539.6 2.9 2011 235.2 5.2 329.9 (0.2) 525.4 (2.6) 2012 242.7 3.2 327.1 (0.8) 522.1 (0.6)
Source: Office for National Statistics, Nationwide Building Society and Lloyds Banking Group.
The percentage change in the table above is calculated in accordance with the following formula:
(X-Y)/Y where X is equal to the current year's index value and Y is equal to the index value of the previous year.
The figures for the Nationwide House Price Index are the average of the published monthly indices for that year (monthly indices not available for the period prior to 1991).
Quarterly house price index
Retail Price Index Nationwide House Price Index (SA)*
Halifax House Price Index (SA)*
Quarter Index
% annual change Index
% annual change Index
% annual change
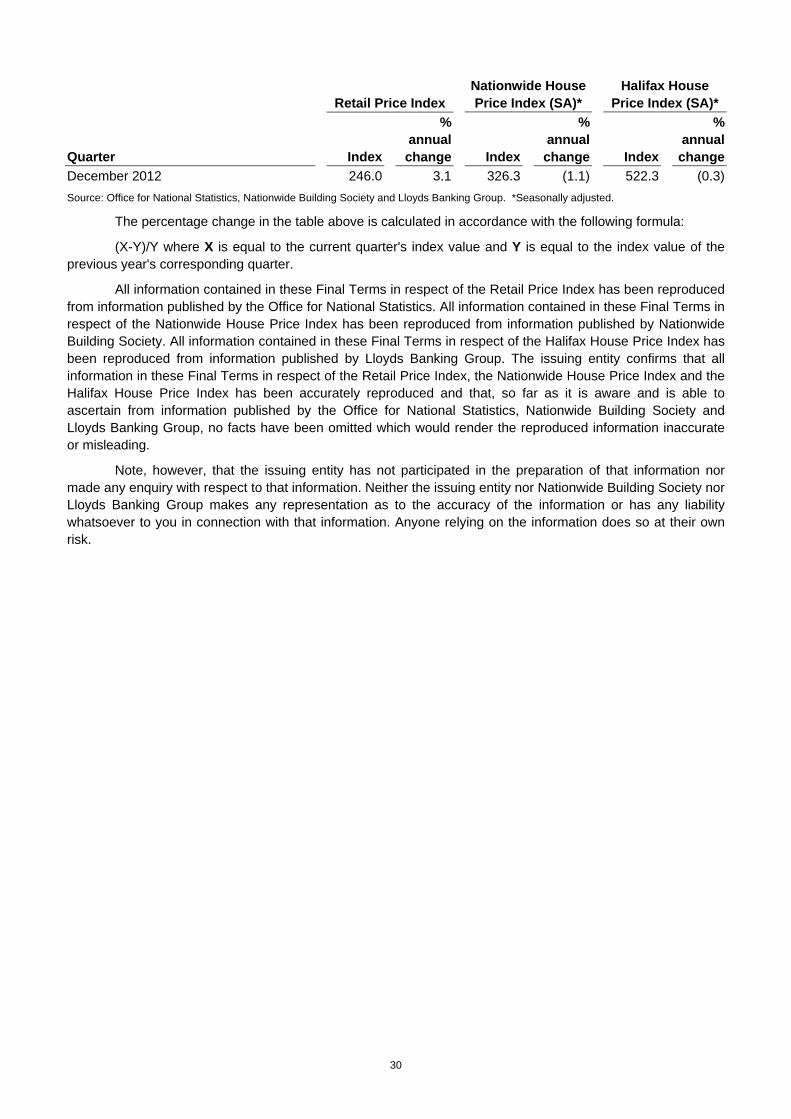
March 2007 203.0 4.5 353.8 9.5 623.5 11.3 June 2007 206.3 4.4 360.1 10.2 639.4 11.2 September 2007 207.1 3.9 365.2 9.3 646.5 11.1 December 2007 209.8 4.2 367.8 6.9 638.8 5.4 March 2008 211.1 4.0 361.9 2.2 630.0 1.0 June 2008 215.3 4.4 345.7 (4.0) 597.6 (6.5) September 2008 217.4 5.0 327.5 (10.3) 564.0 (12.8) December 2008 215.5 2.7 313.4 (14.7) 534.6 (16.3) March 2009 210.9 (0.1) 302.4 (16.5) 517.7 (17.8) June 2009 212.6 (1.3) 305.0 (11.7) 510.6 (14.6) September 2009 214.4 (1.4) 317.4 (3.0) 523.6 (7.2) December 2009 216.9 0.6 324.0 3.4 540.4 1.1 March 2010 219.3 4.0 329.2 8.8 543.6 5.0 June 2010 223.5 5.1 333.8 9.5 543.6 6.5 September 2010 224.5 4.7 331.5 4.5 537.2 2.6 December 2010 227.0 4.7 326.0 0.5 531.7 (1.6) March 2011 230.9 5.3 328.3 (0.3) 527.3 (3.0) June 2011 234.9 5.1 329.7 (1.2) 524.5 (3.5) September 2011 236.2 5.2 330.0 (0.5) 525.2 (2.2) December 2011 238.6 5.1 329.9 1.1 524.0 (1.5) March 2012 239.6 3.8 328.8 0.2 523.8 (0.7) June 2012 242.2 3.1 326.0 (1.1) 521.5 (0.6) September 2012 243.1 2.9 324.8 (1.6) 519.4 (1.1)
30
Retail Price Index Nationwide House Price Index (SA)*
Halifax House Price Index (SA)*
Quarter Index
% annual change Index
% annual change Index
% annual change
December 2012 246.0 3.1 326.3 (1.1) 522.3 (0.3)
Source: Office for National Statistics, Nationwide Building Society and Lloyds Banking Group. *Seasonally adjusted.
The percentage change in the table above is calculated in accordance with the following formula:
(X-Y)/Y where X is equal to the current quarter's index value and Y is equal to the index value of the previous year's corresponding quarter.
All information contained in these Final Terms in respect of the Retail Price Index has been reproduced from information published by the Office for National Statistics. All information contained in these Final Terms in respect of the Nationwide House Price Index has been reproduced from information published by Nationwide Building Society. All information contained in these Final Terms in respect of the Halifax House Price Index has been reproduced from information published by Lloyds Banking Group. The issuing entity confirms that all information in these Final Terms in respect of the Retail Price Index, the Nationwide House Price Index and the Halifax House Price Index has been accurately reproduced and that, so far as it is aware and is able to ascertain from information published by the Office for National Statistics, Nationwide Building Society and Lloyds Banking Group, no facts have been omitted which would render the reproduced information inaccurate or misleading.
Note, however, that the issuing entity has not participated in the preparation of that information nor made any enquiry with respect to that information. Neither the issuing entity nor Nationwide Building Society nor Lloyds Banking Group makes any representation as to the accuracy of the information or has any liability whatsoever to you in connection with that information. Anyone relying on the information does so at their own risk.

31
Static Pool Data
This section sets out, to the extent material, certain static pool information with respect to the loans in the mortgages trust.
The issuing entity has not included static pool information in this section in respect of prepayments, as this information is not separately identified by the servicer. However, prepayment rates in respect of the mortgage loans in the mortgages trust are set out in the monthly reports to investors that are prepared pursuant to the servicing agreement. To date, prepayment rates in respect of the mortgage loans in the mortgages trust have broadly been in line with the industry PPR data set out on page 26 above.
One of the characteristics of the mortgages trust is that the seller is able to sell more loans to the mortgages trustee over time, whether in connection with an issuance of notes by the issuing entity, any new Funding 2 issuing entity or any Funding 1 issuing entity or in order to maintain the minimum seller share. To aid in understanding changes to the mortgages trust over time, the following table sets out information relating to each sale of loans by the seller to the mortgages trustee pursuant to the mortgage sale agreement.
Date
Balance of loans substituted or
sold
Number of loans
substituted or sold In connection with previous issue by
June 2002 .............. £10,117,255,819 173,505 Permanent Financing (No. 1) PLC (dissolved) November 2002 ..... £898,016,408 16,209 N/A January 2003 ......... £894,475,758 16,835 N/A March 2003 ............ £10,538,839,220 186,140 Permanent Financing (No. 2) PLC (dissolved) June 2003 .............. £1,576,963,369 25,652 N/A September 2003 .... £1,688,468,552 23,426 N/A October 2003 ......... £2,735,667,398 37,770 N/A January 2004 ......... £2,670,143,154 35,418 N/A March 2004 ............ £9,376,972,811 134,716 Permanent Financing (No. 4) PLC July 2004................ £3,698,396,657 48,652 N/A November 2004 ..... £9,582,315,930 104,569 Permanent Financing (No. 6) PLC March 2005 ............ £6,625,343,617 70,542 Permanent Financing (No. 7) PLC June 2005 .............. £9,483,670,772 101,317 Permanent Financing (No. 8) PLC December 2005 ..... £5,786,749,656 65,460 N/A March 2006 ............ £9,637,574,095 101,599 Permanent Financing (No. 9) PLC October 2006 ......... £8,838,288,141 86,769 Permanent Master Issuer 2006-1 Notes December 2006 ..... £6,373,073,080 60,773 N/A July 2007................ £5,691,369,649 51,310 N/A November 2007 ..... £8,686,106,961 70,107 N/A April 2008............... £5,919,444,424 45,479 N/A January 2009 ......... £2,997,445,751 23,102 N/A September 2009 .... £5,004,406,381 43,970 N/A May 2010 ............... £4,975,100,475 44,756 N/A March 2011………… £2,606,665,774 26,244 N/A
The sale of new loans by the seller to the mortgages trustee is subject to conditions, including ones required by the rating agencies, designed to maintain certain credit-related and other characteristics of the mortgages trust. These include limits on loans in arrears in the mortgages trust at the time of sale, limits on the aggregate balance of loans sold, limits on changes in the weighted average foreclosure frequency (WAFF) and the weighted average loss severity (WALS), minimum yield for the loans in the mortgages trust after the sale, the Fitch portfolio tests and maximum LTV for the loans in the mortgages trust after the sale. See a description of these conditions in “Sale of the loans and their related security — Sale of loans and their related security to the mortgages trustee on the sale dates” in the base prospectus.

32
The following tables show, for each of the latest five years of origination, the distribution of loans in the mortgages trust originated in that year by delinquency category as at each year-end starting in 2008.
Static pool information set out in this base prospectus is not deemed part of this base prospectus to the extent that the static pool information relates to loans originated by Halifax prior to 1 January 2006.

33
Portfolio arrears by year of origination
Loans originated in 2008 as at each specified date 31 December 2008 31 December 2009 31 December 2010
Number Principal balance % by
number % by
balance Number Principal balance % by
number % by
balance Number Principal balance % by
number % by
balance < 1 month................................... 3,982 £537,263,387.00 98.39% 98.18% 38,333 £4,885,733,478.37 98.24% 98.05% 40,076 £5,099,605,444.31 97.14% 96.89% 1 – < 2 months ........................... 42 £6,773,637.63 1.04% 1.24% 372 £51,704,674.64 0.95% 1.04% 522 £69,532,774.29 1.27% 1.32% 2 – < 3 months ........................... 9 £1,213,738.64 0.22% 0.22% 117 £16,671,648.84 0.30% 0.33% 183 £25,432,815.15 0.44% 0.48% 3 – < 6 months ........................... 12 £1,724,138.00 0.30% 0.32% 131 £18,760,144.21 0.34% 0.38% 277 £37,875,767.06 0.67% 0.72% 6 – < 12 months ......................... 2 £234,712.46 0.05% 0.04% 59 £9,537,270.96 0.15% 0.19% 163 £25,315,418.59 0.40% 0.48%
12+ months ................................ 6 £712,981.04 0.02% 0.01% 36 £5,365,010.58 0.09% 0.10%
Total........................................... 4,047 £547,209,613.73 100.00% 100.00% 39,018 £4,983,120,198.06 100.00% 100.00% 41,257 £5,263,127,229.98 100.00% 100.00%
31 December 2011 31 December 2012
Number Principal balance % by
number % by
balance Number Principal balance % by
number % by
balance < 1 month................................... 36,854 £4,385,556,580.31 96.37% 95.90% 31,618 £3,740,790,204.37 95.59% 94.91% 1 – < 2 months ........................... 514 £68,108,116.63 1.34% 1.49% 466 £62,960,549.67 1.41% 1.60% 2 – < 3 months ........................... 197 £28,010,886.33 0.52% 0.61% 223 £30,067,453.90 0.67% 0.76% 3 – < 6 months ........................... 319 £42,641,597.14 0.83% 0.93% 345 £47,451,752.90 1.04% 1.20% 6 – < 12 months ......................... 250 £34,648,114.62 0.65% 0.76% 304 £44,692,420.92 0.92% 1.13%
12+ months ................................ 109 £13,910,498.86 0.29% 0.30% 122 £15,401,260.28 0.37% 0.39%
Total........................................... 38,243 £4,572,875,793.89 100.00% 100.00% 33,078 £3,941,363,642.04 100.00% 100.00%

34
Loans originated in 2009 as at each specified date 31 December 2008 31 December 2009 31 December 2010
Number Principal balance % by
number % by
balance Number Principal balance % by
number % by
balance Number Principal balance % by
number % by
balance < 1 month................................... 9,750 £1,109,892,049.08 98.57% 98.41% 28,997 £3,135,358,466.62 98.13% 97.94% 1 – < 2 months ........................... 100 £13,227,830.01 1.01% 1.17% 300 £34,097,549.04 1.02% 1.07% 2 – < 3 months ........................... 20 £2,270,373.22 0.20% 0.20% 82 £9,832,808.16 0.28% 0.31% 3 – < 6 months ........................... 20 £2,374,551.54 0.20% 0.21% 117 £15,308,606.02 0.40% 0.48% 6 – < 12 months ......................... 1 £52,129.69 0.01% 0.00% 46 £5,698,343.73 0.16% 0.18%
12+ months ................................ 7 £862,333.40 0.02% 0.03%
Total........................................... 9,891 £1,127,816,933.54 100.00% 100.00% 29,549 £3,201,158,106.97 100.00% 100.00%
31 December 2011 31 December 2012
Number Principal balance % by
number % by
balance Number Principal balance % by
number % by
balance < 1 month................................... 31,497 £3,162,742,222.58 97.40% 97.11% 26,423 £2,564,812,378.68 96.68% 96.32% 1 – < 2 months ........................... 360 £39,394,207.41 1.11% 1.21% 324 £33,322,235.84 1.19% 1.25% 2 – < 3 months ........................... 112 £12,116,229.18 0.35% 0.37% 131 £14,220,447.01 0.48% 0.53% 3 – < 6 months ........................... 208 £24,506,072.15 0.64% 0.75% 207 £23,558,739.46 0.76% 0.88% 6 – < 12 months ......................... 128 £14,742,237.68 0.40% 0.45% 167 £18,193,036.86 0.61% 0.68%
12+ months ................................ 33 £3,474,371.76 0.10% 0.11% 77 £8,619,295.69 0.28% 0.32%
Total........................................... 32,338 £3,256,975,340.76 100.00% 100.00% 27,329 £2,662,726,133.54 100.00% 100.00%

35
Loans originated in 2010 as at each specified date 31 December 2008 31 December 2009 31 December 2010
Number Principal balance % by
number % by
balance Number Principal balance % by
number % by
balance Number Principal balance % by
number % by
balance < 1 month................................... 1,680 £193,974,121.48 98.36% 98.42% 1 – < 2 months ........................... 19 £1,991,605.01 1.11% 1.01% 2 – < 3 months ........................... 5 £584,896.39 0.29% 0.30% 3 – < 6 months ........................... 3 £488,863.82 0.18% 0.25% 6 – < 12 months ......................... 1 £41,817.60 0.06% 0.02%
12+ months ................................
Total........................................... 1,708 £197,081,304.30 100.00% 100.00%
31 December 2011 31 December 2012
Number Principal balance % by
number % by
balance Number Principal balance % by
number % by
balance < 1 month................................... 12,101 £1,271,858,705.28 98.37% 98.33% 10,352 £1,005,866,208.79 97.18% 96.99% 1 – < 2 months ........................... 111 £11,928,820.33 0.90% 0.92% 120 £11,955,681.58 1.13% 1.15% 2 – < 3 months ........................... 38 £4,137,970.11 0.31% 0.32% 53 £5,407,008.14 0.50% 0.52% 3 – < 6 months ........................... 40 £4,116,831.16 0.33% 0.32% 73 £8,420,899.02 0.69% 0.81% 6 – < 12 months ......................... 10 £1,323,118.57 0.08% 0.10% 47 £4,776,586.59 0.44% 0.46%
12+ months ................................ 1 £43,462.22 0.01% 0.00% 7 £645,168.35 0.07% 0.06%
Total........................................... 12,301 £1,293,408,907.67 100.00% 100.00% 10,652 £1,037,071,552.47 100.00% 100.00%
36
There are currently no Loans in the mortgages trust that were originated in 2011 or 2012, so no tables have been produced for these periods.

37
All loans in the mortgages trust as at each specified date
31 December 2008 31 December 2009 31 December 2010
Number Principal balance % by
number % by
balance Number Principal balance % by
number % by
balance Number Principal balance % by
number % by
balance < 1 month................................... 466,416 £37,224,032,569.02 97.19% 96.42% 457,351 £37,511,510,068.03 97.14% 96.39% 437,569 £36,008,557,141.42 96.79% 95.97% 1 – < 2 months ........................... 5,559 £549,662,047.43 1.16% 1.42% 4,854 £487,448,366.26 1.03% 1.25% 5,476 £556,692,649.37 1.21% 1.48% 2 – < 3 months ........................... 2,151 £220,796,709.79 0.45% 0.57% 1,938 £201,693,493.30 0.41% 0.52% 2,055 £212,511,936.17 0.45% 0.57% 3 – < 6 months ........................... 2,833 £294,194,575.89 0.59% 0.76% 2,885 £297,428,785.56 0.61% 0.76% 3,188 £333,617,923.56 0.71% 0.89% 6 – < 12 months ......................... 2,137 £227,390,850.24 0.45% 0.59% 2,496 £273,295,872.35 0.53% 0.70% 2,311 £247,674,942.07 0.51% 0.66%
12+ months ................................ 803 £89,085,851.36 0.17% 0.23% 1,300 £145,836,974.49 0.28% 0.37% 1,472 £162,063,629.54 0.33% 0.43%
Total........................................... 479,899 £38,605,162,603.73 100.00% 100.00% 470,824 £38,917,213,559.99 100.00% 100.00% 452,071 £37,521,118,222.13 100.00% 100.00%
31 December 2011 31 December 2012
Number Principal balance % by
number % by
balance Number Principal balance % by
number % by
balance < 1 month................................... 397,887 £31,917,558,252.23 96.72% 95.81% 339,077 £26,348,820,770.58 95.97% 94.69% 1 – < 2 months ........................... 4,324 £431,400,764.64 1.05% 1.29% 4,146 £410,830,829.98 1.17% 1.48% 2 – < 3 months ........................... 1,921 £200,714,362.63 0.47% 0.60% 2,109 £214,911,292.62 0.60% 0.77% 3 – < 6 months ........................... 3,347 £353,695,110.66 0.81% 1.06% 3,597 £379,688,784.20 1.02% 1.36% 6 – < 12 months ......................... 2,442 £259,525,522.56 0.59% 0.78% 2,849 £311,283,980.74 0.81% 1.12%
12+ months ................................ 1,450 £151,272,881.22 0.35% 0.45% 1,547 £161,840,128.75 0.44% 0.58%
Total........................................... 411,371 £33,314,166,893.94 100.00% 100.00% 353,325 £27,827,375,786.87 100.00% 100.00%

Related Documents