ICICI Group: Performance & Strategy November 2014

Welcome message from author
This document is posted to help you gain knowledge. Please leave a comment to let me know what you think about it! Share it to your friends and learn new things together.
Transcript
ICICI Group: Performance
& Strategy
November 2014
2
Certain statements in these slides are forward-looking statements.
These statements are based on management's current expectations and
are subject to uncertainty and changes in circumstances. Actual results
may differ materially from those included in these statements due to a
variety of factors. More information about these factors is contained in
ICICI Bank's filings with the US Securities and Exchange Commission.
All financial and other information in these slides, other than financial
and other information for specific subsidiaries where specifically
mentioned, is on an unconsolidated basis for ICICI Bank Limited only
unless specifically stated to be on a consolidated basis for ICICI Bank
Limited and its subsidiaries. Please also refer to the statement of
unconsolidated, consolidated and segmental results required by Indian
regulations that has, along with these slides, been filed with the stock
exchanges in India where ICICI Bank’s equity shares are listed and with
the New York Stock Exchange and the US Securities and Exchange
Commission, and is available on our website www.icicibank.com
3
Agenda
Performance highlights
Strategy & outlook
4
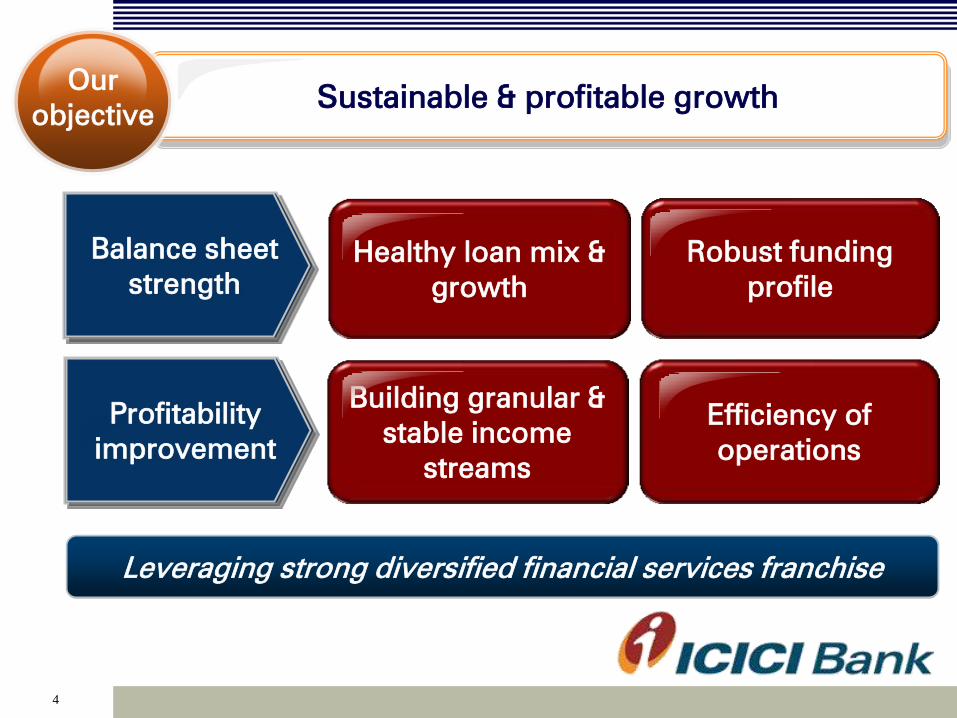
Healthy loan mix &
growth
Robust funding
profile
Building granular &
stable income
streams
Efficiency of
operations
Sustainable & profitable growth Our
objective
Profitability
improvement
Balance sheet
strength
Leveraging strong diversified financial services franchise
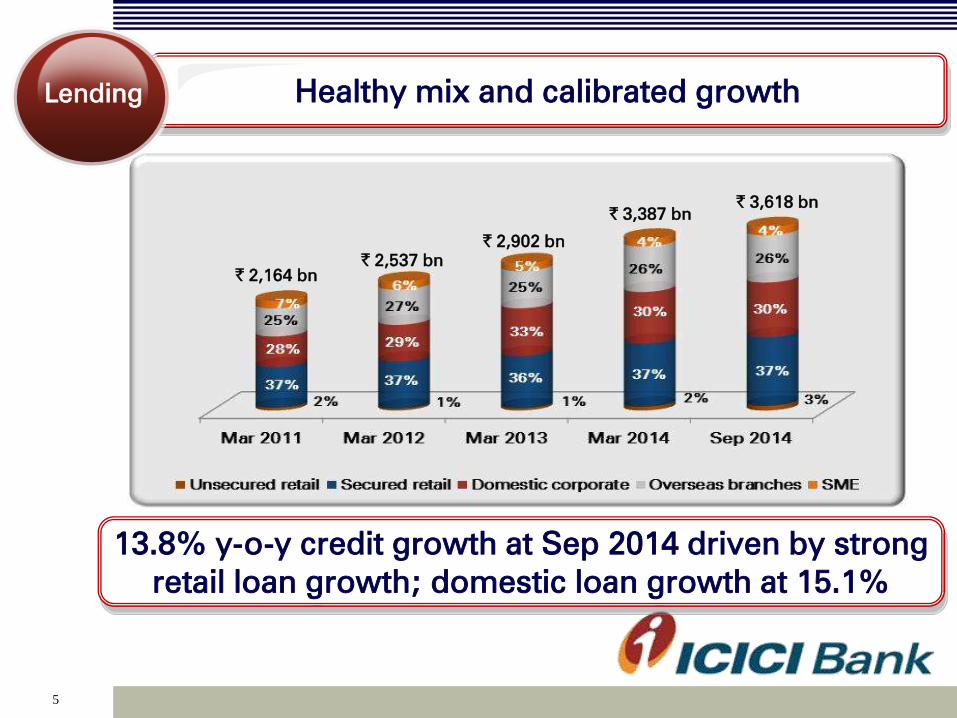
Healthy mix and calibrated growth
13.8% y-o-y credit growth at Sep 2014 driven by strong
retail loan growth; domestic loan growth at 15.1%
5
Lending
` 2,164 bn ` 2,537 bn
` 2,902 bn
` 3,387 bn ` 3,618 bn

Along with healthy growth in rural loans
Secured lending driving 20%+ portfolio growth
6
Retail
lending
Sep 2013 Sep 2014
Home loans
Auto loans
Sep 2013 Sep 2014
Business banking
Sep 2013 Sep 2014
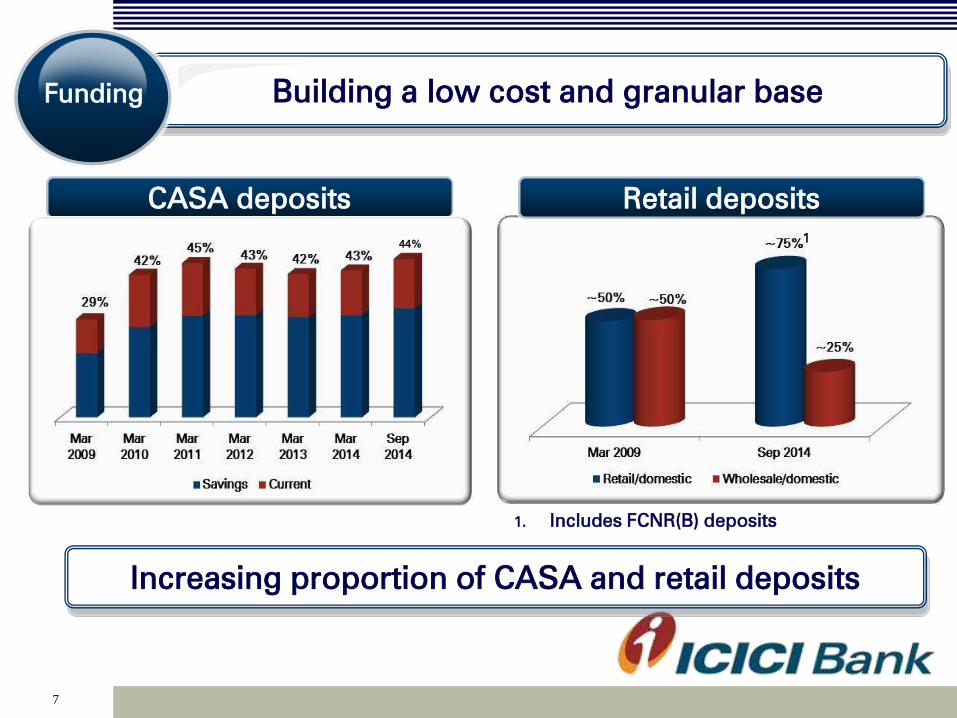
Building a low cost and granular base Funding
Increasing proportion of CASA and retail deposits
7
CASA deposits Retail deposits
1
1. Includes FCNR(B) deposits
44%

8
Growth driven by retail deposit franchise Funding
Sep 2013 Sep 2014
CASA deposits
Retail deposits
Sep 2013 Sep 2014
Driven by continued investments in physical and
technological infrastructure
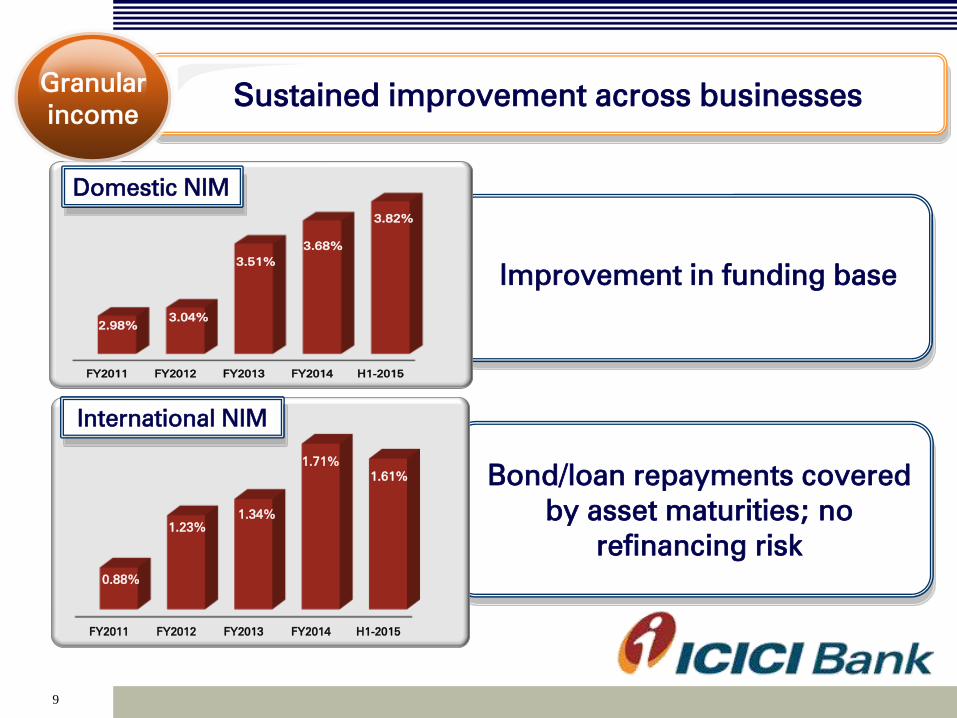
Bond/loan repayments covered
by asset maturities; no
refinancing risk
FY2011 FY2012 FY2013 FY2014 H1-2015
0.88%
1.23%
1.34%
1.71%
1.61%
Improvement in funding base
FY2011 FY2012 FY2013 FY2014 H1-2015
2.98%
3.04%
3.51%
3.68%
3.82%
9
Sustained improvement across businesses Granular
income
Domestic NIM
International NIM

Driven by profit and
margin focus across
domestic and international
businesses
FY2011 FY2012 FY2013 FY2014 H1-2015
2.64%
2.73%
3.11%
3.33%
3.41%
10
Substantial increase in NIMs Granular
income
~77 bps improvement in overall NIM since FY2011
Overall NIM
11
Granular
income
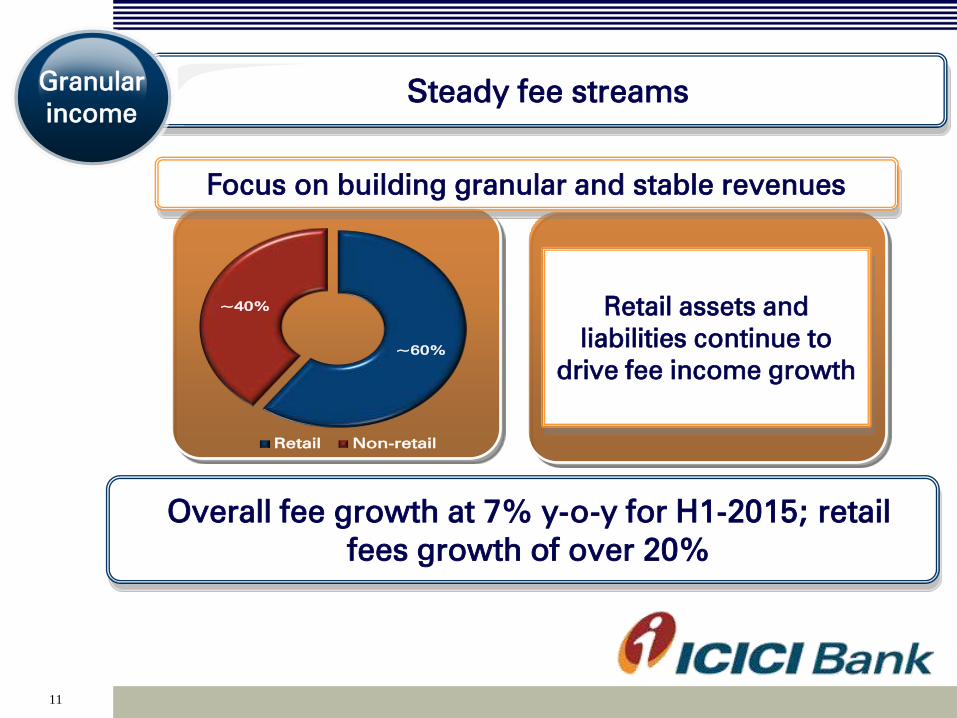
Steady fee streams Granular
income
Overall fee growth at 7% y-o-y for H1-2015; retail
fees growth of over 20%
Focus on building granular and stable revenues
Retail assets and
liabilities continue to
drive fee income growth
~60%
~40%
Retail Non-retail

Diversified financial services
franchise yielding high returns
12
Strong dividend income Granular
income
FY2010 FY2014 FY2013
Contributing to increase in non-interest income
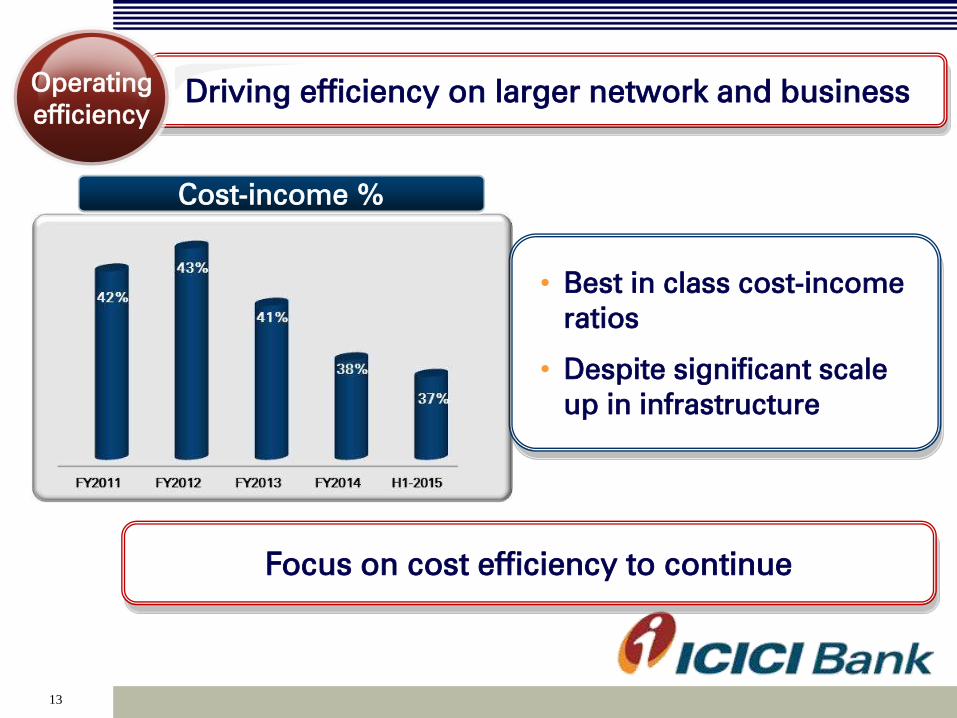
• Best in class cost-income
ratios
• Despite significant scale
up in infrastructure
13
Driving efficiency on larger network and business Operating
efficiency
Focus on cost efficiency to continue
Cost-income %

14
Asset quality impacted by operating environment Asset
quality
Net NPA ratio
• Net restructured loans at
` 110.20 billion at
September 30, 2014
• Provisions to average
loans at 91 bps in H1-
2015
Asset quality reflecting impact of slowdown in economy on SME
& corporate loans
Healthy growth in operating profits giving the ability to absorb
impact of higher credit costs

About 80 bps improvement
over FY2009
15
Consistent delivery against stated objectives Return
profile
Standalone RoA
1.66%
FY2013
1.76%
FY2014
1. annualised
1.82%
H1-20151
<1.0%
FY2009
16
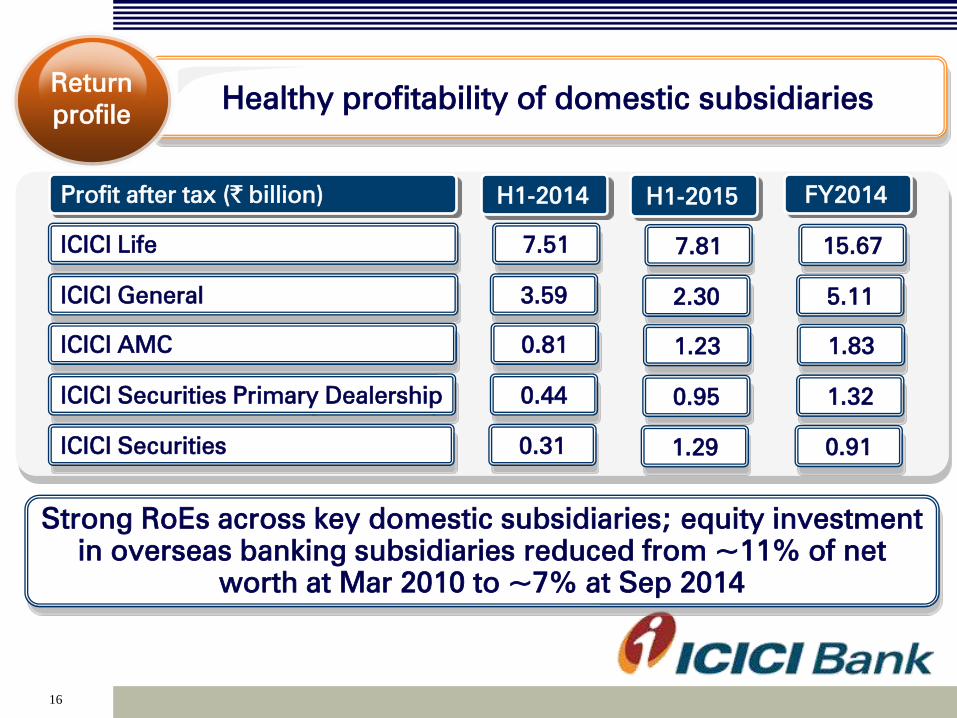
Healthy profitability of domestic subsidiaries Return
profile
15.67 ICICI Life
H1-2014
7.51
H1-2015
7.81
FY2014 Profit after tax (` billion)
5.11 ICICI General
3.59 2.30
1.83 ICICI AMC
0.81 1.23
1.32 ICICI Securities Primary Dealership
0.44 0.95
0.91 ICICI Securities
0.31 1.29
Strong RoEs across key domestic subsidiaries; equity investment
in overseas banking subsidiaries reduced from ~11% of net
worth at Mar 2010 to ~7% at Sep 2014

Near doubling of
consolidated RoE since
FY2009
17
Sustained consolidated returns Return
profile
Consolidated RoE
<8.0%
FY2009
14.7%
FY2013 14.9%
FY2014
1. annualised
14.9%
H1-20151

18
Agenda
Performance highlights
Strategy & outlook
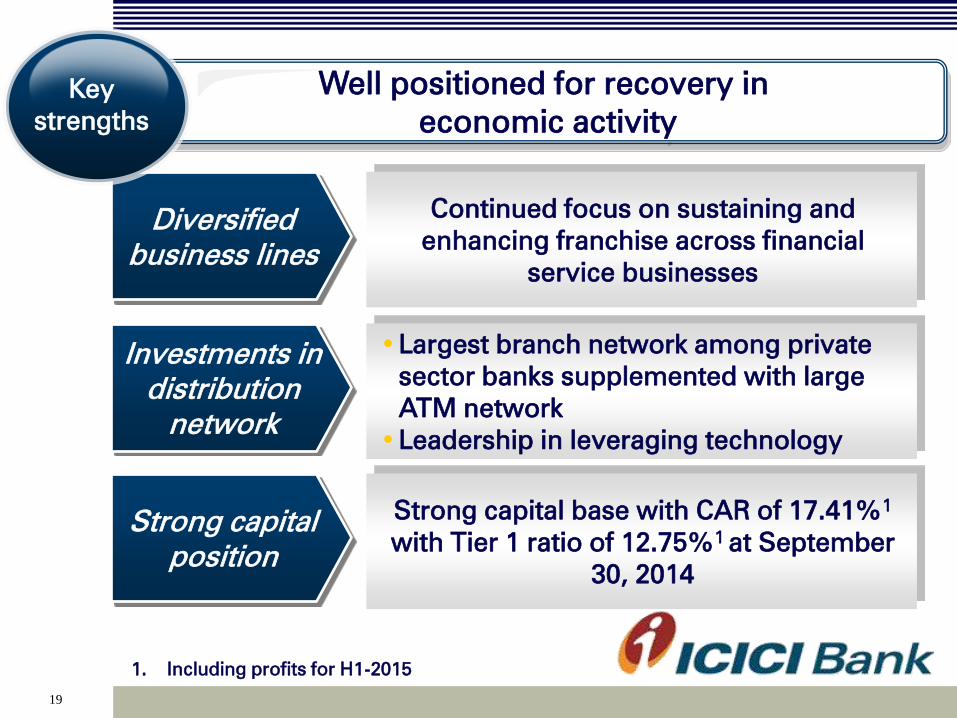
19
Investments in
distribution
network
•Largest branch network among private
sector banks supplemented with large
ATM network
•Leadership in leveraging technology
Strong capital
position
Strong capital base with CAR of 17.41%1
with Tier 1 ratio of 12.75%1 at September
30, 2014
Diversified
business lines
Continued focus on sustaining and
enhancing franchise across financial
service businesses
Well positioned for recovery in
economic activity
Key
strengths
1. Including profits for H1-2015
20
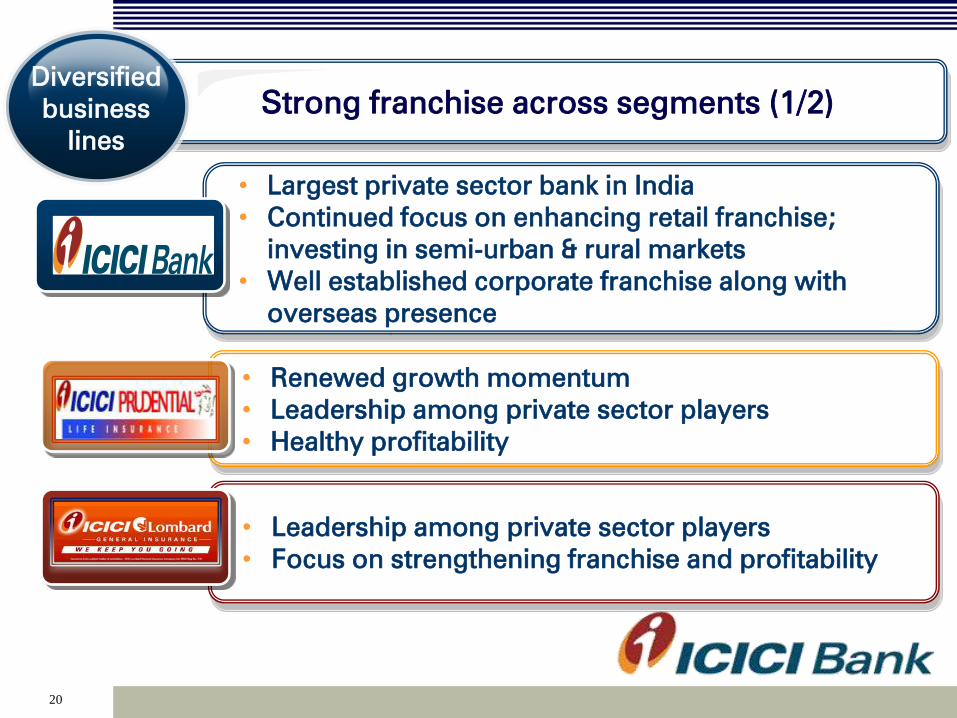
Strong franchise across segments (1/2)
Diversified
business
lines
• Leadership among private sector players
• Focus on strengthening franchise and profitability
• Renewed growth momentum
• Leadership among private sector players
• Healthy profitability
• Largest private sector bank in India
• Continued focus on enhancing retail franchise;
investing in semi-urban & rural markets
• Well established corporate franchise along with
overseas presence

21
• Increase in market share in broking
• Improvement in market conditions favourable for
business outlook
• Improved market position to second largest mutual
fund in India in terms of overall AUM
• Strong fund performance
Strong franchise across segments (2/2)
Diversified
business
lines

22
Significant scale up in branch & ATM network
•Network of 3,815 at Sep 2014;
largest in private sector banks
• Supplemented by ~11,700
ATMs
•Largest rural branch network
among private sector banks
• ~75% of branch additions
since March 2012 in rural and
semi-urban areas
Branch network
Investments in
distribution
-
500
1,000
1,500
2,000
2,500
3,000
3,500
4,000
Mar-10 Mar-11 Mar-12 Mar-13 Mar-14 Sep-14
Metro Urban Semi Urban Rural
1,707
2,529
2,752
3,100
3,753 3,815
Supported by continued leadership
in technology platforms
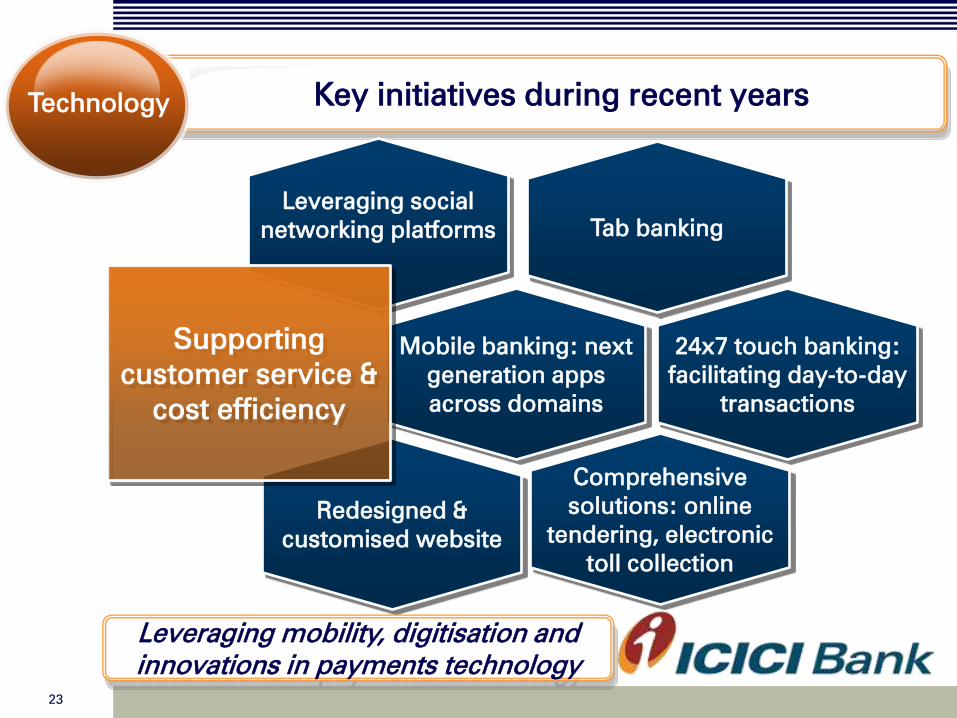
Key initiatives during recent years
23
Technology
Tab banking
Mobile banking: next
generation apps
across domains
24x7 touch banking:
facilitating day-to-day
transactions
Comprehensive
solutions: online
tendering, electronic
toll collection
Leveraging social
networking platforms
Redesigned &
customised website
Supporting
customer service &
cost efficiency
Leveraging mobility, digitisation and
innovations in payments technology
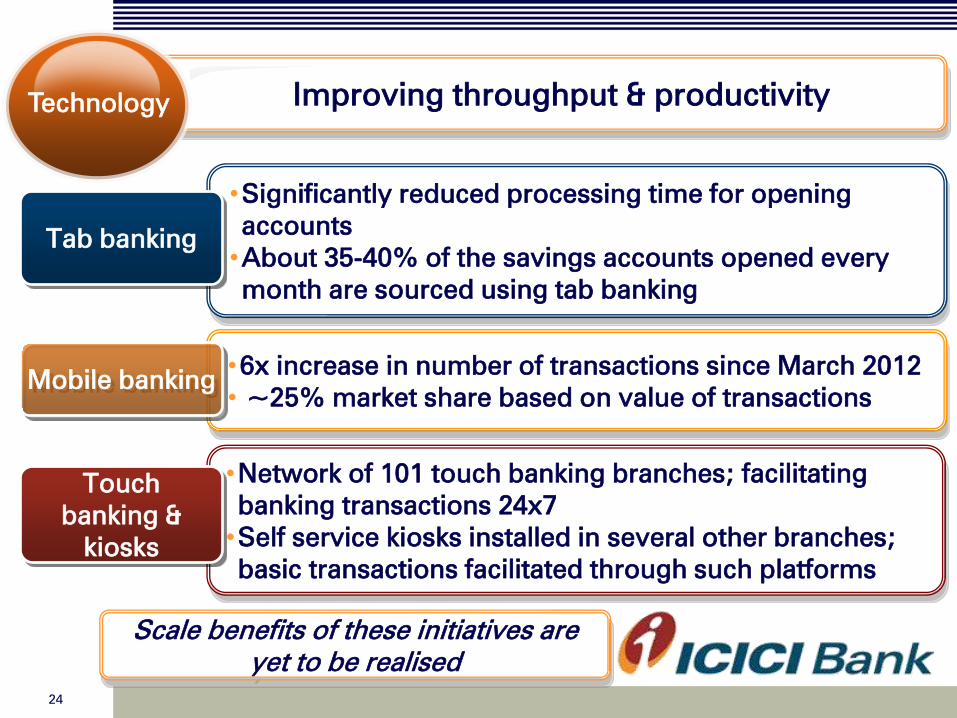
Improving throughput & productivity
24
Technology
•Network of 101 touch banking branches; facilitating
banking transactions 24x7
•Self service kiosks installed in several other branches;
basic transactions facilitated through such platforms
•6x increase in number of transactions since March 2012
• ~25% market share based on value of transactions
Mobile banking
Touch
banking &
kiosks
•Significantly reduced processing time for opening
accounts
•About 35-40% of the savings accounts opened every
month are sourced using tab banking
Tab banking
Scale benefits of these initiatives are
yet to be realised
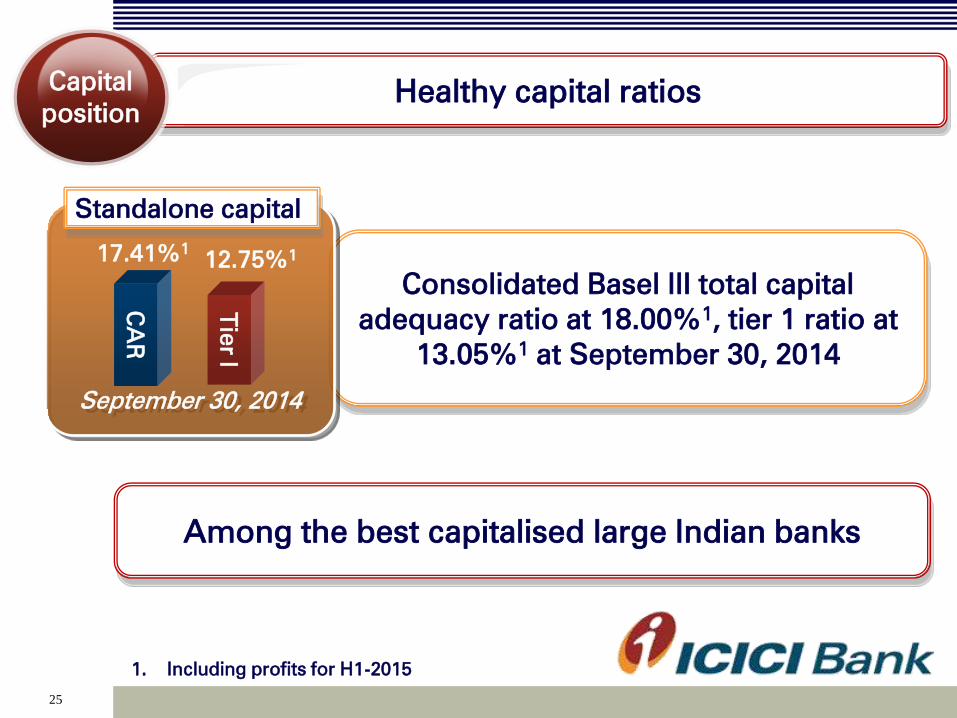
Consolidated Basel III total capital
adequacy ratio at 18.00%1, tier 1 ratio at
13.05%1 at September 30, 2014
25
Healthy capital ratios Capital
position
Among the best capitalised large Indian banks
September 30, 2014
Tier I
CA
R
17.41%1
12.75%1
Standalone capital
1. Including profits for H1-2015
26
Key priorities going forward
27
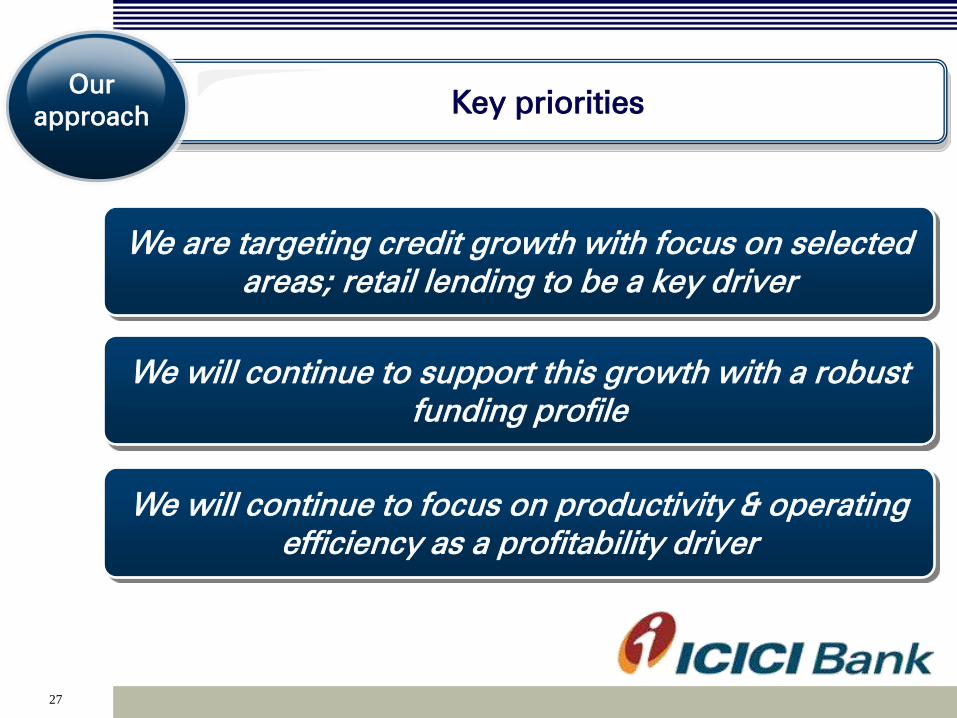
Key priorities Our
approach
We are targeting credit growth with focus on selected
areas; retail lending to be a key driver
We will continue to support this growth with a robust
funding profile
We will continue to focus on productivity & operating
efficiency as a profitability driver
28
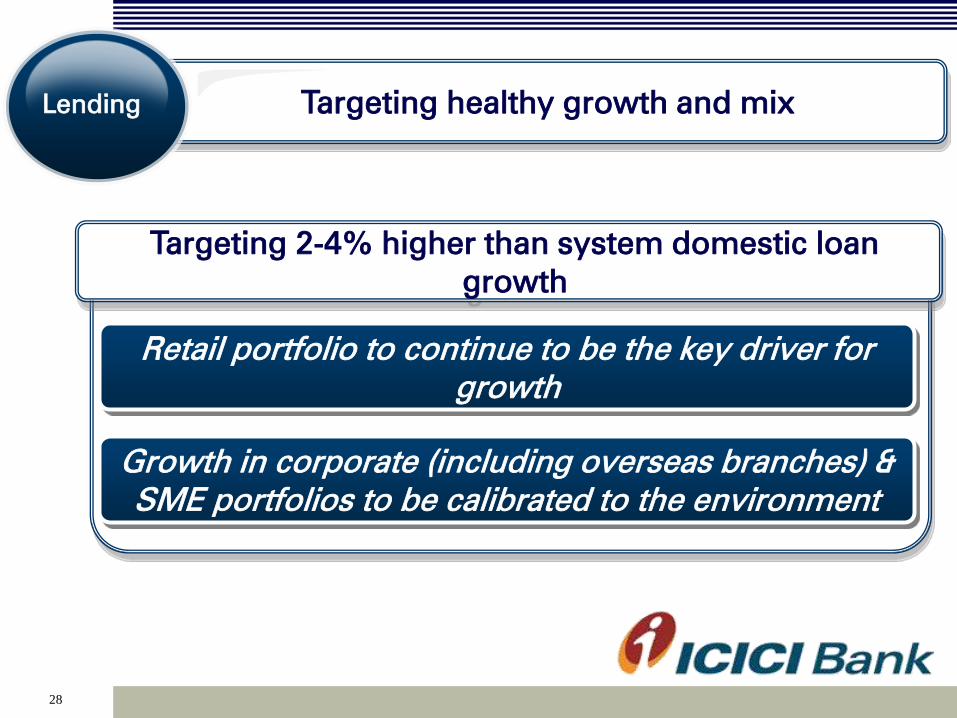
Targeting healthy growth and mix Lending
Retail portfolio to continue to be the key driver for
growth
Growth in corporate (including overseas branches) &
SME portfolios to be calibrated to the environment
Targeting 2-4% higher than system domestic loan
growth

29
• Sustaining momentum in disbursements Home
loans
•Significant geographic expansion achieved;
focus on improving profitability
Auto
loans
•Moderate growth given economic scenario CV
•Growth off low base with close monitoring of
asset quality trends; Significant proportion of
incremental lending to existing customers
Unsecured
loans
Focus on traditional segments to continue Retail
assets

30
New growth areas Retail
assets
• Small value and well collateralised lending to small
businesses
• Closely linked to current account deposits
• Building granular and diversified portfolio while
maintaining focus on portfolio asset quality
• Leveraging increase in geographical presence and larger
distribution to increase volumes
Small business loans
Rural markets
31
Domestic
corporate &
SME loans
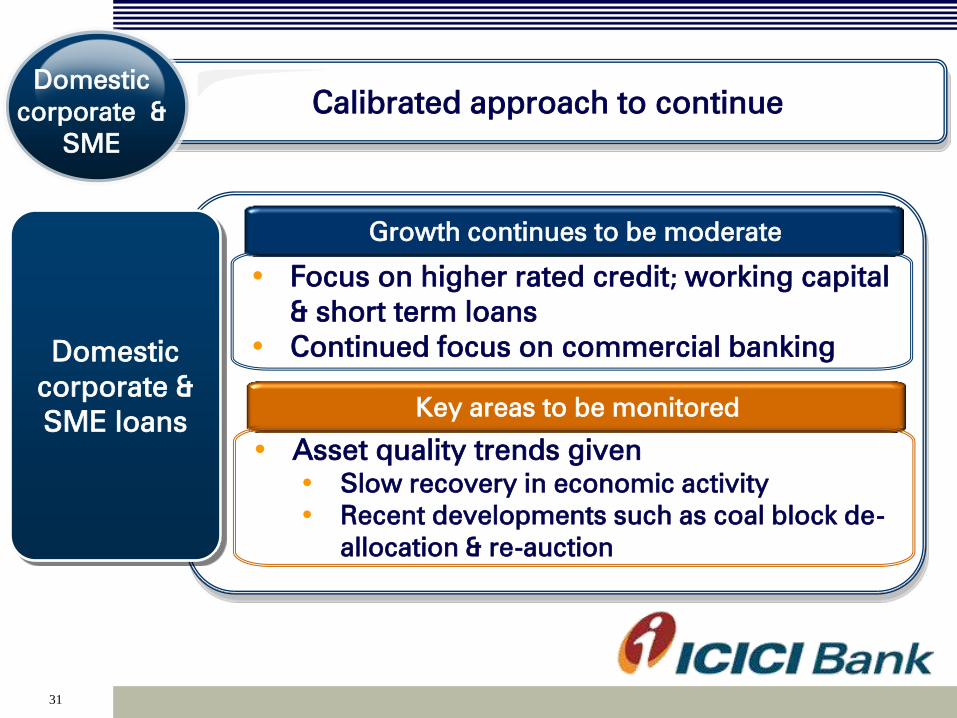
Calibrated approach to continue
Domestic
corporate &
SME
Key areas to be monitored
• Asset quality trends given
• Slow recovery in economic activity
• Recent developments such as coal block de-
allocation & re-auction
Growth continues to be moderate
• Focus on higher rated credit; working capital
& short term loans
• Continued focus on commercial banking

32
•Growth calibrated to global funding
markets & Indian corporate credit demand
•Focus on commercial banking, including
working capital facilities for Indian
companies abroad and MNCs engaged in
trade with India
Branches
Lending primarily
to Indian
corporates
•Continued focus on optimising capital
•Focus on short term loans, working
capital lines, trade & transaction banking
products to MNCs, select local market
corporates & Indian companies abroad
Subsidiaries
•Regulatory
expectations
impacting
business model
•High capital levels
Focus on profitability and returns International
business
33
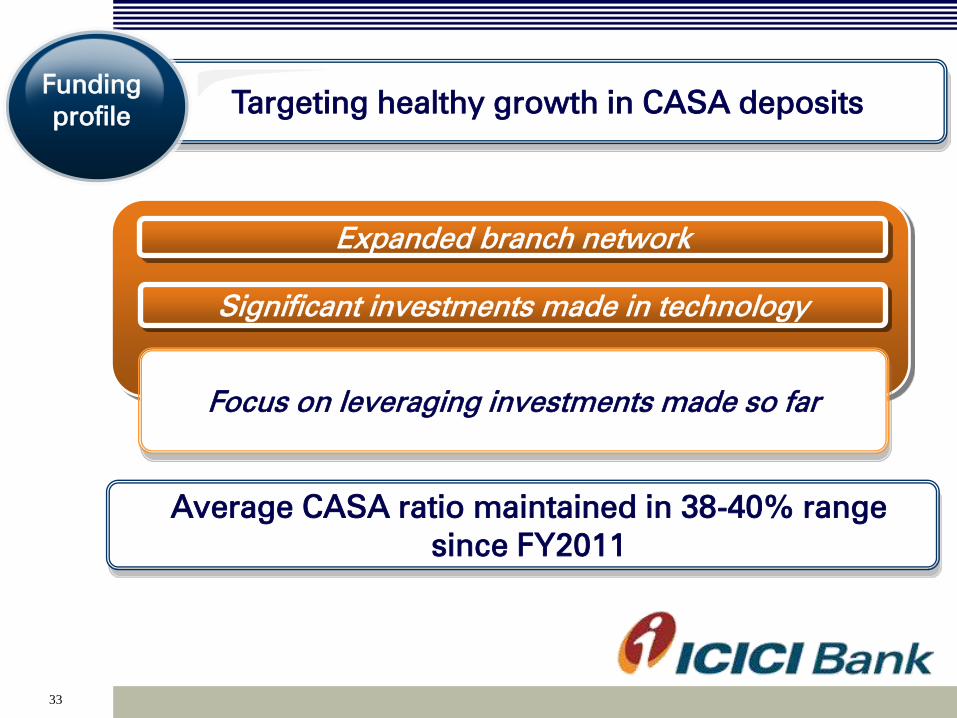
Targeting healthy growth in CASA deposits Funding
profile
Focus on leveraging investments made so far
Expanded branch network
Significant investments made in technology
Average CASA ratio maintained in 38-40% range
since FY2011

34
Sustained focus on strengthening franchise In
summary
2009 onwards
Driving
structural
improvements
Outlook going forward
Achieved
significant
improvement in
balance sheet &
operating
parameters Well-positioned
for economic
recovery
Focus on
profitable credit
growth;
enhancing
franchise
2011 onwards
Scaled up retail
business; continued
investments in
distribution &
technology
Focus on sustaining
profitability metrics
& leveraging growth
opportunities
35
Thank you
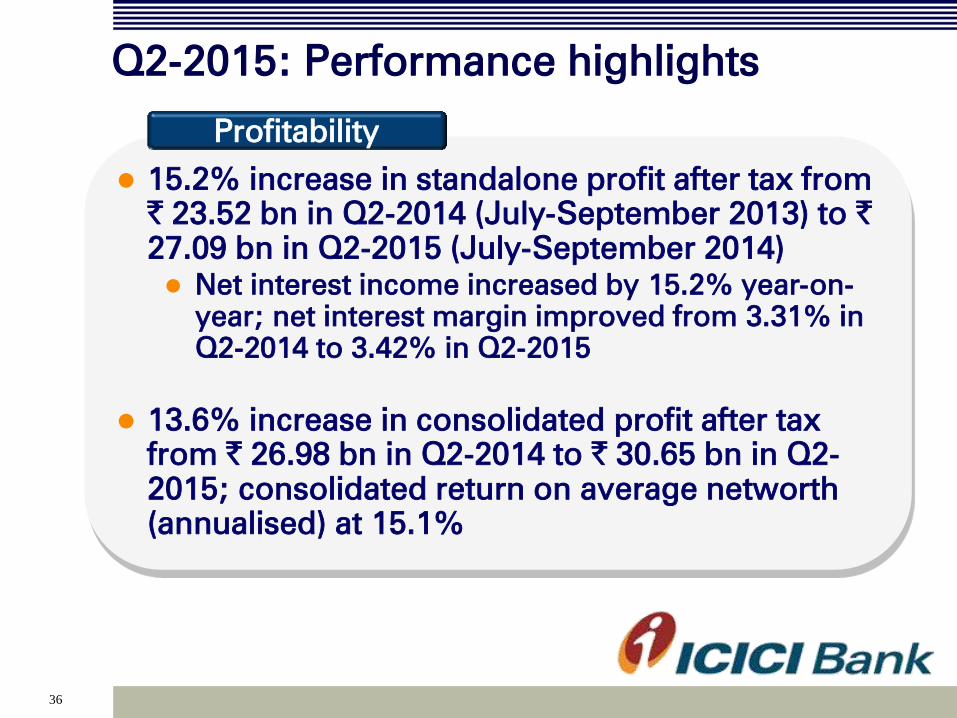
Q2-2015: Performance highlights
36
15.2% increase in standalone profit after tax from
` 23.52 bn in Q2-2014 (July-September 2013) to `
27.09 bn in Q2-2015 (July-September 2014)
Net interest income increased by 15.2% year-on-
year; net interest margin improved from 3.31% in
Q2-2014 to 3.42% in Q2-2015
13.6% increase in consolidated profit after tax
from ` 26.98 bn in Q2-2014 to ` 30.65 bn in Q2-
2015; consolidated return on average networth
(annualised) at 15.1%
Profitability

37
Advances increased by 13.8% year-on-year to `
3,617.57 billion at September 30, 2014
Retail advances growth at 25.2% year-on-year at
September 30, 2014
Period end CASA ratio at 43.7% at September
30, 2014 compared to 43.3% at September 30,
2013 and 43.0% at June 30, 2014
Average CASA ratio stable at 39.5% for Q2-2015
Net NPA ratio at 0.96% at September 30, 2014
(June 30, 2014: 0.87%; September 30, 2013:
0.73%)
Balance sheet
Q2-2015: Performance highlights

38
Standalone results
39
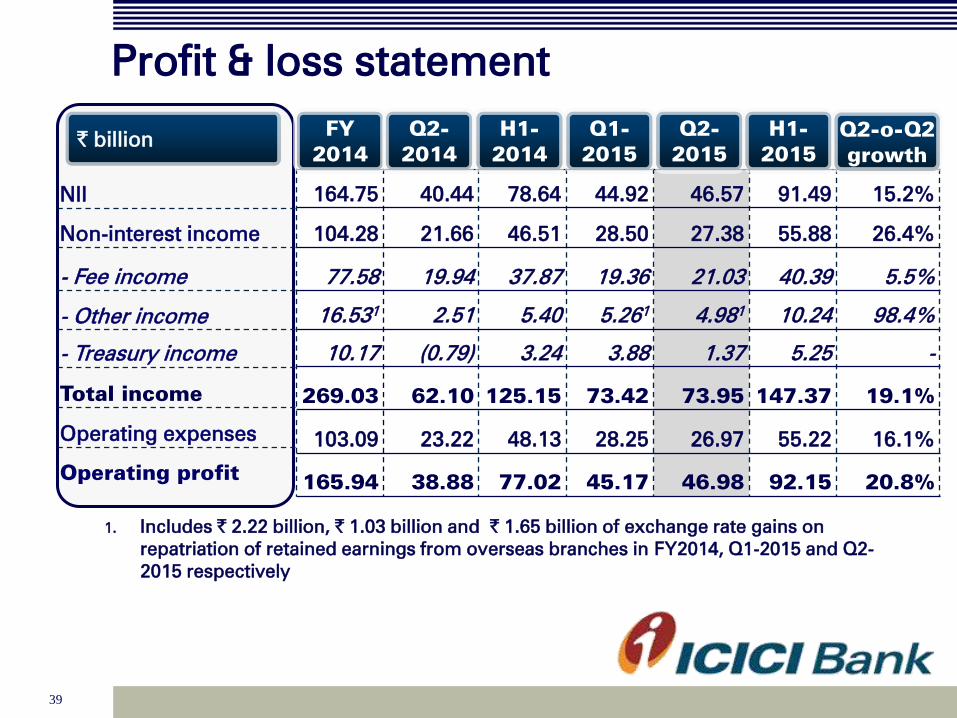
Profit & loss statement
1. Includes ` 2.22 billion, ` 1.03 billion and ` 1.65 billion of exchange rate gains on
repatriation of retained earnings from overseas branches in FY2014, Q1-2015 and Q2-
2015 respectively
NII
Non-interest income
- Fee income
- Other income
- Treasury income
Total income
Operating expenses
Operating profit
` billion
164.75 40.44 78.64 44.92 46.57 91.49 15.2%
104.28 21.66 46.51 28.50 27.38 55.88 26.4%
77.58 19.94 37.87 19.36 21.03 40.39 5.5%
16.531
2.51 5.40 5.261
4.981
10.24 98.4%
10.17 (0.79) 3.24 3.88 1.37 5.25 -
269.03 62.10 125.15 73.42 73.95 147.37 19.1%
103.09 23.22 48.13 28.25 26.97 55.22 16.1%
165.94 38.88 77.02 45.17 46.98 92.15 20.8%
FY
2014
Q2-
2014
H1-
2014
Q1-
2015
Q2-
2015
H1-
2015
Q2-o-Q2
growth
40
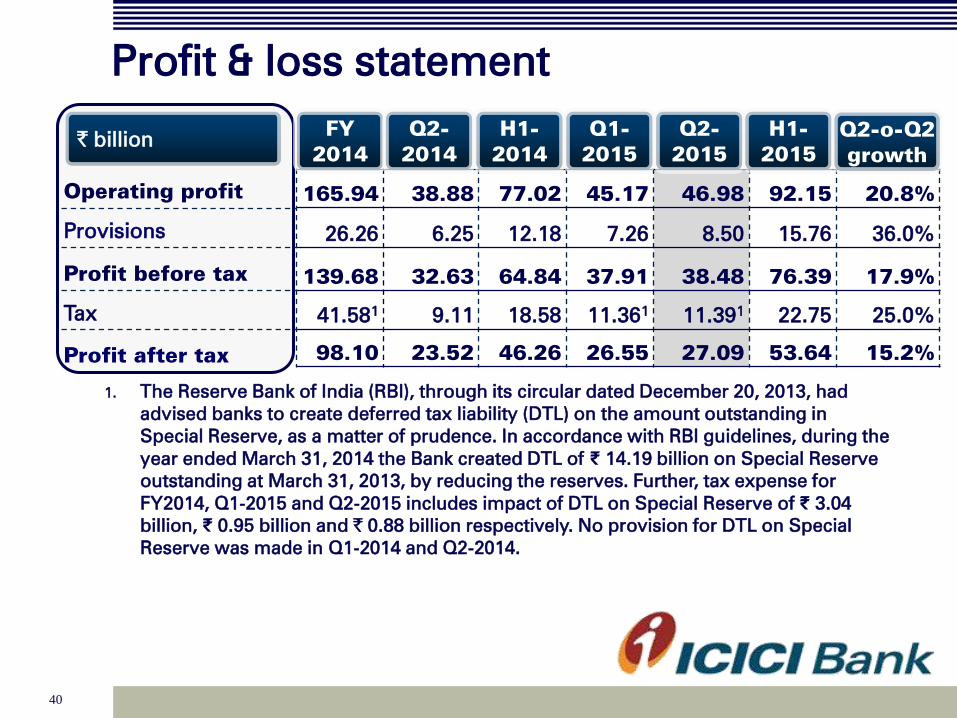
Profit & loss statement
1. The Reserve Bank of India (RBI), through its circular dated December 20, 2013, had
advised banks to create deferred tax liability (DTL) on the amount outstanding in
Special Reserve, as a matter of prudence. In accordance with RBI guidelines, during the
year ended March 31, 2014 the Bank created DTL of ₹ 14.19 billion on Special Reserve
outstanding at March 31, 2013, by reducing the reserves. Further, tax expense for
FY2014, Q1-2015 and Q2-2015 includes impact of DTL on Special Reserve of ₹ 3.04
billion, ₹ 0.95 billion and ` 0.88 billion respectively. No provision for DTL on Special
Reserve was made in Q1-2014 and Q2-2014.
Operating profit
Provisions
Profit before tax
Tax
Profit after tax
` billion
165.94 38.88 77.02 45.17 46.98 92.15 20.8%
26.26 6.25 12.18 7.26 8.50 15.76 36.0%
139.68 32.63 64.84 37.91 38.48 76.39 17.9%
41.581
9.11 18.58 11.361
11.391
22.75 25.0%
98.10 23.52 46.26 26.55 27.09 53.64 15.2%
FY
2014
Q2-
2014
H1-
2014
Q1-
2015
Q2-
2015
H1-
2015
Q2-o-Q2
growth

41
Key ratios
Yield on total interest earning
assets1
Cost of funds1
Net interest margin1
Movement in yield, costs &
margins (Percent)
Return on average networth1
Return on average assets1
Weighted average EPS1
Book value (`)
Fee to income
Cost to income
Average CASA ratio
Percent
8.92 8.86 8.89 8.90 8.93 8.92
6.21 6.13 6.22 6.19 6.16 6.18
3.33 3.31 3.29 3.40 3.42 3.41
FY
2014
Q2-
2014
H1-
2014
Q1-
2015
Q2-
2015
H1-
2015
13.7 13.0 13.2 14.3 13.9 14.1
1.76 1.70 1.72 1.82 1.82 1.82
85.0 80.8 80.0 92.2 92.9 92.6
634 633 633 657 682 682
28.9 32.1 30.3 26.4 28.4 27.4
38.2 37.3 38.4 38.4 36.5 37.5
39.4 40.3 39.6 39.5 39.5 39.5
FY
2014
Q2-
2014
H1-
2014
Q1-
2015
Q2-
2015
H1-
2015
1. Annualised for all interim periods

42
Balance sheet: Assets
Cash & bank balances
Investments
- SLR investments
- Equity investment in
subsidiaries
- RIDF and related
Advances
Fixed & other assets
Total assets
` billion
335.81 422.01 473.78 41.1%
1,688.29 1,701.53 1,735.91 2.8%
986.20 967.40 997.25 1.1%
120.23 120.23 120.23 -
229.40 241.20 240.89 5.0%
3,177.86 3,470.67 3,617.57 13.8%
433.12 289.34 284.17 (34.4)%
5,635.08 5,883.55 6,111.43 8.5%
September
30, 2013
June 30,
2014
September
30, 2014
Y-o-Y
growth
Net investment in security receipts of asset reconstruction companies
was ` 7.77 bn at September 30, 2014 (June 30, 2014: ` 9.25 bn)
1. Rural Infrastructure Development Fund
2. Including impact of exchange rate movement
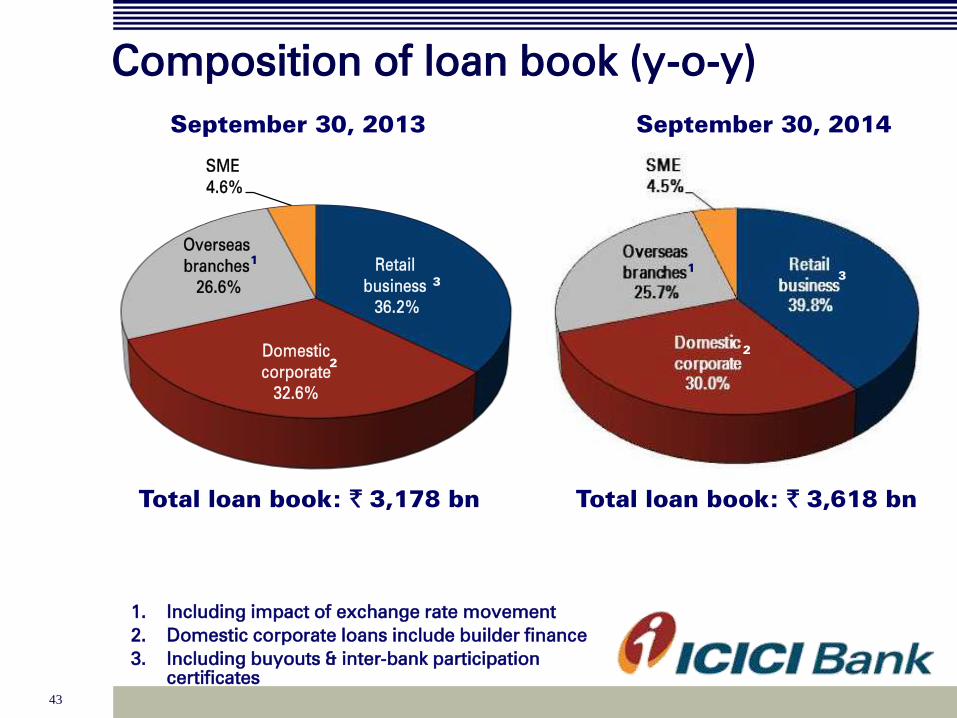
Retail
business
36.2%
Domestic
corporate
32.6%
Overseas
branches
26.6%
SME
4.6%
43
Composition of loan book (y-o-y)
September 30, 2014
Total loan book: ` 3,618 bn Total loan book: ` 3,178 bn
September 30, 2013
1. Including impact of exchange rate movement
2. Domestic corporate loans include builder finance
3. Including buyouts & inter-bank participation
certificates
1
2
3
1
2
3

44
Composition of retail loan book (y-o-y)
September 30, 2014
Total retail loan book: ` 1,441 bn Total retail loan book: ` 1,151 bn
September 30, 2013
• Total retail advances growth of 25.2%
1. September 30, 2013 :Vehicle loans includes auto
loans 10.5%, commercial business 11.7%
2. September 30, 2014: Vehicle loans includes auto
loans 11.6%, commercial business 7.7%
1 2
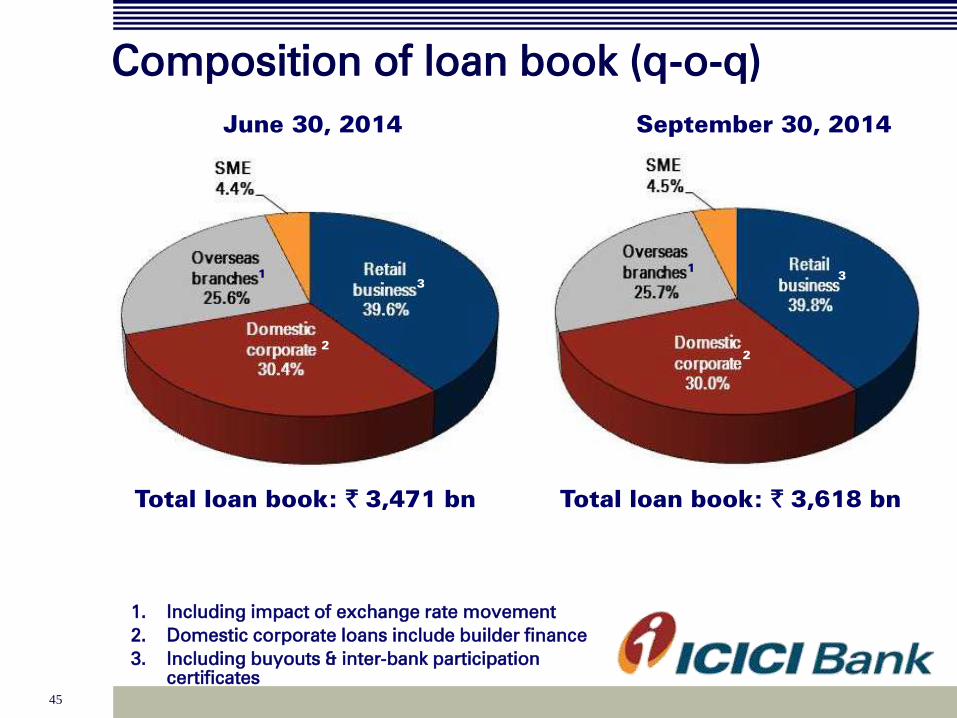
45
Composition of loan book (q-o-q)
Total loan book: ` 3,471 bn
June 30, 2014
1. Including impact of exchange rate movement
2. Domestic corporate loans include builder finance
3. Including buyouts & inter-bank participation
certificates
1
2
3
September 30, 2014
Total loan book: ` 3,618 bn
1
2
3

46
Composition of retail loan book (q-o-q)
Total retail loan book: ` 1,372 bn
June 30, 2014
1. June 30, 2014 :Vehicle loans includes auto loans
11.8%, commercial business 8.5%
2. September 30, 2014: Vehicle loans includes auto
loans 11.6%, commercial business 7.7%
1
September 30, 2014
Total retail loan book: ` 1,441 bn
2
47
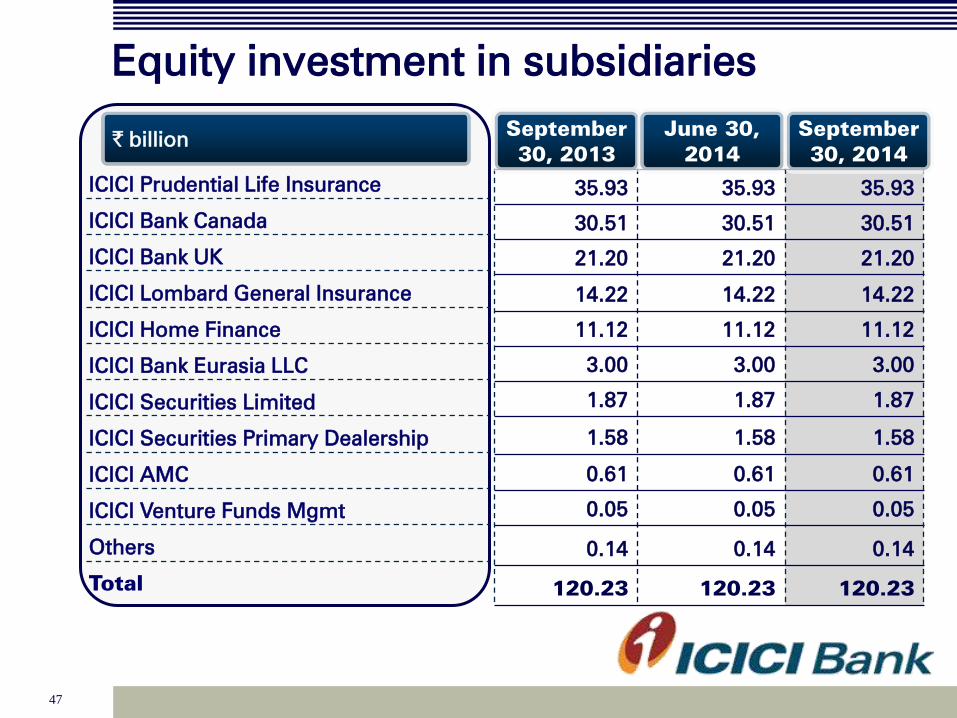
Equity investment in subsidiaries
ICICI Prudential Life Insurance
ICICI Bank Canada
ICICI Bank UK
ICICI Lombard General Insurance
ICICI Home Finance
ICICI Bank Eurasia LLC
ICICI Securities Limited
ICICI Securities Primary Dealership
ICICI AMC
ICICI Venture Funds Mgmt
Others
Total
` billion
35.93 35.93 35.93
30.51 30.51 30.51
21.20 21.20 21.20
14.22 14.22 14.22
11.12 11.12 11.12
3.00 3.00 3.00
1.87 1.87 1.87
1.58 1.58 1.58
0.61 0.61 0.61
0.05 0.05 0.05
0.14 0.14 0.14
120.23 120.23 120.23
September
30, 2013
June 30,
2014
September
30, 2014
48
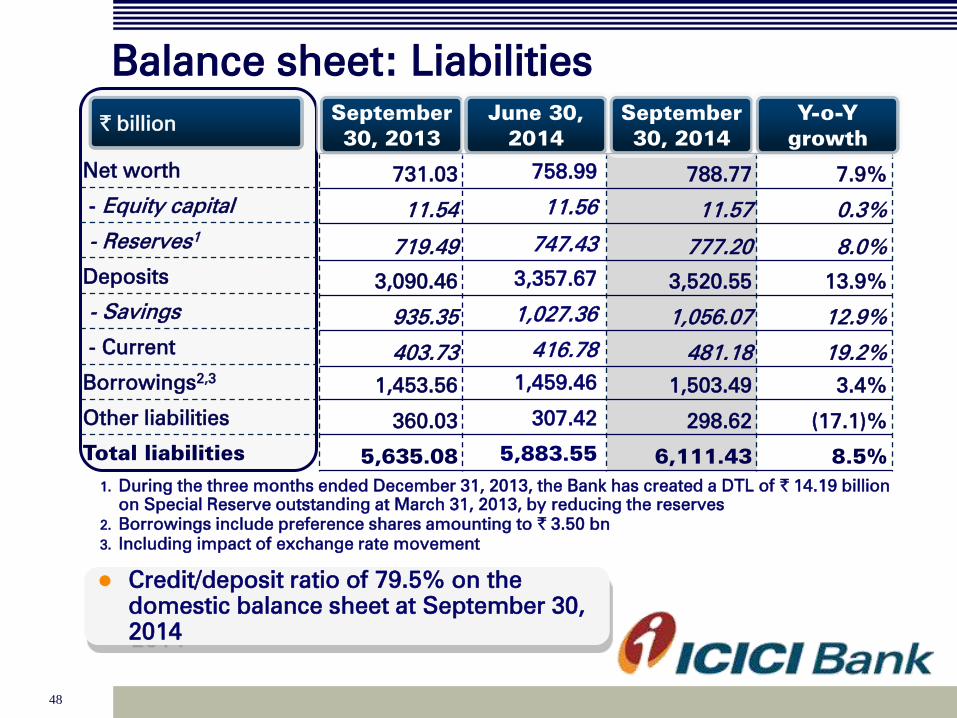
Balance sheet: Liabilities
Net worth
- Equity capital
- Reserves1
Deposits
- Savings
- Current
Borrowings2,3
Other liabilities
Total liabilities
` billion
731.03 758.99 788.77 7.9%
11.54 11.56 11.57 0.3%
719.49 747.43 777.20 8.0%
3,090.46 3,357.67 3,520.55 13.9%
935.35 1,027.36 1,056.07 12.9%
403.73 416.78 481.18 19.2%
1,453.56 1,459.46 1,503.49 3.4%
360.03 307.42 298.62 (17.1)%
5,635.08 5,883.55 6,111.43 8.5%
September
30, 2013
June 30,
2014
September
30, 2014
Y-o-Y
growth
Credit/deposit ratio of 79.5% on the
domestic balance sheet at September 30,
2014
1. During the three months ended December 31, 2013, the Bank has created a DTL of ` 14.19 billion
on Special Reserve outstanding at March 31, 2013, by reducing the reserves
2. Borrowings include preference shares amounting to ` 3.50 bn
3. Including impact of exchange rate movement

49
Composition of borrowings
Domestic
- Capital instruments1
- Other borrowings
Overseas2
- Capital instruments
- Other borrowings
Total borrowings2
` billion
697.12 621.65 632.28
387.71 385.45 386.72
309.42 236.21 245.56
756.44 837.81 871.21
21.24 20.43 20.97
735.20 817.38 850.25
1,453.56 1,459.46 1,503.49
September
30, 2013
June 30,
2014
September
30, 2014
1. Includes preference share capital ` 3.50 bn
2. Including impact of exchange rate movement
Capital instruments constitute 61.2% of domestic borrowings

50
Capital adequacy
Total Capital
- Tier I
- Tier II
Risk weighted assets
- On balance sheet
- Off balance sheet
Standalone Basel III
881.29 17.00% 885.55 16.64%
634.18 12.23% 637.59 11.98%
247.11 4.77% 247.96 4.66%
5,184.02 5,321.74
4,055.52 4,200.23
1,128.50 1,121.51
June 30, 2014 September 30, 2014
1. In line with the applicable guidelines, the Basel III capital ratios reported by the Bank for
the interim periods do not include profits for the period
2. Capital ratios at June 30, 2014 and September 30, 2014 include the impact of credit value
adjustment on derivative exposures and capital charge required for borrowers with
unhedged foreign currency exposures, in accordance with the Reserve Bank of India
guidelines Including the profits for H1-2015, the capital adequacy ratio for
the Bank as per Basel III norms would have been 17.41% and the
Tier I ratio would have been 12.75%
` bn % ` bn %

51
Asset quality and provisioning
Gross retail NPLs at ` 35.91 bn and net retail NPLs at ` 8.90 bn at
September 30, 2014 compared to ` 49.08 bn and ` 7.62 bn
respectively at September 30, 2013
Provisioning coverage ratio of 65.9% at September 30, 2014
computed in accordance with RBI guidelines
Net loans to companies whose facilities have been restructured
at ` 110.20 bn at September 30, 2014 compared to ` 112.65 bn at
June 30, 2014 and ` 68.26 bn at September 30, 2013
Outstanding general provision on standard assets: ` 21.30 bn at
September 30, 2014
Gross NPAs
Less: Cumulative provisions
Net NPAs
Net NPA ratio
` billion
100.78 110.01 116.95
73.71 75.27 76.99
27.07 34.74 39.97
0.73% 0.87% 0.96%
September
30, 2013
June 30,
2014
September
30, 2014
52
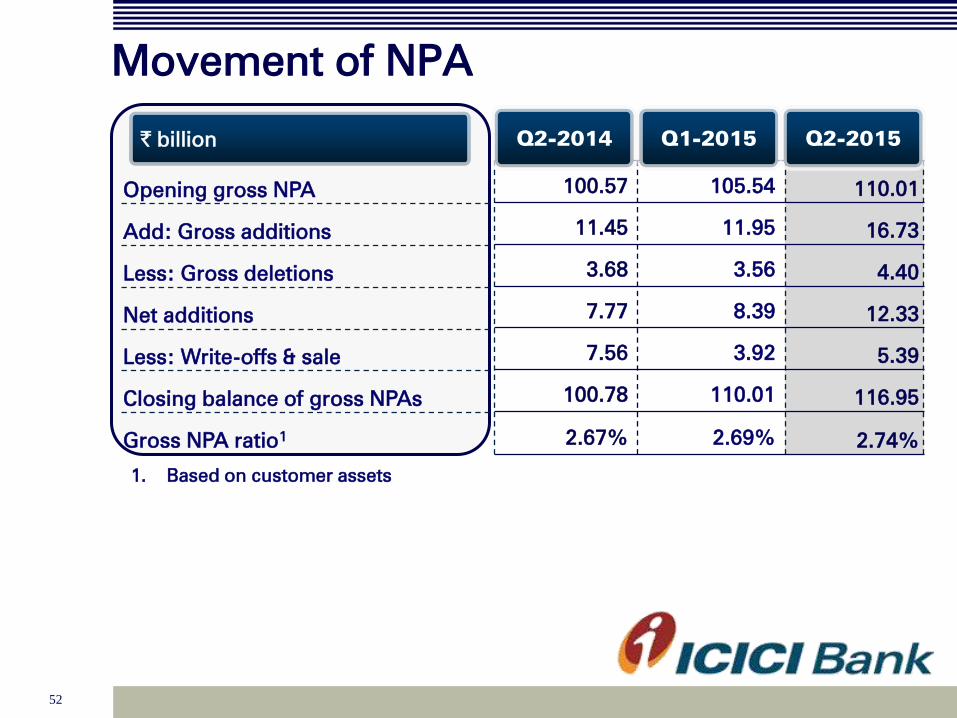
Movement of NPA
Opening gross NPA
Add: Gross additions
Less: Gross deletions
Net additions
Less: Write-offs & sale
Closing balance of gross NPAs
Gross NPA ratio1
` billion
100.57 105.54 110.01
11.45 11.95 16.73
3.68 3.56 4.40
7.77 8.39 12.33
7.56 3.92 5.39
100.78 110.01 116.95
2.67% 2.69% 2.74%
Q2-2014 Q1-2015 Q2-2015
1. Based on customer assets

53
Distribution network
Metro
Urban
Semi urban
Rural
Total branches
Branches
816 865 935 948 24.8%
720 782 865 887 23.3%
904 989 1,114 1,127 29.5%
312 464 839 853 22.4%
2,752 3,100 3,753 3,815 100.0%
9,006 10,481 11,315 11,739 -
At
March
31, 2012
At
March
31, 2013
At Sep
30, 2014
ATMs
Total ATMs
At
March
31, 2014
% of mix
at Sep
30, 2014
54
Consolidated results
55
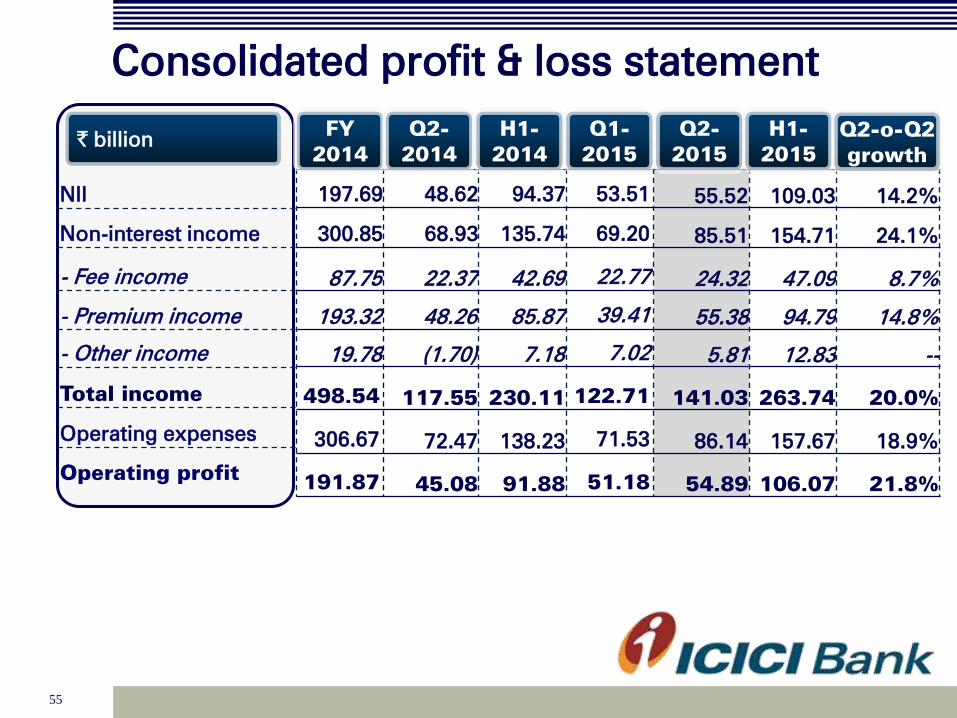
Consolidated profit & loss statement
NII
Non-interest income
- Fee income
- Premium income
- Other income
Total income
Operating expenses
Operating profit
` billion
197.69 48.62 94.37 53.51 55.52 109.03 14.2%
300.85 68.93 135.74 69.20 85.51 154.71 24.1%
87.75 22.37 42.69 22.77 24.32 47.09 8.7%
193.32 48.26 85.87 39.41 55.38 94.79 14.8%
19.78 (1.70) 7.18 7.02 5.81 12.83 --
498.54 117.55 230.11 122.71 141.03 263.74 20.0%
306.67 72.47 138.23 71.53 86.14 157.67 18.9%
191.87 45.08 91.88 51.18 54.89 106.07 21.8%
FY
2014
Q2-
2014
H1-
2014
Q1-
2015
Q2-
2015
H1-
2015
Q2-o-Q2
growth

56
Consolidated profit & loss statement
Operating profit
Provisions
Profit before tax
Tax
Minority interest
Profit after tax
` billion
191.87 45.08 91.88 51.18 54.89 106.07 21.8%
29.00 6.73 13.30 8.14 9.16 17.30 36.1%
162.87 38.35 78.58 43.04 45.73 88.77 19.2%
46.10 9.73 20.81 13.22 13.32 26.54 36.9%
6.36 1.64 3.32 1.50 1.76 3.26 7.3%
110.41 26.98 54.45 28.32 30.65 58.97 13.6%
FY
2014
Q2-
2014
H1-
2014
Q1-
2015
Q2-
2015
H1-
2015
Q2-o-Q2
growth

57
Consolidated balance sheet
Cash & bank balances
Investments
Advances
Fixed & other assets
Total assets
` billion
430.38 506.43 542.00 25.9%
2,560.41 2,668.17 2,769.01 8.1%
3,636.31 3,960.23 4,109.81 13.0%
501.51 356.95 363.53 (27.5)%
7,128.61 7,491.78 7,784.35 9.2%
759.64 794.52 827.56 8.9%
18.85 22.20 22.35 18.6%
3,378.84 3,639.17 3,790.15 12.2%
1,768.69 1,763.91 1,833.83 3.7%
684.63 801.98 846.83 23.7%
517.96 470.00 463.63 (10.5)%
7,128.61 7,491.78 7,784.35 9.2%
September
30, 2013
June 30,
2014
Y-o-Y
growth
September
30, 2014
Net worth
Minority interest
Deposits
Borrowings
Liabilities on policies in
force
Other liabilities
Total liabilities

58
Key ratios (consolidated)
Return on average networth1,2
(consolidated)
Weighted average EPS (`)1
Book value (`)
Percent
14.9 14.6 15.1 14.6 15.1 14.9
95.7 92.7 94.1 98.3 105.1 101.7
660 657 657 686 714 714
FY
2014
Q2-
2014
H1-
2014
Q1-
2015
Q2-
2015
H1-
2015
1. Based on quarterly average networth
2. Annualised for all interim periods
Total Capital
- Tier I
- Tier II
Consolidated Basel III (Percent)
17.57% 17.22%
12.52% 12.27%
5.05% 4.95%
June 30, 20141
September 30, 20141
1. In line with the applicable guidelines, the Basel III
capital ratios reported by the Bank for the interim
periods do not include profits for the period
Including the profits for H1-2015, the capital adequacy ratio on the
consolidated basis as per Basel III norms would have been 18.00% and
the Tier I ratio would have been 13.05%

59
Overseas subsidiaries

60
ICICI Bank UK asset profile
September 30, 2014
Total assets: USD 4.2 bn Total assets: USD 4.1 bn
June 30, 2014
1. Includes cash & advances to banks, T Bills
2. Includes securities re-classified to loans & advances
1
2
2
1
61
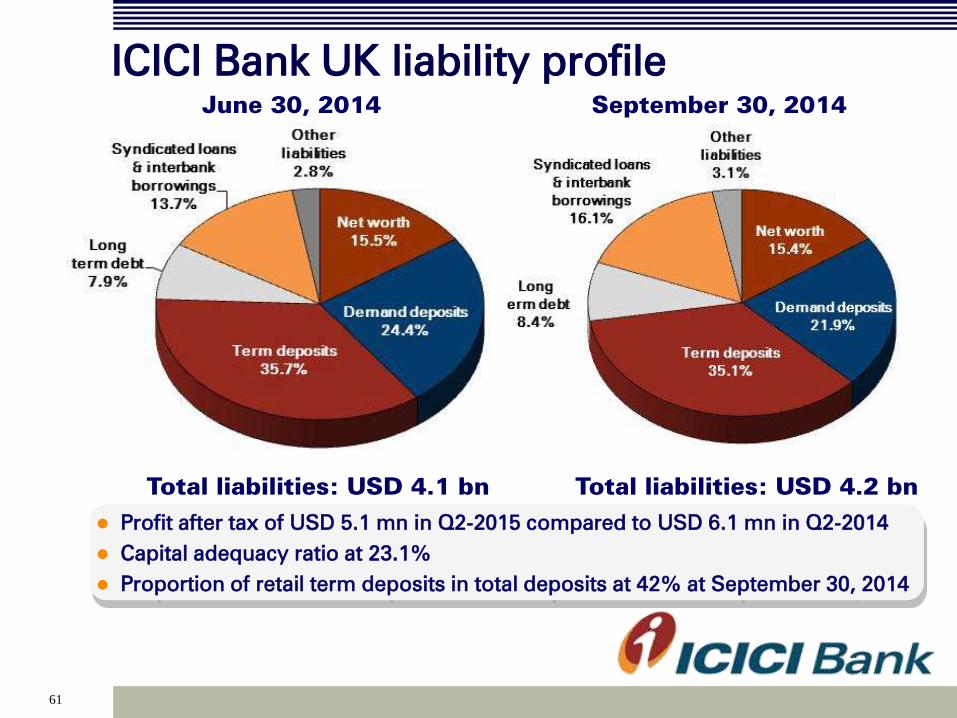
ICICI Bank UK liability profile
September 30, 2014
Total liabilities: USD 4.2 bn Total liabilities: USD 4.1 bn
June 30, 2014
Profit after tax of USD 5.1 mn in Q2-2015 compared to USD 6.1 mn in Q2-2014
Capital adequacy ratio at 23.1%
Proportion of retail term deposits in total deposits at 42% at September 30, 2014

62
ICICI Bank Canada asset profile
September 30, 2014
Total assets: CAD 5.5 bn Total assets: CAD 5.6 bn
June 30, 2014
1. Includes cash & advances to banks and government securities
2. Based on IFRS, securitised portfolio of CAD 2,035 mn and CAD 2,051 mn considered as
part of Insured mortgage portfolio at June 30, 2014 and September 30, 2014 respectively
1
2 2
1

63
ICICI Bank Canada liability profile
September 30, 2014
Total liabilities: CAD 5.5 bn Total liabilities: CAD 5.6 bn
June 30, 2014
Profit after tax of CAD 9.2 mn in Q2-2015 compared to CAD 12.9 mn in Q2-2014
Capital adequacy ratio at 34.0%
1. As per IFRS, proceeds of CAD 2,039 mn and CAD
2,069 mn from sale of securitised portfolio
considered as part of borrowings at June 30,
2014 and September 30, 2014 respectively
1 1

64
ICICI Bank Eurasia asset profile
September 30, 2014
Total assets: USD 114 mn Total assets: USD 127 mn
June 30, 2014
Total borrowings of USD 40 mn at September 30, 2014
Capital adequacy of 47.4% at September 30, 2014
Net profit of USD 0.7 mn in Q2-2015 compared to USD 1.1 mn in Q2-2014
1. Includes cash & call placements with banks,
balances with central bank, government
securities and nostro balances
1 1
65
Domestic subsidiaries
66
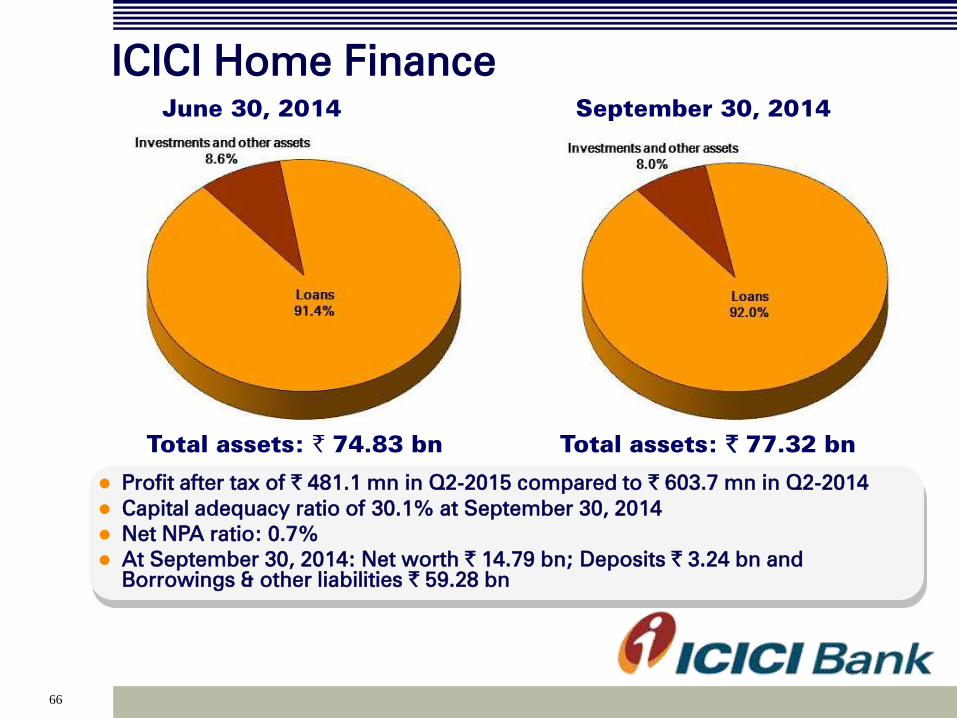
ICICI Home Finance
September 30, 2014
Total assets: ` 77.32 bn Total assets: ` 74.83 bn
June 30, 2014
Profit after tax of ` 481.1 mn in Q2-2015 compared to ` 603.7 mn in Q2-2014
Capital adequacy ratio of 30.1% at September 30, 2014
Net NPA ratio: 0.7%
At September 30, 2014: Net worth ` 14.79 bn; Deposits ` 3.24 bn and
Borrowings & other liabilities ` 59.28 bn
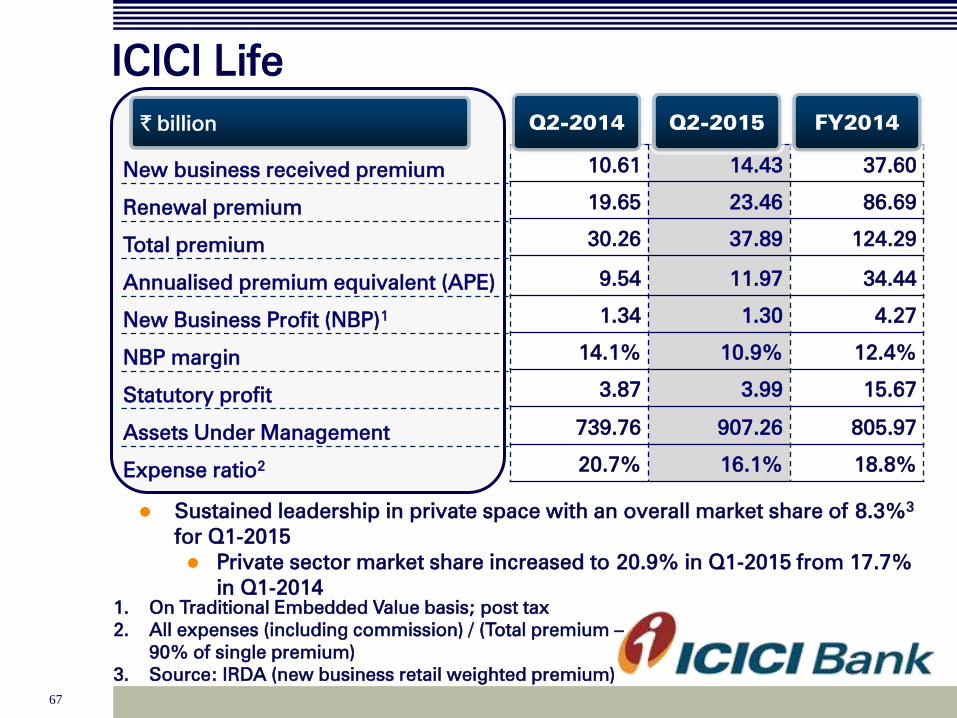
67
ICICI Life
New business received premium
Renewal premium
Total premium
Annualised premium equivalent (APE)
New Business Profit (NBP)1
NBP margin
Statutory profit
Assets Under Management
Expense ratio2
` billion
10.61 14.43 37.60
19.65 23.46 86.69
30.26 37.89 124.29
9.54 11.97 34.44
1.34 1.30 4.27
14.1% 10.9% 12.4%
3.87 3.99 15.67
739.76 907.26 805.97
20.7% 16.1% 18.8%
Q2-2014 Q2-2015 FY2014
Sustained leadership in private space with an overall market share of 8.3%3
for Q1-2015
Private sector market share increased to 20.9% in Q1-2015 from 17.7%
in Q1-2014
1. On Traditional Embedded Value basis; post tax
2. All expenses (including commission) / (Total premium –
90% of single premium)
3. Source: IRDA (new business retail weighted premium)
68
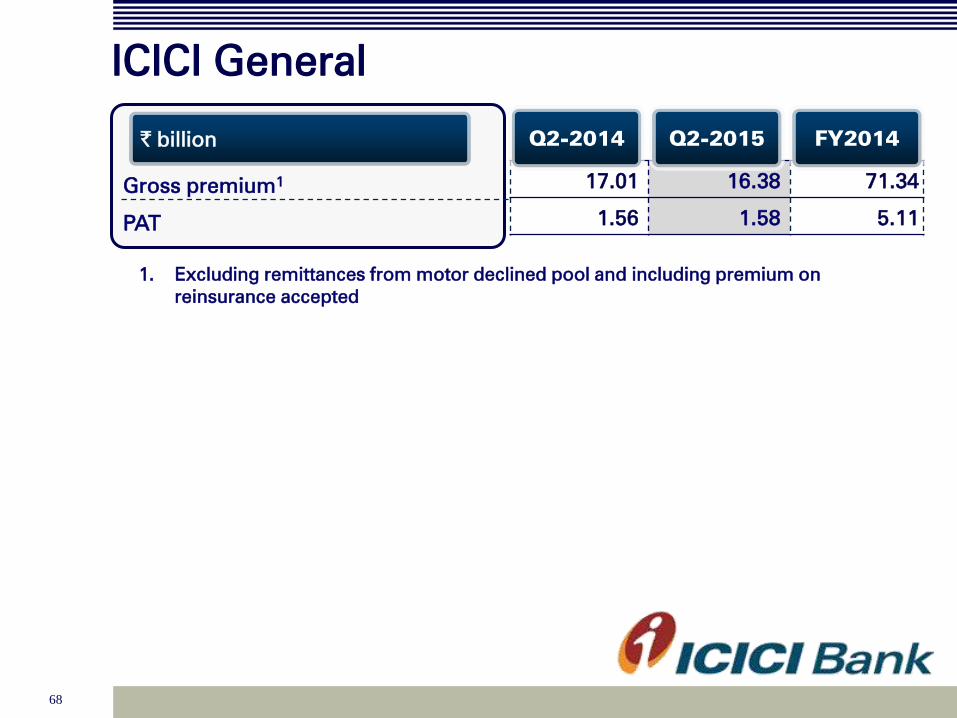
ICICI General
Gross premium1
PAT
` billion
17.01 16.38 71.34
1.56 1.58 5.11
Q2-2014 Q2-2015 FY2014
1. Excluding remittances from motor declined pool and including premium on
reinsurance accepted
69
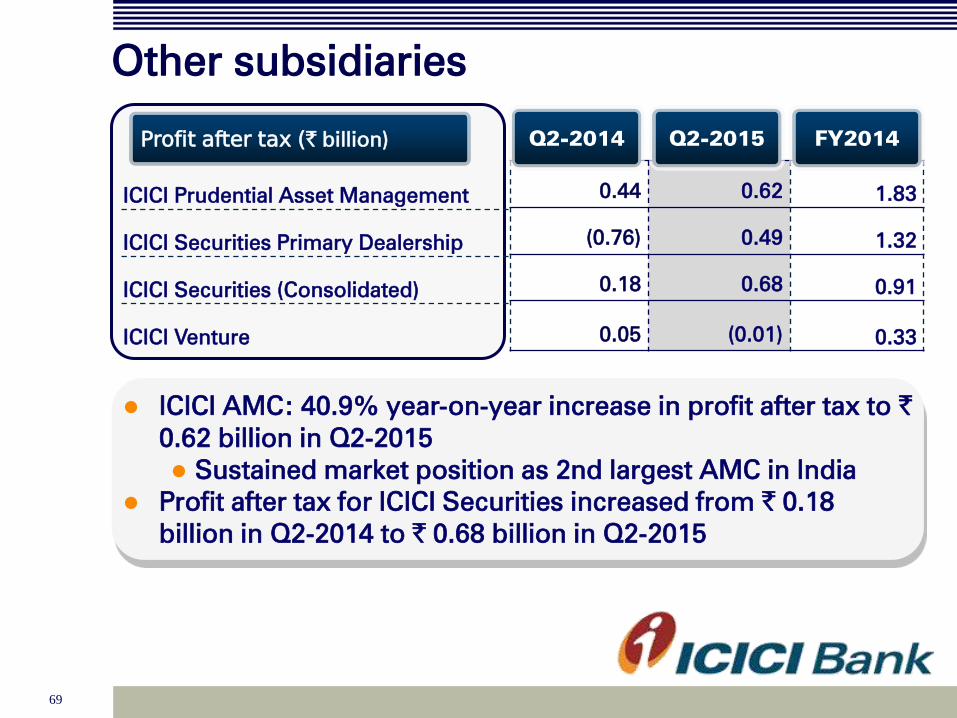
Other subsidiaries
ICICI Prudential Asset Management
ICICI Securities Primary Dealership
ICICI Securities (Consolidated)
ICICI Venture
Profit after tax (` billion)
0.44 0.62 1.83
(0.76) 0.49 1.32
0.18 0.68 0.91
0.05 (0.01) 0.33
Q2-2014 Q2-2015 FY2014
ICICI AMC: 40.9% year-on-year increase in profit after tax to ` 0.62 billion in Q2-2015
Sustained market position as 2nd largest AMC in India
Profit after tax for ICICI Securities increased from ` 0.18
billion in Q2-2014 to ` 0.68 billion in Q2-2015
Related Documents