一目均衡表

Welcome message from author
This document is posted to help you gain knowledge. Please leave a comment to let me know what you think about it! Share it to your friends and learn new things together.
Transcript
◚⯎
一目均衡表 ICHIMOKU KINKO HYO
Contents
INTRODUCTION 4
1. 転換線 TENKAN SEN 9
2. 基準線 KIJUN SEN 15
3. 先行スパン SENKOU SPAN A 19
4. 先行スパン SENKOU SPAN B 20
5. 遅行スパ CHIKOU SPAN 24
NEXT STEPS – START TRADING WITH SWISSQUOTE 39
5CFDs are complex instruments and come with a high risk of losing money rapidly due to leverage. 78% of retail investor accounts lose money when trading CFDs with this provider. You should consider whether you understand how CFDs work and whether you can afford to take the high risk of losing your money.
4
INTRODUCTION
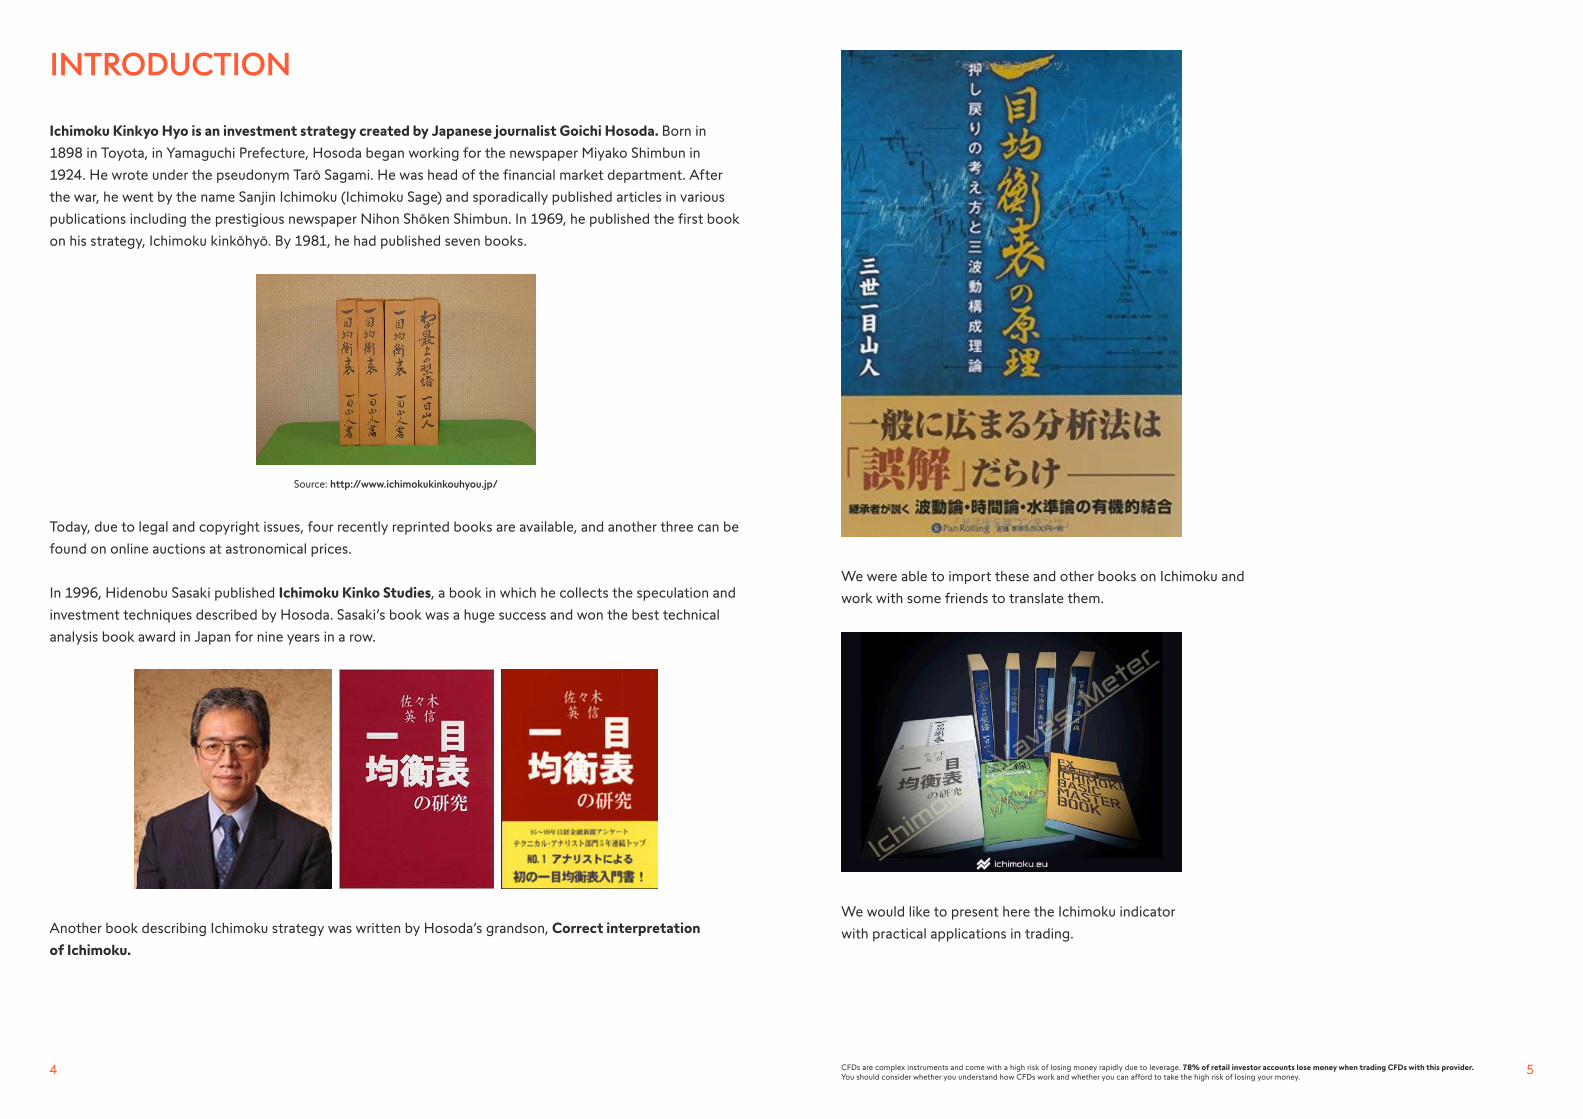
Ichimoku Kinkyo Hyo is an investment strategy created by Japanese journalist Goichi Hosoda. Born in
1898 in Toyota, in Yamaguchi Prefecture, Hosoda began working for the newspaper Miyako Shimbun in
1924. He wrote under the pseudonym Tarō Sagami. He was head of the financial market department. After
the war, he went by the name Sanjin Ichimoku (Ichimoku Sage) and sporadically published articles in various
publications including the prestigious newspaper Nihon Shōken Shimbun. In 1969, he published the first book
on his strategy, Ichimoku kinkōhyō. By 1981, he had published seven books.
Today, due to legal and copyright issues, four recently reprinted books are available, and another three can be
found on online auctions at astronomical prices.
In 1996, Hidenobu Sasaki published Ichimoku Kinko Studies, a book in which he collects the speculation and
investment techniques described by Hosoda. Sasaki’s book was a huge success and won the best technical
analysis book award in Japan for nine years in a row.
Another book describing Ichimoku strategy was written by Hosoda’s grandson, Correct interpretation
of Ichimoku.
We were able to import these and other books on Ichimoku and
work with some friends to translate them.
We would like to present here the Ichimoku indicator
with practical applications in trading.
Source: http://www.ichimokukinkouhyou.jp/
7CFDs are complex instruments and come with a high risk of losing money rapidly due to leverage. 78% of retail investor accounts lose money when trading CFDs with this provider. You should consider whether you understand how CFDs work and whether you can afford to take the high risk of losing your money.
6
WHAT IS ICHIMOKU? Ichimoku is a trend following strategy. That means it follows the dominant trend, so it is essential to
understand what “trend” refers to. The shortest and perhaps best definition of trend can be found in John
Murphy’s book Technical Analysis of the Financial Markets: “In a general sense, the trend is simply the
direction of the market, which way it’s moving”.
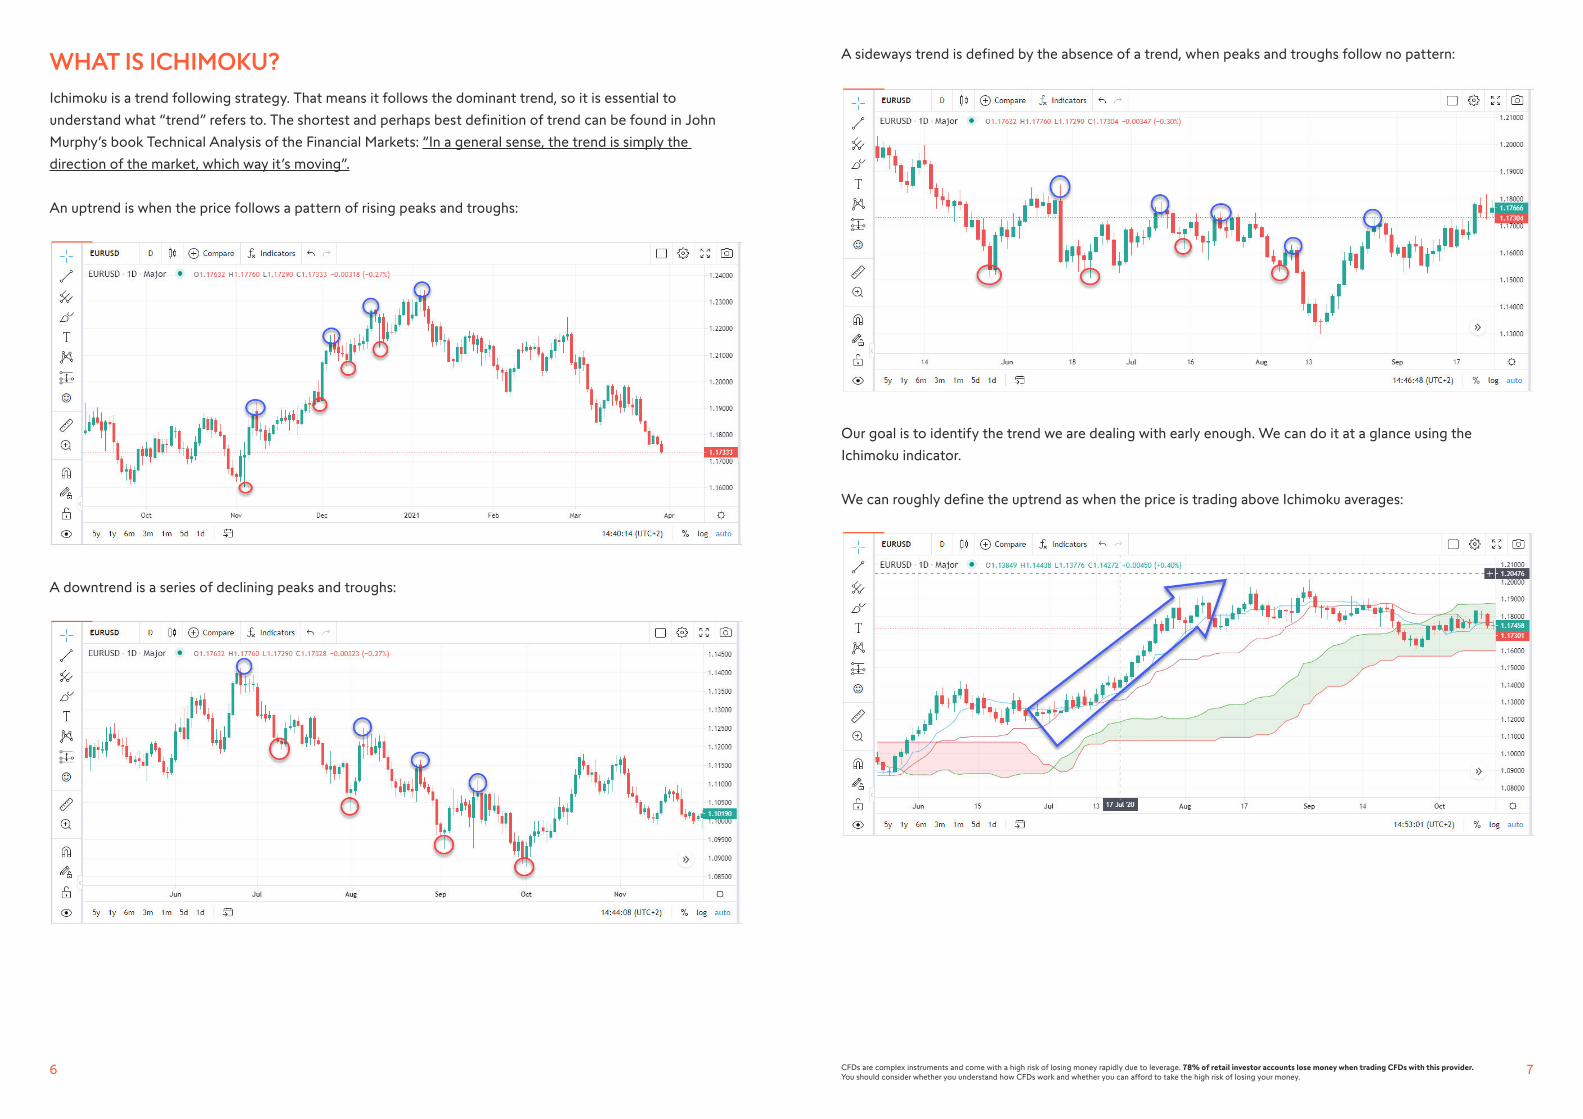
An uptrend is when the price follows a pattern of rising peaks and troughs:
A downtrend is a series of declining peaks and troughs:
A sideways trend is defined by the absence of a trend, when peaks and troughs follow no pattern:
Our goal is to identify the trend we are dealing with early enough. We can do it at a glance using the
Ichimoku indicator.
We can roughly define the uptrend as when the price is trading above Ichimoku averages:
9CFDs are complex instruments and come with a high risk of losing money rapidly due to leverage. 78% of retail investor accounts lose money when trading CFDs with this provider. You should consider whether you understand how CFDs work and whether you can afford to take the high risk of losing your money.
8
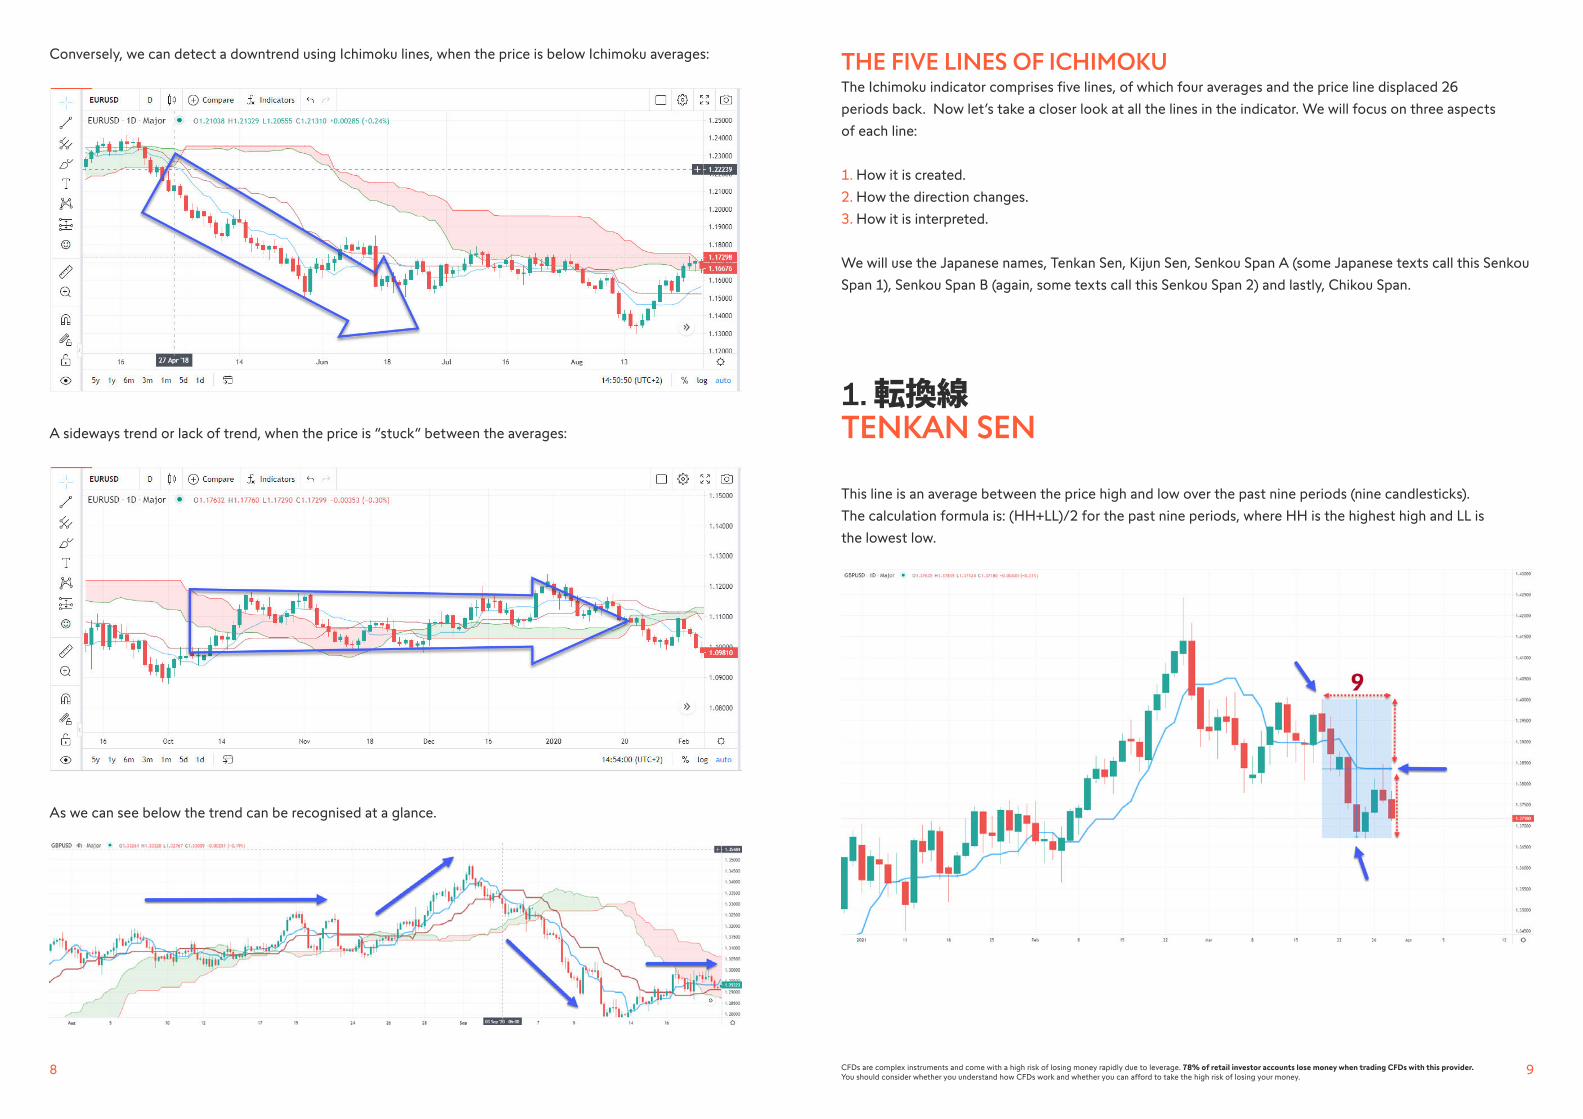
Conversely, we can detect a downtrend using Ichimoku lines, when the price is below Ichimoku averages:
A sideways trend or lack of trend, when the price is “stuck“ between the averages:
As we can see below the trend can be recognised at a glance.
THE FIVE LINES OF ICHIMOKUThe Ichimoku indicator comprises five lines, of which four averages and the price line displaced 26
periods back. Now let’s take a closer look at all the lines in the indicator. We will focus on three aspects
of each line:
1. How it is created.
2. How the direction changes.
3. How it is interpreted.
We will use the Japanese names, Tenkan Sen, Kijun Sen, Senkou Span A (some Japanese texts call this Senkou
Span 1), Senkou Span B (again, some texts call this Senkou Span 2) and lastly, Chikou Span.
1. 転換線 TENKAN SEN
This line is an average between the price high and low over the past nine periods (nine candlesticks).
The calculation formula is: (HH+LL)/2 for the past nine periods, where HH is the highest high and LL is
the lowest low.

11CFDs are complex instruments and come with a high risk of losing money rapidly due to leverage. 78% of retail investor accounts lose money when trading CFDs with this provider. You should consider whether you understand how CFDs work and whether you can afford to take the high risk of losing your money.
10
The Tenkan average can change direction in two ways:
1. With new highs or new lows.
When the price reaches a new high, the Tenkan average changes direction from sideways to an uptrend.
New lows shift the Tenkan average from sideways to a downtrend.

13CFDs are complex instruments and come with a high risk of losing money rapidly due to leverage. 78% of retail investor accounts lose money when trading CFDs with this provider. You should consider whether you understand how CFDs work and whether you can afford to take the high risk of losing your money.
12
2. The Tenkan line can also reverse direction in what is referred to as “candlestick death” in Japanese.
Candlestick death refers to when a candlestick marking a high or low is no longer taken into account as it
becomes the tenth candlestick.
The Tenkan average moving sideways reverses to a downtrend not because of new highs or new lows, but due
to the previous high that is no longer taken into account, hence the term “candlestick death”.
We believe it is very important to be able to identify the cause of a reversal in the Tenkan average, unlike an
Expert Advisor or a careful trader, to give these changes the proper weighting on the chart.
Interpreting the Tenkan line
First of all, the direction, as we see from the image taken two days before, the direction of the Tenkan line
suggested a price increase, and the price did in fact go up.
The Tenkan line, like all Ichimoku averages, also represents support and resistance levels. Usually a bounce in
the Tenkan line is a good time to add lots to an open position.
15CFDs are complex instruments and come with a high risk of losing money rapidly due to leverage. 78% of retail investor accounts lose money when trading CFDs with this provider. You should consider whether you understand how CFDs work and whether you can afford to take the high risk of losing your money.
14
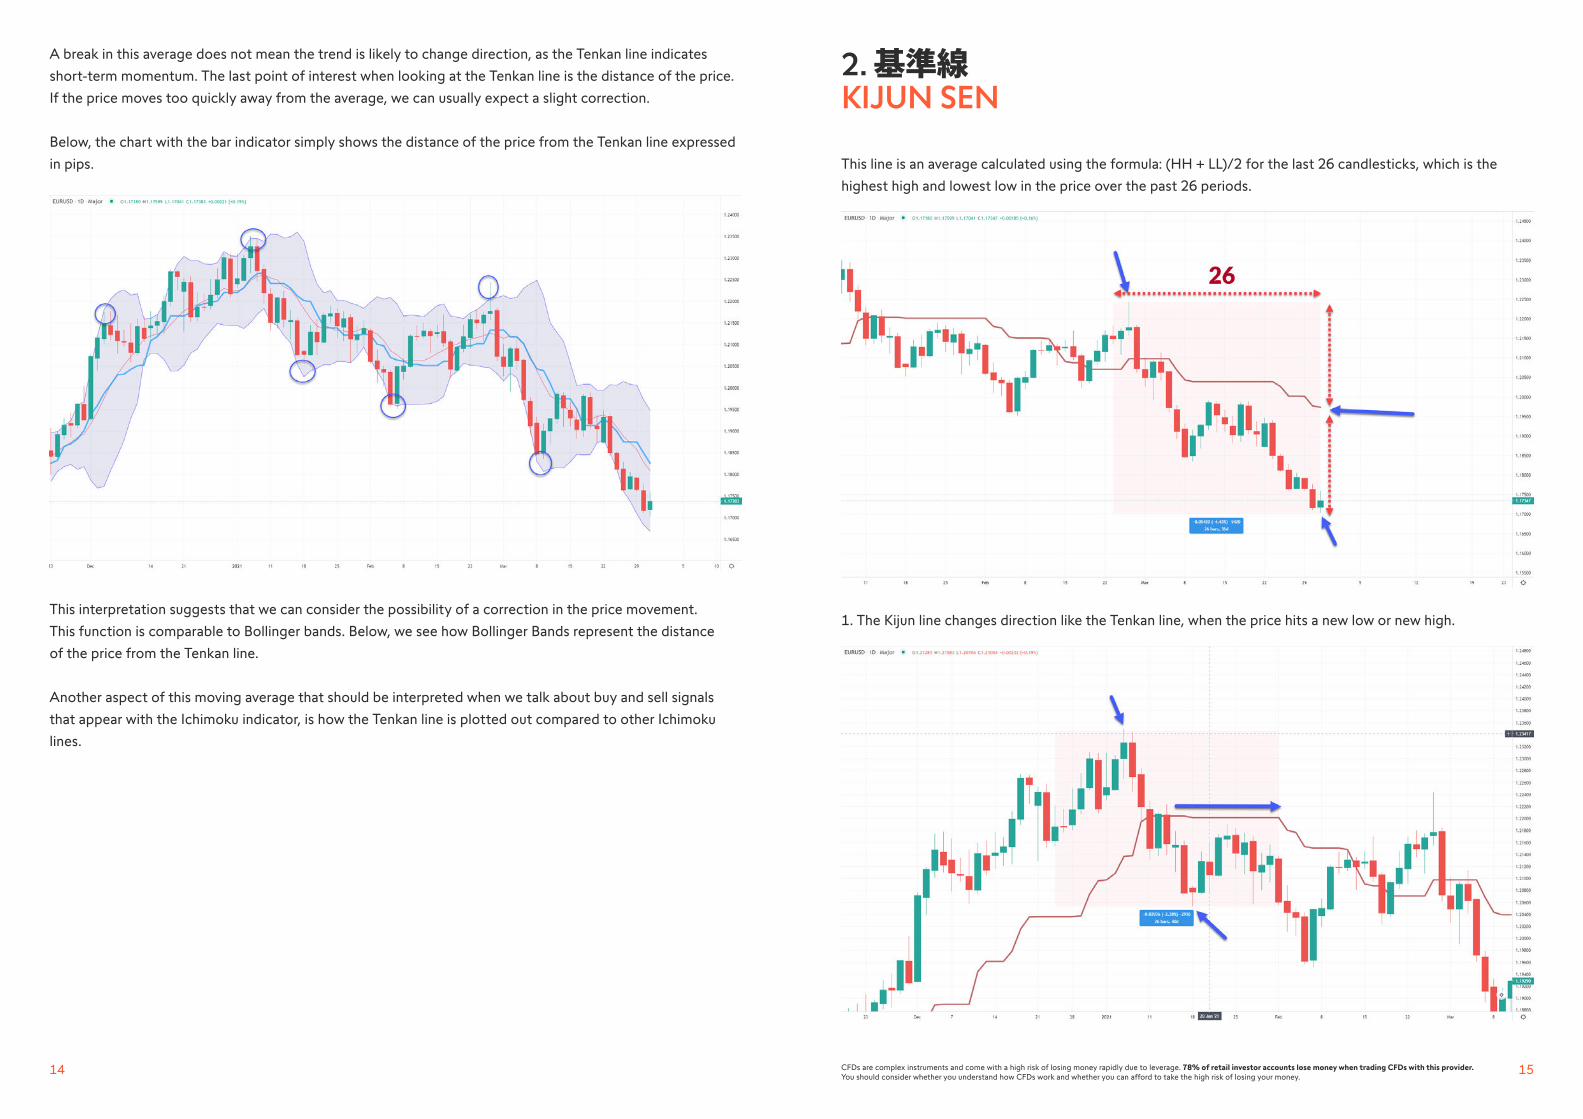
A break in this average does not mean the trend is likely to change direction, as the Tenkan line indicates
short-term momentum. The last point of interest when looking at the Tenkan line is the distance of the price.
If the price moves too quickly away from the average, we can usually expect a slight correction.
Below, the chart with the bar indicator simply shows the distance of the price from the Tenkan line expressed
in pips.
This interpretation suggests that we can consider the possibility of a correction in the price movement.
This function is comparable to Bollinger bands. Below, we see how Bollinger Bands represent the distance
of the price from the Tenkan line.
Another aspect of this moving average that should be interpreted when we talk about buy and sell signals
that appear with the Ichimoku indicator, is how the Tenkan line is plotted out compared to other Ichimoku
lines.
2. 基準線 KIJUN SEN
This line is an average calculated using the formula: (HH + LL)/2 for the last 26 candlesticks, which is the
highest high and lowest low in the price over the past 26 periods.
1. The Kijun line changes direction like the Tenkan line, when the price hits a new low or new high.
17CFDs are complex instruments and come with a high risk of losing money rapidly due to leverage. 78% of retail investor accounts lose money when trading CFDs with this provider. You should consider whether you understand how CFDs work and whether you can afford to take the high risk of losing your money.
16
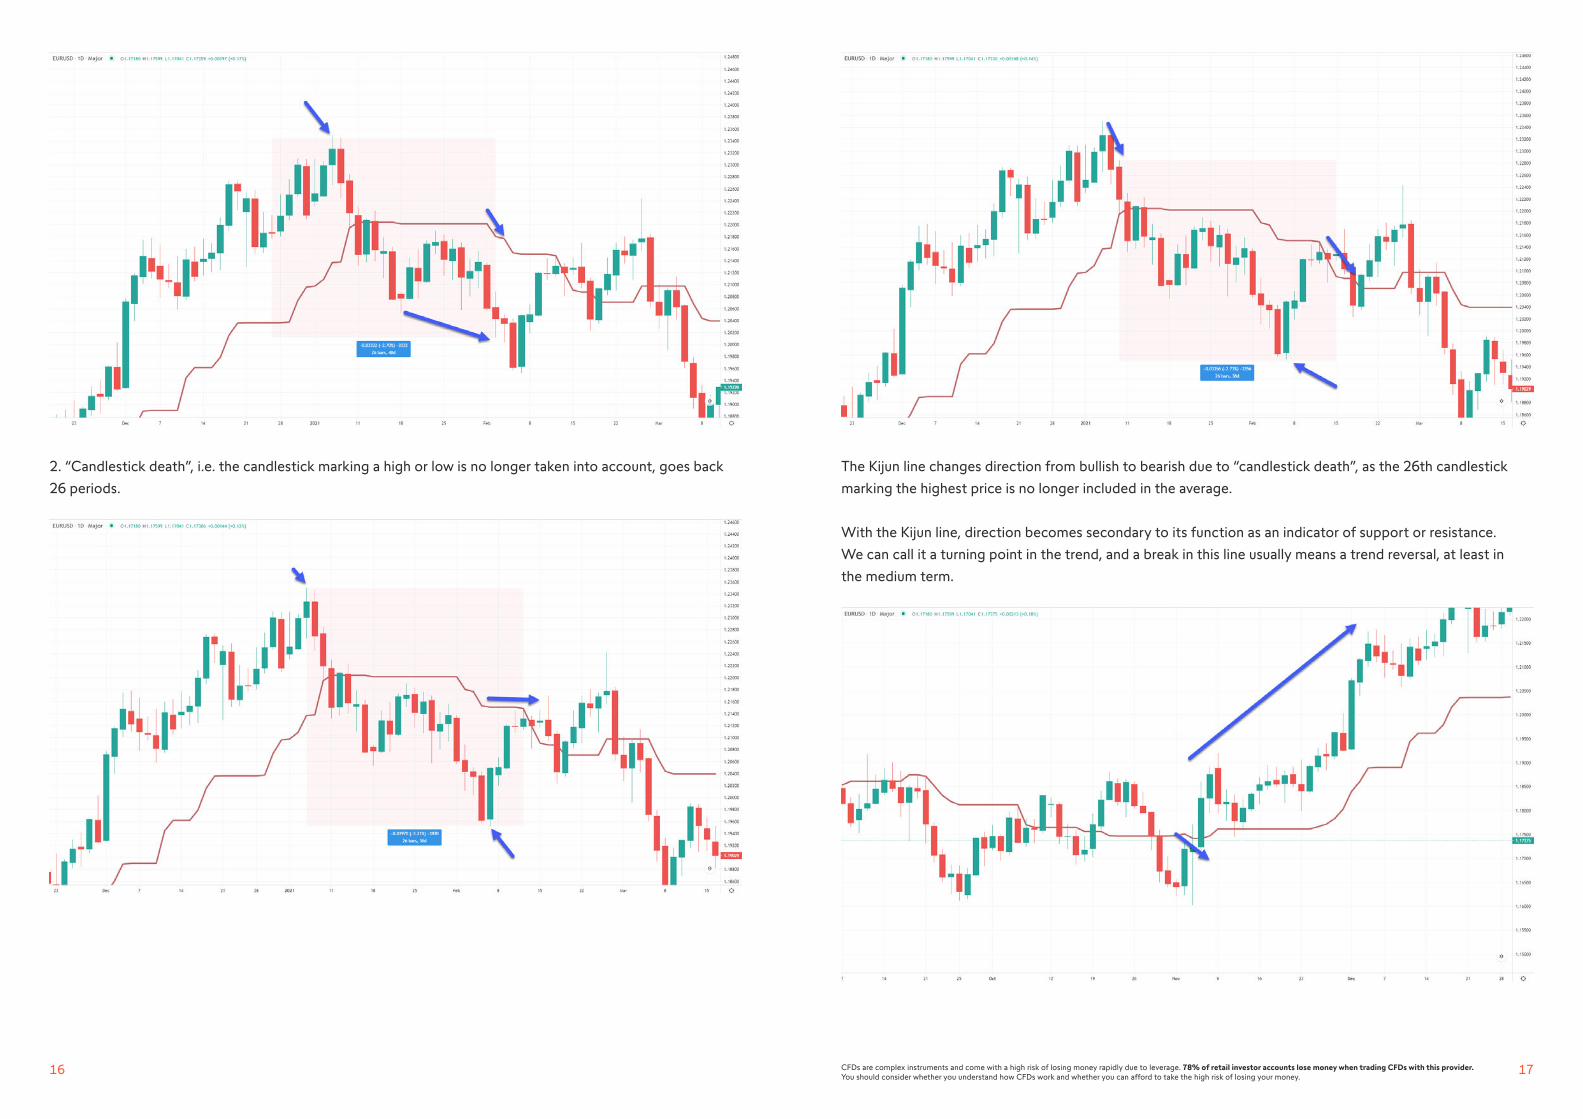
2. “Candlestick death”, i.e. the candlestick marking a high or low is no longer taken into account, goes back
26 periods.
The Kijun line changes direction from bullish to bearish due to “candlestick death”, as the 26th candlestick
marking the highest price is no longer included in the average.
With the Kijun line, direction becomes secondary to its function as an indicator of support or resistance.
We can call it a turning point in the trend, and a break in this line usually means a trend reversal, at least in
the medium term.
19CFDs are complex instruments and come with a high risk of losing money rapidly due to leverage. 78% of retail investor accounts lose money when trading CFDs with this provider. You should consider whether you understand how CFDs work and whether you can afford to take the high risk of losing your money.
18
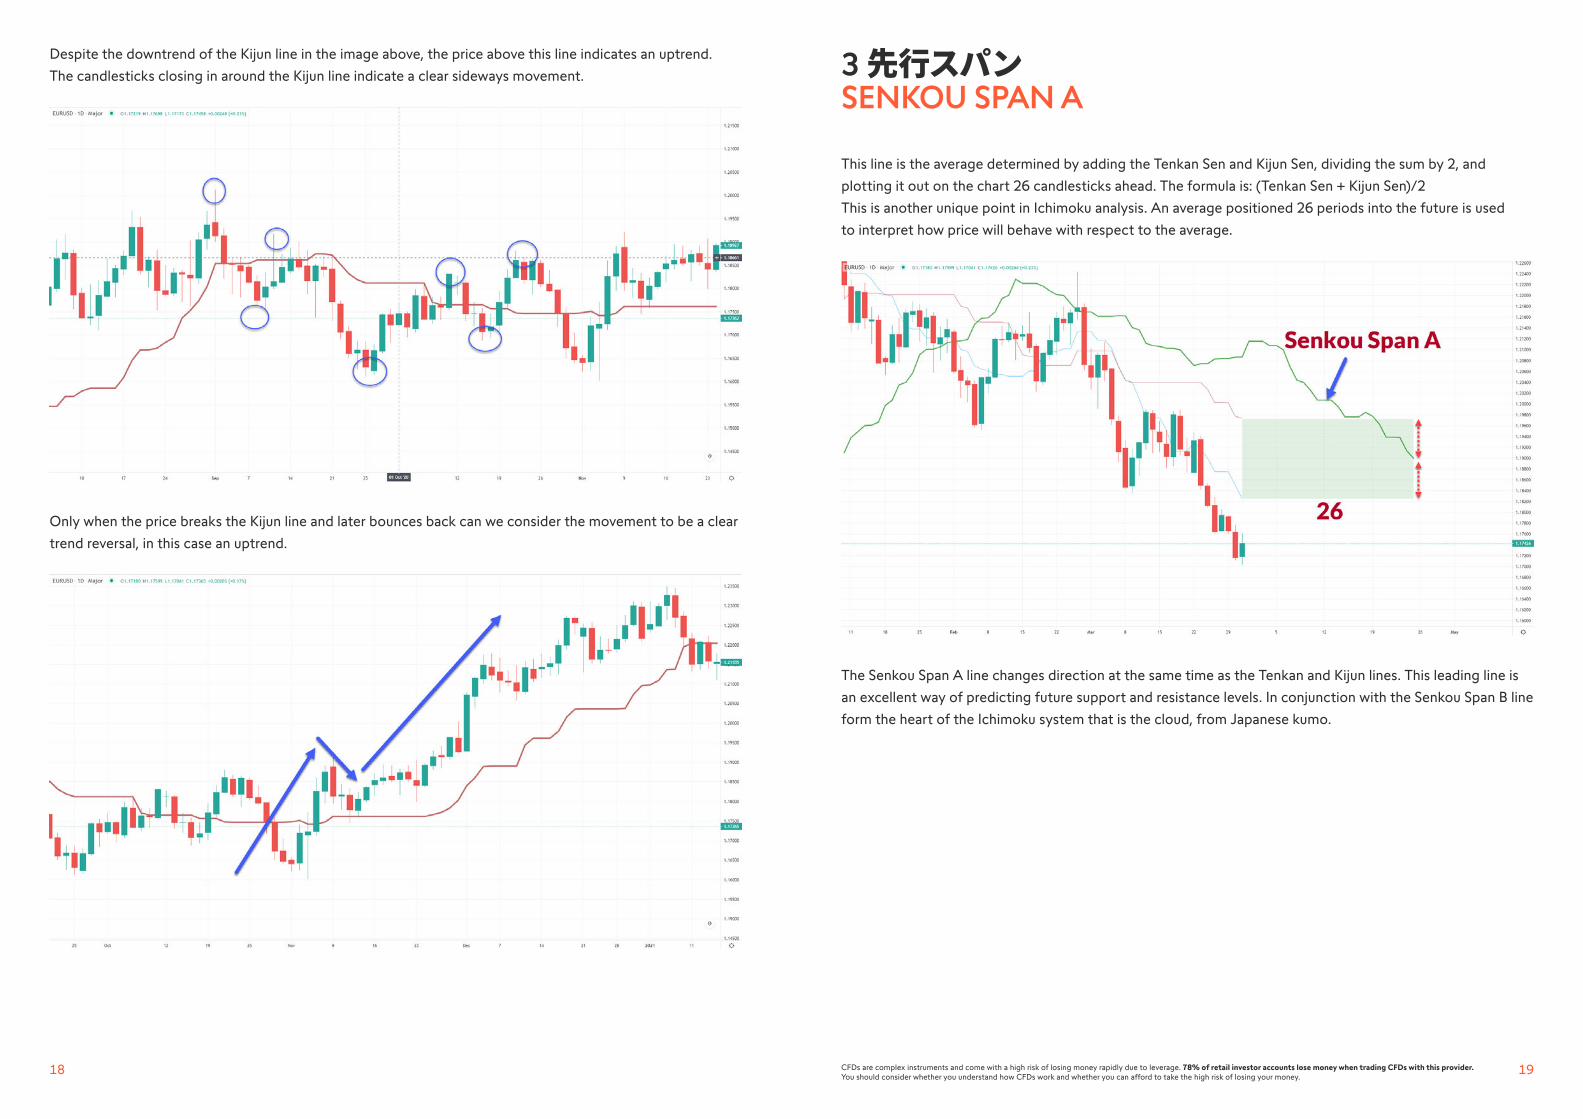
Despite the downtrend of the Kijun line in the image above, the price above this line indicates an uptrend.
The candlesticks closing in around the Kijun line indicate a clear sideways movement.
Only when the price breaks the Kijun line and later bounces back can we consider the movement to be a clear
trend reversal, in this case an uptrend.
3 先行スパン SENKOU SPAN A
This line is the average determined by adding the Tenkan Sen and Kijun Sen, dividing the sum by 2, and
plotting it out on the chart 26 candlesticks ahead. The formula is: (Tenkan Sen + Kijun Sen)/2
This is another unique point in Ichimoku analysis. An average positioned 26 periods into the future is used
to interpret how price will behave with respect to the average.
The Senkou Span A line changes direction at the same time as the Tenkan and Kijun lines. This leading line is
an excellent way of predicting future support and resistance levels. In conjunction with the Senkou Span B line
form the heart of the Ichimoku system that is the cloud, from Japanese kumo.
21CFDs are complex instruments and come with a high risk of losing money rapidly due to leverage. 78% of retail investor accounts lose money when trading CFDs with this provider. You should consider whether you understand how CFDs work and whether you can afford to take the high risk of losing your money.
20
4. 先行スパン SENKOU SPAN B
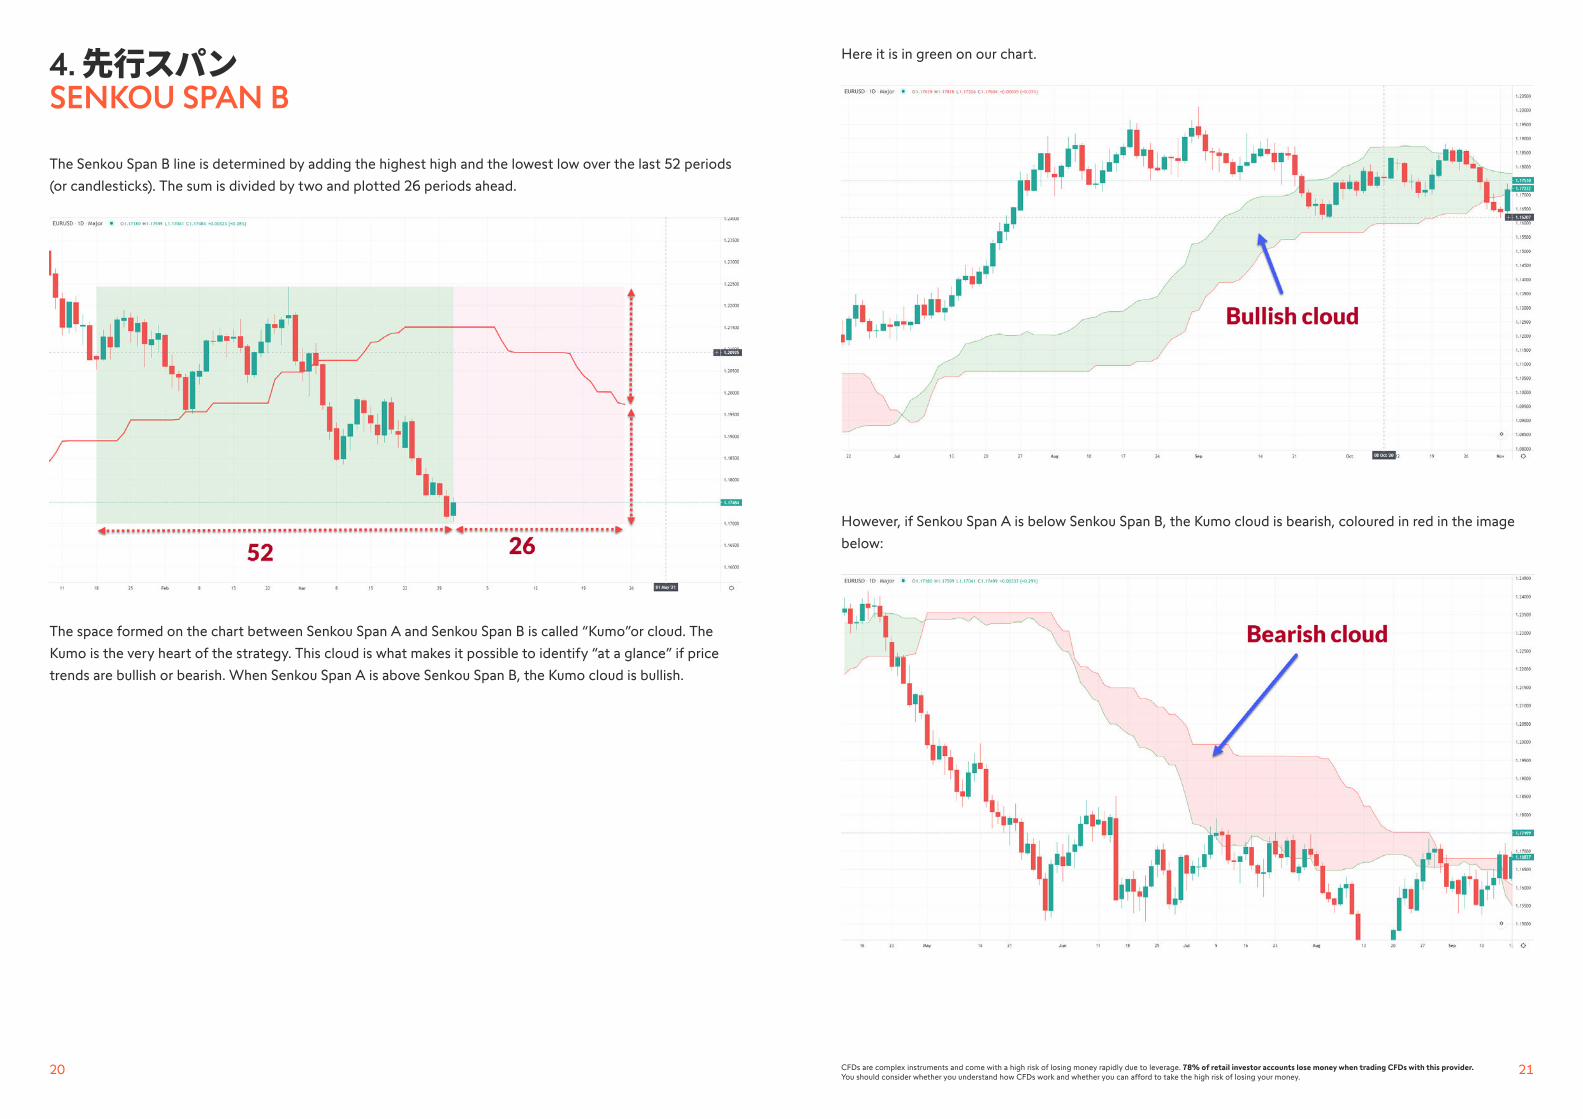
The Senkou Span B line is determined by adding the highest high and the lowest low over the last 52 periods
(or candlesticks). The sum is divided by two and plotted 26 periods ahead.
The space formed on the chart between Senkou Span A and Senkou Span B is called “Kumo”or cloud. The
Kumo is the very heart of the strategy. This cloud is what makes it possible to identify “at a glance” if price
trends are bullish or bearish. When Senkou Span A is above Senkou Span B, the Kumo cloud is bullish.
Here it is in green on our chart.
However, if Senkou Span A is below Senkou Span B, the Kumo cloud is bearish, coloured in red in the image
below:
23CFDs are complex instruments and come with a high risk of losing money rapidly due to leverage. 78% of retail investor accounts lose money when trading CFDs with this provider. You should consider whether you understand how CFDs work and whether you can afford to take the high risk of losing your money.
22
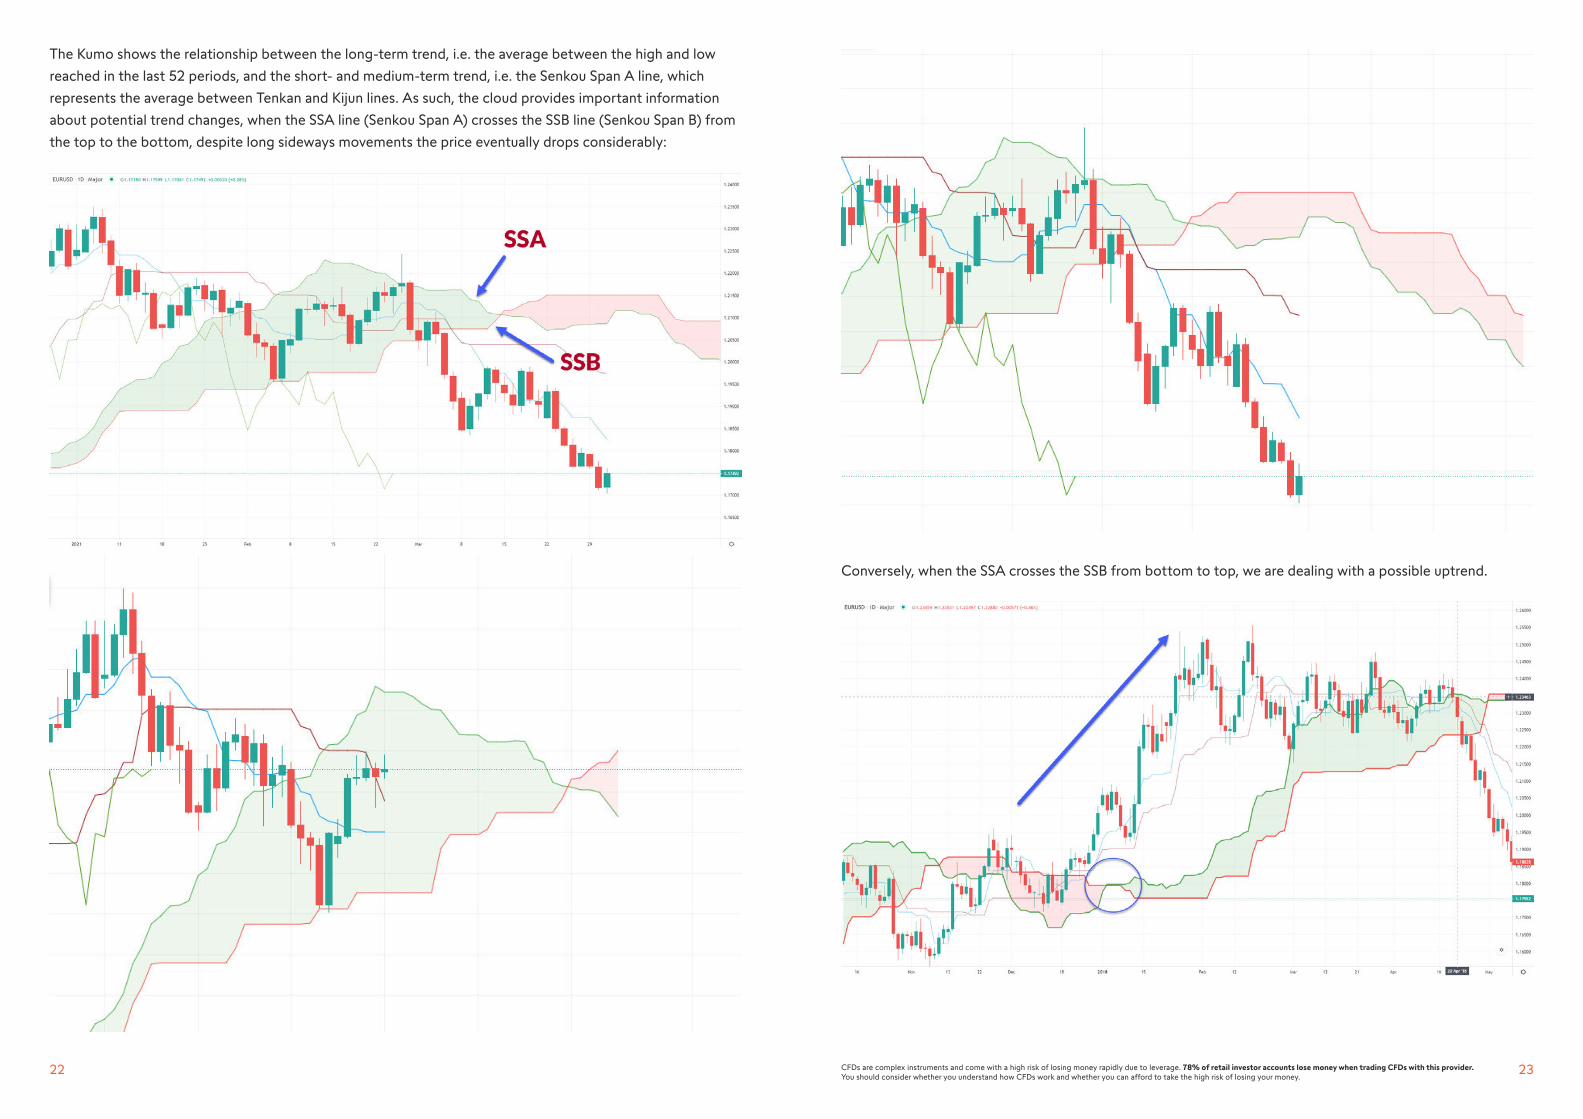
The Kumo shows the relationship between the long-term trend, i.e. the average between the high and low
reached in the last 52 periods, and the short- and medium-term trend, i.e. the Senkou Span A line, which
represents the average between Tenkan and Kijun lines. As such, the cloud provides important information
about potential trend changes, when the SSA line (Senkou Span A) crosses the SSB line (Senkou Span B) from
the top to the bottom, despite long sideways movements the price eventually drops considerably:
Conversely, when the SSA crosses the SSB from bottom to top, we are dealing with a possible uptrend.

25CFDs are complex instruments and come with a high risk of losing money rapidly due to leverage. 78% of retail investor accounts lose money when trading CFDs with this provider. You should consider whether you understand how CFDs work and whether you can afford to take the high risk of losing your money.
24
5. 遅行スパ CHIKOU SPAN
This line is generated by plotting closing prices 26 candlesticks into the past. It is used to gauge momentum.
Analysing the Chikou Span is simple: a line above the price plotted 26 periods behind confirms a bullish trend,
while a line below the price plotted 26 periods behind confirms a bearish trend.
The Chikou Span line is an excellent indicator of support and resistance levels. Traders need to be able to spot
valid support and resistance points. I have often not opened a trade, despite all the conditions for doing so
were met, because the price was too close to a support or resistance line. If this happens, I wait for the price
to cross this line, and only then can I be sure that the trend is strong enough to invest.
The Chikou Span line is used to determine support and resistance levels. We start by taking the monthly
candlesticks and looking for the points where the price has changed direction on the horizontal line close to
the current price:
These points are indicated with the blue arrows, while the blue horizontal line shows that the price has
bounced off these support levels several times.
27CFDs are complex instruments and come with a high risk of losing money rapidly due to leverage. 78% of retail investor accounts lose money when trading CFDs with this provider. You should consider whether you understand how CFDs work and whether you can afford to take the high risk of losing your money.
26
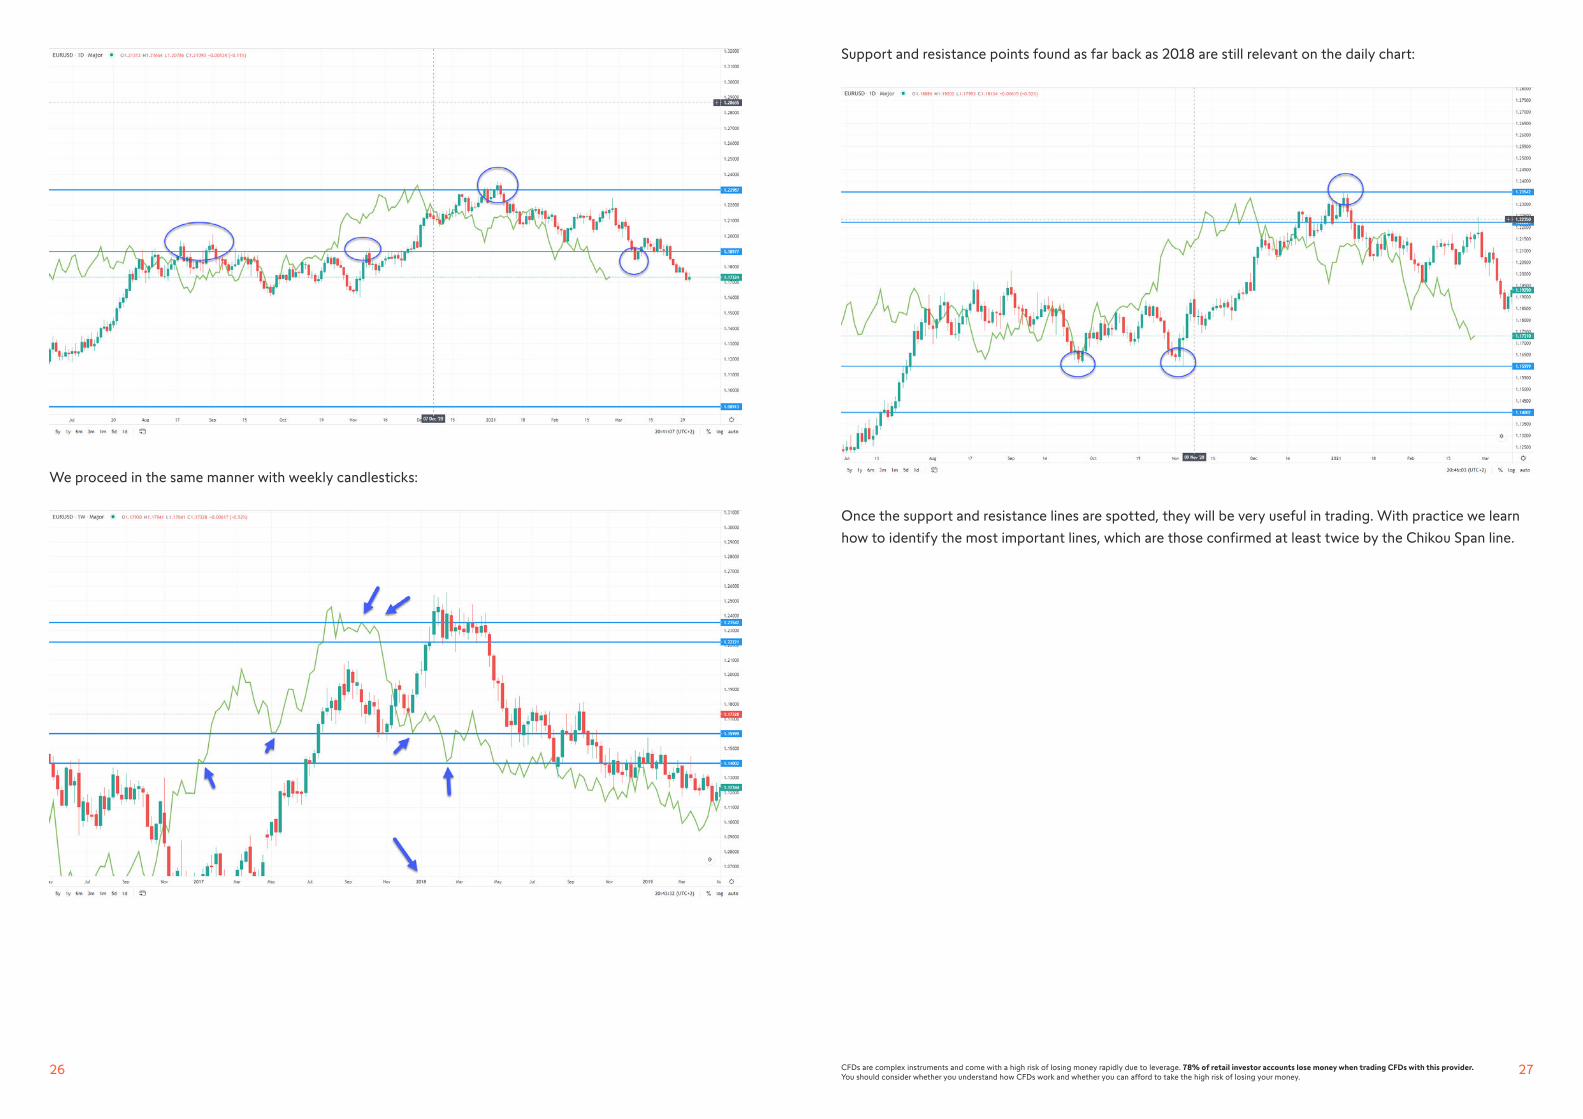
We proceed in the same manner with weekly candlesticks:
Support and resistance points found as far back as 2018 are still relevant on the daily chart:
Once the support and resistance lines are spotted, they will be very useful in trading. With practice we learn
how to identify the most important lines, which are those confirmed at least twice by the Chikou Span line.
29CFDs are complex instruments and come with a high risk of losing money rapidly due to leverage. 78% of retail investor accounts lose money when trading CFDs with this provider. You should consider whether you understand how CFDs work and whether you can afford to take the high risk of losing your money.
28
ICHIMOKU INDICATOR SIGNALS Ichimoku indicator signals can be divided into three groups:
1. Signals generated by observing movements in Ichimoku lines
a) Intersection of the Tenkan and Kijun lines
b) Intersection of the Senkou Span A and Senkou Span B lines
c) The signal of three lines.
2. Signals generated by observing the behaviour of the price line compared to other Ichimoku lines:
a) If the price bounces off any Ichimoku line;
b) If the price crosses over any Ichimoku line.
3. Signals derived from the Chikou Span:
a) If the price line from 28 periods behind crosses the Chikou Span line.
b) If the price line going back 28 periods bounces off the Chikou Span line.
Signals from the first and second group can be strong, weak or neutral. Let’s see what they look like
in practice.
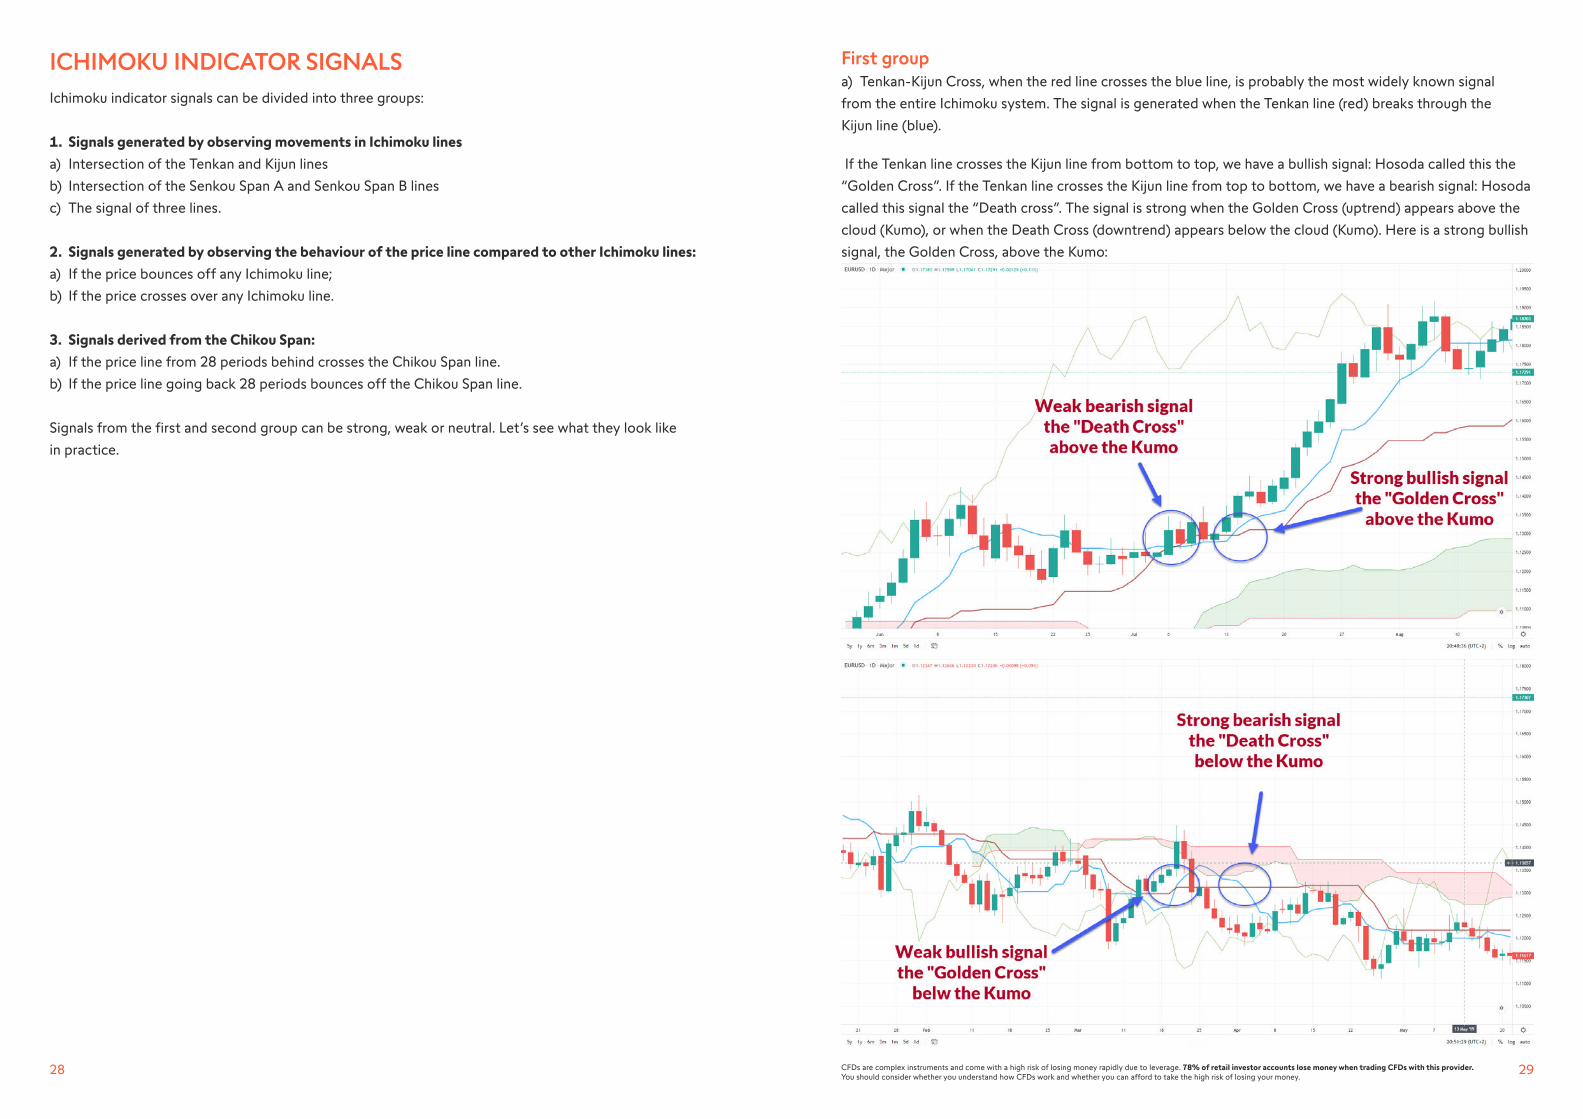
First groupa) Tenkan-Kijun Cross, when the red line crosses the blue line, is probably the most widely known signal
from the entire Ichimoku system. The signal is generated when the Tenkan line (red) breaks through the
Kijun line (blue).
If the Tenkan line crosses the Kijun line from bottom to top, we have a bullish signal: Hosoda called this the
“Golden Cross”. If the Tenkan line crosses the Kijun line from top to bottom, we have a bearish signal: Hosoda
called this signal the “Death cross”. The signal is strong when the Golden Cross (uptrend) appears above the
cloud (Kumo), or when the Death Cross (downtrend) appears below the cloud (Kumo). Here is a strong bullish
signal, the Golden Cross, above the Kumo:
31CFDs are complex instruments and come with a high risk of losing money rapidly due to leverage. 78% of retail investor accounts lose money when trading CFDs with this provider. You should consider whether you understand how CFDs work and whether you can afford to take the high risk of losing your money.
30
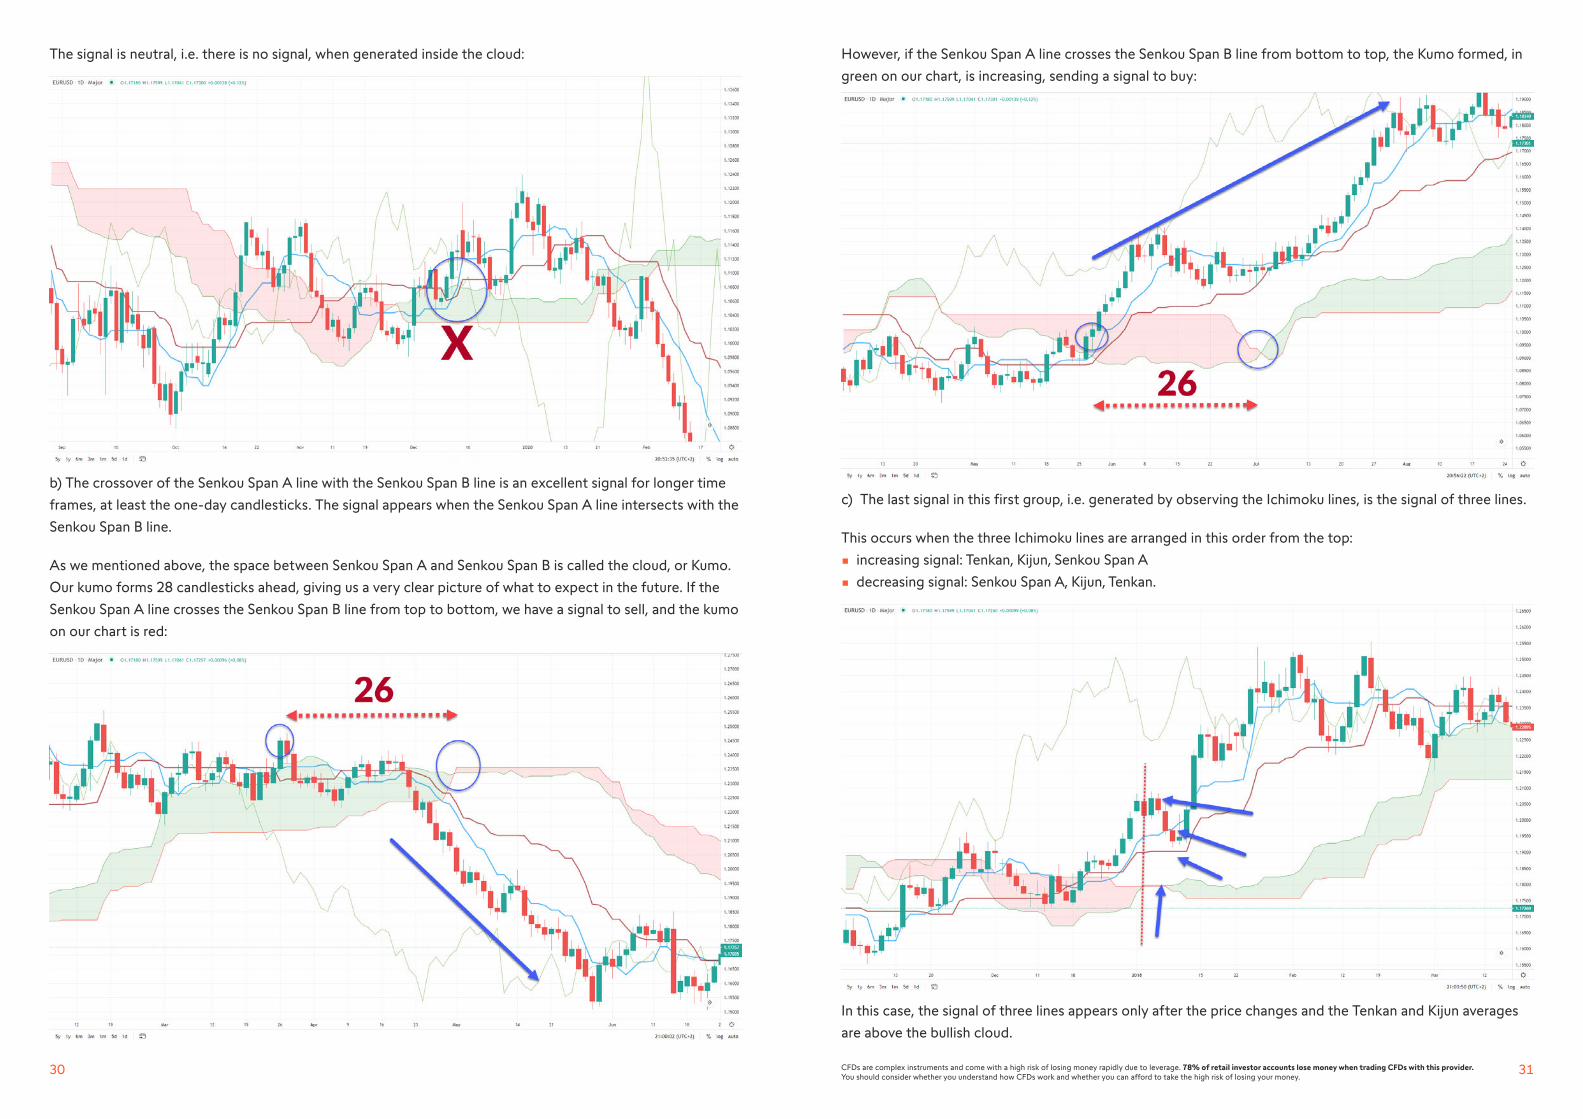
The signal is neutral, i.e. there is no signal, when generated inside the cloud:
b) The crossover of the Senkou Span A line with the Senkou Span B line is an excellent signal for longer time
frames, at least the one-day candlesticks. The signal appears when the Senkou Span A line intersects with the
Senkou Span B line.
As we mentioned above, the space between Senkou Span A and Senkou Span B is called the cloud, or Kumo.
Our kumo forms 28 candlesticks ahead, giving us a very clear picture of what to expect in the future. If the
Senkou Span A line crosses the Senkou Span B line from top to bottom, we have a signal to sell, and the kumo
on our chart is red:
However, if the Senkou Span A line crosses the Senkou Span B line from bottom to top, the Kumo formed, in
green on our chart, is increasing, sending a signal to buy:
c) The last signal in this first group, i.e. generated by observing the Ichimoku lines, is the signal of three lines.
This occurs when the three Ichimoku lines are arranged in this order from the top:
• increasing signal: Tenkan, Kijun, Senkou Span A
• decreasing signal: Senkou Span A, Kijun, Tenkan.
In this case, the signal of three lines appears only after the price changes and the Tenkan and Kijun averages
are above the bullish cloud.

33CFDs are complex instruments and come with a high risk of losing money rapidly due to leverage. 78% of retail investor accounts lose money when trading CFDs with this provider. You should consider whether you understand how CFDs work and whether you can afford to take the high risk of losing your money.
32
Below, the signal of three bearish lines appears when the price along with the Tenkan and Kijun lines moves
below the bearish Kumo:
Second group The key factor in the second group is the price, and signals are generated if:
a) the price bounces off any Ichimoku line:
b) if the price crosses over any Ichimoku line.
The strongest signal in this group is a crossover with the cloud (Kumo).
The image above first shows a bullish signal followed by a bearish signal.
The price intersects with the Tenkan line:
A crossover by the price with the Tenkan line, for me, only has meaning if the price returns to the main trend
after a small correction. After a long run, the price often “rests“ a while. The chart below shows the bullish
trend, in which the price stops and even falls below the Tenkan line (arrow A). When it returns to the bullish
trend and the candlestick closes above the Tenkan line (arrow B), I can actually add lots to any open positions.
35CFDs are complex instruments and come with a high risk of losing money rapidly due to leverage. 78% of retail investor accounts lose money when trading CFDs with this provider. You should consider whether you understand how CFDs work and whether you can afford to take the high risk of losing your money.
34
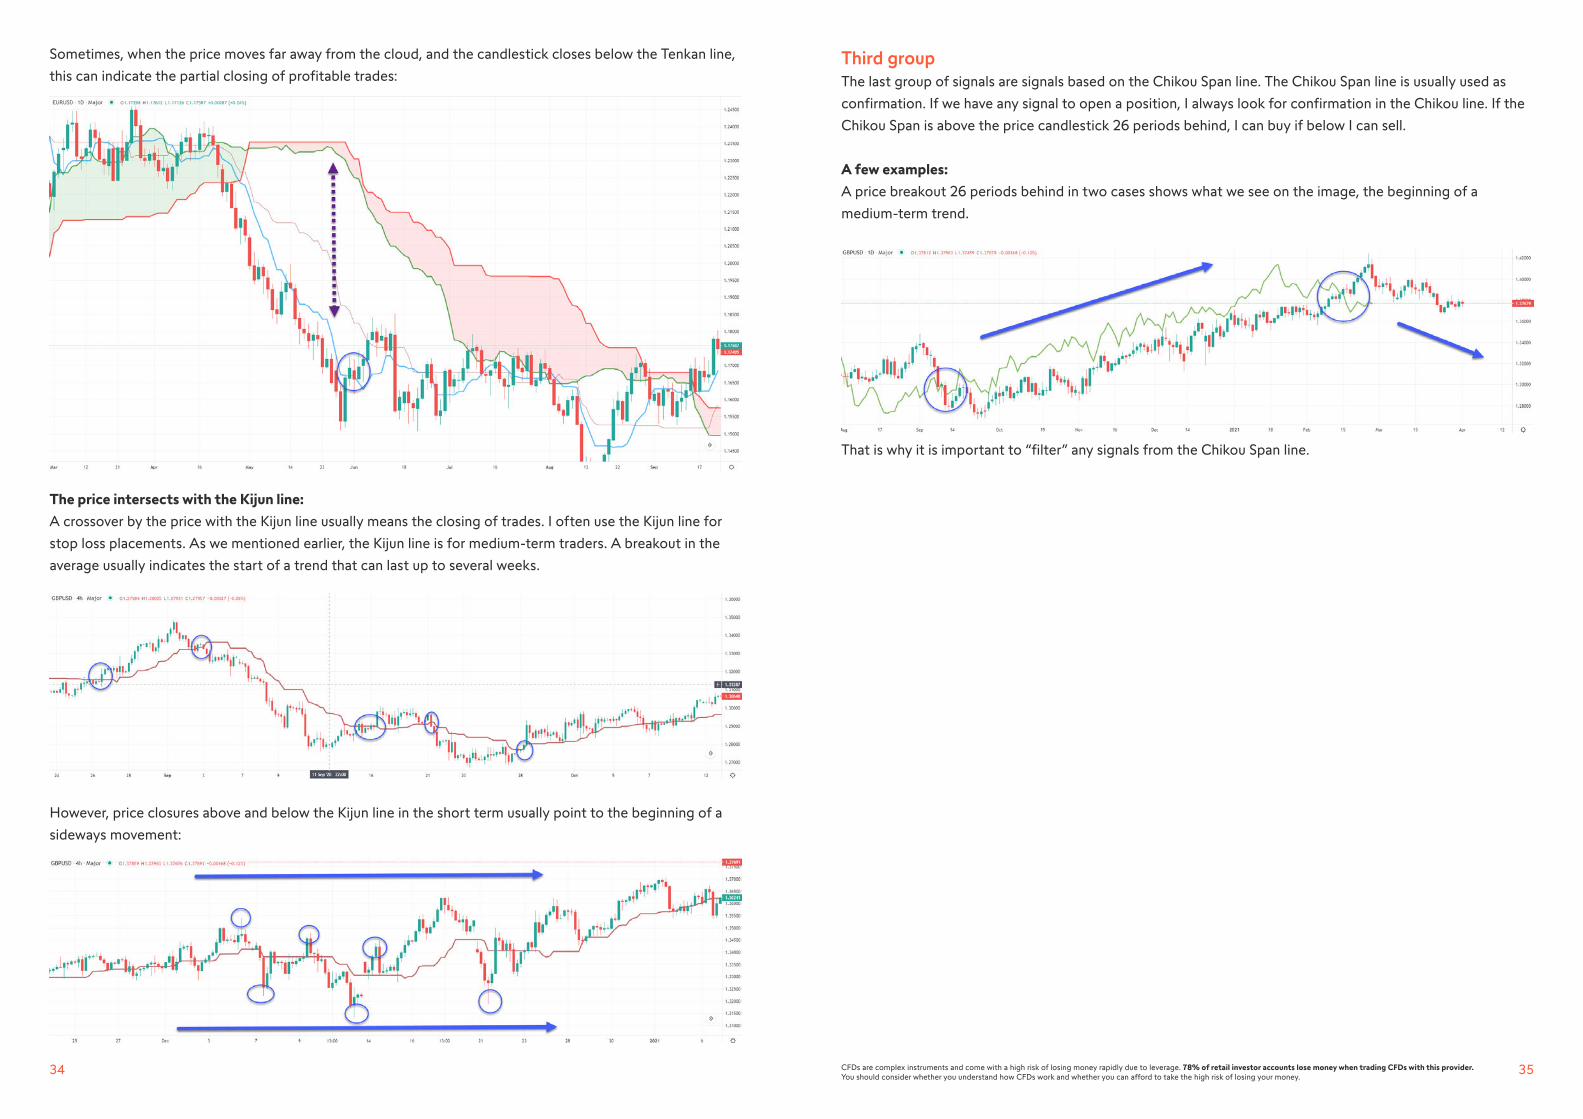
Sometimes, when the price moves far away from the cloud, and the candlestick closes below the Tenkan line,
this can indicate the partial closing of profitable trades:
The price intersects with the Kijun line:
A crossover by the price with the Kijun line usually means the closing of trades. I often use the Kijun line for
stop loss placements. As we mentioned earlier, the Kijun line is for medium-term traders. A breakout in the
average usually indicates the start of a trend that can last up to several weeks.
However, price closures above and below the Kijun line in the short term usually point to the beginning of a
sideways movement:
Third group The last group of signals are signals based on the Chikou Span line. The Chikou Span line is usually used as
confirmation. If we have any signal to open a position, I always look for confirmation in the Chikou line. If the
Chikou Span is above the price candlestick 26 periods behind, I can buy if below I can sell.
A few examples:
A price breakout 26 periods behind in two cases shows what we see on the image, the beginning of a
medium-term trend.
That is why it is important to “filter” any signals from the Chikou Span line.

37CFDs are complex instruments and come with a high risk of losing money rapidly due to leverage. 78% of retail investor accounts lose money when trading CFDs with this provider. You should consider whether you understand how CFDs work and whether you can afford to take the high risk of losing your money.
36
The Ichimoku lines as reference points in spotting the stop-loss (SL) and take-profit (TP) levels.
Ichimoku lines are excellent reference points, when we have to make decisions about opening (entry signals),
and SL and TP positioning.
If we divide the signals roughly into two groups, i.e. those generated by the Tenkan and Kijun lines, and those
generated by the Kumo, we can easily assume that these lines will then be responsible for our stop loss, i.e.
the point where the signal no longer makes sense.
Above we can see a strong signal emerging from the Tenkan and Kijun lines. Our stop loss is therefore placed
on the Kijun line (maybe some pips above to avoid accidental closures).
As one of the core principles in trading is the risk reward, i.e. the trade-off between risk and potential gain,
we simply set our take-profit level as a multiple of our stop loss. In my experience, this creates a risk/reward
ratio of 1:4 in our favour, which is optimal.
We can apply the same reasoning to signals generated by the Kumo. In other words, if the signal is generated
by the Senkou Span A and Senkou Span B lines, the stop loss is placed on the opposite side of the Kumo:

39CFDs are complex instruments and come with a high risk of losing money rapidly due to leverage. 78% of retail investor accounts lose money when trading CFDs with this provider. You should consider whether you understand how CFDs work and whether you can afford to take the high risk of losing your money.
38
In this case we also look for a favourable risk/reward ratio and set our TP at 4xSL.
I have now described the basics of the Ichimoku strategy, so I hope for you that this is the beginning of a
long journey as a profitable trader. But remember that in trading, on top of a good strategy, good money
management is crucial. And the risk/reward ratio I suggested is a great place to start.
NEXT STEPS – START TRADING WITH SWISSQUOTE
Swissquote is regularly quoted and consulted by global financial media.
Go to swissquote.co.uk/forex
Open a demo account.
You can practice Forex tradingwith USD 100’000 virtual money.
No risk & no obligation.
Why trade with Swissquote group?
• 25 years of online trading expertise
• Trusted by +487‘000 traders worldwide
• Multilingual Customer Support
• Exclusive market research with daily & weekly reports
• Global Liquidity & Precise Execution
• Segregated accounts
• International Group listed on the SIX Swiss Exchange (SIX:SQN)
1
2
3
02 –
22| E
N
Try a demo now!

40
swissquote.co.uk/education
Geneva - Zurich - Bern - London - Luxembourg - Malta - Dubai - Singapore - Hong Kong
Related Documents