INTERNATIONAL CONFERENCE ON HARMONISATION OF TECHNICAL REQUIREMENTS FOR REGISTRATION OF PHARMACEUTICALS FOR HUMAN USE ICH HARMONISED TRIPARTITE GUIDELINE PHARMACEUTICAL DEVELOPMENT Q8(R2) Current Step 4 version dated August 2009 This Guideline has been developed by the appropriate ICH Expert Working Group and has been subject to consultation by the regulatory parties, in accordance with the ICH Process. At Step 4 of the Process the final draft is recommended for adoption to the regulatory bodies of the European Union, Japan and USA.

Welcome message from author
This document is posted to help you gain knowledge. Please leave a comment to let me know what you think about it! Share it to your friends and learn new things together.
Transcript

INTERNATIONAL CONFERENCE ON HARMONISATION OF TECHNICAL
REQUIREMENTS FOR REGISTRATION OF PHARMACEUTICALS FOR HUMAN USE
ICH HARMONISED TRIPARTITE GUIDELINE
PHARMACEUTICAL DEVELOPMENT
Q8(R2)
Current Step 4 version
dated August 2009
This Guideline has been developed by the appropriate ICH Expert Working Group
and has been subject to consultation by the regulatory parties, in accordance with the
ICH Process. At Step 4 of the Process the final draft is recommended for adoption to
the regulatory bodies of the European Union, Japan and USA.

Q8(R2)
Document History
First
Codification History Date
Parent Guideline: Pharmaceutical Development
Q8 Approval of the Guideline by the Steering Committee under
Step 2 and release for public consultation.
18
November
2004
Q8 Approval of the Guideline by the Steering Committee under
Step 4 and recommendation for adoption to the three ICH
regulatory bodies.
10
November
2005
Annex to the Parent Guideline: Pharmaceutical Development
Annex to Q8 Approval of the Annex by the Steering Committee under Step
2 and release for public consultation.
1
November
2007
Annex to Q8 Approval of the Annex by the Steering Committee under Step
4 and recommendation for adoption to the three ICH
regulatory bodies.
13
November
2008
Addition of Annex to the Parent Guideline
Q8(R1) The parent guideline “Pharmaceutical Development” was
recoded Q8(R1) following the addition of the Annex to the
parent guideline.
November
2008
Current Step 4 version
Q8(R2) Corrigendum to titles of “Figure 2a” and “Figure 2b” of
“Example 2” on page 23.
August
2009

i
PHARMACEUTICAL DEVELOPMENT
ICH Harmonised Tripartite Guideline
TABLE OF CONTENTS
PART I:
PHARMACEUTICAL DEVELOPMENT
1. INTRODUCTION.................................................................................................. 1
1.1 Objective of the Guideline ........................................................................................1
1.2 Scope .........................................................................................................................1
2. PHARMACEUTICAL DEVELOPMENT............................................................ 1
2.1 Components of the Drug Product.............................................................................3
2.1.1 Drug Substance ............................................................................................ 3
2.1.2 Excipients ..................................................................................................... 3
2.2 Drug Product ............................................................................................................3
2.2.1 Formulation Development............................................................................ 3
2.2.2 Overages ....................................................................................................... 4
2.2.3 Physicochemical and Biological Properties ................................................. 4
2.3 Manufacturing Process Development ......................................................................5
2.4 Container Closure System........................................................................................6
2.5 Microbiological Attributes ........................................................................................6
2.6 Compatibility ............................................................................................................7
3. GLOSSARY ............................................................................................................ 7
PART II:
ANNEX TO PHARMACEUTICAL DEVELOPMENT
1. INTRODUCTION.................................................................................................. 9
2. ELEMENTS OF PHARMACEUTICAL DEVELOPMENT ............................ 10
2.1 Quality Target Product Profile...............................................................................10
2.2 Critical Quality Attributes .....................................................................................11
2.3 Risk Assessment: Linking Material Attributes and Process Parameters to Drug
Product CQAs .........................................................................................................11

ii
2.4 Design Space...........................................................................................................12
2.4.1 Selection of Variables ................................................................................. 12
2.4.2 Describing a Design Space in a Submission.............................................. 12
2.4.3 Unit Operation Design Space(s)................................................................. 12
2.4.4 Relationship of Design Space to Scale and Equipment............................. 12
2.4.5 Design Space Versus Proven Acceptable Ranges ....................................... 13
2.4.6 Design Space and Edge of Failure ............................................................. 13
2.5 Control Strategy .....................................................................................................13
2.6 Product Lifecycle Management and Continual Improvement...............................14
3. SUBMISSION OF PHARMACEUTICAL DEVELOPMENT AND RELATED
INFORMATION IN COMMON TECHNICAL DOCUMENTS (CTD)
FORMAT .............................................................................................................. 14
3.1 Quality Risk Management and Product and Process Development......................15
3.2 Design Space...........................................................................................................15
3.3 Control Strategy .....................................................................................................15
3.4 Drug Substance Related Information ....................................................................15
4. GLOSSARY .......................................................................................................... 16
Appendix 1. Differing Approaches to Pharmaceutical Development ...................................18
Appendix 2. Illustrative Examples........................................................................................19

1
PART I:
PHARMACEUTICAL DEVELOPMENT
ICH Harmonised Tripartite Guideline
Having reached Step 4 of the ICH Process at the ICH Steering Committee meeting
on 10 November 2005, this guideline is recommended for
adoption to the three regulatory parties to ICH
1. INTRODUCTION
1.1 Objective of the Guideline
This guideline describes the suggested contents for the 3.2.P.2 (Pharmaceutical
Development) section of a regulatory submission in the ICH M4 Common Technical
Document (CTD) format.
The Pharmaceutical Development section provides an opportunity to present the
knowledge gained through the application of scientific approaches and quality risk
management (for definition, see ICH Q9) to the development of a product and its
manufacturing process. It is first produced for the original marketing application and
can be updated to support new knowledge gained over the lifecycle* of a product. The
Pharmaceutical Development section is intended to provide a comprehensive
understanding of the product and manufacturing process for reviewers and
inspectors. The guideline also indicates areas where the demonstration of greater
understanding of pharmaceutical and manufacturing sciences can create a basis for
flexible regulatory approaches. The degree of regulatory flexibility is predicated on
the level of relevant scientific knowledge provided.
1.2 Scope
This guideline is intended to provide guidance on the contents of Section 3.2.P.2
(Pharmaceutical Development) for drug products as defined in the scope of Module 3
of the Common Technical Document (ICH guideline M4). The guideline does not apply
to contents of submissions for drug products during the clinical research stages of
drug development. However, the principles in this guideline are important to consider
during those stages as well. This guideline might also be appropriate for other types
of products. To determine the applicability of this guideline to a particular type of
product, applicants can consult with the appropriate regulatory authorities.
2. PHARMACEUTICAL DEVELOPMENT
The aim of pharmaceutical development is to design a quality product and its
manufacturing process to consistently deliver the intended performance of the
product. The information and knowledge gained from pharmaceutical development
studies and manufacturing experience provide scientific understanding to support the
establishment of the design space*, specifications, and manufacturing controls.
Information from pharmaceutical development studies can be a basis for quality risk
management. It is important to recognize that quality* cannot be tested into products;
* See Glossary for definition

Pharmaceutical Development
2
i.e., quality should be built in by design. Changes in formulation and manufacturing
processes during development and lifecycle management should be looked upon as
opportunities to gain additional knowledge and further support establishment of the
design space. Similarly, inclusion of relevant knowledge gained from experiments
giving unexpected results can also be useful. Design space is proposed by the
applicant and is subject to regulatory assessment and approval. Working within the
design space is not considered as a change. Movement out of the design space is
considered to be a change and would normally initiate a regulatory post approval
change process.
The Pharmaceutical Development section should describe the knowledge that
establishes that the type of dosage form selected and the formulation proposed are
suitable for the intended use. This section should include sufficient information in
each part to provide an understanding of the development of the drug product and its
manufacturing process. Summary tables and graphs are encouraged where they add
clarity and facilitate review.
At a minimum, those aspects of drug substances, excipients, container closure
systems, and manufacturing processes that are critical to product quality should be
determined and control strategies justified. Critical formulation attributes and
process parameters are generally identified through an assessment of the extent to
which their variation can have impact on the quality of the drug product.
In addition, the applicant can choose to conduct pharmaceutical development studies
that can lead to an enhanced knowledge of product performance over a wider range of
material attributes, processing options and process parameters. Inclusion of this
additional information in this section provides an opportunity to demonstrate a
higher degree of understanding of material attributes, manufacturing processes and
their controls. This scientific understanding facilitates establishment of an expanded
design space. In these situations, opportunities exist to develop more flexible
regulatory approaches, for example, to facilitate:
• risk-based regulatory decisions (reviews and inspections);
• manufacturing process improvements, within the approved design space
described in the dossier, without further regulatory review;
• reduction of post-approval submissions;
• real-time quality control, leading to a reduction of end-product release testing.
To realise this flexibility, the applicant should demonstrate an enhanced knowledge of
product performance over a range of material attributes, manufacturing process
options and process parameters. This understanding can be gained by application of,
for example, formal experimental designs*, process analytical technology (PAT)*,
and/or prior knowledge. Appropriate use of quality risk management principles can be
helpful in prioritising the additional pharmaceutical development studies to collect
such knowledge.
The design and conduct of pharmaceutical development studies should be consistent
with their intended scientific purpose. It should be recognized that the level of
* See Glossary for definition

Pharmaceutical Development
3
knowledge gained, and not the volume of data, provides the basis for science-based
submissions and their regulatory evaluation.
2.1 Components of the Drug Product
2.1.1 Drug Substance
The physicochemical and biological properties of the drug substance that can
influence the performance of the drug product and its manufacturability, or were
specifically designed into the drug substance (e.g., solid state properties), should be
identified and discussed. Examples of physicochemical and biological properties that
might need to be examined include solubility, water content, particle size, crystal
properties, biological activity, and permeability. These properties could be inter-
related and might need to be considered in combination.
To evaluate the potential effect of drug substance physicochemical properties on the
performance of the drug product, studies on drug product might be warranted. For
example, the ICH Q6A Specifications: Test Procedures and Acceptance Criteria for
New Drug Substances and New Drug Products: Chemical Substances describes some
of the circumstances in which drug product studies are recommended (e.g., Decision
Tree #3 and #4 (Part 2)). This approach applies equally for the ICH Q6B
Specifications: Test Procedures and Acceptance Criteria for Biotechnology/Biological
Products. The knowledge gained from the studies investigating the potential effect of
drug substance properties on drug product performance can be used, as appropriate,
to justify elements of the drug substance specification (3.2.S.4.5).
The compatibility of the drug substance with excipients listed in 3.2.P.1 should be
evaluated. For products that contain more than one drug substance, the compatibility
of the drug substances with each other should also be evaluated.
2.1.2 Excipients
The excipients chosen, their concentration, and the characteristics that can influence
the drug product performance (e.g., stability, bioavailability) or manufacturability
should be discussed relative to the respective function of each excipient. This should
include all substances used in the manufacture of the drug product, whether they
appear in the finished product or not (e.g., processing aids). Compatibility of
excipients with other excipients, where relevant (for example, combination of
preservatives in a dual preservative system), should be established. The ability of
excipients (e.g., antioxidants, penetration enhancers, disintegrants, release
controlling agents) to provide their intended functionality, and to perform throughout
the intended drug product shelf life, should also be demonstrated. The information on
excipient performance can be used, as appropriate, to justify the choice and quality
attributes of the excipient, and to support the justification of the drug product
specification (3.2.P.5.6).
Information to support the safety of excipients, when appropriate, should be cross-
referenced (3.2.P.4.6).
2.2 Drug Product
2.2.1 Formulation Development
A summary should be provided describing the development of the formulation,
including identification of those attributes that are critical to the quality of the drug

Pharmaceutical Development
4
product, taking into consideration intended usage and route of administration.
Information from formal experimental designs can be useful in identifying critical or
interacting variables that might be important to ensure the quality of the drug
product.
The summary should highlight the evolution of the formulation design from initial
concept up to the final design. This summary should also take into consideration the
choice of drug product components (e.g., the properties of the drug substance,
excipients, container closure system, any relevant dosing device), the manufacturing
process, and, if appropriate, knowledge gained from the development of similar drug
product(s).
Any excipient ranges included in the batch formula (3.2.P.3.2) should be justified in
this section of the application; this justification can often be based on the experience
gained during development or manufacture.
A summary of formulations used in clinical safety and efficacy and in any relevant
bioavailability or bioequivalence studies should be provided. Any changes between the
proposed commercial formulation and those formulations used in pivotal clinical
batches and primary stability batches should be clearly described and the rationale
for the changes provided.
Information from comparative in vitro studies (e.g., dissolution) or comparative in
vivo studies (e.g., bioequivalence) that links clinical formulations to the proposed
commercial formulation described in 3.2.P.1 should be summarized and a cross-
reference to the studies (with study numbers) should be provided. Where attempts
have been made to establish an in vitro/in vivo correlation, the results of those
studies, and a cross-reference to the studies (with study numbers), should be provided
in this section. A successful correlation can assist in the selection of appropriate
dissolution acceptance criteria, and can potentially reduce the need for further
bioequivalence studies following changes to the product or its manufacturing process.
Any special design features of the drug product (e.g., tablet score line, overfill, anti-
counterfeiting measure as it affects the drug product) should be identified and a
rationale provided for their use.
2.2.2 Overages
In general, use of an overage of a drug substance to compensate for degradation
during manufacture or a product’s shelf life, or to extend shelf life, is discouraged.
Any overages in the manufacture of the drug product, whether they appear in the
final formulated product or not, should be justified considering the safety and efficacy
of the product. Information should be provided on the 1) amount of overage, 2) reason
for the overage (e.g., to compensate for expected and documented manufacturing
losses), and 3) justification for the amount of overage. The overage should be included
in the amount of drug substance listed in the batch formula (3.2.P.3.2).
2.2.3 Physicochemical and Biological Properties
The physicochemical and biological properties relevant to the safety, performance or
manufacturability of the drug product should be identified and discussed. This
includes the physiological implications of drug substance and formulation attributes.
Studies could include, for example, the development of a test for respirable fraction of
an inhaled product. Similarly, information supporting the selection of dissolution vs.

Pharmaceutical Development
5
disintegration testing, or other means to assure drug release, and the development
and suitability of the chosen test, could be provided in this section. See also ICH Q6A
Specifications: Test Procedures And Acceptance Criteria For New Drug Substances
And New Drug Products: Chemical Substances; Decision Tree #4 (Part 3) and Decision
Tree #7 (Part 1) or ICH Q6B Specifications: Test Procedures and Acceptance Criteria
for Biotechnology/Biological Products. The discussion should cross-reference any
relevant stability data in 3.2.P.8.3.
2.3 Manufacturing Process Development
The selection, the control, and any improvement of the manufacturing process
described in 3.2.P.3.3 (i.e., intended for commercial production batches) should be
explained. It is important to consider the critical formulation attributes, together with
the available manufacturing process options, in order to address the selection of the
manufacturing process and confirm the appropriateness of the components.
Appropriateness of the equipment used for the intended products should be discussed.
Process development studies should provide the basis for process improvement,
process validation, continuous process verification* (where applicable), and any
process control requirements. Where appropriate, such studies should address
microbiological as well as physical and chemical attributes. The knowledge gained
from process development studies can be used, as appropriate, to justify the drug
product specification (3.2.P.5.6).
The manufacturing process development programme or process improvement
programme should identify any critical process parameters that should be monitored
or controlled (e.g., granulation end point) to ensure that the product is of the desired
quality.
For those products intended to be sterile an appropriate method of sterilization for the
drug product and primary packaging material should be chosen and the choice
justified.
Significant differences between the manufacturing processes used to produce batches
for pivotal clinical trials (safety, efficacy, bioavailability, bioequivalence) or primary
stability studies and the process described in 3.2.P.3.3 should be discussed. The
discussion should summarise the influence of the differences on the performance,
manufacturability and quality of the product. The information should be presented in
a way that facilitates comparison of the processes and the corresponding batch
analyses information (3.2.P.5.4). The information should include, for example, (1) the
identity (e.g., batch number) and use of the batches produced (e.g., bioequivalence
study batch number), (2) the manufacturing site, (3) the batch size, and (4) any
significant equipment differences (e.g., different design, operating principle, size).
In order to provide flexibility for future process improvement, when describing the
development of the manufacturing process, it is useful to describe measurement
systems that allow monitoring of critical attributes or process end-points. Collection of
process monitoring data during the development of the manufacturing process can
provide useful information to enhance process understanding. The process control
strategies that provide process adjustment capabilities to ensure control of all critical
attributes should be described.
* See Glossary for definition

Pharmaceutical Development
6
An assessment of the ability of the process to reliably produce a product of the
intended quality (e.g., the performance of the manufacturing process under different
operating conditions, at different scales, or with different equipment) can be provided.
An understanding of process robustness* can be useful in risk assessment and risk
reduction (see ICH Q9 Quality Risk Management glossary for definition) and to
support future manufacturing and process improvement, especially in conjunction
with the use of risk management tools (see ICH Q9 Quality Risk Management).
2.4 Container Closure System
The choice and rationale for selection of the container closure system for the
commercial product (described in 3.2.P.7) should be discussed. Consideration should
be given to the intended use of the drug product and the suitability of the container
closure system for storage and transportation (shipping), including the storage and
shipping container for bulk drug product, where appropriate.
The choice of materials for primary packaging should be justified. The discussion
should describe studies performed to demonstrate the integrity of the container and
closure. A possible interaction between product and container or label should be
considered.
The choice of primary packaging materials should consider, e.g., choice of materials,
protection from moisture and light, compatibility of the materials of construction with
the dosage form (including sorption to container and leaching), and safety of materials
of construction. Justification for secondary packaging materials should be included,
when relevant.
If a dosing device is used (e.g., dropper pipette, pen injection device, dry powder
inhaler), it is important to demonstrate that a reproducible and accurate dose of the
product is delivered under testing conditions which, as far as possible, simulate the
use of the product.
2.5 Microbiological Attributes
Where appropriate, the microbiological attributes of the drug product should be
discussed in this section (3.2.P.2.5). The discussion should include, for example:
• The rationale for performing or not performing microbial limits testing for non
sterile drug products (e.g., Decision Tree #8 in ICH Q6A Specifications: Test
Procedures and Acceptance Criteria for New Drug Substances and New Drug
Products: Chemical Substances and ICH Q6B Specifications: Test Procedures
and Acceptance Criteria for Biotechnology/Biological Products);
• The selection and effectiveness of preservative systems in products containing
antimicrobial preservative or the antimicrobial effectiveness of products that
are inherently antimicrobial;
• For sterile products, the integrity of the container closure system as it relates
to preventing microbial contamination.
Although chemical testing for preservative content is the attribute normally included
in the drug product specification, antimicrobial preservative effectiveness should be
demonstrated during development. The lowest specified concentration of
antimicrobial preservative should be demonstrated to be effective in controlling micro-
* See Glossary for definition

Pharmaceutical Development
7
organisms by using an antimicrobial preservative effectiveness test. The
concentration used should be justified in terms of efficacy and safety, such that the
minimum concentration of preservative that gives the required level of efficacy
throughout the intended shelf life of the product is used. Where relevant, microbial
challenge testing under testing conditions that, as far as possible, simulate patient
use should be performed during development and documented in this section.
2.6 Compatibility
The compatibility of the drug product with reconstitution diluents (e.g., precipitation,
stability) should be addressed to provide appropriate and supportive information for
the labelling. This information should cover the recommended in-use shelf life, at the
recommended storage temperature and at the likely extremes of concentration.
Similarly, admixture or dilution of products prior to administration (e.g., product
added to large volume infusion containers) might need to be addressed.
3. GLOSSARY
Continuous Process Verification:
An alternative approach to process validation in which manufacturing process
performance is continuously monitored and evaluated.
Design Space:
The multidimensional combination and interaction of input variables (e.g., material
attributes) and process parameters that have been demonstrated to provide assurance
of quality. Working within the design space is not considered as a change. Movement
out of the design space is considered to be a change and would normally initiate a
regulatory post approval change process. Design space is proposed by the applicant
and is subject to regulatory assessment and approval.
Formal Experimental Design:
A structured, organized method for determining the relationship between factors
affecting a process and the output of that process. Also known as “Design of
Experiments”.
Lifecycle:
All phases in the life of a product from the initial development through marketing
until the product’s discontinuation.
Process Analytical Technology (PAT):
A system for designing, analyzing, and controlling manufacturing through timely
measurements (i.e., during processing) of critical quality and performance attributes
of raw and in-process materials and processes with the goal of ensuring final product
quality.
Process Robustness:
Ability of a process to tolerate variability of materials and changes of the process and
equipment without negative impact on quality.

Pharmaceutical Development
8
Quality:
The suitability of either a drug substance or drug product for its intended use. This
term includes such attributes as the identity, strength, and purity (from ICH Q6A
Specifications: Test Procedures and Acceptance Criteria for New Drug Substances and
New Drug Products: Chemical Substances).

9
PART II:
PHARMACEUTICAL DEVELOPMENT - ANNEX
ICH Harmonised Tripartite Guideline
Having reached Step 4 of the ICH Process at the ICH Steering Committee meeting
on 13 November 2008, this guideline is recommended for
adoption to the three regulatory parties to ICH
1. INTRODUCTION
This guideline is an annex to ICH Q8 Pharmaceutical Development and provides
further clarification of key concepts outlined in the core guideline. In addition, this
annex describes the principles of quality by design1 (QbD). The annex is not intended
to establish new standards or to introduce new regulatory requirements; however, it
shows how concepts and tools (e.g., design space1) outlined in the parent Q8 document
could be put into practice by the applicant for all dosage forms. Where a company
chooses to apply quality by design and quality risk management (ICH Q9, Quality
Risk Management), linked to an appropriate pharmaceutical quality system,
opportunities arise to enhance science- and risk-based regulatory approaches (see ICH
Q10, Pharmaceutical Quality System).
Approaches to Pharmaceutical Development
In all cases, the product should be designed to meet patients’ needs and the intended
product performance. Strategies for product development vary from company to
company and from product to product. The approach to, and extent of, development
can also vary and should be outlined in the submission. An applicant might choose
either an empirical approach or a more systematic approach to product development,
or a combination of both. An illustration of the potential contrasts of these approaches
is shown in Appendix 1. A more systematic approach to development (also defined as
quality by design) can include, for example, incorporation of prior knowledge, results
of studies using design of experiments, use of quality risk management, and use of
knowledge management (see ICH Q10) throughout the lifecycle1 of the product. Such
a systematic approach can enhance achieving the desired quality of the product and
help the regulators to better understand a company’s strategy. Product and process
understanding can be updated with the knowledge gained over the product lifecycle.
A greater understanding of the product and its manufacturing process can create a
basis for more flexible regulatory approaches. The degree of regulatory flexibility is
predicated on the level of relevant scientific knowledge provided in the registration
application. It is the knowledge gained and submitted to the authorities, and not the
volume of data collected, that forms the basis for science- and risk-based submissions
and regulatory evaluations. Nevertheless, appropriate data demonstrating that this
knowledge is based on sound scientific principles should be presented with each
application.
Pharmaceutical development should include, at a minimum, the following elements:
1
See glossary

Pharmaceutical Development
10
• Defining the quality target product profile1 (QTPP) as it relates to quality,
safety and efficacy, considering e.g., the route of administration, dosage form,
bioavailability, strength, and stability;
• Identifying potential critical quality attributes1 (CQAs) of the drug product, so
that those product characteristics having an impact on product quality can be
studied and controlled;
• Determining the critical quality attributes of the drug substance, excipients
etc., and selecting the type and amount of excipients to deliver drug product of
the desired quality1;
• Selecting an appropriate manufacturing process ;
• Defining a control strategy1.
An enhanced, quality by design approach to product development would additionally
include the following elements:
• A systematic evaluation, understanding and refining of the formulation and
manufacturing process, including;
o Identifying, through e.g., prior knowledge, experimentation, and risk
assessment, the material attributes and process parameters that can
have an effect on product CQAs;
o Determining the functional relationships that link material attributes
and process parameters to product CQAs;
• Using the enhanced product and process understanding in combination with
quality risk management to establish an appropriate control strategy which
can, for example, include a proposal for a design space(s) and/or real-time
release testing1.
As a result, this more systematic approach could facilitate continual improvement and
innovation throughout the product lifecycle (See ICH Q10).
2. ELEMENTS OF PHARMACEUTICAL DEVELOPMENT
The section that follows elaborates on possible approaches to gaining a more
systematic, enhanced understanding of the product and process under development.
The examples given are purely illustrative and are not intended to create new
regulatory requirements.
2.1 Quality Target Product Profile
The quality target product profile forms the basis of design for the development of the
product. Considerations for the quality target product profile could include:
• Intended use in clinical setting, route of administration, dosage form, delivery
systems;
• Dosage strength(s);
• Container closure system;
1
See glossary

Pharmaceutical Development
11
• Therapeutic moiety release or delivery and attributes affecting
pharmacokinetic characteristics (e.g., dissolution, aerodynamic performance)
appropriate to the drug product dosage form being developed;
• Drug product quality criteria (e.g., sterility, purity, stability and drug release)
appropriate for the intended marketed product.
2.2 Critical Quality Attributes
A CQA is a physical, chemical, biological, or microbiological property or characteristic
that should be within an appropriate limit, range, or distribution to ensure the
desired product quality. CQAs are generally associated with the drug substance,
excipients, intermediates (in-process materials) and drug product.
CQAs of solid oral dosage forms are typically those aspects affecting product purity,
strength, drug release and stability. CQAs for other delivery systems can additionally
include more product specific aspects, such as aerodynamic properties for inhaled
products, sterility for parenterals, and adhesion properties for transdermal patches.
For drug substances, raw materials and intermediates, the CQAs can additionally
include those properties (e.g., particle size distribution, bulk density) that affect drug
product CQAs.
Potential drug product CQAs derived from the quality target product profile and/or
prior knowledge are used to guide the product and process development. The list of
potential CQAs can be modified when the formulation and manufacturing process are
selected and as product knowledge and process understanding increase. Quality risk
management can be used to prioritize the list of potential CQAs for subsequent
evaluation. Relevant CQAs can be identified by an iterative process of quality risk
management and experimentation that assesses the extent to which their variation
can have an impact on the quality of the drug product.
2.3 Risk Assessment: Linking Material Attributes and Process Parameters
to Drug Product CQAs
Risk assessment is a valuable science-based process used in quality risk management
(see ICH Q9) that can aid in identifying which material attributes and process
parameters potentially have an effect on product CQAs. Risk assessment is typically
performed early in the pharmaceutical development process and is repeated as more
information becomes available and greater knowledge is obtained.
Risk assessment tools can be used to identify and rank parameters (e.g., process,
equipment, input materials) with potential to have an impact on product quality,
based on prior knowledge and initial experimental data. For an illustrative example,
see Appendix 2. The initial list of potential parameters can be quite extensive, but can
be modified and prioritized by further studies (e.g., through a combination of design of
experiments, mechanistic models). The list can be refined further through
experimentation to determine the significance of individual variables and potential
interactions. Once the significant parameters are identified, they can be further
studied (e.g., through a combination of design of experiments, mathematical models,
or studies that lead to mechanistic understanding) to achieve a higher level of process
understanding.

Pharmaceutical Development
12
2.4 Design Space
The relationship between the process inputs (material attributes and process
parameters) and the critical quality attributes can be described in the design space
(see examples in Appendix 2).
2.4.1 Selection of Variables
The risk assessment and process development experiments described in Section 2.3
can lead to an understanding of the linkage and effect of process parameters and
material attributes on product CQAs, and also help identify the variables and their
ranges within which consistent quality can be achieved. These process parameters
and material attributes can thus be selected for inclusion in the design space.
A description should be provided in the application of the process parameters and
material attributes considered for the design space, those that were included, and
their effect on product quality. The rationale for inclusion in the design space should
be presented. In some cases it is helpful to provide also the rationale as to why some
parameters were excluded. Knowledge gained from studies should be described in the
submission. Process parameters and material attributes that were not varied through
development should be highlighted.
2.4.2 Describing a Design Space in a Submission
A design space can be described in terms of ranges of material attributes and process
parameters, or through more complex mathematical relationships. It is possible to
describe a design space as a time dependent function (e.g., temperature and pressure
cycle of a lyophilisation cycle), or as a combination of variables such as components of
a multivariate model. Scaling factors can also be included if the design space is
intended to span multiple operational scales. Analysis of historical data can
contribute to the establishment of a design space. Regardless of how a design space is
developed, it is expected that operation within the design space will result in a
product meeting the defined quality.
Examples of different potential approaches to presentation of a design space are
presented in Appendix 2.
2.4.3 Unit Operation Design Space(s)
The applicant can choose to establish independent design spaces for one or more unit
operations, or to establish a single design space that spans multiple operations. While
a separate design space for each unit operation is often simpler to develop, a design
space that spans the entire process can provide more operational flexibility. For
example, in the case of a drug product that undergoes degradation in solution before
lyophilisation, the design space to control the extent of degradation (e.g.,
concentration, time, temperature) could be expressed for each unit operation or as a
sum over all unit operations.
2.4.4 Relationship of Design Space to Scale and Equipment
When describing a design space, the applicant should consider the type of operational
flexibility desired. A design space can be developed at any scale. The applicant should
justify the relevance of a design space developed at small or pilot scale to the proposed
production scale manufacturing process and discuss the potential risks in the scale-up
operation.

Pharmaceutical Development
13
If the applicant proposes the design space to be applicable to multiple operational
scales, the design space should be described in terms of relevant scale-independent
parameters. For example, if a product was determined to be shear sensitive in a
mixing operation, the design space could include shear rate, rather than agitation
rate. Dimensionless numbers and/or models for scaling can be included as part of the
design space description.
2.4.5 Design Space Versus Proven Acceptable Ranges
A combination of proven acceptable ranges1 does not constitute a design space.
However, proven acceptable ranges based on univariate experimentation can provide
useful knowledge about the process.
2.4.6 Design Space and Edge of Failure
It can be helpful to determine the edge of failure for process parameters or material
attributes, beyond which the relevant quality attributes cannot be met. However,
determining the edge of failure or demonstrating failure modes are not essential parts
of establishing a design space.
2.5 Control Strategy
A control strategy is designed to ensure that a product of required quality will be
produced consistently. The elements of the control strategy discussed in Section P.2 of
the dossier should describe and justify how in-process controls and the controls of
input materials (drug substance and excipients), intermediates (in-process materials),
container closure system, and drug products contribute to the final product quality.
These controls should be based on product, formulation and process understanding
and should include, at a minimum, control of the critical process parameters1 and
material attributes.
A comprehensive pharmaceutical development approach will generate process and
product understanding and identify sources of variability. Sources of variability that
can impact product quality should be identified, appropriately understood, and
subsequently controlled. Understanding sources of variability and their impact on
downstream processes or processing, in-process materials, and drug product quality
can provide an opportunity to shift controls upstream and minimise the need for end
product testing. Product and process understanding, in combination with quality risk
management (see ICH Q9), will support the control of the process such that the
variability (e.g., of raw materials) can be compensated for in an adaptable manner to
deliver consistent product quality.
This process understanding can enable an alternative manufacturing paradigm where
the variability of input materials could be less tightly constrained. Instead it can be
possible to design an adaptive process step (a step that is responsive to the input
materials) with appropriate process control to ensure consistent product quality.
Enhanced understanding of product performance can justify the use of alternative
approaches to determine that the material is meeting its quality attributes. The use of
such alternatives could support real time release testing. For example, disintegration
could serve as a surrogate for dissolution for fast-disintegrating solid forms with
highly soluble drug substances. Unit dose uniformity performed in-process (e.g., using
1
See glossary
Pharmaceutical Development
14
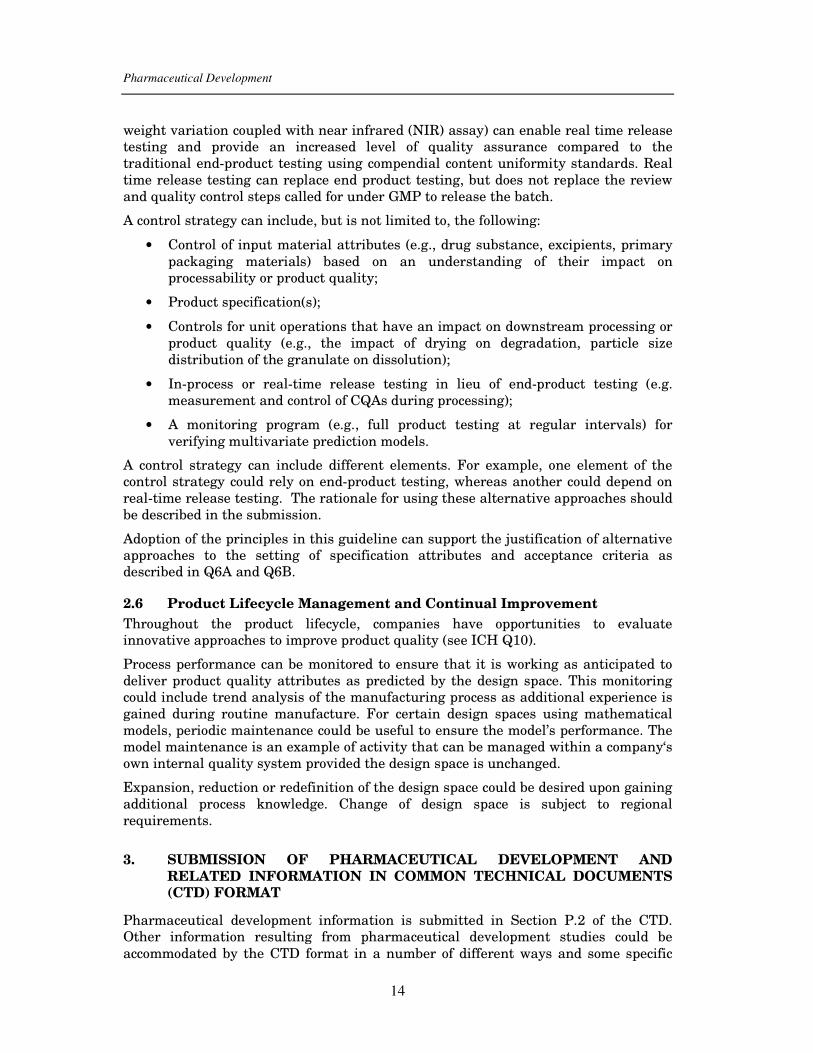
weight variation coupled with near infrared (NIR) assay) can enable real time release
testing and provide an increased level of quality assurance compared to the
traditional end-product testing using compendial content uniformity standards. Real
time release testing can replace end product testing, but does not replace the review
and quality control steps called for under GMP to release the batch.
A control strategy can include, but is not limited to, the following:
• Control of input material attributes (e.g., drug substance, excipients, primary
packaging materials) based on an understanding of their impact on
processability or product quality;
• Product specification(s);
• Controls for unit operations that have an impact on downstream processing or
product quality (e.g., the impact of drying on degradation, particle size
distribution of the granulate on dissolution);
• In-process or real-time release testing in lieu of end-product testing (e.g.
measurement and control of CQAs during processing);
• A monitoring program (e.g., full product testing at regular intervals) for
verifying multivariate prediction models.
A control strategy can include different elements. For example, one element of the
control strategy could rely on end-product testing, whereas another could depend on
real-time release testing. The rationale for using these alternative approaches should
be described in the submission.
Adoption of the principles in this guideline can support the justification of alternative
approaches to the setting of specification attributes and acceptance criteria as
described in Q6A and Q6B.
2.6 Product Lifecycle Management and Continual Improvement
Throughout the product lifecycle, companies have opportunities to evaluate
innovative approaches to improve product quality (see ICH Q10).
Process performance can be monitored to ensure that it is working as anticipated to
deliver product quality attributes as predicted by the design space. This monitoring
could include trend analysis of the manufacturing process as additional experience is
gained during routine manufacture. For certain design spaces using mathematical
models, periodic maintenance could be useful to ensure the model’s performance. The
model maintenance is an example of activity that can be managed within a company‘s
own internal quality system provided the design space is unchanged.
Expansion, reduction or redefinition of the design space could be desired upon gaining
additional process knowledge. Change of design space is subject to regional
requirements.
3. SUBMISSION OF PHARMACEUTICAL DEVELOPMENT AND
RELATED INFORMATION IN COMMON TECHNICAL DOCUMENTS
(CTD) FORMAT
Pharmaceutical development information is submitted in Section P.2 of the CTD.
Other information resulting from pharmaceutical development studies could be
accommodated by the CTD format in a number of different ways and some specific

Pharmaceutical Development
15
suggestions are provided below. However, the applicant should clearly indicate where
the different information is located. In addition to what is submitted in the
application, certain aspects (e.g., product lifecycle management, continual
improvement) of this guideline are handled under the applicant’s pharmaceutical
quality system (see ICH Q10).
3.1 Quality Risk Management and Product and Process Development
Quality risk management can be used at different stages during product and process
development and manufacturing implementation. The assessments used to guide and
justify development decisions can be included in the relevant sections of P.2. For
example, risk analyses and functional relationships linking material attributes and
process parameters to product CQAs can be included in P.2.1, P.2.2, and P.2.3. Risk
analyses linking the design of the manufacturing process to product quality can be
included in P.2.3.
3.2 Design Space
As an element of the proposed manufacturing process, the design space(s) can be
described in the section of the application that includes the description of the
manufacturing process and process controls (P.3.3). If appropriate, additional
information can be provided in the section of the application that addresses the
controls of critical steps and intermediates (P.3.4). The product and manufacturing
process development sections of the application (P.2.1, P.2.2, and P.2.3) are
appropriate places to summarise and describe product and process development
studies that provide the basis for the design space(s). The relationship of the design
space(s) to the overall control strategy can be discussed in the section of the
application that includes the justification of the drug product specification (P.5.6).
3.3 Control Strategy
The section of the application that includes the justification of the drug product
specification (P.5.6) is a good place to summarise the overall drug product control
strategy. However, detailed information about input material controls and process
controls should still be provided in the appropriate CTD format sections (e.g., drug
substance section (S), control of excipients (P.4), description of manufacturing process
and process controls (P.3.3), controls of critical steps and intermediates (P.3.4)).
3.4 Drug Substance Related Information
If drug substance CQAs have the potential to affect the CQAs or manufacturing
process of the drug product, some discussion of drug substance CQAs can be
appropriate in the pharmaceutical development section of the application (e.g., P.2.1).

Pharmaceutical Development
16
4. GLOSSARY
Control Strategy:
A planned set of controls, derived from current product and process understanding
that ensures process performance and product quality. The controls can include
parameters and attributes related to drug substance and drug product materials and
components, facility and equipment operating conditions, in-process controls, finished
product specifications, and the associated methods and frequency of monitoring and
control. (ICH Q10)
Critical Process Parameter (CPP):
A process parameter whose variability has an impact on a critical quality attribute
and therefore should be monitored or controlled to ensure the process produces the
desired quality.
Critical Quality Attribute (CQA):
A physical, chemical, biological or microbiological property or characteristic that
should be within an appropriate limit, range, or distribution to ensure the desired
product quality.
Design Space:
The multidimensional combination and interaction of input variables (e.g., material
attributes) and process parameters that have been demonstrated to provide assurance
of quality. Working within the design space is not considered as a change. Movement
out of the design space is considered to be a change and would normally initiate a
regulatory post approval change process. Design space is proposed by the applicant
and is subject to regulatory assessment and approval (ICH Q8).
Lifecycle:
All phases in the life of a product from the initial development through marketing
until the product’s discontinuation (ICH Q8).
Proven Acceptable Range:
A characterised range of a process parameter for which operation within this range,
while keeping other parameters constant, will result in producing a material meeting
relevant quality criteria.
Quality:
The suitability of either a drug substance or a drug product for its intended use. This term includes such attributes as the identity, strength, and purity (ICH Q6A).
Quality by Design (QbD):
A systematic approach to development that begins with predefined objectives and
emphasizes product and process understanding and process control, based on sound
science and quality risk management.
Quality Target Product Profile (QTPP):
A prospective summary of the quality characteristics of a drug product that ideally
will be achieved to ensure the desired quality, taking into account safety and efficacy
of the drug product.

Pharmaceutical Development
17
Real Time Release Testing:
The ability to evaluate and ensure the quality of in-process and/or final product based
on process data, which typically include a valid combination of measured material
attributes and process controls.

Pharmaceutical Development
18
Appendix 1. Differing Approaches to Pharmaceutical Development
The following table has been developed to illustrate some potential contrasts between
what might be considered a minimal approach and an enhanced, quality by design
approach regarding different aspects of pharmaceutical development and lifecycle
management. The comparisons are shown merely to aid in the understanding of a
range of potential approaches to pharmaceutical development and should not be
considered to be all-encompassing. The table is not intended to specifically define the
only approach a company could choose to follow. In the enhanced approach,
establishing a design space or using real time release testing is not necesserily
expected. Current practices in the pharmaceutical industry vary and typically lie
between the two approaches presented in the table.
Aspect Minimal Approaches Enhanced, Quality by Design Approaches
Overall
Pharmaceutical
Development
• Mainly empirical
• Developmental research often
conducted one variable at a
time
• Systematic, relating mechanistic
understanding of material attributes and
process parameters to drug product CQAs
• Multivariate experiments to understand
product and process
• Establishment of design space
• PAT tools utilised
Manufacturing
Process
• Fixed
• Validation primarily based on
initial full-scale batches
• Focus on optimisation and
reproducibility
• Adjustable within design space
• Lifecycle approach to validation and, ideally,
continuous process verification
• Focus on control strategy and robustness
• Use of statistical process control methods
Process
Controls
• In-process tests primarily for
go/no go decisions
• Off-line analysis
• PAT tools utilised with appropriate feed
forward and feedback controls
• Process operations tracked and trended to
support continual improvement efforts post-
approval
Product
Specifications
• Primary means of control
• Based on batch data available
at time of registration
• Part of the overall quality control strategy
• Based on desired product performance with
relevant supportive data
Control Strategy • Drug product quality controlled
primarily by intermediates (in-
process materials) and end
product testing
• Drug product quality ensured by risk-based
control strategy for well understood product
and process
• Quality controls shifted upstream, with the
possibility of real-time release testing or
reduced end-product testing
Lifecycle
Management
• Reactive (i.e., problem solving
and corrective action)
• Preventive action
• Continual improvement facilitated
Pharmaceutical Development
19
Appendix 2. Illustrative Examples
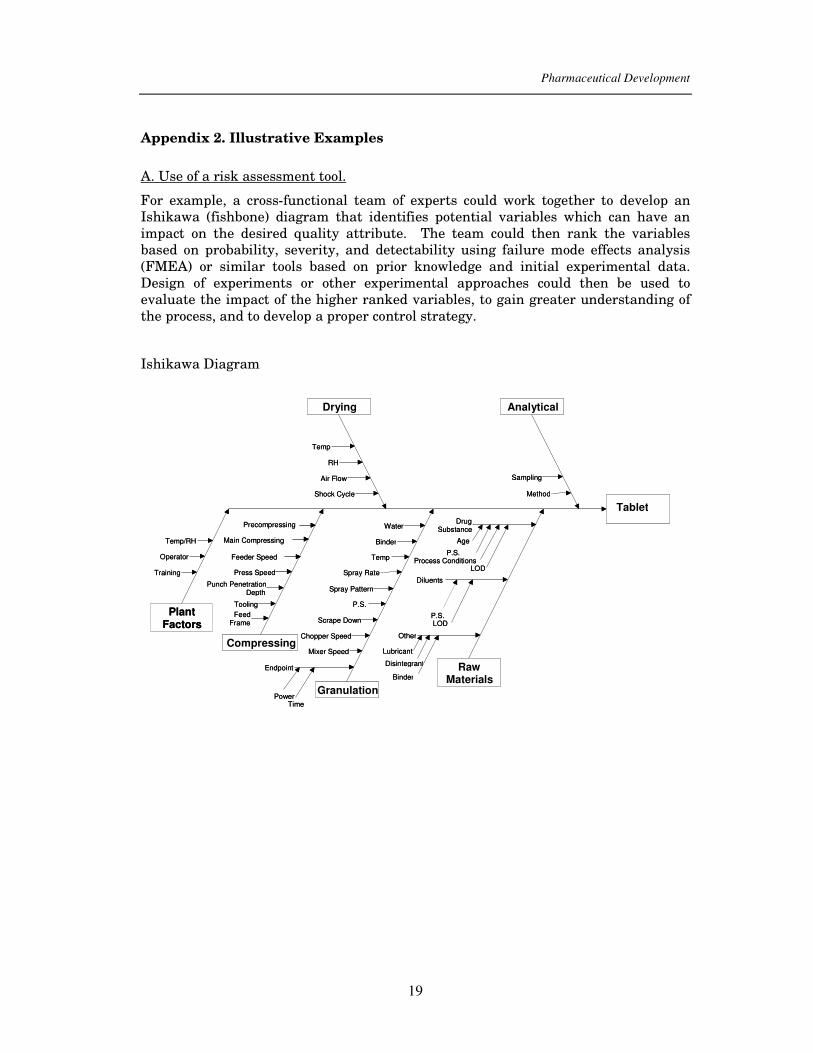
A. Use of a risk assessment tool.
For example, a cross-functional team of experts could work together to develop an
Ishikawa (fishbone) diagram that identifies potential variables which can have an
impact on the desired quality attribute. The team could then rank the variables
based on probability, severity, and detectability using failure mode effects analysis
(FMEA) or similar tools based on prior knowledge and initial experimental data.
Design of experiments or other experimental approaches could then be used to
evaluate the impact of the higher ranked variables, to gain greater understanding of
the process, and to develop a proper control strategy.
Ishikawa Diagram
WaterContent
Drying
Granulation
RawMaterials
Compressing
PlantFactors
Temp/RH
Precompressing Main Compressing
Feeder Speed Press Speed
Punch PenetrationDepth
Temp RH
Air Flow Shock Cycle
DrugSubstance
P.S. Process Conditions
LOD Diluents
P.S. LOD
Other Lubricant
Disintegrant
Binder
Water Binder
Temp Spray Rate
Spray Pattern P.S.
Scrape Down Chopper Speed
Mixer Speed Endpoint
Power Time
Age
Tooling
Operator Training
Analytical
Method
Sampling
FeedFrame
Tablet
Drying
Granulation
RawMaterials
Compressing
PlantFactors
Temp/RH
Precompressing Main Compressing
Feeder Speed Press Speed
Punch PenetrationDepth
Temp RH
Air Flow Shock Cycle
DrugSubstance
P.S. Process Conditions
LOD Diluents
P.S. LOD
Other Lubricant
Disintegrant
Binder
Water Binder
Temp Spray Rate
Spray Pattern P.S.
Scrape Down Chopper Speed
Mixer Speed Endpoint
Power Time
Age
Tooling
Operator Training
Analytical
Method
Sampling
FeedFrame

Pharmaceutical Development
20
B. Depiction of interactions
The figure below depicts the presence or absence of interactions among three process
parameters on the level of degradation product Y. The figure shows a series of two-
dimensional plots showing the effect of interactions among three process parameters
(initial moisture content, temperature, mean particle size) of the drying operation of a
granulate (drug product intermediate) on degradation product Y. The relative slopes
of the lines or curves within a plot indicate if interaction is present. In this example,
initial moisture content and temperature are interacting; but initial moisture content
and mean particle size are not, nor are temperature and mean particle size.
0
0.5
1.0
1.5
%Y
Initial moisture
content (IMC)
100°C
15 20 25 30
15%
30%
Temperature
700 µm
60 80 100
Mean particle size
(d50)
1 2 3 4 5 6 7
0
0
100 µm
60°C
700 µm
100 µm
15%
30%
100°C
60°C
(d50 = 400 µm) (Temp = 80°C)
(Temp = 80°C) (IMC = 22.5%)
(IMC = 22.5%)
Initial MoistureContent (%)
Temp (°C) Mean Particle Size (x100 µm)
0.5
1.0
1.5
%Y
0.5
1.0
1.5
%Y
(d50 = 400 µm)
0
0.5
1.0
1.5
%Y
Initial moisture
content (IMC)
100°C
15 20 25 30
15%
30%
Temperature
700 µm
60 80 100
Mean particle size
(d50)
1 2 3 4 5 6 7
0
0
100 µm
60°C
700 µm
100 µm
15%
30%
100°C
60°C
(d50 = 400 µm) (Temp = 80°C)
(Temp = 80°C) (IMC = 22.5%)
(IMC = 22.5%)
Initial MoistureContent (%)
Temp (°C) Mean Particle Size (x100 µm)
0.5
1.0
1.5
%Y
0.5
1.0
1.5
%Y
(d50 = 400 µm)

Pharmaceutical Development
21
C. Presentations of design space
Example 1: Response graphs for dissolution are depicted as a surface plot (Figure 1a)
and a contour plot (Figure 1b). Parameters 1 and 2 are factors of a granulation
operation that affect the dissolution rate of a tablet (e.g., excipient attribute, water
amount, granule size.)
Figure 1a: Response surface plot of
dissolution as a function of two
parameters of a granulation operation.
Dissolution above 80% is desired.
Figure 1b: Contour plot of dissolution
from example 1a.
Figure 1c: Design space for granulation
parameters, defined by a non-linear
combination of their ranges, that delivers
satisfactory dissolution (i.e., >80%).
Figure 1d: Design space for granulation
parameters, defined by a linear
combination of their ranges, that delivers
satisfactory dissolution (i.e., >80%).
Two examples are given of potential design spaces. In Figure 1c, the design space is
defined by a non-linear combination of parameter ranges that delivers the dissolution
critical quality attribute. In this example, the design space is expressed by the
response surface equation resolved at the limit for satisfactory response (i.e.,80%
dissolution). The acceptable range of one parameter is dependent on the value of the
other. For example:
- If Parameter 1 has a value of 46, then Parameter 2 has a range of 0 and 1.5
- If Parameter 2 has a value of 0.8, then Parameter 1 has a range of 43 and 54

Pharmaceutical Development
22
The approach in Figure 1c allows the maximum range of operation to achieve the
desired dissolution rate. In Figure 1d, the design space is defined as a smaller range,
based on a linear combination of parameters.
- Parameter 1 has a range of 44 and 53
- Parameter 2 has a range of 0 and 1.1
While the approach in Figure 1d is more limiting, the applicant may prefer it for
operational simplicity.
This example discusses only two parameters and thus can readily be presented
graphically. When multiple parameters are involved, the design space can be
presented for two parameters, in a manner similar to the examples shown above, at
different values (e.g., high, middle, low) within the range of the third parameter, the
fourth parameter, and so on. Alternatively, the design space can be explained
mathematically through equations describing relationships between parameters for
successful operation.

Pharmaceutical Development
23
Example 2: Design space determined from the common region of successful
operating ranges for multiple CQAs. The relations of two CQAs, i.e., tablet friability
and dissolution, to two process parameters of a granulation operation are shown in
Figures 2a and 2b. Parameters 1 and 2 are factors of a granulation operation that
affect the dissolution rate of a tablet (e.g., excipient attribute, water amount, granule
size). Figure 2c shows the overlap of these regions and the maximum ranges of the
proposed design space. The applicant can elect to use the entire region as the design
space, or some subset thereof.
> 80%
75-80%
70-75%
65-70%
60-65%
> 80%
75-80%
70-75%
65-70%
60-65%
4-5%
3-4%
2-3%
< 2%
4-5%
3-4%
2-3%
< 2%
Figure 2a: Contour plot of dissolution as
a function of Parameters 1 and 2.
Figure 2b: Contour plot of friability as a
function of Parameters 1 and 2.
Figure 2c: Proposed design space,
comprised of the overlap region of
ranges for friability and or
dissolution.

Pharmaceutical Development
24
Example 3: The design space for a drying operation that is dependent upon the path
of temperature and/or pressure over time. The end point for moisture content is 1-2%.
Operating above the upper limit of the design space can cause excessive impurity
formation, while operating below the lower limit of the design space can result in
excessive particle attrition.
0%
5%
10%
15%
20%
25%
30%
35%
0 2 4 6 8 10 12
time (hr)
Mois
ture
Conte
nt
Design space lower limit
Design space upper limit
Excessive impurity formation
Excessive particle attrition
Endpoint criterion
{
Related Documents