Welcome message from author
This document is posted to help you gain knowledge. Please leave a comment to let me know what you think about it! Share it to your friends and learn new things together.
Transcript

© Icelandic Tourism Research Centre 2014 Publisher: Icelandic Tourism Research Centre, Borgum v/ Norðurslóð, IS-600 Akureyri Tel: (+354) 460-8930
Fax: (+354) 460-8919 e-mail: [email protected] Web: www.rmf.is Title: The Economic Benefits of Tourism in Iceland: Boosting the Icelandic Tourism
Satellite Account Development - Icelandic Tourism Satellite Account (TSA) – A Conformity Assessment with United Nations standards for TSA – Part II
Author: Cristi Frenţ Cover: Ásprent-Stíll and the ITRC Printing: Stell (www.stell.is) Number: RMF-S-01-2014 ISBN: 978-9935-437-25-9 ISSN: 1670-8857 Cover picture: The front pages of the three published Tourism Satellite Accounts by Statistics Iceland. Statistics Iceland ©. All rights reserved. This report is not to be copied or reproduced in any way, such as by photographing, printing, recording or comparable ways in parts or as whole without the prior written consent of the publisher.

The Economic Benefits of Tourism in Iceland: Boosting the Icelandic Tourism Satellite Account Development
Icelandic Tourism Satellite Account (TSA) – A Conformity Assessment with United Nations standards for TSA
Part II
Cristi Frenţ
ICELANDIC TOURISM RESEARCH CENTRE APRIL 2014


2
Content
1. Introduction ................................................................................................................................... 6
2. Handling TSA special issues ......................................................................................................... 8
2.1. Tourism consumption as intermediate consumption of producers .......................................... 8
2.1.1. General aspects ................................................................................................................ 8
2.1.2. Data sources & estimation procedures .......................................................................... 10
2.2. Services provided by the households for the benefit of their guests ..................................... 12
2.3. Housing services provided by vacation homes on own account ........................................... 14
2.3.1. The treatment of vacation homes according to international standards......................... 14
2.3.2. Vacation homes tourism in Iceland ............................................................................... 15
2.4. Timesharing ........................................................................................................................... 19
2.5. The treatment of certain goods .............................................................................................. 21
2.5.1. Tourism single-purpose consumer durables .................................................................. 22
2.5.2. Valuables ....................................................................................................................... 25
2.6. Separate valuation for reservation services ........................................................................... 27
2.7. Same-day visitors expenditure .............................................................................................. 32
3. The TSA tables ............................................................................................................................. 36
3.1. General assessment of the compliance .................................................................................. 36
3.2. Demand side table(s) ............................................................................................................. 40
3.3. Supply side tables .................................................................................................................. 43
3.3.1. Production accounts table .............................................................................................. 43
3.3.2. The “core” TSA table(s) ................................................................................................ 46
3.3.3 Employment table .......................................................................................................... 49
3.4. A future Icelandic TSA table with non-monetary indicators ................................................ 52
3.4.1. Trips and overnights by forms of tourism and classes of visitors in Iceland................. 54
3.4.2. International arrivals in Iceland by modes of transport ................................................. 56
3.4.3. Capacity and occupancy of accommodation industry in Iceland .................................. 58
4. The TSA aggregates .................................................................................................................... 62
4.1. General overview .................................................................................................................. 62
4.2. Internal tourism consumption vs. Total internal tourism consumption (at market prices) .... 65
4.3. Tourism direct gross value added (at basic prices) vs. Tourism gross value added (at basic prices) ………………………………………………………………………………………………70
4.4. Tourism direct gross domestic product vs. Tourism gross value added at market prices ..... 72

3
4.5. Employment in tourism industries vs. Employment in tourism ............................................ 75
5. Conclusions .................................................................................................................................. 78
References ............................................................................................................................................ 82
Annex 1. List of correspondences and meetings with key persons ................................................... 88
Annex 2. Some statistics on second homes (summer houses) in Iceland .......................................... 90
Annex 3. A summary regarding the treatment of TSA special issues in the Icelandic TSA ............. 92
Annex 4. The format of Icelandic TSA tables (according to the last TSA publication in Iceland in 2011) .................................................................................................................................................. 94
Annex 5. Experimental TSA:RMF table 10: Non-monetary indicators for Iceland for the period 2003 – 2013 ..................................................................................................................................... 106
Annex 6. Calculating undeclared overnight stays for domestic tourism in Iceland in 2007-2008 .. 114
Annex 7. A summary for assessing the level of compliance of the Icelandic TSA tables .............. 116
Annex 8. How the Icelandic TSA tables correspond with TSA:RMF (2008) table 6 ..................... 118

4
List of tables and figures
Table 1: Number of summer houses in Iceland by ownership status, 2009 – 2013. ............................. 17 Table 2: Correspondence between the list of tourism single-purpose consumer durables proposed by TSA:RMF (2008) and the related retail trade activities in ISAT 2008. ................................................ 23 Table 3: The treatment of reservation services according with net valuation approach........................ 28 Table 4: Establishing a general correspondence between TSA:RMF (2008) tables and Icelandic TSA tables. ..................................................................................................................................................... 39 Table 5: Similarities and differences between TSA:RMF table 4 (Internal tourism consumption by products) and Icelandic TSA table 15 (Total internal tourism consumption at market prices) ............. 41 Table 6: Similarities and differences between TSA:RMF table 6 (Total domestic supply and internal tourism consumption (at purchasers' prices) and the Icelandic TSA table 14 (Output, intermediate consumption and value added in tourism industry) (but also Icelandic TSA tables 7, 9, 10, 11 and 12). ............................................................................................................................................................... 48 Table 7: Similarities and differences between TSA:RMF table 7 (Employment in the tourism industries) and Icelandic TSA table 16 (Employment in tourism). ....................................................... 51 Table 8: Number of trips and overnights in inbound and outbound tourism in Iceland in 2013 – Experimental TSA:RMF Table 10a....................................................................................................... 56 Table 9: International arrivals by modes of transport in Iceland in 2013 - Experimental TSA:RMF Table 10b. .............................................................................................................................................. 57 Table 10: Capacities and occupancy of accommodation units in Iceland in 2013 - Experimental TSA:RMF Table 10c. ............................................................................................................................ 59 Table 11: General correspondence between TSA aggregates. .............................................................. 63 Table 12: Calculating an adjusted share of internal tourism consumption for Iceland in 2009. ........... 66 Table 13: Payments in kind to employees in Iceland and their relevance as imputed tourism consumption. ......................................................................................................................................... 68
Figure 1: The apparent “misleading” correspondence between production accounts tables in Icelandic TSA and TSA:RMF (2008). .................................................................................................................. 44 Figure 2: The correspondence between Icelandic TSA tables and TSA:RMF (2008) table 6. ............. 47


6
1. Introduction
Iceland has published tourism data through a Tourism Satellite Account (TSA) since October 2008. Since then, three TSA publications have been delivered by Statistics Iceland, the last one in December 2011. Now, more than two years on, an evaluation of the TSA development in Iceland is timely in order to improve future compilations. More reliable and internationally comparable data regarding the size of the tourism sector is necessary for both the public sector and private entrepreneurs, as tourism has experienced one of the fastest growths of any Icelandic economic sector in the last few years.
This study will enhance the TSA development in Iceland and represents the second part of a conformity assessment of current practices in Iceland with international standards for tourism statistics and TSA. The first part of the conformity assessment was published in December 2013 by Icelandic Tourism Research Centre (an online version is publicly available at www.rmf.is). This part of the conformity assessment firstly documented in-depth existing data sources pertaining to the tourism sector that could support the TSA development in Iceland. Secondly, it presented a comparison of the concepts and definitions used by international standards with the ones used in current system of tourism statistics in Iceland. Lastly it detailed the specificity of TSA and provided initial thoughts on how to approach the issue of “country-specific” tourism services and goods.
The conformity assessment is with international standards which are found in two documents endorsed by the United Nations (UN) and other international organizations in 2008: International Recommendations on Tourism Statistics 2008 (IRTS, 2008) and Tourism Satellite Account: Recommended Methodological Framework 2008 (TSA:RMF, 2008). In addition, Eurostat requirements for tourism statistics are also envisaged as a benchmark as applicable. It is important to note that as an EEA (European Economic Area) member, Iceland has to comply with parts of EU legislation, including Regulation 692/2011 concerning European statistics on tourism. This regulation can be seen as a specific adaptation at the European level of the international standards on tourism statistics endorsed by the UN. At present, the implementation of the EU requirements is not fully completed by Statistics Iceland.
The general approach of this study is a continuous comparison between on the one hand, what international standards foresee and on the other, what the existing situation in Iceland is. As to the latter, correspondence with key persons who are in some cases in charge of producing statistics in Iceland provided invaluable insights and data (see Annex I for a list of those corresponded with).
As indicated, the conformity assessment with the United Nations standards for TSA was divided into two parts, each of them offering a gradual assessment of how tourism statistics and TSA in Iceland are coping with international standards as defined by IRTS (2008) and TSA:RMF (2008).
7
This second part of the conformity assessment is divided into four sections. The first section (ch. 2) approaches the following TSA “special issues” as defined by TSA:RMF (2008): tourism consumption as intermediate consumption of producers, services provided by the households for the benefit of their guests, housing services provided by vacation homes on own account, timesharing, tourism single-purpose durables and valuables, separate valuation for reservation services and same-day visitors’ expenditure.
The second section of the current report (ch. 3) refers to the TSA tables as the main pillars in the investigation of both supply and demand aspects of tourism. After a general assessment of the compliance, a more in-depth analysis is provided for each table. Moreover, an experimental TSA table in the case of non-monetary indicators is constructed in order to prove that Iceland does have some data to compile such table.
In the third section of the current report (ch. 4), Icelandic TSA aggregates and their counterparts from TSA:RMF are separately examined in order to see the connections and variances from the standards. Finally, the fourth section of the current report (ch. 5) presents the conclusions of both parts (reports) of the study, the one previously published in December and the current one.
The major output of the entire study (considering the both parts) consists of a series of recommendations (52 in total out of which 25 are to be found in the previous report and 27 in the current report). These were made in order to improve the measurement of tourism in Iceland according to international standards. In principle, where major gaps or non-conformances were observed, then recommendations were prepared. If implemented, the belief of the author is that these will provide the basis for making Icelandic TSA more compliant with international standards. As a consequence, Iceland will have significantly better tourism statistical data and a more reliable statistical characterization of the tourism sector.
8
2. Handling TSA special issues
In compiling Tourism Satellite Accounts there are particular special issues specific only to TSA as a statistical instrument. In principle, they are related to tourism consumption in different forms. Eight such cases will be presented in this chapter.
2.1. Tourism consumption as intermediate consumption of producers
When people are traveling for business purposes, at least a part of their consumption (most likely on accommodation and transport) is covered by the employer, either a business or a government agency or a so called “Non-profit institution serving households” (NPISH1) – one might call these three entities “producers” in order to be in line with National Accounts terminology.
2.1.1. General aspects
According with SNA 2008, the expenditures of these producers (for the travel of their employees) are part of “Intermediate consumption”. Therefore, these expenditures do not fall under the concept of “Household final/actual consumption” where most of tourism consumption is related. This is one of the specificity of TSA: The tourism consumption concept from TSA is not only part of “Household final consumption” from National Accounts but also of the “Intermediate consumption” of producers. Caution should be taken when trying to compare aggregates related to tourism consumption with the “Household final consumption” due to differences in scope (TSA:RMF, 2008, para. 2.33). In this case, in order to perform the comparison with “Household final consumption”, the part related to “Intermediate consumption” should be left aside.
At the same time, it should be clearly stated that not all the expenditures related to business trips are treated as “Intermediate consumption”. Only the expenditures directly paid or reimbursed by employers mainly on accommodation and transport services are included. However, there are two other cases for which the related expenditure during business trips are not considered part of “Intermediate consumption” in National Accounts but part of household final consumption expenditure. In the first case, there are some private expenses made by visitors (e.g. souvenirs) from their own resources while in the second case there could be a lump sum (e.g. per diems) allocated by the employer to employee to cover meals or other expenditures, treated as employee compensation (wages and salaries) (Eurostat 2009, p.
1 NPISH is defined as “non-profit institutions that are not controlled by government. They provide goods and services to households free or at prices that are not economically significant. Most of these goods and services represent individual consumption but it is possible for NPISHs to provide also collective service” (SNA, 2008, para. 4.93). Related to tourism there could be non-profit associations that provide different tourism activities (e.g. accommodation, recreational activities) for its members.

9
33). This latter case is also envisaged in the Icelandic National Accounts and considered part of employee’s compensation and considered a “travel allowance”:
Another and more important item is travel allowances, i.e. a certain amount per day, paid to employees when they are travelling for business purposes. In most cases these payments are supposed to cover both accommodation and other travel expenses but in some cases these payments could include an element of income in kind when these payments are considerably higher than reasonable travel expenses. The tax authorities accept most of these allowances as expenses for the employees. In the Enterprise Accounts Register this item is separately distinguished and recorded as other expenses not wages and salaries. According to ESA95 that part of travel allowances which is intended for meals and drinks is defined as wages and salaries in kind. In travel allowances to the government employees a distinction is made between accommodation, 60%, and other travel allowances, 40% of total. These proportions were rounded off to 50/50 implicitly reflecting the opinion that these allowances are generous in many cases and often involve income in kind (Statistics Iceland, 2011a, p. 179).
To repeat, the payments made by producers as a lump sum to cover meals during travel are included in the “Compensation of employees” (as remuneration in kind) and therefore, defined as a form of “Household final consumption”. The Icelandic National Accounts follow the European regulations, namely ESA (European System of Accounts). On this matter, ESA (2010)2 even exemplifies some types of wages and salaries in kind, among other being “meals and drinks, including those consumed when travelling on business but excluding special meals or drinks necessitated by exceptional working conditions.” (ESA, 2010, para. 4.05)3
In tourism statistics, particularly when discussing the tourism expenditure concept, International Recommendations on Tourism Statistics 2008 (IRTS, 2008) does not make any distinction in relation with the National Accounts concepts of “Intermediate consumption” or “Household final consumption” since the beneficiary of expenditure is the visitor. It only specifies that tourism expenditure includes different types of expenditure that might occur during a business trip (see IRTS, 2008, para. 4.5). At the same time it is important to mention that in the TSA:RMF (2008) unlike the version from 2001 (TSA:RMF, 2001) tourism business expenditures are not presented as a separate item.
In the last Icelandic TSA, published in 2011, one can find the breakdown of domestic tourism consumption by “Households”, “Corporations” and “Government”. The latter two fall into the category of Tourism consumption as an intermediate consumption of producers. Consequently, the TSA in Iceland recognizes the case of tourism consumption as intermediate consumption of producers and moreover provides a separate categorization of these types of
2 It should be remembered that as of September 2014 Statistics Iceland will conform to ESA (2010). Before this the earlier version of ESA, namely ESA 95 has been used. 3 On the other hand, SNA (2008) includes these as components of intermediate consumption when exemplifying types if intermediate consumption: “Transportation and hotel services including allowances for meals provided while the employee is travelling on business” (SNA, 2008, para. 6222e); It seems here that a contradiction between ESA (2010) and SNA 2008 arises. Nevertheless, in this specific case, ESA (2010) should be followed.

10
tourism consumption (see Statistics Iceland, 2011b, pp. 9, 16, 23). By doing this, it does not exceed the framework of TSA:RMF (2008). Instead, one can say that in this particular case Icelandic TSA is doing more than international standards by presenting separately a classification of domestic tourism consumption into “Households”, “Corporations” and “General government”.
2.1.2. Data sources & estimation procedures
Estimating business tourism expenditure can be approached both from the demand and from the supply side. Regarding the forms of tourism, different approaches should be envisaged. While for inbound tourism this issue is not very important (as in any case it is a non-resident who pays and thus is considered an export), for domestic tourism this issue is relevant. Regarding outbound business tourism, what concerns the economy of reference is only the domestic part of the outbound business trips which mainly refers to air passenger transportation (in the particular case of Icelandic residents flying with Icelandic airlines). However, and in accordance with TSA:RMF (2008) the domestic tourism consumption includes also this domestic part of an outbound trip (including a business trip).
It should be reminded that the ITB’s commissioned survey for Icelandic residents does not capture data on purposes of trips and expenditures related to these purposes. So, from a demand side there is no regular survey in Iceland covering business tourism trips. It was only the Statistics Iceland’s demand side travel survey conducted in 2007-2008 that provided data on business as purpose of trip (but with no expenditure breakdown). According to this data source, 11% of domestic trips and 26% of outbound trips had business as the main purpose of trip (Statistics Iceland, 2013a).
However, the 2007-2008 travel survey does not provide detailed data on which tourism expenditure are provided by the employers. In this regard, the future demand-side travel survey in Iceland should particularly envisage the case of business tourism expenditure and since, in many cases, the visitors could not be aware of the real value of expenditures supported by the employer, a separate specification of these types of expenditure might be requested.
11
Following recommendation 1 would be more than helpful as Eurostat also recommends some imputations for estimating tourism expenditure which are covered by other parties:
It is recommended to impute expenses (entirely or partially) covered by a third party in case there was a monetary transaction by the third party, for instance a meal paid by parents, hotel or travel expenses covered by company. In the same way, respondents should only report on their own expenses (not on expenses for other persons) to avoid double counting (Eurostat, 2012, p. 133).
Supply and Use Tables (SUTs) could also provide data on intermediate consumption by products. It can be assumed that total intermediate consumption of all industries for products such as accommodation and air transport is considered 100% business tourism expenses, while for other kinds of products (e.g. food and beverage, rental services), a tourism share could be applied (Eurostat, 2009).
However, as SUTs have been irregularly produced in Iceland, data from administrative sources could be used instead. More precisely, data taken directly from registers (mainly Enterprise Accounts register) used for deriving intermediate consumption should be used. These refer to operating expenses of the companies. Once producing SUTs the same assumption can be applied.
However, in both cases the major issue remains on how to establish the tourism share. In this regard, data from demand side are necessary in order to weigh, for each product (expenditure types) the domestic business tourism expenditure in total tourism expenditure. In other words, the demand side travel survey should provide separate data for expenditure related to business trips, if possible detailed by products (e.g. accommodation, transport etc.)
Recommendation 1: the future demand side travel survey amongst Icelanders should ask whether in case of business trips there were expenditure paid by employers and to identify all these types of expenditure paid by them (i.e. transport, accommodation, meals etc.). However, their value should not be reported as these are not considered as being paid by the tourist himself.
In addition, in case of outbound business trips the identification of airline and travel agency is necessary in order to assign correctly the expenditure for domestic or outbound tourism.
Recommendation 2: the future demand side travel survey amongst Icelanders should allow a separate identification of tourism expenditure in case of business trips, and, if possible, to provide detailed expenditure by products.

12
2.2. Services provided by the households for the benefit of their guests
Services provided by the households for somebody’s benefit need to be distinguished into two cases. On the one hand services provided by a household for its members and on the other hand services provided for other persons belonging to other households (herein named “guests”)4.
In the first case, TSA:RMF (2008) is very strict and follows the SNA (2008) rules by excluding the consumption for the benefit of the household’s members (e.g. transport provided to the airport by one member of the household to another of the same household or self-preparing of meals in a trip). It is considered that this situation is not included within the “production boundary” of the SNA (see: SNA, 2008, pp. 6-7). However, there are two exceptions from this restriction and only one has a tourism relevance namely accommodation on own account which particularly occurs in the case of vacation homes (see 2.3).
In the second case, international standards state that:
… only the increase in the consumption of the household due to purchase of goods and services required to provide those services or the direct purchase of the services for the benefit of the visitors (an invitation to a restaurant or a show) is recorded (when feasible) as part of tourism consumption (TSA:RMF, 2008, p.16).
However, in the case of accommodation services provided by a household to its guests free of charge it is doubtful that a significant “purchase of goods and services” for the benefit of visitors would require a special measurement as “receiving a guest in one’s home free of charge does not generate additional economic production” (UNWTO, 2011, p. 97).
In tourism statistics a benchmark indicator for this situation is illustrated by accommodation provided by friends and relatives (as a type of accommodation, presumably without charge). The last ITB’s commissioned survey for inbound visitors shows that 7.1% of these visitors have chosen to “stay with friends and relatives (unpaid accommodation)” and the average length of stay was 8.3 nights in the summer of 2011 (Icelandic Tourist Board, 2012). Meanwhile, Statistics Iceland’s travel demand survey for 2007-2008 indicates that in 28.8% of domestic trips Icelandic residents chose to stay with friends and relatives 5 (Statistics Iceland, 2014b).
Along with accommodation provided free of charge other examples could include an invitation to a restaurant or a show or transportation provided to the guests (e.g. guests that are picked up free of charge from Keflavík airport by the host household).
4 This includes also relatives and friends who are not part of the respective household. 5 Even if these figures might be considered outdated, they reflect better the real situation compared with the ITB’s most recent commissioned survey for Icelanders (see: ITB, 2014, p. 25) where the multi-answer possibility to the specific question regarding accommodation types gives shares whose summing exceed 100%.

13
Hosts and guests might also exchange houses without payments (the so called “barter transactions”). Also, in this case, there is no increase in the economic production so one might consider there is no need for a further economic measurement.
Specific research has to be undertaken to see the occurrence of the above mentioned situations in Iceland. In this regard a starting point would be including such information in the future demand-side travel survey. More precisely, households would be asked to provide information about guests they accommodated free of charge (if this was the case).
An important remark has to be made referring to implementing the above recommendation: If no reliable answers are obtained in the pretesting or piloting phase of the questionnaire (of the future demand-side survey), these questions should be removed from the future survey, as it must be admitted that this situation is not characteristic for Iceland. However, this remains doubtful in light of survey findings so-far. The same approach could be applied in the case of exchanges of houses, but reliable data can hardly be obtained.
The supplementary questions suggested in recommendation 3 would be justified also by the fact that they provide coherence and consistency between the demand and the supply side of statistics. Asking the household whether or not it accommodates guests could be seen as a supply-side perspective on collecting tourism statistics.
It has to be mentioned that in recent years, particularly in the Reykjavík capital area, some people are renting their houses for tourists through specialized agencies (e.g. airbnb.com). As it is a service which is charged, this does not fall within the situations here discussed. At the same time, it has to be considered unlikely that people renting their apartment through such a system will provide information in a survey. Consequently a household survey (as seen from
Recommendation 3: the future demand-side travel survey in Iceland might include some questions asking about hosting relatives or friends in the reference period. For instance, the following questions might be considered by Statistics Iceland:
1. During the period … did you host friends or relatives inside your home (or second home)?
2. If so, how many days did they stay in your house? 3. How many persons there were? 4. Where were the guests from? (Iceland or abroad) 5. Besides accommodation what other services did you provide to
them, which were entirely/partly supported by you? a) preparation of meals b) invitation to a restaurant c) transportation d) other (please specify) e) none

14
supply-side) could not be viewed a solution to capture such data. Only tourists paying to stay in such accommodations would provide this data. It should be remembered that the questionnaire of the new ITB’s commissioned survey for inbound visitors for 2013-2014 does include the category “in a privately-owned apartment or house (Airbnb/house exchange/couch surfing)6”. Results are expected this year and the relevance of this category will be revealed. However, it should be warned that while the Airbnb system usually involves a monetary transaction, House exchange and Coach surfing do not involve one. Mixing these categories is not the best solution, but once results will show the importance of this category, a separation between these paid and unpaid forms of accommodations has to be made.
2.3. Housing services provided by vacation homes on own account
Vacation homes are a distinct type of accommodation. They are mostly provided on a ‘‘non-commercial’’ (non-market) basis, meaning a service at one’s own expense (owners that occupy vacation homes) or a service provided without charge to family, friends and relatives. (Frent, 2009). Both for IRTS (2008) and TSA:RMF (2008), vacation homes represent an important specific issue requiring separate treatment. Nevertheless, only the vacation homes services provided at own expense will be discussed in this section.
2.3.1. The treatment of vacation homes according to international standards
According to SNA (2008) rules a housing service at one’s own expense is associated with a dwelling occupied by its owner, and this applies not only for a principal dwelling but also to all dwellings owned and used by a household , including the case of vacation homes.
It is important to mention that the estimation of accommodation services related to a vacation home is considered a part of tourism consumption, but not part of tourism expenditure (TSA:RMF, 2008). In TSA a so called “imputation” of that (accommodation) service is performed which is in fact an indirect estimation of this accommodation service based on “either the characteristics of the dwelling and costs of maintenance or, when an active and representative rental market exists, on the actual average market rental for similar units (TSA:RMF, 2008, pp. 16-17).
6 Couch surfing is actually a practice of moving from one friend’s house to another, sleeping in whatever spare space is available, floor or couch, generally staying a few days before moving on to the next house. No monetary exchange takes place but it is a common practice for guests to bring a gift, to cook a meal or to teach a skill. Actually couch surfing is in fact a hospitality exchange network (Other similar networks are BeWelcome, Hospitality Club, Pasporta Servo, Servas Open Doors). These are all different forms of “accommodation sharing” or “home stay networks” referring to individuals offering and seeking accommodation without monetary exchange (Wikipedia, 2013).
15
Moreover, it is considered that “this service is part of tourism supply and of tourism consumption irrespective of whether the dwelling has actually been visited in the period of reference on a tourism trip or not” (TSA:RMF, 2008, para. 2.38). So this imputation is undertaken not only from the demand-side (as a part of tourism consumption) but also from the supply-side as a production activity. The ISIC industry where the imputation of owner-occupied dwelling as a production activity occurs is 6810 “Real estate activities with own or leased property” which is equivalent with the ISAT 2008 activity 6820.1 “Letting of residential housing” (is. Leiga íbúðarhúsnæðis).
It is important to mention that there are two categories of expenditures related to trips to vacation homes which should be excluded from tourism consumption. The first relates to “day-to-day running expenses”. These are incurred by the owner as a producer of accommodation services and are treated as “Intermediate consumption” of the ISIC activity “Real estate activities with own or leased property”. The second refers to purchase of vacation homes and all expenditure related to major repairs, maintenance and improvements which are considered by SNA (2008) and Balance of Payments Manual (BPM 6) as capital expense, and thus excluded from the concept of consumption (IRTS, 2008, para. 4.7).
Another important remark refers to the fact that trips to vacation homes in the usual environment of the owner should be excluded by default. In this regard, Eurostat clearly specify that “trips to second homes within the same municipality should be considered as travel within the usual environment, and not be counted as tourism trips” (Eurostat, 2012, p. 34). In a future demand survey, the cascade system proposed by Eurostat should be applied to trips to vacation homes (including the duration and frequency criteria).
TSA:RMF (2008) recommends to create subcategories in case of vacations homes in TSA tables both as a product and as an industry “when the incidence of owner-occupied vacation homes is significant enough” (TSA:RMF, 2008, para 3.16).
2.3.2. Vacation homes tourism in Iceland According to Statistics Iceland’s 2007 - 2008 demand side survey, there were 349,342 tourism trips of Icelandic residents and 983,330 overnights stays within the category “Private holiday houses” (is. Sumarhús í eigin eigu eða í eigu ættingja/vina – in translation from Icelandic “Holiday houses owned by self or owned by relatives/friends”) (Statistics Iceland, 2014b). These accounted for over 27% in total trips and total overnight stays made by Icelandic residents inside the country.7 It is important to say that this category represents the second largest accommodation type after “staying with friends and relatives” (is. Hjá ættingjum og vinum), according with the same survey.
At the same time the ITB’s commissioned survey for Icelandic residents revealed that in 2013 the category of “Privately owned summer cottage or apartment” was an accommodation 7 Own calculations from Statistics Iceland, 2014b

16
option mentioned by 41.6% of Icelandic residents (Icelandic Tourist Board, 2014a, p. 25) and it ranked third after the categories “Stayed with friends and relatives” and “Tent/trailer/motor home”. However, due to multiple choice answers in the ITB’s commissioned survey, it is difficult to say at this time the “real” share of this category compared with other accommodation categories.
All these figures demonstrate unequivocally the importance of vacation homes as a type of accommodation for domestic tourism in Iceland. So, from the demand-side, one can conclude that the figures indicate the importance of vacation homes among Icelandic residents. Therefore, the case of vacation homes should be separately presented in the future TSA tables.
As mentioned before, from a supply perspective, as an industry, vacation homes are part of the ISAT 2008 classification 6820.1 “Letting of residential housing” (is. Leiga íbúðarhúsnæðis), a category which includes mostly the renting of homes, including vacation homes. Anyway, finding the share of vacation homes within this category could be a great challenge.
One important remark has to be made regarding the precise name of these categories as found in ITB’s commissioned survey and Statistics Iceland 2007-2008 travel demand survey. While ITB’s category is correctly defined referring only to “owned” vacation homes (be it a cottage, a house or an apartment) the Statistics Iceland 2007-2008 survey mixed “own summer houses” with “summer houses owned by friends and relatives”. One should understand that is a common practice in Iceland for a family to share a vacation home. Nevertheless, in order to obtain a clearer figure these two categories should not be aggregated.
There is no data regarding the usage of second homes owned by foreigners and used by them. The ITB’s commissioned survey on inbound visitors does not capture this kind of data. Therefore, it can be assumed that their incidence is not significant, at least at this moment.
On the supply-side, figures provided by Icelandic Property Register revealed that in 2012 the total number of summer houses is Iceland was 12,401 while in 2013 their number has reached 12,574 (Registers Iceland, 2014a). As a comparison in 2012 there were 131,760 dwellings in Iceland and 100,896 in 1997 (Statistics Iceland, 2013b). One can calculate that the share of second homes in the total stock of dwellings in Iceland has grown constantly from 7.5% in
Recommendation 4: The future compilation of TSA in Iceland should separately present vacation homes as a tourism consumption product and (if possible) as a distinct industry.
Recommendation 5: The future demand side travel survey amongst Icelanders should separately include as a type of accommodation “owned summer houses/cottages/ apartments” and this should not be mixed with “summer houses owned by friends and relatives”. The latter should rather fall into the category of “accommodation provided by friends and relatives”.

17
1997 to 9.4% in 2012 (see Annex 2 for more data). It is important to mention that this number indicates the buildings listed as “summer houses” and registered as such, no indication being provided whether the dwelling is actually permanently or temporarily occupied (Huijbens, 2012, p. 340).
Nevertheless, one can see that in 2013 in Iceland 85% of the registered summer houses are privately owned while the remaining 15% are owned by companies or trade unions (see table 1). Also one can see that in the last two years there was a moderate increase in their total number. Despite this, the number of summer houses owned by trade unions has not grown in the last years (around 900 units) whilst the number of summer houses owned by companies has grown beyond the average increase (3.8% compared with 1.4%).
Registers Iceland provided an estimation of the total number of summer houses by the residency of owners (owners living in Iceland and owners living abroad). This special inquiry revealed that for the end of 2013 only 3.8% of the summer houses (479) had owners living abroad while the rest of 96.2% (12,095) had owners living in Iceland. These figures do not provide information about the nationality of owners but even if their owners would be Icelanders living abroad, when they come to stay in these summer houses they should be considered foreign tourists according to international standards.
Table 1: Number of summer houses in Iceland by ownership status, 2009 – 2013. Source: Registers Iceland, 2014a
2009 2010 2011 2012 2013 Total number, out of which 11,835 12,079 12,225 12,401 12,574
1. Owned by individuals 10,047 10,281 10,465 10,589 10,726 2. Owned by companies* 891 900 861 912 947 3. Owned by trade unions** 897 898 899 900 901
* - only if a company is one of the owners ** - trade unions are considered business registered with ISAT codes starting with 94 or 55 It is estimated that 95% of the total registered second homes in Iceland are “purpose built recreational houses” while the remaining 5% are homes that have been converted from primary residence to secondary residence (Nouza et al., 2013).
In the TSA publication for Iceland, there was no separate category of vacation homes. They were presumably embedded in the category of “Other accommodation services” within domestic tourism consumption. Nevertheless, some methodological provisions are found in the first TSA for Iceland published in 2008, indicating that vacation homes were in fact included in the TSA estimations:
Imputed rent of cottages (holiday homes) enjoys a rather special status within the tourism accounts where it is not direct expenditure but a calculated consumption of tourism … the Domestic supply of tourism products of cottages is estimated from the rental equivalent of the summer cottages, even if the owners use it themselves or hire out. In accounting for private consumption in the national accounts the rental of

18
cottages in the country is estimated 0.8% of the total rental housing market in the country. This percentage is based on the proportion of cottages in the cost of rebuilding [endurstofnverði] housing in the Land Registry and estimated time of use (i.e. occupation time) to a maximum of 3 months.
In preparing the tourism accounts presented here, it was decided not to consider the use of occupation time but calculate the rental of cottages as 2.5% of residential real estate evaluation in accordance with the principles of international methodology in this field. It is impossible to find out the frequency and length of stay in the tourist cottages but since this factor is quite important to the settlement of tourism accounts it seemed appropriate to follow international standards (Statistics Iceland, 2011b, p. 22, translated from Icelandic).
Some remarks have to be made here. In estimating the vacation homes services, National Account methodology is followed in estimating the output of the owners’ occupied second homes. In this regard data from administrative register was used (i.e. Land Registry of Iceland8) for the housing stock. At the same time the estimation recognizes the fact that there is no accurate data on the usage of second homes and thus some estimations are done (i.e. estimate time of use of 3 months). However, there is no clear explanation of what the figure of 2.5% represents. It is only stated that this is in accordance with “principles of the international methodology in this field”.
The estimation of housing services provided by vacation homes is also found in the methodology of National Accounts in Iceland, where more details are provided:
… the output of secondary residences, i.e. holiday homes, was estimated by comparing the value of these houses with the primary residence. The output of the secondary residences was estimated 0.8% of the value of the output value of primary residence. That is based on the total rebuilding cost of secondary residence which the Land Registry of Iceland estimates as 3.12% of the rebuilding value of primary residence. The usage time is estimated as a quarter of the year, the summer time. Based on that, the output of the secondary residence was estimated as 0.8% of the output of primary residence9 (Statistics Iceland, 2011a, p. 81).
More explanation is provided as follows:
The rental of secondary residences are estimated as 0.8% of other rental and added to the total value of rental. That result is derived from the following: A special estimate is done to include holiday homes although they account for a very minor part of the housing stock. In this case a notice is taken of the real estate value of holiday homes in proportion to the same value of dwellings. Short usage time of holiday homes is also taken into account.
8 There is a separate governmental agency called Icelandic Property Registry which is in charge of the “Property Registry Database” which is the central framework for all real-estate data in Iceland (Registers Iceland, 2013). 9 To better explain: 3.12 was divided by 0.25 (a quarter) and results in 0.78 rounding at 0.8.

19
The value of summer houses are estimated 3.12% of the total value of houses in 199910. That is the total value of groups 4.2.1 Imputed rentals of owner-occupiers and 4.2.2 Other imputed rentals. The estimated time of use is 25% and therefore the rents for secondary residences are estimated 0.8% of other rents. (Statistics Iceland, 2011a, p. 127).
The above paragraphs reconfirm the fact that the estimation of vacation homes in TSA was strongly related to National Accounts. Actually the majority of EU countries when estimating the component of second homes used for tourism apply the methodology of National Accounts for imputed rents (Eurostat, 2009).
In addition, approximately 80% of all dwellings in Iceland are owner-occupied (Statistics Iceland, 2011a, p. 127). So the rest or 20% is for rent. One can assume that the same percentage could apply to vacation homes.
An important remark has to be made in relation with renting second homes (summer houses). A recent phenomenon that has started to become popular in Iceland is the renting of second homes.11 It should be borne in mind that the estimation of the housing services provided by second homes has already been estimated (under the imputed rent) and in the particular case when summer houses are rented, in the macroeconomic analysis, the total value of the rent received by owners has to be deducted from the total value of imputed rent of vacation homes:
… second home used principally for own account and for tourism purposes might also be leased to third parties. In such a case, the estimation of the service provided on own account should take into consideration the value of the lease received. Then the value of own account production (and of own account consumption) is equal to the total value that has been estimated minus the amount received from the lease (WTO, 2000, p. 94).
Nevertheless, until the relevance of such phenomenon is evident enough to justify a separate estimation in Icelandic National Accounts, no recommendation will be provided, at least for the time being.
2.4. Timesharing
It has to be specified that timesharing might be considered a particular case of vacation home ownership (as it is presented also in the TSA:RMF, 2008). However, due to its specificity it requires separate treatment. In a practical manner, timesharing allows the customers to use the
10 This was done by Statistics Iceland in a Rent Survey carried out in March 1999. This survey was the basis of adopting stratification method proposed by Eurostat in estimating own account housing services and adopted by Iceland starting with 2000 following ESA 95 requirements (see: Statistics Iceland, 2011a, pp. 80-81 for more details). 11 For more details see Innovation Center Iceland (2013) where it is stated that “The demand for summerhouse rentals in Iceland has increased in recent few years”. It is important to mention that according to this source 60% of bookings are made by foreigners.
20
facilities and services offered by properties for a certain period of time. Nevertheless, it is important to know from the very beginning how timesharing is defined.
A good definition of timesharing is presented by Vanhove (2011) who in fact uses the definition given by Goodall and Stabler (1990):
Timeshare, sometimes referred to as interval ownership, is a form of multi-ownership of property of which examples can be found in the business sector, as well as in the leisure sector. It is a periodic right of use or occupation where property is divided on a temporal rather physical basis. It confers on a number of purchasers the right to the exclusive and full use of property and facilities for predetermined period of year. In principle this right is recognized as transferable (Vanhove, 2011, p. 121).
American Resort Development Association (ARDA) provides a more pragmatic definition:
Timesharing – A term used to describe a method of use and/or shared ownership of vacation real estate where purchasers acquire a period of time (often one week) in a condominium, apartment or other type of vacation accommodation (ARDA, 2014, p. n/a).
Globally, timesharing is a growing industry. In 2010 it was estimated that worldwide there were 5,316 timesharing resorts and approximately 20 million of owners. Thereof 1,345 timesharing resorts were located in Europe (Resort Development Organisation, 2014). There are specialized companies in this market such us Resorts Condominiums International or Interval International which are in fact tour operators for timeshare owners (Vanhove, 2011).
Obviously, from the demand side all trips having timesharing as a type of accommodation should be included in tourism if these kinds of units are located outside the usual environment as explained above with reference to Eurostat’s “cascade system” (Eurostat, 2012, p. 67). Things are becoming more complicated when establishments are combining time-share and rented accommodation (see the experience of Finland in this case – Eurostat, 2012, pp. 67-68). In addition, for a tourist it is difficult to clearly specify what is classified as “accommodation” or “real estate services” (IRTS, 2008, para. 3.37).
Nevertheless, it is important to consider the treatment of timesharing in accordance with TSA:RMF (2008):12
- A flow of services is associated with each physical unit sold through a timeshare or other arrangement. These services should be classified as short-term accommodation (ISIC 5510 Short-term accommodation activities, CPC 63113, Room or unit accommodation services for visitors in timeshare properties);
- The value of these services should be estimated on the basis of the market rent for an equivalent unit;
12 The author believes that ambiguity is introduced here. While it is said that is “these services should be classified as short-term accommodation services” they are treated as a type of vacation home ownership and estimated in a similar manner as vacation homes. Moreover, the classification of products in TSA:RMF (2008) tables present a category entitled “Accommodation services associated with all types of vacation home ownership” (and these included timesharing also).

21
- Fees for use of time-share facilities (for linen service, cleaning, etc.) by owners are included in tourism expenditure;
- Day-to-day running expenses (property management services and other current payments such as property taxes) are not part of tourism consumption as they are assigned as costs to the productive activity associated with the ownership;
- Expenditure on “major improvements” (special assessments, representing additional payments made in order to meet specific expenses to enhance and extend the life of the physical property) are also excluded from tourism consumption and would be part of the increase of the rights of the owner, whatever the analysis of these rights (over either a physical asset, a financial asset or a produced or non-produced intangible asset);
- Time-share exchange services and time-share sales services would correspond to the “property owner” aspect of the arrangement, and not so much to the “consumer” and would be excluded from tourism consumption. (TSA:RMF, 2008, pp. 27, 86-87).
These should be followed by every country including Iceland. However, there is no clear evidence of time-share units operating in Iceland. 13 Neither the comprehensive National Accounts Inventory in Iceland makes any reference to timesharing (see Statistics Iceland, 2011a). Nor does the Icelandic TSA. However, it is possible that a sort of “family-based” ownership of vacation homes exists in Iceland and these are used at different times by different family members. Nevertheless, as these are not operated as companies they could not be considered real timesharing arrangements.
Under these circumstances, no recommendations will be provided in this section as it can be assumed that timesharing has a little relevance for Iceland, at least for the time being.
2.5. The treatment of certain goods
In most cases visitors buy goods when making a trip and the acquisition of goods can even become the main purpose of visit. Shopping is indeed now one of the main purposes of trips recognized by IRTS (2008).
From the outset, it is necessary to bear in mind that TSA considers only the retail trade activity associated with visitors for and during their trip. Production and distribution activities of goods do not fall into the “direct economic contribution of tourism” approach of TSA:RMF (2008) and therefore, are part of other economic measurements of tourism. In this context, it should be emphasised that only the economic activities serving visitors directly are part of the TSA methodology.
13 This is strengthened by the fact that Iceland is not included in the offer of big time-share companies such as Resort Condominiums International or Interval International.

22
There are two particular cases of goods purchased by tourists that require separate treatment: “Tourism single-purpose consumer durables” and “Valuables”. These should be seen as separate TSA special issues.
2.5.1. Tourism single-purpose consumer durables
First of all, it is important to present how durable goods are defined. A durable good is:
one that may be used repeatedly or continuously over a period of more than a year, assuming a normal or average rate of physical usage (SNA, 2008, para. 9.42).
When these are acquired by households they are considered consumer durables and when acquired by enterprises they are considered capital goods. In this section, only consumer durables are discussed.
In tourism, there are two categories of consumer durables. On the one hand, so called “tourism single-purpose” durables and on the other “tourism multi-purpose” consumer durables. Those who are used exclusively or almost exclusively by individuals for trips or while on trips are called tourism single-purpose consumer durables (TSA:RMF, 2008, para 2.41). The rest of durable goods bought by tourists can serve multiple other purposes as well, not only tourism purposes (e.g. cars, video and/or photo camera). It is important to mention that tourism expenditure includes the acquisition of tourism single-purpose consumer durables when the purchase occurs both before and during trip. Other consumer durables are included only if they are acquired during trips. (TSA:RMF, 2008, para. 2.43).
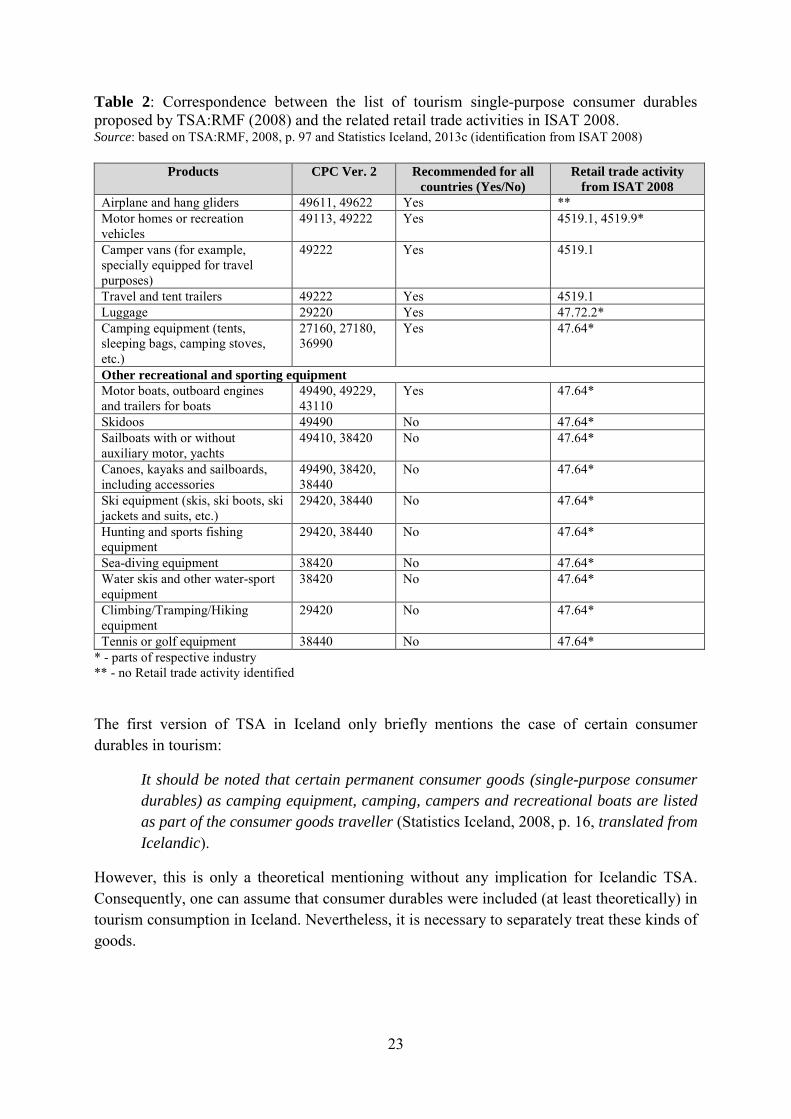
TSA:RMF (2008) proposes a list of tourism single-purpose consumer durables and recommends flexibility for each country when defining its own list of such goods (TSA:RMF, 2008, Annex 5, A).
As only retail trade activity is envisaged by TSA (when a visitor purchases goods), a correspondence between this list of tourism single-purpose consumer durables and the retail trade activity associated to these goods in ISAT 2008 has been performed (see table2).
One can see that there are two categories of products: ones that are recommended for all countries and ones that are optional. Nevertheless, for Iceland one can consider that all the items could be specific to tourism in this country and consequently, they should be included as tourism single purpose consumer durables.
23
Table 2: Correspondence between the list of tourism single-purpose consumer durables proposed by TSA:RMF (2008) and the related retail trade activities in ISAT 2008. Source: based on TSA:RMF, 2008, p. 97 and Statistics Iceland, 2013c (identification from ISAT 2008)
Products CPC Ver. 2 Recommended for all countries (Yes/No)
Retail trade activity from ISAT 2008
Airplane and hang gliders 49611, 49622 Yes ** Motor homes or recreation vehicles
49113, 49222 Yes 4519.1, 4519.9*
Camper vans (for example, specially equipped for travel purposes)
49222 Yes 4519.1
Travel and tent trailers 49222 Yes 4519.1 Luggage 29220 Yes 47.72.2* Camping equipment (tents, sleeping bags, camping stoves, etc.)
27160, 27180, 36990
Yes 47.64*
Other recreational and sporting equipment Motor boats, outboard engines and trailers for boats
49490, 49229, 43110
Yes 47.64*
Skidoos 49490 No 47.64* Sailboats with or without auxiliary motor, yachts
49410, 38420 No 47.64*
Canoes, kayaks and sailboards, including accessories
49490, 38420, 38440
No 47.64*
Ski equipment (skis, ski boots, ski jackets and suits, etc.)
29420, 38440 No 47.64*
Hunting and sports fishing equipment
29420, 38440 No 47.64*
Sea-diving equipment 38420 No 47.64* Water skis and other water-sport equipment
38420 No 47.64*
Climbing/Tramping/Hiking equipment
29420 No 47.64*
Tennis or golf equipment 38440 No 47.64* * - parts of respective industry ** - no Retail trade activity identified
The first version of TSA in Iceland only briefly mentions the case of certain consumer durables in tourism:
It should be noted that certain permanent consumer goods (single-purpose consumer durables) as camping equipment, camping, campers and recreational boats are listed as part of the consumer goods traveller (Statistics Iceland, 2008, p. 16, translated from Icelandic).
However, this is only a theoretical mentioning without any implication for Icelandic TSA. Consequently, one can assume that consumer durables were included (at least theoretically) in tourism consumption in Iceland. Nevertheless, it is necessary to separately treat these kinds of goods.

24
It should be recalled that “Household final consumption” within National Accounts has some items which could correspond to the category of durables (and these could be acquired by tourists as well). These might include part of the categories “Recreation equipment” – for example photographic equipment or personal computers or “Personal effects n.e.c. – for travelling goods, sleeping bags” (Statistics Iceland, 2011a, pp. 132-134)
In the existing presentation of data in the previous Icelandic TSA, consumer durables bought by tourists would probably have been included in the “Miscellaneous tourism retail services” category of tourism consumption. So, one can consider there was no special treatment for durables in the Icelandic TSA.
Moreover, there is no survey in Iceland to separately capture tourism single purpose consumer durables purchased by tourists. As stated before, the solution is to ask directly in the border and household survey about the purchase of these kinds of goods and these should be clearly specified for respondents (as found in table 2). Eurostat also recommends that expenditure collected should be broken down in several categories, one of these being “Durables and valuables goods” which has to be reported separately from “Other” category (Eurostat, 2012, p. 131). Eurostat does not provide any thresholds in defining durables due to difficulties such an endeavour might produce and lack of consensus in this regard.14 Anyway, separating this kind of goods (even mixed with valuables) is a smart solution and hereby recommended.
It is important to mention here that in the previous study, part I of the conformity assessment, durable goods were recommended to be considered a separate category within the classification of goods acquired by visitors in Iceland (see: Frent, 2013, p. 72 - table 18). Also Recommendation 15 of the same previous study has envisaged the inclusion of durables in measuring the tourism expenditure (see: Frent, 2013, p. 55).
14 However, it has to be mentioned that the new edition of Eurostat’s Methodological Manual for Tourism Statistics released in December 2013 introduced a suggested threshold of 300 EUR per item purchased. Nevertheless, this was done only in the model of questionnaire proposed (particularly for collecting demand side data on tourism expenditure) and not in defining durables. Moreover, it is even admitted that “technically this is not a threshold” (Eurostat, 2013a, p. 146 ).
Recommendation 6: The future TSA compilation in Iceland should separately approach the case of consumer durables in tourism in the following manner: - acquisition of tourism single purpose consumer durables (see table 2) should be included in tourism consumption irrespective of when they were bought (prior or during the trip) - acquisition of all other consumer durables (e.g. cars, computers) should be included in tourism consumption only if these were purchased during trips Practically, these can be implemented in two ways: Either by introducing supplementary items/questions in the demand side survey for inbound and Icelandic visitors or by analysing the supply of these kinds of goods within Supply and Use Tables of the Icelandic National Accounts.

25
2.5.2. Valuables
Precious stones, antiques, jewellery, works of art or other art object with high value are example of goods that can also be purchased by visitors when undertaking trips.
Valuables are a type of durable goods and are defined as:
… expensive durable goods that do not deteriorate over time, are not used up in consumption or production and are acquired primarily as stores of value. They consist mainly of works of art, precious stones and metals and jewellery fashioned out of such stones and metals (SNA, 2008, para. 9.57).
Acquisition of valuables by visitors is part of tourism expenditure “irrespective of their value unit” (IRTS, 2008, p. 37). At the same time it is important to mention that valuables are included in tourism expenditure only when acquired on trips (TSA:RMF, 2008, p. 83).
International standards in tourism statistics warn about a difference that appears when valuables are of high value and exceed the country’s custom threshold (in case of inbound and outbound expenditure). Therefore, in this particular case Balance of Payments and SNA (2008) would exclude these from their calculations while TSA:RMF (2008) will include them. This is the justification provided:
International Recommendations for Tourism Statistics 2008 and Tourism Satellite Account: Recommended Methodological Framework 2008 include the purchase of valuables within tourism expenditure (and thus tourism consumption) and make no exception in treatment on the basis of the unit value of the goods purchased (as these exceptions, as they are formulated, do not guarantee uniformity in treatment over countries). This recognizes the importance of such purchases as the driving force for tourism in some places or by some categories of visitors (TSA:RMF, 2008, p. 87).
However, it has to be admitted that this situation (of buying very expensive goods by tourists) is not likely to happen and could be left aside, at least for the time being.
In the TSA tables recommended by international standards, valuables are presented separately as they are considered non-consumption products (TSA:RMF, 2008, pp. 51-62). Actually, valuables are not part of “Household final consumption” and correspond to a non-consumption category of final demand; this is done to facilitate comparison with SNA (2008) and BPM 6 (IRTS, 2008, p. 37).
According with Eurostat recommendations on tourism statistics, valuables should be treated along with consumer durables. Consequently, the tourism expenditure collected (from demand side surveys) has to be broken down in several categories, one of these being the category of “Durables and valuables goods” which has to be reported separately from the “Other” category (Eurostat, 2012, p. 131).
Nevertheless, careful analysis is required as the inclusion of valuables (and consumer durables also) can cause reporting of high values of tourism expenditure (when carrying out tourism

26
demand survey), even if the occurrence of such cases is not frequent. In line with Eurostat recommendation, when disseminating tourism expenditure, median value should be used instead of average (Eurostat, 2012, p. 132).
It is essential that in the future demand side surveys in Iceland, valuables but also consumer durables should be separately identified in order not to affect the value of total tourism expenditure.
It is important to see how valuables are treated in the Icelandic National Accounts. Here these are defined within the context of an expenditure approach calculation of GDP, more precisely within the category of “Acquisitions less disposal of valuables” as part of “Gross fixed capital formation” as:
Valuables represent material assets but are not considered as fixed assets…valuables are antiques and art in the form of paintings, stamps and various collectors’ pieces.
Moreover, some limitation exists in term of data relating to valuables:
So far the only data available on valuables are imported valuables of trivial importance. These valuables are all classified as household final consumption, not fixed capital formation. (Statistics Iceland, 2011a, p. 160).
This statement is not in line with ESA (2010) where acquisition of valuables (in our case by households) is not part of the final consumption expenditure (ESA, 2010). However it is foreseen that in the 2014-2015 Iceland will probably align its National Accounts to ESA (2010). Nevertheless, considering that international standards in tourism statistics state that “Acquisitions of valuables by visitors should be separately identified” (IRTS, 2008, para. 5.42) the same rule should be adopted by Iceland, as well in its future TSA.
Recommendation 7: The future demand side surveys in Iceland should separately capture three categories of tourism expenses as proposed below:
- (only for domestic survey) tourism single purpose durable goods acquired in Iceland such us camper vans, motor homes or recreational vehicles, camping equipment, sport and recreational equipment, luggage (the acquisition in this case could be either prior, during or outside the context of a trip; a separate question for these kind of good should be applied)
- Durable goods (cars, computers, laptops, boats etc.) (only if acquired during the trip in Iceland and within a trip domestically)
- Valuables (jewellery, works of art, paintings, precious stone, antiques and similar) - only if acquired during the trip in Iceland and within a trip domestically.

27
Valuables were not separately envisaged by the former TSA compilations in Iceland, but vaguely mentioned as part of the tourism consumption concept:
… expenditures are first and foremost due to the purchase of goods and services but also the purchase of valuables (ie. valuables) for personal use or for gifts (Statistics Iceland, 2008, p. 15, translated from Icelandic).
Apart from this theoretical inclusion in the Icelandic TSA, no special treatment was given to this situation.
Like in the case of durable goods, part I of the conformity assessment recommended that valuables should be considered a separate category within the classification of goods acquired by visitors in Iceland (see: Frent, 2013, p. 72, table 18). Also, Recommendation 15 of the same previous study has envisaged the inclusion of valuables in measuring the tourism expenditure (see: Frent, 2013, p. 55). It is important to note in this context that the following retail trade activities related to valuables were identified in ISAT 2008 (see: Frent, 2013, p. 72, table 18):
- 4777.0 Retail sale of watches and jewellery in specialized stores - 4752.2 Retail sale of paints and glass in specialized stores - 4778.3 Activities of commercial art galleries
2.6. Separate valuation for reservation services
Valuing reservation services separately refers to services provided by travel agencies, tour operators and other providers of reservation services. It is also called the “net valuation” of services provided by these intermediaries (Eurostat, 2009). Basically, it consists of dividing the total payment made by visitors for these services into two major components: one corresponding to the gross margin earned by the travel agency and the other which corresponds to the total value of the tourism services intermediated.
It should be noted that package tours (which are basically produced by tour operators and in most cases are sold to travel agencies) are also treated herewith and in this case a third element is added to the two components mentioned above, that is the tour operator’s commission as a result of making business with a travel agency. IRTS (2008) provides the following clarifications regarding the definition of tour operators:
Recommendation 8: The future compilation of TSA in Iceland should envisage the case of valuables (in TSA tables) and should separately treat the tourism expenditure for these kinds of goods.
28
Tour operators are businesses that combine two or more travel services (for example, transport, accommodation, meals, entertainment, sightseeing) and sell them through travel agencies or directly to final consumers as a single product (called a package tour) for a single price. The components of a package tour might be pre-established or can result from an “à la carte” procedure where the visitor chooses from a pre-established list the combination of services he/she wishes to acquire (IRTS, 2008, para. 6.59).
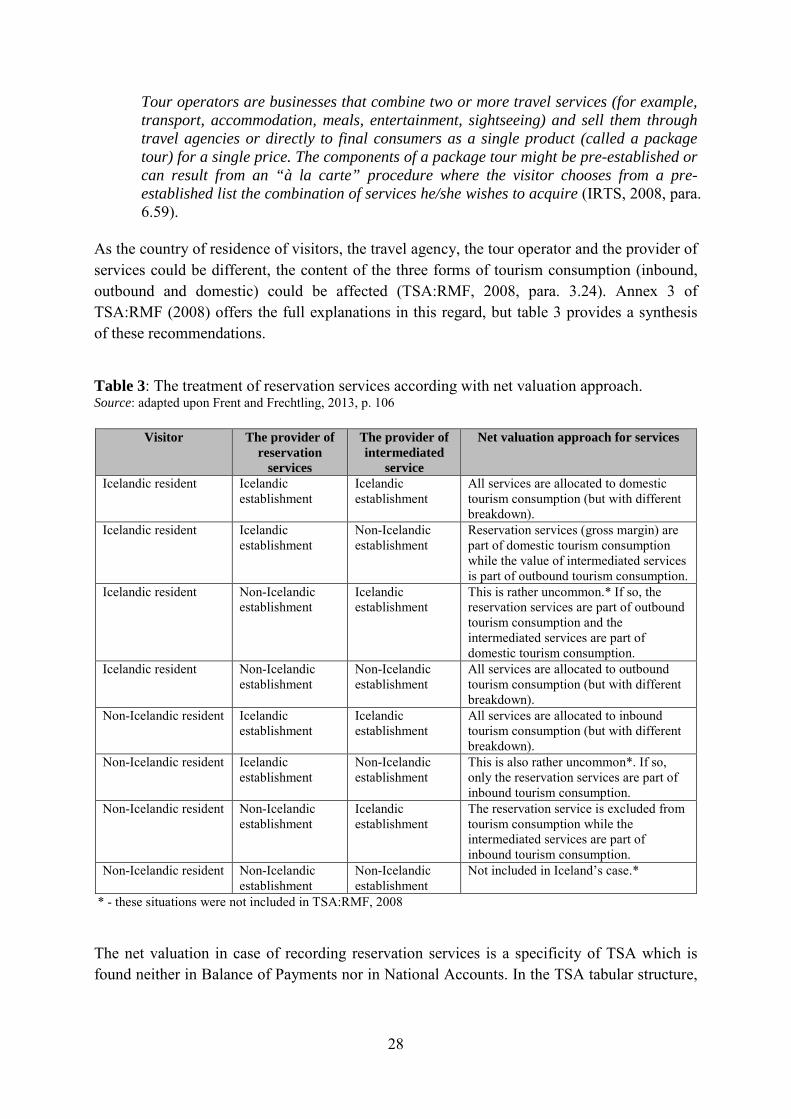
As the country of residence of visitors, the travel agency, the tour operator and the provider of services could be different, the content of the three forms of tourism consumption (inbound, outbound and domestic) could be affected (TSA:RMF, 2008, para. 3.24). Annex 3 of TSA:RMF (2008) offers the full explanations in this regard, but table 3 provides a synthesis of these recommendations.
Table 3: The treatment of reservation services according with net valuation approach. Source: adapted upon Frent and Frechtling, 2013, p. 106
Visitor The provider of
reservation services
The provider of intermediated
service
Net valuation approach for services
Icelandic resident Icelandic establishment
Icelandic establishment
All services are allocated to domestic tourism consumption (but with different breakdown).
Icelandic resident Icelandic establishment
Non-Icelandic establishment
Reservation services (gross margin) are part of domestic tourism consumption while the value of intermediated services is part of outbound tourism consumption.
Icelandic resident Non-Icelandic establishment
Icelandic establishment
This is rather uncommon.* If so, the reservation services are part of outbound tourism consumption and the intermediated services are part of domestic tourism consumption.
Icelandic resident Non-Icelandic establishment
Non-Icelandic establishment
All services are allocated to outbound tourism consumption (but with different breakdown).
Non-Icelandic resident Icelandic establishment
Icelandic establishment
All services are allocated to inbound tourism consumption (but with different breakdown).
Non-Icelandic resident Icelandic establishment
Non-Icelandic establishment
This is also rather uncommon*. If so, only the reservation services are part of inbound tourism consumption.
Non-Icelandic resident Non-Icelandic establishment
Icelandic establishment
The reservation service is excluded from tourism consumption while the intermediated services are part of inbound tourism consumption.
Non-Icelandic resident Non-Icelandic establishment
Non-Icelandic establishment
Not included in Iceland’s case.*
* - these situations were not included in TSA:RMF, 2008
The net valuation in case of recording reservation services is a specificity of TSA which is found neither in Balance of Payments nor in National Accounts. In the TSA tabular structure,

29
net valuation approach is applied both for tourism consumption (TSA:RMF, 2008, tables 1-4) and production (TSA:RMF, 2008, table 5).
It should be underlined that concerning package tours purchased by tourists there is a specific “philosophy” of tourism statistics in which package tours are seen as a sum of disaggregated elements:
… in tourism statistics, a package tour should not be viewed as a product per se, but rather as the sum of its components, including the gross margin of the tour operator and that of the travel agency that sells it to the public (IRTS, 2008, para. 6.61).
However, in the European standards for National Accounts (now ESA (2010)) a distinction is made between the services of travel agencies and tour operators, making the services of travel agencies fully in line with the net valuation approach while package tours are stated to be valued on gross basis (Eurostat, 2009). So it is clearly specified that:
The output of travel agency services is measured as the value of service charges of agencies (fees or commission charges) and not by the full expenditures made by travellers to the travel agency, including charges for transport by third parties. The output of tour operator services is measured by the full expenditure made by travellers to the tour operator.
Travel agency services and tour operator services are distinguished by the fact that travel agency services amount only to intermediation on behalf of the traveller, while tour operator services create a new product called a tour, which has various components of travel, accommodation and entertainment (ESA, 2010, paras. 3.60-3.62).
So what is required by TSA is a “transition from gross (as it is National Accounts) to net valuation of package tours” (Eurostat, 2009, p. 87). Practically, a reallocation within some items of SUTs (e.g. from intermediate consumption to household consumption) will take place.15 More precisely, it is important to note that:
… the net valuation of package tours gives rise to discrepancies in the total input, the total output and on the composition of household final consumption by products in comparison to the related national SUT (Eurostat, 2009, p. 87).
However, what is important to mention is that in this process the value added remains invariable as both level of output and intermediate consumption are decreased with the value of services that are included in the package tour (excepting the commission charged by the tour operator).
15 See: Eurostat, 2009, pp. 88-91 where a practical example is provided.

30
There is no clear reference about using the “net valuation” approach in the Icelandic TSA. However, some general references are provided in the first publication of TSA in Iceland in relation to how the services of travel agencies are estimated:
When analysing the domestic activities of travel agencies it has to be borne in mind that part of the service travel agencies offer relates to imports of tourism, sales of e.g. outbound tourism. This is in other words imports of tourism, which is not reflected in domestic activity of the firm. To evaluate the services of travel agencies belonging to domestic tourism, imported tourism is deducted from the turnover of the agency and also the output is dropped to avoid double counting resulting from transactions with other travel service nationally. The main data source in this analysis came from existing businesses in the tourism industry. It was assumed that about 60 % of the activity of travel is tourism imports (or payments to foreign entities that provide services abroad). What remains is related to services for (foreign and domestic) tourists in the country and service for domestic travellers going abroad (Statistics Iceland, 2008, p. 23, translated from Icelandic).
From the above statement it seems clear that there is not special mentioning of package tours within TSA in Iceland. One can see that only the case of travel agencies (and not the one of tour operators) is mentioned where more or less a supply-side assumption is involved (i.e. 60% of the activity of travel agencies are imports).
In addition to SUTs, administrative data sources for the sector of travel agencies and tour operators can be used as well to make some estimation to disaggregate package tours (i.e. cost structure, margins). Some assumptions can also be provided from the demand-side survey. Eurostat provides practical examples of how to “unbundle package trips” (see: Eurostat 2013a, pp. 151-155).
Regarding tourism statistics in Iceland, there are some data on the usage of package tours. ITB’s commissioned survey for foreign visitors captures data on type of trip (‘‘package tour, individually arranged, mix of both’’), cost of package tour per person and composition of a package tour (‘‘Lodging/accommodation, Air ticket/ferry ticket. Excursion/Sightseeing, Food/beverages, Other transport, Conference fee, Other)’’ (Icelandic Tourist Board, 2012). The survey revealed that in 79.6% of cases inbound visitors made an individually arranged trip while the percentage of ‘‘pure’’ package tour was 10.2% and for the rest of 10.2% there was a combination between individually arranged and package tour (Icelandic Tourist Board, 2012).
Recommendation 9: The future TSA compilation in Iceland should clearly adopt the net valuation of package tours approach. Data from SUTs are essential to be used in this endeavour as well as demand-side sources and administrative data sources.

31
However, the ITB’s commissioned survey for Icelandic residents does not provide any data on package tours and Statistics Iceland in its 2007-2008 travel demand survey only published data regarding package tours on outbound trips. The latter estimated that 36% of outbound trips were organized by travel agencies or tour operators while the rest (64%) represented ‘‘direct contact with airline or shipping company’’ (Statistics Iceland, 2014a). It is important to mention that no data was published by Statistics Iceland regarding the composition of package tours purchased by Icelandic residents although the questionnaire of the 2007 - 2008 survey captured this issue.
In Iceland, travel agencies and tour-operators are licensed by Icelandic Tourist Board “pursuant to Tourism Administration Act”. In January 2014 there were 200 travel agencies and 649 tour operators; in addition there were 156 “booking service and/or information centre” (Icelandic Tourist Board, 2014b). However, according to Statistics Iceland (which presents the number of enterprises and organizations registered in the corresponding ISAT 2008 activities) 16 in 2012 there were 176 travel agencies, 164 tour operators and 255 “reservation services and related activities” (Statistics Iceland, 2013d).
One can notice the difference between these figures. It should be borne in mind that Statistics Iceland data are referring only to entities that mainly operate in this field while Icelandic Tourist Board includes any provider of such service (be it a specialized company or not - for instance it would include a company having transportation as a main activity but having also a license as a tour operator).
At present there is no special supply-side survey in Iceland for these units. A supply-side survey aimed at producers of package tours would provide data regarding the cost of each component of a package tour but this would be a very costly exercise considering the huge number of licensed entities provided by Icelandic Tourist Board.
A demand-side survey has the limit that the tourists are not aware of the cost of the each component of a package tour. They can only provide data on the total cost of a package tour and enumerate what services are included in the package. As previously mentioned, this is actually done in the ITB’s commissioned survey for foreign visitors. Moreover, the draft questionnaire for 2013-2014 ITB’s commissioned survey for inbound visitors differentiate between booking a trip using tour operator/travel agency in Iceland or a tourist’s home country. However, it should be remembered that no data is available about the package tours purchased by Icelandic residents.
16 79.11 Travel agency activities , 79.12 Tour operator activities and 79.90 Other reservation service and related activities

32
It has to be remembered that although the general household expenditure survey conducted by
Statistics Iceland captures “Package holidays” as an item of household consumption, this is
not sufficient for detailed tourism analysis regarding package tours requested by TSA.
2.7. Same-day visitors expenditure
Trips that do not involve an overnight stay are defined as same-day trips “irrespective of the
number of hours spent on that trip” (IRTS, 2008, para. 3.27). A visitor is called a same-day
visitor (or excursionist) if his/her trip does not include an overnight stay (IRTS, 2008, para.
2.13). Obviously, visitors can spend money during their same-day trips and this expenditure is
included in TSA.
However, IRTS (2008) does not provide a special treatment for same-day visitor
expenditures. Moreover, TSA:RMF (2008) does not consider same-day visitor expenditure as
being a “TSA special issue”. It was added as a separate section in this paper due to the fact
that Eurostat has included this issue in its TSA compilation guidelines elaborated in 2009
(see: Eurostat, 2009, pp. 71-80).
Same-day visitors expenditures are mentioned in TSA:RMF (2008) and recognised by their
importance:
Most same-day visitors are domestic visitors, but there are also cases of international
same-day visitors, in particular in small countries or when border crossings are
especially easy. For some countries, consumption by same-day visitors may constitute
an important component of tourism consumption (TSA:RMF, 2008, para. 2.13).
At the same time TSA:RMF (2008) emphasises that the disaggregation of tourism expenditure
into one category corresponding for overnight visitors and one corresponding for same-day
visitors has been made because “their structure of consumption is usually significantly
different” (TSA:RMF, 2008, para. 4.38). Moreover, TSA:RMF (2008) (within the TSA
tables) proposes a breakdown of same-day visitors’ expenditure by inbound, domestic and
outbound tourism expenditure.
Eurostat (2013a) provides detailed guidelines regarding definitions pertaining to same-day
visitors. The definition of the same-day trip entails duration and should be “at least 3 hours
and not including an overnight stay”. More importantly this duration refers to “only the time
spent at the destination, not the time spent to reach (and return from) the place visited.”
Recommendation 10: The future demand side survey amongst Icelanders
should include data on package tours (total cost of package tour and the
components provided). These should be done separately for domestic and
outbound trips. In addition, for outbound trips it has to be specified
whether the package was bought from Icelandic or foreign travel agency
or a tour operator.

33
(Eurostat, 2013a, p. 36). Eurostat also recommends using the cascade system to distinguish tourism same-day trips from other purpose same-day trips (e.g. regular shopping).
Data on same-day visit are required under EU regulation 692/2011 on tourism statistics. According to this regulation member states are to provide quarterly data on outbound same-day visits starting with the reference period 2014 while for domestic same-day visits the first reference period is optional 2015 and compulsory 2018. The mandatory variables required are number of same-day visits (separately for personal and business purposes) and total expenditure (separately for domestic and outbound same-day trips and separately for personal and business purposes). Optional variables refer to same-day tourism expenditure categories (transport, shopping restaurant/café, other), country of destination (in case of outbound same-day trips) and socio-demographics (gender, age, education, employment status).
At the same time Eurostat recognizes the difficulties in data collection of same-day trips:
… collecting information on same-day visits is not only more challenging because of the scope and its potentially grey areas or borderline cases, same-day visits are also more at risk of being underreported due to recall bias of the respondent or due to the reporting burden (Eurostat, 2013a, p. 116).
In Europe, according to the latest Eurostat TSA data collection, there are 14 countries that produced expenditure data for inbound same-day visitors and 13 countries that produced the same data for domestic same-day visitors (Eurostat, 2013b). This data has revealed the importance of same-day trips (for most of the European countries that provided TSA data) as same-day trips accounted more that overnight trips in domestic tourism expenditure.
In analysing same-day trips in Iceland one should firstly distinguish between the three categories of same-day trips: inbound same-day trips, domestic same-day trips and outbound same-day trips.
Referring to inbound same-day trips, for Iceland as an island in the middle of north Atlantic theoretically two types of inbound same-day visitors could be identified:
- Cruise passengers (assuming they don’t make any overnight stay in Iceland) - Transit passengers at Keflavík airport that enter Iceland for a short trip without an
overnight stay – i.e. a visit to the Blue Lagoon
Regarding domestic same-day visitors (is. dagsferðir), it seems that this segment has some relevance for Iceland since according to ITB’s commissioned survey for Icelandic residents in 2013 62.4% of Icelanders went on day trips (Icelandic Tourist Board, 2014a, p. 40) Day trips were defined as “recreational trip lasting at least 5 hours and spent away from the home without overnight stay” (Icelandic Tourist Board, 2013, p. 19). However, this survey does not provide any information on expenditure related to day trips. It is important to mention that the Statistics Iceland’s survey conducted in 2007 – 2008 did not include same day trips (trips without overnight stays).

34
Part I of the conformity assessment recommended (recommendation 3) the inclusion of same-day trips into the future demand side survey for Icelandic residents (see: Frent, 2013, p. 11); this also referred to their expenditure.
In case of outbound same-day trips from Iceland, one might assume that this occurrence is not common (and it even can be neglected) considering the country’s geographic location. That’s why outbound same-day trips might be left aside for the moment. Nevertheless, theoretically some “indirect same-day trips” might be performed for foreign tourists staying in Iceland and having a one-day plane trip to Greenland or Faroe Islands.17 Also, some same day business trips might occur in case of air transportation to the nearest European countries.18 However, one might assume that at least for the moment, these are on a very small scale and do not justify a special measurement. Moreover, such cases depend heavily on airline schedule.19
It is important to mention that the last TSA published for Iceland presents only one figure regarding the “expenditure by same day visitors (SDV) on cruise ships” (Statistics Iceland, 2011b, p. 8). This was 12.410 ISK (72 EUR) in 2010. In a footnote it is explained that this value was obtained from a study commissioned in 2009 by Hafnarsamband Íslands (Port Association of Iceland) to a consultancy firm BREA (Business Research & Economic Advisors).
In fact, in the last Icelandic TSA there were no other data regarding same-day visitors’ expenditure such as the breakdown of same-day visitors’ expenditure by tourist products or between domestic and inbound same-day visitor expenditure.
In case of domestic same-day trips the estimation of related expenditure would not cause great problems if a tourism demand-side survey would be effective. For estimating inbound same-day visitor expenditure the challenge here would be twofold:
- To estimate an average expenditure made by a cruise passenger and by multiplying this expenditure with the total number of cruise passengers in Iceland the total
17 There are flights for such trips performed by Air Iceland in the summer time. 18 For instance, a business traveller who departs in the early morning from Keflavík to Copenhagen and returns in the same day late evening. 19 For instance, in case of Air Iceland (the main airline operating regular flights to Greenland and Faroe Islands) if someone wants to go from Reykjavík to Nuuk in Greenland and return in the same day has no time to visit anything as the return flight is less than one hour since the arrival of the airline in Nuuk. The same applies for Kulusuk in Greenland (Air Iceland, 2014).
Recommendation 11: The future TSA compilation in Iceland should include the estimation of same-day visitor expenditure both for inbound and domestic tourism. In this regard, the future demand-side survey amongst Icelanders could be used as well as other data sources and estimations (i.e. for cruise passengers or transit passengers at Keflavík not overnighting in Iceland).
35
expenditure of cruise passengers in Iceland could be obtained (in this regard data from Icelandic Tourism Research Centre could be useful)
- To research more the transit passengers at Keflavík airport who made a short same day visit in Iceland
Regarding the latter of the two challenges, the focus should be only on passengers not staying overnight in Iceland. ISAVIA could provide the number of transit visitors “staying less than 72 hours” but this is not sufficient. Icelandair might have data on number of passengers having a stopover at Keflavík between 5 and 9 hours.20 If this number is not very high then one could consider that the incidence of same-day trips made by stopover passengers at Keflavík is not enough to justify further research. The conclusion would be that passengers having a stopover at Keflavík who want to visit Iceland usually have at least one overnight stay which is out of our inbound same-day trip investigation for Iceland.
***
Overall, in this chapter eight TSA special issues have been presented taking into consideration, on the one hand the provisions of international standards and on the other hand their treatment within the Icelandic TSA. These are summarized in Annex 3 through a compliance analysis of the Icelandic TSA with international standards.
The chapter reveals that only one TSA special issue (Tourism consumption as intermediate consumption of producers) is totally compliant with international recommendations. Two other TSA special issues were judged as being partially compliant: the case of valuation of reservation services and vacation homes occupied by owners. An additional specification is necessary in case of vacation homes: while these are treated in the Icelandic TSA they are not separately identified in the TSA tables, which is the only reason why they were considered “partially compliant”. Another five TSA issues were found non-compliant either because they were not completely estimated in the Icelandic TSA (case of same-day visitor’s expenditure) or because no evidence exists that they were separately treated (case of valuables and tourism single-purpose consumer durables) even if it is said that theoretically they were included in the TSA estimates. For timesharing and the case of services provided by the household for the benefit of their guests, as a specific TSA issues, the conclusion is that this topic is not relevant for Iceland for the time being.
20 The author proposes to use these thresholds; the threshold of 9 hours could be considered the upper limit for not having an overnight stay although theoretically the incidence of overnight stays could also be possible if one person wants to stay in a hotel in the proximity of the airport. The minimal threshold of 5 hours is to allow passengers reasonable time to exit and return at the airport.

36
3. The TSA tables
The presentation of TSA results is made through a set of tables. These are an essential part of any TSA and assessing their compliance with international standards is a core issue. In this chapter a general assessment of compliance will be presented followed by a detailed analysis of tables which were classified as demand side tables (referring to tourism consumption) and supply side tables (in Iceland referring output, value added, intermediate consumption, taxes on tourism output and employment). Also, a separate analysis is provided regarding the TSA table referring to non-monetary indicators (which is lacking from the Icelandic TSA).
3.1. General assessment of the compliance
TSA:RMF (2008) proposes ten tables whose purpose is promoting “homogeneity among countries” (TSA:RMF, 2008, p. 31). Some of them are derived from the Supply and Use Tables (SUTs) of National Accounts.
From these ten tables, only eight are considered a priority and should be developed in the first stage in order to comply sufficiently with TSA standards. The other two tables (TSA:RMF (2008), table 8 and table 9) should be considered only at latter stages of the TSA development as they have to face “some specific conceptual challenges” (TSA:RMF, 2008, para. 4.6). This is the reason why the compliance analysis does not include these two tables, at least for the time being.
The eight tables present details; of consumption of products and services purchased by visitors (TSA:RMF (2008) tables 1-4), of the supply of the industries that produce these (TSA:RMF (2008) table 5) and a reconciliation of supply and demand at the core TSA:RMF (2008) table 6). A table presenting employment in tourism industries (TSA:RMF (2008) table 7) is then provided while some non-monetary indicators (within TSA:RMF (2008) table 10) complete this set.
TSA:RMF (2008) states that these tables are considered only a “guide for presenting Tourism Satellite Account data” and recommends flexibility:
Each country should decide on the most adequate format for taking into account its tourism reality and scope of available data (TSA:RMF, 2008, para. 4.7).
In the last TSA publication for Iceland eleven tables were presented. 21 What is rather confusing for users is the fact that the numbering of the tables in the Annex of the publication
21 It should be clearly underlined that the analysis in this study reflects only the last TSA publication in 2011. However, it seems that in the previous TSA publications for Iceland there were some tables which were not found in the last TSA publication. For instance, in the first TSA publication there were two tables entitled “Export revenue from tourism industry and number of tourists” and “Number of overnight stays by tourists”. (Statistics Iceland, 2008, pp. 40-41). Also there was a table entitled “Tourism industry contribution to tourism

37
does not begin with 1 but with 7 (as they were seen as a continuation of other tables presented in the text of publication)22 (see Annex 4 for the format of the Icelandic TSA tables). So TSA tables numbered from 7 to 17 are in fact the Icelandic TSA tables for which the correspondence with TSA:RMF (2008) will be established.
The first two Icelandic TSA tables present only aggregated figures in a time series format (i.e. 2001 – 2009) referring to the “Tourism share of gross domestic product” and “Total internal consumption” which are the most important aggregates in the TSA (see chapter 4). The subsequent tables present the following aggregates also in a time series format (i.e. 2004 – 2009): “Tourism industry output (at basic prices)”, “Tourism industry gross value added”, “Tourism industry intermediate consumption”, “Total taxes on tourism outputs” and “Tourism industry output (at market prices)”. Following these there is one table summing up all these aggregates but only for 2009 while another table details internal tourism consumption for the same year. The last two tables present in the time series format Employment in tourism and Factor income in tourism.
It should be noted that seven Icelandic TSA tables are in time series format having current prices. The comparability between years is rather problematic under these conditions as inflation effects are not considered.23 An example of this is table 7 of the Icelandic TSA “Tourism share of gross domestic product 2001-2009”. It presents changes between years for some aggregates using current prices. This is useless in the opinion of the author. When presenting TSA data in time series format it is necessary to use constant prices.
TSA:RMF (2008) also recommends the usage of constant prices when a period of observation is envisaged and in this endeavour the principles used in national accounts should be considered, and moreover the usage of price indexes specific to tourism consumption:
… The presentation (a.n. in constant prices) is designed to emphasize changes in volume in activities distinct from changes in prices and facilitates comparison over time. The same general methods used in the compilation of national accounts at constant prices should be followed. Within this endeavour, it might be relevant to generate and use tourism-specific price indices in order to take into account that tourism consumption and the consumption of resident households within the economy might include different quantities of products, or the same quantities but combined in different proportions (TSA:RMF, 2008, p. 44).
related industry output and gross value added” which appeared both in the first and in the second TSA publications for Iceland but not in the third TSA publication. 22 The other six tables presented in the text of the 2011 TSA publication (see Statistics Iceland, 2011b) are in fact small tables used for analysing the data. Under no circumstances these could not be seen as TSA tables. 23 In Iceland in the period 2001-2011 the consumer price index (calculated as average change compared with previous year) fluctuated in average with 6.03% per year (Source: own calculation from Statistics Iceland, 2012, p. 217). Evidently, this jeopardizes the comparability over years.
Recommendation 12: The future TSA compilation in Iceland should consider the valuation in constant prices when presenting time series TSA data. If possible, tourism-specific price indexes could be created to better facilitate comparison over time.

38
Icelandic TSA does not respect the exact tabular format proposed by TSA:RMF (2008). However, a sort of correspondence between the TSA:RMF (2008) format and the one in Iceland could be established (see table 4).
It is important to mention that besides the TSA tables there is another table in the Icelandic TSA for which there is no correspondence with TSA:RMF (2008). It is called “Factor income in tourism” 24 (Statistics Iceland, 2011b, p. 26). There are no details provided on how compilation was made for this table. As this table is out of the scope of the recommendations provided by international standards no analysis will be performed. Nevertheless, one can assume that that this table is showing the evolution of value added since Statistics Iceland does calculate in its National Accounts “Gross domestic factor income” as a difference between value added and taxes on products to which subsidies on products are added (see: Statistics Iceland, 2011a, p. 76).
One can see from table 4 that there are five tables that are lacking from the Icelandic TSA. These refer to “Outbound tourism consumption”, “Production accounts of tourism industries and other industries”, “Tourism gross fixed capital formation”, “Tourism collective consumption” and “Non-monetary indicators”.
Regarding the last named, it is worth mentioning that in the first Icelandic TSA published in 2009, there was a table entitled “Number of overnight stays by tourists” (Statistics Iceland, 2008, p. 41) which could be considered a “hybrid form” of a table containing non-monetary indicators. Nevertheless, due to the fact that its rendering does not adhere to the format imposed by international standards and moreover it contained very limited data (to meet the request of TSA:RMF (2008) table 10), this table cannot be considered as a corresponding table to the one found in TSA:RMF (2008) table 10.
The valuation principle in the TSA should be the same as the one used in the System of National Accounts, meaning production valued at basic prices and consumption at purchasers’ prices should be used. This is almost fulfilled by Icelandic TSA: production is indeed valued at basic prices in Icelandic TSA table 9 but consumption is valued at “market prices” (in Icelandic TSA tables 15 and 8).
One can see different terminology used. “Market prices” one could consider roughly as “purchasers’ prices” from the demand-side perspective. As a specificity of the Icelandic TSA, production is also valued at market prices (in Icelandic TSA tables 13 and 14).
24 This table was included only in the second and the third TSA publication for Iceland.

39
Table 4: Establishing a general correspondence between TSA:RMF (2008) tables and Icelandic TSA tables. Source: author based on TSA:RMF, 2008 and Statistics Iceland, 2011b
TSA:RMF (2008) tables Icelandic TSA tables Explanation Inbound tourism expenditure by products and classes of visitors (table 1)
(*) Total internal tourism consumption at market prices (table 15)
It refers only to one column related to the inbound tourism consumption by products within Icelandic TSA table 15. However, there is no breakdown by classes of visitors in the Icelandic TSA.
Domestic tourism expenditure by products, classes of visitors and types of trips (table 2)
(*) Total internal tourism consumption at market prices (table 15)
It refers only to one column related to the domestic tourism consumption by products within Icelandic TSA table 15. There is no breakdown by classes of visitors and types of trips in Icelandic the TSA.
Outbound tourism expenditure by products and classes of visitors (table 3)
N/A There is no correspondent Icelandic TSA table.
Internal tourism consumption by products (table 4)
Total internal tourism consumption at market prices (table 15 and Table 8 in a aggregated and multiyear form)
There is a real correspondence.
Production accounts of tourism industries and other industries (at basic prices) (table 5)
N/A There is no real correspondence. However, there is a “misleading correspondence” with Icelandic TSA tables 9, 10 and 11 (see 3.3.1).
Total domestic supply and internal tourism consumption (at purchasers’ prices) (table 6)
Tourism share of gross domestic product (table 7) Tourism industry output at basic prices (table 9) Tourism industry gross value added (table 10) Tourism industry intermediate consumption (table 11) Total taxes on tourism outputs (table 12) Output, intermediate consumption and value added in tourism industry (table 14)
There are several different Icelandic TSA tables that correspond to TSA:RMF (2008) table 6.
Employment in the tourism industries (table 7)
Employment in tourism (table 16) A form of correspondence could be established but only at the level of employment as a measurement variable. The scope of measurement is different.
Tourism gross fixed capital formation of tourism industries and other industries (table 8)
N/A There is no correspondent Icelandic TSA table. However, this is out of the compliance analysis.
Tourism collective consumption by products and level of government (table 9)
N/A There is no correspondent Icelandic TSA table. . However, this is out of the compliance analysis.
Non-monetary indicators (table 10)
N/A There is no correspondent Icelandic TSA table.
(*) it signifies only part of the table

40
It should be borne in mind that there are some differences between TSA tables and SUTs, mainly concerning presentation of data and the level of detail. In this regard, in the first six TSA:RMF (2008) tables the net valuation of reservation services should be performed (which is not met in SUTs, see 2.6). Also TSA deals with the so called “dual classification of tourism expenses that are intermediate consumption of producers” (TSA:RMF, 2008, p. 32, see also 2.1). With reference to the latter, international standards clearly state that:
… such expenses are part of tourism consumption when the balance between supply and use of products is presented, and a cost of production of industries when establishing tourism direct gross value added (TSA:RMF, 2008, para. 4.13c).
Each of the TSA tables will be discussed in the next sections.
3.2. Demand side table(s)
From a demand side perspective, TSA:RMF (2008) proposes four tables referring to tourism expenditure and tourism consumption. The first three tables envisage tourism expenditure (inbound, domestic and outbound) while table 4 presents internal tourism consumption. For all these tables, tourism expenditure/consumption has to be broken down by 10 products for international comparability, 2 categories of country specific products, valuables and the residual category “Other consumption products”. Regarding the latter category it is stated that:
If relevant and feasible, countries should separately identify both components: tourism connected products and non-tourism related consumption products. In both cases goods and services should be separately identified (see: TSA:RMF, 2008, pp. 51-55).
These aspects were already discussed in part I of the conformity assessment (see: Frent, 2013, pp. 60-73).
TSA:RMF (2008) also proposes a breakdown for the first three TSA tables by classes of visitors, i.e. tourists (overnight visitors) and excursionists (same-day visitors). This is done to take into consideration the different consumption patterns of these two categories. In addition, in TSA:RMF (2008) table 2 a breakdown of domestic tourism expenditure by type of trips (domestic trips and outbound trips) is also required in order to highlight the domestic part of the outbound trips (which is a component of domestic tourism expenditure).
TSA:RMF (2008) table 4 is composed of internal tourism expenditure (which is a sum of inbound tourism expenditure and domestic tourism expenditure) and other components of tourism consumption. It should be remembered that the latter category is made up of three other subcategories: “Services associated with vacation accommodation on own account”, “Tourism social transfer in kind (except refunds)” and “Other forms of imputed consumption” (see: Frent, 2013, pp. 49-51). These should be presented separately, if possible (TSA:RMF, 2008, p. 55).

41
It is important to mention that these four tables also incorporate not only the expenditures paid by visitors themselves but also the expenditure of so called producers (businesses, government) or others which spend for their benefit (see 2.1. for more details on this topic). Also in all four tables the principle of net valuation of reservation services is carried out (see 2.6 for more details on this topic).
There are only two Icelandic TSA tables that present data from the demand-side (Icelandic TSA table 15 and Icelandic TSA table 8). Both of them refer to internal tourism consumption and therefore one might consider them as one. The Icelandic TSA table 8 is in fact an aggregated form of Icelandic TSA table 15 providing multiyear data.
In the Icelandic TSA, tourism expenditure is embedded in the tourism consumption concept (see: Frent, 2013, pp. 48-49). Therefore Icelandic TSA uses in its table “Inbound tourism consumption” instead of “Inbound tourism expenditure” and “Domestic tourism consumption” instead of “Domestic tourism expenditure”.
Overall some similarities and differences could be established between TSA:RMF table 4 and Icelandic TSA table 15. One can see more differences than similarities (see table 5).
Table 5: Similarities and differences between TSA:RMF table 4 (Internal tourism consumption by products) and Icelandic TSA table 15 (Total internal tourism consumption at market prices)
Similarities Differences • Internal tourism consumption as a sum
between inbound tourism consumption and domestic tourism consumption
• A detailed breakdown by products/industries • Valuation according with National Accounts
principles
• Tourism expenditure embedded in tourism consumption (not separately identified)
• No additional column for “Other components of tourism consumption” category
• Accommodation services provided by vacation homes are not separately presented
• Valuables are not separately identified • An additional breakdown of domestic
tourism consumption by households, corporations and government is included in the Icelandic TSA
• Additional row to present the share of internal tourism consumption in total consumption of the economy (defined as sum between private consumption and government consumption) is included in the Icelandic TSA table
• Additional rows to present percentage breakdown for each product/industry are part of the Icelandic TSA table
It should be recalled once again that there are two components of tourism consumption which were not separately presented in the Icelandic TSA. This is the case of “Tourism social transfer in kind” and “Other forms of imputed consumption”. Some issues about these

42
categories were already presented in part I of the conformity assessment (see: Frent, 2013, pp. 49-52).
Also, the case of vacation homes and valuables were discussed in the previous chapter (see 2.3 and 2.5.2). However, the fact that the Icelandic TSA presents an additional breakdown of domestic tourism consumption by households, corporations and government it is not considered a conformance with TSA:RMF (2008) but as a rather a specific way of presenting TSA data; in fact, one can say that in this case Icelandic TSA is doing more than international standards recommend. The same applies to the existence of some additional rows presenting percentage breakdown for each product/industry in Icelandic TSA table 15 (the breakdown is actually by the components of internal tourism consumption respectively inbound tourism consumption and domestic tourism consumption, the latter being further classified by households, corporations and government).
As previously mentioned, the consumption of excursionists is not separately presented in Icelandic TSA tables. However, this issue was discussed in detail in the previous chapter (see 2.7).
To summarise there is in fact only one Icelandic TSA table that presents data from the demand side (Icelandic TSA table 15). Inbound and domestic tourism are covered but outbound tourism is not envisaged by the Icelandic TSA. For the moment, the author considers that no priority should be allocated for surveying outbound tourism (the correspondent TSA:RMF (2008) table 3) as this is not part of the calculations envisaging Iceland as an economy of reference. There is no table in the Icelandic TSA to present tourism expenditure by classes of visitors (excursionists vs. overnight visitors). However, the fact that at least one column of the TSA:RMF table 1 and respectively table 2 is found in Icelandic TSA corresponding table 15 (the one presenting only total consumption by products but without breakdown by excursionists and overnight visitors) one can consider a sort of partial correspondence with TSA:RMF, although this also could be considered questionable since TSA:RMF table 4 is in fact comprising mainly the totals from TSA:RMF table 1 and 2. Nevertheless, the lack of separate tables for inbound tourism expenditure and domestic tourism expenditure is obvious.
An important remark has to be made regarding TSA:RMF table 2 which includes also the domestic component of outbound trips. It is likely that this component has some significance especially for air transport since most of the trips abroad made by Icelanders can be assumed to be undertaken with Icelandic airlines (Icelandair, Air Iceland and Wow Air) and the related expenditure are considered domestic tourism expenditure (assumption based on capacity figures, see: CAPA, 2012).
Recommendation 13: The future TSA compilation in Iceland should include distinct tables for inbound tourism expenditure and domestic tourism expenditure in which the expenditure of excursionists should be separately estimated.

43
From the demand side the expenditure related to the domestic part of an outbound trip can be captured by the future travel survey amongst Icelanders.
3.3. Supply side tables
The tables presenting production, intermediate consumption and value added are considered supply-side tables. By default, the table presenting employment was also included in this category.
3.3.1. Production accounts table
TSA:RMF (2008) table 5 presents “Production accounts of tourism industries and other industries (at basic prices)”. The format of the table is similar to the one in the System of National Accounts (2008). The output is broken down by products and it is valued at basic prices. Intermediate consumption is valued at purchaser’s prices and the difference between these two is called gross value added (at basic prices). Further, value added for each industry is split between “Compensation of employees”, “Gross operating surplus”, “Gross mixed income” and “Other taxes less subsidies on production” (TSA:RMF, 2008, para. 4.44). The classification of products and industries are the ones proposed by TSA:RMF (2008) (see: Frent, 2013, pp. 60-63). Table 5 also values reservation services (now from a supply side perspective) taking into account the net approach (see 2.6).
Usually, the compilation of TSA:RMF (2008) table 5 and also TSA:RMF (2008) table 6 is based on the Supply and Use Tables (Eurostat, 2009). There is no evidence that the previous TSA compilations in Iceland were based on SUTs. Rather, it seems that a sort of “bottom-up method” was used which was based on different data sources.
Apparently, there are three Icelandic TSA tables that relates to the TSA:RMF (2008) table 5 (see Figure 1). One can consider at first glance that there is compliance but this is a misleading assumption and this section will prove this fact.
All the related Icelandic TSA tables (table 9, 10 and 11) are in fact multiyear tables presenting data for the period 2004 – 2009 (Statistics Iceland, 2011b, pp.17-19). What could be observed
Recommendation 14: The future demand side survey amongst Icelanders should capture tourism expenditure related to the domestic part of outbound trips. Specific questions might be foreseen such as specification of airline, indicating categories of expenses made in Iceland before departing abroad (transportation to airport, accommodation or meals) or at least an approximation of total such expenses etc.

44
is that these tables are presenting output, intermediate consumption and gross value added for each tourism industry but without any product breakdown. Actually, there is no product breakdown in the Icelandic TSA (see: Frent, 2013, p. 64). Therefore, one can assume that the Icelandic TSA tables are in fact just parts of the corresponding TSA:RMF (2008) table 5 presenting aggregated data. One part is production, one part is intermediate consumption and one part is gross value added.
Figure 1: The apparent “misleading” correspondence between production accounts tables in Icelandic TSA and TSA:RMF (2008).
Nevertheless, the major difference between TSA:RMF (2008) and the Icelandic corresponding tables is the fact that there is no output, intermediate consumption or gross value added for a single tourism industry (as misleadingly indicated in the English title of the tables). The output (as well as intermediate consumption and gross value added) generated by tourism is calculated by using defined ratios.25 In other words, the production accounts of tourism industries are not presented in order to see the total industry output; 26 what is actually presented is an adjusted output (using tourism ratios) of each tourism industry. The same applies for intermediate consumption and gross value added.
25 These ratios are presented separately for each tourism industry only in the first version of Icelandic TSA in 2008 (for the reference year 2003) (see: Statistics Iceland, 2008 p. 18). In the last TSA publication in 2011 this was not done anymore. 26 However, it should be reminded that in the first and the second TSA compilation for Iceland there was a separate table entitled “Tourism industry contribution to tourism related industry output and gross value added” in which “Total output in tourism related industries” and “Total value added in tourism related industries” were presented (Statistics Iceland, 2008, p. 38). Actually, this table presented the output and value added for each of the tourism industry (which was not found in the last TSA compilation for Iceland in 2011).
TSA:RMF table 5 Production
accounts of tourism industries and other industries (at basic
prices)
Icelandic TSA table 9 Tourism industry
output at basic prices
Icelandic TSA table 10 Tourism industry gross
value added
Icelandic TSA table 11 Tourism industry
intermediate consumption

45
So there is no production of an (entire) tourism industry but production generated by tourism (i.e. tourism production, tourism intermediate consumption and tourism gross value added). By doing this, the Icelandic TSA tables 9, 10 and 11 are out of TSA:RMF (2008) recommendations for compilation of TSA:RMF (2008) table 5. From a certain perspective they are more related to TSA:RMF (2008) table 6 (see 3.3.2).
In addition to TSA:RMF (2008) table 5, an additional row is introduced in all the three Icelandic TSA tables referring to the share of total production, intermediate consumption and value added of the economy. This is not a departure from the standards.
To conclude, there is no TSA:RMF (2008) table 5 per se in the Icelandic TSA. The output of each of the tourism industries is not presented (at least this was the case for the last TSA compilation in 2011). So, no connection with Icelandic National Accounts was performed in this regard.
Moreover, Icelandic TSA table 10 presents no details about the components of value added through the following items: “Compensation of employees”, “Other taxes less subsidies on production”, “Gross mixed income” and “Gross operating surplus”. If this data had been compiled, valuable information would have been provided regarding the remuneration of the labour factor. This is another shortage of the Icelandic TSA.
The progress in improving National Accounts in Iceland will be vital for the future TSA implementation in this country. As mentioned in the previous study, part I of the conformity assessment, Statistics Iceland is working on a project to meet the European aquis in National Accounts and the first results are expected during 2014 (see: Frent, 2013, p. 30). Definitely this will provide the background for future TSA compilation.
Recommendation 15: The future TSA compilation in Iceland should present a table corresponding with TSA:RMF (2008) table 5 in which the production accounts of tourism industries (and the rest of the industries) have to be separately identified; in other words, to compile a real “TSA:RMF table 5”.
Recommendation 16: The future TSA compilation in Iceland should present also data on the components of gross value added for each tourism industry. Data from SUTs and data used for compilation of National Accounts in Iceland should be used in this endeavour.
46
3.3.2. The “core” TSA table(s)
The so called “core table” of the TSA system, TSA:RMF (2008) table 6 is where the “confrontation and reconciliation between domestic supply and internal tourism consumption take[s] place” (TSA:RMF, 2008, p. 40). The table details “Total domestic supply and internal tourism consumption (at purchasers’ prices)”. The table provides data for the compilation of the main TSA aggregates: “Tourism Direct Gross Value Added” and “Tourism Direct Gross Domestic Product” (these aggregates will be discussed in detail in chapter 4).
The format of the table is derived from the Supply and Use Tables of the System of National Accounts. It could be viewed as an “expanded form” of TSA:RMF (2008) table 5 sharing with this table the exact number of rows and columns regarding the production of tourism industries. In addition, for each column related to the production of tourism industries (taken from TSA:RMF table 5), a supplementary column (entitled “Tourism share”27) is introduced; Furthermore, there are two additional blocks of columns one block of columns presenting “Imports”, “Taxes less subsidies on products nationally produced and imported” and “Trade and Transportation margins” (in order to make the conversion from basic prices to purchasers’ prices) while the other block of column is made up of Internal tourism consumption (taken from TSA:RMF table 4) and a column entitled “Tourism ratio”. Regarding the latter, tourism ratio is calculated as a ratio between internal tourism consumption and domestic supply at purchasers’ prices (TSA:RMF, 2008, p. 63).
Icelandic TSA does not respect the tabular format recommended by TSA:RMF (2008). As it is, the TSA:RMF (2008) table 6 is not found in the Icelandic TSA. One can say that there are many Icelandic TSA tables that corresponds to TSA:RMF (2008) table 6. Therein two levels can be identified here: on the one hand there are multiyear tables and on the other hand there are one year tables. There are five multiyear Icelandic tables that could be considered related to TSA:RMF (2008) table 6. These are Icelandic TSA tables 7, 9, 10, 11 and 12 (see figure 2). There is only one one year table that relates to TSA:RMF (2008) table 6 and this is Icelandic TSA table 14 “Output, intermediate consumption and value added in tourism industry” (see figure 2). Also Icelandic TSA table 15 could be added to this list as an one year table that provides data for internal tourism consumption (which is also included as one column in TSA:RMF (2008) table 6). All these tables provide data by tourism industries and not by tourism products. Another schematic representation of how Icelandic TSA tables correspond with the core TSA:RMF (2008) table 6 is presented in Annex 8.
27 Tourism share is actually “the part of production that is allocated to internal tourism consumption” (Eurostat, 2009, p. 51).
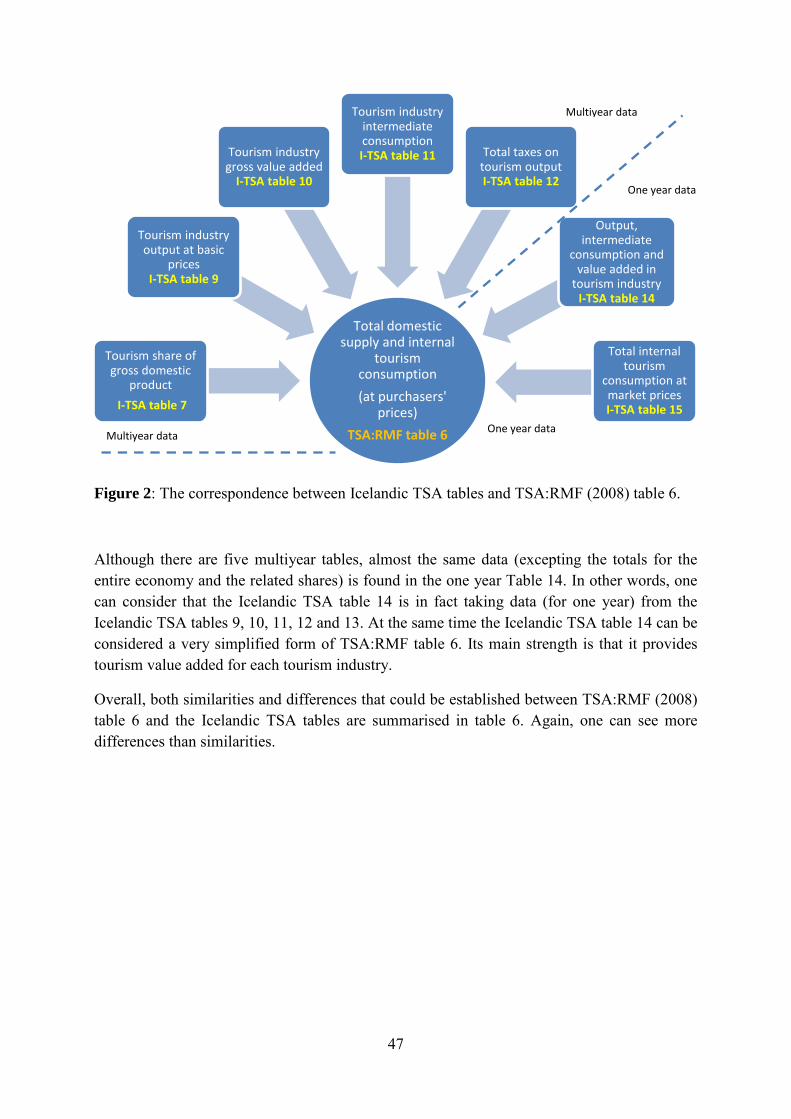
47
Figure 2: The correspondence between Icelandic TSA tables and TSA:RMF (2008) table 6.
Although there are five multiyear tables, almost the same data (excepting the totals for the entire economy and the related shares) is found in the one year Table 14. In other words, one can consider that the Icelandic TSA table 14 is in fact taking data (for one year) from the Icelandic TSA tables 9, 10, 11, 12 and 13. At the same time the Icelandic TSA table 14 can be considered a very simplified form of TSA:RMF table 6. Its main strength is that it provides tourism value added for each tourism industry.
Overall, both similarities and differences that could be established between TSA:RMF (2008) table 6 and the Icelandic TSA tables are summarised in table 6. Again, one can see more differences than similarities.
Total domestic supply and internal
tourism consumption
(at purchasers' prices)
TSA:RMF table 6
Tourism share of gross domestic
product I-TSA table 7
Tourism industry output at basic
prices I-TSA table 9
Tourism industry gross value added
I-TSA table 10
Tourism industry intermediate consumption I-TSA table 11 Total taxes on
tourism output I-TSA table 12
Output, intermediate
consumption and value added in
tourism industry I-TSA table 14
Total internal tourism
consumption at market prices I-TSA table 15
Multiyear data
Multiyear data
One year data
One year data

48
Table 6: Similarities and differences between TSA:RMF table 6 (Total domestic supply and internal tourism consumption (at purchasers' prices) and the Icelandic TSA table 14 (Output, intermediate consumption and value added in tourism industry) (but also Icelandic TSA tables 7, 9, 10, 11 and 12).
Similarities Differences • The existence of many tourism industries • Valuation according with National Accounts
principles • Tourism value added (at basic prices)
obtained as a difference between Output (at basic prices) and Intermediate consumption (at purchasers’ prices).
• Taxes on tourism products are included allowing calculation of Tourism GDP (which is equivalent with the Tourism Value Added at market prices in the Icelandic TSA)
• No product breakdown • There is no output, intermediate
consumption and gross value added of tourism industries separately presented (as output of the entire industry not as tourism output!)
• No breakdown by components of value added: “Compensation of employees”, “Other taxes less subsidies on production”, “Gross mixed income” and “Gross operating surplus”
• The issue of distribution margins in case of goods is not approached by Icelandic TSA tables
• The same applies to imports (only for the import content of goods and services purchased within Iceland)
• Tourism ratios are not separately presented (in the last TSA compilation)
• There is no single Icelandic TSA table following the format of TSA:RMF table 6 and where a clear reconciliation between supply and demand takes place
Particular attention should be paid to Icelandic TSA table 7, as this is the first table presenting Icelandic TSA data. As a multiyear table, table 7 presents only aggregated figures relating to tourism contribution to GDP. Actually, this table is the only table presenting “Tourism gross value added at market prices” and allows calculating “tourism share of GDP”. These are not part of the Icelandic TSA table 14.
One comment should be made relating to the second lower part of the Icelandic TSA table 7. It presents actually the percentage changes between years for “Tourism gross value added at basic prices”, “Taxes on tourism products”, “Tourism gross domestic product at market prices” and “Gross domestic production”. While these figures are expressed in current prices, this might be considered rather useless as the inflation effects are included in these figures, so the evolution in real terms in not shown and it is necessary to have a constant price approach (see also Recommendation 12).
Recommendation 17: The future TSA compilation in Iceland should not present anymore the evolution of TSA aggregates for a period of time (for several years) in current prices. Constant prices should be mandatory used in this endeavour.

49
It should be pointed out that the importance of other information from National Accounts necessary to compile TSA:RMF (2008) table 6 is made very clear:
Data from NA for net taxes on products (for production and imports) and detailed information for the different types of taxes levied on final products (such as consumption taxes on tobacco, fuel, alcohol), value added tax (VAT) and on imports are important for the compilation of the correspondent column of T6 (Eurostat, 2009, p. 52).
It should be said that excepting taxes (that were estimated in the Icelandic TSA table 12) no such data were separately presented in the Icelandic TSA. This is also the case for imports. Imports in TSA refer only to the goods and services purchased within Iceland that have an import component. Obviously, the main part is related to imported goods while for services it usually occurs in case of transportation services and in case of package tours for outbound trips provided by resident organizers. Supply and Use Tables provide data on imports by products which should be envisaged by TSA also.
3.3.3 Employment table
Generating employment is an important benefit of tourism and measuring employment is also part of TSA. TSA:RMF (2008) recommends the compilation of table 7 “Employment in the tourism industries” (TSA:RMF, 2008, pp. 64-65). In this table, for each tourism industry as a whole, employment is measured by indicators such us number of jobs, number of hours worked and number of full-time equivalent jobs. Additionally the number of establishments for each tourism industry is also calculated in this table (as it is also in TSA:RMF (2008) table 10c) in order to allow calculation of average indicators at the establishment level. Two levels of breakdowns are included here: gender and status in employment (employees and self-employed).
It should be clearly pointed out that according to TSA:RMF (2008) only employment related to tourism industries is envisaged and this is applied both to internationally comparable tourism industries and country specific tourism industries. These industries were already identified in Icelandic ISAT 2008 classification (see: Frent, 2013, p. 88). Therein no other employment in other industries than the ones defined as tourism industries is envisaged. In this regard, there is an evident limitation consisting in “ignoring employment in the non-characteristic industries” (Eurostat, 2009, p. 57). On the other hand, not all the employment generated by the tourism industries is due to the consumption of visitors but only a major part of it.
Hence, TSA:RMF (2008) recognizes how the measurement of employment is rather limited:

50
… the measures proposed here refer to a restrictive quantification of employment according to its statistical meaning (since not all volume of employment found in a given industry corresponds to tourism consumption) and coverage (since there are different levels of employment in other industries that partly correspond to tourism consumption) (TSA:RMF, 2008, para. 4.67).
Moreover, the complexity of “relating employment to a specific output of an industry or specific portions of different outputs” is recognized considering that “labour is a factor of production and is generally associated with an establishment in which, usually, various outputs are produced” (TSA:RMF, 2008, para. 4.63).
At the same time, TSA:RMF (2008) admits that there are countries that use tourism ratio for employment data, and this case has to be clearly specified:
Some countries may seek to narrow down the gross sum of total employment in the tourism industries towards the number of jobs, volume of hours worked, etc. actually attributable to servicing tourism internal consumption by applying the industry tourism ratios to measure these employment variables for each industry and summing the results. When such a modelling procedure is applied, the country should make clear that the assumption implicit in such a procedure is that the production function of any fraction of output of an industry consumed by visitors is the same as that of the total output of this industry (TSA:RMF, 2008, para 4.64).
It should be clearly pointed out that in the above case it is the “Tourism employment” aggregate which is estimated and not “Employment in tourism industries” as TSA:RMF table 7 recommends.
Eurostat offers a more flexible approach, which while admitting that it is “conceptually wrong” to determine “which part of a job is tourism characteristic and which part is not-tourism characteristics” (Eurostat, 2009, p. 59) it is considered proper to apply the ratio approach to some variables such us full-time equivalents and number of hours worked:
… variables that could be fractioned into a tourism and non-tourism component are full-time equivalent and hours worked, wages and salaries and compensations. For these variables it is possible and sensible to determine which part is tourism characteristic or not; it is possible to determine that a certain individual worked five hours serving visitors and two hours serving non-visitors, for instance (Eurostat, 2009, p. 59).
There is one employment table in the Icelandic TSA, namely “Table 16 Employment in tourism” (is. Störf í ferðaþjónustu). This is a multiyear table and presents only employment data according to the classification of tourism industries as defined in Icelandic TSA (see: Frent, 2013, p. 64, table 16).
So there are no indicators such as number of establishments, number of hours worked or number of full-time equivalents as requested by TSA:RMF (2008) table 7. Also no breakdown by gender and status of employment (employees and self-employed) is provided.

51
Overall, similarities and differences between Icelandic TSA table 16 and TSA:RMF (2008) table 7 were summarized (see table 7).
Table 7: Similarities and differences between TSA:RMF table 7 (Employment in the tourism industries) and Icelandic TSA table 16 (Employment in tourism).
Similarities Differences • The existence of many tourism industries • Presumably number of jobs are measured
• Icelandic TSA actually quantifies tourism employment (adjusted with tourism ratios) and not “employment in the (whole) tourism industries” as it is in TSA:RMF (2008)
• Variables such as number of hours worked, number of establishments, number of full-time equivalent jobs are not included
• There is no breakdown by status in employment and gender
• Icelandic TSA table 16 includes also Total employment (of the economy) and share of tourism employment in total employment (but this is not sanctioned by the TSA:RMF)
There is no description of the methodology estimating tourism employment in the Icelandic TSA. However, it is assumed that tourism industry ratios were applied to employment figures. Moreover, it is not clear what employment data sources were used: Labour Force Survey or administrative register such as the PAYE register. The assumption is the latter data source was used.
Regardless, what was used was “Tourism employment” instead of “Employment in tourism industries” as found in TSA:RMF (2008). So in the case of employment a departure from the standards is found.
In addition, the author considers it proper to continue to use the tourism ratios to derive “tourism employment” aggregates but only for full-time equivalents and number of hours worked and not for number of jobs. This is in accordance with Eurostat’s flexible approach on this topic. Nevertheless, this should be specifically mentioned very clearly in the future TSA publications in order not to create confusion among users.
Recommendation 18: The future TSA compilation in Iceland should also compile a table for “Employment in tourism industries” in conformity with TSA:RMF (2008) table 7. The new classification of tourism industries in Iceland (proposed in the part one of the conformity assessment – see Frent, 2013, p. 88) is recommended to be used. If possible (and available), National Accounts employment data should be used in this endeavour.
52
It should be reminded that in Iceland there are two major employment related data sources. The PAYE Register and Labour Force Survey both have to be fully used in the future TSA compilation. Details about these were provided in part I of the conformity assessment (see: Frent, 2013, pp. 30-31). As summarised there, at present there are no employment estimates made by National Accounts in Iceland. However, it was understood that the Icelandic Labour Force Survey collects data on the number of hours worked (per week) allowing also (at least theoretically) the calculation of full time equivalents. Also, the Labour Force Survey has data on gender breakdown required by TSA.
If in the near future, the compilation of National Accounts employment data will not be available in Iceland, the future TSA employment estimations should however “follow the National Accounts rules and concepts for exhaustiveness purposes” (Eurostat, 2009, p. 58).
In addition to follow TSA:RMF (2008) measurement of employment, an advanced system under the so called “employment module” can be created within TSA. This was recommended by UNWTO as complementary to the TSA system. The methodological guidelines were already provided by OECD in its Employment Module released in 2000 (see: OECD, 2000) and some countries have already developed such a system, e.g. Portugal, Austria, Poland and the Czech Republic (Eurostat, 2009). Considering the limited availability of data sources related to employment in Iceland, for the time being no recommendation is made referring to compiling such an employment module for this country.
3.4. A future Icelandic TSA table with non-monetary indicators
TSA:RMF (2008) proposes a table with non-monetary indicators for TSA called table 10. The aim of these indicators is to help the analysis of monetary data presented in the previous tables (tables 1-6). Their importance is clearly stated also by SNA (2008):
Data measured in physical or other non-monetary units should not be considered a secondary part of a satellite account. They are essential components, both for the information they provide directly and in order to analyse the monetary data adequately (SNA, 2008, para. 29.84).
At the same time, it is specified by TSA:RMF (2008) that there is a need to “improve the link between the provisional list of non-monetary indicators and the monetary tables” (TSA:RMF,
Recommendation 19: The future TSA compilation in Iceland might continue to produce employment data derived from tourism consumption (using tourism ratios) in a supplementary table. However, this should be applied only for Full-time equivalent jobs and Number of hours worked and a clear specification of this case should be made in the future TSA publications.

53
2008, para. 4.77). By doing this, international organizations recognize their provisional character and necessity for further research in this field.
TSA:RMF (2008) table 10 is actually composed on four different tables (TSA:RMF, 2008, pp. 71-72):
10a. Number of trips and overnights by forms of tourism and classes of visitors 10b. Number of arrivals and overnights (in inbound tourism) by modes of transport 10c. Number of establishments and capacity by types of accommodation 10d. Number of establishments in tourism industries classified according to average number of jobs
In table 10a the “classes of visitors” refers to tourists (overnight visitors) and excursionists (same-day visitors). The inbound, domestic and outbound tourism are considered as forms of tourism. One can consider that number of inbound and outbound trips is equivalent with number of arrivals (of foreign visitors) and respectively departures (of Icelandic residents, in this case).
The classification by modes of transport in table 10b is made according to the standard classification of modes of transport proposed by UNWTO (see: Frent, 2013, pp. 40). Both arrivals and overnights are the proposed variables.
In table 10c, the following variables are required: number of establishments, capacity (number of rooms and number of beds), capacity utilization (room occupancy and bed occupancy). Here the breakdown is by the main ISIC Rev. 4 four digit level activities related to the industry “Accommodation for visitors” as proposed by IRTS (2008).
Table 10d presents the number of establishments belonging to each tourism industry which are further categorized upon average number of jobs provided (the following categorization is recommended 1-4, 5-9, 10-19, 20-49, 50-99, 100-249, 250-499, 500-999 and >1 000).
As previously mentioned, there was no Icelandic TSA table providing non-monetary indicators in the last TSA publication for Iceland. These indicators would provide valuable information that could allow the calculation of some “average” indicators. Nevertheless, the last TSA publication for Iceland presents (within the text analysis) some “average per tourist” indicators but only referring to inbound tourism consumption/expenditure (Statistics Iceland, 2011b, p. 8). Detailed there were:
- Average expenditure by tourists (is. Meðalútgjöld á ferðamenn) - Average Tourists Expenditure by day (is. Meðalútgjöld á dag) - Average Expenditure by SDV (Same day visitors) on cruise ships (is. Meðalútgjöld á
dagsferðamenn) - Average Expenditure by overnight stays (is. Meðalútgjöld á gistinætur alls) - Average Expenditure per night (is. Meðalútgjöld á gistinótt)

54
Non-monetary indicators which have led to calculation of these “average indicators” were not separately shown. One might consider that the publication of such data without presenting also the non-monetary indicators could jeopardize the reliability of TSA data.
In Europe, few countries compile these tables; nevertheless it is recognized by Eurostat that:
… the fact that table 10 in not compiled within the TSA does not mean that countries do not have at least part of the information available; it may only not have been published (Eurostat, 2009, p. 68).
This is also the case of Iceland, and that is why a further analysis of the feasibility of the compilation of these tables for Iceland will be discussed in the following sections. Some of them were renamed in order to reflect better the statistical reality of Iceland. Data sources of these indicators were analysed and data were presented either for one year or for the whole 2003 - 2013 period (see Annex 5). An exception from this is TSA:RMF (2008) table 10d, since for the time being there is a lack of data sources in Iceland to provide number of establishments in tourism industries. This will thus not be discussed below.
3.4.1. Trips and overnights by forms of tourism and classes of visitors in Iceland
According to TSA:RMF (2008) both the number of trips and overnights have to be presented for each form of tourism (inbound, domestic and outbound) and within each form of tourism there is a breakdown by types of visitors (tourists and excursionists).
For inbound tourism in Iceland the following data sources are available:
• Counting foreign visitors performed by Icelandic Tourist Board (at Keflavík airport and Seyðisfjörður port) for number of tourists departing (assuming all of them were overnight visitors in Iceland)
• Cruise statistics (data provided by Icelandic ports) for number of excursionists • Accommodation statistics (from Statistics Iceland) for number of overnights
For domestic tourism unfortunately there are no data available as there is no regular survey carried out amongst Icelanders to capture number of trips and same-day visits. However, only overnights provided by Accommodation Statistics can be partly used taking into consideration that they only refer to official accommodation providers while overnights in second homes or staying at friends and relatives are not covered. The latter was traditionally considered as
Recommendation 20: The future TSA compilation in Iceland should clearly indicate the non-monetary indicators used in deriving average expenditure indicators.

55
being “private accommodation” and in the lack of any survey the following solution is recommended:
Whenever specific private accommodation statistics are not available, surveys on tourism expenditure and on behaviour can be used to estimate private accommodation overnight stays (Eurostat, 2009, p. 67).
In Iceland the ITB’s commissioned survey amongst Icelanders provides this data but in the actual questionnaire the multi-answer possibility referring to the types of accommodation can hardly be used.28 It is important to underline that according to Statistics Iceland 2007-2008 demand side travel survey more than two thirds of overnights made by Icelanders in Iceland (67.8%) were in the so called “private accommodation” sector.29
Regarding outbound tourism, number of trips and overnights do not exist due to the lack of regular survey carried out amongst Icelanders. Instead, number of departures of Icelanders registered at Keflavík airport and Seyðisfjörður port by Icelandic Tourist Board can be used as a proxy for number of trips. Also the departures of Icelanders abroad from the other airports having international traffic (Reykjavík, Akureyri, Egilsstaðir) should be added. Annex 5 presents this data.
A special issue is undeclared overnight stays which also should be included in this table. In this regard it is important to present Eurostat guidelines:
It is also important to consider undeclared overnight stays, if there are any. In principle, this data has already supported the estimations of the undeclared accommodation services in the other TSA tables (and also NA estimations). The number of undeclared overnight stays is usually obtained from the confrontation of supply data figures on overnight stays with those from the demand side of tourism surveys (Eurostat, 2009, p. 67).
In other words, the difference between what people declare (usually through a household survey) and what actually gets reported by accommodation establishments should give the number of undeclared/unreported overnight stays by accommodation establishments.
Statistics Iceland in its National Accounts compilations usually estimates the “hidden activity” in the category “Camping sites and other provision of short-stay accommodation” (Statistics Iceland, 2011a, p. 183). In this context it is important to say that 100% was the direct estimated hidden activity for this category (Statistics Iceland, 2011a, p. 71). The figure estimated for unreported overnight stays of accommodation providers excepting hotels and guesthouses was 148.2% for period May 2007 – April 2008 (see Annex 6). 28 For instance, according with Icelandic Tourist Board in 2013 among Icelandic residents, 48.5% stayed with friends and relatives, 41.6% stayed in “privately owned summer cottage or apartment” and 37.3% stayed in “association-owned holiday cottage”. (Icelandic Tourist Board, 2014a, p. 25). Due to the multi-answer possibility these exceeds 100% and it is useless in analysing the accommodation types which are not covered by Statistics Iceland. 29 This category actually cumulates the following categories: “Private holiday houses”, “Holiday houses owned by trade or company unions”, “Accommodation with friends and relatives” and “Other”. These categories have no correspondence with Accommodation Statistics. (see: Frent, 2013, p. 41, table 9).

56
An experimental table 10a was elaborated for Iceland for 2013 (see table 8). It should be mentioned once again that due to lack of data domestic tourism is not included. Annex 5 presents this data for the whole period 2003 – 2013.
Table 8: Number of trips and overnights in inbound and outbound tourism in Iceland in 2013 – Experimental TSA:RMF Table 10a. Source: Icelandic Tourist Board, 2014c, Statistics Iceland, 2014f and Icelandic Tourism Research Centre, 2014
Inbound tourism Outbound tourism Tourists
(overnight visitors)
Excursionists (same-day visitors) –
Arrivals on cruise ships
only
Visitors Tourists (overnight visitors) –
Departures of Icelanders
abroad
Excursionists (same-day visitors)
Visitors
Number of trips
807,349 226,820 1,034,169 381,675 * 381,675
Number of overnights
3,366,252 N/A 3,366,252 … N/A …
* - insignificant and/or negligible for Iceland for the time being (see 2.7) … - data not available Note: Number of trips equals number of arrivals in inbound tourism (ITB’s data summing Keflavík airport, Smyril line and estimations from other airports) while in outbound tourism equals numbers departures abroad made by Icelanders.
In case of inbound tourism the figure covered only the overnights registered in accommodation establishments and reported by Statistics Iceland. No reliable data is available at this moment to perform any estimation of overnights of foreigners for the so called “private accommodation” (staying with friends and relatives or in second homes). That is why for the time being only this “partial figure” is used. Number of cruise visitors’ arrivals (as a proxy for the number of arrivals made by inbound excursionists) was taken from the database of Icelandic Tourism Research Centre which is based on figures from individual ports.
Regarding outbound tourism, number of departures of Icelanders abroad is obtained as a sum of the number of departures registered at Keflavík airport, the number of departures of Icelanders from the other airports and the number of departures of Icelanders with ferry (see Annex 5).
3.4.2. International arrivals in Iceland by modes of transport
It is important to mention that according to TSA:RMF (2008) table 10b, overnights by modes of transport should also be included in addition to arrivals. However, the lack of a border survey that presumably would provide such data for Iceland leaves only arrivals to be considered as this data are continuously reporting by the Icelandic Tourist Board in its
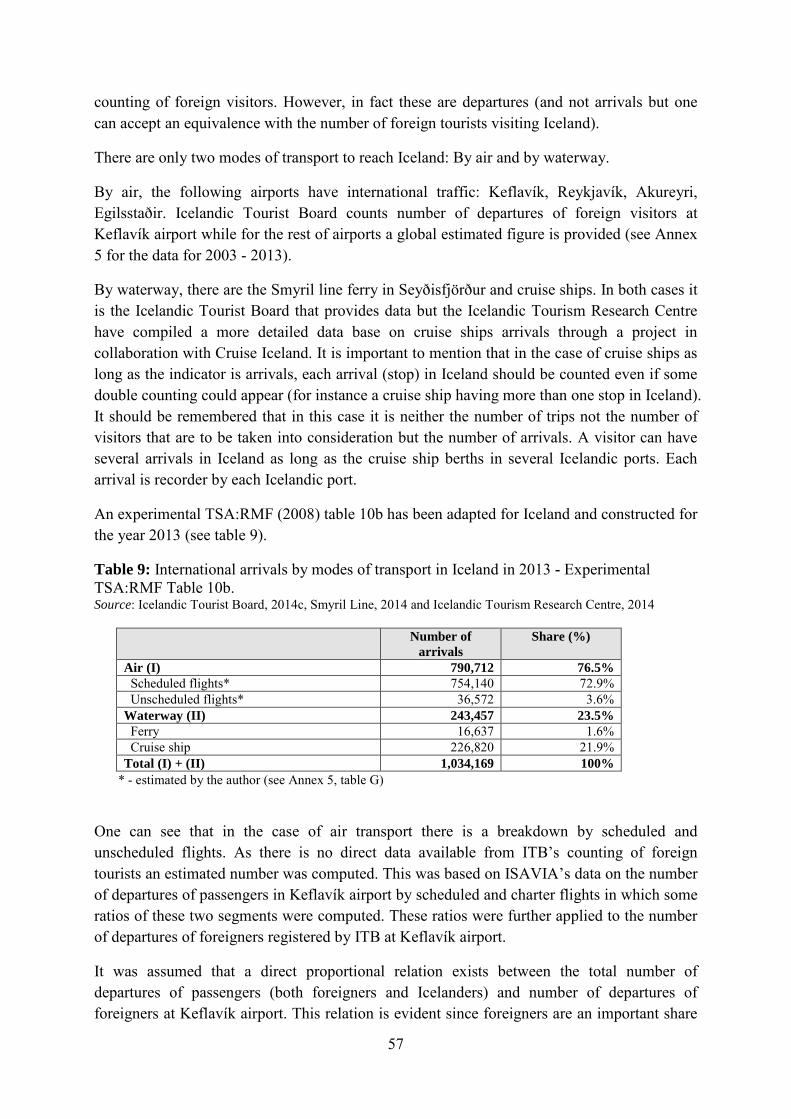
57
counting of foreign visitors. However, in fact these are departures (and not arrivals but one can accept an equivalence with the number of foreign tourists visiting Iceland).
There are only two modes of transport to reach Iceland: By air and by waterway.
By air, the following airports have international traffic: Keflavík, Reykjavík, Akureyri, Egilsstaðir. Icelandic Tourist Board counts number of departures of foreign visitors at Keflavík airport while for the rest of airports a global estimated figure is provided (see Annex 5 for the data for 2003 - 2013).
By waterway, there are the Smyril line ferry in Seyðisfjörður and cruise ships. In both cases it is the Icelandic Tourist Board that provides data but the Icelandic Tourism Research Centre have compiled a more detailed data base on cruise ships arrivals through a project in collaboration with Cruise Iceland. It is important to mention that in the case of cruise ships as long as the indicator is arrivals, each arrival (stop) in Iceland should be counted even if some double counting could appear (for instance a cruise ship having more than one stop in Iceland). It should be remembered that in this case it is neither the number of trips not the number of visitors that are to be taken into consideration but the number of arrivals. A visitor can have several arrivals in Iceland as long as the cruise ship berths in several Icelandic ports. Each arrival is recorder by each Icelandic port.
An experimental TSA:RMF (2008) table 10b has been adapted for Iceland and constructed for the year 2013 (see table 9).
Table 9: International arrivals by modes of transport in Iceland in 2013 - Experimental TSA:RMF Table 10b. Source: Icelandic Tourist Board, 2014c, Smyril Line, 2014 and Icelandic Tourism Research Centre, 2014
* - estimated by the author (see Annex 5, table G)
One can see that in the case of air transport there is a breakdown by scheduled and unscheduled flights. As there is no direct data available from ITB’s counting of foreign tourists an estimated number was computed. This was based on ISAVIA’s data on the number of departures of passengers in Keflavík airport by scheduled and charter flights in which some ratios of these two segments were computed. These ratios were further applied to the number of departures of foreigners registered by ITB at Keflavík airport.
It was assumed that a direct proportional relation exists between the total number of departures of passengers (both foreigners and Icelanders) and number of departures of foreigners at Keflavík airport. This relation is evident since foreigners are an important share
Number of arrivals
Share (%)
Air (I) 790,712 76.5% Scheduled flights* 754,140 72.9% Unscheduled flights* 36,572 3.6% Waterway (II) 243,457 23.5% Ferry 16,637 1.6% Cruise ship 226,820 21.9% Total (I) + (II) 1,034,169 100%

58
of total number of passengers departing from Keflavík airport. For instance, in 2013 according with ITB’s counting at Keflavík airport 68.2% of departing passengers were foreigners. Anyway, in the period 2003-2013 the average share of foreigners departing from Keflavík airport accounted for 56.4%.
The computation of the breakdown of foreign visitors by scheduled and unscheduled flights was performed in a first stage for Keflavík airport. It should be reminded that there are still foreign visitors arriving in Iceland by air using other Icelandic international airports Reykjavík, Akureyri and Egilsstaðir. These figures are separately presented by the Icelandic Tourist Board for the period 2008-2013 in its publications “Iceland in figures”. Regarding the period 2003-2007 these were estimated by the author as a difference between data on Total arrivals by air and sea and data from Keflavík airport and Smyril line (see Table A in Annex 5).
It should be clearly stated that there is no statistical data (provided by ISAVIA) regarding the number of international passengers by scheduled and unscheduled flights for each of the three airports. Also in this case, some estimations have to be done. In this regard, it is important to mention that the share of foreign visitors from these three airports in the total number of foreign visitors arriving in Iceland by air is rather low accounting on average for 2.1% of arrivals in the period 2003-2013 (own calculations based upon ITB data). Taking these into consideration it is reasonable to assume that the same shares calculated from Keflavík can be applied to the cumulated figures of foreign visitor arrivals from the other three airports. Even if assuming that the percentage of charter flights could be theoretically higher on these three airports compared with the ones from Keflavík airport, one can suspect that these will not have a great influence on the final results as foreign visitors are overwhelmingly arriving in Iceland by air through Keflavík airport (in 2013 the share of Keflavík in total foreign arrivals by air in Iceland accounted for 98.8% while for the whole period 2003-2013 this share was in average 97.9% - own calculation upon Icelandic Tourist Board data).
Annex 5 presents this data for the period 2003 – 2013.
3.4.3. Capacity and occupancy of accommodation industry in Iceland
From the very beginning, it should be clearly pointed out that capacities and occupancies in the Real estate activities in ISIC 68 are not included as there are no data sources to provide such data for Iceland. Only the traditional accommodation sector (defined by UNWTO as ISIC 55) is included. However, vacation homes (summer houses) were added to this only as the physical number of such establishments. That data is provided by Registers Iceland.
As mentioned before, TSA:RMF (2008) table 10c proposes that the indicators related to capacities and occupancy should be divided into three ISIC Rev. 4 industries: “55.1 Short-term accommodation”, “55.2 Camping grounds, recreational vehicle parks and trailer parks”, “55.3 Other accommodation”. These are easily identified in ISAT 2008 respectively NACE

59
Rev. 2 and Statistics Iceland does have this data. Actually this kind of data is also requested by Eurostat in response to the EU Regulation of tourism statistics. In this domain, Iceland is fully aligned with EU requests.
For exemplification, an experimental table was prepared for the year 2013 (see table 10).
Table 10: Capacities and occupancy of accommodation units in Iceland in 2013 - Experimental TSA:RMF Table 10c. Source: Statistics Iceland, 2014g; 2014d; 2014e and Registers Iceland, 2014a
Accommodation in NACE Rev. 2/ISAT 2008 55 Vacation homes Short-term
accommodation activities
(NACE/ISAT 55.1 + 55.2)
Camping grounds, recreational vehicle
parks and trailer parks (NACE/ISAT
55.3)
Other accommodation (NACE/ISAT
55.9)
Summer houses (according with
Registers Iceland)
Number of establishments
758 158 … 12,574
Number of beds* 34,152 … … … Number of rooms 13,967 N/A … … Room occupancy (%) 54.3 N/A … … Beds occupancy (%) 43.6 … … …
* - in case of camping these would be places for tents and caravans … - data not available
Annex 5 presents this data for the period 2003 – 2013.
Iceland does have the data to compile TSA:RMF (2008) table 10 even if these were not presented in the previous TSA compilations for Iceland. Even without a demand side survey amongst Icelanders, there is certain data that can be used although some shortcomings are still evident.
***
In this chapter, an assessment of the compliance with TSA:RMF (2008) standards for the Icelandic TSA tables was carried out. These are summarized and briefly presented once again in Annex 7. As in the case of TSA special issues, three level of compliance were used: Fully compliant, Partially compliant and Non-compliant. In judging two of three levels the “Frent and Frechtling approach” was applied (see: Frent and Frechtling, 2013, p. 20).
Unfortunately, there was no Icelandic TSA table found to be fully compliant with TSA:RMF (2008). Instead the majority of Icelandic TSA tables can be considered partially compliant
Recommendation 21: The future TSA compilation in Iceland should include separate tables with non-monetary indicators. The format provided in this section could easily be adopted.

60
and this was the case of the Icelandic TSA tables 7, 8, 9, 10, 11, 12, 14 and 15. The following Icelandic TSA tables were found not compliant with international standards: 13, 16 and 17. While Icelandic TSA table 17 (Factor income in tourism) has no TSA:RMF counterpart table, the Icelandic TSA table 13 and 16 requires additional explanations.
Icelandic TSA table 13 presents “Tourism industry output at market prices” which are not found in any rows and/or column of TSA:RMF (2008) table 6. Meanwhile this table calculates domestic supply (at purchasers’ prices) for each product which is different from the “Tourism output at market prices” which is in fact the output of each tourism industry as a result of tourism consumption. A special situation is the Icelandic TSA table 16 “Employment in tourism” which has a counterpart in TSA:RMF (2008) but the measurements within this table did not envisage the employment for the whole tourism industry (as proposed by TSA:RMF table 7) but instead the “tourism employment” concept was used (see 3.3.3). This is not in accordance with TSA:RMF (2008) recommendations.
At the same time, there are important TSA:RMF tables which were not found in the Icelandic TSA: “Production accounts in the tourism industries” (TSA:RMF table 5) and “Non-monetary indicators (TSA:RMF table 10)”; these are not presented in Icelandic TSA.


62
4. The TSA aggregates
The compilation of TSA aggregates offers a clear picture of the macroeconomic importance of tourism. The aggregates obtained are derived from the TSA tables outlined in the previous chapter. Some of these aggregates can easily be expressed as shares of the corresponding aggregates in the System of National Accounts (SNA). This chapter will present a general overview of the aggregates both in the TSA:RMF (2008) and in the Icelandic TSA. Thereafter a distinct analysis will be carried out for each of them from the perspective of international standards and then from the current state of affairs in the Icelandic TSA.
4.1. General overview
The size of tourism within the economy is characterized by aggregates which have to be “consistent with similar aggregates for the total economy and for other productive economic activities and functional areas of interest” (TSA:RMF, 2008, para. 1.15). In fact, TSA might be considered “an ideal instrument to measure a number of macro-economic aggregates” (Vanhove, 2011, p. 41). This is due to its nature as an extension of National Accounts.
The TSA aggregates belong to two categories: the “main aggregates” and the “other aggregates” (see TSA:RMF, 2008, pp. 45 and 48). This is in accordance with the two or more stages of development recommended for TSA compilation depending on the availability of data sources in the reference country (TSA:RMF, 2008, para. 4.3). The main aggregates proposed are:
• Internal tourism expenditure • Internal tourism consumption • Gross value added of tourism industries (GVATI) • Tourism direct gross value added (TDGVA) • Tourism direct gross domestic product (TDGDP)
The “other aggregates” recommended are:
• Tourism employment • Tourism gross fixed capital formation • Tourism collective consumption • Tourism internal demand
Referring to the latter set of aggregates, it should be clear that “with the exception of tourism employment, they should be the object of a more advanced development of the Tourism

63
Satellite Account” (TSA:RMF, 2008, para 4.99). Consequently, these will not be treated in this conformity assessment except employment.30
A correspondence between the TSA:RMF (2008) aggregates and the ones found in the Icelandic TSA can be established (see Table 11). In table 11 only the last TSA publication for Iceland is considered. One can see that out of six aggregates proposed by TSA:RMF (2008) only four are found in the Icelandic TSA publication. There are two aggregates that are not found in the Icelandic TSA namely “Internal tourism expenditure” and “Gross value added of tourism industries”. On the other hand, three additional “specific” Icelandic TSA aggregates (which are not found in TSA:RMF, 2008) were identified:31 “Tourism industry output at market prices”, “Tourism industry intermediate consumption” and “Total taxes on tourism outputs”.
Table 11: General correspondence between TSA aggregates. Source: author based on TSA:RMF, 2008 and Statistics Iceland, 2011b
TSA:RMF (2008) Icelandic TSA Internal tourism expenditure … Internal tourism consumption Total internal tourism consumption at market prices
(is. Neysla ferðamanna innanlands á markaðsvirði) Gross value added of tourism industries … Tourism direct gross value added Tourism gross value added at basic prices
(is. Vinnsluvirði í ferðaþjónustu á grunnverði) Tourism direct gross domestic product Tourism gross value added at market prices
(is. Vinnsluvirði í ferðaþjónustu á markaðsverði) Tourism employment - Employment in the tourism industries
Employment in tourism (is. Störf í ferðaþjónustu)
… Tourism industry output at market prices (is. Framleiðsluvirði í ferðaþjónustu á markaðsvirði)
… Tourism industry intermediate consumption (is. Aðfanganotkun atvinnugreina í ferðaþjónustu)
… Total taxes on tourism outputs (is. Skattar á ferðaþjónustu)
… - lack of correspondence
In the Icelandic TSA “Internal tourism expenditure” is not separately identified but embedded in the “Internal tourism consumption” (see: Frent, 2013, pp. 48-49). “Internal tourism expenditure” is actually the sum between “Inbound tourism expenditure” and “Domestic tourism expenditure”. So in the Icelandic TSA instead of “Inbound tourism expenditure” there is “Inbound tourism consumption” and instead of “Domestic tourism expenditure” there is “Domestic tourism consumption”. According to TSA:RMF (2008) “Tourism consumption” is conceptually larger than “Tourism expenditure” (see: Frent, 2013, pp. 49-52).
The Icelandic TSA does not make this distinction between tourism expenditure and tourism consumption but it should have made it in order to be aligned with the international standards.
30 However, the follow up study of this one envisages these aggregates. 31 These were considered separate aggregates since for each of them the share in the corresponding aggregate for the total economy is provided in Icelandic TSA tables. Nevertheless, this was not the case of “Factor income in tourism” identified in Icelandic TSA table 17 where only volume indices are presented.

64
Regarding “Gross value added of tourism industries” (GVATI), although this was presented in the first two TSA publications for Iceland, it is not found in the last TSA publication from 2011. One can consider this a lack of continuity in approaching TSA and also as a lack of transparency. However, presumably in the compilation of the Icelandic TSA data on production, intermediate consumption and gross value added for each tourism industry were used before applying tourism ratios.
GVATI is very easily calculated as it is defined:
GVATI simply sums the total gross value added of all establishments belonging to tourism industries, regardless of whether all their output is provided to visitors and the degree the specialization of their production process. It leaves out the value added from other non-tourism industries whose outputs have been acquired by visitors or by others for their benefit (TSA:RMF, 2008, para. 4.86).
Due to the fact that GVATI comprises only the tourism industries and not all other industries (where the consumption of visitors can also occur), it is not considered a very proper aggregate to characterize the tourism sector and this fact is clearly indicated by international standards (see TSA:RMF, 2008, para. 4.87). Nevertheless, this does not mean that this aggregate should not be computed.
Each of the four aggregates for which a correspondence can be established (see table 11) will be separately treated in the following sections. This analysis builds not only on the Icelandic TSA aggregates but also their counterparts in TSA:RMF (2008). Regarding the three Icelandic TSA aggregates which are not found in TSA:RMF (2008), these will not be specifically analysed for conformity.
Recommendation 22: The future TSA compilation in Iceland should separately present the aggregate of Internal tourism expenditure as recommended by TSA:RMF (2008).
Recommendation 23: The future TSA compilation in Iceland should transparently present and calculate data on Gross value added for each tourism industry. This will allow the calculation of Gross Value Added of Tourism Industries (GVATI) as recommended by TSA:RMF (2008).

65
4.2. Internal tourism consumption vs. Total internal tourism consumption (at market prices)
Internal tourism consumption goes beyond of the concept of tourism expenditure by including in addition “services associated with vacation accommodation on own account, tourism social transfer in kind and other imputed consumption” (TSA:RMF, 2008, p. 12). This was discussed in the part one of the conformity assessment (see: Frent, 2013, pp. 49-52).
Internal tourism consumption is a key aggregate in TSA derived from TSA:RMF (2008) table 4. It allows the calculation of other important aggregates such us “Tourism direct gross value added” and “Tourism direct gross domestic product”.
At the same time “Internal tourism consumption” is the sum between “Domestic tourism consumption” and “Inbound tourism consumption”. This is the way the corresponding aggregate in the Icelandic TSA named “Total internal consumption” (is. Neysla ferðamanna innanlands) is obtained. Further, in the Icelandic TSA domestic tourism consumption is made up of consumption in “Households”, “Corporations” and “General government”. This cannot be considered a departure from the standards.
TSA:RMF (2008) emphasises comparing the TSA aggregates to the corresponding aggregates from the System of National Accounts. This was done in the Icelandic TSA also in the case of “Internal tourism consumption”, both in the Icelandic TSA table 8 and in table 15.
Thus, in the Icelandic TSA table 15 the share of internal tourism consumption in total consumption of the economy (defined as the sum of “Private consumption” and “Government consumption”) is presented in a separate row. Nevertheless, one observation has to be made in this regard. As “Internal tourism consumption” contains also the “Domestic tourism consumption” related to business tourism expenses which is recorded as an intermediate consumption according to National Account principles, “Internal tourism consumption” should not be expressed as a share of total consumption (private and governmental). This is very clearly stated in TSA:RMF (2008):
This difference in scope should not be forgotten when trying to compare aggregates related to tourism consumption with aggregate household final consumption, as the scope of tourism consumption extends beyond that of household final consumption, so that tourism consumption is not always part of household final consumption of the corresponding individuals (TSA:RMF, 2008, para. 2.33).
However, if the TSA compiler/user wants to benchmark these values the only reasonable solution would be to remove the consumption related to businesses tourism expenses from “Internal tourism consumption”. Table 12 presents the adjusted figures resulting from removing “Corporations” from “Domestic tourism consumption”. Even if the difference is not too great (0.4%), for a correct comparison the adjustment for business travel has to be performed.

66
A special remark has to be made in relation to “Inbound tourism consumption” which is not part of total consumption in the economy defined here as a sum of “Private consumption” and “Government consumption”. Instead, “Inbound tourism consumption” is part of the exports at the macroeconomic level. Therefore, the calculation of its share is rather useless and it was not done in the table 12.
Table 12: Calculating an adjusted share of internal tourism consumption for Iceland in 2009. Source: own calculation upon Statistics Iceland, 2011b, p. 23
Total internal tourism
consumption
Inbound tourism
consumption
Domestic tourism
consumption
Of which households
Of which corporation
Of which general
government
Total internal tourism consumption (1)
183,670 111,316 72,354 64,434 4,205 3,716
Total consumption in the economy* (2)
1,161,403 N/A
% of internal tourism consumption (3) = (1) / (2)
15.8 9.6 6.2 5.5 0.4 0.3
Adjusted internal tourism consumption (4)
179,466 111,316 68,150 64,434 - 3,716
Adjusted % of internal tourism consumption (5) = (4) / (2)
15.4 n.c. 5.8 5.5 - 0.3
* - defined as a sum between private consumption and government consumption n.c. - not calculated
However, the calculation of this adjusted share of “Internal tourism consumption” is not 100% accurate. It has to be taken into consideration that the “Corporation” component of “Domestic tourism consumption” is not a 100% part of intermediate consumption since a part of the “Corporation” component could also be considered “Compensation of employees (and thus part of “Household final consumption” ) according to National Account procedures (e.g. expenditure for meals) (see 2.1.1). It would be practical to consider that half of these are related to “Compensation of employees”, as this was the way Icelandic National Accounts have been prepared:

67
… as a practical solution half of the travel allowances are defined as a payment for meals and drinks and that part has been reclassified from intermediate consumption in the production accounts to compensation of employees (Statistics Iceland, 2011a, p. 179).
However, this refers only to travel allowances of enterprises for their employees and not to other direct payments made by enterprises, which also can occur in some cases, in addition to travel allowances (e.g. purchasing a flight ticket).
In addition to the inaccurate calculation of the share of internal tourism consumption in the Icelandic TSA table 15, another one is made in the Icelandic TSA table 8 (Total internal tourism consumption at market prices 2001 - 2009). Here this share is calculated as a share of GDP. For the same reason as presented above, using GDP as a reference value is not accurate as GDP, at aggregate level is seen as a sum of final demand components (and “Intermediate consumption” is not a part of them).
TSA:RMF (2008) is also very clear in this regard:
Aggregates related to tourism expenditure and tourism consumption should not be expressed as shares of GDP or of household final consumption at the aggregated level because they differ in coverage, as both tourism expenditure and tourism consumption include expenditure by producers for the benefit of visitors which national accounts classify within the intermediate consumption of productive activities and not as part of final demand (TSA:RMF, 2008, para. 4.48).
As previously mentioned, tourism consumption comprises the so called “imputed consumptions”, in addition to tourism expenditure (corresponding to monetary transactions). One of the most important component of imputed consumption, and generally included in most of the TSAs, is housing services provided by vacation homes on own account (see 2.3). TSA:RMF (2008) recommends also including social transfers in kind32 and other forms of
32 At present there is no evidence for the existence of social transfers in kind in Icelandic tourism. For instance, in case of free or reduced admission fee to swimming pools National Accounts in Iceland states “the producing units in question do not receive any special compensation from the government… this type of price reduction should not be classified as Social Transfer in Kind”. Another case is medical treatment which is supported by the government and is “classified as government final consumption and mostly as social transfer in kind” (Statistics Iceland, 2011a, pp. 115 and 130). However in this latter example, for the time being there is no scheme from the Icelandic government to support health tourism for elderly people (e.g. awarding “treatment tickets” for pensioners for medical treatment in a spa resort – as many European countries do).
Recommendation 24: The future TSA compilation in Iceland should not present Internal tourism consumption as a share of GDP or of total consumption (sum of private and governmental consumption). Only if adjustments are made (in order to remove the part of domestic tourism consumption related to payments made directly by employers – mainly on accommodation and transport) these kinds of shares could be accurately calculated and presented in future TSA tables.
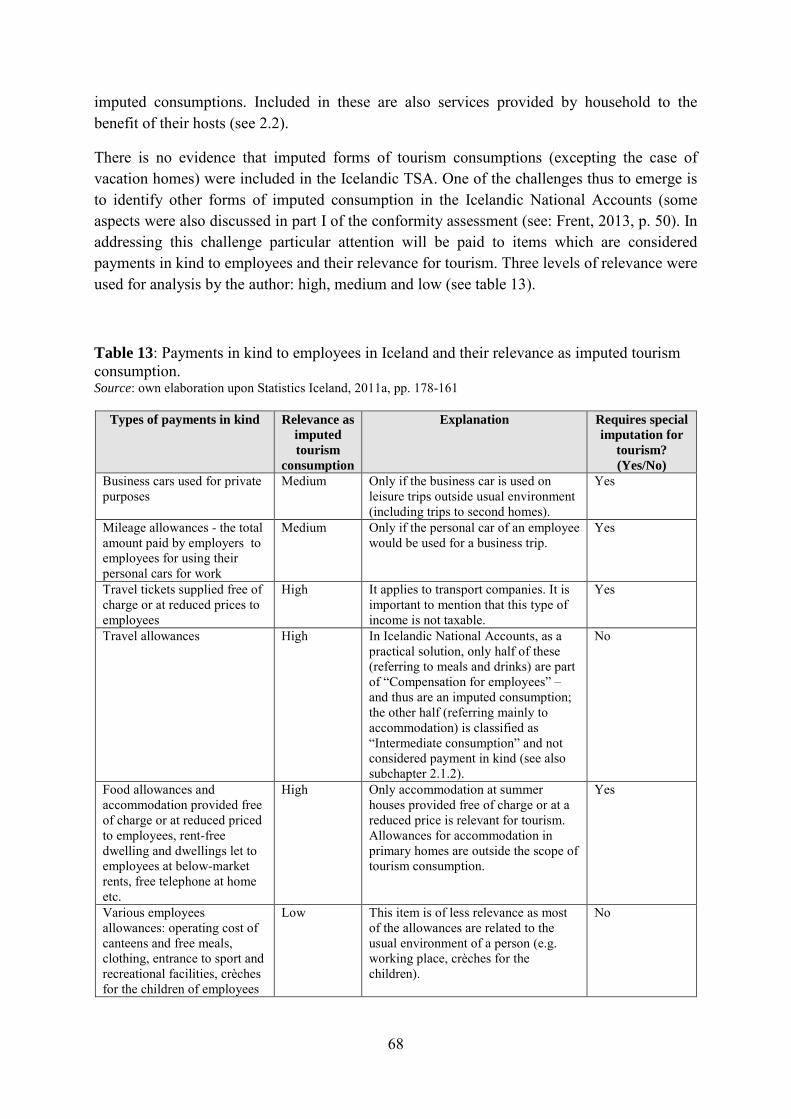
68
imputed consumptions. Included in these are also services provided by household to the benefit of their hosts (see 2.2).
There is no evidence that imputed forms of tourism consumptions (excepting the case of vacation homes) were included in the Icelandic TSA. One of the challenges thus to emerge is to identify other forms of imputed consumption in the Icelandic National Accounts (some aspects were also discussed in part I of the conformity assessment (see: Frent, 2013, p. 50). In addressing this challenge particular attention will be paid to items which are considered payments in kind to employees and their relevance for tourism. Three levels of relevance were used for analysis by the author: high, medium and low (see table 13).
Table 13: Payments in kind to employees in Iceland and their relevance as imputed tourism consumption. Source: own elaboration upon Statistics Iceland, 2011a, pp. 178-161
Types of payments in kind Relevance as imputed tourism
consumption
Explanation Requires special imputation for
tourism? (Yes/No)
Business cars used for private purposes
Medium Only if the business car is used on leisure trips outside usual environment (including trips to second homes).
Yes
Mileage allowances - the total amount paid by employers to employees for using their personal cars for work
Medium Only if the personal car of an employee would be used for a business trip.
Yes
Travel tickets supplied free of charge or at reduced prices to employees
High It applies to transport companies. It is important to mention that this type of income is not taxable.
Yes
Travel allowances High In Icelandic National Accounts, as a practical solution, only half of these (referring to meals and drinks) are part of “Compensation for employees” – and thus are an imputed consumption; the other half (referring mainly to accommodation) is classified as “Intermediate consumption” and not considered payment in kind (see also subchapter 2.1.2).
No
Food allowances and accommodation provided free of charge or at reduced priced to employees, rent-free dwelling and dwellings let to employees at below-market rents, free telephone at home etc.
High Only accommodation at summer houses provided free of charge or at a reduced price is relevant for tourism. Allowances for accommodation in primary homes are outside the scope of tourism consumption.
Yes
Various employees allowances: operating cost of canteens and free meals, clothing, entrance to sport and recreational facilities, crèches for the children of employees
Low This item is of less relevance as most of the allowances are related to the usual environment of a person (e.g. working place, crèches for the children).
No

69
One can observe that there are three forms of payments in kind (made for the benefit of employees) which have high relevance as imputed forms of tourism consumption. These are travel tickets supplied free of charge or at subsidized prices, accommodation provided free of charge or at a reduced price (particularly for summer houses) and travel allowances. While the first two requires special imputations, in the case of travel allowances this value can easily be found in Icelandic National Account (actually this topic was also discussed in 2.1.2). There are two other categories for which the relevance is not so high but do require further imputations – these are the case of mileage allowance and business cars used for private purposes.
There is no evidence that these payments in kind were separately presented in the estimates of the Icelandic TSA. It is necessary that other forms of imputed tourism consumption are separately identified and estimated in accordance with National Accounts.
Besides these payments in kind, there are other forms of imputed consumptions (excepting social transfers in kind). TSA:RMF (2008) presents two categories (which were not included in table 13). These refers to the “imputed value of barter transactions (for example temporary exchange of dwellings for vacation purposes)” and “the imputed value of goods (vegetables, fruits, game, fish etc.) produced on own account or resulting from recreational activities (gardening, hunting, fishing) outside usual environment” (TSA:RMF, 2008, para. 2.26a;b). At the moment, one might assume that the relevance of these categories is not that high for tourism in Iceland to justify separate measurements. Furthermore, for the time being there is no study/research to indicate their importance for Iceland. In addition, Icelandic National Accounts do not envisage any barter transactions nor imputed consumption of goods produced on own account with relevance for tourism. The latter case is even specified by Statistics Iceland:
Goods produced by households for own consumption are of minor importance in Iceland and normally not covered in household final consumption. Apart from housing services produced by owner occupiers the major exception is the own consumption of milk and meat of farmers and other members of the households on the farm (Statistics Iceland, 2008, p. 111).
Recommendation 27: The future TSA compilation in Iceland should pay particular attention to payments in kind to employees as forms of imputed tourism consumptions and part of the aggregate Internal tourism consumption. These refer mainly to travel tickets supplied free of charge or at subsidized prices, accommodation provided free of charge or at a reduced price (i.e. in summer houses), part of travel allowances allocated to meals. If possible and relevant, other imputations can also be envisaged (i.e. business cars used for leisure trips outside usual environment, personal cars used in business trips).
70
4.3. Tourism direct gross value added (at basic prices) vs. Tourism gross value added (at basic prices)
The aggregate of “Tourism Direct Gross Value Added” (TDGVA) is defined by TSA:RMF (2008) as:
the part of gross value added (at basic prices) generated by tourism industries other industries of the economy that directly serve visitors in response to internal tourism consumption (TSA:RMF, 2008, para. 4.88)
It is important to mention that the use of the term “direct” is due to the fact that TSA only estimates direct effect of tourism consumption leaving aside other effects (indirect or induced) that can also appear.33 More precisely, “tourism value added is the sum of parts of the value added generated in all production processes in an economy, where the part corresponding to each activity represents the share of tourism consumption within the production of each activity” (Libreros, 2004, p. 137).
TSA:RMF (2008) warns about what is considered to be a “modelled component” due to assumptions involved in the compilation process of TDGVA:
It is important to bear in mind at this stage that because several assumptions are used to relate inputs to particular outputs of production processes of industries, the results have a modelled component and thus cannot be considered to be directly observed and reconciled with statistical data. This is due to the fact that value added is strictly associated with the production process of an establishment taken as a whole and cannot be assigned among the outputs of this process (TSA:RMF, 2008, para. 4.57).
Value added is calculated at the establishment level and more than one output can be produced within an establishment. As value added is an indicator associated with the production process it “does not depend to the use given to the output of this process” (TSA:RMF, 2008, para. 4.89). Therefore, it has no effect that tourism consumption is not always part of final consumption expenditure but also part of intermediate consumption (as this also generates gross value added).
Also, a specificity regarding the calculation of TDGVA appears in the case of goods acquired by visitors. The retail trade margin that generates tourism’s share corresponds both to the industry “Retail trade of country-specific tourism characteristic goods” and to the other retail trade industries that serves visitors. It is considered that “the remaining value of goods (out of retail margin) purchased by visitors is deemed not to generate tourism shares and not to generate gross value added but only indirect effects” (TSA:RMF, 2008, p. 94).
Another important point is that the TDGVA is somehow independent of the definition of tourism characteristic products and tourism industries as long as the output of industries 33 There are other methods used to calculate indirect and induces effects of tourism. TSA:RMF (2008) classified these in three types: “Models based on input-output analysis”, “Computable general equilibrium models” and “Multipliers” (see TSA:RMF, 2008, pp. 103-104).

71
“responds to tourism consumption” (TSA:RMF, 2008, para. 4.92). Thus, the international comparability is not affected by each country’s specific way of establishing tourism characteristic products and industries.
Tourism gross value added (is. Vinnsluvirði í ferðaþjónustu) in the Icelandic TSA is found in different forms in three Icelandic tables (Statistics Iceland, 2011b, pp. 15-22):
• Table 7 “Tourism share of gross domestic product” • Table 10 “Tourism industry gross value added” • Table 14 “Output, intermediate consumption and value added in tourism industry”
Tables 7 and 10 of the Icelandic TSA are multiyear tables while table 14 is a one year table (for 2009). In table 7 of the Icelandic TSA only a total aggregate figure is presented for the reference period while tables 10 and 14 provide a classification of tourism value added by each tourism industry. However, only table 10 focuses exclusively on value added in tourism.
It is important to mention that for the Icelandic TSA value added in tourism is estimated at basic prices, totally in accordance with TSA:RMF (2008). Moreover, the compilation process seems to respect the basic methodology for calculating gross value added as a difference between output at basic prices and intermediate consumption at purchasers’ prices.
Nevertheless, there are no detailed and clear provisions on how value added in tourism was estimated in the Icelandic TSA. It is assumed tourism value added was obtained as a difference between tourism output and tourism intermediate consumption through the so called “balancing item between tourism production and tourism intermediate consumption” (Eurostat, 2009, p. 55). This is proved by the fact that Icelandic TSA presents separate tables for “tourism output” (table 9) and “tourism intermediate consumption” (table 11).
In this regard, what is specific for the Icelandic TSA (and not sanctioned by the international standards) is the fact that there is a special table (table 11) in which “tourism industry intermediate consumption” (is. Aðfanganotkun atvinnugreina í ferðaþjónustu) is presented. This is in fact intermediate consumption generated by tourism consumption (presumably calculated again by applying tourism ratios to the intermediate consumption of each tourism industry). Moreover, one can see that the ordering and numbering of Icelandic tables is rather “unconventional” as the table referring to tourism gross value added (table 10) is placed in front of the table referring to tourism intermediate consumption (table 11). This is rather confusing and, at least the ordering of these tables has to be switched as value added is obtain as value of output less the value of intermediate consumption. Nevertheless, one can accept the fact that the relation can be algebraically reinterpreted and output can also be seen as a sum between intermediate consumption and value added. Maybe this was also considered in the Icelandic TSA?
Regardless of these specificities, overall, the aggregate of tourism value added (and its specific way of calculation in the Icelandic TSA) meets, at least formally the requirements of international standards. That is why no recommendation has been provided within this section.

72
4.4. Tourism direct gross domestic product vs. Tourism gross value added at market prices
The second TSA aggregate that is the direct result of (internal) tourism consumption is “Tourism Direct Gross Domestic Product” (TDGDP). In a similar manner as the Gross Domestic Product (GDP) of an economy is compiled a Tourism GDP is defined as:
The sum of the part of gross value added (at basic prices) generated by all industries in response to internal tourism consumption plus the amount of net taxes on products and imports included within the value of this expenditure at purchasers’ prices (TSA:RMF, 2008, para. 4.96).
Estimating the net taxes on products and imports included in the value of internal consumption and adding these to TDGVA represents TDGDP. Unfortunately, Eurostat does not provide in its TSA publication (see Eurostat, 2009) any guidelines referring to the calculation of TDGDP.
However, applying tourism shares also to the total value of taxes less subsidies on products gives the part of taxes less subsidies on products which is attributable to tourism consumption. Adding this part to TDGVA one can obtain TDGDP.
It is important to remember that TDGDP (as well and TDGVA) considers only direct effect of tourism within the economy leaving aside indirect and induced effects. Moreover, when comparability of such aggregates is discussed, TSA:RMF (2008) warns about their characteristics:
They are indicators emanating from a reconciliation of tourism consumption and supply, and their values will depend on the scope of the measurement of tourism consumption each country adopts … The estimates of TDGVA and TDGDP rely on number of assumptions and implicit modelling procedures, and thus special care must be taken when using or interpreting these aggregates (TSA:RMF, 2008, para. 4.97).
Having these characteristics in mind, the measurement of tourism as a macroeconomic activity can trust in TSA as an internationally recognized method.
The terminology of the aggregate used to designate “Tourism direct gross domestic product” in the Icelandic TSA is “Tourism gross value added at market prices” (is. Vinnsluvirði í ferðaþjónustu á markaðsverði). Indeed, one can consider that in a macroeconomic framework gross value added at market prices is similar to gross domestic product (at market prices) and examples exist of this treatment in some countries. This is also the case of Iceland’s National Accounts where gross value added at market prices is computed as gross value added at basic prices plus taxes less subsidies on product (see: Statistics Iceland, 2011a, p. 27). Therein lays the GDP calculation. Extending this to tourism, the relation is similar.
Unlike tourism gross value added, in the case of “Tourism gross domestic product” there is one single table (Icelandic TSA table 7 – a multiyear table) where this aggregate is presented
73
and calculated as a sum between “Tourism gross value added at basic prices” and “Taxes on tourism products” (Statistics Iceland, 2011b, p. 15). Then the share in total Gross Domestic Product in Iceland is also provided.
In fact, table 7 of the Icelandic TSA presents two shares: one for the aggregate “Tourism gross value added at basic prices” and one for “Tourism gross value added at market prices”. For the first one, the reference is “Total value added in the economy at basic prices” (although not give in the table) while for the second one the reference is Gross Domestic Product (which is included in the table). The name of the Icelandic TSA table 7 is “Tourism share of gross domestic product” (is. Hlutur ferðaþjónustu í landsframleiðslu). There is no TSA:RMF (2008) table with such a name although the Icelandic TSA table 7 does relate to TSA:RMF (2008) table 6 (see: 3.3.2).
As part of the aggregate “Tourism gross value added at market prices” there is a separate table (Icelandic TSA table 12) entitled “Total taxes on tourism outputs” (is. Skattar á ferðaþjónustu) presenting data for several years (Statistics Iceland, 2011b, p. 20). Taxes on tourism products are also part of table 14 of the Icelandic TSA entitled “Output, intermediate consumption and value added in tourism industry”. In this table taxes are presented only for one year and are used for obtaining “Output at market prices” as a sum between “Output at basic prices” and “Taxes on tourism products”; so there is no Tourism GDP presented in this table.
It is assumed that “Taxes on tourism products” were calculated by applying tourism ratios to the total taxes related to each tourism industry. However, there is no evidence on how Taxes for each tourism industry (at the whole industry level) were calculated. Only some general information is provided regarding what categories of taxes are included or not in the Icelandic TSA calculation. It seems that only Value Added Tax (VAT) was included:
When summing the taxes on branches of tourism the focus has only been on the value added tax. In other words, information on e.g. excise taxes or duties which are levied on tourism as other industries are not included. Also no summary of special dues on tourism has been created such as landing fees, security and weapons control fee, registration fee, handling charges, and airport charges which are taxes on departing passengers … Neither port fees, piloting fees, shipping fees, harbour/wharfing fees or lighthouse fees related to the arrivals of foreign cruise ships to this country. 34 (Statistics Iceland, 2008, p. 9, translated from Icelandic).
34 Within an ITRC project related to cruise tourism it was estimated that the value of government taxes obtained from arriving cruises in Icelandic harbours reached 154.3 million ISK in 2013. This really proves the importance of governmental revenues generated by cruise tourism for this country.
Recommendation 25: The future TSA compilation in Iceland should consider also other taxes included in the value of tourism consumption in Iceland (e.g. airport fees, other consumption taxes).

74
In fact overall, Icelandic National Accounts considers two large categories of taxes on products: these are Value Added Tax (VAT) and Taxes on products excluding VAT. In Iceland apart from VAT (which is the most important tax) the most important type (among the second category) are excise duties which are applied to motor vehicles, petrol, fuel, oil, liquor and tobacco. However, there are also other taxes such us environmental taxes on specific goods, inspection fees, fire prevention fee, airport fees and import duties (see: Statistics Iceland, 2011a, p. 92).
Regarding subsidies on products (which have to be deducted from GDP calculations), in 2005 the following categories were presented: agriculture subsidies (by far the biggest category), transportation fund of oil products, wool subsidies, subsidies to ferries and concessionaires, subsidies to domestic flight and deposit fees for recycling (see: Statistics Iceland, 2011a, p. 94). Obviously, what is of interest for tourism are passenger transportation subsidies. The main source of information in both cases is government (state) accounts.
There is no evidence that subsidies were deducted in Icelandic TSA when calculating TDGDP (equivalent to gross value added at market prices in Iceland). Only taxes were included without netting from subsidies.
Indeed in the case of air transportation, more precisely for domestic air transportation, subsidies are evident. For instance in 2013, a total of 221.1 million ISK were awarded as subsidies by the government for sustaining domestic flights to Bíldudalur, Gjögur, Grímsey, Hornafjörður and Vopnafjörður/Þórshöfn (Innanríkisráðuneytið, 2014).
Recommendation 26: The future TSA compilation in Iceland should include also the subsidies (by deducting them) when calculating Tourism Gross Domestic Product (Tourism gross value added at market prices), since there is clear evidence that these are applied for air passenger transportation, and to a lesser extent in waterway passenger transportation (ferries). Data from National Accounts and government account could be used in this endeavour.
75
4.5. Employment in tourism industries vs. Employment in tourism
There is an apparent contradiction regarding employment as a macroeconomic aggregate in TSA:RMF (2008). It is called “tourism employment” within the section referring to TSA aggregates (see TSA:RMF, 2008, p. 48) but according to table 7 in the TSA:RMF (2008) there is “employment in tourism industries” that should be computed. As previously shown, (see 3.3.3) the “tourism employment” concept is different from “employment in tourism industries”.
Employment is not seen as a main aggregate in TSA since it is not included in the classification of these (see: TSA:RMF, 2008, para. 4.81). Nevertheless, table 7 of the TSA:RMF (2008) “Employment in tourism industries” is part of the “central core” due to “the frequent strategic importance of tourism in the development of an employment policy” (TSA:RMF, 2008, para. 4.5). Yet, Eurostat’s European Implementation Manual on TSA does not consider TSA:RMF table 7 as being part of the “core tables” (Eurostat, 2001, p. 16).
Tourism employment is according to TSA:RMF (2008) one of the “four additional aggregates” together with “Tourism gross fixed capital formation”, “Tourism collective consumption” and Total tourism internal demand”. Excepting tourism employment all these aggregates “should be the object of a more advanced development of the TSA” (TSA:RMF, 2008, para. 4.99).
TSA:RMF (2008) recognizes a similarity of tourism employment with the other two main TSA aggregates which are derived from tourism consumption: “Tourism direct gross value added” and “Tourism direct gross domestic product”. From these a clarification is provided in relation with the measurement of the employment aggregate:
As is the case of Tourism direct gross value added and Tourism direct gross domestic product, labour as a factor of production can be associated with the total output of an establishment, but cannot be assigned to any particular output or part of output without the use of specific assumptions and modelling procedures. Tourism employment as meaning the employment strictly related to the goods and services acquired by visitors and produced either by tourism industries or other industries cannot be directly observed. For this reason, the Tourism Satellite Account recommends only the estimation of employment in the tourism industries (TSA:RMF, 2008, para 4.102).
This definitely clarifies the “apparent” contradiction mentioned in the first paragraph of this section. It is emphasized that only “Employment in tourism industries” is a recommended aggregate by TSA:RMF (2008) and not “tourism employment”.
From a certain perspective, “Employment in tourism industries” is similar with the TSA aggregate “Gross value added in tourism industries”. Both aggregates refer only to tourism industries not considering the effect of tourism consumption on other industries.

76
As previously shown (see 3.3.3) “Employment in tourism industries” as defined by TSA:RMF (2008) is not calculated by the Icelandic TSA. Instead the concept of “tourism employment” is presumably applied. Basically, tourism ratios were applied to the employment in each tourism industry in order to obtain the aggregate of “Employment in tourism” (is. Störf í ferðaþjónustu). This is in fact the number of jobs generated by internal tourism consumption in Iceland.
The TSA publications for Iceland do not transparently present employment data (number of jobs – as translated from Icelandic “störf”) for the whole tourism industries. Instead a sort of “computed” tourism employment aggregate is only shown (as already mentioned derived from applying tourism ratios).
The aggregate of “Employment in tourism industries” can easily be computed if employment data for entire tourism industries is available in Iceland. It is just a sum of the variables (jobs, hours worked and full-time equivalents) for what are defined as tourism industries in Iceland. As mentioned before (see 3.3.3) employment from National Accounts are not yet available in Iceland. However, the Labour Force Survey captures data on “average number of working hours per week” and these can be used to compute “Full-time equivalents”. It was understood that this kind of data is not yet published by Statistics Iceland.
***
Although considered by TSA:RMF (2008) as “not the most important feature” of TSA, aggregates do provide important indications in relation with the significance of tourism as an economic activity. The Icelandic TSA did not present all the TSA aggregates recommended by international standards but most of them are available. These refer to “Internal tourism consumption”, “Tourism gross value added”, “Tourism gross domestic product” (equivalent with “Tourism gross value added at market prices”) and “Tourism employment”, even if for this last one a difference in scope makes it not in full compliant. The aggregates of “Internal tourism expenditure” and “Gross value added of tourism industries” are not computed in the Icelandic TSA although the latter might exist in the Icelandic TSA compilation but not separately presented in the publication.
Three specific aggregates not included in TSA:RMF (2008) are however included in the Icelandic TSA and they refer to “Tourism industry output” (at basic and at market prices), “Tourism industry intermediate consumption” and “Total taxes on tourism outputs”. These departures from the standards are not sanctioned (being outside the scope of TSA:RMF
Recommendation 27: The future TSA compilation in Iceland should present separately the aggregate of “Employment in tourism industries” in accordance with the international standards. Additionally, the existing aggregate of “Tourism employment” derived from tourism consumption could also be presented but only expressed as full-time equivalents.

77
(2008)) and their presence can create a sort of confusion among TSA users. Nevertheless, special caution should be taken in the interpretation of the aggregates and their relations with the National Accounts aggregates as in some instances, some differences from the conceptual point of view have been noted (e.g. tourism as an intermediate consumption of producers).

78
5. Conclusions
For the reference period 2000 - 2009 Iceland produced TSA estimates which were disseminated through three specialized publications. These were issued by Statistics Iceland (is. Hagstofa Íslands) in October 2008, November 2010 and respectively, December 2011. Now, more than two years since the last Icelandic TSA publication, an in-depth analysis has been carried out envisaging the conformance with the international standards elaborated by United Nations World Tourism Organization and other international organizations such as OECD and Eurostat.
This two part study showed in many instances the fact that Iceland is not complying with international standards in tourism statistics and TSA. In order to remedy this situation, a series of recommendations have been presented in both parts (52 in total) which are in fact the major output of this analysis.
This study is in fact an example of how a country doing TSA has been coping with conformance with international standards. This is an option for countries already developing TSA in a regular manner.
The conformity analysis with international standards pointed out some “deficiencies” of the TSA in Iceland revealing also the major gaps in terms of data sources. In this regard, lack of an official and continuous demand-side survey both (and separately) for foreigners and Icelandic residents is a major weakness of the actual system of producing tourism statistics in Iceland. The existence of Icelandic Tourist Board’s commissioned surveys does not fill at all this problem since there are evident departures from international standards. This is not surprising as these types of surveys are carried out by private companies and not by official producers of statistical data.
Regarding the ITB’s counting of foreign visitors as the single data source providing the total number of foreign visitors (registered at their departure) in Iceland, this procedure should definitely be improved in order to use country of residence concept instead of nationality and moreover, to separate visitors (tourists) from other categories of travellers which should not be considered visitors according with IRTS 2008 (e.g. foreign nationals, Icelandic citizens living abroad, long term students, emigrants and immigrants).
It seems that TSA in Iceland was constructed following a sort of bottom-up approach without any integration within Supply and Use Tables (SUTs). However, producing SUTs for Iceland is expected during 2014 and the future TSA compilation should be based on them. In general, a closer link with National Accounts data should be envisaged, and by implication a completely different compilation approach compared with the previous one (i.e. a top-down approach).
The usage of concepts and definitions specific to tourism is rather limited in the existing system of producing statistics for tourism in Iceland apart from some general theoretic explanations found in the first TSA publication in Iceland in 2008 for several concepts (i.e.

79
tourist, usual environment, purpose of visit, classification of tourists, tourist consumption). For instance, the definition of tourist follows broadly the UNWTO international definition as does the definition of tourism consumption. However, these have no practical relevance since they are not applied and implemented in the Icelandic statistical procedures.
Among tourism statistics issues, measuring tourism expenditure is the key issue. Unfortunately, the compliance analysis revealed that international recommendations in this field were not at all applied in Iceland in 8 out of 15 cases. The most common non-conformances referred to usage of residence concept, lack of some key characteristics of trip, identifying travel parties but most importantly the absence of statistical procedures to expand the results of the surveys to the total universe of visitors.
The TSA compliance analysis has included the classification of products and activities, the so called “TSA special issues”, TSA tables and TSA aggregates. These can be considered the main components of the conformance assessment which are strictly specific to TSA.
In terms of classifications, only tourism industries (tourism characteristic activities) were envisaged in the conformity analysis as there is no product classification in the Icelandic TSA. Thus, the exercise was to compare the Icelandic TSA classification of tourism industries with its counterpart in TSA:RMF (2008). Although, broadly speaking most of the Icelandic tourism industries comply with international standards, some inconsistencies were revealed regarding terminology, differentiation between goods and services or relevance for tourism. Moreover, a correspondence table has been proposed between tourism industries defined by UNWTO for international comparability and the ISAT 2008 classification. This should be used in the future TSA compilation in Iceland. Meanwhile, some preliminaries have been presented herein in order to approach the issue of establishing country-specific tourism characteristic products, of course, by differentiating between services and goods acquired by tourists.
Regarding the so called “TSA special issues”, eight such cases were treated in this report. Among these, only one TSA special issue (tourism consumption as intermediate consumption of producers) was judged as being totally compliant with international standards. At the same time, Iceland did not separately approach the cases of “Same-day visitors’ expenditure”, “Tourism single-purpose consumer durables” and “Valuables” although for some of them a mentioning in declarative format was found. One can assume that these are important elements for Icelandic TSA which have to be separately estimated in the future TSA compilations.
Assessing the compliance in the case of TSA tables revealed that the Icelandic TSA does not follow entirely the tabular format recommended by TSA:RMF (2008). As it is, the TSA:RMF (2008) table 6 (which is the core TSA table) is not found in Iceland. Instead, there are seven Icelandic TSA tables that correspond to TSA:RMF (2008) table 6. It is worth mentioning that out of eleven Icelandic TSA tables, three tables were found as being in non-compliance with international standards while the rest of Icelandic TSA tables are considered “partially” compliant. Unfortunately no Icelandic TSA table can be considered “totally” compliant with TSA:RMF (2008). At the same time, important TSA:RMF (2008) tables are lacking from the

80
Icelandic TSA. These are “Production accounts in tourism industries” (TSA:RMF (2008) table 5) and “Non-monetary indicators” (TSA:RMF (2008) table 10). Also the first three TSA:RMF (2008) tables should be added comprising inbound, domestic and outbound tourism expenditure.
Regarding the TSA aggregates, it was showed that the Icelandic TSA does not compute all the aggregates recommended by TSA:RMF (2008). There are two aggregates which are not found in the Icelandic TSA namely “Internal tourism expenditure” and “Gross value added of tourism industries”. Instead, there are some “specific” Icelandic TSA aggregates like “Tourism industry output” (at basic and at market prices), “Tourism industry intermediate consumption” and “Total taxes on tourism outputs”. Nevertheless, Icelandic TSA presents the core TSA:RMF aggregates of “Internal Tourism Consumption” and “Gross Tourism Value Added”.
Iceland has managed to elaborate TSA based on its specific data sources. This is what every country producing TSA does. So the compilation of TSA is strongly based on the existing system of producing statistics in particular tourism statistics. This report has shown that it is necessary to have a real improvement in this field not only for meeting the international standards but also for having a sound statistical base proving how tourism is an important sector for Icelandic economy comparable with other economic sectors and comparable with other countries. In order words, for this to happen, the recommendations provided in this two part study should be implemented as soon as possible. It is our belief that Statistics Iceland together with Icelandic Tourist Board should consider these in the near future and the study will fully support the forthcoming TSA compilation in Iceland. It is for the good of the tourism industry in this country.
This kind of study can inspire other countries to perform such a conformance analysis. Moreover, international organizations such as UNWTO, OECD and Eurostat can encourage similar exercises for their members. From a certain perspective the study fully supports the objective of having international comparability of data. It is without any doubt that if one country’s TSA is constructed in compliance with international standards this could further contribute to achieving comparability of TSA figures between countries. Worldwide this is one of the major challenges for TSAs in the coming years.


82
References Air Iceland (2014). Route Map. On http://www.airiceland.is/information/travel-guide/routemap. Viewed 30th January 2014. American Resort Development Association – ARDA (2014). Timeshare terminology. On http://www.arda.org/news-information/industryinformation/glossaryofterms/overview.aspx. Viewed 20th January 2014. Centre for Aviation - CAPA (2012). Icelandair’s model has withstood the test of time but 757 replacement dilemma poses a challenge. On http://centreforaviation.com/analysis/icelandairs-model-has-withstood-the-test-of-time-but-757-replacement-dilemma-poses-a-challenge-78647. Viewed 18th February 2014. ESA (2010). European System of Accounts 2010 by European Commission – Eurostat (2013). (Luxembourg: Publication Office of the European Union).
Eurostat (2001). European Implementation Manual on Tourism Satellite Account. Final draft version 1.0. On: http://epp.eurostat.ec.europa.eu/portal/page/portal/tourism/documents/TSA_EIM_FINAL_VERSION.pdf. Viewed 10th March 2014. Eurostat (2009). Tourism Satellite Accounts in the European Union, volume 3: Practical Guide for the Compilation of a TSA: Directory of Good Practices (Luxembourg: Office for Official Publications of the European Communities). Eurostat (2012). Methodological Manual on Tourism Statistics, Version 1.2 (Luxembourg: Publication Office of the European Union). Eurostat (2013a). Methodological Manual on Tourism Statistics, Version 2.1 (Luxembourg: Publication Office of the European Union). Eurostat (2013b). Tourism Satellite Accounts (TSAs) in Europe. 2013 Edition (Luxembourg: Publication Office of the European Union). Frent, C. (2009). The economic importance of vacation homes from the Tourism Satellite Account (TSA) perspective, Tourism Review, 64(2), pp. 19 – 27.
Frent, C. and Frechling D.C. (2013). Assessing a Tourism Satellite Account: a programme for ascertaining conformance with United Nations Standards, Tourism Economics, DOI: http://dx.doi.org/10.5367/te.2014.0368.
Frent, C. (2013). The Economic Benefits of Tourism in Iceland: Boosting the Icelandic Tourism Satellite Account Development - Icelandic Tourism Satellite Account (TSA) – A Conformity Assessment with United Nations standards for TSA – Part I. Akureyri: Icelandic Tourism Research Centre.

83
Huijbens, E. (2012). Sustaining a Village’s Social Fabric?, Sociologia Ruralis, 52(3), pp. 332-352.
Icelandic Tourism Research Centre (2014). Statistics on cruise passengers by ports in Iceland. Email communication with ITRC – Kristinn Berg Gunnarsson, sent 13rd March 2014. Icelandic Tourist Board (2012). International visitors in Iceland – Visitor survey Summer 2011, January 2012. On: http://www.ferdamalastofa.is/static/files/upload/files/Erlendir%20gestir_2011_10_English_final2.pdf . Viewed 5th December 2013. Icelandic Tourist Board (2013). Research and Statistics – Tourism in Iceland in Figures. On: http://www.ferdamalastofa.is/static/files/ferdamalastofa/talnaefni/tourism-in-iceland-in-figures-april-2013.pdf. Viewed 10th December 2013. Icelandic Tourist Board (2014a). Ferðalög Íslendinga (ferðalög Íslendinga 2013 og ferðaáform þeirra 2014). On http://www.ferdamalastofa.is/static/research/files/fms_2014_01_final6.pdf. Viewed 29th April 2014. Icelandic Tourist Board (2014b). Licenses and legislation. On: http://www.ferdamalastofa.is/en/licences-legislation. Viewed 31st January 2014. Icelandic Tourist Board (2014c). Number of foreign visitors to Iceland. On: http://www.ferdamalastofa.is/en/recearch-and-statistics/numbers-of-foreign-visitors. Viewed 3rd April 2014. Icelandic Tourist Board (2014d). Tourism in Iceland in figures. On: http://www.ferdamalastofa.is/en/recearch-and-statistics/tourism-in-iceland-in-figures. Viewed 10th April 2014. Innanríkisráðuneytið (2014). Félagshagfræðileg greining á framtíð áætlunarflugs innanlands (rafræn útgáfa). (Reykjavík: Innanríkisráðuneytið). Innovation Center Iceland (2013). Great demand for Icelandic summerhouses. On: http://nmi.is/news/?enews=/frettir/2013/05/mikil-erlend-eftirspurn-i-islensk-sumarhus/ . Viewed 22nd January 2014. ISAVIA (2014). Number of passengers at Keflavík airport by charter and scheduled flights. Email communication with ISAVIA, Sent 19th March 2014.
Libreros, M. (2004). Some thoughts about tourism value added in World Tourism Organization, Tourism Satellite Account (TSA) – Implementation Project Enzo Paci Papers on Measuring the Economic Significance of Tourism (Volume 4), pp. 133-150 (Madrid: WTO).
Nouza, M., Ólafsdóttir, R. and Muller, D.K. (2013) Temporal Development of Second Homes: Case Study from Iceland. Scandinavian Journal of Hospitality and Tourism 13(1), pp. 20-37.

84
OECD (2000). Measuring the role of tourism in OECD economies. The OECD Manual on Tourism Satellite Accounts and Employment. (Paris: OECD). Resort Development Organisation (2014). Media Pack. On http://www.rdo.org/Assets/Images/News/Media-Pack-final-Jul121.pdf. Viewed 17th December 2013. Registers Iceland (2013). Property Register. On: http://www.skra.is/english/property-register/. Viewed 18th December 2013. Registers Iceland (2014a). Icelandic Property Registry Database – Summer houses in Iceland. Email communication with Registers Iceland, sent 22nd January 2014. Registers Iceland (2014b). Statistics – Talnaefni. On http://www.skra.is/markadurinn/talnaefni/. Viewed 6th February 2014. Smyril Line (2013). Arrivals and departures by nationality 2003-2012. Email communication with Smyril Line, sent 1st November 2013. Smyril Line (2014). Arrivals and departures by nationality in 2013. Email communication with Smyril Line, sent 3rd April 2014. SNA (2008). System of National Accounts 2008 by Commission of the European Communities, International Monetary Fund, Organization for Economic Co-operation and Development, United Nations and World Bank (2009). (Brussels/Luxembourg/New York/Paris/Washington D.C.). Statistics Iceland (2008). Ferðaþjónustureikningar 2000-2006 Tourism satellite accounts in Iceland 2000-2006. On: http://www.statice.is/Pages/452?itemid=2589eb1b-e856-408f-8489-5deeb4b55c02 . Viewed 23rd January 2014. Statistics Iceland (2011a). Gross National Income Inventory (ESA 95) Iceland, April 2011 Version 4. On: http://www.hagstofa.is/lisalib/getfile.aspx?itemid=12687 . Viewed 17th December 2013. Statistics Iceland (2011b). Ferðaþjónustureikningar 2009-2011 Tourism satellite accounts in Iceland 2009-2011. On: http://www.statice.is/Pages/452?itemid=f6fd551f-dad6-4c4c-aa73-91b7af3f182a. Viewed 16th December 2013. Statistics Iceland (2012). Landshagir 2012 Statistical Yearbook of Iceland. On http://issuu.com/hagstofa/docs/landshagir2012_lowres?e=7193385/5082887. Viewed 5th February 2014. Statistics Iceland (2013a).Travel survey – Main purpose of trips 2007-2008. On: http://www.statice.is/?PageID=2440&src=https://rannsokn.hagstofa.is/pxen/Dialog/varval.asp?ma=SAM09102%26ti=Main+purpose+of+trips+2007-2008%26path=../Database/ferdamal/ferdavenjur/%26lang=1%26units=percentage%20of%20trips. Viewed 16th December 2013.

85
Statistics Iceland (2013b). Dwellings by number of rooms and type of dwellings 2000-2009. On: http://www.statice.is/?PageID=1229&src=https://rannsokn.hagstofa.is/pxen/Dialog/varval.asp?ma=IDN03004%26ti=Dwellings+by+number+of+rooms+and+type+of+dwellings+2000-2009+%26path=../Database/idnadur/byggingar/%26lang=1%26units=Number/per%201,000/percent. Viewed 19th December 2013. Statistics Iceland (2013c). ÍSAT 2008 . On: http://www.hagstofa.is/Pages/1830. Viewed 21st January 2014.
Statistics Iceland (2013d). Enterprises and turnover – Registered enterprises and organisations 2008-2012. On: http://www.statice.is/?PageID=1198&src=https://rannsokn.hagstofa.is/pxen/Dialog/varval.asp?ma=FYR01001%26ti=Registered+enterprises+and+organisations+2008-2012%26path=../Database/fyrirtaeki/fjoldi/%26lang=1%26units=number. Viewed 5th September 2013. Statistics Iceland (2014a). Travel Survey – Booking of outbound trips by destinations 2007-2008. On: http://statice.is/?PageID=2440&src=https://rannsokn.hagstofa.is/pxen/Dialog/varval.asp?ma=SAM09111%26ti=Booking+of+outbound+trips+by+destination+2007-2008%26path=../Database/ferdamal/ferdavenjur/%26lang=1%26units=Percentage%20of%20trips. Viewed 28th January 2014. Statistics Iceland (2014b). Travel Survey – Domestic trips by type of accommodation 2007-2008. On http://www.statice.is/?PageID=2440&src=https://rannsokn.hagstofa.is/pxen/Dialog/varval.asp?ma=SAM09106%26ti=Domestic+trips+by+type+of+accommodation+2007-2008%26path=../Database/ferdamal/ferdavenjur/%26lang=1%26units=Number . Viewed 25th February 2014. Statistics Iceland (2014c). Accommodation. On http://www.statice.is/Statistics/Tourism,-transport-and-informati/Accommodation. Viewed 26th February 2014. Statistics Iceland (2014d). Supply in all types of accommodation 2000-2013. On http://www.statice.is/?PageID=1234&src=https://rannsokn.hagstofa.is/pxen/Dialog/varval.asp?ma=SAM01602%26ti=Supply+in+all+types+of+accommodation+2000-2013%26path=../Database/ferdamal/GiAllir/%26lang=1%26units=Number. Viewed 16th April 2014. Statistics Iceland (2014e). Occupancy rate of rooms and beds in hotels and guesthouses 2000-2013. On http://www.statice.is/?PageID=1234&src=https://rannsokn.hagstofa.is/pxen/Dialog/varval.asp?ma=SAM01108%26ti=Occupancy+rate+of+rooms+and+beds+in+hotels+and+guesthouses+2000-2013+%26path=../Database/ferdamal/GiHotGist/%26lang=1%26units=Percent. Viewed 16th April 2014.
86
Statistics Iceland (2014f). Overnight stays in all types of accommodations. On http://www.statice.is/?PageID=1234&src=https://rannsokn.hagstofa.is/pxen/Dialog/varval.asp?ma=SAM01601%26ti=Overnight+stays+in+all+types+of+accommodation+1998-2013%26path=../Database/ferdamal/GiAllir/%26lang=1%26units=Number. Viewed 23rd April 2014. Statistics Iceland (2014g). Fjöldi gististaða eftir árum og tegundum 2000-2013. Email communication with Statistics Iceland - Hildur Kristjánsdóttir, sent 16th April 2014. United Nations World Tourism Organization – UNWTO (2011). International Recommendations on Tourism Statistics 2008 Draft Compilation guide. On: http://unstats.un.org/unsd/tradeserv/egts/CG/IRTS%20compilation%20guide%207%20march%202011%20-%20final.pdf. Viewed 17th December 2013. IRTS (2008). International Recommendations on Tourism Statistics 2008 by United Nations World Tourism Organization (New York: United Nations Publications). TSA:RMF (2008). Tourism Satellite Account: Recommended Methodological Framework by United Nations, Statistical Office of the European Communities Eurostat, World Tourism Organization, Organization for Economic Co-operation and Development (Luxembourg, Madrid, New York, Paris 2010). Vanhove, N. (2011). The Economics of Tourism Destinations. Second Edition (London: Elsevier) Wikipedia (2013). CouchSurfing. On: http://en.wikipedia.org/wiki/CouchSurfing. Viewed 9th December 2013.
World Tourism Organization (2000). General Guidelines for Developing the Tourism Satellite Account (TSA). Measuring Total Tourism Demand (Madrid: World Tourism Organization).


88
Annexes
Annex 1. List of correspondences and meetings with key persons
No Organization Period Name of person and
position/department Topic discussed
Correspondences (by email and/or phone) 1. Registers Iceland 17 – 19
December 2014
Tryggvi Már Ingvarsson Data on vacation homes
2. United Nations Statistics Divisions
21 January – 6 February 2014
Paul Hanna, Bojan Nastav / Statistical Classification Hotline
Clarifications on classification on retail trade activities for some durable goods
3. Statistics Iceland 24 February – 16 April 2014
Hildur Kristjánsdóttir, Business Trends and Structure
Data on capacities of accommodation establishments (experimental TSA:RMF table 10c)
4. ISAVIA 26 February – 21 March 2014
Grétar Már Garðarsson, Project Manager for Business Development
Data and clarification on scheduled vs. non-scheduled air passenger transport statistics
5. Icelandic Tourist Board 27 February – 3 April 2014
Oddný Þóra Óladóttir, Research Director
Data and clarification about ITB’s statistics on foreign visitors.
6. Smyril line company 3 April 2014 Sófus Jóhannsson, Travel consultant
Data on departures of Icelanders abroad using Smyril line ferry
7. Austurbrú – East Iceland 27 March – 7 April 2014
María Hjálmarsdóttir, Project manager
Information regarding Egilsstaðir airport
List of meetings 1. Central Bank of Iceland
(Seðlabanki)
29 January 2014
Ólafur Örn Klemensson / Senior Economist
Forecasting tourism revenues (general discussion)


90
Annex 2. Some statistics on second homes (summer houses) in Iceland
Year Number of summer houses
Number of dwellings
% of summer houses
1997 7,517 100,896 7.5 1998 7,859 102,063 7.7 1999 8,078 103,289 7.8 2000 8,633 104,811 8.2 2001 8,813 106,706 8.3 2002 9,049 108,577 8.3 2003 9,283 111,157 8.4 2004 9,575 113,915 8.4 2005 10,039 116,859 8.6 2006 10,450 120,797 8.7 2007 10,935 125,683 8.7 2008 11,454 129,366 8.9 2009 11,835 130,065 9.1 2010 12,079 130,855 9.2 2011 12,225 131,249 9.3 2012 12,401 131,760 9.4
Source: Registers Iceland, 2014b and Statistics Iceland, 2013b


92
Annex 3. A summary regarding the treatment of TSA special issues in the Icelandic TSA
The purpose of this summary is to briefly recap on the compliance of TSA in Iceland for each of the topic presented in chapter 2. Three levels of compliance were judged here: Totally, Partially compliant and Not compliant (see table below). These levels are explained below:
- “Totally” means that the respective TSA issue is completely and separately treated in the Icelandic TSA.
- “Partially” means that only some (partial) features of the respective TSA issue are treated in the Icelandic TSA and/or these were not done in a complete manner (as separate estimates).
- “Non-compliant” means that there is no evidence of the respective TSA special issue in the Icelandic TSA even if a mentioning (in a declarative format) is found.
No TSA special issue Level of compliance for Icelandic TSA
Short comment/justification
Totally Partially Non-compliant
1. Tourism consumption as intermediate consumption of producers
√ This was separately included and estimated in the Icelandic TSA.
2. Services provided by the households for the benefit of their guests
* This was not envisaged by Icelandic TSA and no relevance might be assumed for the time being.
3. Housing services provided by vacation homes on own account
√ This was included in the Icelandic TSA but it was not separately presented in the TSA tables (as a product/industry).
4. Timesharing * It is assumed that for the time being the relevance of timesharing in Iceland is rather low.
5. Tourism single-purpose consumer durables
√ Although a mentioning of tourism single-purpose consumer durables is made in the Icelandic TSA there is no proof that these kinds of goods were given a special treatment in the TSA estimations.
6. Valuables √ Although a vague mentioning is made in the Icelandic TSA, valuables are not separately treated and identified in TSA tables.
7. Separate valuation for reservation services – the case of package tours
√ Although some rough estimations were done to separately consider the reservation services, the case of package tours was not separately treated (there is no evidence of “unbundling” package tours).
8. Same-day visitors expenditure
√ There are no specific estimation for same-day visitors’ expenditure in the Icelandic TSA tables.
* - no level of compliance is assessed since this phenomenon is not very characteristic to Iceland for the time being


94
Annex 4. The format of Icelandic TSA tables (according to the last TSA publication in Iceland in 2011)
Based on Statistics Iceland’s (2011b, pp. 15-26) last published TSA the format of the tables is here summarised. It is important to note that the numbering of tables starts with 7 according to the TSA publication for Iceland. Tables numbered 1 to 6 within the Icelandic TSA publication are in fact synthetic and interpretative tables supporting the analysis (in the text format) of the publication. Under no circumstances can these be considered TSA tables as defined by TSA:RMF (2008). Nevertheless, the purpose of this Annex is just to show how the Icelandic TSA tables were set up without presenting any numbers.
Table 7: Tourism share of gross domestic product 2001-2009
Current prices, million ISK
2001 … 2009
Tourism gross value added at basic prices Taxes on tourism products Tourism gross value added at market prices Gross domestic production Tourism share of gross value added Tourism share of GDP Changes between years, % Tourism gross value added at basic prices Taxes on tourism products Tourism gross value added at market prices Gross domestic production
Table 8: Total internal tourism consumption at market prices 2001-2009
Current prices, million ISK
2001 … 2009
Total internal tourism consumption Total inbound tourism consumption Total domestic tourism consumption Households Businesses General government GDP Tourism consumption as % of GDP Total internal tourism consumption Total inbound tourism consumption Total domestic tourism consumption Households Businesses General government

95
Table 9: Tourism industry output at basic prices 2004-2009
Current prices, million ISK
2004 … 2009
Total tourism output
Tourism characteristic industries 1. Accommodation services 1.1. Hotel services 1.2. Other accommodation services 2. Food and beverage serving services 3. Passenger transport services 3.1. Land passenger transport 3.2. Ocean passenger transport 3.3. Air passenger transport 3.4. Transport equipment rental 4. Travel agency services
Tourism connected industries 5. Automotive fuel retail and repairs 6. Other supportive transport activities 7. Cultural services 8. Recreation and entertainment 9. Miscellaneous tourism services 10. Miscellaneous tourism retail services
Total output at basic prices Total tourism output, % of total output at basic prices

96
Table 10: Tourism industry gross value added 2004-2009
Current prices, million ISK
2004 … 2009
Total tourism gross value added
Tourism characteristic industries 1. Accommodation services 1.1. Hotel services 1.2. Other accommodation services 2. Food and beverage serving services 3. Passenger transport services 3.1. Land passenger transport 3.2. Ocean passenger transport 3.3. Air passenger transport 3.4. Transport equipment rental 4. Travel agency services
Tourism connected industries 5. Automotive fuel retail and repairs 6. Other supportive transport activities 7. Cultural services 8. Recreation and entertainment 9. Miscellaneous tourism services 10. Miscellaneous tourism retail services
Total gross value added Total tourism gross value added, % of total gross value added

97
Table 11: Tourism industry intermediate consumption 2004-2009
Current prices, million ISK
2004 … 2009
Total tourism intermediate consumption
Tourism characteristic industries 1. Accommodation services 1.1. Hotel services 1.2. Other accommodation services 2. Food and beverage serving services 3. Passenger transport services 3.1. Land passenger transport 3.2. Ocean passenger transport 3.3. Air passenger transport 3.4. Transport equipment rental 4. Travel agency services
Tourism connected industries 5. Automotive fuel retail and repairs 6. Other supportive transport activities 7. Cultural services 8. Recreation and entertainment 9. Miscellaneous tourism services 10. Miscellaneous tourism retail services
Total intermediate consumption Total tourism intermediate consumption, % of total intermediate consumption

98
Table 12: Total taxes on tourism outputs 2004-2009
Current prices, million ISK
2004 … 2009
Total taxes on tourism outputs
Tourism characteristic industries 1. Accommodation services 1.1. Hotel services 1.2. Other accommodation services 2. Food and beverage serving services 3. Passenger transport services 3.1. Land passenger transport 3.2. Ocean passenger transport 3.3. Air passenger transport 3.4. Transport equipment rental 4. Travel agency services
Tourism connected industries 5. Automotive fuel retail and repairs 6. Other supportive transport activities 7. Cultural services 8. Recreation and entertainment 9. Miscellaneous tourism services 10. Miscellaneous tourism retail services
Total taxes on goods and services Total taxes on tourism outputs, % of total taxes on products
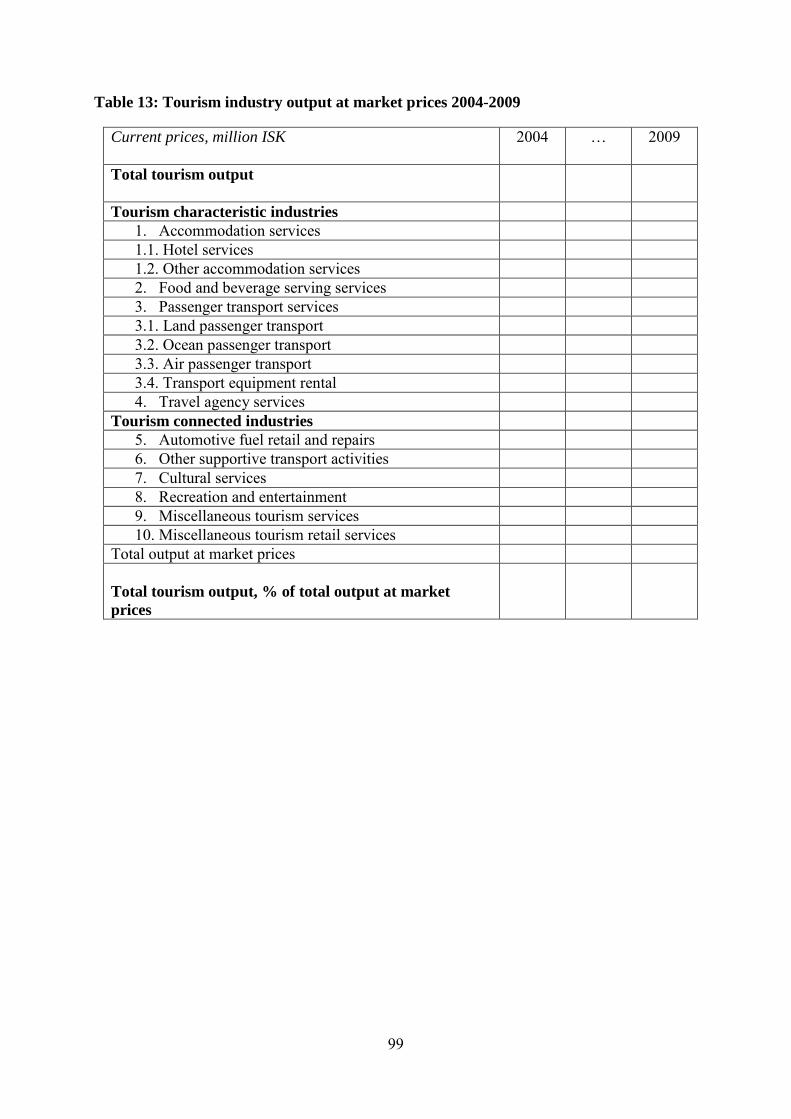
99
Table 13: Tourism industry output at market prices 2004-2009
Current prices, million ISK
2004 … 2009
Total tourism output
Tourism characteristic industries 1. Accommodation services 1.1. Hotel services 1.2. Other accommodation services 2. Food and beverage serving services 3. Passenger transport services 3.1. Land passenger transport 3.2. Ocean passenger transport 3.3. Air passenger transport 3.4. Transport equipment rental 4. Travel agency services
Tourism connected industries 5. Automotive fuel retail and repairs 6. Other supportive transport activities 7. Cultural services 8. Recreation and entertainment 9. Miscellaneous tourism services 10. Miscellaneous tourism retail services
Total output at market prices Total tourism output, % of total output at market prices

100
Table 14: Output, intermediate consumption and value added in tourism industry 2009
Current prices, million ISK Output at basic prices
Inter-mediate
consump-tion
Value added
Taxes on tourism products
Output at
market prices
Total sum
Tourism characteristic industries 1. Accommodation services 1.1. Hotel services 1.2. Other accommodation
services
2. Food and beverage serving services
3. Passenger transport services 3.1. Land passenger transport 3.2. Ocean passenger transport 3.3. Air passenger transport 3.4. Transport equipment rental 4. Travel agency services
Tourism connected industries 5. Automotive fuel retail and
repairs
6. Other supportive transport activities
7. Cultural services 8. Recreation and entertainment 9. Miscellaneous tourism
services
10. Miscellaneous tourism retail services
Notes: the output in the miscellaneous tourism retail services at market prices equals the output at basic prices, its purchases of goods and services for sale, and its (product) taxes.

101
Table 15: Total internal tourism consumption at market prices 2009
Current prices, million ISK
Total internal tourism
consump- tion
Inbound tourism
consump- tion
Domestic tourism
consump- tion
of which house-holds
of which corpora-
ration
Of which genera govern-
ment Total tourism consumption
Tourism characteristic industries
1. Accommodation services
1.1. Hotel services 1.2. Other accommodation services
2. Food and beverage serving services
3. Passenger transport services
3.1. Land passenger transport
3.2. Ocean passenger transport
3.3. Air passenger transport
3.4. Transport equipment rental
4.Travel agency services Tourism connected industries
5. Automotive fuel retail and repairs
6. Other supportive transport activities
7. Cultural services 8. Recreation and entertainment
9. Miscellaneous tourism services
10. Miscellaneous tourism retail services
Total consumption at market prices
% of total consumption at market prices*
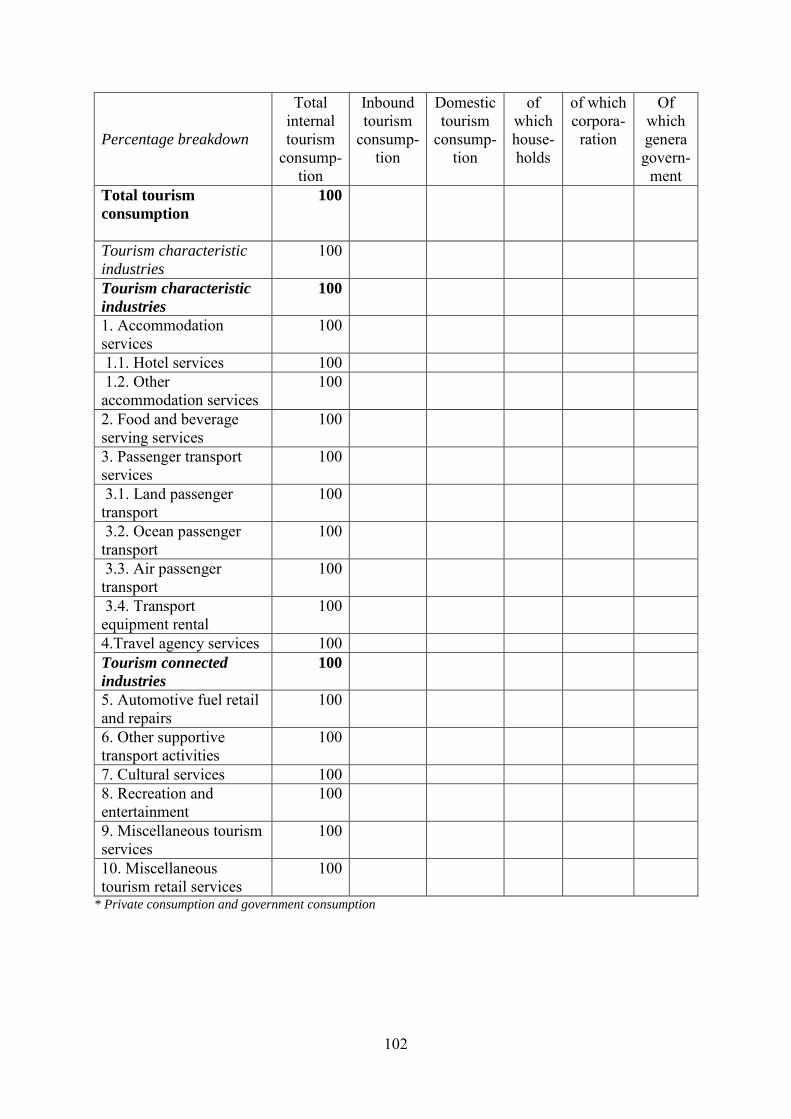
102
* Private consumption and government consumption
Percentage breakdown
Total internal tourism
consump- tion
Inbound tourism
consump- tion
Domestic tourism
consump- tion
of which house-holds
of which corpora-
ration
Of which genera govern-
ment Total tourism consumption
100
Tourism characteristic industries
100
Tourism characteristic industries
100
1. Accommodation services
100
1.1. Hotel services 100 1.2. Other accommodation services
100
2. Food and beverage serving services
100
3. Passenger transport services
100
3.1. Land passenger transport
100
3.2. Ocean passenger transport
100
3.3. Air passenger transport
100
3.4. Transport equipment rental
100
4.Travel agency services 100 Tourism connected industries
100
5. Automotive fuel retail and repairs
100
6. Other supportive transport activities
100
7. Cultural services 100 8. Recreation and entertainment
100
9. Miscellaneous tourism services
100
10. Miscellaneous tourism retail services
100

103
Table 16: Employment in 2003-2009
2003 … 2009* Total tourism employment
Tourism characteristic industries 1. Accommodation services 1.1. Hotel services 1.2. Other accommodation services 2. Food and beverage serving services 3. Passenger transport services 3.1. Land passenger transport 3.2. Ocean passenger transport 3.3. Air passenger transport 3.4. Transport equipment rental 4. Travel agency services
Tourism connected industries 5. Automotive fuel retail and repairs 6. Other supportive transport activities 7. Cultural services 8. Recreation and entertainment 9. Miscellaneous tourism services 10. Miscellaneous tourism retail services
Total employment Employment in tourism, % of total employment
* Preliminary data for 2008 and 2009

104
Table 17: Factor income in tourism 2004 – 2009
Volume indices, 2000=100 2004 … 2009
Total tourism gross value added
Tourism characteristic industries 1. Accommodation services 1.1. Hotel services 1.2. Other accommodation services 2. Food and beverage serving services 3. Passenger transport services 3.1. Land passenger transport 3.2. Ocean passenger transport 3.3. Air passenger transport 3.4. Transport equipment rental 4. Travel agency services
Tourism connected industries 5. Automotive fuel retail and repairs 6. Other supportive transport activities 7. Cultural services 8. Recreation and entertainment 9. Miscellaneous tourism services 10. Miscellaneous tourism retail services
Total factor income


106
Annex 5. Experimental TSA:RMF table 10: Non-monetary indicators for Iceland for the period 2003 – 2013
This Annex is organized as it follows:
- A “general structure table” adapted for Iceland upon the corresponding TSA:RMF table is firstly presented
- Related data tables (corresponding to the “general structure table”) for the period 2003 – 2013 are presented afterwards
Note: Only TSA:RMF (2008) tables 10a, 10b and 10c are included in this section.
1) TSA:RMF (2008) Table 10a General Structure and the related data tables (presented below)
Inbound tourism Outbound tourism Tourists
(overnight visitors)-
Arrivals of Foreigners
Excursionists (same-day visitors) –Arrivals of
cruise visitors only
Visitors Tourists (overnight visitors) –
Departures of Icelanders
abroad
Excursionists (same-day visitors)
Visitors
Number of trips
Table A, column V
Table B, second row
Total of the previous two
columns
Table D, column IV
* Table D, column IV
Number of overnights
Table C, column II
N/A Table C, column II
... N/A …
* - insignificant and/or negligible for Iceland for the time being … - data not available Note: Number of trips equals number of arrivals in inbound tourism while in outbound tourism equals numbers departures abroad made by Icelanders
Table A: Number of trips (arrivals/departures of foreigners) by modes of transport in inbound tourism for Iceland, 2003-2013 (cruise visits excluded). Source: Icelandic Tourist Board, 2014c; 2014d and Smyril Line, 2013; 2014
Years Total Air, out of which (I = II + III)
Keflavík airport (II)
Other airports*
(III)
Waterway – Ferry (IV)
Total (V = I + IV)
2003 312,154 308,768 3,386 7,846 320,000 2004 352,533 348,533 4,000 7,859 360,392 2005 366,048 361,187 4,861 8,079 374,127 2006 407,963 398,901 9,062 14,317 422,280 2007 469,644 458,999 10,645 15,356 485,000 2008 487,772 472,672 15,100 14,500 502,272 2009 480,075 464,536 15,539 13,866 493,941 2010 473,286 459,252 14,034 15,336 488,622 2011 553,106 540,824 12,282 12,505 565,611 2012 659,993 646,921 13,072 12,780 672,773 2013 790,712 781,016 9,696 16,637 807,349
* - for the period 2003-2007 estimated as a residual by the author

107
Table B: Number of arrivals of cruise visitors in Iceland by ports, 2003-2013. Source: Icelandic Tourism Research Centre, 2014
2003 2004 2005 2006 2007 2008 2009 2010 2011 2012 2013
Total, out of which 57,137 87,632 105,641 122,820 123,437 126,446 157,384 167,449 152,271 212,231 226,820 Reykjavík 31,264 44,630 54,795 55,223 53,529 59,308 68,867 70,133 62,673 91,954 92,412 Akureyri 23,458 32,639 40,056 44,549 43,423 41,705 47,597 55,734 49,475 66,383 71,338 Isafjörður 2,242 5,800 7,845 14,108 14,804 12,386 15,054 19,442 19,130 30,015 39,050 Grundarfjörður x 4,540 2,452 4,316 2,186 6,251 7,195 5,128 5,674 5,650 1,960 Vestmannaeyjar x x x 2,484 2,910 3,205 5,073 5,115 4,887 4,744 5,928 Seyðisfjörður x x x 1,790 3,975 2,563 8,500 3,376 4,974 9,000 5,989 Hafnarfjörður x x 350 350 601 400 1,762 6,431 2,170 3,131 2,681 Húsavik 173 23 143 * 684 464 1,364 1,289 265 306 2,848 Siglufjörður x x x x x 64 326 277 464 260 707 Höfn x x x x x 100 162 46 144 310 122 Eskifjörður 0 0 0 0 0 0 0 0 0 82 880 Vesturbyggð x x x x x x x x 120 x x Djúpavogur x x x x 1,325 x 1,484 478 2,295 396 2,905
x - data not available * - there are no records on cruise passenger numbers Table C: Number of overnights in all types of accommodation establishments in Iceland, 2003 – 2013. Source: Statistics Iceland, 2014f
Years Total
(I = II + III) Foreigners
(II) Icelanders
(III) 2003 1,984,448 1,376,788 607,660 2004 2,130,230 1,478,848 651,382 2005 2,232,911 1,550,183 682,728 2006 2,457,068 1,719,140 737,928 2007 2,662,394 1,885,138 777,256 2008 2,735,989 1,942,698 793,291 2009 3,004,629 2,134,245 870,384 2010 2,999,025 2,144,318 854,707 2011 3,248,960 2,444,245 804,715 2012 3,725,213 2,879,111 846,102 2013 4,280,685 3,366,252 914,433

108
Table D: Number of departures of Icelanders abroad. Source: Icelandic Tourist Board, 2014c; 2014d and Smyril Line, 2013; 2014
Years Departures
through Keflavík airport (I = II +
III)
Departures through other
Icelandic airports* (II)
Departures through ferry
line (III)
Total departures of
Icelanders abroad
(IV = I + II + III)
2003 291,601 14,201 … 305,802 2004 345,350 7,771 … 353,121 2005 391,382 14,527 3,023 408,932 2006 431,533 24,437 2,461 458,431 2007 468,800 25,788 2,122 496,710 2008 406,587 11,486 1,890 419,963 2009 254,537 4,608 2,118 261,263 2010 293,770 16,442 2,341 312,553 2011 341,091 14,849 1,639 357,579 2012 358,201 14,281 1,458 373,940 2013 364,912 14,894 1,869 381,675
* - estimated by the author using ITB (data for foreigners) and ISAVIA data (total number of departures). It should be remembered that for 2003-2007 also data on foreigners was estimated as a residual by the author. … - no data available
2) TSA:RMF (2008) Table 10b General Structure and the Corresponding Tables (presented below and above)
* - own estimations based on ISAVIA data
Number of arrivals Air (I) Table G, column VII
(Table A, column I) Scheduled flights* Table G, column V Unscheduled flights* Table G, column VI Waterway (II) Ferry Table A, column IV Cruise ship Table B, row 2 Total (I) + (II)

109
Table E: Estimating number of foreigners’ departures at Keflavík airport by scheduled and charter flights. Source: Icelandic Tourist Board, 2014c and computed from ISAVIA, 2014
Years Total number of
foreigners’ departures on
Keflavík airport (Source: Icelandic
Tourist Board) (I)
Computed shares* Estimated number of foreigners
Scheduled flights (II)
Unscheduled
flights - charter (III)
Scheduled
flights (IV) = (II) * (I)
Unscheduled
flights - charter (V) = (III) * (I)
2003 308,768 81.7% 18.3% 252,176 56,592 2004 348,533 88.2% 11.8% 307,309 41,224 2005 361,187 85.2% 14.8% 307,684 53,503 2006 398,901 88.0% 12.0% 351,157 47,744 2007 458,999 88.8% 11.2% 407,734 51,265 2008 472,672 88.4% 11.6% 418,013 54,659 2009 464,536 95.5% 4.5% 443,477 21,059 2010 459,252 94.8% 5.2% 435,496 23,756 2011 540,824 95.5% 4.5% 516,421 24,403 2012 646,921 94.5% 5.5% 611,276 35,645 2013 781,016 95.4% 4.6% 744,892 36,124
* - based on ISAVIA data on number of total departing passengers at Keflavík airport by the breakdown scheduled and unscheduled flights.
Table F: Estimating number of foreigners arriving in other airports by scheduled and charter flights. Source: Icelandic Tourist Board, 2014d and computed from ISAVIA, 2014
Years Total number of
foreigners arriving on other airports* (Source: Icelandic Tourist
Board) (I)
Computed shares** Estimated number of foreigners
Scheduled flights (II)
Unscheduled
flights - charter (III)
Scheduled
flights (IV) = (II) * (I)
Unscheduled
flights - charter (V) = (III) * (I)
2003 3,386 81.7% 18.3% 2,765 621 2004 4,000 88.2% 11.8% 3,527 473 2005 4,861 85.2% 14.8% 4,141 720 2006 9,062 88.0% 12.0% 7,977 1,085 2007 10,645 88.8% 11.2% 9,456 1,189 2008 15,100 88.4% 11.6% 13,354 1,746 2009 15,539 95.5% 4.5% 14,835 704 2010 14,034 94.8% 5.2% 13,308 726 2011 12,282 95.5% 4.5% 11,728 554 2012 13,072 94.5% 5.5% 12,352 720 2013 9,696 95.4% 4.6% 9,248 448
* - for 2003-2007 estimated as a residual by the author ** - based on ISAVIA data on number of total departing passengers at Keflavík airport by the breakdown scheduled and unscheduled flights

110
Table G: Estimating total number of foreigners arriving by air in Iceland by scheduled and charter flights. Source: Icelandic Tourist Board, 2014c; 2014c and computed from ISAVIA, 2014
Years
Keflavík airport (from table E)
Other airports (from table F)
Total Total air (VII) = (V) + (VI)
Scheduled
flights (I)
Unscheduled
flights - charter (II)
Scheduled
flights (III)
Unscheduled
flights - charter (IV)
Scheduled
flights (V) = (I) +
(III)
Unscheduled
flights - charter (VI) = (II) + (IV)
2003 252,176 56,592 2,765 621 254,941 57,213 312,154 2004 307,309 41,224 3,527 473 310,836 41,697 352,533 2005 307,684 53,503 4,141 720 311,825 54,223 366,048 2006 351,157 47,744 7,977 1,085 359,134 48,829 407,963 2007 407,734 51,265 9,456 1,189 417,190 52,454 469,644 2008 418,013 54,659 13,354 1,746 431,367 56,405 487,772 2009 443,477 21,059 14,835 704 458,312 21,763 480,075 2010 435,496 23,756 13,308 726 448,804 24,482 473,286 2011 516,421 24,403 11,728 554 528,149 24,957 553,106 2012 611,276 35,645 12,352 720 623,628 36,365 659,993 2013 744,892 36,124 9,248 448 754,140 36,572 790,712
3) TSA:RMF (2008) Table 10c General Structure and the Corresponding Tables (presented below)
Accommodation in NACE Rev. 2/ISAT 2008 55 Vacation homes Short-term
accommodation activities (NACE/ISAT
55.1 + 55.2)
Camping grounds, recreational vehicle
parks and trailer parks (NACE/ISAT 55.3)
Other accommodation
(NACE/ISAT 55.9)
Summer houses (according with Registers Iceland)
Number of establishments
Table H, column I Table H, column II … See Annex 2
Number of rooms
Table I N/A … …
Number of beds*
Table J … … …
Room occupancy (%)
Table K N/A … …
Beds occupancy (%)
Table L … … …
* - in case of camping these would be places for tents and caravans … - lack of data

111
Table H: Number of establishments by types of accommodation in Iceland, 2003 – 2013. Source: own compilations from Statistics Iceland, 2014g
Short-term accommodation activities
(NACE /ISAT 55.1 + 55.2)
Camping grounds, recreational vehicle
parks and trailer parks (NACE/ISAT 55.3)
2003 531 135 2004 560 129 2005 582 145 2006 598 140 2007 586 137 2008 569 132 2009 578 143 2010 620 149 2011 674 157 2012 709 162 2013 758 158
Table I: Number of rooms* in accommodation units in Iceland, 2003 – 2013. Source: Statistics Iceland, 2014d
Short-term accommodation activities
(NACE/ISAT 55.1 + 55.2) 2003 8,150 2004 8,458 2005 8,923 2006 9,339 2007 9,914 2008 10,122 2009 10,312 2010 10,897 2011 11,746 2012 12,928 2013 13,967
* - existing in the month of July
Table J: Number of beds* in accommodation units in Iceland, 2003 – 2013. Source: Statistics Iceland, 2014d
Short-term accommodation activities
(NACE/ISAT 55.1 + 55.2) 2003 20,312 2004 21,366 2005 22,326 2006 23,236 2007 24,626 2008 24,951 2009 25,562 2010 27,094 2011 30,018 2012 31,772 2013 34,152
* - existing in the month of July

112
Table K: Occupancy (rooms) for accommodation units in Iceland, 2003 – 2013 (%). Source: Statistics Iceland, 2014e
Short-term accommodation activities
(NACE/ISAT 55.1) 2003 41.2 2004 42.6 2005 44.3 2006 45.8 2007 46.1 2008 45.7 2009 46.2 2010 43.5 2011 46.0 2012 50.0 2013 54.3
Table L: Occupancy (beds) for accommodation units in Iceland, 2003 – 2013 (%). Source: Statistics Iceland, 2014e
Short-term accommodation
activities (NACE/ISAT 55.1)
2003 34.3 2004 35.0 2005 36.2 2006 37.0 2007 36.9 2008 36.5 2009 37.0 2010 34.8 2011 36.8 2012 39.6 2013 43.6


114
Annex 6. Calculating undeclared overnight stays for domestic tourism in Iceland in 2007-2008
In this annex calculations were performed in order to reveal the undeclared overnight stays made by Icelanders in Iceland (see table below). It should be noted that undeclared overnight stays in case of foreigners (inbound tourism) are not included as there is no reliable data from the demand-side to perform such analysis.
In this endeavour, supply data is represented by Accommodation Statistics while demand-side data by the 2007-2008 Travel demand survey; both data sources belong to Statistics Iceland and they refer to the period May 2007 – April 2008, when the Travel demand survey was conducted. A breakdown by types of accommodation was used (see: Frent, 2013, p. 41, table 9 for the exact correspondence between accommodation types).
Overall, for all accommodation units it was determined that unreported overnight stays represented 46.4% from the official reported ones in the period May 2007 – April 2008. However, this was not the case of hotels and guesthouses where a underreporting from demand side (-30.7%) is observed; this is due to characteristics of the survey which probably failed in obtaining a closer figure with the one found in supply side accommodation statistics. Nevertheless, if “Hotels and guesthouses” are not considered (due to high share of underreporting from demand side which definitely influences the final results), one can say that undeclared overnights are almost 1.5 higher than the official overnight stays reported by accommodation establishments excepting hotels and guesthouses.
Calculating undeclared overnight stays undertaken by Icelanders in Iceland, May 2007 – April 2008 Source: derived from Statistics Iceland, 2014b; 2014c
Types of accommodations
Demand side data
(Travel survey)
Supply side data
(Accommodation statistics)
Difference Percentage difference
A B C = A - B D = C/B Hotels and guesthouses 311,582 449,502 -137,920 -30.7% Youth hostels 16,667 12,178 4,489 36.9% Holiday houses*/holiday centres 82,154 43,015 39,139 91.0% Lodges in wilderness** 69,000 30,109 38,891 129.2% Sleeping bag facilities** 23,694 10,174 13,520 132.9% Private home accommodation*** 52,248 12,517 39,731 317.4% Camping 600,243 232,071 368,172 158.6% Total 1,155,588 789,566 366,022 46.4% Total without “Hotels and guesthouses” 844,006 340,064 503,942 148.2%
* - from demand side it includes only Holiday houses owned by travel operators and the category of “Other holiday houses”; categories such as Private holiday houses and Holiday houses owned by company unions are excluded within this analysis. ** - it refers to the period June 2007 – May 2008 in the supply side (Accommodation statistics) *** - for supply-side an estimated number was used

115
Private home accommodations and camping sites are the types of accommodations that are “the most intensive in undeclared overnight stays”. Needless to say, the number of undeclared overnight stays (from demand-side) in case of private home accommodation is triple than the one officially reported by accommodation statistics. The opposite are the youth hostels (36.9%).
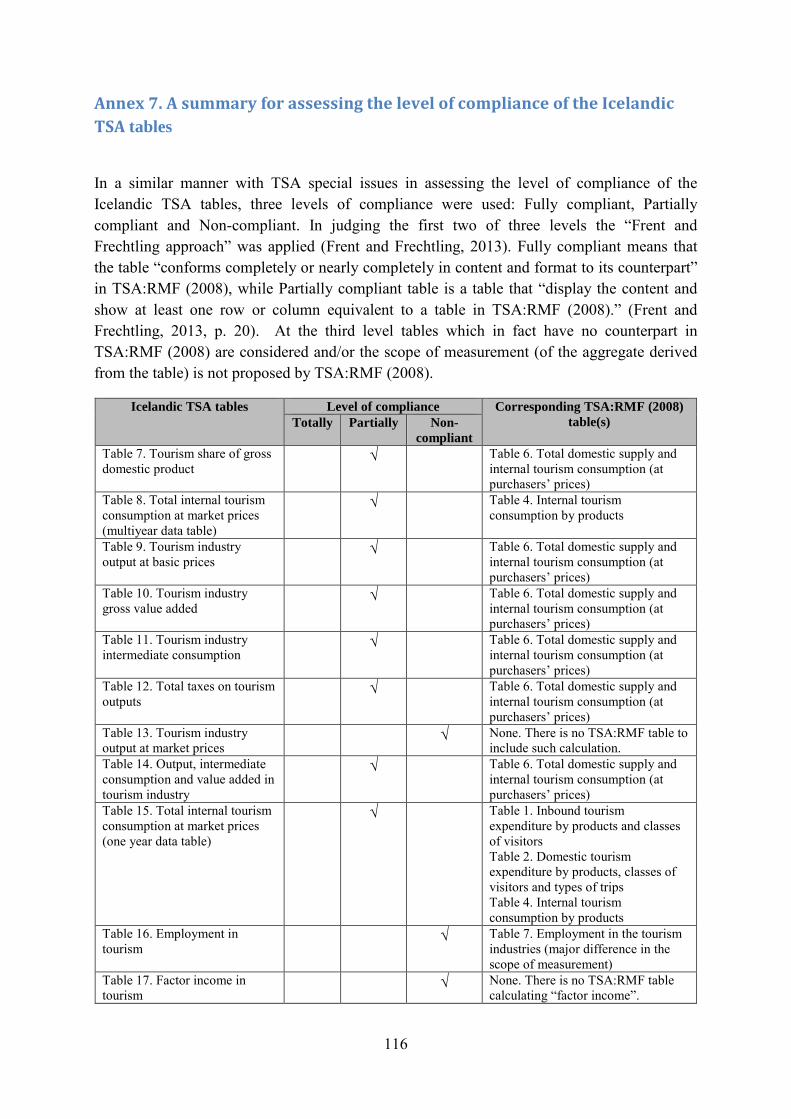
116
Annex 7. A summary for assessing the level of compliance of the Icelandic TSA tables
In a similar manner with TSA special issues in assessing the level of compliance of the Icelandic TSA tables, three levels of compliance were used: Fully compliant, Partially compliant and Non-compliant. In judging the first two of three levels the “Frent and Frechtling approach” was applied (Frent and Frechtling, 2013). Fully compliant means that the table “conforms completely or nearly completely in content and format to its counterpart” in TSA:RMF (2008), while Partially compliant table is a table that “display the content and show at least one row or column equivalent to a table in TSA:RMF (2008).” (Frent and Frechtling, 2013, p. 20). At the third level tables which in fact have no counterpart in TSA:RMF (2008) are considered and/or the scope of measurement (of the aggregate derived from the table) is not proposed by TSA:RMF (2008).
Icelandic TSA tables Level of compliance Corresponding TSA:RMF (2008) table(s) Totally Partially Non-
compliant Table 7. Tourism share of gross domestic product
√ Table 6. Total domestic supply and internal tourism consumption (at purchasers’ prices)
Table 8. Total internal tourism consumption at market prices (multiyear data table)
√ Table 4. Internal tourism consumption by products
Table 9. Tourism industry output at basic prices
√ Table 6. Total domestic supply and internal tourism consumption (at purchasers’ prices)
Table 10. Tourism industry gross value added
√ Table 6. Total domestic supply and internal tourism consumption (at purchasers’ prices)
Table 11. Tourism industry intermediate consumption
√ Table 6. Total domestic supply and internal tourism consumption (at purchasers’ prices)
Table 12. Total taxes on tourism outputs
√ Table 6. Total domestic supply and internal tourism consumption (at purchasers’ prices)
Table 13. Tourism industry output at market prices
√ None. There is no TSA:RMF table to include such calculation.
Table 14. Output, intermediate consumption and value added in tourism industry
√ Table 6. Total domestic supply and internal tourism consumption (at purchasers’ prices)
Table 15. Total internal tourism consumption at market prices (one year data table)
√ Table 1. Inbound tourism expenditure by products and classes of visitors Table 2. Domestic tourism expenditure by products, classes of visitors and types of trips Table 4. Internal tourism consumption by products
Table 16. Employment in tourism
√ Table 7. Employment in the tourism industries (major difference in the scope of measurement)
Table 17. Factor income in tourism
√ None. There is no TSA:RMF table calculating “factor income”.


Annex 8. How the Icelandic TSA tables correspond with TSA:RMF (2008) table 6
… - it signifies other rows/columns found in the original TSA:RMF (2008) table 6 but not represented here due to lack of space. * - imports exclude direct purchase of resident abroad. Note: The red colour signifies lack of data for the Icelandic TSA while the green colour represents the existence of data (in a table format) found in Icelandic TSA.
Products
Tourism industries Other industries
Output of domestic
producers (at basic prices)
Imports* Taxes less subsidies on
products nationally
produced and imported
…
Internal tourism consum-
ption 1. Accommodation for visitors …
Output
Tourism share (in value)
Output
Tourism share (in value)
Output
Tourism share (in value)
Output
Tourism share (in value)
Output
Tourism share (in value)
Output
Tourism share (in value)
…
I-TSA table 15
I. Total output (at basic prices)
I-TSA table 9,
14
I-TSA table 9,
14
I-TSA table 9
I-TSA table 9,
14
I-TSA table
12
I-TSA table 7,
12, 14
I-TSA table 8,
15 II. Total intermediate consumption (at purchasers prices)
I-TSA table 11,
14
I-TSA table 11,
14
I-TSA table
11
I-TSA table 11,
14
(I) - (II). Total gross value added (at basic prices)
I-TSA table 10,
14
I-TSA table 10,
14
I-TSA table
10
I-TSA table 7,
10, 14
…
118

93
April 2014
I C E L A N D I C TO U R I S MR E S E A RC H C E N T R E
Related Documents