Barbara Delmonte Jean Robert Petit Gerhard Krinner Valter Maggi Jean Jouzel Roberto Udisti Ice core evidence for secular variability and 200-year dipolar oscillations in atmospheric circulation over East Antarctica during the Holocene Received: 27 September 2004 / Accepted: 4 February 2005 / Published online: 25 March 2005 ȑ Springer-Verlag 2005 Abstract Two Holocene ice core records from East Antarctica (Vostok and EPICA-Dome C) were analysed for dust concentration and size distribution at a tem- poral resolution of 1 sample per 50 years. A series of volcanic markers randomly distributed over the com- mon part of the ice cores (from 9.8 to 3.5 kyear BP) ensures accurate relative dating (±33 years). Dust-size records from the two sites display oscillations structured in cycles with sub-millennial and secular scale frequen- cies that are apparently asynchronous. The power spectra of the composite sum (S) of the two dust-size records display spectral energy mostly for 150- to 500- year periodicities. On the other hand, the 200-year band is common to both records and the 200 year compo- nents of the two sites are out-of-phase (100-year lead or lag) over 5.5 kyear, a phenomenon also reflected by a significant (>99% conf. lev.) band in the power spectra of the composite difference (D) of the two size records. During long-range transport, mineral dust originating from the Southern Hemisphere continents is graded to a variable extent depending on the altitude and duration of atmospheric transport. Relatively coarse dust is associated with air mass penetration from the middle– lower troposphere and conversely relatively fine dust with upper troposphere air masses or the influence of subsidence over the Antarctic plateau, a hypothesis al- ready proposed for the changes that occurred during the Last Glacial Maximum to Holocene transition (Del- monte et al. 2004b). Moreover, we assume that the overall fluctuation of air mass advection over Antarctica depends on the meridional pressure gradient with re- spect to low latitudes, i.e. the Antarctic Oscillation (AAO). We therefore suggest a regional variability in atmospheric circulation over East Antarctica. The 150– 500 year power spectrum of the composite (S) parameter represents the long term variability of the AAO, im- printed by secular internal oscillations probably related to the southern ocean-climatic system. On the other hand, the D dust composite parameter suggests a per- sistent atmospheric dipole over East Antarctica deliv- ering coarser (finer) dust particles alternatively to Vostok and Dome C regions with a bi-centennial peri- odicity. Indeed, a seesaw phenomenon in dust size dis- tribution was already observed at three East Antarctic sites during the last deglaciation (Delmonte et al. 2004b) and was interpreted as a progressive reduction of the eccentricity of the polar vortex with respect to the geo- graphic south pole. Interestingly, the D parameter shows a pronounced 200-year oscillation mode, throwing new light on the unresolved question of a possible relation- ship between climate and solar activity. 1 Introduction The investigation of Holocene climatic variability over decadal and secular timescales is essential to the B. Delmonte (&) J. R. Petit G. Krinner Laboratoire de Glaciologie et de Ge´ophysique de l’Environnement (LGGE-CNRS), BP96, 38402 Saint Martin d’He`res, France E-mail: [email protected] E-mail: [email protected] V. Maggi B. Delmonte Department of Environmental Sciences, University Milano-Bicocca - DISAT, Piazza della Scienza 1, 20126 Milano, Italy E-mail: [email protected] B. Delmonte Department of geological sciences, University of Siena, Via del Laterino 8, 53100 Siena, Italy E-mail: [email protected] Tel.: +39-2-64482874 Fax: +39-2-64482895 J. Jouzel Laboratoire des Sciences du Climat et de l’Environnement, Institut Pierre Simon Laplace, UMR CEA-CNRS 1572, CE Saclay, Orme des Merisiers, 91191 Gif-sur-Yvette, France R. Udisti Chemistry Department, Analytical Chemistry Sect., Scientific Pole, University of Florence, Via della Lastruccia 3, 50019 Sesto Fiorentino (Florence), Italy E-mail: udisti@unifi.it Climate Dynamics (2005) 24: 641–654 DOI 10.1007/s00382-005-0012-9

Welcome message from author
This document is posted to help you gain knowledge. Please leave a comment to let me know what you think about it! Share it to your friends and learn new things together.
Transcript
Barbara Delmonte Æ Jean Robert Petit
Gerhard Krinner Æ Valter Maggi Æ Jean Jouzel
Roberto Udisti
Ice core evidence for secular variability and 200-year dipolar oscillationsin atmospheric circulation over East Antarctica during the Holocene
Received: 27 September 2004 / Accepted: 4 February 2005 / Published online: 25 March 2005� Springer-Verlag 2005
Abstract Two Holocene ice core records from EastAntarctica (Vostok and EPICA-Dome C) were analysedfor dust concentration and size distribution at a tem-poral resolution of 1 sample per �50 years. A series ofvolcanic markers randomly distributed over the com-mon part of the ice cores (from 9.8 to 3.5 kyear BP)ensures accurate relative dating (±33 years). Dust-sizerecords from the two sites display oscillations structuredin cycles with sub-millennial and secular scale frequen-cies that are apparently asynchronous. The powerspectra of the composite sum (S) of the two dust-sizerecords display spectral energy mostly for 150- to 500-year periodicities. On the other hand, the 200-year bandis common to both records and the 200 year compo-nents of the two sites are out-of-phase (100-year lead orlag) over �5.5 kyear, a phenomenon also reflected by asignificant (>99% conf. lev.) band in the power spectra
of the composite difference (D) of the two size records.During long-range transport, mineral dust originatingfrom the Southern Hemisphere continents is graded to avariable extent depending on the altitude and durationof atmospheric transport. Relatively coarse dust isassociated with air mass penetration from the middle–lower troposphere and conversely relatively fine dustwith upper troposphere air masses or the influence ofsubsidence over the Antarctic plateau, a hypothesis al-ready proposed for the changes that occurred during theLast Glacial Maximum to Holocene transition (Del-monte et al. 2004b). Moreover, we assume that theoverall fluctuation of air mass advection over Antarcticadepends on the meridional pressure gradient with re-spect to low latitudes, i.e. the Antarctic Oscillation(AAO). We therefore suggest a regional variability inatmospheric circulation over East Antarctica. The 150–500 year power spectrum of the composite (S) parameterrepresents the long term variability of the AAO, im-printed by secular internal oscillations probably relatedto the southern ocean-climatic system. On the otherhand, the D dust composite parameter suggests a per-sistent atmospheric dipole over East Antarctica deliv-ering coarser (finer) dust particles alternatively toVostok and Dome C regions with a bi-centennial peri-odicity. Indeed, a seesaw phenomenon in dust size dis-tribution was already observed at three East Antarcticsites during the last deglaciation (Delmonte et al. 2004b)and was interpreted as a progressive reduction of theeccentricity of the polar vortex with respect to the geo-graphic south pole. Interestingly, the D parameter showsa pronounced 200-year oscillation mode, throwing newlight on the unresolved question of a possible relation-ship between climate and solar activity.
1 Introduction
The investigation of Holocene climatic variability overdecadal and secular timescales is essential to the
B. Delmonte (&) Æ J. R. Petit Æ G. KrinnerLaboratoire de Glaciologie et de Geophysique de l’Environnement(LGGE-CNRS), BP96, 38402 Saint Martin d’Heres, FranceE-mail: [email protected]: [email protected]
V. Maggi Æ B. DelmonteDepartment of Environmental Sciences, UniversityMilano-Bicocca - DISAT, Piazza della Scienza 1,20126 Milano, ItalyE-mail: [email protected]
B. DelmonteDepartment of geological sciences, University of Siena, Via delLaterino 8, 53100 Siena, ItalyE-mail: [email protected].: +39-2-64482874Fax: +39-2-64482895
J. JouzelLaboratoire des Sciences du Climat et de l’Environnement,Institut Pierre Simon Laplace, UMR CEA-CNRS 1572, CE Saclay,Orme des Merisiers, 91191 Gif-sur-Yvette, France
R. UdistiChemistry Department, Analytical Chemistry Sect., Scientific Pole,University of Florence, Via della Lastruccia 3, 50019Sesto Fiorentino (Florence), ItalyE-mail: [email protected]
Climate Dynamics (2005) 24: 641–654DOI 10.1007/s00382-005-0012-9
comprehension of present-day climatic trends and todistinguish between natural and anthropogenic contri-butions to climate change (IPCC 2001). Terrestrial andmarine records in polar settings provide importantinformation on the timescales and magnitude of climatevariability, useful for climate models aimed at investi-gating physical processes, interactions, amplificationsand for estimating climate sensitivity to either externalor internal forcing.
Over the Holocene epoch, a number of marine sedi-ment cores from the North Atlantic (e.g. Bond et al.1997; Marchitto et al. 1998; Bianchi and McCave 1999),Indian Ocean (e.g. Sakar et al. 2000) and SoutheastPacific (e.g. Lamy et al. 2001; 2002) as well as atmo-spheric proxies from tropical latitudes (Moy et al. 2002)and northern polar areas (Mayewski et al. 1997) haveshown that a prominent millennial-scale oceanic circu-lation variability mode characterises the present inter-glacial period. At high latitudes of the SouthernHemisphere, secular-scale periodicities (200 and400 year band) were detected from 7,000 year long bio-geochemical sediment records from the Antarctic Pen-insula (Leventer et al. 1996; Domack et al. 1993, 2001;Domack and Mayewski 1999). This was interpreted interms of local changes in upper ocean conditions such assea ice extent and wind stress. Recently, an ice core dustrecord from East Antarctica covering the period from13,000 BP to 2,000 BP indicated a pronounced vari-ability of particle size at millennial and multi-centennialtimescales, linked to atmospheric circulation changes inthe Antarctic and circum-Antarctic regions (Delmonteet al. 2002a).
Further investigations at a high temporal resolution(Bond et al. 2001) pointed out that the structured mil-lennial-scale oscillations evident in North Atlantic deep-sea sediment records (e.g. Bond et al. 1997) are actuallymade up of shorter oscillations (�200–500 years) withperiodicities close to those of solar activity. Several cli-matic records (Bard et al. 1997; Paterson et al. 1991),especially from tropical latitudes (e.g. Neff et al. 2001),also display such modes of variability during the Holo-cene and, in particular, in the late Holocene (Hodellet al. 2001; DeMenocal et al. 2002). However, themechanisms linking faint solar forcing to climate atmillennial and secular periodicities are not yet under-stood.
The southern ocean connects the world’s three oceanbasins and constitutes an important system for themodulation of long-term climatic changes within Ant-arctica and the circumpolar region. Deepwater forma-tion and the extent and distribution of sea ice varygreatly along with the climatological position of theatmospheric centres of influence (ridges and troughs).Such a climatic system coupling continental, oceanic andatmospheric influences possesses its own dynamicinternal oscillations and interacts with external forcingfactors. The impurities emitted from oceans and conti-nents are preserved in the ice layers of the ice sheet.Atmospheric tracers such as insoluble mineral dust
subject to long range transport from Southern Hemi-sphere continents to the Antarctic can therefore poten-tially be used to document atmospheric exchanges andthe variability of the southern climatic system.
The total dust concentration of mineral dust deflatedfrom continental landmasses and transported to thepolar plateau depends on a number of factors such asthe aggradation of the source(s), the hydrological cycleand the strength of atmospheric circulation (e.g. Basileet al. 1997). On the other hand, the grain size is aninteresting atmospheric circulation indicator sensitive tothe grading occurring during transport (e.g. Ruth et al.2003; Delmonte et al. 2004b). From ice records in EastAntarctic sites, Delmonte et al. (2004b) showed thattotal dust concentration and size distribution are notsimply correlated. In particular, the authors pointed outthat the drastic decline of total dust concentration dur-ing Termination I was associated to a dust-size increasein the Dome C and Komsomoskaya regions and to aparticle-size decrease at Dome B and Vostok .
Dust is exclusively of aeolian origin and its size dis-tribution is a parameter mostly sensitive to the atmo-spheric circulation variability. Here, we present twoaeolian dust records from European Project for IceCoring in Antarctica (EPICA)-Dome C and Vostok icecores (East Antarctica), spanning a large part of theHolocene and analysed with a resolution of �50 years.The paper focuses, in particular, on the variability of thetwo dust-size records, which are also analysed for their
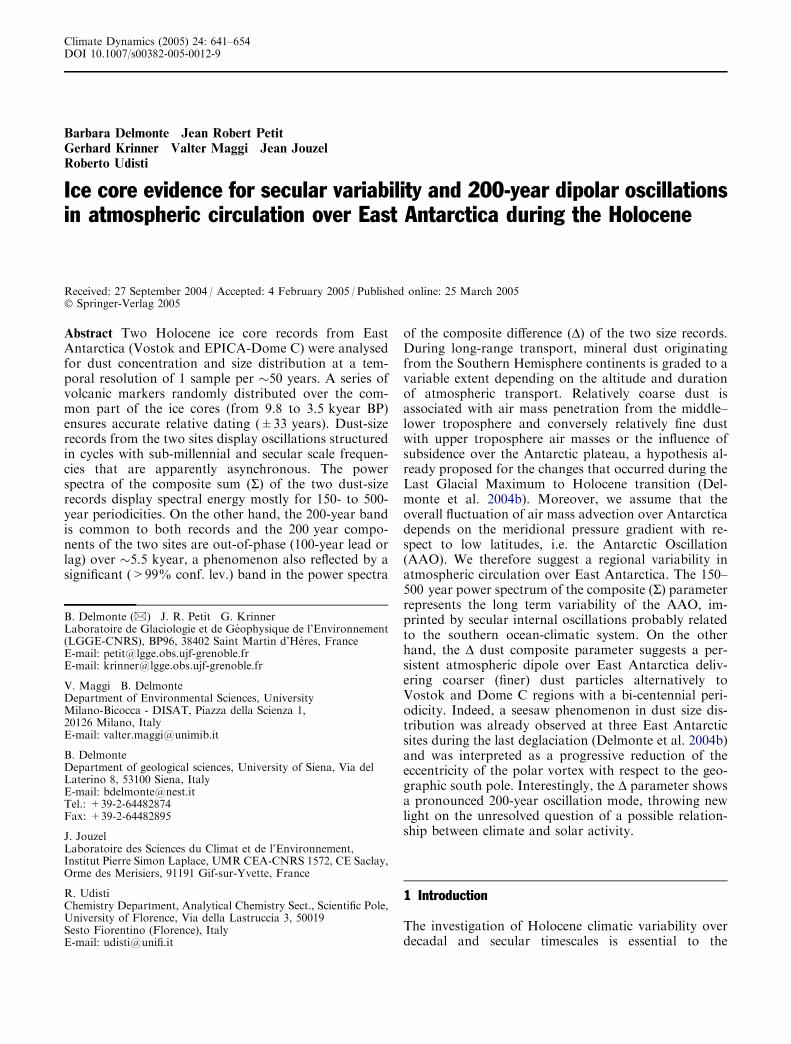
Fig. 1 Antarctic map with ice core drilling location. Map ofAntarctica with the locations of the ice coring drilling sites cited inthe text (EDC EPICA-Dome C; VK Vostok; DB Dome B; KMSKomsomolskaya)
642 Delmonte et al.: Ice core evidence for secular variability and 200-year dipolar oscillations in atmospheric circulation
periodic components. The two drilling sites are �600 kmapart and it was possible to determine the relativechronology of the two records by stratigraphic linksbased on a number of volcanic markers.
2 Analytical methods and results
2.1 Analytical techniques
The EPICA-Dome C ice core (hereinafter EDC, 75�06¢S123�21¢E, Epica community members 2004) and an icecore from Vostok (Vostok-BH7, 78�28¢S, 106�48¢E) werestudied. The two sites (Fig. 1) are located 600 km apart
on the East Antarctic plateau. They have similar alti-tudes (3,233 m a.s.l. and 3,480 m a.s.l., respectively) andclimatic characteristics (mean annual temperature�54.5�C and �55.4�C, accumulation rate2.9 g cm�2 a�1 and 2.2 g cm�2 a�1 for EDC and Vo-stok, respectively). The EDC ice core was analysed from100 m to 400 m, corresponding to an 11,000-year periodfrom 2,000 BP to 13,000 BP, encompassing the end ofthe last climatic transition and the Holocene (Jouzelet al. 2001). The Vostok ice core (Vostok-BH7) wasdrilled in 1996 and was analysed from 104 m to 236 m,corresponding to the period from 3,600 BP to 9,800 BP.
A total of 280 samples from EDC and 130 samplesfrom Vostok ice cores were selected and decontaminated
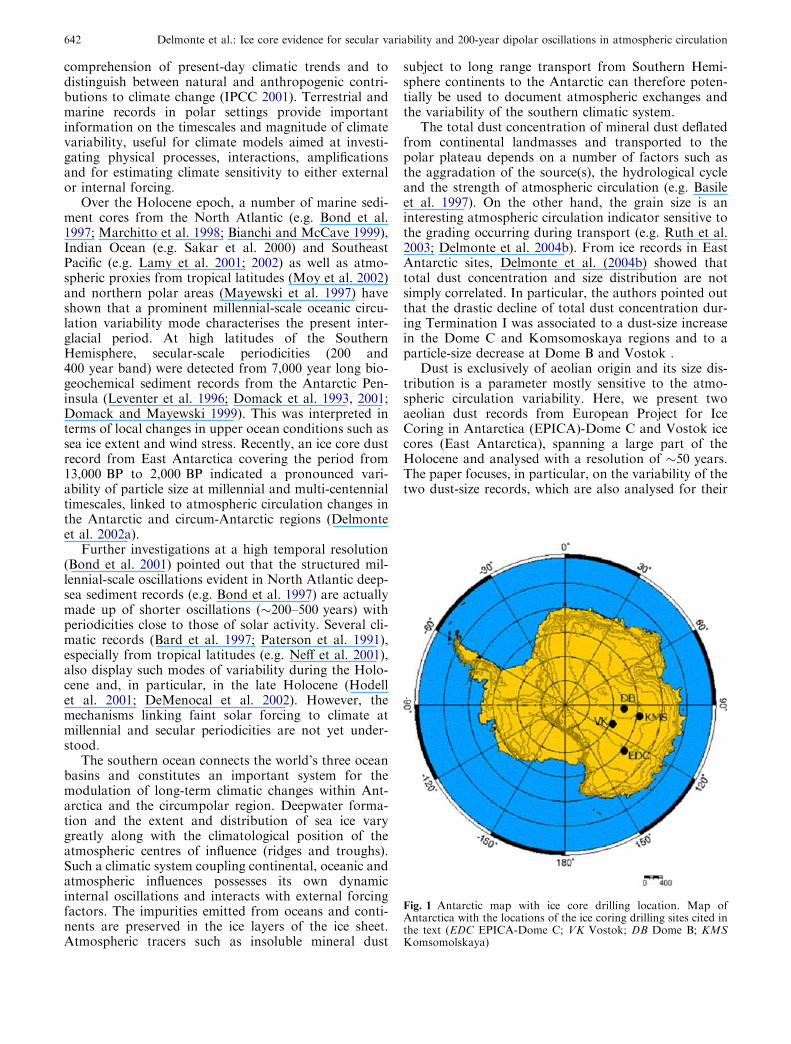
Fig. 2 Stratigraphic linksbetween ice cores.a Comparison of ECM records(in relative units) from EDCand VK-BH7 ice cores. Themost evident events common toboth sites and used asstratigraphic markers aresurrounded by an ellipse. Thethick line at 134 m in EDC and102.1 m in VK-BH7 recordsindicates the ash layer (see text).EDC data are from Wolff et al.1999.b Depth-to-depth relationshipbetween EDC and Vostok-BH7ice cores obtained fromvolcanic markers and indicationof the tephra layer (see text).The insert on the right hand sideis a sketch showing the principleuse to estimate the error due tothe variability in iceaccumulation rate. The error isrepresented by the meanmisalignment of successivemarkers (exaggerated scale).Distances (d1, d2,...) arecalculated as the orthogonaldistance to the line linking twosuccessive markers (bold line)
Delmonte et al.: Ice core evidence for secular variability and 200-year dipolar oscillations in atmospheric circulation 643
using a washing procedure. To avoid contamination, wediscarded the porous firn (i.e. the first �100 m) andfractured ice samples. All ice samples (6–10 cm long)correspond to �3–4 years of accumulation and were
selected every �1 m giving a resolution of about 1sample per 40 years for EDC and 1 per 50 years forVostok, respectively. Dust mass concentration (assum-ing a dust density of 2.5 g cm�3) and size distribution
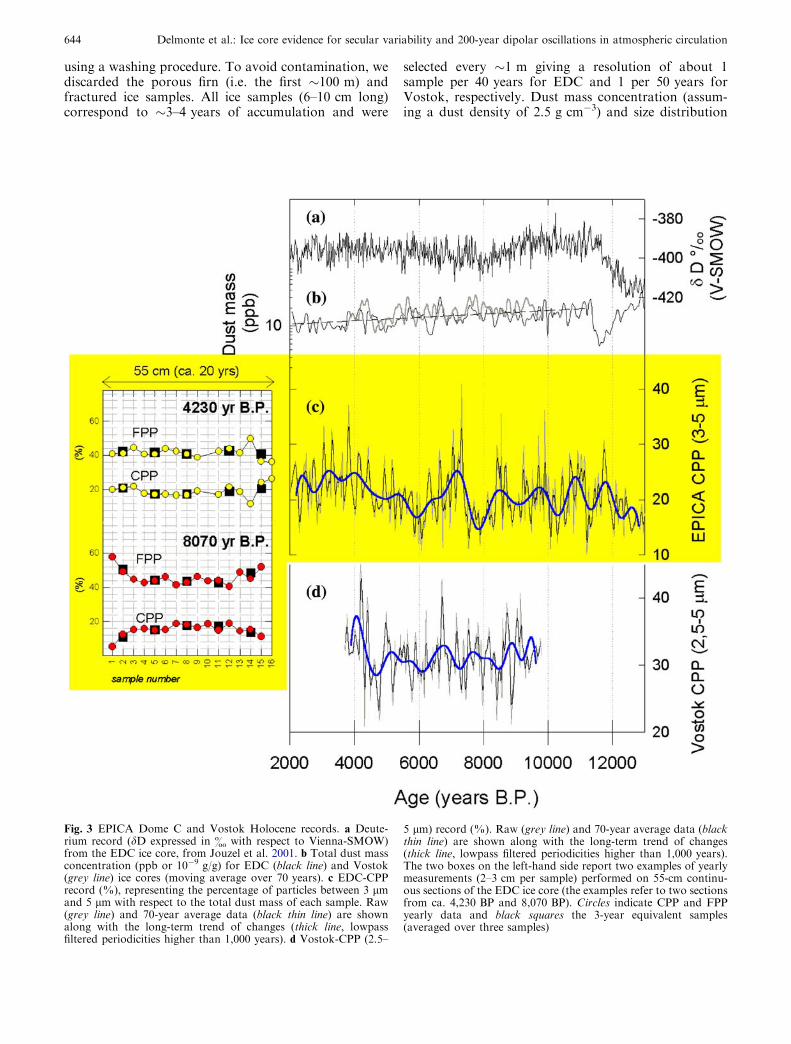
Fig. 3 EPICA Dome C and Vostok Holocene records. a Deute-rium record (dD expressed in & with respect to Vienna-SMOW)from the EDC ice core, from Jouzel et al. 2001. b Total dust massconcentration (ppb or 10�9 g/g) for EDC (black line) and Vostok(grey line) ice cores (moving average over 70 years). c EDC-CPPrecord (%), representing the percentage of particles between 3 lmand 5 lm with respect to the total dust mass of each sample. Raw(grey line) and 70-year average data (black thin line) are shownalong with the long-term trend of changes (thick line, lowpassfiltered periodicities higher than 1,000 years). d Vostok-CPP (2.5–
5 lm) record (%). Raw (grey line) and 70-year average data (blackthin line) are shown along with the long-term trend of changes(thick line, lowpass filtered periodicities higher than 1,000 years).The two boxes on the left-hand side report two examples of yearlymeasurements (2–3 cm per sample) performed on 55-cm continu-ous sections of the EDC ice core (the examples refer to two sectionsfrom ca. 4,230 BP and 8,070 BP). Circles indicate CPP and FPPyearly data and black squares the 3-year equivalent samples(averaged over three samples)
644 Delmonte et al.: Ice core evidence for secular variability and 200-year dipolar oscillations in atmospheric circulation
measurements were performed using a 256-channelCoulter Counter. The detailed analytical procedure isdescribed elsewhere (Delmonte et al. 2002b). Sampleswere processed in random order and the calibration ofthe particle Counter was checked carefully to avoidinstrumental bias.
2.2 Stratigraphic link between the two ice cores andaccuracy of the relative chronology
The EDC and Vostok cores can be linked chronologi-cally by the major H2SO4 fallout from volcanic events,detected from continuous electrical conductivity
measurements (ECM, Fig.1a, Wolff et al. 1999) and ionchromatography (Udsiti et al. 2004). The EDC timescalefrom Schwander et al. (2001) was adopted as a reference.The electrical profiles provided the inventory of volcanicevents that are used as stratigraphic markers. A tightdepth-to-depth correspondence between the two recordswas set for the 7,000-year common period using 24volcanic events (Fig. 2a, b), yielding an average of onemarker every �300 years. To prevent cumulative errors,peak-to-peak matching was not carried out from top tobottom but rather by first establishing a general strati-graphic relationship through the major climatic events,such as the end of the climatic transition (ca. 12,000 BP)and by comparison of the deuterium profiles.
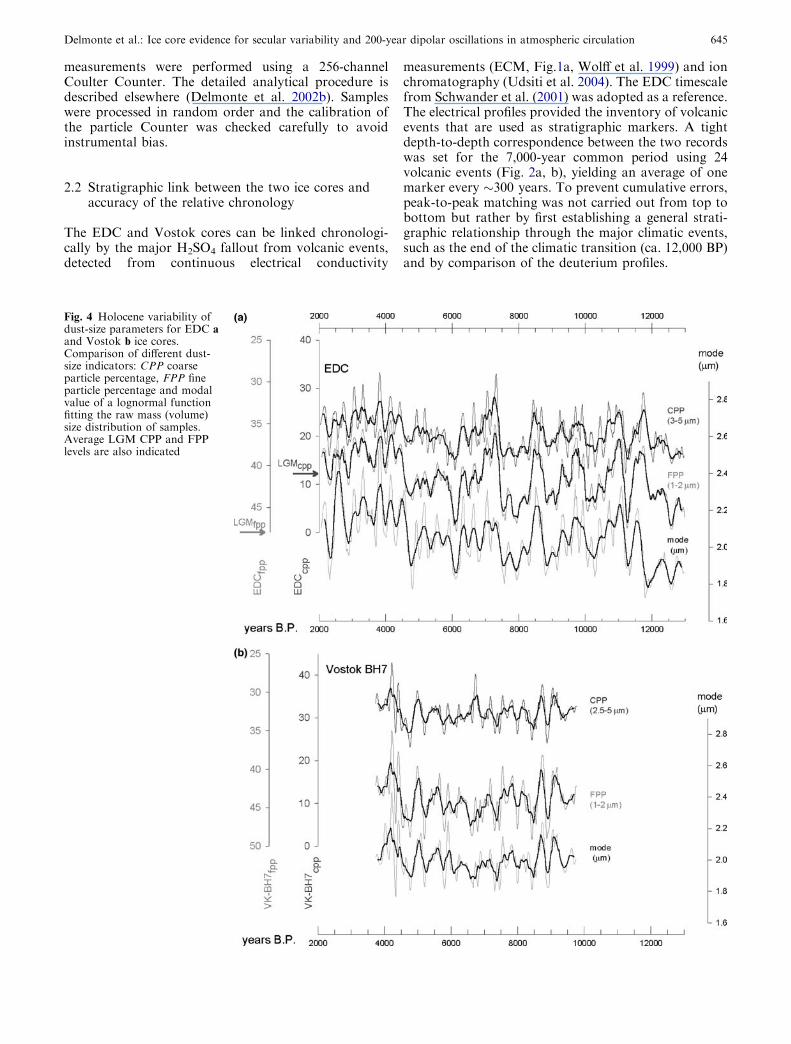
Fig. 4 Holocene variability ofdust-size parameters for EDC aand Vostok b ice cores.Comparison of different dust-size indicators: CPP coarseparticle percentage, FPP fineparticle percentage and modalvalue of a lognormal functionfitting the raw mass (volume)size distribution of samples.Average LGM CPP and FPPlevels are also indicated
Delmonte et al.: Ice core evidence for secular variability and 200-year dipolar oscillations in atmospheric circulation 645
Moreover, the EDC ice core was examined to lo-cate the equivalent of a 2-cm thick tephra layer foundat 102.1 m depth in the Vostok-BH7 ice core, an eventfrom the South Sandwich islands (Basile et al. 2001)and lying between two major ECM peaks. The cor-responding ECM ice section event did not show visibleash layers. However, continuous Coulter Counteranalyses (1 sample per 2–3 cm) and electron micro-scope observations revealed the presence of a highlyconcentrated dust layer with large (10–20 lm) glassshards at 132.60 m depth, in-between two ECM peaks.Taking into account the general trend of the depth-to-depth relationship, all the other 23 events were iden-tified from the EDC-Vostok ECM comparison. Themain markers made it possible to refine the relation-ship and to select secondary and then intermediateevents.
The accuracy of such matching was estimated. Sincethe average EDC/Vostok accumulation ratio is �1.33for the considered period (Udisti et al. 2004), all Vostokdepths were first normalised by multiplying by this fac-tor. Assuming correct stratigraphic correspondence (anddating), the relative variation of snow accumulation ratebetween the two sites was calculated on the normaliseddepth-to-depth plot. The error can be defined as theorthogonal distance of a marker from the extrapolatedline passing through the previous pair of markers (insertin Fig. 2b). The mean (squared) misalignment of allmarkers gives the mean (squared) distance and error.For EDC and Vostok cores, we calculated a mean dis-tance of about ±1 m, representing ±33 years (taking2.9 cm year�1 as the mean ice accumulation rate forEDC).
2.3 Dust-size distribution parameters
The continental dust reaching the high East Antarcticplateau is well sorted: the average particle diameter isgenerally around 2 lm and generally smaller than�5 lm (Delmonte et al. 2002a, 2002b, 2004b). Largerdust (up to �20 lm in diameter) is typically associatedwith rare ash layers (Basile et al. 2001). To characterisethe dust-size distribution, the modal value (mode) of thevolume-size distribution obtained from the lognormal fitof the raw data or the proportion of dust within arbi-trarily-selected size intervals can be used (Delmonteet al. 2002a, 2004b). In order to define the percentage offine particles (Fine Particle Percent or FPP), we choosethe interval between 1 lm and 2 lm with respect to thetotal dust mass spectrum (0.7- to 5-lm interval); thepercentage of coarse particles (Coarse Particle Percentor CPP), on the other hand, was defined in the interval3–5 lm for EDC and 2.5–5 lm for VK-BH7, since dustin the Vostok ice core is slightly smaller than in the EDCice core (see below).
Each dust sample represents �3–4 years of accumu-lation. We tested the variability and significance of each
point by analysing a set of seven 55 cm sections of theEDC ice core with annual resolution (�1 sample peryear, i.e. 1 sample every 2–3 cm) selected at differentdepths. The FPP and CPP parameters of two of them(corresponding to ca. 4,230 BP and 8,070 BP) are shownin the insert of Fig. 3 both as yearly values and as �3-year equivalent values (unweighted average of 3 adjacentsamples). The variability (standard deviation) calculatedon the yearly samples is �4.6% both for CPP and FPPand it decreases to 2.9% and 2.6% for CPP and FPP,respectively when the 3-year samples are considered. Forthe sake of comparison, the Holocene standard devia-tion is about 5.2% for CPP, suggesting that the varia-tions are significant, even for single measurements.Moreover, we averaged the data using a resamplingprocedure that also improves the significance of thevariations.
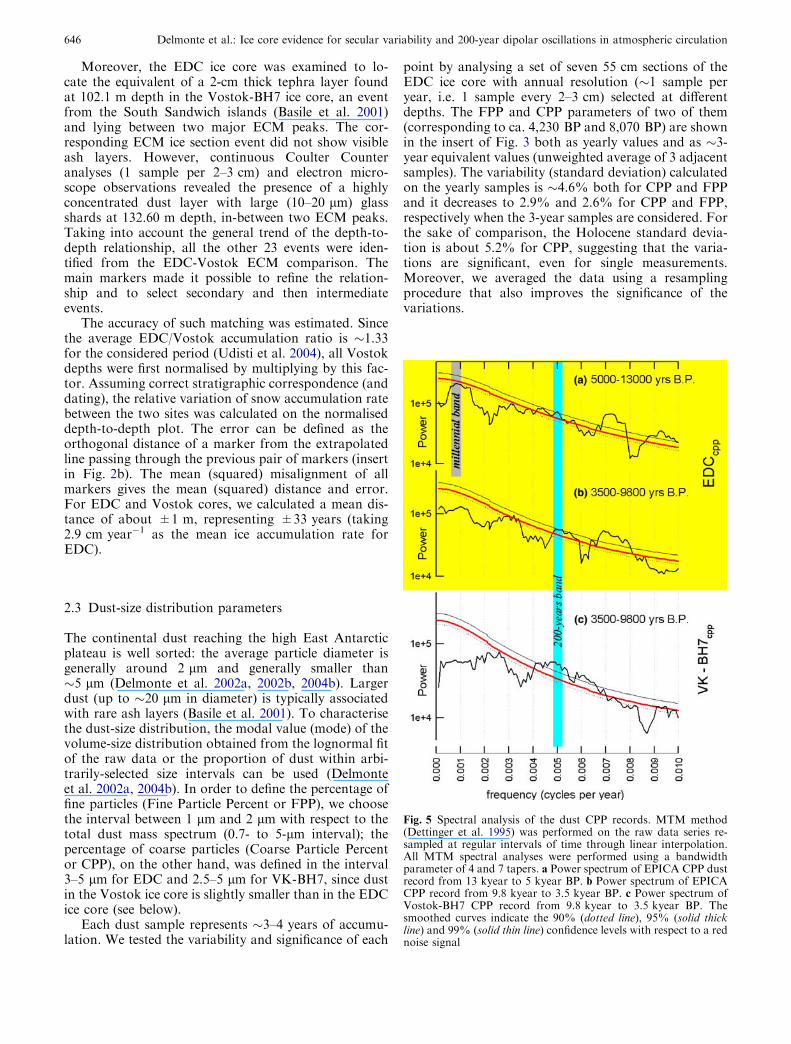
Fig. 5 Spectral analysis of the dust CPP records. MTM method(Dettinger et al. 1995) was performed on the raw data series re-sampled at regular intervals of time through linear interpolation.All MTM spectral analyses were performed using a bandwidthparameter of 4 and 7 tapers. a Power spectrum of EPICA CPP dustrecord from 13 kyear to 5 kyear BP. b Power spectrum of EPICACPP record from 9.8 kyear to 3.5 kyear BP. c Power spectrum ofVostok-BH7 CPP record from 9.8 kyear to 3.5 kyear BP. Thesmoothed curves indicate the 90% (dotted line), 95% (solid thickline) and 99% (solid thin line) confidence levels with respect to a rednoise signal
646 Delmonte et al.: Ice core evidence for secular variability and 200-year dipolar oscillations in atmospheric circulation
2.4 The EPICA and Vostok records
The EDC deuterium profile, proxy of the surface tem-perature (Jouzel et al. 2001) is reported in Fig. 3a alongwith the two records of total dust concentration forEDC and Vostok ice cores (Fig. 3b). Both dust recordsdisplay a short-term variability superposed on a mainlong-term Holocene decreasing trend. The EDC recordfrom 13,000 BP to 2,000 BP encompasses the end of theAntarctic Cold Reversal dust event (�13,000 BP) andthe 800–1,000 year pre-Holocene dust minimum, cul-minating at �11,500 BP (DelMonte et al. 2002).
The proportion of coarse particles (CPP) is reportedin Fig. 3c, d for EDC and Vostok ice cores, respectively(raw data, moving average over 70 years and lowpassfiltered series for periodicities longer than 1,000 years).A visual observation of the CPP records highlights thatEDC dust-size variations clearly overcome the ampli-tude variation of the stable isotope record for multi-secular to sub-millennial periodicities (Fig. 3a, c).Moreover, EDC and Vostok dust-size profiles displayevident dissimilarities at sub-millennial periodicities(Fig. 3c, d). The visual comparison does not make itpossible to determine a clear correlation and several sub-millennial oscillations appear to be at least asynchro-nous, if not totally opposite (Fig. 2c, d). For example,from 13,000 BP to 4,500 BP, the EDC profile suggestsshort-term (secular-scale) variations structured inapparent multi-secular and millennial-scale cycles, whilethese are less pronounced in the Vostok record.
The different dust-size indicators (FPP, CPP and themodal value of the log-normal function fitting the raw
dust mass-size distribution) reported in Fig. 4 consis-tently capture the overall pattern of dust-size variabilityand therefore can be used interchangeably. An increaseof �0.50 lm in the mode corresponds to a �10–15%increase (decrease) in CPP (FPP). Obviously, with re-spect to FPP variations, the mode and CPP variationsare opposite. The average FPP value is 44±3% forVostok and 41±4% for EDC, respectively and Vostokdust is slightly more graded than EDC dust over thecommon time period. Compared to value obtained forthe last glacial climate (ca. 20,000 BP, Delmonte et al.2002b), the size of EDC dust never returned to the ex-treme values of the LGM: CPP always represents morethan �20% and FPP more than �41% of the total mass,while LGM values are about 12.5% and 48%, respec-tively (see Fig. 4a).
2.5 Spectral analysis of dust-size records
Spectral analyses were performed on the dust recordsusing the Multitaper Method (or MTM, bandwidthparameter of 4 and 7 tapers, Dettinger et al. 1995). Forthe time period common to the two series (9,800–3,500BP), the CPP power spectrum of EDC indicates that theenergy is mostly spread between �120 and �330 yearswhile two significant (>95% conf. lev.) secular-scalebands (Fig. 5b) corresponding to periodicities arisearound 130–150 years and 180–210 years. Depending onthe time series considered, power may be carried bymillennial-scale periodicities (>90% conf. lev.) asshown by the EDC series analysed from 13,000 BP to
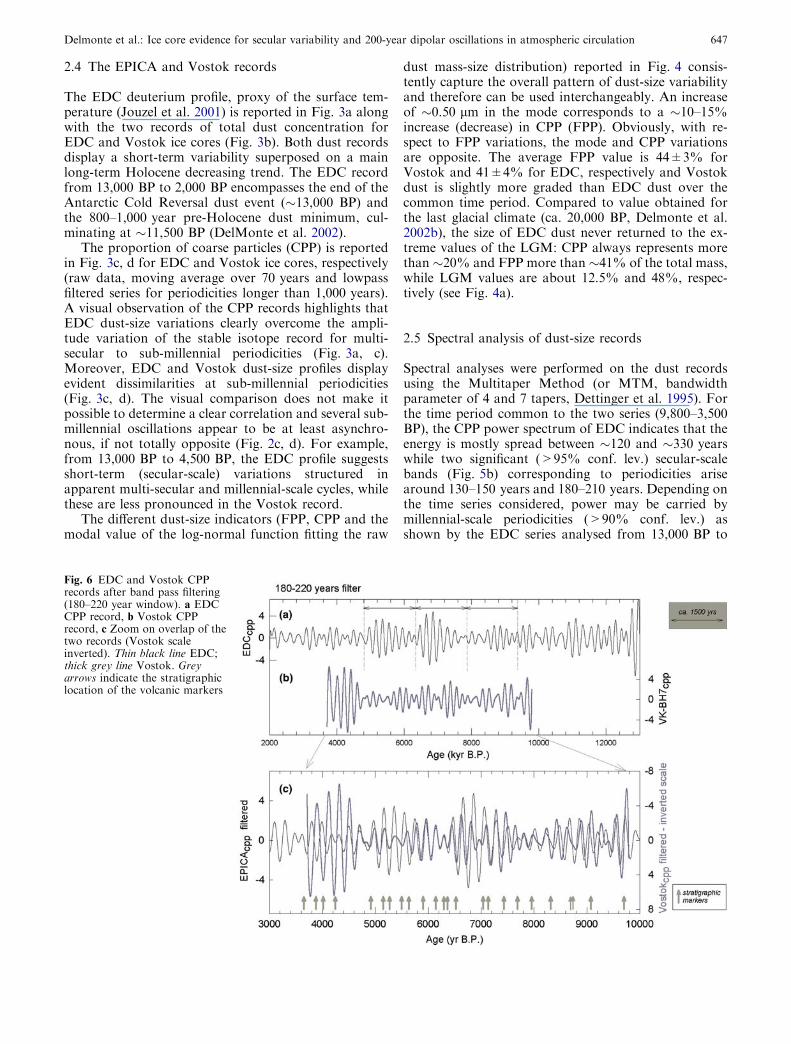
Fig. 6 EDC and Vostok CPPrecords after band pass filtering(180–220 year window). a EDCCPP record, b Vostok CPPrecord, c Zoom on overlap of thetwo records (Vostok scaleinverted). Thin black line EDC;thick grey line Vostok. Greyarrows indicate the stratigraphiclocation of the volcanic markers
Delmonte et al.: Ice core evidence for secular variability and 200-year dipolar oscillations in atmospheric circulation 647
5,000 BP (Fig. 5a). The power spectrum of Vostok CPPseries also indicates a rather wide frequency window(�120–400 years) while one band (significant >99%conf. lev.) corresponds to 150- to 230-year periodicitiesand another band peaks (>90%) at around 380 years(Fig. 5c).
Interestingly, the dust-size distribution records fromboth sites share a common significant frequency bandaround �200 years. Filtering the two CPP series in the180–220 year window (Fig. 5) gives rise to a modula-tion, likely reflecting a combination of very close secularperiodicities. Such modulation is clearly apparent in theEDC record from 9,500 BP to 4,500 BP and the distancebetween the nodes again suggests a millennial-scaleperiodicity. Focusing on the 200 year component, thetwo signals are opposite in phase for most of theHolocene (Fig. 6c) and a matching of the two records ispossible with 25 cycles from a total of 29, encompassingabout a 5,500-year period (from 9,800 BP to 4,200 BP).Such phase opposition is confirmed by consistency cal-culations and phase analyses performed on the two re-cords (not reported) but also from the power spectra ofthe composite (difference between the two records) dustsignal (see below).
The �100 year lead or lag between the EDC andVostok dust-size indicators may correspond to a sys-tematic shift in depth between the two ice cores by�3 m. Yet, this is unlikely because the depth-to-depthmatching, is accurately determined by volcanic eventsrandomly distributed along the two profiles (Fig. 6) and,in particular, by a number of clear double peaks and theash layer.
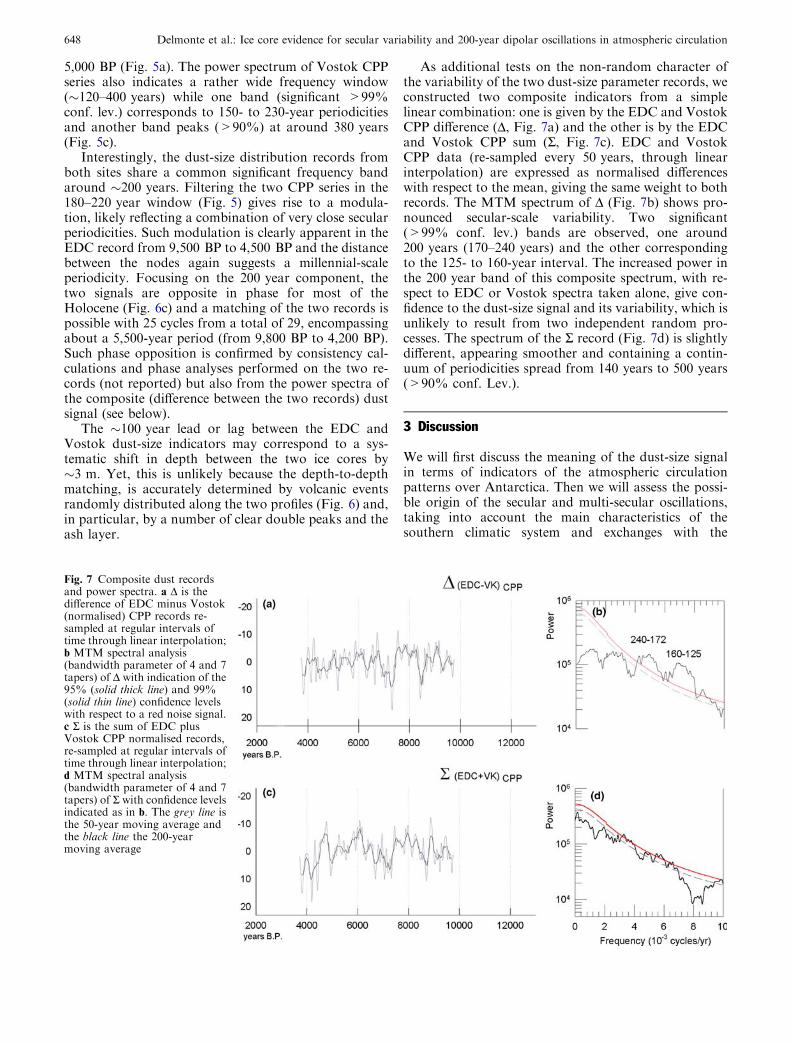
As additional tests on the non-random character ofthe variability of the two dust-size parameter records, weconstructed two composite indicators from a simplelinear combination: one is given by the EDC and VostokCPP difference (D, Fig. 7a) and the other is by the EDCand Vostok CPP sum (S, Fig. 7c). EDC and VostokCPP data (re-sampled every 50 years, through linearinterpolation) are expressed as normalised differenceswith respect to the mean, giving the same weight to bothrecords. The MTM spectrum of D (Fig. 7b) shows pro-nounced secular-scale variability. Two significant(>99% conf. lev.) bands are observed, one around200 years (170–240 years) and the other correspondingto the 125- to 160-year interval. The increased power inthe 200 year band of this composite spectrum, with re-spect to EDC or Vostok spectra taken alone, give con-fidence to the dust-size signal and its variability, which isunlikely to result from two independent random pro-cesses. The spectrum of the S record (Fig. 7d) is slightlydifferent, appearing smoother and containing a contin-uum of periodicities spread from 140 years to 500 years(>90% conf. Lev.).
3 Discussion
We will first discuss the meaning of the dust-size signalin terms of indicators of the atmospheric circulationpatterns over Antarctica. Then we will assess the possi-ble origin of the secular and multi-secular oscillations,taking into account the main characteristics of thesouthern climatic system and exchanges with the
Fig. 7 Composite dust recordsand power spectra. a D is thedifference of EDC minus Vostok(normalised) CPP records re-sampled at regular intervals oftime through linear interpolation;b MTM spectral analysis(bandwidth parameter of 4 and 7tapers) of D with indication of the95% (solid thick line) and 99%(solid thin line) confidence levelswith respect to a red noise signal.c S is the sum of EDC plusVostok CPP normalised records,re-sampled at regular intervals oftime through linear interpolation;d MTM spectral analysis(bandwidth parameter of 4 and 7tapers) of S with confidence levelsindicated as in b. The grey line isthe 50-year moving average andthe black line the 200-yearmoving average
648 Delmonte et al.: Ice core evidence for secular variability and 200-year dipolar oscillations in atmospheric circulation
Southern Ocean. We will also discuss the meaning of thecomposite S and D records and the kind of informationthat can be extracted from them. Finally, given thepresence of a persistent 200 year oscillation mode in theD record over a large part of the Holocene, the existenceof a possible relationship between Antarctic climate andsolar variability will be discussed.
3.1 Dust-size changes as an indicator of atmospherictransport pathways
First, let us look at why the salient changes in atmo-spheric circulation suggested by dust-size records are notso clearly expressed in other climatic proxies such as thestable isotope composition of ice. In fact, the Deuteriumor Oxygen 18 record for EDC (Fig. 3a), and similarlyfor other sites from the east Antarctic plateau, displays avery low temporal variability during the Holocene. Onlyweak secular and sub-millennial periodicities were foundin stacked ice core isotopic records by Masson et al.(2000). However, while isotope sources are extensive, thenarrow and geographically fixed location of the mainsource areas for mineral dust (see below) as well as theirrelative long distance from Antarctica are good reasonsto use this proxy as a tracer for air mass exchanges andvariability between middle and high latitude in thesouthern hemisphere. Insoluble mineral aerosols reach-ing East Antarctica must be transported at high altitudes(middle to high troposphere) and precipitate exclusivelyby dry deposition (Legrand and Mayewski 1997).Therefore, the slight size fractionation that we observe islikely insensitive to air temperature or water saturationpressure and should depend mostly on transport time.This likely gives the dust-size parameter a greater sen-sitivity than other climatic proxies to the variability ofatmospheric circulation around Antarctica.
A dominant southern South American provenancefor aeolian dust reaching EDC and Vostok sites duringthe cold periods of the late Quaternary was suggested byGrousset et al. (1992), Basile et al. (1997) and recently byDelmonte et al. (2004a). Preliminary isotopic investiga-tions (Basile 1997; Delmonte 2003) on samples frominterglacial periods have suggested that the two sitesprobably share common dust sources also during warmepochs, although the geographic location is not yet wellestablished.
Over the last 220 kyear, the EDC and Vostok sitesshow an overall homogeneity of dust flux (Delmonteet al. 2004a); the same conclusion was drawn by Del-monte et al. (2004b) for the last climatic transition(20 kyear to 10 kyear BP) based on three independentice core dust records from the 90�E–125�E sector of EastAntarctica (EDC, Dome B, located 77�05¢ S, 94�55¢Eand Komsomolskaya, located 74�05¢S, 97�29¢E, seeFig. 1). Therefore, the overall agreement between EDCand Vostok dust concentration records reported inFig 2b confirms that the first-order similarity of mineraldust input also holds for the Holocene.
Indeed, the total concentration depends on severalparameters influencing the dust cycle from the conti-nental sources to the snow layers. Among them, we cancite the environmental conditions at the source regions,transport conditions, the hydrological cycle and localsnow accumulation rate on the ice sheet. On the otherhand, particle grading depends mainly on the transportconditions (Delmonte et al. 2004b) and can be used as anindicator for atmospheric circulation over the Antarcticand circum-Antarctic regions. While the total dustconcentration profile is quite homogenous and uniformbetween sites, the dust-size records can be very dissimilarand sometimes the regional trends are opposite (asym-metric). During the last climatic transition, a significantincrease in particle size was observed at EDC site (Del-monte et al. 2002b), while opposite changes were ob-served on other East Antarctic ice cores from the 90�E–125�E sector of the plateau (Delmonte et al. 2004b).Moreover, asynchronous short-term dust-size oscilla-tions of secular to millennial-scale duration are presentin all the records. The authors attributed the temporalvariability observed in the records to changes in atmo-spheric circulation and dust transport patterns modu-lating advection to the East Antarctic plateau andpointed out that the response to this phenomenon can beregionally different.
The progressive seesaw pattern of the dust-sizechanges observed between the EDC-Komsomolskayaregion and the Dome B-Vostok region during the lastclimatic transition is a clear expression of geo-diversityand regional differences over the East Antarctic plateau(Delmonte et al. 2004b). The authors proposed a con-ceptual scenario in which the relatively coarser (finer)dust is associated with the penetration of air massesfrom lower (higher) altitudes and/or through shorter(longer) paths. Indeed, the observed changes in sizedistribution of dust during a volcanic event recorded inice supports this interpretation: while the coarse glassshards from the eruption are transported first to the siteby a rapid and almost direct pathway through the lowertroposphere, the subsequent sulphate compound formedwithin the stratosphere peaks later in the ice record andis escorted by fine and very fine particles which havetransited through the upper troposphere (Delmonteet al. 2004b).
The dust-size changes observed during the Holoceneat EDC and Vostok sites are less pronounced than theglacial-to-Holocene differences. As the dust source re-gions were not constrained yet for the interglacial peri-ods, two possibilities must be considered. Assuming acommon source for dust to Vostok and EDC during theHolocene, different transport paths are required to ex-plain the asynchronous grain-size variations. A secondpossibility is that two or more sources are involved andinfluence alternatively the two sites. Nevertheless, thiswould imply an atmospheric circulation and dusttransport variability. Therefore, the short-term andasynchronous dust-size oscillations we observe in therecords likely represent the continuation during the
Delmonte et al.: Ice core evidence for secular variability and 200-year dipolar oscillations in atmospheric circulation 649
Holocene of those observed in the EDC, Dome B andKomsomolskaya ice cores during Termination I andsuperposed on the main trend of the changes. In otherterms, our records suggest that a multi-secular to mil-lennial-scale modulation of lower or higher air-masspenetration onto the polar plateau was taking place overAntarctica for at least 20 kyear.
Despite the relatively short distance between the twoice-coring sites, the climatic and atmospheric regimeover East Antarctica is far from uniform. The EDC andVostok sites are located at similar altitudes (3,233 ma.s.l. and 3,480 m a.s.l., respectively) and distances fromthe coast (1,100 km and 1,410 km), they have similarmean annual temperatures (�54.5�C and �55.4�C) andprobably share the same dust sources.
However, there is evidence of regional differences inatmospheric circulation inside the East Antarctic pla-teau. The variability of the isotopic composition of snowat a �100 km scale along the 6,000 km transect of theTrans-Antarctic route (Dahe et al. 1994) is a goodexample of regional differences. The deuterium value forVostok is the lowest of the whole series (dD��440&)for present-day climate. This is consistent with thegradual trend and the isotope-temperature relationshipover more than �2,500 km from the Weddell Seathrough the South Pole to Vostok. North of Vostok,however, there is a steady gradient (+7& per 100 km)and �300 km away a second isotope-temperature rela-tionship occurs, with a 20& shift with respect to theprevious one. Such variability was believed to be asso-ciated with a topographic effect (Dahe et al. 1994),making the Vostok Antarctic site subject to the strongestcontinental influence. This effect, however, was notreproduced by GCM experiments. However, the isotopecontent of precipitation is linked to the cloud historyand the less depleted isotopic content of EDC (dD��390&) with respect to Vostok (� �440&) can beattributed to different pathways of air masses and to amore oceanic influence. The same conclusion is sup-ported by the Holocene values of deuterium excess, aproxy for the sea surface temperature indicative of watersource constraining the atmospheric pathway (Vimeuxet al. 2001).
3.2 Possible origin of secular oscillations in atmosphericcirculation: influence of the Southern Ocean
Atmospheric circulation at high latitudes of the southernhemisphere is dominated by the circumpolar Westerlywinds, reaching their maximum close to 50�S at surfacelevel. The Westerlies can be embedded at any time withdisturbances taking the form of cyclonic waves and ed-dies controlling the daily weather (e.g. King and Turner1997 and references therein). Beside transient distur-bances, present-day climatological data from the Ant-arctic region show that large-scale semi-stationary wavescan maintain a similar location and amplitude all yearround. In the analysis of zonal standing waves, low
disturbance levels are generally associated with longerwaves (wavenumbers 2 and 3) while intense disturbancesare generally associated with shorter waves (higherwavenumbers) and to a more meridional circulationpattern. Planetary long waves can influence the atmo-spheric circulation of the high troposphere (500–300 hPa) and can be contained and propagated by thejet stream. Wavenumber 1 corresponds to the eccen-tricity of the Polar vortex, i.e. the distance of the centreof the vortex from the geographic South Pole.
Atmospheric circulation at high latitudes of theSouthern Hemisphere is highly related to the SouthernOcean conditions. For example, the present-day east-ward propagation of the Antarctic Circumpolar Wave(ACW, White and Peterson 1996) shows that sea iceextent, sea surface temperature and surface wind stressanomalies do exist in the southern polar region and thatthey are highly interrelated on an interannual (4–5 years) timescale. Changes in the position of stormtracks are thought to affect the amount of sea ice versusopen water on an annual basis (see King and Turner1997 and references therein). Furthermore, high-pres-sure systems influence the dynamics of sea ice distribu-tion by moving ice and by leading to new ice formation(e.g. Venegas and Drinkwater 2001). Sea ice, in turn, canaffect the positions of the major climatological centresinfluencing the circum-Antarctic, the atmospheric cir-culation pattern and the cyclonic activity on a variety oftimescales (Carleton 1989).
On secular and multi-secular timescales, the annularmode appears to be the dominant atmospheric circula-tion structure around Antarctica and the zonally sym-metric fluctuations of atmospheric masses driven by theoverall pressure gradient between polar and lower lati-tudes characterise the Antarctic oscillation (AAO). TheSouthern Ocean plays a major role in long-term climatechange trends. It potentially influences atmospheric cir-culation at high latitudes of the Southern Hemispherethrough the slow changes in sea ice concentration anddistribution around Antarctica and constitutes a keybuffer for heat and mass exchanges within the globalocean. The Drake passage allows exchanges with thePacific ocean, while the Southern circum-Antarctic re-gion is an important crossing for ocean currentsincluding the North Atlantic deep water (NADW) cur-rent from the global thermohaline circulation. Due tothe geometry of the Atlantic basin, the forcing of surfacecurrents by atmospheric circulation and the densityproperties of seawater, the system is capable of gener-ating internal oscillations at secular frequencies. Indeed,an ocean–atmosphere experiment performed by Mi-kolajewicz and Maier-Reimer (1990) suggests internaloscillations in the �50–500 year-band for the SouthernAtlantic Ocean. In the conducted experiment, the modelwas forced by a stochastic surface wind at 40�S. Resultsshow that the southward flux of NADW (and heat)through 30�S into the circum-Antarctic current is notcontinuous but pulsed and appears opposite to the fluxof fresh water through the Drake passage. After inte-
650 Delmonte et al.: Ice core evidence for secular variability and 200-year dipolar oscillations in atmospheric circulation
gration over �1,500 years, the model of the SouthAtlantic Ocean indicated a mean oscillation mode ofabout �320 years.
It could be therefore speculated the Southern Oceanresembles a secular pseudo-oscillator capable of influ-encing the atmospheric circulation through surfacetemperature, sea ice extent, position of the centres ofatmospheric influence, atmospheric circulation patternsand meridional air exchanges with Antarctica. In thisconjuncture, the variability of the overall atmosphericresponse or the resulting secular variability of the AAOshould have a spectrum similar to that of the SouthernOcean. It is interesting to point out that the spectrum ofthe composite dust indicator S (Fig. 7d), which is rep-resentative of the general atmospheric circulation regime(enhanced or reduced subsidence) over the east Ant-arctic sector (approximately 100�E–125�E), displaysenergy over a wide band of periodicities from 150 yearsto 500 years (confidence >90%), consistent with thecited model results. We therefore speculate that theSouthern Ocean modes of oscillations are reflected in theatmospheric circulation and expressed in the sub-mil-lennial and secular-scale pervasive oscillations.
3.3 Sketch of the principal modes of variabilityof atmospheric circulation over east Antarctica:AAO and an atmospheric dipole oscillation
The influence of air masses from different altitudessuggested by the dust-size variations can be associatedwith the strength of subsidence over Antarctica, thelatter being maximum close to the overall centre of thepolar vortex (King and Turner 1997). Actually, the cli-matological centre of upper cyclonic vorticity is gener-ally zonally asymmetric with respect to the geographicsouth pole. Among indicators of its variable eccentricityis the Trans Polar Index (TPI, pressure difference be-tween Hobart and Stanley, Pittock 1980), that can bealso interpreted as an index of the sea-level pressurewavenumber 1 component of southern Hemisphere cir-culation. The TPI record shows that the eccentricity ofthe polar vortex has changed over the last two centuries(Villalba et al. 1997) and it is reasonable to assume thatit may have changed in the Quaternary over a variety oftimescales. Through this argument, it was suggested(Delmonte et al. 2004b) that the general reorganisationof the atmospheric circulation that occurred during thelast glacial/interglacial transition, linked also to South-ern Ocean conditions, led to a gradual change in theeccentricity of the polar vortex (centre of relativelyhigher subsidence) from lower to higher latitudes (e.g.from �75�S over the Dome C region to �79�S over theVostok region).
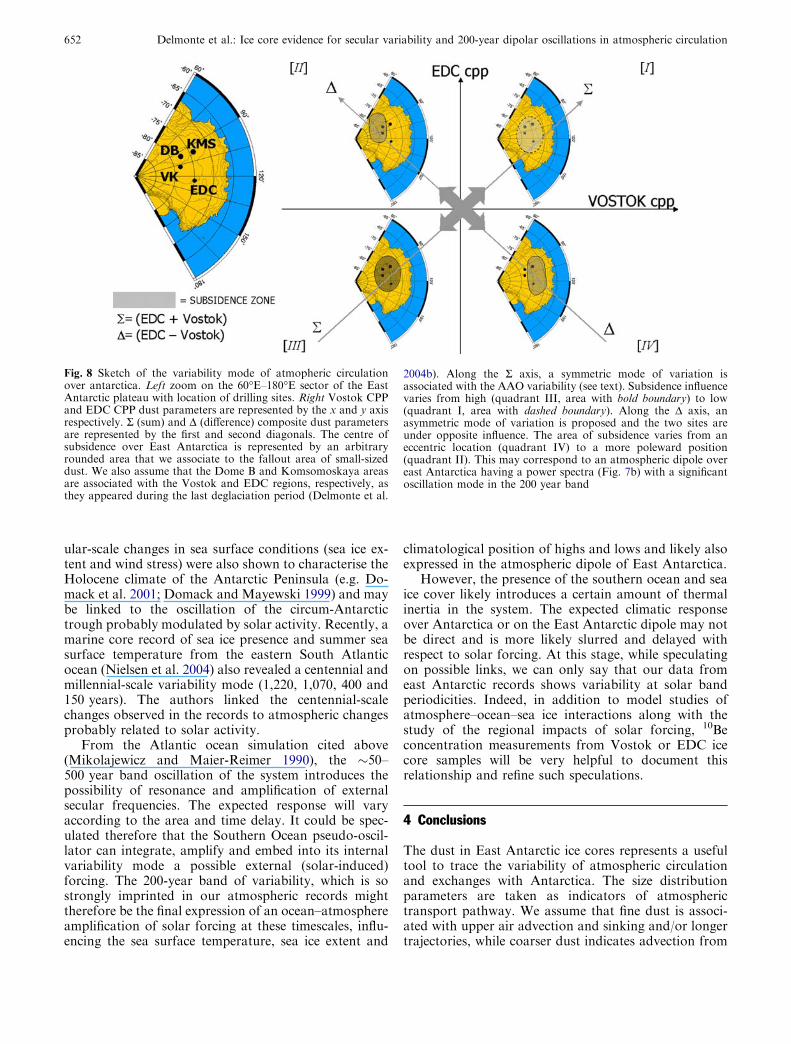
In our interpretation, we associate the CPP parame-ter to the poleward advection of air from the lowertroposphere and conversely, the FPP parameter to theinfluence of the high level and subsidence. The com-posite sum parameter (S) likely characterises the sym-
metric mode of influence of advection/subsidence overthe east Antarctic plateau and it could also be an indi-cator of the AAO strength. On the other hand, thecomposite difference parameter (D) could be associatedwith the relative difference of air influence over the twosites (Vostok and Dome C), or an asymmetric advection/subsidence regime or in other terms, an atmosphericdipole over east Antarctica.
Figure 8 shows the Vostok and EDC CPP dustparameters on the x and y axis, respectively. The twocomposite indicators (S and D) are represented by thefirst and second diagonals. The S axis (symmetric mode)is associated with the AAO domain. The two sites areunder the same influence at any given time (e.g. CPP islow (high), FPP is high (low) and dust mode indicatessmaller (coarser) particles size). The power spectrum ofS contains energy from 150 years to 500 years, which isthought to reflect the internal oscillations of the south-ern ocean climatic system. Along the D axis (asymmetricmode), the two sites are under opposite influence: whenVostok is subject to relatively high subsidence (i.e. CPPlow, FPP high, small particle size), the EDC site issubject to air advection from the lower troposphere (i.e.CCP high, FPP low, and coarse particle size) and viceversa. Over the studied period, the power spectra of Ddisplay a significant band of energy centred around 150and 220 years, suggesting a prominent oscillation modecentred on a 200 year band.
3.4 Is there a link between east Antarctic dipoleoscillations and 200 year solar activity?
Our study points out that a 200-year oscillation modecharacterises the atmospheric dipole over the east Ant-arctica during the Holocene. This periodicity is of par-ticular interest since it is typically associated with thevariability of solar activity (205-year so-called DeVriessolar cycle), constituting the most prominent periodicityin the D14C record during the Holocene (Damon andSonett 1991), and also imprinted in the 10Be record ofpolar ice (e.g. Beer et al. 1991). However, a directcomparison with 10Be is not yet possible from the samesample we studied for dust since EDC and Vostokmeasurements are still in progress (G. M. Raisbeck,personal communication). In spite of this, we can al-ready discuss some facts in the context of our scenariosuggesting a possible link with solar activity.
From present-day atmospheric data, a significantstatistical relationship between the 11-year sunspot cycleand geopotential heights was reported (Labitzke andVan Loon 1997) with the highest correlation for thesubtropics. Also, a model study of modern climate(Shindell et al. 2001) suggests that an external forcingfactor such as solar activity can induce significantchanges in the intensity of the Westerlies. In fact, anamplification of the faint solar forcing would be requiredand amongst scenarios, Broecker et al. (1990, 1999)suggest a possible coupling with the ocean system. Sec-
Delmonte et al.: Ice core evidence for secular variability and 200-year dipolar oscillations in atmospheric circulation 651
ular-scale changes in sea surface conditions (sea ice ex-tent and wind stress) were also shown to characterise theHolocene climate of the Antarctic Peninsula (e.g. Do-mack et al. 2001; Domack and Mayewski 1999) and maybe linked to the oscillation of the circum-Antarctictrough probably modulated by solar activity. Recently, amarine core record of sea ice presence and summer seasurface temperature from the eastern South Atlanticocean (Nielsen et al. 2004) also revealed a centennial andmillennial-scale variability mode (1,220, 1,070, 400 and150 years). The authors linked the centennial-scalechanges observed in the records to atmospheric changesprobably related to solar activity.
From the Atlantic ocean simulation cited above(Mikolajewicz and Maier-Reimer 1990), the �50–500 year band oscillation of the system introduces thepossibility of resonance and amplification of externalsecular frequencies. The expected response will varyaccording to the area and time delay. It could be spec-ulated therefore that the Southern Ocean pseudo-oscil-lator can integrate, amplify and embed into its internalvariability mode a possible external (solar-induced)forcing. The 200-year band of variability, which is sostrongly imprinted in our atmospheric records mighttherefore be the final expression of an ocean–atmosphereamplification of solar forcing at these timescales, influ-encing the sea surface temperature, sea ice extent and
climatological position of highs and lows and likely alsoexpressed in the atmospheric dipole of East Antarctica.
However, the presence of the southern ocean and seaice cover likely introduces a certain amount of thermalinertia in the system. The expected climatic responseover Antarctica or on the East Antarctic dipole may notbe direct and is more likely slurred and delayed withrespect to solar forcing. At this stage, while speculatingon possible links, we can only say that our data fromeast Antarctic records shows variability at solar bandperiodicities. Indeed, in addition to model studies ofatmosphere–ocean–sea ice interactions along with thestudy of the regional impacts of solar forcing, 10Beconcentration measurements from Vostok or EDC icecore samples will be very helpful to document thisrelationship and refine such speculations.
4 Conclusions
The dust in East Antarctic ice cores represents a usefultool to trace the variability of atmospheric circulationand exchanges with Antarctica. The size distributionparameters are taken as indicators of atmospherictransport pathway. We assume that fine dust is associ-ated with upper air advection and sinking and/or longertrajectories, while coarser dust indicates advection from
Fig. 8 Sketch of the variability mode of atmopheric circulationover antarctica. Left zoom on the 60�E–180�E sector of the EastAntarctic plateau with location of drilling sites. Right Vostok CPPand EDC CPP dust parameters are represented by the x and y axisrespectively. S (sum) and D (difference) composite dust parametersare represented by the first and second diagonals. The centre ofsubsidence over East Antarctica is represented by an arbitraryrounded area that we associate to the fallout area of small-sizeddust. We also assume that the Dome B and Komsomoskaya areasare associated with the Vostok and EDC regions, respectively, asthey appeared during the last deglaciation period (Delmonte et al.
2004b). Along the S axis, a symmetric mode of variation isassociated with the AAO variability (see text). Subsidence influencevaries from high (quadrant III, area with bold boundary) to low(quadrant I, area with dashed boundary). Along the D axis, anasymmetric mode of variation is proposed and the two sites areunder opposite influence. The area of subsidence varies from aneccentric location (quadrant IV) to a more poleward position(quadrant II). This may correspond to an atmospheric dipole overeast Antarctica having a power spectra (Fig. 7b) with a significantoscillation mode in the 200 year band
652 Delmonte et al.: Ice core evidence for secular variability and 200-year dipolar oscillations in atmospheric circulation
air masses from low levels in the troposphere. Our studyshows that atmospheric circulation over East Antarcticacontains secular and sub-millennial variations cha-racterising the Holocene epoch similar to those observedfor the last climatic transition.
The two Holocene dust-size records analysed at hightemporal resolution show a clear secular-scale variabilitymode for atmospheric circulation over Antarctica at thetwo sites. A composite dust-size parameter (sum) isassociated with the strength of the Antarctic oscillation.Its power spectrum is imprinted by secular scale oscil-lations that we interpret as internal to the southernocean climate system, likely playing a buffering role andimposing its internal secular and sub-millennial oscilla-tions to the AAO and to the meridional atmospherictransport of dust toward Antarctica.
The tight stratigraphic link between the two icecores also makes it possible to show the existence of anatmospheric dipole over east Antarctica during theHolocene, i.e. a mesoscale asymmetric (seesaw) vari-ability mode of atmospheric circulation between Vo-stok and EDC. Data show pervasive oscillations of thedipole around the 200 year band over �5,500 years andsuggest a possible link with solar activity, likelythrough amplification by the Southern Ocean climaticsystem.
On going 10Be measurements on EDC or Vostok icecores are expected to bring clues to the solar–climaterelationship at secular periodicities by comparison withthe dust-size profiles we presented here. In addition,model studies of atmosphere–ocean–sea ice interactionscould be used to test the secular time scale behaviour ofthe southern climate system as well as the regional sen-sitivity of Antarctic climate to solar forcing.
Acknowledgements The work of B. Delmonte was supported by a2003 Prince of Asturias Fellowship awarded by the ScientificCommittee for Antarctic Research (SCAR) and benefited from aBALZAN donation to C. Lorius. We thank the three anonymousreferees for their useful suggestions. The Vostok ice (BH7 and 8)core was obtained through the Russia-US-France tripartite col-laboration and benefited from the support of Russian AntarcticExpeditions, the US National Foundation and the French PaulEmile Victor Institute (IPEV). This work is a contribution to the‘‘European Project for Ice Coring in Antarctica’’ (EPICA), a jointESF (European Science Foundation)/EC scientific programme,funded by the European Commission under the Environmental andClimate Programme (1994–1998) contract ENV4-CT95–0074 andby national contributions from Belgium, Denmark, France, Ger-many, Italy, the Netherlands, Norway, Sweden, Switzerland andthe UK.
References
Bard E, Raisbeck GM, Yiou F, Jouzel J (1997) Solar modulation ofcosmogenic nuclide production over the last millennium: com-parison between 14C and 10Be records. Earth Planet Sci Lett150:453–462
Basile I (1997) Origine des aerosols volcaniques et continentaux dela carotte de glace de Vostok (Antarctique). PhD Thesis,LGGE-CNRS Universite Joseph Fourier-Grenoble I, Greno-ble, p 254
Basile I, Grousset FE, Revel M, Petit JR, Biscaye PE, Barkov NI(1997) Patagonian origin of glacial dust deposited in EastAntarctica (Vostok and Dome C) during glacial stages 2, 4 and6. Earth Planet Sci Lett 146:573–589
Basile I, Petit JR, Touron S, Grousset F, Barkov NI (2001) Vol-canic layers in Antarctic (Vostok) ice cores: source identifica-tion and atmospheric implications. J Geophys Res106(D23):31915–31931
Beer J, Raisbeck GM, Yiou F (1991) Time variations of 10Be andsolar activity. In: Sonnett CP, Giampapa MS, Matthews MS(eds) The sun in time. University of Arizona Press, Tucson, pp343–359
Bianchi GG, McCave IN (1999) Holocene periodicity in NorthAtlantic climate and deep-ocean flow south of Iceland. Nature397:515–517
Bond G, Showers W, Cheseby M, Lotti R, Almasi P, DeMenocalP, Priore P, Cullen H, Hajadas I, Bonani G (1997) A pervasivemillennial scale cycle in the North Atlantic Holocene and gla-cial climates. Science 278:1257–1266
Bond G, Kromer B, Beer J, Muscheler R, Evans MN, Showers W,Hoffmann S, Lotti-Bond R, Hajadas I, Bonani G (2001) Per-sistent solar influence on North Atlantic climate during theHolocene. Science 294:2130–2136
Broecker WS, Bond G, Klaus M, Bonani G, Wolffli W (1990) A saltoscillator in the glacial Atlantic? Paleoceanography 5:469–477
Broecker WS, Sutherland S, Peng TH (1999) A possible 20th-cen-tury slowdown of Southern Ocean deep water formation. Sci-ence 286:1132–1135
Carleton AM (1989) Antarctic sea-ice relationships with indices ofthe atmospheric circulation of the Southern Hemisphere. ClimDyn 3:207–220
Dahe Q, Petit JR, Jouzel J, Stievenard M (1994) Distribution ofstable isotopes in surface snow along the route of the 1990International Transantarctic expedition. J Glaciol 40(134):107–118
Damon PE, Sonett CP (1991) Solar and terrestrial components ofthe atmospheric C-14 variation spectrum. In: Sonett CP,Giampapa MS, Mattews MS (eds) Solar and Terrestrial Com-ponents of the Atmospheric C-14 Variation Spectrum. TheUniversity of Arizona, Tucson, pp 360–388
Delmonte B (2003) Quaternary variations and origin of continentaldust in East Antarctica. PhD Thesis, University of Siena, Siena,p 274
Delmonte B, Petit JR, Maggi V (2002a) LGM-Holocene changesand Holocene millennial-scale oscillations of dust particles inthe EPICA Dome C ice core, East Antarctica. Ann Glaciol35:306–312
Delmonte B, Petit JR, Maggi V (2002b) Glacial to Holoceneimplications of the new 27,000-year dust record from theEPICA-Dome C (East Antarctica) ice core. Clim Dyn 18:647–660
Delmonte B, Basile-Doelsch I, Petit JR, Maggi V, Revel-RollandM, Michard A, Jagoutz E, Grousset F (2004a) Comparing theEPICA and Vostok dust records during the last 220,000 years:stratigraphical correlation and origin in glacial periods. EarthSci Rev 66:63–87
Delmonte B, Petit JR, Andersen KK, Basile-Doelsch I, Maggi V,Lipenkov VY (2004b) Dust size evidence for opposite regionalatmospheric circulation changes over east Antarctica during thelast climatic transition. Clim Dyn 23:427–438
DeMenocal P, Oritz J, Guilderson T, Sarnthein M (2002) Coherenthigh- and low- latitude climate variability during the Holocenewarm period. Science 288:2198–2202
Dettinger MD, Ghil M, Strong CM, Weibel W, Yiou P (1995)Software expedites singular-spectrum analyses of noisy timeseries. EOS Trans Am Geophys Union 76:12
Domack EW, Mayewski PA (1999) Bi-polar ocean linkages: evi-dence from late-Holocene Antarctic marine and Greenland ice-core records. Holocene 9:247–251
Domack EW, Mashiotta TA, Burkley LA, Ishman SE (1993)300 year cyclicity in organic matter preservation in Antarcticfjord sediments. Ant Res Ser 60:265–272
Delmonte et al.: Ice core evidence for secular variability and 200-year dipolar oscillations in atmospheric circulation 653
Domack E, Leventer A, Dunbar R, Taylor F, Brachfeld S,Sjunneskog C, Party OLS (2001) Chronology of thePalmer Deep site, Antarctic Peninsula: a Holocene palaeoen-vironmental reference for the circum-Antarctic. Holocene 11:1–9
EPICA community members (2004) Eight glacial cycles from anAntarctic ice core. Nature 429:623–628
Grousset FE, Biscaye PE, Revel M, Petit JR, Pye K, Joussaume S,Jouzel J (1992) Antarctic (Dome C) ice-core dust at 18 ky BP:isotopic constraints and origins. Earth Planet Sci Lett 111:175–182
Hodell DA, Brenner M, Curtis JH, Guilderson T (2001) Solarforcing of drought frequency in the Maya lowlands. Science292:1367–1370
IPCC, Intergovernmental Panel on Climatic Changes (2001)Houghton JT, Ding Y, Griggs DJ, Noguer M, Van der LindenPJ, Dai X, Maskell K, Johnson CA (eds) Cambridge UnivPress, New York
Jouzel J, Masson V, Cattani O, Falourd S, Stievenard M, Stenni B,Longinelli A, Johnsen SJ, Steffensen JP, Petit JR, Schwander J,Souchez R. (2001) A new 27 kyr high resolution East Antarcticclimate record. J Geophys Res 28:3199–3202
King JC, Turner J (1997) Antarctic meteorology and climatology.In: Dessler AJ, Houghton JT, Rycroft MJ (eds) CambridgeUniv Press, Cambridge, p 409
Labitzke K, Van Loon H (1997) The signal of the 11-year sunspotcycle in the upper troposphere-lower stratosphere. Space SciRev 80: 393–410
Lamy F, Hebbeln D, Rohl U, Wefer G (2001) Holocene rainfallvariability in southern Chile: a marine record of SouthernWesterlies. Earth Planet Sci Lett 185:369–382
Lamy F, Ruhlemann C, Hebbeln D, Wefer G (2002) High- andlow- latitude climate control on the position of the southernPeru-Chile current during the Holocene. Paleoceanography17(2)
Legrand M, Mayewski P (1997) Glaciochemistry of polar ice cores:a review. Rev Geophys 35:217–243
Leventer A., Domack EW, Ishman SE, Brachfeld S, McClennenCE, Manley P (1996) Productivity cycles of 200–300 years inthe Antarctic Peninsula region: understanding linkages amongthe sun, atmosphere, oceans, sea ice, and biota. GSA Bull108:1626–1644
Marchitto TM, Curry WB, Oppo DW (1998) Millennial-scalechanges in the North Atlantic circulation since the last glacia-tion. Nature 393:557–561
Masson V, Vimeux F, Jouzel J, Morgan VI, Delmotte M, Ciais P,Hammer CU, Johnsen SJ, Lipenkov V, Moseley-Thompson E,Petit JR, Steig EJ, Stievenard L, Vaikmae R (2000) Holoceneclimate variability in Antarctica based on 11 ice core isotopicrecords. Quat Res 54:348–358
Mayewski P, Meeker LD, Twickler MS, Whitlow S, Yang Q,Lyons WB, Prentice M (1997) Major features and forcing ofhigh-latitude northern hemisphere atmospheric circulation
using a 110,000 year-long glaciochemical series. J Geophys Res102(C12):26345–26366
Mikolajewicz U, Maier-Reimer E (1990) Internal secular variabilityin an ocean general circulation model. Clim Dyn 4:145–156
Moy C, Seltzer GO, Rodbell DT, Anderson DM (2002) Variabilityof El Nino/Southern Oscillation activity at millennial timescalesduring the Holocene epoch. Nature 420:162–165
Neff U, Burns SJ, Mangini A, Mudelsee M, Fleitmann D, Matter A(2001) Strong coherence between solar variability and themonsoon in Oman between 9 and 6 kyr ago. Nature 411:290–293
Nielsen SHH, Koc N, Crosta X (2004) Holocene climate in theAtlantic sector of the Southern Ocean: controlled by insolationor oceanic circulation? Geology 4:317–320
Paterson LC, Overpeck JT, Kipp NG, Imbrie J (1991) A high-resolution late Quaternary upwelling record from the anoxicCariaco Basin, Venezuela. Paleoceanography 6:99–119
Pittock AB (1980) Patterns of climatic variation in Argentina andChile, I-Precipitation. Mon Weather Rev 108:1347–1361
Ruth U, Wagenbach D, Steffensen JP, Biggler M (2003) Continu-ous record of microparticle concentration and size distributionin the central Greenland NGRIP ice core during the last glacialperiod. J Geophys Res 108:4098–4110
Schwander J, Jouzel J, Hammer CU, Petit JR, Udisti R, Wolff E(2001) A tentative chronology for the EPICA Dome Concordiaice core. Geophys Res Lett 28:4243–4246
Shindell DT, Schmidt GA, Miller RL, Rind D (2001) NorthernHemisphere winter climate response to greenhouse gas,ozone, solar, and volcanic forcing. J Geophys Res 106:7193–7210
Udisti R, Becagli S, Castellano E, Delmonte B, Jouzel J, Petit JR,Schwander J, Stenni B, Wolff E (2004) Stratigraphic correla-tions between the Epica-Dome C and Vostok ice cores showingthe relative variations of snow accumulation over the past45 kyr. J Geophys Res 109. D08101, DOI 10.1029/2003JD004180
Venegas S, Drinkwater MR (2001) Coupled oscillations in Ant-arctic sea-ice and atmosphere in the South Pacific sector.Geophys Res Lett 28(17):3301–3304
Villalba R, Cook ER, D’Arrigo RD, Jacoby GC, Jones PD, Sal-inger JM, Palmer J (1997) Sea-level pressure variability aroundAntarctica since A.D. 1750 inferred from sub-Antarctic tree-ring records. Clim Dyn 13:375–390
Vimeux F, Masson V, Jouzel J, Petit JR, Steig EJ, Stievenard M,Vaikmae R, White JWC (2001) Holocene hydrological cyclechanges in the Southern Hemisphere documented in EastAntarctic deuterium excess records. Clim Dyn 17:503–513
White WB, Peterson RG (1996) An Antarctic circumpolar wave insurface pressure, wind, temperature and sea-ice extent. Nature380:699–702
Wolff EW, Basile I, Petit JR, Schwander J (1999) Comparison ofHolocene electrical records from Dome C and Vostok. AnnGlaciol 29: 89–93
654 Delmonte et al.: Ice core evidence for secular variability and 200-year dipolar oscillations in atmospheric circulation
Related Documents
![[8] Dipolar Couplings in Macromolecular Structure ... · [8] DIPOLAR COUPLINGS AND MACROMOLECULAR STRUCTURE 127 [8] Dipolar Couplings in Macromolecular Structure Determination By](https://static.cupdf.com/doc/110x72/605c24b70c5494344557be4f/8-dipolar-couplings-in-macromolecular-structure-8-dipolar-couplings-and.jpg)