Ice core evidence for a 20th century decline of sea ice in the Bellingshausen Sea, Antarctica Nerilie J. Abram, 1 Elizabeth R. Thomas, 1 Joseph R. McConnell, 2 Robert Mulvaney, 1 Thomas J. Bracegirdle, 1 Louise C. Sime, 1 and Alberto J. Aristarain 3 Received 17 June 2010; revised 11 August 2010; accepted 24 August 2010; published 1 December 2010. [1] This study uses ice core methanesulphonic acid (MSA) records from the Antarctic Peninsula, where temperatures have been warming faster than anywhere else in the Southern Hemisphere, to reconstruct the 20th century history of sea ice change in the adjacent Bellingshausen Sea. Using satellite‐derived sea ice and meteorological data, we show that ice core MSA records from this region are a reliable proxy for regional sea ice change, with years of increased winter sea ice extent recorded by increased ice core MSA concentrations. Our reconstruction suggests that the satellite‐observed sea ice decline in the Bellingshausen Sea during recent decades is part of a long‐term regional trend that has occurred throughout the 20th century. The long‐term perspective on sea ice in the Bellingshausen Sea is consistent with evidence of 20th century warming on the Antarctic Peninsula and may reflect a progressive deepening of the Amundsen Sea Low due to increasing greenhouse gas concentrations and, more recently, stratospheric ozone depletion. As a first‐order estimate, our MSA‐based reconstruction suggests that sea ice in the Bellingshausen Sea has retreated southward by ∼0.7° during the 20th century. Comparison with other 20th century sea ice observations, reconstructions, and model simulations provides a coherent picture of Antarctic sea ice decline during the 20th century, although with regional‐scale differences evident in the timing and magnitude of this sea ice decline. This longer‐term perspective contrasts with the small overall increase in Antarctic sea ice that is observed in post‐1979 satellite data. Citation: Abram, N. J., E. R. Thomas, J. R. McConnell, R. Mulvaney, T. J. Bracegirdle, L. C. Sime, and A. J. Aristarain (2010), Ice core evidence for a 20th century decline of sea ice in the Bellingshausen Sea, Antarctica, J. Geophys. Res., 115, D23101, doi:10.1029/2010JD014644. 1. Introduction [2] Sea ice around Antarctica plays a crucial role in modulating ecosystems and climate; however, it remains a poorly constrained component in model projections of past and ongoing climate change. This is largely because routine satellite monitoring of sea ice only began in the 1970s and its strong interannual variability has meant that long‐term trends over this short interval have been difficult to discern [Zwally et al., 2002; Cavalieri and Parkinson, 2008]. Over the 1978–2007 interval, satellite observations show that sea ice extent around Antarctica has increased by a small amount (increasing at a rate of 1.0% decade −1 ; p < 0.05). Although this increasing trend is statistically significant, a long control run of a coupled climate model suggests that this recent increase in Antarctic sea ice extent may still be within the bounds of natural climate variability [Turner et al., 2009]. When examined at a regional scale, the strongest trends in the satellite record of Antarctic sea ice are an increase in annual sea ice extent in the Ross Sea (4.6% decade −1 ; p < 0.05) and a decrease in annual sea ice extent in the Amundsen‐ Bellingshausen Seas (−6.6% decade −1 ; p < 0.01). This dipole pattern of increasing and decreasing sea ice extent in the Ross and Amundsen‐Bellingshausen seas is thought to be driven by strengthening of the cyclonic atmospheric flow over the Amundsen Sea (i.e., the Amundsen Sea Low). Model studies suggest that much of the increase in cyclonic flow since ∼1980 may be attributed to circulation changes caused by stratospheric ozone depletion [ Turner et al. , 2009]. [3] Prior to satellite monitoring, direct information about Antarctic sea ice is extremely sparse, and this has prompted attempts to produce reconstructions of 20th century sea ice change using historical information from whaling ships and the chemistry of ice cores. Records of the position of whale catches, which are assumed to have occurred near the ice edge, have been used to estimate that Antarctic‐average summer sea ice extent retreated southward by 2.8° during the mid‐20th century [de la Mare, 1997]. However, the use of this whaling data as a sea ice indicator has been challenged 1 British Antarctic Survey, Cambridge, UK. 2 Division of Hydrologic Sciences, Desert Research Institute, Reno, Nevada, USA. 3 Instituto Antárctico Argentino, CRICYT, Mendoza, Argentina. Copyright 2010 by the American Geophysical Union. 0148‐0227/10/2010JD014644 JOURNAL OF GEOPHYSICAL RESEARCH, VOL. 115, D23101, doi:10.1029/2010JD014644, 2010 D23101 1 of 9

Welcome message from author
This document is posted to help you gain knowledge. Please leave a comment to let me know what you think about it! Share it to your friends and learn new things together.
Transcript
Ice core evidence for a 20th century decline of sea icein the Bellingshausen Sea, Antarctica
Nerilie J. Abram,1 Elizabeth R. Thomas,1 Joseph R. McConnell,2 Robert Mulvaney,1
Thomas J. Bracegirdle,1 Louise C. Sime,1 and Alberto J. Aristarain3
Received 17 June 2010; revised 11 August 2010; accepted 24 August 2010; published 1 December 2010.
[1] This study uses ice core methanesulphonic acid (MSA) records from the AntarcticPeninsula, where temperatures have been warming faster than anywhere else in theSouthern Hemisphere, to reconstruct the 20th century history of sea ice change in theadjacent Bellingshausen Sea. Using satellite‐derived sea ice and meteorological data, weshow that ice core MSA records from this region are a reliable proxy for regional seaice change, with years of increased winter sea ice extent recorded by increased ice coreMSA concentrations. Our reconstruction suggests that the satellite‐observed sea icedecline in the Bellingshausen Sea during recent decades is part of a long‐term regionaltrend that has occurred throughout the 20th century. The long‐term perspective on sea icein the Bellingshausen Sea is consistent with evidence of 20th century warming on theAntarctic Peninsula and may reflect a progressive deepening of the Amundsen Sea Lowdue to increasing greenhouse gas concentrations and, more recently, stratospheric ozonedepletion. As a first‐order estimate, our MSA‐based reconstruction suggests that sea ice inthe Bellingshausen Sea has retreated southward by ∼0.7° during the 20th century.Comparison with other 20th century sea ice observations, reconstructions, and modelsimulations provides a coherent picture of Antarctic sea ice decline during the 20thcentury, although with regional‐scale differences evident in the timing and magnitude ofthis sea ice decline. This longer‐term perspective contrasts with the small overall increasein Antarctic sea ice that is observed in post‐1979 satellite data.
Citation: Abram, N. J., E. R. Thomas, J. R. McConnell, R. Mulvaney, T. J. Bracegirdle, L. C. Sime, and A. J. Aristarain (2010),Ice core evidence for a 20th century decline of sea ice in the Bellingshausen Sea, Antarctica, J. Geophys. Res., 115, D23101,doi:10.1029/2010JD014644.
1. Introduction
[2] Sea ice around Antarctica plays a crucial role inmodulating ecosystems and climate; however, it remains apoorly constrained component in model projections of pastand ongoing climate change. This is largely because routinesatellite monitoring of sea ice only began in the 1970s andits strong interannual variability has meant that long‐termtrends over this short interval have been difficult to discern[Zwally et al., 2002; Cavalieri and Parkinson, 2008]. Overthe 1978–2007 interval, satellite observations show that seaice extent around Antarctica has increased by a smallamount (increasing at a rate of 1.0% decade−1; p < 0.05).Although this increasing trend is statistically significant, along control run of a coupled climate model suggests thatthis recent increase in Antarctic sea ice extent may still be
within the bounds of natural climate variability [Turner et al.,2009].When examined at a regional scale, the strongest trendsin the satellite record of Antarctic sea ice are an increase inannual sea ice extent in the Ross Sea (4.6% decade−1; p < 0.05)and a decrease in annual sea ice extent in the Amundsen‐Bellingshausen Seas (−6.6% decade−1; p < 0.01). This dipolepattern of increasing and decreasing sea ice extent in theRoss and Amundsen‐Bellingshausen seas is thought to bedriven by strengthening of the cyclonic atmospheric flowover the Amundsen Sea (i.e., the Amundsen Sea Low).Model studies suggest that much of the increase in cyclonicflow since ∼1980 may be attributed to circulation changescaused by stratospheric ozone depletion [Turner et al.,2009].[3] Prior to satellite monitoring, direct information about
Antarctic sea ice is extremely sparse, and this has promptedattempts to produce reconstructions of 20th century sea icechange using historical information from whaling ships andthe chemistry of ice cores. Records of the position of whalecatches, which are assumed to have occurred near the iceedge, have been used to estimate that Antarctic‐averagesummer sea ice extent retreated southward by 2.8° duringthe mid‐20th century [de la Mare, 1997]. However, the useof this whaling data as a sea ice indicator has been challenged
1British Antarctic Survey, Cambridge, UK.2Division of Hydrologic Sciences, Desert Research Institute, Reno,
Nevada, USA.3Instituto Antárctico Argentino, CRICYT, Mendoza, Argentina.
Copyright 2010 by the American Geophysical Union.0148‐0227/10/2010JD014644
JOURNAL OF GEOPHYSICAL RESEARCH, VOL. 115, D23101, doi:10.1029/2010JD014644, 2010
D23101 1 of 9
due to potential biases caused by changes in the species ofwhales caught, spatial and temporal heterogeneities in thecoverage of the whaling data, and offsets between satellite andchart records of sea ice extent [Vaughan, 2000; Ackley et al.,2003]. A recent re‐examination of the whaling catch recordsalongside early ship charts of Antarctic sea ice extent hassuggested a revised regionally weighted sea ice retreat of ∼1.7°from the early (1930 to mid‐1950s) to the late (1971–1987)20th century [de la Mare, 2009]. Regional analysis also sug-gests that themagnitude of sea ice retreat has differedmarkedlyaroundAntarctica [Cotte and Guinet, 2007; de laMare, 2009],although the regional changes produced using direct chartobservations do still differ in detail from those derived fromwhaling records.[4] The chemistry of Antarctic ice cores provides an
alternate way to reconstruct past sea ice changes on a rangeof time scales [Curran et al., 2003; Wolff et al., 2003; Dixonet al., 2005; Rothlisberger et al., 2010]. For high accumu-lation sites around coastal Antarctica, it has been proposedthat changes in the methanesulphonic acid (MSA; CH3SO3H)concentration of ice cores may provide a proxy for exam-ining past sea ice changes, potentially going back thousandsof years. The only source of MSA in Antarctic ice corescomes from the atmospheric oxidation of dimethylsulphide,which is derived from marine phytoplankton that live in thesea ice zone [Welch et al., 1993; Curran and Jones, 2000].The seasonal melting of sea ice promotes blooms of thesesea ice algae, leading to increased emissions of dimethyl-sulphide to the atmosphere. For this reason, it has beenproposed that years of enhanced winter sea ice extent, andsubsequently enhanced sea ice algae blooms during seasonalsea ice melting, can lead to increased MSA being trans-ported to near coastal ice cores in the following summer.This proxy was utilized in the Law Dome ice core to infer a1.5° retreat in winter sea ice extent since the 1950s [Curranet al., 2003].[5] Similar positive relationships between ice core MSA
records and Antarctic sea ice variability have now beenidentified at a number of other near‐coastal sites in the RossSea/Indian Ocean sector of east Antarctica [Welch et al.,1993; Foster et al., 2006; Becagli et al., 2009]. However,in some locations, increased ice core MSA is not a reliableproxy for enhanced winter sea ice extent [Sun et al., 2002;Abram et al., 2007; Rhodes et al., 2009]. In the Weddell Seaand Dronning Maud Land region, it appears that transportstrength and direction have an important influence on theconcentration of ice core MSA [Fundel et al., 2006; Abramet al., 2007], while the presence of a summer open waterpolynya in the Ross Sea is thought to dominate the inter-annual variability of MSA in the nearby Mount ErebusSaddle ice core [Rhodes et al., 2009]. Atmospheric chem-
istry measurements also indicate that ice core MSA recordsfrom inland Antarctic Plateau sites may not be representa-tive of sea ice‐associated emissions of dimethylsulphide dueto long transport distances and oxidation processes[Preunkert et al., 2008] and the influence of postdeposi-tional losses [Weller et al., 2004]. The potential for variousfactors to influence the MSA signal preserved in ice coreshighlights the need for detailed site‐specific assessments ofthe suitability of MSA as a sea ice proxy.[6] In this study we use a set of ice core records from
three sites along the western Antarctic Peninsula to inves-tigate the reliability of MSA records from this region as seaice proxies. We are then able to use these ice core records toexamine the history of 20th century changes in winter seaice extent in the Bellingshausen Sea, and how these compareto other 20th century climate records from the AntarcticPeninsula region and to sea ice reconstructions from otherregions around the Antarctic continent.
2. Methods
[7] We use ice core MSA records from three sitesextending along the western and northern AntarcticPeninsula (Table 1). The Beethoven Peninsula and DyerPlateau cores were collected by the British Antarctic Survey[Mulvaney et al., 2002; Thomas et al., 2008]. The core fromJames Ross Island was drilled by an Argentinian/Frenchteam [Aristarain et al., 2004; McConnell et al., 2007].Chronologies for each of these high‐resolution cores havebeen established by counting the clear annual cycles in waterisotopes and trace chemistry and are verified by knownvolcanic eruption events.[8] Measurements of MSA were made in a class‐100 clean
laboratory at the British Antarctic Survey using Dionex ionchromatographs [Littot et al., 2002; Abram et al., 2008].The experimental setup used a DX2000 anion instrument,using an AS17 4 mm column and KOH eluent that was runusing a gradient method ranging from 0.3 to 60 mmol L−1
concentration that optimized MSA separation. The MSAmeasurements were made at subannual resolution (approx-imately 28 samples/year for Beethoven, 12 samples/year forDyer, and 2 samples/year for James Ross Island), and theresults were interpolated and averaged to produce annualresolution records of MSA centered about the MSA maxi-mum that occurs in the Austral summer (i.e., ∼July–Juneannual averages).[9] It has been shown that MSA can be lost from archived
ice cores during storage at −20°C [Smith et al., 2004; Abramet al., 2008] due to a relatively high diffusion coefficient forMSA in ice [Roberts et al., 2009] that can result in adecrease in the mean amount of MSA retained in the
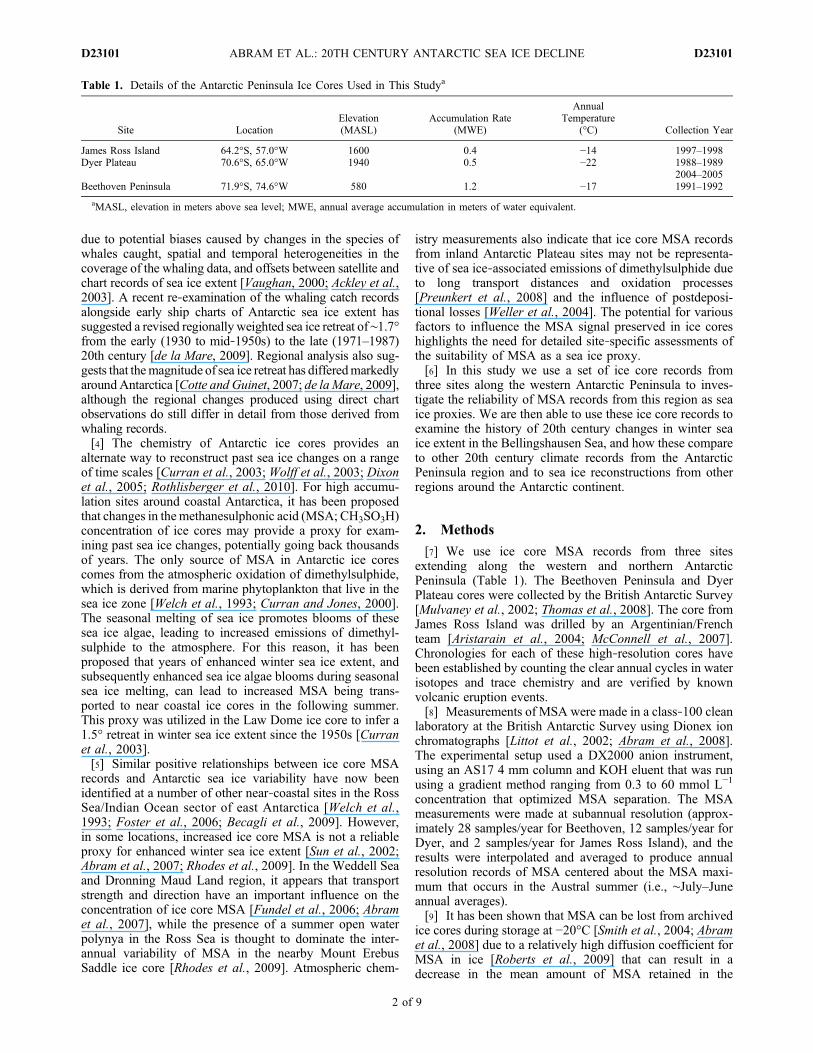
Table 1. Details of the Antarctic Peninsula Ice Cores Used in This Studya
Site LocationElevation(MASL)
Accumulation Rate(MWE)
AnnualTemperature
(°C) Collection Year
James Ross Island 64.2°S, 57.0°W 1600 0.4 −14 1997–1998Dyer Plateau 70.6°S, 65.0°W 1940 0.5 −22 1988–1989
2004–2005Beethoven Peninsula 71.9°S, 74.6°W 580 1.2 −17 1991–1992
aMASL, elevation in meters above sea level; MWE, annual average accumulation in meters of water equivalent.
ABRAM ET AL.: 20TH CENTURY ANTARCTIC SEA ICE DECLINE D23101D23101
2 of 9
archived core. However, this mean loss does not destroy therelative variability of the original MSA record if all sampleshave a similar storage time and geometry [Abram et al.,2008; Roberts et al., 2009], and if detailed storage and icegeometry information are available then the effects shouldbe able to be corrected using a 2‐D diffusion model [Robertset al., 2009]. The MSA measurements from the BeethovenPeninsula and early Dyer Plateau cores were made onarchived ice samples refrozen in discrete bottles, a storagemethod that has been shown to prevent MSA loss [Abramet al., 2008]. The MSA measurements on the more recentDyer Plateau core were completed within 18 months of corecollection, so postcollection MSA loss should also be neg-ligible in this core. It is likely that the James Ross Islandcore will have experienced some loss in the absolute amountof MSA, as it was analyzed for MSA after 9 years of frozenstorage. As this study uses only the normalized MSA recordsto look at relative variability of MSA, rather than absoluteMSA concentrations, any postcollection loss of MSA shouldnot affect the results of this study [Abram et al., 2008;Roberts et al., 2009]. This is confirmed by earlier discretemeasurements of MSA on a short section of the James RossIsland core (13.8–29.5 m analyzed 3 years after collection),which show a similar temporal variability to the more recentMSA measurements used in this study.[10] The statistical significance of the reported linear cor-
relation results in this study are computed based on a 2‐sidedt test. To take into account autocorrelation effects, these testsuse effective sample sizes that were estimated using thecorrection of: Neff = N (1 − rarb)/(1 + rarb), where ra and rbare the lag‐1 autocorrelation values for the two series[Bretherton et al., 1999; van Ommen and Morgan, 2010]. Inorder to assess the approximate magnitude of sea ice extentchange from the regional‐scale proxy records, a geometricmean regression technique was used (also known as reducedmajor axis regression) [Smith, 2009]. This method avoidsthe assumption applied in ordinary least squares regressionthat there is no error in the independent variable (in thiscase, satellite sea ice extent records). The geometric meanregression method allows for error in both parameters bycalculating the line of best fit that minimizes the error inboth the x and y dimensions.
3. Results
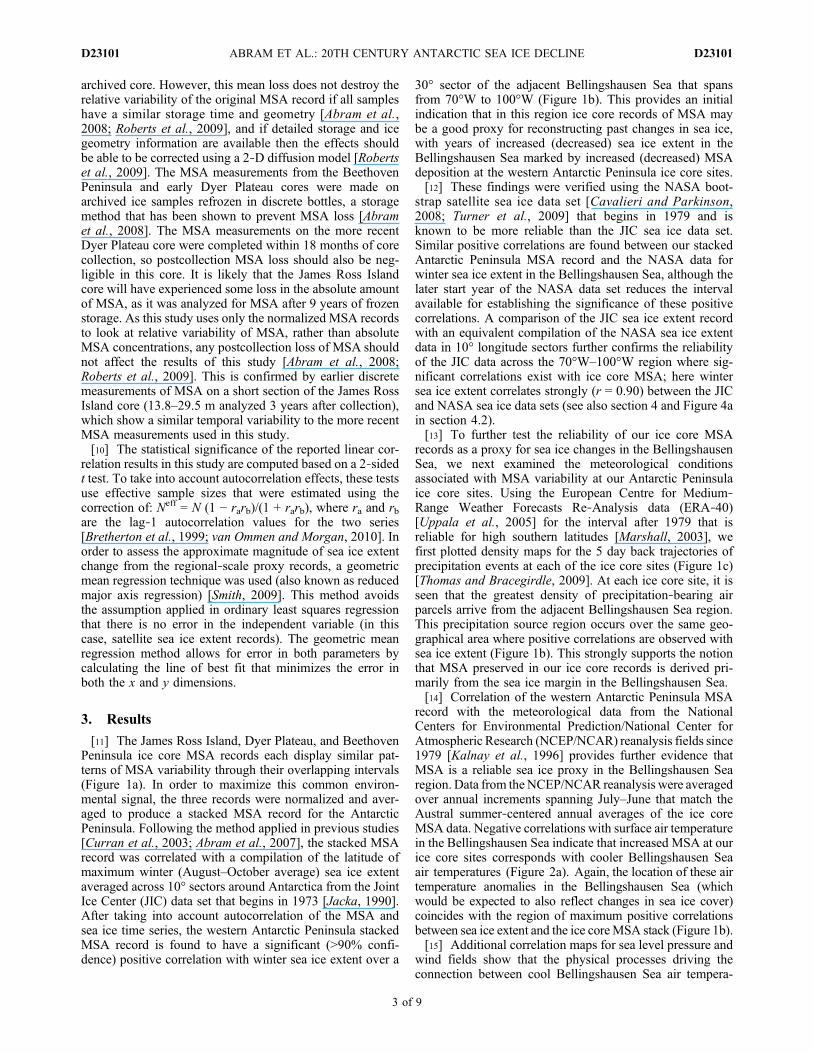
[11] The James Ross Island, Dyer Plateau, and BeethovenPeninsula ice core MSA records each display similar pat-terns of MSA variability through their overlapping intervals(Figure 1a). In order to maximize this common environ-mental signal, the three records were normalized and aver-aged to produce a stacked MSA record for the AntarcticPeninsula. Following the method applied in previous studies[Curran et al., 2003; Abram et al., 2007], the stacked MSArecord was correlated with a compilation of the latitude ofmaximum winter (August–October average) sea ice extentaveraged across 10° sectors around Antarctica from the JointIce Center (JIC) data set that begins in 1973 [Jacka, 1990].After taking into account autocorrelation of the MSA andsea ice time series, the western Antarctic Peninsula stackedMSA record is found to have a significant (>90% confi-dence) positive correlation with winter sea ice extent over a
30° sector of the adjacent Bellingshausen Sea that spansfrom 70°W to 100°W (Figure 1b). This provides an initialindication that in this region ice core records of MSA maybe a good proxy for reconstructing past changes in sea ice,with years of increased (decreased) sea ice extent in theBellingshausen Sea marked by increased (decreased) MSAdeposition at the western Antarctic Peninsula ice core sites.[12] These findings were verified using the NASA boot-
strap satellite sea ice data set [Cavalieri and Parkinson,2008; Turner et al., 2009] that begins in 1979 and isknown to be more reliable than the JIC sea ice data set.Similar positive correlations are found between our stackedAntarctic Peninsula MSA record and the NASA data forwinter sea ice extent in the Bellingshausen Sea, although thelater start year of the NASA data set reduces the intervalavailable for establishing the significance of these positivecorrelations. A comparison of the JIC sea ice extent recordwith an equivalent compilation of the NASA sea ice extentdata in 10° longitude sectors further confirms the reliabilityof the JIC data across the 70°W–100°W region where sig-nificant correlations exist with ice core MSA; here wintersea ice extent correlates strongly (r = 0.90) between the JICand NASA sea ice data sets (see also section 4 and Figure 4ain section 4.2).[13] To further test the reliability of our ice core MSA
records as a proxy for sea ice changes in the BellingshausenSea, we next examined the meteorological conditionsassociated with MSA variability at our Antarctic Peninsulaice core sites. Using the European Centre for Medium‐Range Weather Forecasts Re‐Analysis data (ERA‐40)[Uppala et al., 2005] for the interval after 1979 that isreliable for high southern latitudes [Marshall, 2003], wefirst plotted density maps for the 5 day back trajectories ofprecipitation events at each of the ice core sites (Figure 1c)[Thomas and Bracegirdle, 2009]. At each ice core site, it isseen that the greatest density of precipitation‐bearing airparcels arrive from the adjacent Bellingshausen Sea region.This precipitation source region occurs over the same geo-graphical area where positive correlations are observed withsea ice extent (Figure 1b). This strongly supports the notionthat MSA preserved in our ice core records is derived pri-marily from the sea ice margin in the Bellingshausen Sea.[14] Correlation of the western Antarctic Peninsula MSA
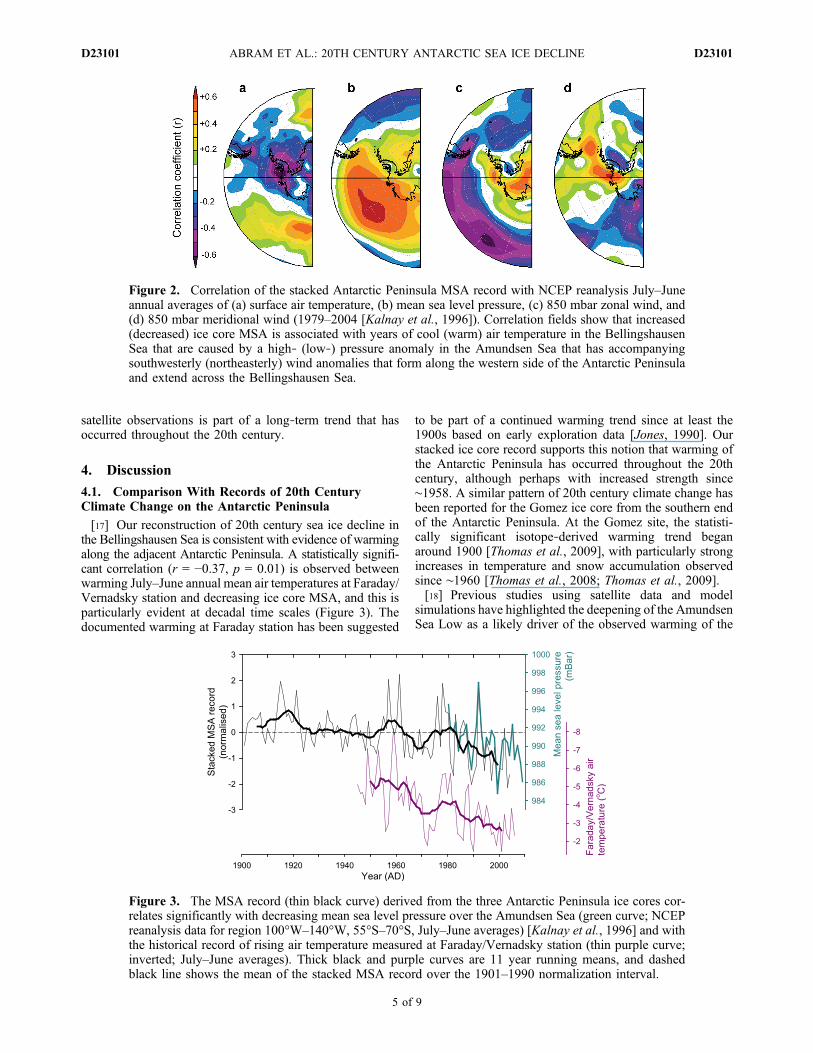
record with the meteorological data from the NationalCenters for Environmental Prediction/National Center forAtmospheric Research (NCEP/NCAR) reanalysis fields since1979 [Kalnay et al., 1996] provides further evidence thatMSA is a reliable sea ice proxy in the Bellingshausen Searegion. Data from the NCEP/NCAR reanalysis were averagedover annual increments spanning July–June that match theAustral summer‐centered annual averages of the ice coreMSA data. Negative correlations with surface air temperaturein the Bellingshausen Sea indicate that increased MSA at ourice core sites corresponds with cooler Bellingshausen Seaair temperatures (Figure 2a). Again, the location of these airtemperature anomalies in the Bellingshausen Sea (whichwould be expected to also reflect changes in sea ice cover)coincides with the region of maximum positive correlationsbetween sea ice extent and the ice coreMSA stack (Figure 1b).[15] Additional correlation maps for sea level pressure and
wind fields show that the physical processes driving theconnection between cool Bellingshausen Sea air tempera-
ABRAM ET AL.: 20TH CENTURY ANTARCTIC SEA ICE DECLINE D23101D23101
3 of 9
tures and increased ice core MSA are linked with a highsurface air pressure anomaly centered in the Amundsen Sea(Figure 2b). The wind fields associated with the highpressure anomaly over the Amundsen Sea involve westerlywind anomalies that travel along the West Antarctic coast(Figure 2c) and continue northward along the AntarcticPeninsula (Figure 2d). This wind configuration brings coldAntarctic air over the Bellingshausen Sea, resulting in theprominent cool anomaly in the surface air temperature fieldsfrom the reanalysis data that corresponds with years of highMSA at our ice core sites. These wind fields are alsofavorable for transporting MSA from high sea ice anomaliesin the Bellingshausen Sea onshore to the ice core sites.[16] Together this analysis of our ice core MSA records
alongside a variety of sea ice and meteorological data pro-vides strong evidence that MSA is a reliable proxy for
changes in sea ice in the adjacent Bellingshausen Sea. Usingthe stacked ice core MSA as a proxy for changes in sea icesince 1901 suggests that the Bellingshausen Sea has expe-rienced a marked loss of sea ice during the 20th century(Figure 3). A linear trend analysis calculated across thewhole 1901–1990 interval identifies a significant decreasingtrend of −0.10 ± 0.03s decade−1 in the stacked MSA record.When this analysis is repeated over 50 year intervals, similarsignificant trends are found for the early (−0.12 ± 0.06sdecade−1, 1901–1950) and late (–0.13 ± 0.09s decade−1,1941–1990) halves of the 20th century. A prominent epi-sode of high MSA in the late 1950s means that the trend ofdecreasing MSA is maximized when calculated over the1958–1990 interval (−0.34 ± 0.18s decade−1). The sus-tained trends of decreasing MSA imply that the recentdecline in sea ice in the Bellingshausen Sea observed using
Figure 1. (a) Ice core MSA records from James Ross Island (green), Dyer Plateau (red), and BeethovenPeninsula (blue) normalized relative to the 1901–1990 interval and the stacked MSA record (black) pro-duced from these three sites. (b) Correlation of the stacked MSA record with the winter (August–October)maximum sea ice extent in 10° sectors around Antarctica (1973–1990 [Jacka, 1990]). Increased ice coreMSA is significantly correlated with increased winter sea ice in the Bellingshausen Sea between 70°W–100°W (*>90% and ***>99% confidence; 2‐sided t test using autocorrelation‐adjusted effective datasizes). (c) Density maps of ERA‐40 [Uppala et al., 2005] 5 day back trajectories for precipitation eventsat the James Ross Island (green), Dyer (red), and Beethoven (blue) ice core sites. Shading and contour lineshow the 20% and 10% densities, respectively, for each site. All sites show a Bellingshausen Sea‐dominated source for precipitation events, which corresponds with the region of maximum correlation inwith sea ice extent.
ABRAM ET AL.: 20TH CENTURY ANTARCTIC SEA ICE DECLINE D23101D23101
4 of 9
satellite observations is part of a long‐term trend that hasoccurred throughout the 20th century.
4. Discussion
4.1. Comparison With Records of 20th CenturyClimate Change on the Antarctic Peninsula
[17] Our reconstruction of 20th century sea ice decline inthe Bellingshausen Sea is consistent with evidence of warmingalong the adjacent Antarctic Peninsula. A statistically signifi-cant correlation (r = −0.37, p = 0.01) is observed betweenwarming July–June annual mean air temperatures at Faraday/Vernadsky station and decreasing ice core MSA, and this isparticularly evident at decadal time scales (Figure 3). Thedocumented warming at Faraday station has been suggested
to be part of a continued warming trend since at least the1900s based on early exploration data [Jones, 1990]. Ourstacked ice core record supports this notion that warming ofthe Antarctic Peninsula has occurred throughout the 20thcentury, although perhaps with increased strength since∼1958. A similar pattern of 20th century climate change hasbeen reported for the Gomez ice core from the southern endof the Antarctic Peninsula. At the Gomez site, the statisti-cally significant isotope‐derived warming trend beganaround 1900 [Thomas et al., 2009], with particularly strongincreases in temperature and snow accumulation observedsince ∼1960 [Thomas et al., 2008; Thomas et al., 2009].[18] Previous studies using satellite data and model
simulations have highlighted the deepening of the AmundsenSea Low as a likely driver of the observed warming of the
Figure 3. The MSA record (thin black curve) derived from the three Antarctic Peninsula ice cores cor-relates significantly with decreasing mean sea level pressure over the Amundsen Sea (green curve; NCEPreanalysis data for region 100°W–140°W, 55°S–70°S, July–June averages) [Kalnay et al., 1996] and withthe historical record of rising air temperature measured at Faraday/Vernadsky station (thin purple curve;inverted; July–June averages). Thick black and purple curves are 11 year running means, and dashedblack line shows the mean of the stacked MSA record over the 1901–1990 normalization interval.
Figure 2. Correlation of the stacked Antarctic Peninsula MSA record with NCEP reanalysis July–Juneannual averages of (a) surface air temperature, (b) mean sea level pressure, (c) 850 mbar zonal wind, and(d) 850 mbar meridional wind (1979–2004 [Kalnay et al., 1996]). Correlation fields show that increased(decreased) ice core MSA is associated with years of cool (warm) air temperature in the BellingshausenSea that are caused by a high‐ (low‐) pressure anomaly in the Amundsen Sea that has accompanyingsouthwesterly (northeasterly) wind anomalies that form along the western side of the Antarctic Peninsulaand extend across the Bellingshausen Sea.
ABRAM ET AL.: 20TH CENTURY ANTARCTIC SEA ICE DECLINE D23101D23101
5 of 9
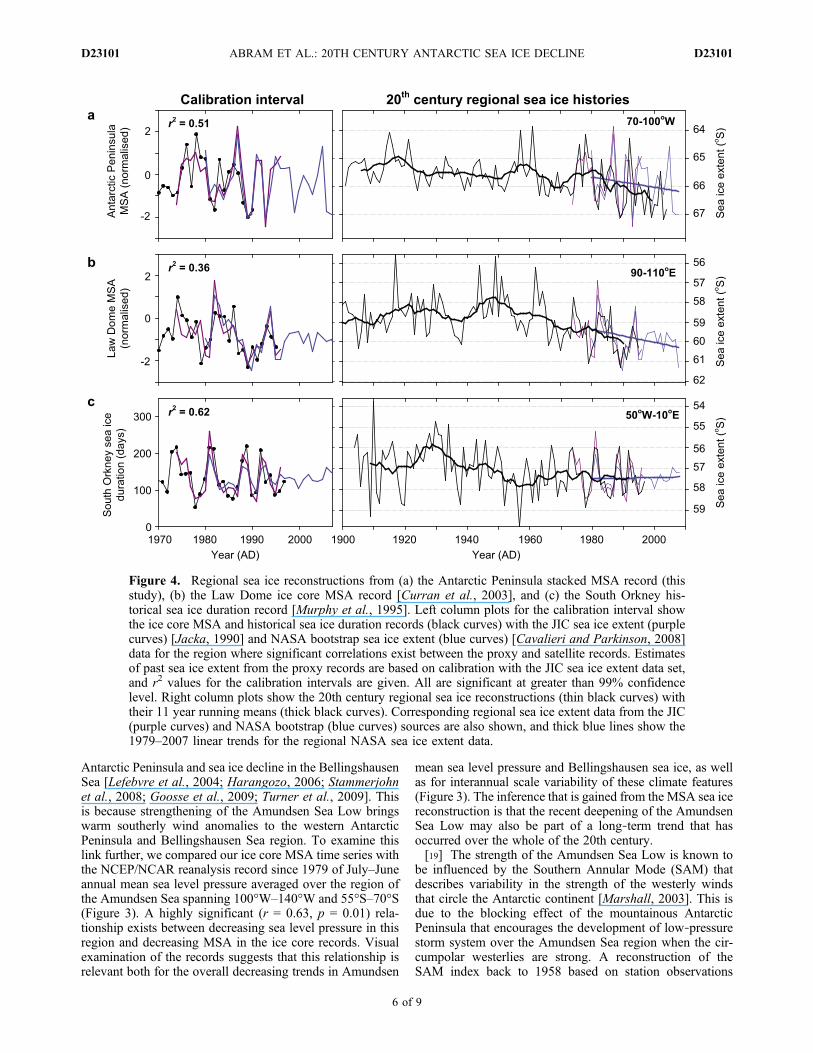
Antarctic Peninsula and sea ice decline in the BellingshausenSea [Lefebvre et al., 2004; Harangozo, 2006; Stammerjohnet al., 2008; Goosse et al., 2009; Turner et al., 2009]. Thisis because strengthening of the Amundsen Sea Low bringswarm southerly wind anomalies to the western AntarcticPeninsula and Bellingshausen Sea region. To examine thislink further, we compared our ice core MSA time series withthe NCEP/NCAR reanalysis record since 1979 of July–Juneannual mean sea level pressure averaged over the region ofthe Amundsen Sea spanning 100°W–140°W and 55°S–70°S(Figure 3). A highly significant (r = 0.63, p = 0.01) rela-tionship exists between decreasing sea level pressure in thisregion and decreasing MSA in the ice core records. Visualexamination of the records suggests that this relationship isrelevant both for the overall decreasing trends in Amundsen
mean sea level pressure and Bellingshausen sea ice, as wellas for interannual scale variability of these climate features(Figure 3). The inference that is gained from the MSA sea icereconstruction is that the recent deepening of the AmundsenSea Low may also be part of a long‐term trend that hasoccurred over the whole of the 20th century.[19] The strength of the Amundsen Sea Low is known to
be influenced by the Southern Annular Mode (SAM) thatdescribes variability in the strength of the westerly windsthat circle the Antarctic continent [Marshall, 2003]. This isdue to the blocking effect of the mountainous AntarcticPeninsula that encourages the development of low‐pressurestorm system over the Amundsen Sea region when the cir-cumpolar westerlies are strong. A reconstruction of theSAM index back to 1958 based on station observations
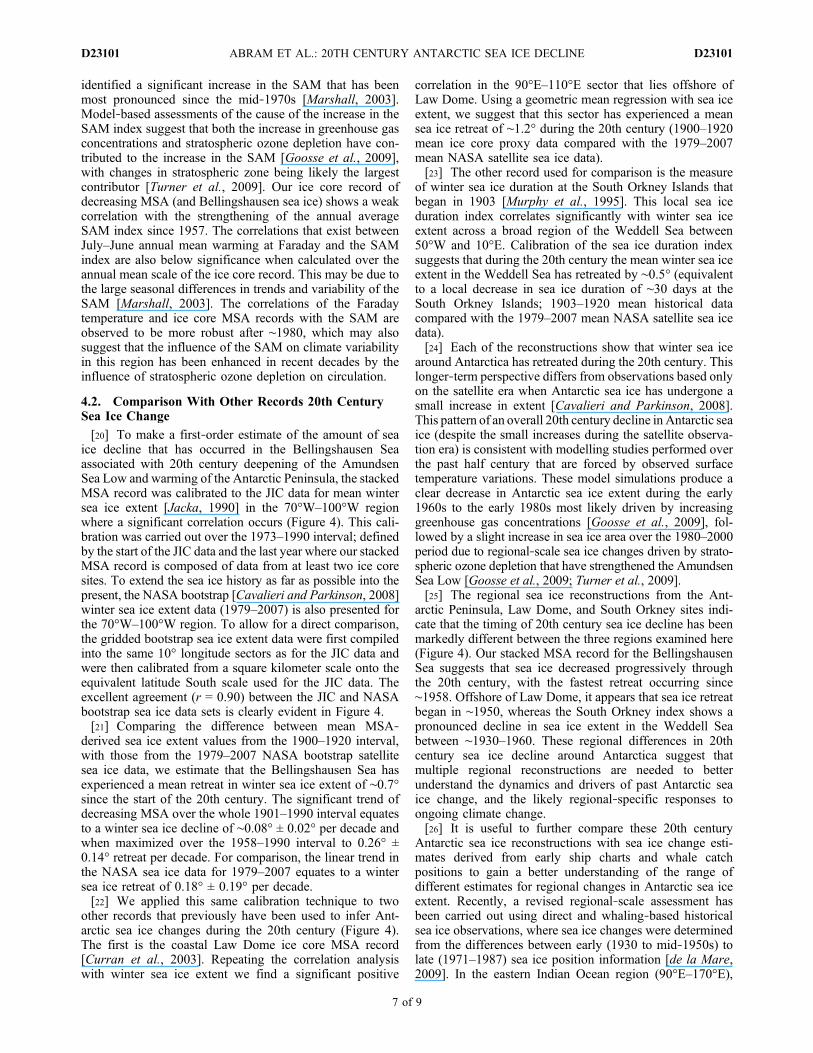
Figure 4. Regional sea ice reconstructions from (a) the Antarctic Peninsula stacked MSA record (thisstudy), (b) the Law Dome ice core MSA record [Curran et al., 2003], and (c) the South Orkney his-torical sea ice duration record [Murphy et al., 1995]. Left column plots for the calibration interval showthe ice core MSA and historical sea ice duration records (black curves) with the JIC sea ice extent (purplecurves) [Jacka, 1990] and NASA bootstrap sea ice extent (blue curves) [Cavalieri and Parkinson, 2008]data for the region where significant correlations exist between the proxy and satellite records. Estimatesof past sea ice extent from the proxy records are based on calibration with the JIC sea ice extent data set,and r2 values for the calibration intervals are given. All are significant at greater than 99% confidencelevel. Right column plots show the 20th century regional sea ice reconstructions (thin black curves) withtheir 11 year running means (thick black curves). Corresponding regional sea ice extent data from the JIC(purple curves) and NASA bootstrap (blue curves) sources are also shown, and thick blue lines show the1979–2007 linear trends for the regional NASA sea ice extent data.
ABRAM ET AL.: 20TH CENTURY ANTARCTIC SEA ICE DECLINE D23101D23101
6 of 9
identified a significant increase in the SAM that has beenmost pronounced since the mid‐1970s [Marshall, 2003].Model‐based assessments of the cause of the increase in theSAM index suggest that both the increase in greenhouse gasconcentrations and stratospheric ozone depletion have con-tributed to the increase in the SAM [Goosse et al., 2009],with changes in stratospheric zone being likely the largestcontributor [Turner et al., 2009]. Our ice core record ofdecreasing MSA (and Bellingshausen sea ice) shows a weakcorrelation with the strengthening of the annual averageSAM index since 1957. The correlations that exist betweenJuly–June annual mean warming at Faraday and the SAMindex are also below significance when calculated over theannual mean scale of the ice core record. This may be due tothe large seasonal differences in trends and variability of theSAM [Marshall, 2003]. The correlations of the Faradaytemperature and ice core MSA records with the SAM areobserved to be more robust after ∼1980, which may alsosuggest that the influence of the SAM on climate variabilityin this region has been enhanced in recent decades by theinfluence of stratospheric ozone depletion on circulation.
4.2. Comparison With Other Records 20th CenturySea Ice Change
[20] To make a first‐order estimate of the amount of seaice decline that has occurred in the Bellingshausen Seaassociated with 20th century deepening of the AmundsenSea Low and warming of the Antarctic Peninsula, the stackedMSA record was calibrated to the JIC data for mean wintersea ice extent [Jacka, 1990] in the 70°W–100°W regionwhere a significant correlation occurs (Figure 4). This cali-bration was carried out over the 1973–1990 interval; definedby the start of the JIC data and the last year where our stackedMSA record is composed of data from at least two ice coresites. To extend the sea ice history as far as possible into thepresent, the NASA bootstrap [Cavalieri and Parkinson, 2008]winter sea ice extent data (1979–2007) is also presented forthe 70°W–100°W region. To allow for a direct comparison,the gridded bootstrap sea ice extent data were first compiledinto the same 10° longitude sectors as for the JIC data andwere then calibrated from a square kilometer scale onto theequivalent latitude South scale used for the JIC data. Theexcellent agreement (r = 0.90) between the JIC and NASAbootstrap sea ice data sets is clearly evident in Figure 4.[21] Comparing the difference between mean MSA‐
derived sea ice extent values from the 1900–1920 interval,with those from the 1979–2007 NASA bootstrap satellitesea ice data, we estimate that the Bellingshausen Sea hasexperienced a mean retreat in winter sea ice extent of ∼0.7°since the start of the 20th century. The significant trend ofdecreasing MSA over the whole 1901–1990 interval equatesto a winter sea ice decline of ∼0.08° ± 0.02° per decade andwhen maximized over the 1958–1990 interval to 0.26° ±0.14° retreat per decade. For comparison, the linear trend inthe NASA sea ice data for 1979–2007 equates to a wintersea ice retreat of 0.18° ± 0.19° per decade.[22] We applied this same calibration technique to two
other records that previously have been used to infer Ant-arctic sea ice changes during the 20th century (Figure 4).The first is the coastal Law Dome ice core MSA record[Curran et al., 2003]. Repeating the correlation analysiswith winter sea ice extent we find a significant positive
correlation in the 90°E–110°E sector that lies offshore ofLaw Dome. Using a geometric mean regression with sea iceextent, we suggest that this sector has experienced a meansea ice retreat of ∼1.2° during the 20th century (1900–1920mean ice core proxy data compared with the 1979–2007mean NASA satellite sea ice data).[23] The other record used for comparison is the measure
of winter sea ice duration at the South Orkney Islands thatbegan in 1903 [Murphy et al., 1995]. This local sea iceduration index correlates significantly with winter sea iceextent across a broad region of the Weddell Sea between50°W and 10°E. Calibration of the sea ice duration indexsuggests that during the 20th century the mean winter sea iceextent in the Weddell Sea has retreated by ∼0.5° (equivalentto a local decrease in sea ice duration of ∼30 days at theSouth Orkney Islands; 1903–1920 mean historical datacompared with the 1979–2007 mean NASA satellite sea icedata).[24] Each of the reconstructions show that winter sea ice
around Antarctica has retreated during the 20th century. Thislonger‐term perspective differs from observations based onlyon the satellite era when Antarctic sea ice has undergone asmall increase in extent [Cavalieri and Parkinson, 2008].This pattern of an overall 20th century decline in Antarctic seaice (despite the small increases during the satellite observa-tion era) is consistent with modelling studies performed overthe past half century that are forced by observed surfacetemperature variations. These model simulations produce aclear decrease in Antarctic sea ice extent during the early1960s to the early 1980s most likely driven by increasinggreenhouse gas concentrations [Goosse et al., 2009], fol-lowed by a slight increase in sea ice area over the 1980–2000period due to regional‐scale sea ice changes driven by strato-spheric ozone depletion that have strengthened the AmundsenSea Low [Goosse et al., 2009; Turner et al., 2009].[25] The regional sea ice reconstructions from the Ant-
arctic Peninsula, Law Dome, and South Orkney sites indi-cate that the timing of 20th century sea ice decline has beenmarkedly different between the three regions examined here(Figure 4). Our stacked MSA record for the BellingshausenSea suggests that sea ice decreased progressively throughthe 20th century, with the fastest retreat occurring since∼1958. Offshore of Law Dome, it appears that sea ice retreatbegan in ∼1950, whereas the South Orkney index shows apronounced decline in sea ice extent in the Weddell Seabetween ∼1930–1960. These regional differences in 20thcentury sea ice decline around Antarctica suggest thatmultiple regional reconstructions are needed to betterunderstand the dynamics and drivers of past Antarctic seaice change, and the likely regional‐specific responses toongoing climate change.[26] It is useful to further compare these 20th century
Antarctic sea ice reconstructions with sea ice change esti-mates derived from early ship charts and whale catchpositions to gain a better understanding of the range ofdifferent estimates for regional changes in Antarctic sea iceextent. Recently, a revised regional‐scale assessment hasbeen carried out using direct and whaling‐based historicalsea ice observations, where sea ice changes were determinedfrom the differences between early (1930 to mid‐1950s) tolate (1971–1987) sea ice position information [de la Mare,2009]. In the eastern Indian Ocean region (90°E–170°E),
ABRAM ET AL.: 20TH CENTURY ANTARCTIC SEA ICE DECLINE D23101D23101
7 of 9
historical records suggest that a mean regional sea ice retreatof ∼1.3° occurred between the early and late intervals. Usingthese same time intervals, a similar sea ice retreat of ∼1.0° inthe 90°E–110°E sector is inferred from the Law Dome MSArecord [Curran et al., 2003].[27] Historical whaling/ship data are too sparse in the
Bellingshausen Sea to produce an estimate for this regionalone, but across the broader South Pacific Ocean region(70–150°W), sea ice retreat between the early and lateintervals is estimated at ∼0.3° [de la Mare, 2009]. It is worthnoting, however, that in this region, different historicalsources give very different sea ice change estimates; directship observations indicate an early‐to‐late sea ice retreat of∼2.1°, whereas whale catch records suggest an early‐to‐latesea ice advance of ∼0.6°. Our MSA‐based reconstruction forthe 70°W–100°W sector of the Bellingshausen Sea docu-ments no mean change (0.0°) in sea ice extent between thesespecific early and late intervals. This is due to the timing ofthe early and late intervals with respect to decadal variabilityin the Bellingshausen sea ice reconstruction.[28] In the Weddell Sea region, significantly different
magnitudes of sea ice retreat are produced using the whaling/ship chart information compared with the inferences fromthe sea ice duration record from the South Orkney Islands.The South Orkney record [Murphy et al., 1995] suggests amean sea ice retreat in the Weddell Sea region of ∼0.4°between the early and late intervals, whereas whaling/shiprecords from this region suggest that sea ice retreat mayhave exceeded 4° [de la Mare, 2009]. This exceptionallylarge sea ice retreat indicated by the historical ship‐basedrecords has been hypothesized to reflect, at least in part, thedynamic position of the eastern tongue of the Weddell Seaice pack that in some years delayed or prevented the earlywhaling vessels from reaching the true sea ice edge [de laMare, 2009]. It is also possible that a more prominent andsustained Weddell ice tongue during the early 20th centuryresulted in a strong seasonal difference in sea ice retreat inthis region, with the whaling records documenting a strongretreat of the summer ice pack, and the South Orkney sea iceduration record representing a more moderate retreat ofwinter sea ice.
5. Implications
[29] Our study using ice cores from three sites along thewestern and northern Antarctic Peninsula has found that inthis region the MSA concentration in ice is a reliable proxyfor regional‐scale changes in winter sea ice extent. The icecore MSA‐based reconstruction indicates that the Belling-shausen Sea has experienced a progressive decline in sea icethroughout the 20th century, with a particularly strongretreat in sea ice since ∼1958. This supports theories thatrecent warming along the Antarctic Peninsula has been partof a continued trend since the early 1900s. Climate simu-lation studies may be able to further test the relationship thatthese 20th century changes in Bellingshausen sea ice andAntarctic Peninsula temperatures have to circulation pro-cesses associated with the Amundsen Sea Low and theSAM, and the implications that greenhouse gas concentra-tions and stratospheric ozone changes have for futurechanges in Antarctic sea ice extent. The recent collection ofa deep ice core from James Ross Island will also allow for a
more complete understanding of the natural range and dri-vers of past sea ice variability in the Bellingshausen Seaspanning the whole of the Holocene.[30] The sea ice reconstruction, presented here, for the
Bellingshausen Sea builds on previous evidence for a 20thcentury decline in Antarctic sea ice. Although all presatelliterecords demonstrate evidence for a decline in Antarctic seaice during the 20th century, the details of these reconstructedsea ice declines are quite varied. Differences in the magni-tude of sea ice decline that is reconstructed by differentmethods within the same region highlight the need forimproved methods of quantification for the historical andproxy record data sets. Geographical differences in thetiming of sea ice decline demonstrate the need for multipleregional‐scale reconstructions. For the future, ice core MSArecords from the Amundsen Sea coast and around coastaleast Antarctica will be particularly useful for developing amore comprehensive understanding of the geographicaldifferences in interannual to centennial‐scale changes inAntarctic sea ice. The combination of ice core MSA recordswith numerical modeling assessments of MSA production,transport, and deposition pathways will also help to improvethe quantification of these sea ice reconstructions so that thedrivers of past and future sea ice change around Antarcticamay be better understood.
[31] Acknowledgments. We thank Eric Wolff and John Turner forvaluable discussions, Robert Arthern for providing access to the recent corefrom Dyer Plateau, and Gareth Marshall and the READER project formaking the Faraday/Vernadsky temperature data available. For laboratoryassistance, we gratefully acknowledge Genevieve Littot, Sue Foord, andLouise Thilthorpe. This study is part of the British Antarctic Survey PolarScience for Planet Earth Programme. It was funded by the Natural Environ-ment Research Council, with additional support from the National ScienceFoundation’s Office of Polar Programs, the Instituto Antárctico Argentino,and the U.S. and Argentine Fulbright Programs.
ReferencesAbram, N. J., R. Mulvaney, E. Wolff, and M. Mudelsee (2007), Ice corerecords as sea ice proxies: an evaluation from the Weddell Sea regionof Antarctica, J. Geophys. Res., 112, D15101, doi:10.1029/2006JD008139.
Abram, N. J., M. A. J. Curran, R. Mulvaney, and T. Vance (2008),The preservation of methanesulphonic acid in frozen ice core samples,J. Glaciol., 54, 680–684.
Ackley, S., P. Wadhams, J. Cosimo, and A. Worby (2003), Decadaldecrease of Antarctic sea ice extent inferred from whaling records revis-ited on the basis of historical and modern sea ice records, Polar Res., 22,19–25.
Aristarain, A. J., R. J. Delmas, and M. Stievenard (2004), Ice core study ofthe link between sea‐salt aerosol, sea‐ice cover and climate in the AntarcticPeninsula area, Clim. Change, 67, 63–86.
Becagli, S., et al. (2009), Methanesulphonic acid (MSA) stratigraphyfrom a Talos Dome ice core as a tool in depicting sea ice changesand southern atmospheric circulation over the previous 140 years, Atmos.Environ., 43, 1051–1058.
Bretherton, C. S., M. Widmann, V. P. Dymnikov, J. M. Wallace, andI. Blade (1999), The effective number of spatial degrees of freedom of atime‐varying field, J. Clim., 12, 1990–2009.
Cavalieri, D. J., and C. L. Parkinson (2008), Antarctic sea ice variabilityand trends, 1979–2006, J. Geophys. Res., 113, C07004, doi:10.1029/2007JC004564.
Cotte, C., and C. Guinet (2007), Historical whaling records reveal majorregional retreat of Antarctic sea ice, Deep Sea Res. Part I, 54, 243–252.
Curran, M. A. J., and G. B. Jones (2000), Dimethyl sulfide in the SouthernOcean: Seasonality and flux, J. Geophys. Res., 105(D16), 20,451–20,459, doi:10.1029/2000JD900176.
Curran, M. A. J., T. D. van Ommen, V. I. Morgan, K. L. Phillips, andA. S. Palmer (2003), Ice core evidence for Antarctic sea ice decline sincethe 1950s, Science, 302, 1203–1206.
ABRAM ET AL.: 20TH CENTURY ANTARCTIC SEA ICE DECLINE D23101D23101
8 of 9
de la Mare, W. K. (1997), Abrupt mid‐twentieth century decline in Antarcticsea ice extent from whaling records, Nature, 389, 57–60.
de la Mare, W. K. (2009), Changes in Antarctic sea ice extent from directhistorical observations and whaling records, Clim. Change, 92, 461–493,doi:10.1007/s10584-008-9473-2.
Dixon, D., P. A. Mayewski, S. Kaspari, K. J. Kreutz, G. Hamilton,K. Maasch, S. B. Sneed, and M. J. Handley (2005), A 200 year sulfaterecord from 16 Antarctic ice cores and associations with Southern Oceansea ice extent, Ann. Glaciol., 41.
Foster, A. F. M., M. A. J. Curran, B. T. Smith, T. D. van Ommen, andV. I. Morgan (2006), Covariation of sea ice and methanesulphonic acid inWilhelm II Lnad, East Antarctica, Ann. Glaciol., 44, 429–432.
Fundel, F., H. Fischer, R. Weller, F. Traufetter, H. Oerter, and H. Miller(2006), Influence of large‐scale teleconnection patterns on methanesulfonate ice core records in Dronning Maud Land, J. Geophys. Res.,111, D04103, doi:10.1029/2005JD005872.
Goosse, H., W. Lefebvre, A. de Montety, E. Crespin, and A. H. Orsi(2009), Consistent past half‐century trends in the atmosphere, the seaice and the ocean at high southern latitudes, Clim. Dyn., 33, 999–1016.
Harangozo, S. A. (2006), Atmospheric circulation impacts on winter max-imum sea ice extent in the west Antarctic Peninsula region (1979–2001),Geophys. Res. Lett., 33, L02502, doi:10.1029/2005GL024978.
Jacka, T. H. (1990), Antarctic and Southern Ocean sea ice and climatetrends, Ann. Glaciol., 14, 127–130.
Jones, P. D. (1990), Antarctic temperatures over the past century—A studyof the early expedition record, J. Clim., 3, 1193–1203.
Kalnay, E., et al. (1996), The NCEP/NCAR Re‐Analysis 40‐year project,Bull. Am. Meteorol. Soc., 77, 437–471.
Lefebvre, W., H. Goosse, R. Timmermann, and T. Fichefet (2004),Influence of the Southern Annular Mode on the sea ice ocean system,J. Geophys. Res., 109, C09005, doi:10.1029/2004JC002403.
Littot, G. C., R. Mulvaney, R. Rothlisberger, R. Udisti, E. W. Wolff,E. Castellano, M. De Angelis, M. E. Hansson, S. Sommer, and J. P.Steffensen (2002), Comparison of analytical methods used for measuringmajor ions in the EPICA Dome C (Antarctica) ice core, Ann. Glaciol., 35,299–305.
Marshall, G. J. (2003), Trends in the Southern Annular Mode from obser-vations and reanalyses, J. Clim., 16, 4134–4143.
McConnell, J. R., A. J. Aristarain, J. R. Banta, P. R. Edwards, andJ. C. Simoes (2007), 20th century doubling in dust archived in an AntarcticPeninsula ice core parallels climate change and desertification in SouthAmerica, Proc. Natl. Acad. Sci. U. S. A., 104, 5732–5748, doi:10.1073pnas.0607657104.
Mulvaney, R., H. Oerter, D. A. Peel, W. Graf, C. Arrowsmith, E. C. Pasteur,B. Knight, C. Littot, and W. D. Miners (2002), 1000 year ice core recordsfrom Berkner Island, Antarctica, Ann. Glaciol., 35, 45–51.
Murphy, E. J., A. Clarke, C. Symon, and J. Priddle (1995), Temporal varia-tion in Antarctic sea ice: Analysis of a long‐term fast ice record from theSouth Orkney Islands, Deep Sea Res. Part I, 42, 1045–1062.
Preunkert, S., B. Jourdain, M. Legrand, R. Udisti, S. Becagli, and O. Cerri(2008), Seasonality of sulfur species (dimehtyl sulfide, sulfate, and metha-nesulfonate) in Antarctica: Inland versus coastal regions, J. Geophys.Res., 113, D15302, doi:10.1029/2008JD009937.
Rhodes, R. H., N. A. N. Bertler, J. A. Baker, S. B. Sneed, H. Oerter, andK. R. Arrigo (2009), Sea ice variability and primary productivity in theRoss Sea, Antarctica, from methylsulphonate snow record, Geophys.Res. Lett., 36, L10704, doi:10.1029/2009GL037311.
Roberts, J. L., T. D. van Ommen, M. A. J. Curran, and T. R. Vance (2009),Methanesulphonic acid loss during ice core storage: Recommendationsbased on a new diffusion coefficient, J. Glaciol., 55(193), 784–788.
Rothlisberger, R., X. Crosta, N. J. Abram, L. Armand, and E. W. Wolff(2010), Potential and limitations of marine and ice core sea ice proxies:An example from the Indian Ocean sector, Quat. Sci. Rev., 29, 296–302.
Smith, B. T., T. van Ommen, and M. A. J. Curran (2004), Methanesulphonicacid movement in solid ice cores, Ann. Glaciol., 39, 540–544.
Smith, R. J. (2009), Use and misuse of the reduced major axis for linefitting, Am. J. Phys., 140, 476–486.
Stammerjohn, S. E., D. G. Martinson, R. C. Smith, X. Yuan, and D. Rind(2008), Trends in Antarctic annual sea ice retreat and advance and theirrelation to El Nino‐Southern Oscillation and Southern Annular Modevariability, J. Geophys. Res., 113, C03S90, doi:10.1029/2007JC004269.
Sun, J., J. Ren, and D. Qin (2002), 60 years record of biogenic sulfurfrom Lambert Glacier basin firn core, East Antarctica, Ann. Glaciol.,35, 362–367.
Thomas, E. R., and T. J. Bracegirdle (2009), Improving ice core interpre-tation using in situ and reanalysis data, J. Geophys. Res., 114, D20116,doi:10.1029/2009JD012263.
Thomas, E. R., G. J. Marshall, and J. R. McConnell (2008), A doublingin snow accumulation in the western Antarctic Peninsula since 1850,Geophys. Res. Lett., 35, L01706, doi:10.1029/2007GL032529.
Thomas, E. R., P. F. Dennis, T. J. Bracegirdle, and C. Franzke (2009), Icecore evidence for significant 100‐year regional warming on the AntarcticPeninsula, Geophys. Res. Lett., 36, L20704, doi:10.1029/2009GL040104.
Turner, J., J. C. Comiso, G. J. Marshall, T. A. B. Lachlan‐Cope, T. T.Maksym, M. P. Meredith, Z. Wang, and A. Orr (2009), Non‐annularatmospheric circulation change induced by stratospheric ozone depletionand its role in the recent increase of Antarctic sea ice extent, Geophys.Res. Lett., 36, L08502, doi:10.1029/2009GL037524.
Uppala, S. M., et al. (2005), The ERA‐40 re‐analysis, Q. J. R. Meteorol.Soc., 131, 2961–3012, doi:10.1256/qj.04.176.
van Ommen, T. D., and V. Morgan (2010), Snowfall increase in coastalEast Antarctica linked with southwest Western Australian drought, Nat.Geosci., 3, doi:10.1038/ngeo761.
Vaughan, S. (2000), Can Antarctic sea ice extent be determined fromwhaling records?, Polar Rec., 36, 345–347.
Welch, K. A., P. A. Mayewski, and S. I. Whitlow (1993), Methanesulphonicacid in coastal Antarctic snow related to sea ice extent,Geophys. Res. Lett.,20(6), 443–446, doi:10.1029/93GL00499.
Weller, R., F. Traufetter, H. Fischer, H. Oerter, C. Piel, and H. Miller(2004), Post depositional losses of methane sulfonate, nitrate and chlo-ride at the EPICA deep‐drilling site in Dronning Maud Land, Antarctica,J. Geophys. Res., 109, D07301, doi:10.1029/2003JD004189.
Wolff, E., A. M. Rankin, and R. Rothlisberger (2003), An ice core indicatorof Antarctic sea ice production?, Geophys. Res. Lett., 30(20), 2158,doi:10.1029/2003GL018454.
Zwally, H. J., J. C. Comiso, C. L. Parkinson, D. J. Cavalieri, and P. Gloersen(2002), Variability of Antarctic sea ice 1979–1998, J. Geophys. Res.,107(C5), 3041, doi:10.1029/2000JC000733.
N. J. Abram, T. J. Bracegirdle, R. Mulvaney, L. C. Sime, andE. R. Thomas, British Antarctic Survey, Cambridge CB3 0ET, UK. ([email protected])A. J. Aristarain, Instituto Antárctico Argentino, CRICYT, CC131, 5500
Mendoza, Argentina.J. R. McConnell, Division of Hydrologic Sciences, Desert Research
Institute, Reno, NV 89512, USA.
ABRAM ET AL.: 20TH CENTURY ANTARCTIC SEA ICE DECLINE D23101D23101
9 of 9
Related Documents