Feb 20, 2014

Welcome message from author
This document is posted to help you gain knowledge. Please leave a comment to let me know what you think about it! Share it to your friends and learn new things together.
Transcript

Feb 20, 2014

THE SOLUTION

S&OP – IBS APPROACH
Our innovations & differentiators:
Along with all the traditional attachments of S&OP:
Forward cover bands
Embedded analytics
Exceptions detection
Root cause(s) engine
Guided Recommendations
Demand management
Supply management
Process calendars
Scenario planning &
managementKPI reports

MTNA
DemandInventory
(Units)
“Optimized” Target
Supply
Businesses typically manage the variables of demand, inventory
and supply separately – Existing ERPs typically induce this type
of performance
MAKEThe Numbers™
MAKEThe Numbers™
MAKE Don’t Chase the Numbers!
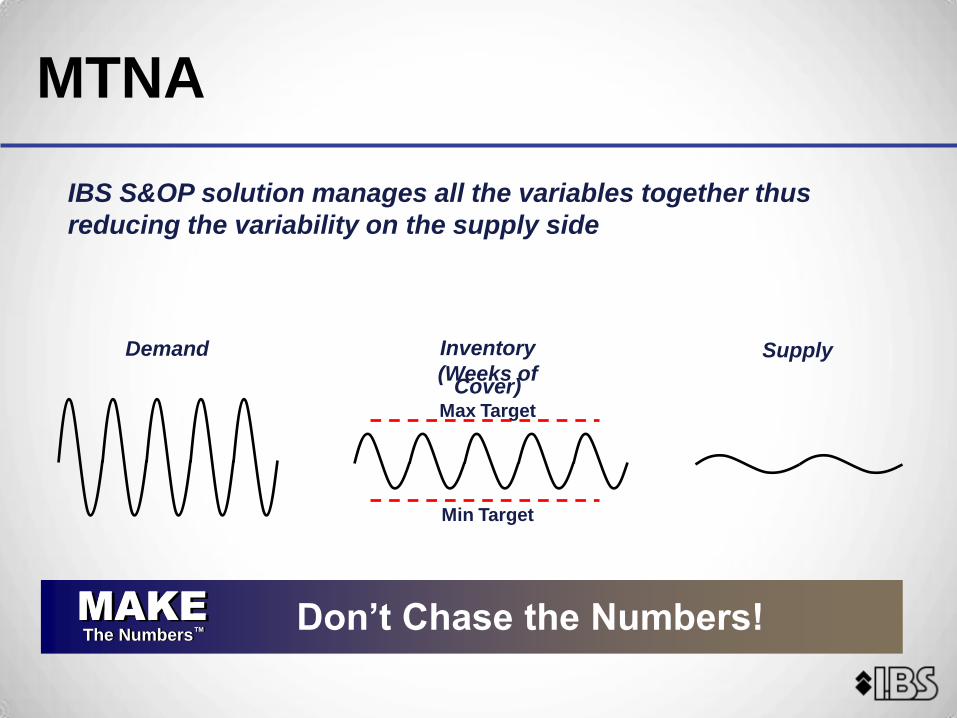
SupplyDemand
IBS S&OP solution manages all the variables together thus
reducing the variability on the supply side
Inventory
(Weeks of Cover)
Max Target
Min Target
MAKEThe Numbers™
MAKEThe Numbers™
MAKE Don’t Chase the Numbers!
MTNA

ANALYTICS LIBRARY
Stock out/Lost sales prediction
Pricing and promotions analytics
Dynamic supply chain segmentation
Inventory/service level analytics
Supplier score-carding
Etc
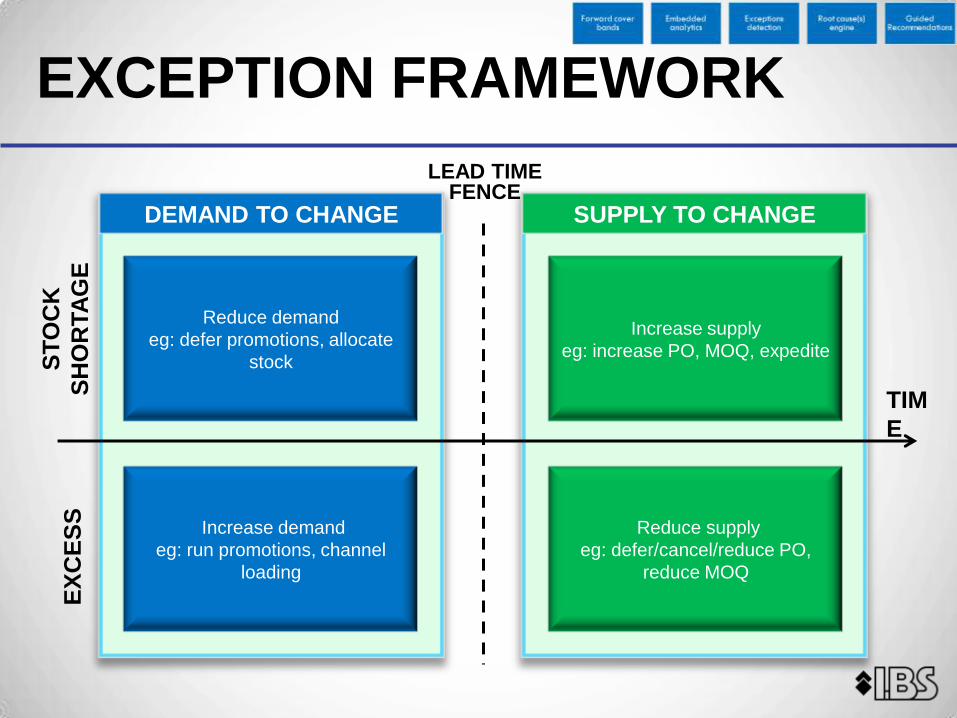
SUPPLY TO CHANGEDEMAND TO CHANGE
Reduce supply
eg: defer/cancel/reduce PO,
reduce MOQ
Reduce demand
eg: defer promotions, allocate
stock
EXCEPTION FRAMEWORK
LEAD TIME FENCE
ST
OC
K
SH
OR
TA
GE
EX
CE
SS
TIM
E
Increase supply
eg: increase PO, MOQ, expedite
Increase demand
eg: run promotions, channel
loading

ROOT CAUSE ENGINE
Level 1
• Demand related
• Supply related
Level 2
• Which customer/Why
• Did promotion succeed
Level 3
• Is there product cannibalization
• Why promotion failed to achieve target
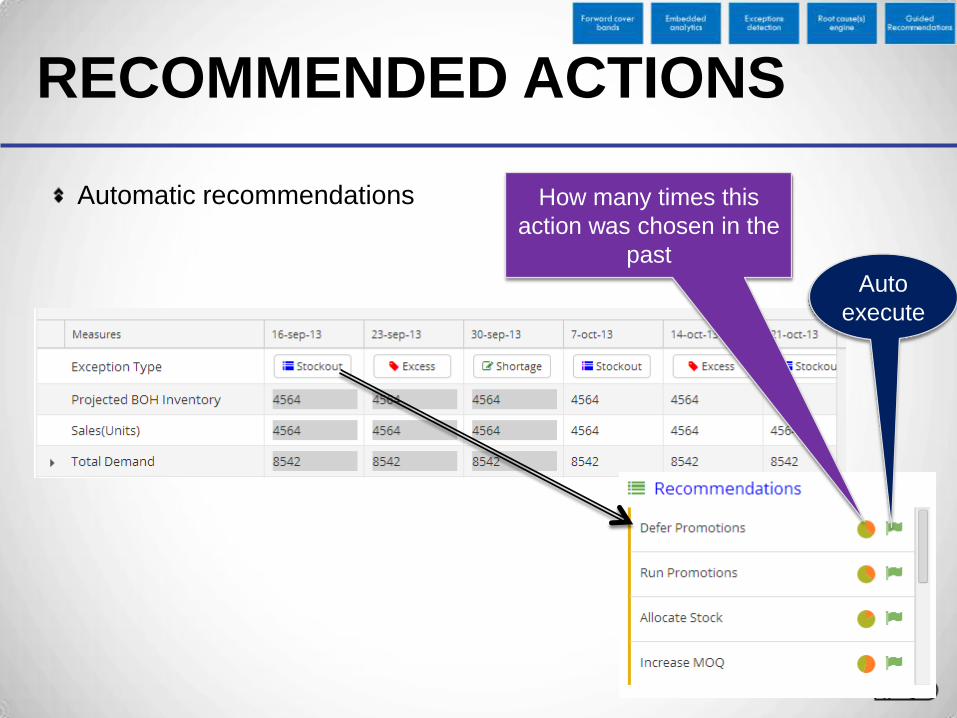
RECOMMENDED ACTIONS
Automatic recommendations How many times this
action was chosen in the
past
Auto
execute
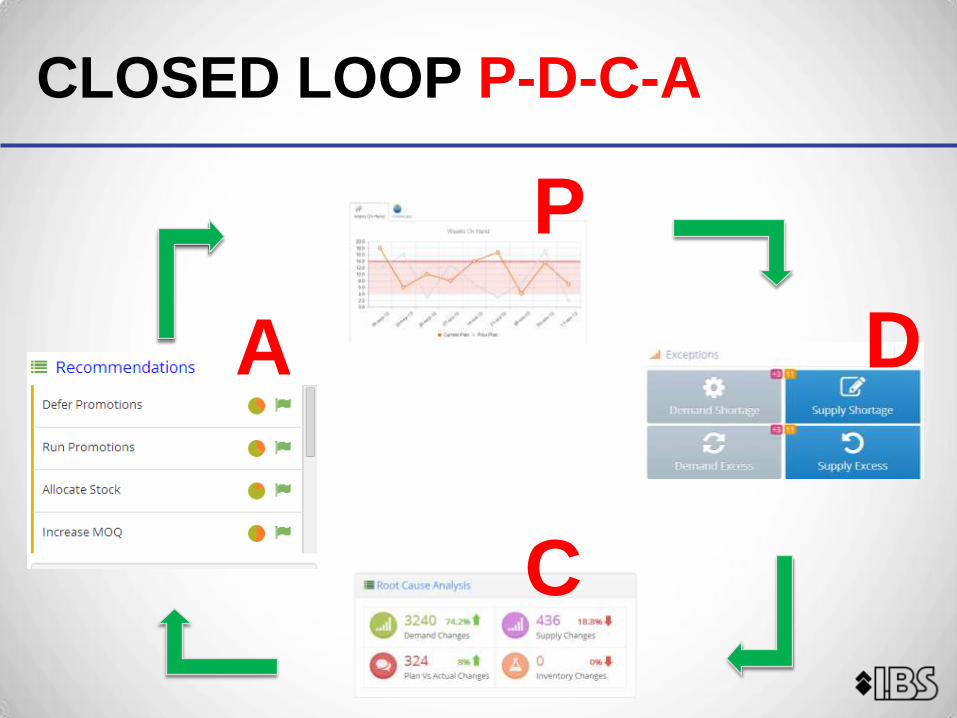
CLOSED LOOP P-D-C-A
P
D
C
A
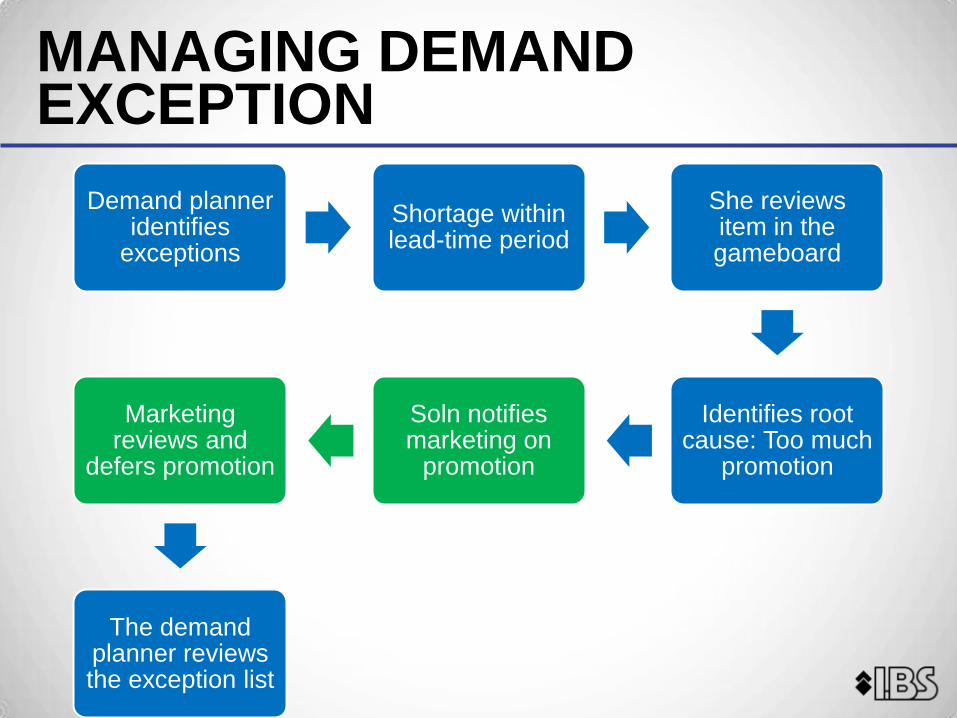
MANAGING DEMAND EXCEPTION
Demand planner identifies
exceptions
Shortage within lead-time period
She reviews item in the gameboard
Identifies root cause: Too much
promotion
Soln notifies marketing on
promotion
Marketing reviews and
defers promotion
The demand planner reviews the exception list

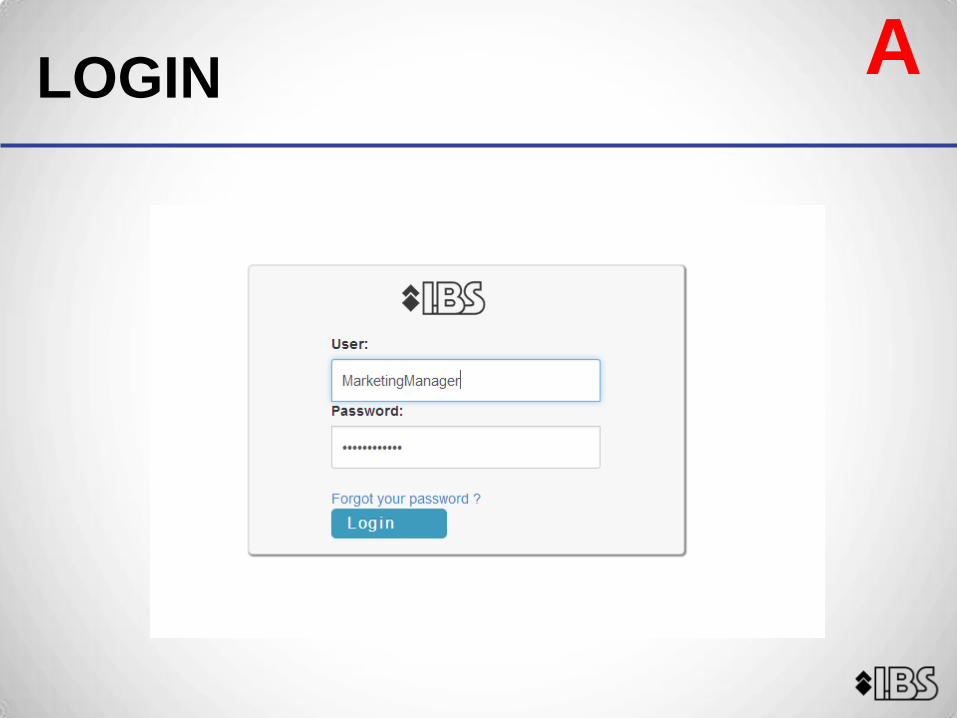
DEMAND PLANNER

LOGIN

DEFAULT ENTRY: MY WORKSPACE
Your scenarios
The
exceptions
Tasks
D

NAVIGATE TO EXCEPTIONS
The bands
Navigate to the
Gameboard
Promotions
indicator
D

NAVIGATE TO GAMEBOARD
WOH cover
Compare it
against last
cycle’s situation
Change values &
simulate here
C

IDENTIFY ROOT-CAUSE & USE PROCESS PLAYBOOK
Click to know why
deviation in WOH
Action: Defer
promotion
A

MARKETING MANAGER
LOGIN A
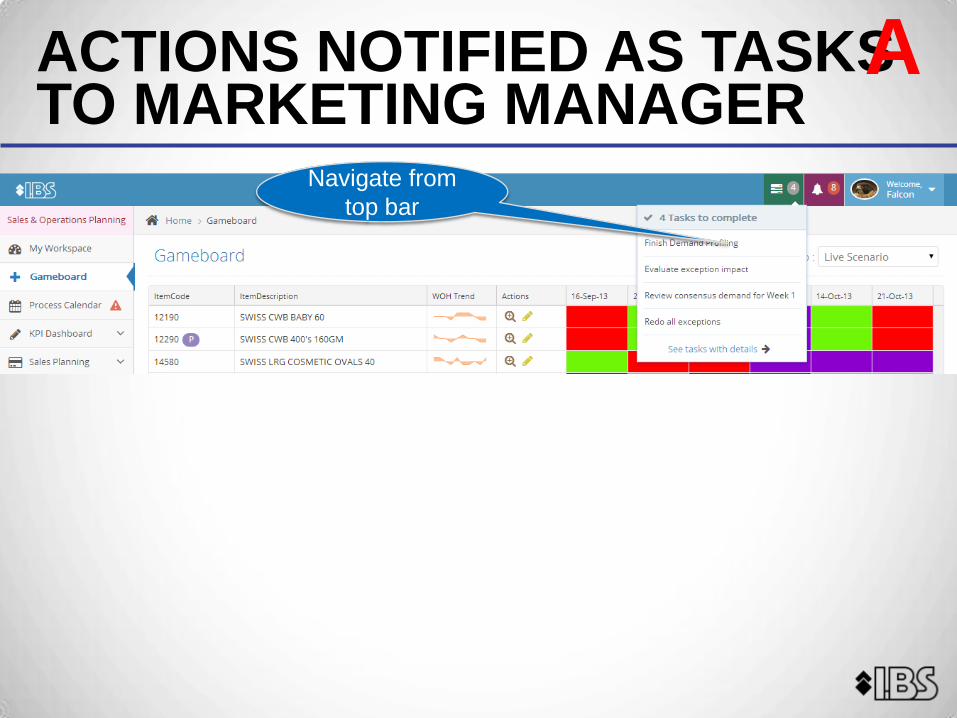
ACTIONS NOTIFIED AS TASKS TO MARKETING MANAGER
Navigate from
top bar
A

PLAYBOOK: REDUCE PROMOTION
Reduce
planned
promotion
P
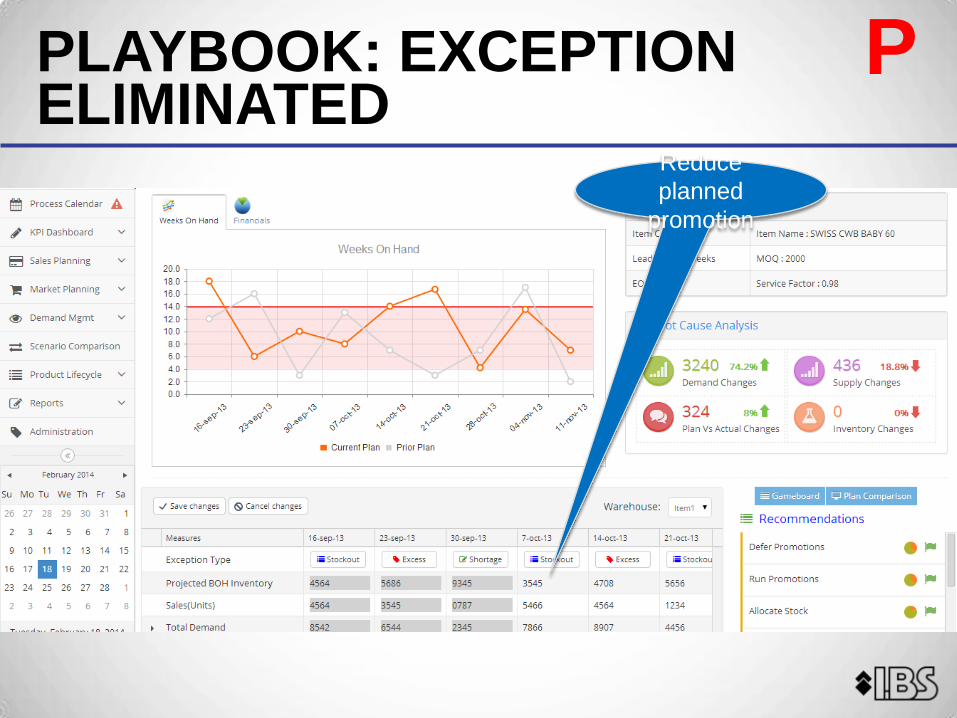
PLAYBOOK: EXCEPTION ELIMINATED
Reduce
planned
promotion
P
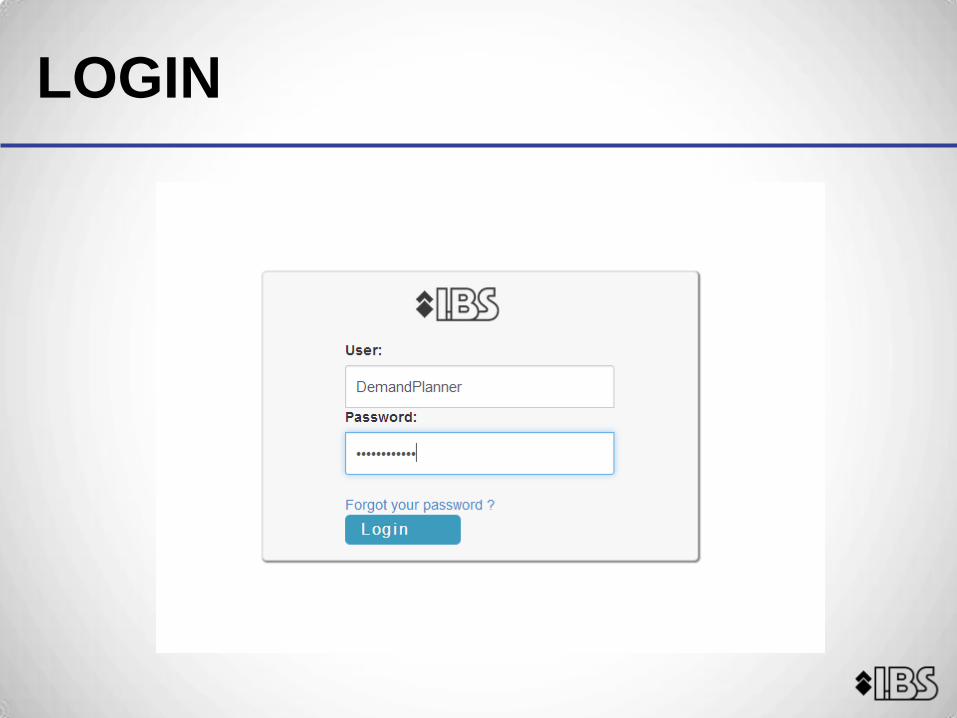
LOGIN

STATISTICAL FORECAST/MGMT
compare
Auto
classification
Forecast
accuracy
P
Seasonality,
trend
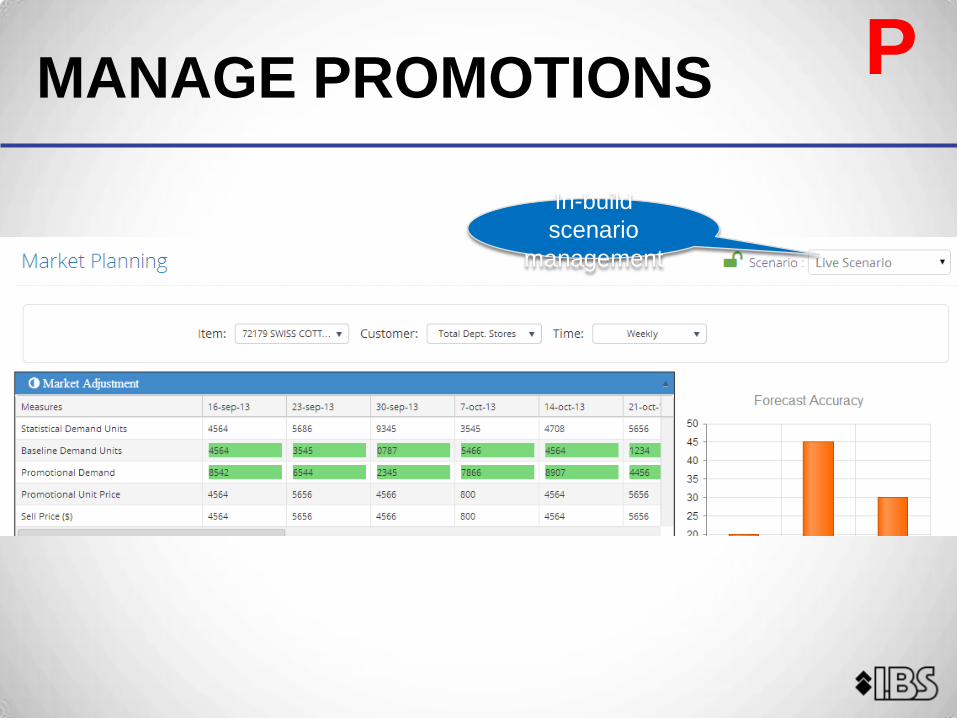
MANAGE PROMOTIONS P
In-build
scenario
management

NPI/LIKE PRODUCTS P

DEFAULT ENTRY: MY WORKSPACE
Your scenarios
The
exceptions
Tasks
D

NAVIGATE TO EXCEPTIONS
The bands
Navigate to the
Gameboard
Promotions
indicator
D

NAVIGATE TO GAMEBOARD
WOH cover
Compare it
against last
cycle’s situation
Change values &
simulate here
C

IDENTIFY ROOT-CAUSE & USE PROCESS PLAYBOOK
Click to know why
deviation in WOH
Action: Defer
promotion
A

SUPPLY PLANNING
Review BOHEdit MOQ, LT,
EOQ etc
P
EXECUTIVE REPORTS

REVENUE C
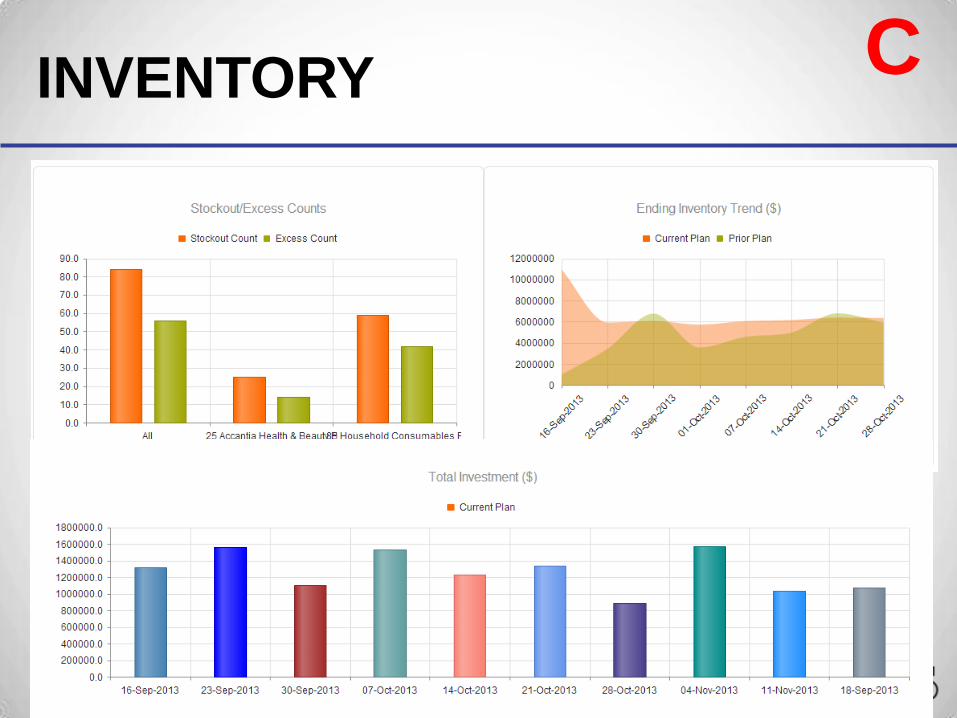
INVENTORY C

FINANCIAL C

SEGMENTATION C
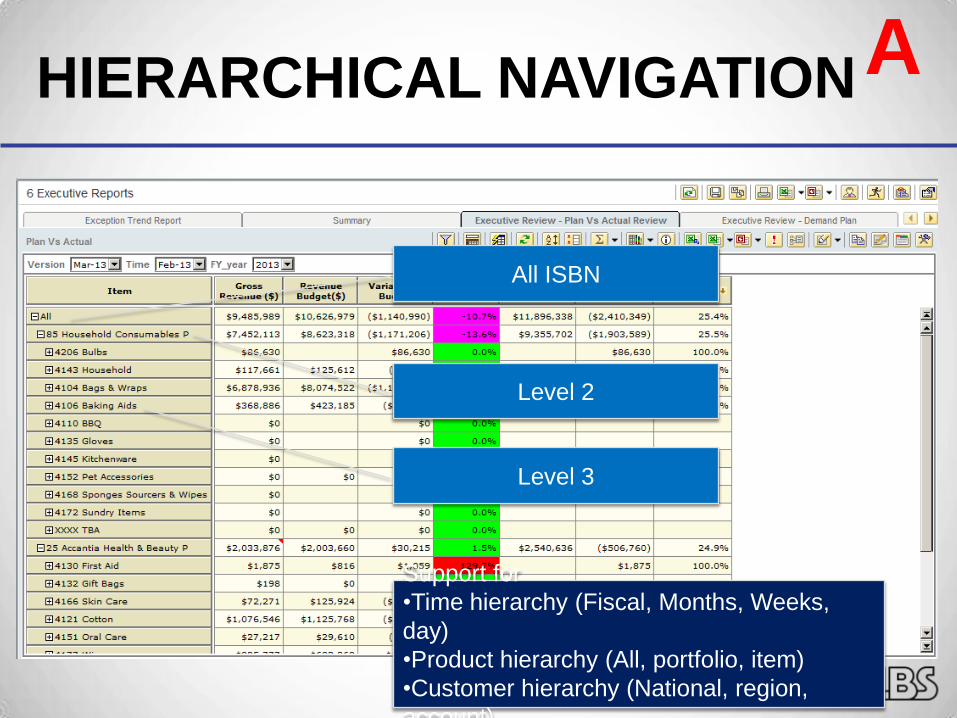
HIERARCHICAL NAVIGATION
All ISBN
Level 2
Level 3
Support for
•Time hierarchy (Fiscal, Months, Weeks,
day)
•Product hierarchy (All, portfolio, item)
•Customer hierarchy (National, region,
account)
A
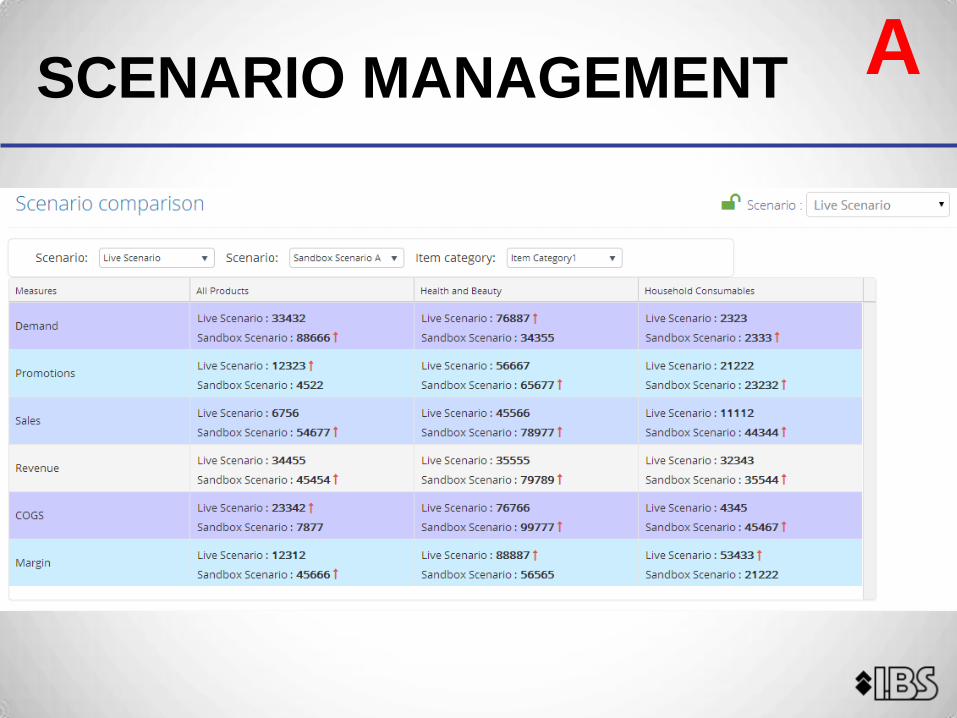
SCENARIO MANAGEMENT A

BUILDING VALUE PROP
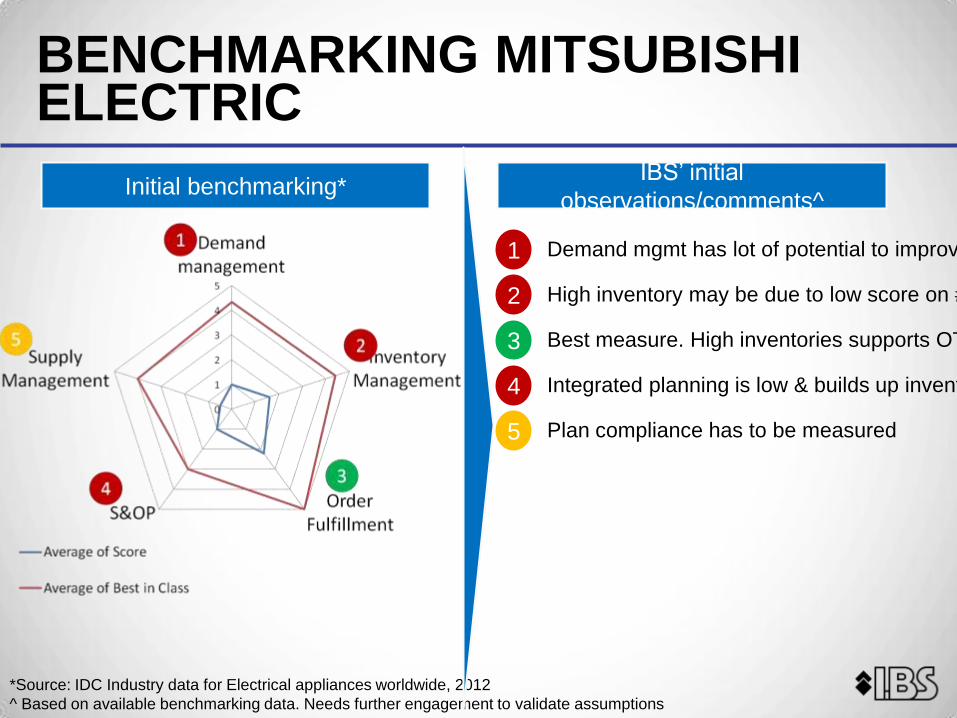
BENCHMARKING MITSUBISHI ELECTRIC
*Source: IDC Industry data for Electrical appliances worldwide, 2012
^ Based on available benchmarking data. Needs further engagement to validate assumptions
1 Demand mgmt has lot of potential to improve
2 High inventory may be due to low score on #1
3 Best measure. High inventories supports OTIF
4 Integrated planning is low & builds up inventory
5 Plan compliance has to be measured
IBS’ initial
observations/comments^Initial benchmarking*

VALUE PROPOSITION
Based on our experience, we estimate a range of value** that can be created and
captured at Mitsubishi to achieve the benchmarking objectives by using our global
network of experts, industry knowledge and proprietary tools.
**Based on available high level data. Needs further engagement to validate assumptions. See Appendix A for input
details
Value Drivers Low Medium High
One Time Value
Inventory Reduction $3,500,000.00 $6,000,000.00 $7,500,000.00
F&E Investment Reduction $0.00 $0.00 $0.00
Improve Margin Rate
Lower Cost of Goods Sold $3,500,000.00 $5,250,000.00 $8,750,000.00
Inventory Write-Off $225,000.00 $255,000.00 $300,000.00
Reduce Expenses
Inventory Carrying Costs $350,000.00 $600,000.00 $750,000.00
Expedited Freight Expense $0.00 $0.00 $0.00
SG&A Expense $0.00 $0.00 $0.00
Recurring Savings (1 year) $4,075,000.00 $6,105,000.00 $9,800,000.00
Recurring Savings (5 years) $20,375,000.00 $30,525,000.00 $49,000,000.00
One-Time Savings $3,500,000.00 $6,000,000.00 $7,500,000.00
IBS VALUE ASSESSMENT

Detailed report
Business case
Detailed report
Business case
AS-IS / TO-BE
VA report
1. Cost build up
2. 3 years of invoices/real demand
3. Closing inventory
4. Lead time
ERP integration
Full system
availability
Continuous
improvement
and monitoring
IBS METHODOLOGY FOR UNLOCKING VALUE
Congratulations!
You have
already
completed this.
Detailed
discovery with
stakeholders
and detailed
assessment of
potential
Now, you can
play with our
processes/syste
ms and YOUR
data
Further unlock
value by rolling
out the test drive
system to entire
corporation
Continuous
improvement
and monitoring
1 week 1 week 2-3 weeks 4-6 weeks On going

APPENDIX – A

MITSUBISHI VA SURVEY
RESPONSES

MITSUBISHI VA SURVEY
RESPONSES
Current Inventory $50,000,000.0
Inventory Carrying Costs 10%
Revenue $200,000,000
Gross Margin Rate 12.5%
COGS $175,000,000
Inventory Turns 3.5
SG&A Expense as a % to Sales 0.00%
Expedited Freight Expense as a % to Sales0.00%
Inventory Write-Off as a % to Inventory 3.0%
FINANCIAL METRICS
WE TAKE PROSPECT’S DATA
Current Inventory $50,000,000.0
Inventory Carrying Costs 10%
Revenue $200,000,000
Gross Margin Rate 12.5%
COGS $175,000,000
Inventory Turns 3.5
SG&A Expense as a % to Sales 0.00%
Expedited Freight Expense as a % to Sales0.00%
Inventory Write-Off as a % to Inventory 3.0%
FINANCIAL METRICS A representative sample of SKUs
Fast movers, medium movers, slow movers
For each SKU
Average forecast error
Lead time fence
MOQ
Incremental order qty
ITEM Period1 Period2 Period3 Period4 Period5 Period6 Period7 Period8 Period9 Period10 Period11 Period12
Starting Inventory 966 -351 1640 734 515 -372 458 394 333 115 235 409
Production/Purchasing 2940 420 2100 840 1260 840 1260 1260 1260
Sales 1317 949 906 219 1307 1270 904 1321 1058 1140 1086 1669
Ending Inventory -351 1640 734 515 -372 458 394 333 115 235 409 0
Cost of goods sold 13,170.00$ 9,490.00$ 9,060.00$ 2,190.00$ 13,070.00$ 12,700.00$ 9,040.00$ 13,210.00$ 10,580.00$ 11,400.00$ 10,860.00$ 16,690.00$
Revenue 15,804.00$ 11,388.00$ 10,872.00$ 2,628.00$ 15,684.00$ 15,240.00$ 10,848.00$ 15,852.00$ 12,696.00$ 13,680.00$ 13,032.00$ 20,028.00$

ADMINISTER ONLINE SURVEY
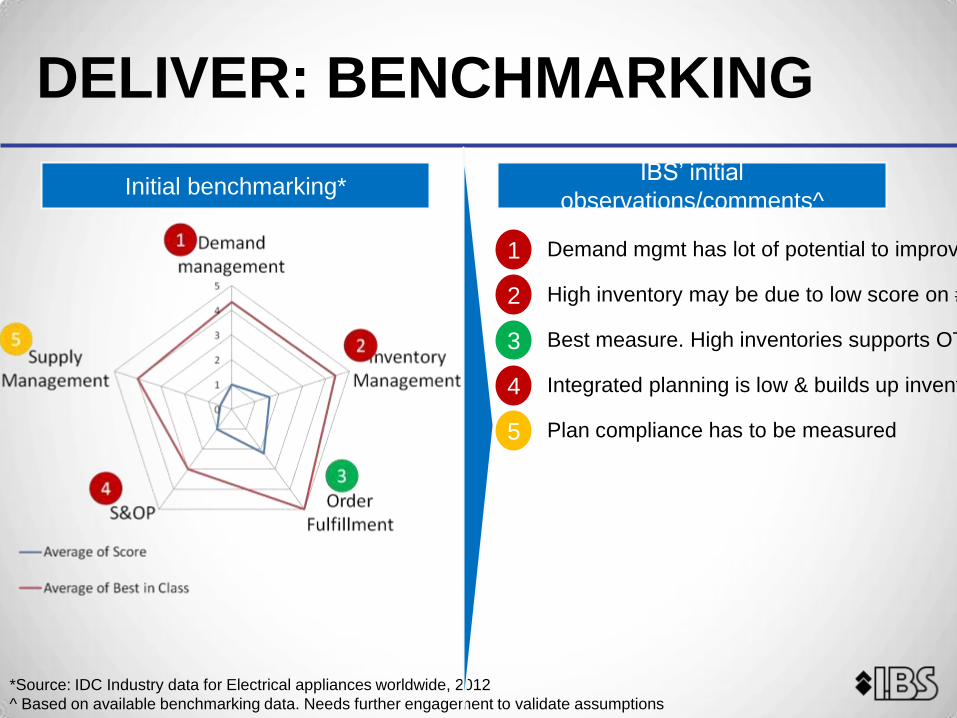
DELIVER: BENCHMARKING
*Source: IDC Industry data for Electrical appliances worldwide, 2012
^ Based on available benchmarking data. Needs further engagement to validate assumptions
IBS’ initial
observations/comments^Initial benchmarking*
1 Demand mgmt has lot of potential to improve
2 High inventory may be due to low score on #1
3 Best measure. High inventories supports OTIF
4 Integrated planning is low & builds up inventory
5 Plan compliance has to be measured

DELIVER: VALUE PROPOSITION
Based on our experience, we estimate a range of value** that can be created and
captured at Mitsubishi to achieve the benchmarking objectives by using our global
network of experts, industry knowledge and proprietary tools.
**Based on available high level data. Needs further engagement to validate assumptions. See Appendix A for input
details
Value Drivers Low Medium High
One Time Value
Inventory Reduction $3,500,000.00 $6,000,000.00 $7,500,000.00
F&E Investment Reduction $0.00 $0.00 $0.00
Improve Margin Rate
Lower Cost of Goods Sold $3,500,000.00 $5,250,000.00 $8,750,000.00
Inventory Write-Off $225,000.00 $255,000.00 $300,000.00
Reduce Expenses
Inventory Carrying Costs $350,000.00 $600,000.00 $750,000.00
Expedited Freight Expense $0.00 $0.00 $0.00
SG&A Expense $0.00 $0.00 $0.00
Recurring Savings (1 year) $4,075,000.00 $6,105,000.00 $9,800,000.00
Recurring Savings (5 years) $20,375,000.00 $30,525,000.00 $49,000,000.00
One-Time Savings $3,500,000.00 $6,000,000.00 $7,500,000.00
IBS VALUE ASSESSMENT

MTNA CASE-STUDY: LINKSYS
Functional silo’s working from their own set of numbers
Higher than desired inventory cost fueled by high safety stock holding
Higher than desired COGS caused by unpredictability to suppliers
Poor forecast accuracy scores across the board
Business Challenges:Quick Company Facts:
Division of Cisco Systems, Inc.
Over $1B Revenues
Global sales in over 100+ countries
High-Volume business
MAKEThe Numbers™
MAKEThe Numbers™
MAKE Don’t Chase the Numbers!

MTNA CASE-STUDY: LINKSYS
Quick Company Facts:
Division of Cisco Systems, Inc.
Over $1B Revenues
Global sales in over 100+ countries
High-Volume business
MAKEThe Numbers™
MAKEThe Numbers™
MAKE Don’t Chase the Numbers!
Revenue up 1-2%
Customer Inventory reduction of 30%
Linksys inventory reduction of 35%
Global order backlog reduced 60%
Expediting reduced from 35% to 3%
SKU level forecast accuracy from 30% to 71%
Supplier fill rate increased from 65% to 95%
Business Results:

THANK YOU
Related Documents