LEARNING DYNAMICS simulation centred learning Developed and run by universities business challenge IBM UNIVERSITIES BUSINESS CHALLENGE Regional semi-finals sponsored by: Lead sponsor: PARTICIPANT’S MANUAL CLICK HERE TO ENTER © Copyright Learning Dynamics 1998 – 2006. All rights reserved. Printing of copies permitted for IBM UBC participants only

Welcome message from author
This document is posted to help you gain knowledge. Please leave a comment to let me know what you think about it! Share it to your friends and learn new things together.
Transcript

LEARNINGDYNAMICSsimulation centred learning
Developed and run by
universities business
c h a l l e n g e
IBM UNIVERSITIES BUSINESS CHALLENGE
Regional semi-finals sponsored by:
Lead sponsor:
PARTICIPANT’S MANUAL
CLICK HERE TO ENTER
© Copyright Learning Dynamics 1998 – 2006. All rights reserved. Printing of copies permitted for IBM UBC participants only

The views of previous IBM Universities
Business Challenge Participants:
“The Universities Business Challenge is an outstanding experience, combining the pressure of working under time constraints while harnessing the strengths of all the team-members to make an efficient group. It is an excellent point on a CV and I have found it a useful talking point at interviews. I wouldthoroughly recommend it to everyone”. Cambridge University, Cambridge Futures Industrial Society
“The Business Challenge is an excellent chance to experience the highs and lows of team work and to learn how to manage a successful company”. Durham University
“I really enjoyed working on the IBM UBC. It helped me put a lot of the business theory I was learninginto practice, and it's a good thing to have on your CV as well. I would definitely recommend it to otherbusiness students”. Oxford Brookes University
“I think it was good practice, actually trying to put some of the theory learnt from business courses into practical use. I also think it was good working in teams and making decisions together. People should enter if they would like some more practical style experience”. Birmingham University
“The challenge is an all-round excellent experience. It's been extremely useful for gaining a clearerunderstanding of the key elements of running a business and particularly helpful for getting to grips withfinancial information, an area I've always been intimidated by previously. It has also been very rewarding on a personal level, through working within a great team and the excitement of getting good results. Iwould definitely recommend it to anybody with an interest in fun and business”. Lancaster University
“I think that the IBM UBC is great because it is the closest thing to gaining real experience in operationaland strategic corporate management. I gained more insight into the complexities of competitivemanagement, a better team working ability and improved time management skills”. Sheffield University
“We really enjoyed the UBC and found that it gave us a deeper insight into the workings of a business by allowing us to apply out learnt theories, while also learning the market responsiveness of our decisions.We found it great fun and also helped us bond together as a team”. Bournemouth University
IBM UNIVERSITIES BUSINESS CHALLENGE | PARTICIPANT’S MANUAL
©C
opyr
ight
Lea
rnin
g D
ynam
ics
1998
–20
06

CONTENTS
Views of previous participants
Section 1 Introduction 3
Section 2 Production 8
Section 3 Production and Stock Costs 14
Section 4 Markets and Marketing 17
Section 5 Miscellaneous Costs 24
Section 6 Taxation 26
Section 7 Debtors, Creditors, Cash and Loans 27
Section 8 Cash Available and Cash Allocations 29
Section 9 The Decision Form 32
Section 10 The Management Report 36
Section 11 Special Play Decisions 44
Appendix A Economic & Marketplace Scenario’s 47
Appendix B The Decision Form 48
Appendix C The Company Management Report 49
Appendix D The Company Management Report Comments 53
Index 56
Contact information 58
Click on the contents link
to go directly to that section
of this manual
©C
opyr
ight
Lea
rnin
g D
ynam
ics
1998
–20
06
IBM UNIVERSITIES BUSINESS CHALLENGE | PARTICIPANT’S MANUAL

3
Welcome to the IBM Universities Business Challenge. Over the
following pages of this Participant’s Manual we will take you through
the essential elements and nice-to-know aspects that will hopefully
help you to take part successfully in this business challenge.
This Section will explain the basic framework and objectives of the
competition.We will then move on in subsequent Sections to detail
specific requirements and provide guidelines that should assist you
in making your business decisions and running your new Company!
So what is it all about?
Who are you?A fundamental question indeed! In this context however, you
and your team members are a team of business consultants who
have been employed to improve the business performance of
a medium-sized business.
What do you have to do?For the duration of this business challenge you and your team
members will work together, making the key decisions which
ultimately will determine the success of the business.You will
work in an existing company, with a reputation in the marketplace,
a workforce, manufacturing facilities, suppliers and an outstanding
bank loan amongst other things!
The decisions that you will be making throughout the competition
will require you to balance management controls, such as cost
reduction, with more creative investment decisions, perhaps in product
development or marketing activities.
Section 1 | Introduction
©C
opyr
ight
Lea
rnin
g D
ynam
ics
1998
–20
06
team members are a team of business consultants who have been
employed to improve the business performance of a medium-sized business
IBM UNIVERSITIES BUSINESS CHALLENGE | PARTICIPANT’S MANUAL

4
IBM UNIVERSITIES BUSINESS CHALLENGE | PARTICIPANT’S MANUAL
You will need to keep your customers happy by fulfilling their
orders and to do that you will need to ensure that you have
the correct levels of resources to make and pay for your
production requirements.
You may also find that your suppliers are not always as
co-operative as you would wish and there is always the
matter of the Bank Manager to deal with!
What are your objectives?There are two possible answers to this question. Firstly, from
the perspective of a team entering the IBM Universities Business
Challenge, there are probably a number of reasons why you may
have entered the competition. From increasing your own business
and commercial awareness to building a cross-functional team or it
may be that you want to improve your employability skills.Whatever
the reasons, we are sure that throughout the challenge you and your
team members will learn a great deal about the vagaries of business
life, will undoubtedly learn a great deal about each other and,
hopefully, you will all have a great deal of fun along the way!
The second answer relates to your team objectives resulting from
your newly acquired management responsibilities!
The task has been clearly set down by the Chairman of your
Company – “ Manage the business effectively, to the satisfaction of
all the stakeholders.” This will require you to establish a strategy
for your Company at the same time as coping with short-term
tactical pressures in your marketplace and the economy in general.
Ultimately, you must ensure that you satisfy your customers and
motivate your employees and by the way, the Chairman would also
like to see an increase in the profits – to an all-time high! Plans
for the future flotation of the Company depend on it!
©C
opyr
ight
Lea
rnin
g D
ynam
ics
1998
–20
06

5
What will everyone else be doing?Very much the same as you! All the teams within the competition
will be operating their own companies making the same types of
decisions based on exactly the same start position as you.You will
compete against all the other companies in your group, forming a
team interactive marketplace.You will not be pitting your wits
against a computer but against other university teams!
Each company will manufacture the same two products and endeavor
to sell them into a number of markets over a pre-determined set
of ‘Trading Periods’.The number of ‘Trading Periods’ in the Round
will be announced separately.
All the companies may be making the same categories of trading
decisions but you will all very probably have different strategies at
different times during the competition.These strategies may or may
not influence the content and direction of your decisions but it will
be up to your team to decide whether or not to pile ’em high and
sell ’em cheap, expand your manufacturing facilities, pay off the bank
loan or pour your cash into differentiators such as marketing or
product development.
Whatever your team strategy each set of trading decisions that you
submit will be equivalent to approximately six months in the life of
your Company, so you will have plenty of time to make or break it!
How does it all work?At the start of the Round your team will be allocated a unique
Game Code and Company Number.These will be used to identify
your team throughout the Round.
You may also wish to assume a team identity in your new role and
you will therefore be able to choose an appropriate Team Name.
A ‘Start Position’ will be issued to you detailing the status of various
functional aspects of the Company you are inheriting. For example,
previous selling prices will be highlighted, stocks of materials, current
production capacities, your financial position in terms of Profit and
Loss and any marketing, product development or cost reduction
investments that have been made.
IBM UNIVERSITIES BUSINESS CHALLENGE | PARTICIPANT’S MANUAL
©C
opyr
ight
Lea
rnin
g D
ynam
ics
1998
–20
06
Whatever your team strategy
each set of trading decisions that
you submit will be equivalent to
approximately six months in the
life of your Company, so you will
have plenty of time to make or
break it!

6
In Appendix B of this Manual you will find the Decision Form that
you will be required to submit to the IBM UBC Team in accordance
with a strict timetable.
Full details of how to complete the form are included in Section 9.
The length of time your team take in reaching your decisions is
entirely up to you. Feedback from previous participants indicates a
range between 30 minutes to half a day for fax, e-mail or internet
challenges.This is obviously different for ‘live’ events, where each
decision period is strictly timed.
At the beginning of a Round a set of ‘Trial Decisions’ will be
introduced just to get you used to the various guidelines, the
sensitivities of the market or even your fellow competitors’ ‘apparent’
strategies.The trials are purely for practice and the results are not
included as part of the competition.
Once your Decision Form is submitted, whether for a trial or a real
set of decisions, a Management Report will be generated for your
Company and this will form the basis of your next set of decisions.
Remembering that each set of Decisions is equivalent to six
months there are bound to be changes in your various markets and
the general economy during that time.To keep you up to date with
the prevailing climate, Scenario Updates and Newsflashes will be
circulated from time to time to add a further touch of reality. In
addition, the updates may also carry news from your marketeers or
even your bankers, so ignore them at your peril! Examples of the
possible content of the Scenario Updates and Newsflashes are
included in the back of the Manual in Appendix A.
From time to time the balance sheets for all the companies in your
marketplace will be issued or available for purchase so you will be
able to see how you are measuring up to the competition.
Sheffield Hallam University, finalists 2006
©C
opyr
ight
Lea
rnin
g D
ynam
ics
1998
–20
06IBM UNIVERSITIES BUSINESS CHALLENGE | PARTICIPANT’S MANUAL

7
So who wins?Well, certainly the Profit figure as reported in your final Trading
Period’s Profit and Loss Account will be a major factor in the
adjudication of the winning team. However, the ultimate winners
will be the team that has lived up to the task set down by the
Chairman, this may be, customer satisfaction, share price as well
as the best bottom-line results.
Full details of the final adjudication will be supplied to you at
the start of the competition.
IBM UNIVERSITIES BUSINESS CHALLENGE | PARTICIPANT’S MANUAL
©C
opyr
ight
Lea
rnin
g D
ynam
ics
1998
–20
06

8
IntroductionThe Company that you have just taken over manufactures two
products – Product ‘Alpha’ and Product ‘Delta’.
Both products are similar in design and production
methods and therefore use the same :
• PLANT (machinery and manufacturing facilities)
• LABOUR (the workforce directly employed in producing
the products)
• MATERIALS (raw and processed materials, components
or assemblies)
Plant and Manufacturing Capacity At the start of your first Trading Period your Company has a total
manufacturing capability of 550,000 CAPACITY UNITS from
55 sets of PLANT – (each with 10,000 capacity units).
Naturally, after a period of time, each set of Plant suffers wear and
tear and is unable to maintain acceptable tolerances to produce your
usual quality of products. It is therefore scrapped.This will occur after
the Plant has been in use for 10 Trading Periods.
The cost of dismantling and removing the Plant is only just covered
by the scrap value you receive and therefore, there is no residual
value. In addition, unfortunately, there is no market for second-hand
Plant in your industry.
Obviously, your predecessors had been acquiring Plant over previous
years and Table 1.1 overleaf indicates the timetable for scrapping Plant
from your Company.
However, to ensure that your production capacity doesn’t dwindle
to nothing, provided you can afford it, you are able to buy new Plant.
Sets of new Plant with 10,000 capacity units each will cost you
£65,000. Only whole 10,000 sets may be purchased and the payment
must be paid in the Trading Period in which the order for the Plant
is placed.
Be careful however, although you have paid upfront for the new
Plant, it will only be delivered and ready for use in the following
Trading Period.
Section 2 | Production
At the start of your first Trading
Period your Company has a total
manufacturing capability of
550,000 CAPACITY UNITS from
55 sets of PLANT – (each with
10,000 capacity units).
©C
opyr
ight
Lea
rnin
g D
ynam
ics
1998
–20
06IBM UNIVERSITIES BUSINESS CHALLENGE | PARTICIPANT’S MANUAL

9
Depreciation on the new machinery and facilities will also only be charged
from the start of the next Trading Period when the Plant has been
installed and the new production capacity is available for you to use.
Depreciation at the rate of 10% of the original cost of the Plant is
charged each Trading Period (for 10 Trading Periods) so that the book
value of the Plant is NIL when it is scrapped.
Excess Plant can also be permanently decommissioned.This means
that the Plant is taken out of use, thus reducing the Fixed Production
Costs for the subsequent Trading Periods. However, once
decommissioned the Plant cannot be used again.The Book Value of
the Plant remains unchanged and is written off in the usual way.
(This action can be achieved by indicating the number of Plant that you wish to be
decommissioned in the appropriate box on the Decision Form Each set of Plant to
be decommissioned will have a capacity of 10,000 Units therefore indicating – 010
on Line L of the Decision Form will decommission 10 Plant – 100,000 Capacity
Units, – 020 will decommission 20 Plant – 200,000 capacity Units etc).
Installed Plant Table 1.1
Note: Plant is scrapped at the end of even-numbered Trading Periods.
Trading Period NoCapacity at
Start of TradingPeriod
Book Value at Start of Trading
Period
Depreciation for the
Trading Period
Book Value at End of
Trading Period
Capacity at End of Trading Period
1 550,000 2,535,000 357,500 2,177,500 550,000
2 550,000 2,177,500 357,500 1,820,000 500,000
3 500,000 1,820,000 325,000 1,495,000 500,000
4 500,000 1,495,000 325,000 1,170,000 400,000
5 400,000 1,170,000 260,000 910,000 400,000
6 400,000 910,000 260,000 650,000 300,000
7 300,000 650,000 195,000 455,000 300,000
8 300,000 455,000 195,000 260,000 200,000
9 200,000 260,000 130,000 130,000 200,000
10 200,000 130,000 130,000 nil nil
IBM UNIVERSITIES BUSINESS CHALLENGE | PARTICIPANT’S MANUAL
©C
opyr
ight
Lea
rnin
g D
ynam
ics
1998
–20
06

10
LabourHistorically, your directly employed workforce has always been up
to the task of producing your products in terms of both availability
and skills.
Regardless of the Capacity Units available at your factory and
irrespective of the products being produced your employees have
served you loyally and produced quality products. It is hoped that
this fortunate situation will continue under your management!
MaterialsAll of the raw and processed materials, component parts and
sub-assembled units for your products are grouped together and
categorised as Materials Units
• Production of each Product Alpha requires one Materials Unit
• Production of each Product Delta requires two Materials Units
Your requirements for materials will obviously fluctuate throughout
the Trading Periods and you will be able to purchase new Materials
Units in multiples of 1,000.The price for the Materials Units for
the following Trading Periods will be indicated within the Company
Management Report you will receive and any Economic or
Marketplace Newsflashes that are issued.
Unfortunately, your predecessors were less than reliable in their
payments to their material suppliers and therefore payment for
Materials Units must be made in the Trading Period in which the
units are ordered!
Even more unfortunately, you have a monopoly materials supplier
at the moment and customer care does not feature high on his list
of priorities. He can only guarantee to supply 75% of the Materials
Units that you order in the next Trading Period.Whilst you will
receive the remaining 25% at some time you will need to remember
this when calculating what level of Materials Units you need to order.
You will also need to take into account that you may be carrying
stocks of Materials Units.
©C
opyr
ight
Lea
rnin
g D
ynam
ics
1998
–20
06
University of Manchester, winners in 2006
IBM UNIVERSITIES BUSINESS CHALLENGE | PARTICIPANT’S MANUAL

11
Quantity of Products ProducedHow much your Company produces of Product Alpha and
Product Delta in any particular Trading Period is your management
decision in line with your strategy. However, you are subject to
the following constraints:
• One Capacity Unit, one Labour Unit and one Materials Unit
are required to produce one Product Alpha.
• Two Capacity Units, two Labour Units and two Materials Units
are required to produce one Product Delta.
• Both products are made in batches of 1,000 saleable products
and currently rejects are not a problem for your Company.
• Any quantity of either Product may be manufactured in multiples
of 1,000 up to the limit of your Company’s Capacity Units available
and Materials Units limit.
• Production in any Trading Period is limited to a maximum requirement
for Materials Units equal to the ‘Stock of Materials Brought Forward’
(indicated in your Management Report) at the beginning of the
Trading Period plus the 75% of the Materials Units purchased in the
same Trading Period (to the nearest 1,000 rounded down).
• Production of your Delta Product will always be given priority
and therefore the Capacity Units and Materials Units will be
allocated to make Product Delta first. Only the balance of Capacity
Units and Materials Units will be subsequently allocated to
manufacture Product Alpha.
Product Development InvestmentsDepending on your cash flow situation and your strategy,
you may wish to invest cash in any Trading Period for Product
Development purposes. By allocating monetary resources to
such initiatives you may be able to make both Product Alpha
and Delta more attractive to their markets.
IBM UNIVERSITIES BUSINESS CHALLENGE | PARTICIPANT’S MANUAL
©C
opyr
ight
Lea
rnin
g D
ynam
ics
1998
–20
06
The result of a successful Product Development initiative will be to cause
your Company’s share of the ‘Total Market for the Product’ to be greater
than it would otherwise have been.
12
The result of a successful Product Development initiative will be to
cause your Company’s share of the ‘Total Market for the Product’
(indicated in your Company Management Report) to be greater
than it would otherwise have been.
However, it is worth noting the following:
• Success is not 100% guaranteed in each Trading Period. Investments
in Product Development do not always produce the benefits
envisaged and there is an amount of uncertainty in initiatives of
such a nature.
• While Product Development rewards will be a random factor it
will be the same for all Companies in the marketplace.
• The benefits achieved, if any, in the Trading Period will be
determined by two principal factors:
1) How much you have invested in the Trading Period
2) Average investment made to date
• The benefit will be expressed as a % for each Product.
• The % increase, if any, in attractiveness of your Products to the
Market will be added to any achieved in previous Trading Periods
and the cumulative total % to be applied to the next Trading period
will be indicated in your Company Management Report.
• If and when your Products reach between 10%–14% your Company
will achieve a ‘Super-Product’ status and the % achieved will be reset
to 15%.
• If further investments raise the % achieved to between 25% –34%a further ‘Super-Plus Product’ status will be reached and the %
achieved will be set to 35%
It goes without saying, that despite the random nature of the benefits,
if you make no investments in Product Development within a Trading
Period – no extra benefit whatsoever will be achieved by your
Company in that Trading Period.
Product ImageThis factor relates to your Company’s competence at matching its
production and marketing effort and it will be further explained in
Section 4 of the Manual regarding Markets and Marketing.This is
very important and has some major implications so watch
out for it!
©C
opyr
ight
Lea
rnin
g D
ynam
ics
1998
–20
06IBM UNIVERSITIES BUSINESS CHALLENGE | PARTICIPANT’S MANUAL
13
Sequence of SupplyThe Products that are available from your factory will be used
to meet orders in the following sequence: (See Section 4, Markets
and Marketing, for a full explanation of the markets into which
your Company is selling).
1. Contract Orders
2. Industrial Market Orders
3. Wholesale Orders
4. Additional Sales Orders – Industrial Market
5. Additional Sales Orders – Wholesalers
IBM UNIVERSITIES BUSINESS CHALLENGE | PARTICIPANT’S MANUAL
©C
opyr
ight
Lea
rnin
g D
ynam
ics
1998
–20
06

14
LabourThe cost per Unit of Labour for the employees in your factory
will be indicated in your Company Management Report under ‘Data
for Next Trading Period’.You will then be able to calculate, depending
on your production requirements, how much Labour you will need
Remember: It takes two units of Labour to make one
Product Delta and only one to make Product Alpha.
MaterialsAs with the Labour costs, the Materials Units buying price for the
next Trading period will be indicated in your Company Management
Report.
Materials Units used will be valued at the average price of stocks
brought forward plus purchases in the discrete Trading Period.
• The Materials Unit cost for Product Alpha will be the value of one
Materials Unit.
• For Product Delta the value will be two Materials Units.
Fixed CostsProduction Fixed Costs include such items as Rates, Rent etc and are
dependent on total capacity.They are written-off in the Profit and Loss
(P&L) Account for the Trading Period in which they were incurred.
For a given capacity these costs remain the same, irrespective of the
quantities actually produced, including zero production.
Section 3 | Production and Stock costs
©C
opyr
ight
Lea
rnin
g D
ynam
ics
1998
–20
06IBM UNIVERSITIES BUSINESS CHALLENGE | PARTICIPANT’S MANUAL

15
The Production Fixed Costs for the Trading Period will be calculated in
the following way:
The Fixed Costs of Production per Unit of capacity (C)multiplied by Total Capacity (X) for that Trading Period.
(C) will be calculated as follows:
C = 8 + (350,000 - X) / 100,000
Minimum value of C = 5.5
Variable CostsThe Unit Variable Cost of each Product in any Trading Period is
the sum of the Unit Labour Cost and the Unit Materials Cost (as
described overleaf) and the quantities produced will be transferred
to ‘Finished Goods Stock’ at this value.
Finished Goods Stock and Costs of Goods SoldEach Trading Period, the quantities of each Product produced will be
transferred to ‘Finished Goods Stock’ valued at Unit Variable Cost (as
described above).These quantities and values will be added to those
brought forward from the previous Trading Period and new average
values will be calculated to give the unit rate for charging to cost of
‘Goods Sold’ in the Profit and Loss Account. Full details will be
indicated in your Company Management Report.
Plant DepreciationAs explained in Section 2, depreciation at the rate of 10% of the
original cost of the Plant is charged in each Trading Period for 10Trading Periods.This only starts in the Trading Period when the Plant
capacity is first available and it is shown as a separate item in the
Profit and Loss Account for your Company.
Warehousing There is a fixed cost of £50,000 each Trading Period, plus a
charge of per 100 units of ‘Finished Goods’ and Materials Units
held in stock in your warehouses at the start of the Trading Period.
The cost will be given to you in each scenario update and will change
accordingly during each challenge.You will be notified of all changes.
Cost ReductionAs part of your strategy, or in response to other tactical issues, you
may wish to invest in Cost Reduction projects, in a similar way as
Product Development initiatives. By investing cash, in multiples of£5,000, you may be able to lower your Unit Variable Cost more
than it would otherwise have been.
IBM UNIVERSITIES BUSINESS CHALLENGE | PARTICIPANT’S MANUAL
©C
opyr
ight
Lea
rnin
g D
ynam
ics
1998
–20
06

16
However, such investment is subject to the same vagaries as
Product Development. Nothing is guaranteed! There is often a ceiling
as to how much cost reduction can be achieved by any particular
cost reduction project and therefore a random factor will be used.
The random factor will vary across the Trading Periods but it will
be applied equally to all Companies in the marketplace.
• The % reduction your Company achieves will be dependent upon
two main factors again:
1) How much you invest in the Trading Period
2) The average investment made by your Company to date
• The % cost reduction achieved will be shown in your Company
Management Report
• The % cost reduction achieved will be applied to the ‘Unit Labour
Costs’ and ‘Materials Unit Buying Price’ for the next Trading Period.
This will produce savings on both the Labour and Materials content
of your two Products and will assist your Company in fighting
inflation through the following Trading Periods.
• Only one investment in Cost Reduction is required to cover
both Products.
There are no prizes for forecasting the results if you don‘t make
any investments in Cost Reduction during any Trading Period!
Anglia Ruskin University, second place in 2006
©C
opyr
ight
Lea
rnin
g D
ynam
ics
1998
–20
06
As part of your strategy, or in response to other tactical issues, you may wish to invest in Cost Reduction projects, in a similar way asProduct Development initiatives.
IBM UNIVERSITIES BUSINESS CHALLENGE | PARTICIPANT’S MANUAL

17
MARKETS:
Product AlphaSales of your Product Alpha will hopefully be made into two
specific markets:
• Wholesale
• Industrial
Successful sales into these markets will be indicated in your
Company Management Report as AW and AI. (AW = Product
Alpha into the Wholesale Market and AI = Product Alpha into
the Industrial Market).
Product DeltaSales of your Product Delta will only be made into the Industrial
Market and will therefore be identified in the Company Management
Report as DI. (DI = Product Delta into the Industrial Market).
ContractsIn addition to the usual Markets, now and again, Contracts may be
offered for either or both of your Products. Successful sales in this
area will be referred to as AC and DC. (AC = Product Alpha in the
Contract Market and DC Product Delta in the Contract Market).
The range of Contracts on offer will be indicated in your Company
Management Report relating to the marketplace opportunities for
the next Trading Period or may be highlighted in ad-hoc Economic
or Marketplace Newsflashes.These will detail the actual quantities
of Products for which tenders are invited.
You are under no obligation to go for the Contracts but if you are
planning to tender for a Contract you must take account of the
following factors:
• The tendered price for a Contract must not be greater than your
lowest Selling Price for the same Product in the same Trading
Period. (Tenders breaking this rule will not be considered for the
award of the Contract)
• Contract orders achieved by your Company will be fulfilled by your
manufacturing facilities before any other orders!
Section 4 | Markets and Marketing
University of Lancaster, finalists in 2006
IBM UNIVERSITIES BUSINESS CHALLENGE | PARTICIPANT’S MANUAL
©C
opyr
ight
Lea
rnin
g D
ynam
ics
1998
–20
06

18
• If your Company cannot supply the whole of the Contract then
you will not be awarded any part of it.
• Contracts will be awarded on the basis of the ‘Lowest Contract
Factor’.This is calculated as follows:
CONTRACT FACTOR =
* See later in section for explanation of this crucial factor
• Contracts may be divided between two or more Companies.
• Contract orders are additional to the orders for each of the
Product markets already described.
Marketing InvestmentsIn addition to your Product Development and Cost Reduction
initiatives you are also able to invest cash each Trading Period for a
further competitive differentiator – marketing activities. Such activities
are available for both of your Products in their respective markets:
AW, AI and DI.
These investments affect both the ‘Total Market for the Product’ and
your Company’s share of the Market.
• For Product AI and Product DI 70% of the amount you invest is
effective in the specific Trading Period in which you allocate the
cash, with the remaining 30% taking effect in the following
Trading Period.
• For Product AW, 65% is effective immediately with the 35%balance effective in the next Trading Period.
Your Company may suffer some restrictions on the amounts it
can invest, depending on Company fortunes and of course your
own management strategy, but you must be very careful if you are
considering not investing anything at all into Marketing activities!!
Please Note: A zero marketing spend will usually result in
a zero share of the market – no orders, no sales, no profit!
CONTRACT PRICE
PRODUCT IMAGE *
©C
opyr
ight
Lea
rnin
g D
ynam
ics
1998
–20
06IBM UNIVERSITIES BUSINESS CHALLENGE | PARTICIPANT’S MANUAL

19
In addition, if your Company decides to drop out of one of the
Markets and no orders for a product are made (in AW, AI or DI)
then a re-entry penalty will be levied on any future marketing
investment.This re-entry penalty must be paid before any further
orders for the product can be achieved. If there are no orders in
the next Trading Period, then the penalty will be levied again and
accumulated. Penalties are paid from the relevant Marketing
Investment in the next Trading Period.
All Companies must ensure that the amount is sufficient to cover
the penalty in addition to any marketing investment for that particular
Trading Period. If not, then the investment is lost and a new penalty
is added.There is no carried forward effect from the previous
Trading Period.
The penalties will be as follows:
Any penalty to be paid will be clearly shown in the ‘Data for Next
Trading Period’ section of your Company Management Report.
Marketing Consultancy InvestmentIn addition to your own Marketing efforts within your Company you
may want to invest in the services provided by an external Marketing
Consultancy agency.
Such investment will maximise the effectiveness of your own efforts,
however, the benefits will only be seen in future Trading Periods, rather
than the current Trading Period – when you have to pay for the services!
The maximum investment that is advisable in any one Trading Period
is £50,000. It is certain that any higher amount will not make these
Marketeers work any harder on your behalf! You can of course pay
them more, but rest assured that no further benefits will be accrued
by your Company.
Product Penalty £’s
AW 500,000
AI 200,000
DI 250,000
IBM UNIVERSITIES BUSINESS CHALLENGE | PARTICIPANT’S MANUAL
©C
opyr
ight
Lea
rnin
g D
ynam
ics
1998
–20
06
20
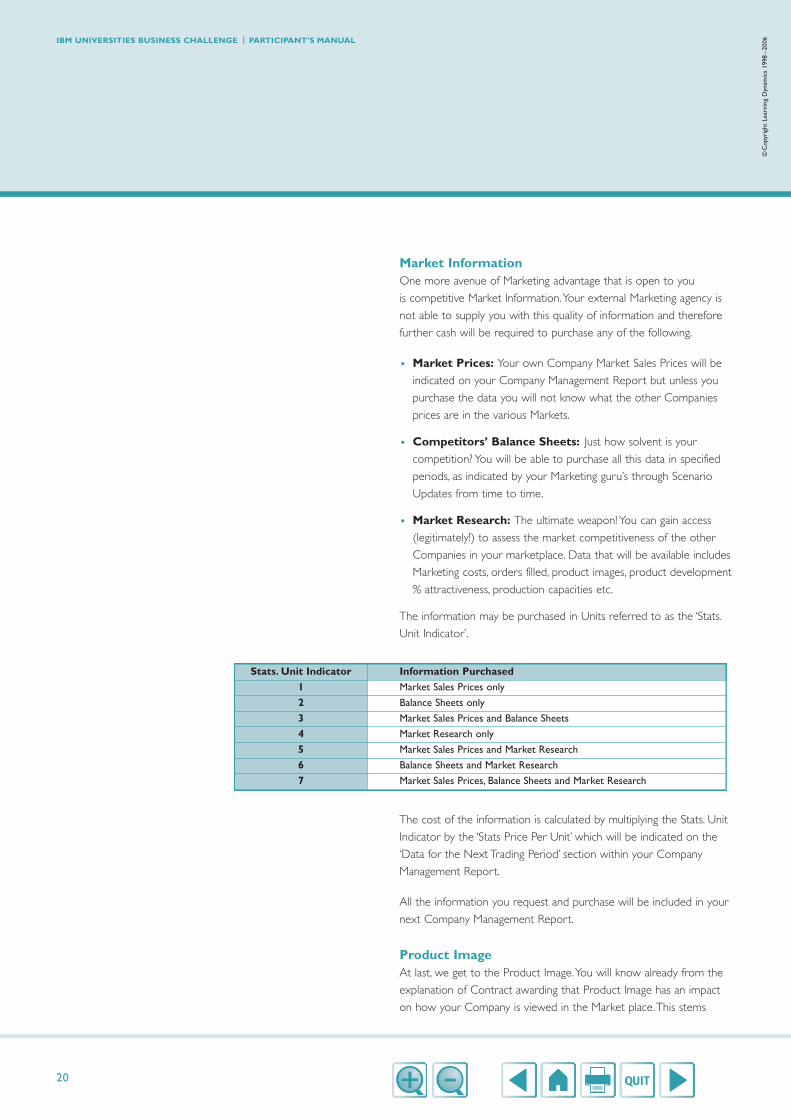
Market InformationOne more avenue of Marketing advantage that is open to you
is competitive Market Information.Your external Marketing agency is
not able to supply you with this quality of information and therefore
further cash will be required to purchase any of the following.
• Market Prices: Your own Company Market Sales Prices will be
indicated on your Company Management Report but unless you
purchase the data you will not know what the other Companies
prices are in the various Markets.
• Competitors’ Balance Sheets: Just how solvent is your
competition? You will be able to purchase all this data in specified
periods, as indicated by your Marketing guru’s through Scenario
Updates from time to time.
• Market Research: The ultimate weapon! You can gain access
(legitimately!) to assess the market competitiveness of the other
Companies in your marketplace. Data that will be available includes
Marketing costs, orders filled, product images, product development
% attractiveness, production capacities etc.
The information may be purchased in Units referred to as the ‘Stats.
Unit Indicator’.
The cost of the information is calculated by multiplying the Stats. Unit
Indicator by the ‘Stats Price Per Unit’ which will be indicated on the
‘Data for the Next Trading Period’ section within your Company
Management Report.
All the information you request and purchase will be included in your
next Company Management Report.
Product ImageAt last, we get to the Product Image.You will know already from the
explanation of Contract awarding that Product Image has an impact
on how your Company is viewed in the Market place.This stems
Stats. Unit Indicator Information Purchased1 Market Sales Prices only
2 Balance Sheets only
3 Market Sales Prices and Balance Sheets
4 Market Research only
5 Market Sales Prices and Market Research
6 Balance Sheets and Market Research
7 Market Sales Prices, Balance Sheets and Market Research
©C
opyr
ight
Lea
rnin
g D
ynam
ics
1998
–20
06IBM UNIVERSITIES BUSINESS CHALLENGE | PARTICIPANT’S MANUAL
21
from your Company’s ability to match production and marketing effort
and therefore your ultimate ability to meet the orders received from
your customers during any Trading Period.
At the end of any Trading Period where a Company fails to fulfill all
the orders it receives for Product Alpha and/or Product Delta, the
Company’s Product Image will be reduced by 0.1. Each Product,
i.e Alpha and Delta, has a separate Product Image.
Your Company will start the first Trading Period with a maximum
1.00 in each Product area. On each occasion your Company fails to
fulfill orders the Product Image for the appropriate Product will be
reduced by 0.1.
However, if your Product Image is already less than 1.00 from a
previous Trading Period, if you fulfill all your orders the Product Image
will increase by 0.1. If you continue to fail to fulfill orders the image
will keep slipping! This will obviously affect your Company’s ability to
trade in the markets.
The Product Image is used as a multiplying factor in the calculation
of the Company’s market shares and therefore, reduction in the
factor will cause a reduction in the share.
Remember also that the factor is used to determine the award
of contracts. A low contract price alone is not enough to win
the business.
The Product Image to be applied to the next Trading Period will
be shown in your Company Management Report.
Orders arising from ‘Additional Sales’, (described later in this
Section), are not taken into account in any calculations relating
to the Product Image.
Market PricesA key feature of your Company strategy will be to decide the
selling prices for your Products. Marketplace data and historical
prices will be provided at the start of a Round when you take
over the Company from your predecessors, but it will be up to
you to agree the future selling price per unit for each of your
Products in their respective markets.
IBM UNIVERSITIES BUSINESS CHALLENGE | PARTICIPANT’S MANUAL
©C
opyr
ight
Lea
rnin
g D
ynam
ics
1998
–20
06
The Product Image is used
as a multiplying factor in the
calculation of the Company’s
market shares and therefore,
reduction in the factor will
cause a reduction in
the share.

22
There are a few guidelines to help in your thought process:
• The selling prices must be a whole number.
• Prices may be changed in each Trading Period.You will be supplied
with information regarding the maximum or minimum change that
the Market will stand, from the price of the same product in the
previous Trading Period e.g. +/- 5.
If you do not enter a price on your Decision Form, or indicate a zero
price, it will be assumed that your Company does not wish to sell a
particular Product in a particular Market for that Trading Period.
Please Note:When and if you re-enter that Product Market, the
maximum/minimum rule will apply based on the last positive price
you indicated on your Decision Form AND don’t forget the Marketing
Investment penalties you will incur for re-entering the market!
• For Product Alpha, the Industrial Market tends to expect a price
approximately 20% less that that quoted for your supply to
Wholesalers. In any case, this price must not be higher than that
for the Wholesale Market. Also remember the restrictions on
your prices for any Contracts you may wish to tender for.
• From time to time economic or marketplace newsflashes may
indicate maximum or minimum price policies etc.
Market SizeThe ‘Total Orders’ for each Product Market will be calculated by
reference to the total of Price/Marketing Factors derived for each
Company from their Price and Marketing Investment.
Demand in each of the Product Markets are bound to be affected
by the economic climate and news of this will be brought to you
by Scenario Updates, in plenty of time for you to consider your
Company strategy and tactical decisions.
Market ShareThe Market Share of each Company in each Product area is
calculated by reference to a ‘Market Share Factor’ for that particular
Product based on the following:
• Price/Marketing Factor adjusted for the effect of any Marketing
Consultancy.
University of Leicester, third place in 2006
©C
opyr
ight
Lea
rnin
g D
ynam
ics
1998
–20
06IBM UNIVERSITIES BUSINESS CHALLENGE | PARTICIPANT’S MANUAL

23
• Price/Marketing/Product Image Competition Factor.This factor
will be assessed by comparing Company performance in Pricing,
Marketing Investment and Product Image in relation to the other
Companies in the same marketplace.
• Product Development investment.
• Product Image.
Additional SalesIf any Company is unable to fulfill all of it’s orders, a proportion
of these surplus orders may be transferred to other Companies in
the Marketplace.
The question of whether or not a Company will receive additional
sales orders will be decided by reference to the Price/Marketing
Factors and any quantity to be transferred will be determined by
reference to the Market Share Factors.
Turn to ‘Sequence of Supply’ at the end of Section 2 to remind
yourselves of the impact of each market on your Production schedule.
University of Southampton, finalists in 2006
IBM UNIVERSITIES BUSINESS CHALLENGE | PARTICIPANT’S MANUAL
©C
opyr
ight
Lea
rnin
g D
ynam
ics
1998
–20
06

24
Any Company must take into account all the costs that will
undoubtedly arise in the day to day running of an efficient operation
and you are no exception.
Detailed below are some of the costs that you must balance at the
same time as managing your market segmentation, production
capacities, materials ordering and investment decisions!
Bank Loan Interest At the start of the first Trading Period you will have inherited a
Bank Loan taken out by the previous Management team.You must
now manage that loan and decide as part of your overall strategy
what needs to be done. As the Trading Periods come and go you
may even find yourself in need of more Bank provided support!
Bank Loan Interest will be charged to your Profit and Loss Account
each Trading Period and will be calculated on the Loan outstanding
at the end of the Trading Period.The appropriate % rate will be
indicated in various financial news updates issued throughout the
Trading Periods.
If you pay off all your bank loan, a Savings Account will be set up,
which will be credited with an interest rate of 2% below the current
rate of interest quoted by the Bank.The interest will be credited to
your Profit & Loss Account as negative Loan Interest.
Bad DebtsIt is a sad fact of everyday business that bad debts may occur and
you will receive periodic updates indicating when Bad Debts need to
be written off by your Company.The % of Debtors to your Company
will be clearly indicated in your start position and scenario updates
and will be charged directly to your Profit and Loss Account.
Section 5 | Miscellaneous Costs
©C
opyr
ight
Lea
rnin
g D
ynam
ics
1998
–20
06
If you pay off all your bank loan,
a Savings Account will be set up,
which will be credited with an
interest rate of 2% below the
current rate of interest quoted
by the Bank
IBM UNIVERSITIES BUSINESS CHALLENGE | PARTICIPANT’S MANUAL

25
AdministrationA necessary evil and unavoidable! The costs of your Company
Administration include your team salaries, company cars and the
Chairman’s HQ costs. All these amount to £700,000 per Trading
Period!.This will be charged to your Profit and Loss Account.
Carriage & PackingThe packing and shipping of your products to your markets will cost
a specific amount, for example £1 per unit of the Product sold and
this will be charged to your Profit and Loss Account.The cost of
carriage and packaging will be notified to you in your scenario updates.
IBM UNIVERSITIES BUSINESS CHALLENGE | PARTICIPANT’S MANUAL
©C
opyr
ight
Lea
rnin
g D
ynam
ics
1998
–20
06
26
Taxation ProvisionProvided your Company is making a profit in the Trading Period a
provision for Taxation will be made.The provision will be based on
the profit you have made in that Trading Period and the % rate will
be indicated via periodic financial updates.
The amount payable will be charged to your Profit and Loss Account
and added to the ‘Taxation Reserve’ shown in your Balance Sheet.
Taxation relief on losses will be allowed only to the extent of
the Taxation Reserve brought forward in your Balance Sheet from
previous Trading Periods. Any amount of Tax on losses in excess of
the Taxation Reserve will be carried forward and offset against Tax
on future profits: they will be shown as a note in your Profit and
Loss Account and will not form part of the Accounts.
Payment of TaxUnfortunately, your Company is not operating in a tax-free haven
and at the end of each financial year, ie Trading Period 2, 4, 6, etc, you
will be advised that Tax is due in your company management report.
Your Taxation Reserve at the end of the previous Trading Period will
be cleared to pay the Tax due.
You must remember to allocate the correct amount due on your
Decision Form.The amount will be equal to your Taxation Reserve.
You will be reminded of the amount to pay in the ‘Data for Next
Period’ in your Company Management Report.
Section 6 | Taxation
©C
opyr
ight
Lea
rnin
g D
ynam
ics
1998
–20
06
Unfortunately, your Company
is not operating in a tax-free
haven and at clearly specified
times indicated in your Company
Management report you will
be advised that Tax is due
IBM UNIVERSITIES BUSINESS CHALLENGE | PARTICIPANT’S MANUAL
27
DebtorsThe Sales Revenue for a Trading Period will be received as ‘cash’ in
the proportion of:
• 75% in the current Trading Period and
• 25% in the next Trading Period
The Debtors carried forward shown in the Balance Sheet, therefore,
will be 25% of the current Trading Period Sales Revenue, unless this
is reduced by any Bad Debt Written Off. If this occurs you will be
advised, in advance, by your Bankers.
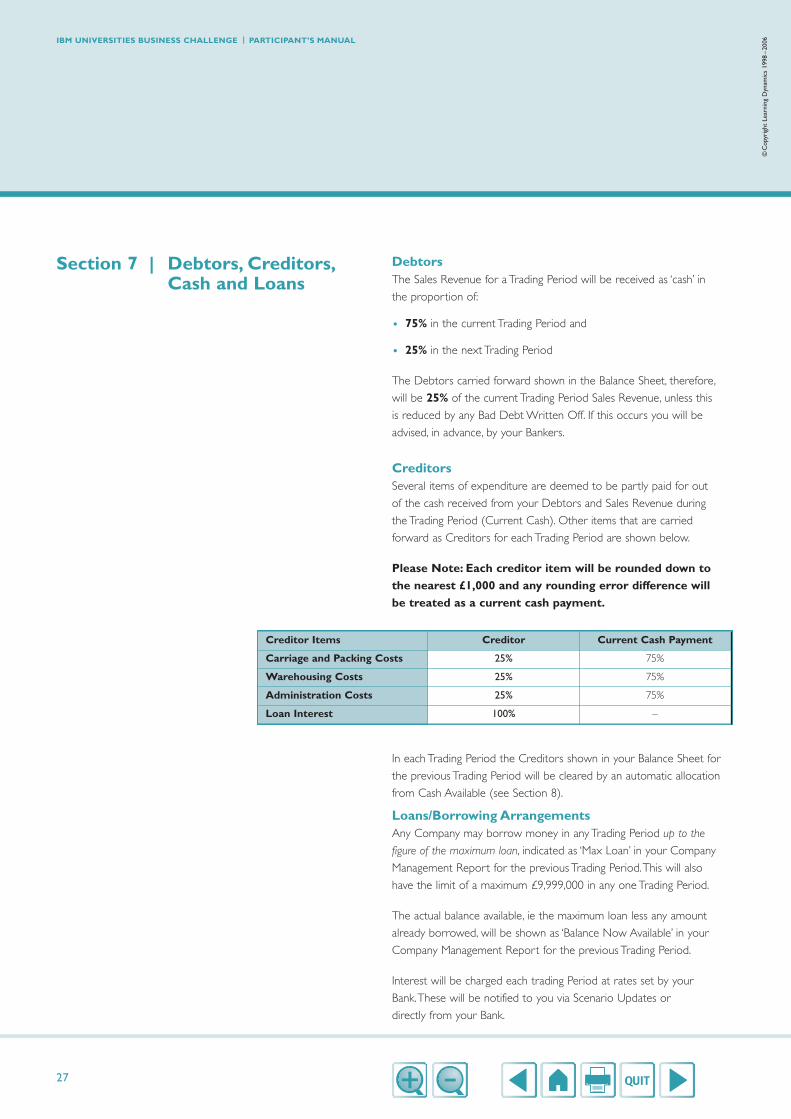
CreditorsSeveral items of expenditure are deemed to be partly paid for out
of the cash received from your Debtors and Sales Revenue during
the Trading Period (Current Cash). Other items that are carried
forward as Creditors for each Trading Period are shown below.
Please Note: Each creditor item will be rounded down tothe nearest £1,000 and any rounding error difference will be treated as a current cash payment.
In each Trading Period the Creditors shown in your Balance Sheet for
the previous Trading Period will be cleared by an automatic allocation
from Cash Available (see Section 8).
Loans/Borrowing ArrangementsAny Company may borrow money in any Trading Period up to the
figure of the maximum loan, indicated as ‘Max Loan’ in your Company
Management Report for the previous Trading Period.This will also
have the limit of a maximum £9,999,000 in any one Trading Period.
The actual balance available, ie the maximum loan less any amount
already borrowed, will be shown as ‘Balance Now Available’ in your
Company Management Report for the previous Trading Period.
Interest will be charged each trading Period at rates set by your
Bank.These will be notified to you via Scenario Updates or
directly from your Bank.
Section 7 | Debtors, Creditors,Cash and Loans
Creditor Items Creditor Current Cash Payment
Carriage and Packing Costs 25% 75%
Warehousing Costs 25% 75%
Administration Costs 25% 75%
Loan Interest 100% –
IBM UNIVERSITIES BUSINESS CHALLENGE | PARTICIPANT’S MANUAL
©C
opyr
ight
Lea
rnin
g D
ynam
ics
1998
–20
06

28
The borrowing limit may also be re-calculated from time to time and
this will also be notified to you.The new limit will be calculated taking
into account the balance sheet position and the economic climate OR
the current loan outstanding, whichever is the greater. Loans will not
be recalled!
If you wish, your Company may repay any amount of your loan in
any Trading Period, but remember:
• the payment must be in £000’s
• it can only be up to a maximum of £9,999,000 in any one Trading
Period and
• any Loan Repayments will be effective from the start of the
Trading Period in which they are made.
Once Loans have been reduced to zero, if your Company decides to
make further Loan repayments a saving account will be set up and the
balance will be shown in your Balance Sheet as a negative figure.
Interest on this negative balance will be credited at rates 2% below
the prevailing bank loan interest rate.
©C
opyr
ight
Lea
rnin
g D
ynam
ics
1998
–20
06
Once Loans have been reduced to zero, if your Company decides to make
further Loan repayments a saving account will be set up and the balance
will be shown in your Balance Sheet as a negative figure.
IBM UNIVERSITIES BUSINESS CHALLENGE | PARTICIPANT’S MANUAL

29
Cash AvailableAt the start of each Trading Period each Company must make
decisions about the allocation of cash resources that are available at
that time.The maximum cash which may be allocated is the sum of
the following items:
1. Cash shown in the Balance Sheet in your Company Management
Report for the previous Trading Period (always rounded down
to the nearest £1,000).
+
2. ‘Loan Applied For’ on the Decision Form, which must not
exceed the ‘Balance Now Available’ indicated in your Company
Management Report for the previous Trading Period (to a
maximum of £9,999,000 in any one Trading Period).
Please Note: Cash you expect to accrue from Debtors
during the coming Trading Period cannot be anticipated
and allocated.
However, payments referred to under ‘Current Cash Payment’ in
the Section 7 Table, are automatically deemed to be paid from this
cash received and any balance will be taken into account in arriving
at the cash in hand at the end of the current Trading Period.
Cash AllocationIn the allocations decided by your Company, as described in Section 9,
there are three ‘automatic’ allocations:
Two of the allocations will occur each Trading Period:
1. The amount of Creditors shown in your Company Management
report for the previous Trading Period.
Section 8 | Cash Available and Cash Allocations
IBM UNIVERSITIES BUSINESS CHALLENGE | PARTICIPANT’S MANUAL
©C
opyr
ight
Lea
rnin
g D
ynam
ics
1998
–20
06

30
2. The amount of Production Fixed Costs shown in your
Company Management Report for the previous Trading Period.
The remaining ‘automatic’ allocation will occur in varying Trading Periods
and will be brought to your attention via Scenario Updates etc.
3. The amount of Taxation Reserve shown in your Company
Management Report for the previous Trading Period.
Please Note:These must be allocated on your Decision
Form. If not, they will be deducted automatically and the
remaining allocations that you have made will be reduced,
as necessary, as detailed below.
Over-Allocation of CashIf your total Cash Allocation exceeds the total of Cash Available
any balance of Bank Loan available, within the borrowing limit (to a
maximum of £9,999,000 in any one Trading Period), will be used to
increase the total of Cash Available to cover your Allocations.
If this happens, there will be no penalty for increases of up to £5,000,
which will cover any shortfall due to ‘rounding’ errors but, if more
than £5,000 extra is required the loan interest rate for the current
Trading Period will be increased by 20%. i.e. if the current loan interest
rate is 5%, the penalty rate will be 6%.This penalty rate will be
charged on the total loan outstanding at the end of the Trading
Period.This can be a very costly mistake! The loan interest rate will,
however, revert to that shown in your latest Scenario Update for the
following Trading Period unless, of course, you make a further over-
allocation exceeding £5,000.
If, after taking up all the loan available, the Cash Allocations still exceed
the Cash Available, the over-allocation will be dealt with by taking the
following actions, in the sequence shown, until the over-allocation is
cleared:
1. If minimum allocations for Marketing are imposed by any Scenario
Update, any cash allocations your Company has made for Marketing
will be reduced to the minimum allowed.
Any allocation for Purchase of Plant, the Marketing Consultancy /
Research Fee and then Cost Reduction will be reduced to zero
until the over-allocation is cleared, if possible.
©C
opyr
ight
Lea
rnin
g D
ynam
ics
1998
–20
06
The winners are congratulated by Larry Hirst, Country General Manager, IBM UK
IBM UNIVERSITIES BUSINESS CHALLENGE | PARTICIPANT’S MANUAL

31
1. Any Cash Allocation for Product Development will be reduced
by 20%.
2. If there are no minimum allocations imposed on Marketing, any
cash allocation for Marketing will be reduced by 20%.
3. Quantities for Production and Purchases of Materials will be
reduced by 20% and Cash Allocations adjusted accordingly.
4. Actions (3), (4) and (5) will be repeated with reductions of 10%
instead of 20%.
5. Actions (3), (4) and (5) will be repeated with reductions of 10%
and any minimum allocation for Marketing regarded as cancelled.
Please Note: Creditors,Tax Payable and Production Fixed
Costs will always be met, in full, even if this results in
‘overdrawing cash’
Cash OverdrawnOverdrawing cash to meet Cash Allocations other than the three
‘automatic’ allocations is not permitted and will be dealt with as
described previously.
However, in the event of a negative Cash Balance arising in the Trading
Period it will be shown as such in the Balance Sheet in your Company
Management Report.
Interest at twice the prevailing Loan Interest Rate will be charged
on the negative balance and added to the normal Loan Interest.
IBM UNIVERSITIES BUSINESS CHALLENGE | PARTICIPANT’S MANUAL
©C
opyr
ight
Lea
rnin
g D
ynam
ics
1998
–20
06

32
A Decision Form must be completed by each Company for each
Trading Period.This Form is then sent via e-mail to Jane Redhead
[email protected] at specified
dates according to the published timetable. Or it can be uploaded via
the website: www.universitiesbusinesschallenge.com
If a Decision Form is not received in time from a Company there is a
facility named ‘Special Play’ that can be invoked. Special Plays are
described fully in Section 11.
An example Decision Form is illustrated in Appendix B.
It would be useful for you to look at the Decision Form in conjunction
with the following notes which explain each line of the Decision Form.
Please Note: Use the symbol 0 to represent zero. If you
wish to show NIL against an item leave the boxes blank.
The top of the Decision Form asks for information regarding you
and your ‘Company Team’ and ensures that we are all dealing with the
correct Trading Period. In addition you will be allocated a Game Code
and Company number as a unique identifier, which will be provided to
you at the start of each Round.
In the area marked TEAM NAME add the name or pseudonym by
which you wish your team to be known!
PERIOD NUMBER refers to the Trading Period for which your
Decisions are to be applicable.The Trading Period numbers will
range from 0 for the Trial Decision then 1, 2, 3 etc through to
the last Trading Period in the Round.
Line A – GAME CODE.This will be two alpha-numeric characters
allocated to you by the Business Simulations Team at the start of
the Round.You will always need to add this information so make
sure you remember it!
Section 9 | The Decision Form
©C
opyr
ight
Lea
rnin
g D
ynam
ics
1998
–20
06
If a Decision Form is not received
in time from a Company there is
a facility named ‘Special Play’
that can be invoked. Special Plays
are described fully in Section 11.
IBM UNIVERSITIES BUSINESS CHALLENGE | PARTICIPANT’S MANUAL
33
Line B – COMPANY NUMBER. As with the Game Code this
number will be allocated to you by the Business Simulations Team
and you will be required to enter it on each Decision Form that
your Company submits.
The above information will correctly identify your Company team
and the Trading Period.The remaining lines of the Decision Form
cover the substance of your strategic and tactical deliberations!
Selling Prices
Lines C1 to C5
Into these boxes you will state the Prices at which you would like
to offer your products for sale. A blank entry against any item will
indicate that you do not wish to sell that product. A blank entry for
Products AC and DC, indicates that you do not wish to be considered
for the award of a Contract(s). Restrictions are described in Section 4.
Production Quantities: (always expressed in 000’s Units)
Lines D1 and D2
These lines are where you indicate the quantity of each product that
you wish to produce during the Trading Period. Limits are described in
Section 2.
Line E
Here you add the quantity of Materials Units you wish to buy during
the Trading Period. Remember that only 75% plus materials carried forward
can be used in the Trading Period. If you wish to use your full capacity you will
need to purchase (capacity – materials carried forward x 4/3)
Cash Allocation: (in £000’s, rounded UP)
Lines F1 and F2
These lines relate to the allocation of cash to cover the direct labour
costs of your production requirements.The Unit Labour Costs are
shown in the ‘Data for Next Trading Period’ in your Company
Management Report for the previous Trading Period.
IBM UNIVERSITIES BUSINESS CHALLENGE | PARTICIPANT’S MANUAL
©C
opyr
ight
Lea
rnin
g D
ynam
ics
1998
–20
06

34
Line G
This line relates to the cash covering the cost of Materials Units
Purchased.The Material Buying Price is shown in your Company
Management Report under the ‘Data for Next Trading Period’ section.
Lines H1 to I12
All cash allocations in this Trading Period relating to Marketing and
Product Development are recorded here. See Section 4 for more
information.
Line J
Cash allocations to cover the cost of any Cost Reduction investments
within the Trading Period are to be added on this line. See Section 3
of the Manual for more information.
Line K1
If you decide to employ Marketing Consultants the cash allocation
to cover their costs must be added here. Remember:The maximum
recommended investment is £50,000 per Trading Period. See Section 4.
Line K2
Add in this box the numeric value of Stats. Unit Indicator so that
you can receive competitive market information. See Section 4 for
the Table of values.
Line L
This indicates the cash allocated to buy new Plant or it may be a
negative number indicating that you wish to de-commission Plant.
Remember:The cost for each Plant is £65,000 for 10,000 units of
capacity. See Section 2 for further guidance.
Line M
This is the total of your ‘optional’ cash allocations, this does not include
the ‘automatic’ cash allocations.
Line M1
This indicates the cash you wish to spend in the Period to
purchase competitive Market Information.
©C
opyr
ight
Lea
rnin
g D
ynam
ics
1998
–20
06IBM UNIVERSITIES BUSINESS CHALLENGE | PARTICIPANT’S MANUAL
35
Line N and O
These are the ‘automatic’ cash allocations such as Production Fixed
Costs and Creditors items.The amounts are provided for you in your
Company Management Report for the previous Trading Period. Read
Section 8 for further clarification.
Line P
This is always Tax payable. Again, the amount is indicated to you
in your Company Management Report.Turn to Section 6 for the
background.
Line Q
This is the Total of cash allocation required for the Trading Period.
Be very careful! This amount should not exceed the total of cash at
the end of the last Trading Period plus the loan balance available.
See Section 8 for more information.
Line R and S
These boxes relate to the Total Cash Allocations less the cash
available and this will highlight whether a further loan is required.
Check Section 8 for guidelines.
Line T
This box is where you indicate the amount of loan to be repaid,
if any. See Section 7 if in doubt.
Remember to submit your Decision Form on time!
IBM UNIVERSITIES BUSINESS CHALLENGE | PARTICIPANT’S MANUAL
©C
opyr
ight
Lea
rnin
g D
ynam
ics
1998
–20
06

36
A comprehensive Management Report will be produced each
Trading Period specifically for your Company.The Report will detail
the effects of the Trading Period decisions and it will also include
essential data that you will need to use as the foundation to your
next Trading Period decisions. In addition, it may include Market
Information particulars about your competitors – if, of course,
such information is available and you have paid for it!
An example copy of a Company Management Report is included in
this Manual – Appendix C.
The sections included in your Company Management Report will
combine financial/numerical data occasionally accompanied by
narrative explanations or hints and tips
The sections will cover:
Selling PricesThe prices quoted by your Company will be shown for Products
Alpha and Delta within the markets you entered ie Wholesale,
Industrial or Contracts.The prices quoted by other Companies in
your marketplace will not be included unless you have requested
and purchased the relevant Market Information.
Marketing and Product DevelopmentThe ‘Total’ investment in the Trading Period by Product for all the
Companies will be shown plus your specific Company investment.
The Total Marketing Investment section will include any re-entry
penalties, if applicable.
Section 10 | The Company Management Report
©C
opyr
ight
Lea
rnin
g D
ynam
ics
1998
–20
06IBM UNIVERSITIES BUSINESS CHALLENGE | PARTICIPANT’S MANUAL

37
Finished Goods Production and StockThe quantities and costs for both Products Alpha and Delta on hand
at the end of the previous Trading Period are shown as Brought
Forward: to these are added quantities and costs of Production in
the Trading Period.The cost of Production is calculated as follows:
Product AlphaQuantity Produced X (UNIT COST OF MATERIALS USED AS
SHOWN IN THE CURRENT TRADING
PERIOD COMPANY MANAGEMENT REPORT
PLUS
UNIT LABOUR COST OF PRODUCT
ALPHA,AS SHOWN IN THE PREVIOUS
TRADING PERIOD COMPANY
MANAGEMENT REPORT)
Product DeltaQuantity Produced X (2 x UNIT COST OF MATERIALS USED
AS SHOWN IN THE CURRENT TRADING
PERIOD COMPANY MANAGEMENT REPORT
PLUS
UNIT LABOUR COST FOR PRODUCT
DELTA,AS SHOWN IN THE PREVIOUS
TRADING PERIOD COMPANY
MANAGEMENT REPORT
The resultant Sub-Total units and cost are then used to calculate a
new Unit Cost (U.Cost) for each Product and is shown on the next
line of the cost of Goods Sold.The number of units and cost of Stocks
Carried Forward are then shown.
Please Note:The quantities produced are limited byCapacity Units and Material Units available (see Section 2 ‘Quantity of Products Produced’)
Materials Bought and StockThe quantity and cost of Material Units on hand at the end of the
previous Trading Period is shown as Brought Forward: to this is added
the quantity purchased in the Trading Period and the cost calculated at
the Materials Buying Price per Unit (shown under U.Cost) given in
your Company Management Report for the previous Trading Period.
The resultant Sub-Total units and cost are then used to calculate a
new Unit Cost for you to evaluate the cost of units used.
IBM UNIVERSITIES BUSINESS CHALLENGE | PARTICIPANT’S MANUAL
©C
opyr
ight
Lea
rnin
g D
ynam
ics
1998
–20
06

38
The number of units used is calculated as follows:
(2 x NUMBER OF UNITS PRODUCED – PRODUCT DELTA)
PLUS
NUMBER OF UNITS PRODUCED – PRODUCT ALPHA
The number of units and cost Carried Forward to the next Trading
Period are then shown.
Please Note:The maximum quantity of Materials Units
which may be used in a Trading Period is the quantity brought
forward + 75% of the quantity purchased, rounded down to
the nearest 1,000.
Market Statistics:
1.Total Market
This section shows, for each Product, the total Orders and Sales
(including Additional Sales) achieved in the Trading Period by all the
Companies in the marketplace. Factors affecting the calculation of
total orders are described under ‘Market Size’ in Section 4.
2. Company Market
Orders, Sales, Additional Sales and Total Sales achieved by your
Company are highlighted in this section, for each Product. Factors
affecting calculation of Orders Received and Additional Sales are
described under ‘Market Size’ and ‘Additional Sales’ in Section 4.
Sales RevenueThe figures in this section refer to the number of units of Product
Alpha and Product Delta that have been sold by your Company and
they will have been multiplied by your quoted price for each Product.
Profit and Loss Account for the Trading Period:
Total Sales Revenue
The Grand Total of the Total Sales Revenue for Products AW, AI,
AC and the Total Sales Revenue for Products DI, DC, as shown
under ‘Market Statistics’.
©C
opyr
ight
Lea
rnin
g D
ynam
ics
1998
–20
06IBM UNIVERSITIES BUSINESS CHALLENGE | PARTICIPANT’S MANUAL

39
Cost of Goods Sold
The Total of Goods Sold Cost for Product Alpha and Goods Sold
Cost for Product Delta, as shown under ‘Finished Goods Productions
and Stock’.
Production Fixed Cost
The Production Fixed Costs for the Trading Period, as shown in your
Company Management Report for the previous Trading Period.
Plant Depreciation
10% of the original cost of the Plant.
Warehousing
£50,000 plus £100 per 100 Units (or part thereof) of Finished Goods
AND Materials Units in stock at the start of the Trading Period.
Carriage Packing
£1 per unit of Products sold, unless changed by a Scenario Update.
Cost Reduction Product Development Market Consultancy/Research
The amounts allocated on your Decision Form adjusted, when
necessary, for over-allocation of cash and/or other limits imposed
from time to time.
Loan Interest
Interest at the % shown in the Scenario Update, calculated on the
Loan outstanding at the end of the Trading Period plus any additional
interest charged for over-allocation of cash or cash overdrawn. (see
Section 8 for more information).
Administration
£700,000 per Trading Period.
Bad Debts Written Off
The amount written off, if any, as Bad Debts at the % rate of debtors
indicated by your Bank in the Scenario Update.
Total
The Total Expenditure for the Trading Period.
Profit Before Tax
Total Sales Revenue minus Total Expenditure.
IBM UNIVERSITIES BUSINESS CHALLENGE | PARTICIPANT’S MANUAL
©C
opyr
ight
Lea
rnin
g D
ynam
ics
1998
–20
06

40
Provision for Tax
The amount calculated at the % indicated in the Scenario Update,
which has been transferred to the Taxation Reserve in the Balance
Sheet (see Section 6).
Profit for the Trading Period
Profit Before Tax minus Provision for Tax.The amount transferred to
Profit and Loss Account in the Balance Sheet.
The Balance Sheet:Only the Balance Sheet information for your Company will be shown
within the main body of your Company Management Report. If you
have purchased Balance Sheet Market Information regarding your
competitors this will be included in your Report.
Share Capital
The issued Share Capital of your Company remains unaltered.
Loans/Saving A/C
The amount of loan outstanding or savings made.
Profit & Loss A/C
The accumulated profits or losses after tax.
Total Capital Employed
The long term Capital which is being used to run the business –
equal to the value of the Net Assets.
Plant at Nett Book
The original cost of Plant Value less accumulated depreciation.
Stock – Materials / Stock – Finished / Goods
The value of stocks at the end of the trading Period as calculated
and shown in the Stock reports against ‘C/Forward’.
Debtors
25% of the current Trading Period Sales Revenue adjusted for
Bad Debts, when applicable.
©C
opyr
ight
Lea
rnin
g D
ynam
ics
1998
–20
06IBM UNIVERSITIES BUSINESS CHALLENGE | PARTICIPANT’S MANUAL

41
Cash
Cash available for allocation in the next Trading Period.
Total
The Total Assets in use in the business.
Creditors
Amounts unpaid in respect of Carriage and Packing,Warehousing,
Administration and Loan Interest (see Section 7).
Taxation Reserve
The accumulation of tax provisions since the last payment of tax. It
must be cleared by a cash allocation in the Trading Periods when
payment is specified in the Scenario Updates.
Total Current Liabilities
The short term capital employed in the business.
Net Assets
Total Assets Less Current Liabilities – equal to the Capital Employed.
Data for the Next Trading PeriodThis section provides you with the basic information required to make
trading decisions for the next Trading Period.The individual items
highlighted below are fully described in the relevant sections
of this manual.
Unit Labour Costs
The cost to produce one unit of Alpha/Delta documented accordingly.
Materials Buying Price
These and the above costs will be calculated according to market
factors and any investment in cost reduction initiatives.
Capacity
Capacity available in the factory.
Production Fixed Costs
Calculated according to total capacity.
Product Development
The percentage attractiveness of both Alpha & Delta.
Contract
Value of contracts on offer for both Alpha & Delta.
IBM UNIVERSITIES BUSINESS CHALLENGE | PARTICIPANT’S MANUAL
©C
opyr
ight
Lea
rnin
g D
ynam
ics
1998
–20
06

42
Maximum Loan
The maximum amount that your Company may borrow. In certain
Trading Periods, as advised in Scenario Updates, the maximum loan
amount may be revised.
Balance Now Available
The amount of loan available to be borrowed next Trading Period.
This is the Maximum Loan minus the amount you have already
borrowed as shown against ‘Loans’ in the Balance Sheet.
Pay Tax of £xxxx Next Period
A reminder will be included that tax is due in the next Trading Period
and the amount indicated must be included in your cash allocations.
Tax on Losses Carried Forward
This is the amount of tax on losses available to offset against Tax on
profits made in the future.
Product Image
Product Image for both Alpha & Delta at that point in time.
Stats Price per Unit
The cost of purchasing competitive information.
Next Decision Due
This will indicate the date by when your next set of Trading
Decisions will be expected.
Company Management Report CommentsIncluded in this section will be warning of any errors resulting from
your Decision Form submissions. For example, rounding errors in
calculations, over-allocation of cash, insufficient raw materials to meet
your orders, Contract prices greater than lowest sales market prices
of the Company in a particular Product, rounding errors etc. An error
report number will be indicated and you will need to study the
Participant’s Manual for a full explanation.
©C
opyr
ight
Lea
rnin
g D
ynam
ics
1998
–20
06IBM UNIVERSITIES BUSINESS CHALLENGE | PARTICIPANT’S MANUAL

43
Competitive Market Information:If your Company has requested and purchased Market Information
relating to your competitors within the marketplace (as described
in Section 4) the data will be included in your Company
Management Report.
Depending on what information you requested and purchased the
Sections will cover:
Selling Prices
The selling prices for both products, in each of the markets including
Contracts when relevant, will be displayed for all the Companies in
your marketplace.
Balance Sheets
The Balance Sheets for all Companies in the same marketplace will be
included. However, this information will only be available for purchase
at specified times in the business cycle. Availability will be highlighted
via Scenario Updates.
Statistical Data Market Costs / Unit A
This will indicate the Total amount invested in Marketing for Product
Alpha divided by the Total sales of Product Alpha in the Wholesale
market and Product Alpha in the Industrial market i.e. AW and AI.
Market Costs / Unit D
This will indicate the amount invested in Marketing for Product Delta
divided by the sales of Product Delta in the Industrial market i.e. DI.
Orders Filled
This will show the Sales of Products AW, AI and DI.
Product Image
This will indicate the relevant Product Image for Teams for the
previous Trading Period.
Product Development %
This will indicate the relevant Product Development % achieved by
the other Companies in the market that will be used in the next
Trading Period.
Production Capacity
This will reveal your competitors production capacity for the next
Trading Period.
IBM UNIVERSITIES BUSINESS CHALLENGE | PARTICIPANT’S MANUAL
©C
opyr
ight
Lea
rnin
g D
ynam
ics
1998
–20
06
If your Company has
requested and purchased
Market Information relating to
your competitors within the
marketplace the data will be
included in your Company
Management Report.

44
As described earlier in Section 9, a ‘Special Play’ will be made in any
Trading Period when the Decision Form for a Company has not been
received by the Business Simulations Team by the time specified at the
start of the Round.
In addition, any Company is also allowed to invoke a Special Play, if,
because of exceptional circumstances a full set of Decisions cannot be
made or relayed to the Business Simulations Team. However, should a
Company require three Special Plays in one Round, the team will be
eliminated from the entire Business Management Simulation.
Special Plays will be made each Trading Period for eliminated or
cancelled companies until the Round in completed.These may vary
from the decisions shown below.
The following data represents the Decisions that will be input, under
normal circumstances, for a Special Play:
Selling Prices
Lines C1 to C5
The Price quoted by the Company in the previous Trading Period
for Products AW, AI and DI. Zero for Products AC (Contract) and
DC (Contract).
Production Quantities
Lines D1 and D2
The available Capacity Units divided between Products Alpha and
Delta in the same proportion as the previous Trading Period.
Section 11 | Special Play Decisions
©C
opyr
ight
Lea
rnin
g D
ynam
ics
1998
–20
06IBM UNIVERSITIES BUSINESS CHALLENGE | PARTICIPANT’S MANUAL

45
Purchase of Materials
Line E – The minimum quantity required to meet the Production
quantities stated above.
Labour and Materials Costs
Lines F1 to G – Values calculated as shown on the Decision Form.
Marketing and Product Development
Lines H1 to I2 – For each item, an allocation equal to that made in the
previous Trading Period.
Cost Reduction Consultancy Fee Stats. Unit Indicator
Lines J to K – NIL
Plant Purchased
Line L – The amount required to replace any Plant to be scrapped at
the end of the Trading Period.
Sub-Total
Line M – Amount calculated as shown on the Decision Form.
Production Fixed Costs, Creditors and Tax Payable
Lines N to P – The actual amounts brought forward from the previous
Trading Period.
Total Cash Allocations
Line Q – Amount calculated as shown on the Decision Form.
Cash at End of Trading Period
Line R – The actual amount.
Loan Applied For
Line S – Amount calculated as shown on the Decision Form.
Loan Repaid
Line T – NIL
IBM UNIVERSITIES BUSINESS CHALLENGE | PARTICIPANT’S MANUAL
©C
opyr
ight
Lea
rnin
g D
ynam
ics
1998
–20
06

46
These Decisions will be input on behalf of your Company and may
be adjusted, if necessary, to meet any restrictions imposed at the time.
Over-allocation of cash will be dealt with as described in Section 8.
Your Company Management Report will have a footnote saying
‘SPECIAL PLAY’ when it is appropriate.
©C
opyr
ight
Lea
rnin
g D
ynam
ics
1998
–20
06IBM UNIVERSITIES BUSINESS CHALLENGE | PARTICIPANT’S MANUAL

47
Throughout the competition you will receive, from time to time, a
number of Scenario Updates or News- flashes.These will provide you
with background data such as the state of your marketplace, specific
occurrences in your Company or even aspects of the general
economy that are likely to affect you and your trading decisions.
For example, the following types of details may be highlighted:
Economic Climate:Information may be provided regarding the instability of a particular
marketplace for one or both of your products. Long-term forecasts
regarding demand for products or short-term crises may be reported
along with specific sensitivities in the marketplace such as price issues.
Materials Units:In specific Trading Periods the purchase of materials may be subject
to maximum or minimum limits.
Market Prices:There may be price restrictions imposed or lifted, possibly as a result
of new legislation.
Marketing:Almost anything could happen here! Your marketing consultants could
go out of business or maximum expenditure could be imposed due
to unforeseen circumstances within your Company.
Loan Interest Rates:Issues with your Bank Manager or fluctuations in the base rates could
affect the interest rates on any loans you have outstanding.
Taxation:Again, issues in the economy in general may affect the % rate of tax
your Company must pay in different Trading periods year to year.
Remember that each decision you make is roughly equivalent to six
months in the life of your Company and changes will undoubtedly
occur during this time.
These are only some examples of the kind of changes
you may face during your tenure of office, there are
likely to be many other challenges!
Appendix A | Economic & Marketplace Scenario Updates
IBM UNIVERSITIES BUSINESS CHALLENGE | PARTICIPANT’S MANUAL
©C
opyr
ight
Lea
rnin
g D
ynam
ics
1998
–20
06

Team Name: Trading Period No:
A Game Code
B Company Number
Selling Prices
C1 Product AW
C2 Product AI
C3 Product AC (Contract only)
C4 Product DI
C5 Product DC (Contract only)
Quantities in 000’s Units
D1 Production of Product Alpha
D2 Production of Product Delta
E Purchase of Materials Units
Cash Allocations in £000’s (Rounded up)
F1 Line D1 x Unit Labour Cost for Product Alpha
F2 Line D2 x Unit Labour Cost for Product Delta
G Line E x Materials Buying Price Per Unit
H1 Marketing – Product AW
H2 Marketing – Product AI
H3 Marketing – Product DI
I1 Product Development – Product Alpha
I2 Product Development – Product Delta
J Cost Reduction
K1 Consultancy Fee – Marketing
K2 Stats. Unit Indicator
L Plant Purchased (10,000 capacity each) No x £65,000 =
M Sub-totals (Lines F1 to L)
M1 Stats. Cost (Line K2 x Stats. Price)
N Production Fixed Costs
O Creditors
P Tax Payable
Q Total Cash Allocations (line M to P)
R Deduct: Cash at end of Last Period – (to nearest £1,000)
S Loan Applied for £000’ s
OR
T Loan Repaid £000’s
DO NOT ADD ANY EXTRA BOXES TO THIS FORM,THANK YOU!
The Decisions which you enter below will be input by the Business
Simulations Team in accordance with the rules and limitations as stated
in the Participant’s Manual and any Scenario Updates or Newsflashes.
Appendix B | The Decision Form
©C
opyr
ight
Lea
rnin
g D
ynam
ics
1998
–20
06IBM UNIVERSITIES BUSINESS CHALLENGE | PARTICIPANT’S MANUAL

49
Appendix C | The Company Management Report
Company Selling Prices
Product AW £48Product AI £40Product AC £0Product DI £74Product DC £0
Materials Bought and StockUnits Cost Unit Cost
B/Forward 163,000 £1,366,640Purchases 516,000 £4,308,600 £8.35Sub Total 679,000 £5,675,240 £8.36Used 550,000 £4,597,030 £8.36C/Forward 129,000 £1,078,210
Finished Goods Production and Stocks – Product AlphaUnits Cost Unit Cost
B/Forward 34,700 £911,070Production 350,000 £9,247,000 £26.42Sub Total 384,700 £10,158,070 £26.41Sold 338,360 £8,934,450 £26.41C/Forward 46,340 £1,223,620
Company Market StatisticsOrders Sales Additional Sales Total Sales Sales Revenue
Product AW 259,340 259,340 2,700 262,040 £12,577,920Product AI 76,320 76,320 0 76,320 £3,052,800Product AC 0 0 0 0 £0Total 335,660 335,660 2,700 338,360 £15,630,720
Product DI 96,260 96,260 0 96,260 £7,123,240Product DC 0 0 0 0 £0Total 96,260 96,260 0 96,260 £7,123,240
Finished Goods Production and Stocks – Product DeltaUnits Cost Unit Cost
B/Forward 32,400 £1,706,990Production 100,000 £5,284,000 £26.42Sub Total 132,400 £6,990,990 £26.41Sold 96,260 £5,082,720 £26.41C/Forward 36,140 £1,908,270
Company InformationMarketing Product Devt
Product AW £450,000Product AI £50,000Product DI £200,000Product Alpha £200,000Product Delta £200,000
Total Market InformationMarketing Product Devt
Product AW £3,500,000Product AI £400,000Product DI £1,800,000Product A £2,200,000Product D £1,900,000
Total Market StatisticsOrders Sales
Product AW 2,134,300 2,128,260Product AI 669,500 669,500Product AC 10,000 10,000Total 2,813,800 2,807,760
Product DI 804,260 804,260Product DC 10,000 10,000Total 814,260 814,260
Product/Market KeyAW Product Alpha – Wholesale MarketAI Product Alpha – Industrial MarketAC Product Alpha – Contract Market
DI Product Delta – Industrial MarketDC Product Delta – Contract Market
IBM UNIVERSITIES BUSINESS CHALLENGE | PARTICIPANT’S MANUAL
©C
opyr
ight
Lea
rnin
g D
ynam
ics
1998
–20
06
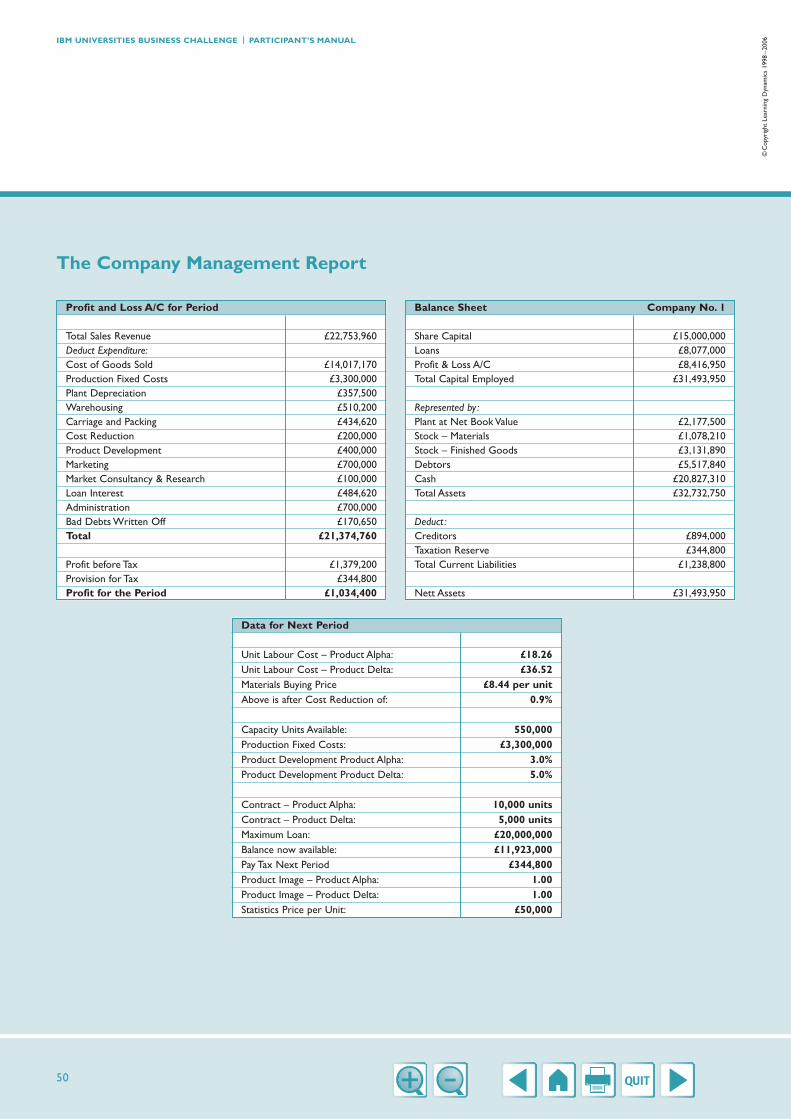
50
The Company Management Report
Data for Next Period
Unit Labour Cost – Product Alpha: £18.26Unit Labour Cost – Product Delta: £36.52Materials Buying Price £8.44 per unitAbove is after Cost Reduction of: 0.9%
Capacity Units Available: 550,000Production Fixed Costs: £3,300,000Product Development Product Alpha: 3.0%Product Development Product Delta: 5.0%
Contract – Product Alpha: 10,000 unitsContract – Product Delta: 5,000 unitsMaximum Loan: £20,000,000Balance now available: £11,923,000Pay Tax Next Period £344,800Product Image – Product Alpha: 1.00Product Image – Product Delta: 1.00Statistics Price per Unit: £50,000
Balance Sheet Company No. 1
Share Capital £15,000,000Loans £8,077,000Profit & Loss A/C £8,416,950Total Capital Employed £31,493,950
Represented by :Plant at Net Book Value £2,177,500Stock – Materials £1,078,210Stock – Finished Goods £3,131,890Debtors £5,517,840Cash £20,827,310Total Assets £32,732,750
Deduct :Creditors £894,000Taxation Reserve £344,800Total Current Liabilities £1,238,800
Nett Assets £31,493,950
Profit and Loss A/C for Period
Total Sales Revenue £22,753,960Deduct Expenditure:Cost of Goods Sold £14,017,170Production Fixed Costs £3,300,000Plant Depreciation £357,500Warehousing £510,200Carriage and Packing £434,620Cost Reduction £200,000Product Development £400,000Marketing £700,000Market Consultancy & Research £100,000Loan Interest £484,620Administration £700,000Bad Debts Written Off £170,650Total £21,374,760
Profit before Tax £1,379,200Provision for Tax £344,800Profit for the Period £1,034,400
©C
opyr
ight
Lea
rnin
g D
ynam
ics
1998
–20
06IBM UNIVERSITIES BUSINESS CHALLENGE | PARTICIPANT’S MANUAL

51
Competitive Market Information
Market Selling PricesCompany 1 2 3 4 5 6 7 8
Product Alpha (Wholesale) £48 £47 £46 £49 £48 £47 £46 £49Product Alpha (Industrial) £40 £39 £38 £40 £40 £39 £38 £40Product Alpha (Contract) £0 £37 £34 £0 £0 £37 £34 £ 0Product Delta (Industrial) £74 £74 £72 £75 £74 £74 £72 £75Product Delta (Contract) £0 £72 £70 £0 £0 £72 £70 £0
Market Statistical DataCompany 1 2 3 4 5 6 7 8
Market Costs/Unit Alpha £1.48 £0.87 £1.32 £1.95 £1.48 £0.87 £1.32 £1.95Market Costs/Unit Delta £2.08 £2.08 £1.76 £3.12 £2.08 £2.08 £1.76 £3.12Orders Filled AW 262,040 260,770 283,470 257,850 262,040 260,770 283,470 257,850Orders Filled AI 76,320 85,880 96,230 76,320 76,320 85,880 96,230 76,320Orders Filled DI 96,260 96,260 113,360 96,250 96,260 96,260 113,360 96,250Product Image this Period:Alpha 1.00 1.00 1.00 1.00 1.00 1.00 1.00 1.00Product Image this Period: Delta 1.00 1.00 1.00 1.00 1.00 1.00 1.00 1.00Prod Devt % Next Period:Alpha 3.0% 4.0% 2.0% 4.0% 3.0% 4.0% 2.0% 4.0%Prod Devt % Next Period: Delta 5.0% 3.5% 6.5% 5.0% 5.0% 3.5% 6.5% 5.0%Production Capacity 550,000 550,000 600,000 550,000 550,000 550,000 600,000 550,000
IBM UNIVERSITIES BUSINESS CHALLENGE | PARTICIPANT’S MANUAL
©C
opyr
ight
Lea
rnin
g D
ynam
ics
1998
–20
06
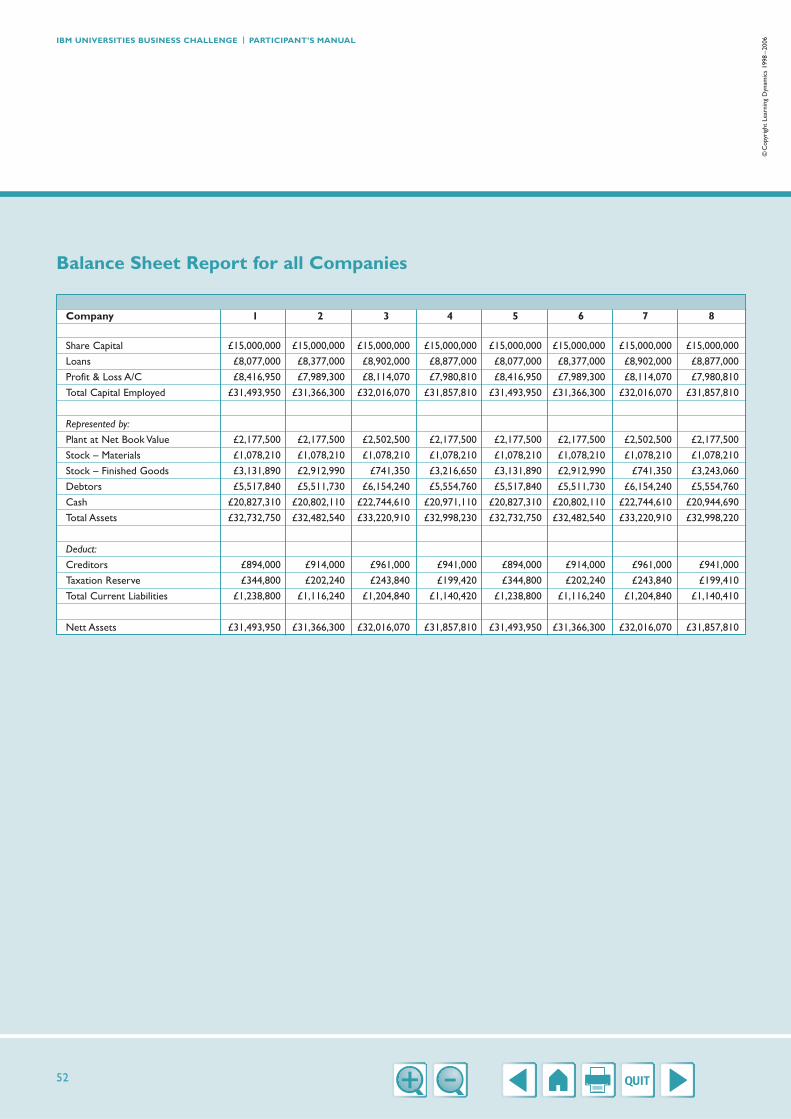
52
Balance Sheet Report for all Companies
Company 1 2 3 4 5 6 7 8
Share Capital £15,000,000 £15,000,000 £15,000,000 £15,000,000 £15,000,000 £15,000,000 £15,000,000 £15,000,000
Loans £8,077,000 £8,377,000 £8,902,000 £8,877,000 £8,077,000 £8,377,000 £8,902,000 £8,877,000
Profit & Loss A/C £8,416,950 £7,989,300 £8,114,070 £7,980,810 £8,416,950 £7,989,300 £8,114,070 £7,980,810
Total Capital Employed £31,493,950 £31,366,300 £32,016,070 £31,857,810 £31,493,950 £31,366,300 £32,016,070 £31,857,810
Represented by:
Plant at Net Book Value £2,177,500 £2,177,500 £2,502,500 £2,177,500 £2,177,500 £2,177,500 £2,502,500 £2,177,500
Stock – Materials £1,078,210 £1,078,210 £1,078,210 £1,078,210 £1,078,210 £1,078,210 £1,078,210 £1,078,210
Stock – Finished Goods £3,131,890 £2,912,990 £741,350 £3,216,650 £3,131,890 £2,912,990 £741,350 £3,243,060
Debtors £5,517,840 £5,511,730 £6,154,240 £5,554,760 £5,517,840 £5,511,730 £6,154,240 £5,554,760
Cash £20,827,310 £20,802,110 £22,744,610 £20,971,110 £20,827,310 £20,802,110 £22,744,610 £20,944,690
Total Assets £32,732,750 £32,482,540 £33,220,910 £32,998,230 £32,732,750 £32,482,540 £33,220,910 £32,998,220
Deduct:
Creditors £894,000 £914,000 £961,000 £941,000 £894,000 £914,000 £961,000 £941,000
Taxation Reserve £344,800 £202,240 £243,840 £199,420 £344,800 £202,240 £243,840 £199,410
Total Current Liabilities £1,238,800 £1,116,240 £1,204,840 £1,140,420 £1,238,800 £1,116,240 £1,204,840 £1,140,410
Nett Assets £31,493,950 £31,366,300 £32,016,070 £31,857,810 £31,493,950 £31,366,300 £32,016,070 £31,857,810
©C
opyr
ight
Lea
rnin
g D
ynam
ics
1998
–20
06IBM UNIVERSITIES BUSINESS CHALLENGE | PARTICIPANT’S MANUAL

53
Within your Company Management Report you will receive
guidance relating to various aspects that may have occurred as a
result of your Decision’s or the cumulative effect of the Decisions
of other Companies in your marketplace.
Throughout the course of a Round you may find that some of the
following numbers are highlighted within your Report. If this occurs,
locate the relevant number on this page and refer to the comments.
You will only receive comments for your own Company results.
Comment No:1. Minimum or maximum prices were in force (as notified via the
Scenario Update) or the maximum permitted change in price
was exceeded. As a result of this your selling prices were
altered accordingly.
2. Production quantities exceeded the capacity available in your
factory.The production quantities were therefore altered in
line with your actual capacity.
3. The Production quantities you reported exceeded the actual
materials available to your Company.Your Materials Stock Carried
Forward plus the 75% (rounded down to the nearest 1000) of
Materials Purchased was insufficient to meet your needs and
therefore the Production quantities were altered to match
your resources.
4. An error was made in the calculation of the Labour Costs for
Product Alpha.The calculation was corrected. (The error could
have been caused by forgetting to ‘round-up’, using the wrong
Unit Labour Costs in your calculations or, if you did not produce
as much as you anticipated and therefore used less labour).
5. An error was made in the calculation of the Labour Costs for
Product Delta.The calculation was corrected. (The error could
have been caused by forgetting to ‘round-up’, using the wrong
Unit Labour Costs in your calculations or, if you did not produce
as much as you anticipated and therefore used less labour).
Appendix D | The Company Management Report:Comments
IBM UNIVERSITIES BUSINESS CHALLENGE | PARTICIPANT’S MANUAL
©C
opyr
ight
Lea
rnin
g D
ynam
ics
1998
–20
06

54
6. An error was made in the calculation of the cost of Materials
Purchased.The calculation was corrected. Did you calculate
your costs correctly?
7. Marketing investments were subject to a minimum (as notified
via Newsflashes or Scenario Updates).Your figures were therefore
altered accordingly.
8. Product Development investments were subject to a minimum
(as notified via the Scenario Update).Your figures were therefore
altered to meet the minimum requirement.
9. There is no Plant available for you to purchase in Trading Period
1 (refer to Section 2).Your allocation of cash to buy Plant was
therefore reduced to zero.
10. The Bank Loan that your Company applied for exceeded the
amount of loan available to you at the moment.The Bank Loan
amount was therefore reduced to match your current limit.
11. Your Total Allocations of cash exceeded the amount of Total
Cash Available by more than £5,000 and therefore the Bank
Loan Interest rate was increased by 20% of the normal interest
rate. See Section 8 for further explanation.
12. You over-allocated your cash, however, there were sufficient
funds in the balance of your Bank Loan to meet the over
allocated amount.Your Bank Loan Applied for was therefore
increased accordingly.
13. You did not have enough funds to cover any allocations other
than the ‘automatic’ allocations for Production Fixed Costs,
Creditors and Tax.The existing stocks of your Finished Goods
may be sold but Production will be limited to existing stocks of
Materials, if any. However, these Materials will be used to make
Product Alpha only.The minimum cash required is likely to result
in ‘Cash Overdrawn’ for which Loan Interest will be charged at
the normal rate. Refer to Section 8 for clarification.
14. The Cash Available to your Company was insufficient to meet
your Total Allocations and these have therefore be reduced to
match your actual funds. See Section 8 for further information.
©C
opyr
ight
Lea
rnin
g D
ynam
ics
1998
–20
06IBM UNIVERSITIES BUSINESS CHALLENGE | PARTICIPANT’S MANUAL
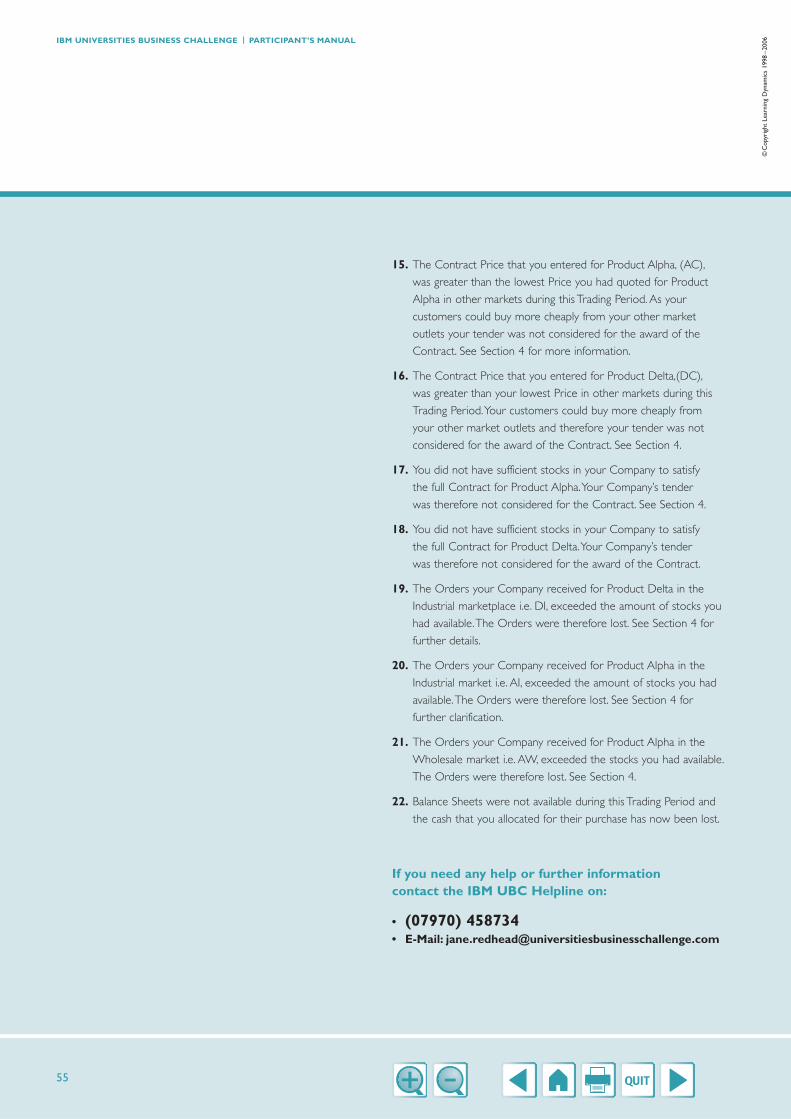
55
15. The Contract Price that you entered for Product Alpha, (AC),
was greater than the lowest Price you had quoted for Product
Alpha in other markets during this Trading Period. As your
customers could buy more cheaply from your other market
outlets your tender was not considered for the award of the
Contract. See Section 4 for more information.
16. The Contract Price that you entered for Product Delta,(DC),
was greater than your lowest Price in other markets during this
Trading Period.Your customers could buy more cheaply from
your other market outlets and therefore your tender was not
considered for the award of the Contract. See Section 4.
17. You did not have sufficient stocks in your Company to satisfy
the full Contract for Product Alpha.Your Company’s tender
was therefore not considered for the Contract. See Section 4.
18. You did not have sufficient stocks in your Company to satisfy
the full Contract for Product Delta.Your Company’s tender
was therefore not considered for the award of the Contract.
19. The Orders your Company received for Product Delta in the
Industrial marketplace i.e. DI, exceeded the amount of stocks you
had available.The Orders were therefore lost. See Section 4 for
further details.
20. The Orders your Company received for Product Alpha in the
Industrial market i.e. AI, exceeded the amount of stocks you had
available.The Orders were therefore lost. See Section 4 for
further clarification.
21. The Orders your Company received for Product Alpha in the
Wholesale market i.e. AW, exceeded the stocks you had available.
The Orders were therefore lost. See Section 4.
22. Balance Sheets were not available during this Trading Period and
the cash that you allocated for their purchase has now been lost.
If you need any help or further information contact the IBM UBC Helpline on:
• (07970) 458734• E-Mail: [email protected]
IBM UNIVERSITIES BUSINESS CHALLENGE | PARTICIPANT’S MANUAL
©C
opyr
ight
Lea
rnin
g D
ynam
ics
1998
–20
06

42
7
25
24, 27
40, 52
27
27, 28
25, 27
29
29
31
36, 49
17
15, 16
14
15
15
24
27
27
32, 48
9, 15
14
5, 32
15
24, 27, 28, 31
10
14
24, 27, 28, 31
24, 27, 28, 31
Manufacturing Capacity
Markets:
Information
Prices
Share
Size
Marketing:
Consultants
Effect
Investment
Materials
Materials Costs
Next Trading Period
Orders:
Fulfillment of
Production:
Capacity
Cash Allocation
Costs
Units produced
Plant:
Decommission
Depreciation
Size
Purchase of
Prices:
Market
Contract
Product Development
Product Image
Profit & Loss Account
Re-Entry Penalty
Sales:
Additional
Revenue
No. of Units Sold
8
20
21, 33
22
22
19
18
18
10
14
41
21
8
33
14
37
9
9,15
8
8
21, 33
17, 22
11
12, 20
3
19
23
38
38
56
Additional Information
Adjudication
Administration Costs
Bad Debts
Balance Sheet
Borrowing:
Arrangements
Limit
Carriage & Packing Costs
Cash:
Allocations
Availability
Over-drawn
Company Management Report
Contracts
Cost Reduction
Costs:
Fixed
Variable
Goods Sold
Miscellaneous
Creditors
Debtors
Decision Form
Depreciation of Plant
Fixed Costs
Game Code
Goods Sold, Cost of
Interest Rates
Labour
Labour Costs
Loans
Loan Interest
Index
©C
opyr
ight
Lea
rnin
g D
ynam
ics
1998
–20
06IBM UNIVERSITIES BUSINESS CHALLENGE | PARTICIPANT’S MANUAL

57
IBM UNIVERSITIES BUSINESS CHALLENGE | PARTICIPANT’S MANUAL
©C
opyr
ight
Lea
rnin
g D
ynam
ics
1998
–20
06
Sequence of Supply
Share Capital
Special Play Decisions
Statistics Unit Indicator
Statistics Costs
Stocks:
Finished Goods
Materials
Tax:
Provision
Payment
Reserve
Total Market Statistics
Trading Periods
Variable Costs
Warehousing
Winner!
13
40
44
20
20
11, 37
10, 37
26
26
35
38
5
15
15, 27, 39
7

58
©C
opyr
ight
Lea
rnin
g D
ynam
ics
1998
–20
06
IBM Universities Business Challenge
UBC Helpline: 07970 458734
UBC Email: [email protected]
For any other information
For other business simulations and management development
programmes, please contact Learning Dynamics:
Telephone: + 44 (0)20 7520 9288
Email: [email protected]
Learning Dynamics Ltd
7 – 10 Adam Street
London
WC2N 6AA
IBM UNIVERSITIES BUSINESS CHALLENGE | PARTICIPANT’S MANUAL
IBM UNIVERSITIES BUSINESS CHALLENGE | PARTICIPANT’S MANUAL
©C
opyr
ight
Lea
rnin
g D
ynam
ics
1998
–20
06
LEARNINGDYNAMICSsimulation centred learning
Developing winning business performance
Learning Dynamics
7–10 Adam Street, London,WC2N 6AA
IBM Universities Business Challenge
UBC Helpline: 07970 458 734
Email: [email protected]
For all other enquiries:
Telephone: 020 7520 9288
Email: [email protected]
Related Documents


