© IBM Corporation 1 IBM ® Spectrum Archive™ Enterprise Edition 1.3.1.3 Dashboard Deployment Guide Version 2.2.0 2021-05-20 Authors: Takeshi Ishimoto ([email protected]) Osamu Matsumiya Junta Watanabe Yuka Sasaki

Welcome message from author
This document is posted to help you gain knowledge. Please leave a comment to let me know what you think about it! Share it to your friends and learn new things together.
Transcript

© IBM Corporation 1
IBM® Spectrum Archive™ Enterprise Edition 1.3.1.3
Dashboard Deployment Guide
Version 2.2.0
2021-05-20
Authors:
Takeshi Ishimoto ([email protected])
Osamu Matsumiya
Junta Watanabe
Yuka Sasaki

© IBM Corporation 2
Revision History Document Revision Date Summary of Changes
1.0 2017-06 Initial
2.1 2018-12
2.2.0 2021-05 Updated for IBM Spectrum Archive Enterprise Edition Version 1.3.1.3
⚫ Removed the need of defining the secondary data source in
Grafana, and simplify the installation steps for Task view
⚫ Updated the Task View template for displaying the additional task
information.

© IBM Corporation 3
Table of Contents
1. Introduction ........................................................................................................................................ 4
1.1. Overview .......................................................................................................................................................... 4
1.2. System Requirement ...................................................................................................................................... 5
1.3. Installation Planning ....................................................................................................................................... 6
2. Fresh install of Dashboard ................................................................................................................. 7
2.1. Configuring the Monitoring Server ................................................................................................................. 7
2.2. Configuring EE node for Dashboard ............................................................................................................. 12
2.3. Customizing Grafana for EE Dashboard....................................................................................................... 19
3. Upgrading the Dashboard ................................................................................................................ 23
3.1. Upgrading the software on EE node ............................................................................................................ 23
3.2. Upgrading the software on Monitoring Server ............................................................................................ 27
4. Using Grafana ................................................................................................................................... 33
4.1. System Health View ...................................................................................................................................... 35
4.2. Storage View .................................................................................................................................................. 36
4.3. Activity View .................................................................................................................................................. 37
4.4. Config View .................................................................................................................................................... 38
4.5. Task View ....................................................................................................................................................... 39
5. Troubleshooting ............................................................................................................................... 40
5.1. “No data point” message on Grafana .......................................................................................................... 40
5.2. Clean up the old records from Elasticsearch .............................................................................................. 41
5.3. Log files .......................................................................................................................................................... 43
6. Limitations ........................................................................................................................................ 44

© IBM Corporation 4
1. Introduction
IBM Spectrum Archive Enterprise Edition (Spectrum Archive EE) supports a Dashboard that helps the
storage administrators to manage and monitor the storage system through the Web-based graphical
interface. By using the Dashboard, you can see the following information without logging in to a system
and typing command but just with a Web browser:
• System health and error events
• Tape pool configuration
• Time-scaled storage consumption for each tape pool.
• Throughput of each drive for migration and recall.
1.1. Overview
The Spectrum Archive EE dashboard uses the open-source software (OSS), Logstash™, Elasticsearch™
and Grafana™, for collecting the statistics from the IBM Spectrum Archive EE nodes and for rendering the
information. The figure below illustrates how the information is collected, stored, and presented by OSS.
An external Red Hat Linux Sever ™ (RHEL) server called monitoring server is required to setup the
Dashboard. The monitoring server is completely separate node from Spectrum Scale nodes. Recommend
the monitoring server is deployed within a network that the Spectrum Archive EE nodes are running in.
Overview of deployment procedure is:
1. Setup Spectrum Archive EE …Not covered in this document
2. Setup an external monitoring server

© IBM Corporation 5
3. Setup Spectrum Archive EE node
4. Configure Grafana in monitoring server by using a web browser
All system commands below needs to be run by root.
1.2. System Requirement
1.2.1. Requirements to IBM Spectrum Archive EE node
Dashboard supports IBM Spectrum Archive EE running on x86_64 server
Additional prerequisite software (required only for Activity View of Dashboard):
• systemtap
• systemtap-runtime
• kernel-devel
• logstash-5.6.8.rpm (included in Spectrum Archive EE installation package)
1.2.2. Requirements to Monitoring Server
Hardware:
• Architecture: x86_64
• CPU: One or more
• Memory: 32 GB or more
• Disk space: 1 TB or more
• Network for connection from/to EE nodes
Required software:
• Operating system: RHEL server 7.x
• java-1.8.0-openjdk
• elasticsearch-5.6.8.rpm (included in Spectrum Archive EE installation package)
• grafana-5.0.4-1.x86_64.rpm (included in Spectrum Archive EE installation package)
Note: The tested versions of Elasticsearch, Logstash, and Grafana are redistributed along with
the IBM Spectrum Archive EE product package, for convenience. The support for those open
source packages can be acquired, for a fee, by contacting a third-party provider. It is not
covered by the IBM Spectrum Archive Enterprise Edition license and support contract.
System Settings:
• SELinux
Disable SELinux by the following command for the current run.
$ setenforce 0 setenforce: SELinux is disabled

© IBM Corporation 6
And, edit the /etc/sysconfig/selinux file and change SELINUX line to SELINUX=disabled for
disabling the SELinux permanently.
• Network firewall
Make the following network port numbers available for the access from the Spectrum Archive EE node
and Web client.
➢ Port 9200, for Elasticsearch
➢ Port 3000, for Grafana
Or, disable firewalld by the commands below.
1.3. Installation Planning
Use the following diagram to determine your installation procedure. Note that, when Spectrum Archive EE
software is updated by using ltfsee_install --upgrade command, you need to upgrade Dashboard
software manually to the corresponding versions and follow the Upgrade procedure.
NOTE: If you have been using Elasticsearch, Logstash, or Grafana for other purpose and if you are
planning to reuse the existing installation for Spectrum Archive EE Dashboard, the procedure in this
guide may overwrite your current configuration.
$ systemctl stop firewalld.service $ systemctl disable firewalld.service

© IBM Corporation 7
2. Fresh install of Dashboard
The first-time installation is outlined as follows.
1. Prepare a new monitoring server and configure
2. Install additional software on each EE node
3. Customize Grafana for Spectrum Archive EE Dashboard
2.1. Configuring the Monitoring Server
Complete the following tasks for setting up the monitoring server.
1. Copying the required files to monitoring server (task on one of EE nodes)
2. Installing Elasticsearch and Grafana, on monitoring server
3. Post-installation steps for Elasticsearch on monitoring server
4. Post-installation steps for Grafana on monitoring server
5. Starting Elasticsearch and Grafana on monitoring server
2.1.1. Copying the required files from EE node to Monitoring Server
Copy the ibmsa-dashboard-xxx.tar.gz file and two other RPMs, from /root/rpm/ directory of EE
node to /tmp directory of the monitoring server.
2.1.2. Installing Elasticsearch and Grafana on Monitoring Server
On the monitoring server, go to the /tmp directory where two RPMs were copied by scp command in
section 2.1.1, and use yum command to install the Elasticsearch and Grafana RPMs.
Example of command output:
$ cd /root/rpm/
$ scp RHEL7/ibmsa-dashboard-1.3.x.x-xxxxx.tar.gz dashboard/Elastic/elasticsearch-5.6.8.rpm
dashboard/Grafana/grafana-5.0.4-1.x86_64.rpm <Your ID>@<Your Monitoring Server IP>:/tmp
[email protected]'s password:
ibmsa-dashboard-1.3.1.3-52105.tar.gz 100% 18KB 9.1MB/s 00:00
elasticsearch-5.6.8.rpm 100% 32MB 43.2MB/s 00:00
grafana-5.0.4-1.x86_64.rpm 100% 49MB 55.2MB/s 00:00
$ cd /tmp
$ yum localinstall elasticsearch-5.6.8.rpm grafana-5.0.4-1.x86_64.rpm -y

© IBM Corporation 8
$ cd /tmp
$ yum localinstall elasticsearch-5.6.8.rpm grafana-5.0.4-1.x86_64.rpm -y
Loaded plugins: langpacks, product-id, search-disabled-repos
Examining elasticsearch-5.6.8.rpm: elasticsearch-5.6.8-1.noarch
Marking elasticsearch-5.6.8.rpm to be installed
Examining grafana-5.0.4-1.x86_64.rpm: grafana-5.0.4-1.x86_64
Marking grafana-5.0.4-1.x86_64.rpm to be installed
Resolving Dependencies
--> Running transaction check
---> Package elasticsearch.noarch 0:5.6.8-1 will be installed
---> Package grafana.x86_64 0:5.0.4-1 will be installed
--> Finished Dependency Resolution
Dependencies Resolved
================================================================================================
===========================================================================
Package Arch Version
Repository Size
================================================================================================
===========================================================================
Installing:
elasticsearch noarch 5.6.8-1
/elasticsearch-5.6.8 36 M
grafana x86_64 5.0.4-1
/grafana-5.0.4-1.x86_64 149 M
Transaction Summary
================================================================================================
===========================================================================
Install 2 Packages
Total size: 185 M
Installed size: 185 M
Downloading packages:
Running transaction check
Running transaction test
Transaction test succeeded
Running transaction
Warning: RPMDB altered outside of yum.
Installing : grafana-5.0.4-1.x86_64
1/2
### NOT starting on installation, please execute the following statements to configure grafana
to start automatically using systemd
sudo /bin/systemctl daemon-reload
sudo /bin/systemctl enable grafana-server.service
### You can start grafana-server by executing
sudo /bin/systemctl start grafana-server.service
Creating elasticsearch group... OK
Creating elasticsearch user... OK
Installing : elasticsearch-5.6.8-1.noarch
2/2
### NOT starting on installation, please execute the following statements to configure
elasticsearch service to start automatically using systemd
sudo systemctl daemon-reload
sudo systemctl enable elasticsearch.service
### You can start elasticsearch service by executing
sudo systemctl start elasticsearch.service
POSTTRANS: Running script
Verifying : elasticsearch-5.6.8-1.noarch
1/2
Verifying : grafana-5.0.4-1.x86_64
2/2
Installed:
elasticsearch.noarch 0:5.6.8-1 grafana.x86_64
0:5.0.4-1
Complete!

© IBM Corporation 9
2.1.3. Post-installation steps for Elasticsearch
Use the following steps for setting up the Elasticsearch instance on single node for the use with EE
Dashboard.
Refer to the information at the following URLs to learn more about the configuration setting of Elasticsearch.
https://www.elastic.co/guide/en/elasticsearch/reference/5.6/system-config.html
https://www.elastic.co/guide/en/elasticsearch/reference/5.6/important-settings.html
1) Unpack ibmsa-dashboard-xxx.tar.gz file
2) Edit /etc/elasticsearch/jvm.options file. Find the -Xms and -Xmx lines and increase the JVM
heap memory size. (This example assumes the monitoring server has 32 GB physical memory.)
-Xms24g
-Xmx24g
3) Edit /etc/elasticsearch/elasticsearch.yml file. Find the bootstrap.memory_lock and
network.host lines, uncomment the lines by removing the hash character (#) at the beginning of line, and
update values as below.
bootstrap.memory_lock: true
network.host: 0.0.0.0
You can also customize the location of Elasticsearch data by changing the path.data value in
elasticsearch.yml file. (The default location is /var/lib/elasticsearch directory)
4) Enable the log rotation for Elasticsearch
$ cd /tmp
$ tar zxvf ibmsa-dashboard-1.3.x.x-xxxxx.tar.gz
ibmsa-dashboard-1.3.x.x-xxxxx/
ibmsa-dashboard-1.3.x.x-xxxxx/grafana/
ibmsa-dashboard-1.3.x.x-xxxxx/grafana/task.json
ibmsa-dashboard-1.3.x.x-xxxxx/grafana/activity.json
ibmsa-dashboard-1.3.x.x-xxxxx/grafana/health.json
ibmsa-dashboard-1.3.x.x-xxxxx/grafana/ibmsa-logrotate-grafana
ibmsa-dashboard-1.3.x.x-xxxxx/grafana/config.json
ibmsa-dashboard-1.3.x.x-xxxxx/grafana/storage.json
ibmsa-dashboard-1.3.x.x-xxxxx/elasticsearch/
ibmsa-dashboard-1.3.x.x-xxxxx/elasticsearch/log4j2.properties
ibmsa-dashboard-1.3.x.x-xxxxx/systemtap/
ibmsa-dashboard-1.3.x.x-xxxxx/systemtap/ibmsa-stat-driveperf-wrapper.py
ibmsa-dashboard-1.3.x.x-xxxxx/systemtap/ibmsa-stat-driveperf.stp
ibmsa-dashboard-1.3.x.x-xxxxx/logstash/
ibmsa-dashboard-1.3.x.x-xxxxx/logstash/ibmsa-stat-logstash-common.conf
ibmsa-dashboard-1.3.x.x-xxxxx/logstash/ibmsa-stat-logstash-onlyonenode.conf
ibmsa-dashboard-1.3.x.x-xxxxx/logstash/log4j2.properties
$ cp /tmp/ibmsa-dashboard-1.3.x.x-xxxxx/elasticsearch/log4j2.properties
/etc/elasticsearch/log4j2.properties
cp: overwrite '/etc/elasticsearch/log4j2.properties'?y

© IBM Corporation 10
5) Edit /etc/sysconfig/elasticsearch file. Find MAX_LOCKED_MEMORY= line, uncomment the line
by removing the hash character (#) at the beginning of line, and set the value to unlimited as below.
MAX_LOCKED_MEMORY=unlimited
6) Run the following command to edit override.conf of Elasticsearch, which should be blank initially.
Add the following two lines and save.
[Service]
LimitMEMLOCK=infinity
2.1.4. Post-installation steps for Grafana
1) Enable the log rotation by logrotate command for Grafana
2) Edit /etc/grafana/grafana.ini file. Find the log_rotate= line, delete the semicolon character
(;) at the beginning of line, and change the value from true to false as below.
log_rotate = false
2.1.5. Starting Elasticsearch and Grafana
1) Reload systemd config file:
2) Start Elasticsearch:
Check the progress and status by systemctl status elasticsearch.service command, and
make sure that Active: field of command output displays 'active (running)'
$ systemctl edit elasticsearch.service
$ cd /tmp/ibmsa-dashboard-1.3.x.x-xxxxx/grafana
$ cp ibmsa-logrotate-grafana /etc/logrotate.d/
$ chmod 644 /etc/logrotate.d/ibmsa-logrotate-grafana
$ systemctl daemon-reload
$ systemctl start elasticsearch.service
© IBM Corporation 11
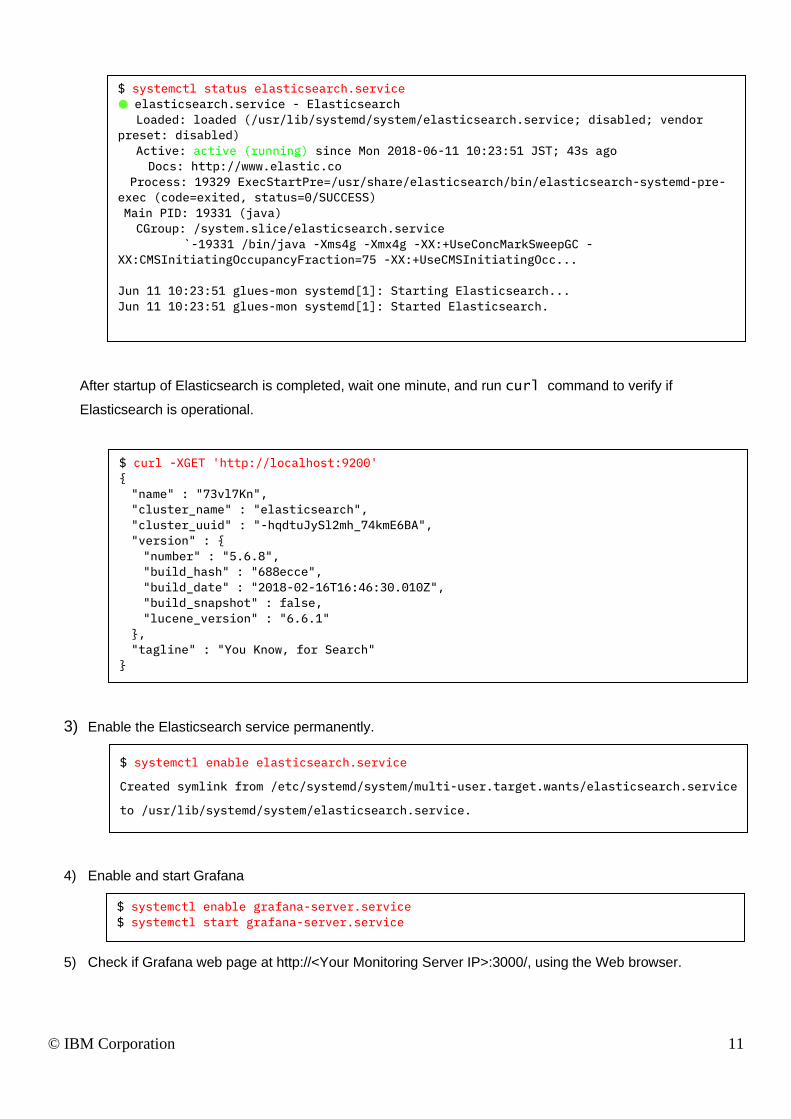
After startup of Elasticsearch is completed, wait one minute, and run curl command to verify if
Elasticsearch is operational.
3) Enable the Elasticsearch service permanently.
4) Enable and start Grafana
5) Check if Grafana web page at http://<Your Monitoring Server IP>:3000/, using the Web browser.
$ systemctl status elasticsearch.service
● elasticsearch.service - Elasticsearch
Loaded: loaded (/usr/lib/systemd/system/elasticsearch.service; disabled; vendor
preset: disabled)
Active: active (running) since Mon 2018-06-11 10:23:51 JST; 43s ago
Docs: http://www.elastic.co
Process: 19329 ExecStartPre=/usr/share/elasticsearch/bin/elasticsearch-systemd-pre-
exec (code=exited, status=0/SUCCESS)
Main PID: 19331 (java)
CGroup: /system.slice/elasticsearch.service
-19331 /bin/java -Xms4g -Xmx4g -XX:+UseConcMarkSweepGC -
XX:CMSInitiatingOccupancyFraction=75 -XX:+UseCMSInitiatingOcc...
Jun 11 10:23:51 glues-mon systemd[1]: Starting Elasticsearch...
Jun 11 10:23:51 glues-mon systemd[1]: Started Elasticsearch.
$ curl -XGET 'http://localhost:9200'
{
"name" : "73vl7Kn",
"cluster_name" : "elasticsearch",
"cluster_uuid" : "-hqdtuJySl2mh_74kmE6BA",
"version" : {
"number" : "5.6.8",
"build_hash" : "688ecce",
"build_date" : "2018-02-16T16:46:30.010Z",
"build_snapshot" : false,
"lucene_version" : "6.6.1"
},
"tagline" : "You Know, for Search"
}
$ systemctl enable elasticsearch.service
Created symlink from /etc/systemd/system/multi-user.target.wants/elasticsearch.service
to /usr/lib/systemd/system/elasticsearch.service.
$ systemctl enable grafana-server.service
$ systemctl start grafana-server.service

© IBM Corporation 12
2.2. Configuring EE node for Dashboard
Complete the following tasks, on all EE nodes.
1. Unpacking the required files
2. Installing SystemTap
3. Installing Logstash
4. Post-installation steps for Logstash
5. Starting Logstash
2.2.1. Unpacking the required files on EE node
Copy the ibmsa-dashboard-xxx.tar.gz file to /tmp directory and extract the files
The files under logstash and systemtap directories will be used in the section 2.2.
2.2.2. Installing SystemTap
SystemTap is required for collecting the data for Activity Page, and you can skip this step if you are not going
to use the Activity Page.
Refer to the following URLs for the detail of SystemTap.
https://access.redhat.com/documentation/en-US/Red_Hat_Enterprise_Linux/7/html-
single/SystemTap_Beginners_Guide/index.html
Use yum command to install SystemTap and dependencies.
$ cp /root/rpm/RHEL7/ibmsa-dashboard-1.3.x.x-xxxxx.tar.gz /tmp
$ cd /tmp
$ tar zxvf ibmsa-dashboard-1.3.x.x-xxxxx.tar.gz
ibmsa-dashboard-1.3.x.x-xxxxx/
ibmsa-dashboard-1.3.x.x-xxxxx/grafana/
ibmsa-dashboard-1.3.x.x-xxxxx/grafana/task.json
ibmsa-dashboard-1.3.x.x-xxxxx/grafana/activity.json
ibmsa-dashboard-1.3.x.x-xxxxx/grafana/health.json
ibmsa-dashboard-1.3.x.x-xxxxx/grafana/ibmsa-logrotate-grafana
ibmsa-dashboard-1.3.x.x-xxxxx/grafana/config.json
ibmsa-dashboard-1.3.x.x-xxxxx/grafana/storage.json
ibmsa-dashboard-1.3.x.x-xxxxx/elasticsearch/
ibmsa-dashboard-1.3.x.x-xxxxx/elasticsearch/log4j2.properties
ibmsa-dashboard-1.3.x.x-xxxxx/systemtap/
ibmsa-dashboard-1.3.x.x-xxxxx/systemtap/ibmsa-stat-driveperf-wrapper.py
ibmsa-dashboard-1.3.x.x-xxxxx/systemtap/ibmsa-stat-driveperf.stp
ibmsa-dashboard-1.3.x.x-xxxxx/logstash/
ibmsa-dashboard-1.3.x.x-xxxxx/logstash/ibmsa-stat-logstash-common.conf
ibmsa-dashboard-1.3.x.x-xxxxx/logstash/ibmsa-stat-logstash-onlyonenode.conf
ibmsa-dashboard-1.3.x.x-xxxxx/logstash/log4j2.properties

© IBM Corporation 13
Note: When you update the OS/kernel version after the initial installation of Dashboard completed,
you also need to update the kernel-devel package at that time to make SystemTap to work.
2.2.3. Installing Logstash
Install logstash using yum command.
$ yum install -y systemtap systemtap-runtime kernel-devel-$(uname -r)
$ cd /root/rpm/dashboard/Elastic
$ yum localinstall logstash-5.6.8.rpm -y
Loaded plugins: product-id, search-disabled-repos, subscription-manager
Examining logstash-5.6.8.rpm: 1:logstash-5.6.8-1.noarch
Marking logstash-5.6.8.rpm to be installed
Resolving Dependencies
--> Running transaction check
---> Package logstash.noarch 1:5.6.8-1 will be installed
--> Finished Dependency Resolution
Dependencies Resolved
======================================================================================
============================================
Package Arch Version
Repository Size
======================================================================================
============================================
Installing:
logstash noarch 1:5.6.8-1
/logstash-5.6.8 183 M
Transaction Summary
======================================================================================
============================================
Install 1 Package
Total size: 183 M
Installed size: 183 M
Downloading packages:
Running transaction check
Running transaction test
Transaction test succeeded
Running transaction
Installing : 1:logstash-5.6.8-1.noarch
1/1
Using provided startup.options file: /etc/logstash/startup.options
Successfully created system startup script for Logstash
Verifying : 1:logstash-5.6.8-1.noarch
1/1
Installed:
logstash.noarch 1:5.6.8-1
Complete!

© IBM Corporation 14
2.2.4. Post-installation steps for Logstash
1) Designate one of EE nodes for collecting the cluster-wide information.
Logstash collects the statistics and the event information from each EE node by running a set of
commands locally, and all EE nodes feed the independently collected information to single
Elasticsearch database. The information can be categorized into two groups; one is cluster-wide and
common information and the other is node specific, and the former needs be collected only by one of
EE nodes to avoid the duplication.
Depending on the role of node, one or two pipeline configuration files need to be copied to
/etc/logstash/conf.d directory of that node.
• ibmsa-stat-logstash-common.conf … required on all EE nodes
• ibmsa-stat-logstash-onlyonenode.conf … required only on one of EE nodes
So, one node should have two pipeline configuration files under the /etc/logstash/conf.d
directory, while all the other nodes should have just one pipeline configuration file under the directory.
Any node could have ibmsa-stat-logstash-onlyonenode.conf file, but it is recommended to use one of
standby control nodes, just to remember easily. For the EE cluster with two tape libraries, you only
need one designated node for ibmsa-stat-logstash-onlyonenode.conf.
Note: In case the node with ibmsa-stat-logstash-onlyonenode.conf becomes nonfunctional due to some
failure or planned maintenance, ibmsa-stat-logstash-onlyonenode.conf needs to be moved to another
node manually.
2) Place ibmsa-stat-logstash-common.conf file onto all the Spectrum Archive EE nodes as below:
3) Place ibmsa-stat-logstash-onlyonenode.conf file onto only one node in the EE cluster.
4) Edit /etc/logstash/logstash.yml file. Find the pipeline.workers line, uncomment the line
by removing the hash character (#) at the beginning of line, and update the value as below.
pipeline.workers: 1
$ cp /tmp/ibmsa-dashboard-1.3.x.x-xxxxx/logstash/ibmsa-stat-logstash-common.conf
/etc/logstash/conf.d/
$ cp /tmp/ibmsa-dashboard-1.3.x.x-xxxxx/logstash/ibmsa-stat-logstash-onlyonenode.conf
/etc/logstash/conf.d/

© IBM Corporation 15
5) Edit /etc/logstash/startup.options file. Find the LS_OPTS= and LS_USER= lines and
update the value as below.
LS_OPTS="--path.settings ${LS_SETTINGS_DIR} --config.reload.automatic"
LS_USER=root
6) Run the system-install command to create the new startup configuration file:
7) Check if Elasticsearch can be accessed from a Spectrum Archive EE node:
An example of command result if monitoring server uses IP address 192.168.56.102,
If the command returns an error, check the IP address of monitoring server, check if the network port 9200
is available, check if Elasticsearch on monitoring server is running.
8) Get GPFS Cluster ID by mmlscluster command.
In the above case, 8030362133662912158 is the GPFS Cluster ID.
9) Create /etc/sysconfig/logstash. Add the following lines based on the information obtained in
steps 7 and 8.
LS_IBMSA_ES_IP=<Your Monitoring Server IP>
LS_IBMSA_ES_PORT=<Network port number of your Elasticsearch. 9200 by default>
LS_IBMSA_CLUSTER_ID=<GPFS ClusterID>
$ /usr/share/logstash/bin/system-install
Successfully created system startup script for Logstash
$ curl -XGET 'http://<Your Monitoring Server IP>:9200'
$ mmlscluster | egrep 'cluster id'
GPFS cluster id: 8030362133662912158
$ curl -XGET 'http://192.168.56.102:9200'
{
"name" : "73vl7Kn",
"cluster_name" : "elasticsearch",
"cluster_uuid" : "-hqdtuJySl2mh_74kmE6BA",
"version" : {
"number" : "5.6.8",
"build_hash" : "688ecce",
"build_date" : "2018-02-16T16:46:30.010Z",
"build_snapshot" : false,
"lucene_version" : "6.6.1"
},
"tagline" : "You Know, for Search"
}

© IBM Corporation 16
LS_IBMSA_EXEC_INTERVAL=600
LS_IBMSA_DPERF_INTERVAL=60
An example of logstash file:
LS_IBMSA_ES_IP=192.168.56.102
LS_IBMSA_ES_PORT=9200
LS_IBMSA_CLUSTER_ID=8030362133662912158
LS_IBMSA_EXEC_INTERVAL=600
LS_IBMSA_DPERF_INTERVAL=60
Tips: LS_IBMSA_EXEC_INTERVAL and LS_IBMSA_DPERF_INTERVAL define the interval (in seconds)
at which the information is captured. LS_IBMSA_EXEC_INTERVAL is for the information through eeadm
command, and LS_IBMSA_DPERF_INTERVAL is for the drive activity information using SystemTap. The
smaller numbers in *_INTERVAL will stress the system more, and thus it is recommended to use the
default value as the minimum. Set LS_IBMSA_EXEC_INTERVAL to 3600 (an hour) at most. Restart
Logstash by systemctl restart logstash.service command when you make the changes to
those values.
10) Enable the log rotation of Logstash.
11) Copy SystemTap configuration files:
2.2.5. Starting Logstash
1) Before starting the Logstash, make sure that Spectrum Archive EE is active by using eeadm node
list command.
$ cp /tmp/ibmsa-dashboard-1.3.x.x-xxxxx/logstash/log4j2.properties /etc/logstash/
cp: overwrite '/etc/logstash/log4j2.properties'?y
$ mkdir -p /opt/ibm/ltfsee/dashboard/systemtap
$ cd /opt/ibm/ltfsee/dashboard/systemtap/
$ cp /tmp/ibmsa-dashboard-1.3.x.x-xxxxx/systemtap/ibmsa-stat-driveperf.stp .
$ cp /tmp/ibmsa-dashboard-1.3.x.x-xxxxx/systemtap/ibmsa-stat-driveperf-wrapper.py .
$ chmod +x *
$ eeadm node list
Node ID State Node IP Drives Ctrl Node Library Node Group Host Name
1 Available 192.168.33.85 1 yes(active) lib1 ng1 node1

© IBM Corporation 17
2) Start the Logstash.
Watch the status and progress of Logstash by systemctl status logstash.service command,
and check if it started successfully. You may need to wait for about five minutes before Logstash starts
collecting the data. If it starts up correctly, you will see that the process of “/usr/bin/python2
/opt/ibm/ltfsee/dashboard/systemtap/ibmsa-stat-driveperf-wrapper.py” in CGroup field of command output.
$ systemctl start logstash.service
$ systemctl status logstash.service -l
● logstash.service - logstash
Loaded: loaded (/etc/systemd/system/logstash.service; enabled; vendor preset: disabled)
Active: active (running) since Wed 2021-05-19 21:13:57 EDT; 7min ago
Main PID: 823 (java)
Tasks: 55
CGroup: /system.slice/logstash.service
├─ 823 /usr/bin/java -XX:+UseParNewGC -XX:+UseConcMarkSweepGC -
XX:CMSInitiatingOccupancyFraction=75 -XX:+UseCMSInitiatingOccupancyOnly -XX:+DisableExplicitGC -
Djava.awt.headless=true -Dfile.encoding=UTF-8 -XX:+HeapDumpOnOutOfMemoryError -Xmx1g -Xms256m -
Xss2048k -Djffi.boot.library.path=/usr/share/logstash/vendor/jruby/lib/jni -
Xbootclasspath/a:/usr/share/logstash/vendor/jruby/lib/jruby.jar -classpath : -
Djruby.home=/usr/share/logstash/vendor/jruby -Djruby.lib=/usr/share/logstash/vendor/jruby/lib -
Djruby.script=jruby -Djruby.shell=/bin/sh org.jruby.Main
/usr/share/logstash/lib/bootstrap/environment.rb logstash/runner.rb --path.settings
/etc/logstash --config.reload.automatic
├─10965 /usr/bin/python2 /opt/ibm/ltfsee/dashboard/systemtap/ibmsa-stat-driveperf-
wrapper.py 60
├─11684 stap /opt/ibm/ltfsee/dashboard/systemtap/ibmsa-stat-driveperf.stp 60 1
spectrumscale VDRIVE0000 3cbff040-8c36-4dbe-9073-594e77aba756 VDRIVE0001 3cbff040-8c36-4dbe-
9073-594e77aba756 VDRIVE0002 3cbff040-8c36-4dbe-9073-594e77aba756 VDRIVE0003 3cbff040-8c36-4dbe-
9073-594e77aba756 x x x x x x x x x x x x x x x x x x x x x x x x
└─11739 /usr/libexec/systemtap/stapio -R stap_260429dbb57ec335c4d29ee48e62ed4d_11739 -
F4
May 19 21:17:19 spectrumscale eeadm[10968]:
GLES,60a5b89f,35d45,spectrumscale,eeadm,L,1e8,a7fe3087,1cc,2ad8,2ad8,/opt/ibm/ltfsee/bin/eeadm
drive list --json
May 19 21:17:19 spectrumscale eeadm[10971]:
GLES,60a5b89f,47b8e,spectrumscale,eeadm,L,1e8,a7fe3087,1cc,2adb,2adb,/opt/ibm/ltfsee/bin/eeadm
library list --json
May 19 21:17:19 spectrumscale eeadm[10973]:
GLES,60a5b89f,52d14,spectrumscale,eeadm,L,1e8,a7fe3087,1cc,2add,2add,/opt/ibm/ltfsee/bin/eeadm
nodegroup list --json
May 19 21:17:19 spectrumscale eeadm[11158]:
GLES,60a5b89f,c1bf3,spectrumscale,eeadm,L,1e8,a7fe3087,1cc,2b96,2b96,/opt/ibm/ltfsee/bin/eeadm
task list --json --dashboard --both-act-comp --num-tasks 10000
May 19 21:17:19 spectrumscale eeadm[11168]:
GLES,60a5b89f,cc4fc,spectrumscale,eeadm,L,1e8,a7fe3087,1cc,2ba0,2ba0,/opt/ibm/ltfsee/bin/eeadm
task list --count-tasks --num-tasks 1000
May 19 21:17:22 spectrumscale eeadm[10974]:
GLES,60a5b8a2,71bd1,spectrumscale,eeadm,A,3ac,53cc49f9,89,2ade,2ade,10.0.2.15,4
May 19 21:17:22 spectrumscale eeadm[10974]:
GLES,60a5b8a2,7377f,spectrumscale,eeadm,A,3ad,53cc49f9,a6,2ade,2ade,10.0.2.15,4
May 19 21:17:22 spectrumscale eeadm[10974]:
GLES,60a5b8a2,739c3,spectrumscale,eeadm,A,3ad,53cc49f9,a6,2ade,2ade,10.0.2.15,-1
May 19 21:17:22 spectrumscale eeadm[10974]:
GLES,60a5b8a2,739e9,spectrumscale,eeadm,A,3ad,53cc49f9,a6,2ade,2ade,10.0.2.15,-1
May 19 21:17:24 spectrumscale eeadm[11669]:
GLES,60a5b8a4,2371e,spectrumscale,eeadm,L,1e8,a7fe3087,1cc,2d95,2d95,/opt/ibm/ltfsee/bin/eeadm
drive list --json

© IBM Corporation 18
3) Enable Logstash to make it start automatically when the EE node starts.
$ systemctl enable logstash.service

© IBM Corporation 19
2.3. Customizing Grafana for EE Dashboard
Complete the following tasks using the Web browser.
1. Connect Grafana to Elasticsearch
2. Import pre-defined views
2.3.1. Connecting Grafana to Elasticsearch
Step 1. Start the web browser on one of EE node
Step 2. Access the web page at http://<Your Monitoring Server IP>:3000/
Grafana login screen should appear. Enter the default user id and password.
• User: admin
• Password: admin
Step 3. 1) Click the gear icon from the left, and 2) select "Data Sources". If no icon appears on the left,
click Grafana logo at the upper left corner.
Step 4. Click green "+ Add data source" button. Fill in the required fields as below:
Name: Type the name of data source just for displaying purpose
Default: Set the checkbox
(1)
(2)

© IBM Corporation 20
Type: select “Elasticsearch”
HTTP setting
• URL: http://localhost:9200
• Access: proxy
Elasticsearch details
• Index name : ibmsa-*
• Pattern: No pattern
• Time field name: @timestamp
• Version : 5.x
Press 'Save & Test' button. Make sure that a message "Index OK. Time field name OK." in a green box
is showed as below after testing.

© IBM Corporation 21
2.3.2. Importing pre-defined views
Each page in Grafana is called as dashboard. In this document, Grafana dashboard is sometimes called as
"view" or "page" to distinguish it from Spectrum Archive Dashboard.
The pre-defined view is provided in JSON format (*.json file), and the step at the section 2.2.1 already
extracted the five JSON files under /tmp/ibmsa-dashboard-1.3.x.x-xxxxx/grafana directory
activity.json, config.json, health.json, storage.json, task.json
Step 1. 1) Click the plus sign icon from the left pane and 2) select “Import”.
(1)
(2)

© IBM Corporation 22
Step 2. Click green “Upload .json File” button. Select one of JSON files in /tmp/ibmsa-dashboard-
1.3.x.x-xxxxx/grafana directory by File Upload dialog and click Open at the upper right corner.
Step 3. Specify the options, and then click “Import” button.
Name: (Optional) change the name of dashboard
Datasource: specify the name of datasource created at the section 2.3.1
Note: Starting from EE version 1.3.1.3, the task.json requires only one datasource, just like others.
Step 4. Repeat steps 1 to 3 for all five json files at once, or you can import only the ones you are going to use.
Step 5. The imported views are accessible by 1) clicking the Dashboards icon from the left pane, 2)
selecting the “home* or “manage”, and selecting a view from the list of available views.
(1)
(2)

© IBM Corporation 23
3. Upgrading the Dashboard
Complete the following tasks when you upgrade the Spectrum Archive EE software, and make Dashboard
software in sync with EE software version.
1. Upgrade the software on all EE nodes
2. Upgrade the software on monitoring server
3.1. Upgrading the software on EE node
3.1.1. Unpack the required files
Copy the ibmsa-dashboard-xxx.tar.gz file to /tmp directory and extract the files
3.1.2. Upgrading Logstash and pipeline configuration files
Refer to the general information about the Logstash Upgrade process at:
https://www.elastic.co/guide/en/logstash/5.6/upgrading-logstash.html
1) Stop Logstash
$ cp /root/rpm/RHEL7/ibmsa-dashboard-1.3.x.x-xxxxx.tar.gz /tmp
$ cd /tmp
$ tar zxvf ibmsa-dashboard-1.3.x.x-xxxxx.tar.gz
ibmsa-dashboard-1.3.x.x-xxxxx/
ibmsa-dashboard-1.3.x.x-xxxxx/grafana/
ibmsa-dashboard-1.3.x.x-xxxxx/grafana/task.json
ibmsa-dashboard-1.3.x.x-xxxxx/grafana/activity.json
ibmsa-dashboard-1.3.x.x-xxxxx/grafana/health.json
ibmsa-dashboard-1.3.x.x-xxxxx/grafana/ibmsa-logrotate-grafana
ibmsa-dashboard-1.3.x.x-xxxxx/grafana/config.json
ibmsa-dashboard-1.3.x.x-xxxxx/grafana/storage.json
ibmsa-dashboard-1.3.x.x-xxxxx/elasticsearch/
ibmsa-dashboard-1.3.x.x-xxxxx/elasticsearch/log4j2.properties
ibmsa-dashboard-1.3.x.x-xxxxx/systemtap/
ibmsa-dashboard-1.3.x.x-xxxxx/systemtap/ibmsa-stat-driveperf-wrapper.py
ibmsa-dashboard-1.3.x.x-xxxxx/systemtap/ibmsa-stat-driveperf.stp
ibmsa-dashboard-1.3.x.x-xxxxx/logstash/
ibmsa-dashboard-1.3.x.x-xxxxx/logstash/ibmsa-stat-logstash-common.conf
ibmsa-dashboard-1.3.x.x-xxxxx/logstash/ibmsa-stat-logstash-onlyonenode.conf
ibmsa-dashboard-1.3.x.x-xxxxx/logstash/log4j2.properties
$ systemctl stop logstash.service

© IBM Corporation 24
2) Check the current installed version. If you are using version 5.6.8 or later, jump over to step 4
3) Update Logstash
$ yum list installed | grep logstash
logstash.noarch 1:x.x.x-x @/logstash-x.x.x
$ systemctl stop logstash.service
$ cd /root/rpm/dashboard/Elastic
$ yum localupdate logstash-5.6.8.rpm -y

© IBM Corporation 25
Example of command output:
4) Update log4j2 configuration file
5) Update pipeline configuration files under /etc/logstash/conf.d.
$ yum localupdate logstash-5.6.8.rpm -y
Loaded plugins: product-id, rhnplugin, search-disabled-repos
Examining logstash-5.6.8.rpm: 1:logstash-5.6.8-1.noarch
Marking logstash-5.6.8.rpm as an update to 1:logstash-5.1.1-1.noarch
Resolving Dependencies
--> Running transaction check
---> Package logstash.noarch 1:5.1.1-1 will be updated
---> Package logstash.noarch 1:5.6.8-1 will be an update
--> Finished Dependency Resolution
Dependencies Resolved
================================================================================================
=============================
Package Arch Version Repository
Size
================================================================================================
=============================
Updating:
logstash noarch 1:5.6.8-1 /logstash-5.6.8
183 M
Transaction Summary
================================================================================================
=============================
Upgrade 1 Package
Total size: 183 M
Downloading packages:
Running transaction check
Running transaction test
Transaction test succeeded
Running transaction
Warning: RPMDB altered outside of yum.
Updating : 1:logstash-5.6.8-1.noarch
1/2
warning: /etc/logstash/logstash.yml created as /etc/logstash/logstash.yml.rpmnew
Using provided startup.options file: /etc/logstash/startup.options
Successfully created system startup script for Logstash
Cleanup : 1:logstash-5.1.1-1.noarch
2/2
vtd | 4.1 kB
00:00:00
Verifying : 1:logstash-5.6.8-1.noarch
1/2
Verifying : 1:logstash-5.1.1-1.noarch
2/2
Updated:
logstash.noarch 1:5.6.8-1
Complete!
$ cp /tmp/ibmsa-dashboard-1.3.x.x-xxxxx/logstash/log4j2.properties /etc/logstash/
cp: overwrite '/etc/logstash/log4j2.properties'? y

© IBM Corporation 26
For all EE nodes,
Additionally, if this node already has ibmsa-stat-logstash-onlyonenode.conf file in /etc/logstash/conf.d/
Run the system-install command to create the new startup configuration file:
6) Update SystemTap configuration files
7) Restart the upgraded Logstash.
8) Repeat the steps 1 to 7 on all EE nodes.
$ cp /tmp/ibmsa-dashboard-1.3.x.x-xxxxx/logstash/ibmsa-stat-logstash-common.conf
/etc/logstash/conf.d/
cp: overwrite ‘/etc/logstash/conf.d/ibmsa-stat-logstash-common.conf’? y
$ cp /tmp/ibmsa-dashboard-1.3.x.x-xxxxx/logstash/ibmsa-stat-logstash-onlyonenode.conf
/etc/logstash/conf.d/
cp: overwrite ‘/etc/logstash/conf.d/ibmsa-stat-logstash-onlyonenode.conf’? y
$ /usr/share/logstash/bin/system-install
Successfully created system startup script for Logstash
$ cd /opt/ibm/ltfsee/dashboard/systemtap/
$ cp /tmp/ibmsa-dashboard-1.3.x.x-xxxxx/systemtap/ibmsa-stat-driveperf.stp .
cp: overwrite ‘./ibmsa-stat-driveperf.stp’? y
$ cp /tmp/ibmsa-dashboard-1.3.x.x-xxxxx/systemtap/ibmsa-stat-driveperf-wrapper.py .
cp: overwrite ‘./ibmsa-stat-driveperf-wrapper.py’? y
$ systemctl restart logstash.service

© IBM Corporation 27
3.2. Upgrading the software on Monitoring Server
3.2.1. Copying the required files from EE node to Monitoring Server
Copy the ibmsa-dashboard-xxx.tar.gz file and two other RPMs, from /root/rpm/ directory of EE
node to /tmp directory of the monitoring server.
3.2.2. Upgrading Elasticsearch
The following steps will perform the rolling upgrade (especially for the case you had been using Elasticsearch
version 5.1.1 with older version of Spectrum Archive EE).
Refer to the general information about upgrading Elasticsearch at.
https://www.elastic.co/guide/en/elastic-stack/5.6/upgrading-elastic-stack.html
https://www.elastic.co/guide/en/elasticsearch/reference/5.6/setup-upgrade.html
https://www.elastic.co/guide/en/elasticsearch/reference/5.6/rolling-upgrades.html
1) Check the current installed version. Skip the remaining steps of section 3.2.2 if you are using version
5.6.8 or later.
2) Disable shard allocation
When you shut down a node, the allocation process will wait for one minute before starting to replicate the
shards that were on that node to other nodes in the cluster, causing a lot of wasted I/O. This can be
avoided by disabling allocation before stopping Elasticsearch:
$ cd /root/rpm/
$ scp RHEL7/ibmsa-dashboard-1.3.x.x-xxxxx.tar.gz dashboard/Elastic/elasticsearch-5.6.8.rpm
dashboard/Grafana/grafana-5.0.4-1.x86_64.rpm <Your ID>@<Your Monitoring Server IP>:/tmp
[email protected]'s password:
ibmsa-dashboard-1.3.1.3-52105.tar.gz 100% 18KB 9.1MB/s 00:00
elasticsearch-5.6.8.rpm 100% 32MB 43.2MB/s 00:00
grafana-5.0.4-1.x86_64.rpm 100% 49MB 55.2MB/s 00:00
$ curl -X PUT "localhost:9200/_cluster/settings" -H 'Content-Type: application/json' -d'
{
"transient": {
"cluster.routing.allocation.enable": "none"
}
}
'
$ yum list installed | grep elasticsearch
elasticsearch.noarch x.x.x-x installed

© IBM Corporation 28
Note: If you do copy & paste the command from above, do not forget to copy the single quote character
(‘) in the last line.
Example of command output:
3) Stop Elasticsearch
4) Upgrade the software
Example of command output:
$ curl -X PUT "localhost:9200/_cluster/settings" -H 'Content-Type: application/json' -d'
{
"transient": {
"cluster.routing.allocation.enable": "none"
}
}
'
{"acknowledged":true,"persistent":{},"transient":{"cluster":{"routing":{"allocation":{"enable":"
none"}}}}}
$ systemctl stop elasticsearch.service
$ cd /tmp
$ yum localupdate elasticsearch-5.6.8.rpm -y

© IBM Corporation 29
5) Upgrade any plugins
Elasticsearch plugins must be upgraded when upgrading your Elasticsearch if any Elasticsearch plugins
have been installed. Use the “elasticsearch-plugin” script in /usr/share/elasticsearch/bin
directory to install the correct version of any plugins that you need.
6) Enable the log rotation for Elasticsearch
$ yum localupdate elasticsearch-5.6.8.rpm -y
Loaded plugins: product-id, search-disabled-repos, subscription-manager
Examining elasticsearch-5.6.8.rpm: elasticsearch-5.6.8-1.noarch
Marking elasticsearch-5.6.8.rpm as an update to elasticsearch-5.1.1-1.noarch
Resolving Dependencies
--> Running transaction check
---> Package elasticsearch.noarch 0:5.1.1-1 will be updated
---> Package elasticsearch.noarch 0:5.6.8-1 will be an update
--> Finished Dependency Resolution
Dependencies Resolved
================================================================================================
====================================
Package Arch Version Repository
Size
================================================================================================
====================================
Updating:
elasticsearch noarch 5.6.8-1 /elasticsearch-
5.6.8 36 M
Transaction Summary
================================================================================================
====================================
Upgrade 1 Package
Total size: 36 M
Downloading packages:
Running transaction check
Running transaction test
Transaction test succeeded
Running transaction
Updating : elasticsearch-5.6.8-1.noarch
1/2
warning: /etc/elasticsearch/elasticsearch.yml created as
/etc/elasticsearch/elasticsearch.yml.rpmnew
warning: /etc/sysconfig/elasticsearch created as /etc/sysconfig/elasticsearch.rpmnew
warning: /usr/lib/systemd/system/elasticsearch.service created as
/usr/lib/systemd/system/elasticsearch.service.rpmnew
Cleanup : elasticsearch-5.1.1-1.noarch
2/2
Verifying : elasticsearch-5.6.8-1.noarch
1/2
Verifying : elasticsearch-5.1.1-1.noarch
2/2
Updated:
elasticsearch.noarch 0:5.6.8-1
Complete!
$ cp /tmp/ibmsa-dashboard-1.3.x.x-xxxxx/elasticsearch/log4j2.properties
/etc/elasticsearch/log4j2.properties
cp: overwrite '/etc/elasticsearch/log4j2.properties'?y

© IBM Corporation 30
7) Restart the upgraded Elasticsearch
Confirm that it joins the cluster by checking the log file or by checking the output of this request:
8) Reenable shard allocation
Once the node has joined the cluster, reenable shard allocation to start using the node:
Note: If you do copy & paste the command from above, do not forget to copy the single quote character
(‘) in the last line.
Example of command output:
9) Wait for the node to recover
You should wait for the cluster to finish shard allocation before upgrading the next node. You can check on
progress with the _cat/health request:
Wait for the status column to move from “yellow” to “green”. Status “green” means that all primary and replica
shards have been allocated.
Note: If the status was “yellow” before upgrading, the status remains “yellow” even if the shard
allocation is finished.
$ systemctl restart elasticsearch.service
$ curl -X GET "localhost:9200/_cat/nodes"
192.168.208.5 4 26 0 0.04 0.03 0.05 mdi * oHNdMaw
$ curl -X PUT "localhost:9200/_cluster/settings" -H 'Content-Type: application/json' -d'
{
"transient": {
"cluster.routing.allocation.enable": "all"
}
}
'
$ curl -X PUT "localhost:9200/_cluster/settings" -H 'Content-Type: application/json' -d'
{
"transient": {
"cluster.routing.allocation.enable": "all"
}
}
'
{"acknowledged":true,"persistent":{},"transient":{"cluster":{"routing":{"allocation":{"enable":"
all"}}}}}
$ curl -X GET "localhost:9200/_cat/health"
1620888465 15:47:45 elasticsearch yellow 1 1 41 41 0 0 41 0 - 50.0%

© IBM Corporation 31
3.2.3. Upgrading Grafana
1) Check the current installed version. If you are using version 5.0.4 or later, jump to step 6.
2) Run the command below on the monitoring node to install the RPM.
Example of command output:
$ cd /tmp
$ yum -y localupdate grafana-5.0.4-1.x86_64.rpm
$ yum localupdate grafana-5.0.4-1.x86_64.rpm -y
Examining grafana-5.0.4-1.x86_64.rpm: grafana-5.0.4-1.x86_64
Marking grafana-5.0.4-1.x86_64.rpm as an update to grafana-4.2.0-1.x86_64
Resolving Dependencies
--> Running transaction check
---> Package grafana.x86_64 0:4.2.0-1 will be updated
---> Package grafana.x86_64 0:5.0.4-1 will be an update
--> Finished Dependency Resolution
Dependencies Resolved
================================================================================================
=====================
Package Arch Version Repository
Size
================================================================================================
=====================
Updating:
grafana x86_64 5.0.4-1 /grafana-5.0.4-1.x86_64
149 M
Transaction Summary
================================================================================================
=====================
Upgrade 1 Package
Total size: 149 M
Downloading packages:
Running transaction check
Running transaction test
Transaction test succeeded
Running transaction
Updating : grafana-5.0.4-1.x86_64
1/2
Cleanup : grafana-4.2.0-1.x86_64
2/2
POSTTRANS: Running script
Verifying : grafana-5.0.4-1.x86_64
1/2
Verifying : grafana-4.2.0-1.x86_64
2/2
Updated:
grafana.x86_64 0:5.0.4-1
Complete!
$ yum list installed | grep grafana
grafana.x86_64 x.x.x-x @/grafana-x.x.x-x.x86_64

© IBM Corporation 32
3) Enable the log rotation by logrotate command for Grafana:
4) Edit /etc/grafana/grafana.ini file. Find the log_rotate= line, delete the semicolon character
(;) at the beginning of line, and change the value from true to false as below.
log_rotate = false
5) Restart the upgraded Grafana.
6) Access Grafana using the Web browser and follow the instruction in the section 2.3.2 to replace the
dashboard view. Note that *.json files need to be unpacked by the step in the section 3.1.1.
7) If you have two datasource definitions in Grafana, one with Time Field Name parameter set to
“@timestamp” and other set to “task.created_time”, the latter is no longer needed starting from Spectrum
Archive EE version 1.3.1.3.
Open Grafana and confirm your current setting by clicking the gear icon from the left, and select
"Data Sources". If you have the second datasource for “task.created_time”, delete the datasource
definition. Note that this won’t affect to the task records stored in Elasticsearch.
$ cp /tmp/ibmsa-dashboard-1.3.x.x-xxxxx/grafana/ibmsa-logrotate-grafana /etc/logrotate.d/
$ chmod 644 /etc/logrotate.d/ibmsa-logrotate-grafana
$ systemctl restart grafana-server.service

© IBM Corporation 33
4. Using Grafana
To access a pre-defined view, (1) click Dashboards icon from the left, (2) select Home from the menu,
and then (3) click Home button at the top.
It will give you the list of all available dashboard panels. If you have more than the five panels provided by
IBM Spectrum Archive, you can find the EE dashboard either by, typing “Spectrum Archive” in the Find box at
the top,
Or by filtering by the “ibmsa” tag in the right pane.
(1)
(2)
(3)

© IBM Corporation 34
Clicking the one of EE dashboard panels will bring up the view.
EE dashboard views are using the common layout with
• A: Dynamic Filter
• B: Hyperlinks to other views
• C: Time Range selector
• D: Online help. Read this pane before starting using each view.
You can hide (or show) the online help by
1. Collapse the pane by clicking "About this dashboard".
2. Save the view using the disc icon at the top
A B
D
C

© IBM Corporation 35
4.1. System Health View System Health View includes a table including system events and its summary/histogram. For example, you
can see the events when you start or stop Spectrum Archive using eeadm cluster start and eeadm
cluster stop commands.

© IBM Corporation 36
4.2. Storage View Storage View shows space information of tape storage. It includes how many percent of each tape pool is
consumed and its trend.

© IBM Corporation 37
4.3. Activity View Activity View shows the performance summary about tape drives. This includes how much of data is read or
written from/to tape in a time window and the throughput. It includes the tape I/O activity for migration and
recall but not for other tape administration operations such as reconcile, reclaim, etc.

© IBM Corporation 38
4.4. Config View Config View shows system configuration. Note that tape storage related information like tape pool and tape
media are shown in the Storage View. Config View includes information about tape libraries, node groups and
nodes.
© IBM Corporation 39
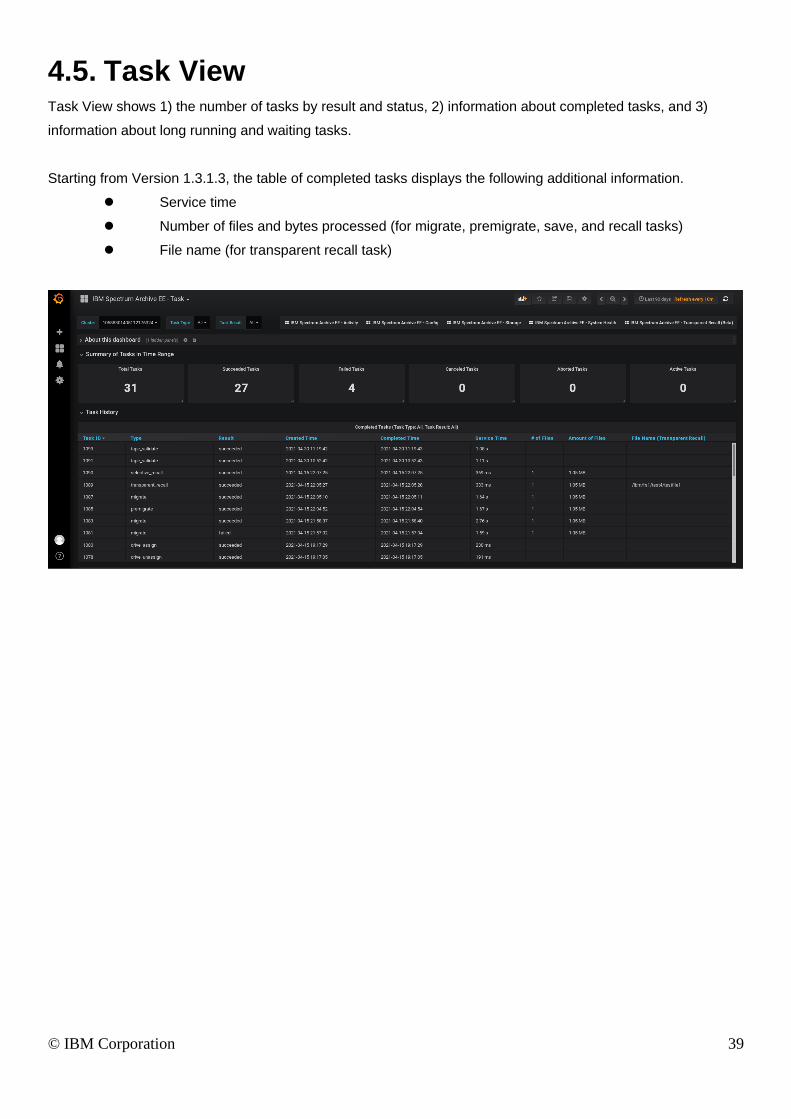
4.5. Task View Task View shows 1) the number of tasks by result and status, 2) information about completed tasks, and 3)
information about long running and waiting tasks.
Starting from Version 1.3.1.3, the table of completed tasks displays the following additional information.
⚫ Service time
⚫ Number of files and bytes processed (for migrate, premigrate, save, and recall tasks)
⚫ File name (for transparent recall task)

© IBM Corporation 40
5. Troubleshooting
5.1. “No data point” message on Grafana
5.1.1. Checking Logstash
After initial setup, Grafana may display "No data point" message because either Logstash or
Elasticsearch does not work correctly.
Check: Make sure that the Logstash is running on all nodes. Run systemctl status
logstash.service command to check the status. If the status is “active (running)”, run the same
command after waiting for a minute, and compare the process ID (PID) and the elapsed time since the start of
process (in the red circle in the example below). If the elapsed time does not exceed 1 minute, Logstash
might be restarting again and again without any error indication on systemctl command nor on the log file
under /var/log/logstash directory.
This could typically occur when:
• Wrong version of Java is installed – Version 1.8 is required.
• Typo or wrong value in a configuration file – Double check the files set at the section 2.1.3.
Action: Run logstash command manually with --debug option and check the output.
$ systemctl status logstash.service
● logstash.service - logstash
Loaded: loaded (/etc/systemd/system/logstash.service; enabled)
Active: active (running) since Thu 2017-06-22 20:22:14 CDT; 8s ago
Main PID: 34520 (java)
CGroup: /system.slice/logstash.service
└─34520 jeva -XX:+U/eParNewGC oXX:+UseConcMarkSweepGC -
XX:CMSIndtiatingOccupancyFraction=75 -XX:+UseCMSInitiatingOccupancyOnly -XX:+DisableExplicitGC -
Djava.awt.headless=true -Dfile.encoding=UTF-8 -XX:+HeapDumpOnOutOfMemoryE...
Jun 22 20:22:14 endeavour systemd[1]: Stopping logstash...
Jun 22 20:22:14 endeavour systemd[1]: Starting logstash...
Jun 22 20:22:14 endeavour systemd[1]: Started logstash.
$ /usr/share/logstash/bin/logstash --path.settings /etc/logstash --debug --verbose

© IBM Corporation 41
An example of error: In this case, Java 1.7 was installed in the system and the message in the red circle
pointed that out.
5.1.2. Checking the Time Range setting of Grafana
You can choose a time range on Grafana by:
• Open the Time Range control at the upper-right corner. Then, select the one of pre-defined relative
time ranges or specify an absolute time range.
• Highlighting the range by mouse in a time-scaled graph
You may see 'No data point' message if you choose a time range which do not have any corresponding
data in the Elasticsearch.
If you encounter the message, try the refresh button , change the time range (relative time range, such
as “last 90 days”), or go to other view once and come back to the original view again which loads the default
time range.
5.2. Clean up the old records from Elasticsearch
When the disk space of the Monitoring node is about to be full due to the growth of Elasticsearch database,
you may want to delete the older documents stored in the database.
Refer the following URL to understand how to back up the data before deleting.
https://www.elastic.co/guide/en/elasticsearch/guide/current/retiring-data.html
5.2.1. Identifying the name and size of indices
$ /usr/share/logstash/bin/logstash --path.settings /etc/logstash --debug --verbose
LoadError: JRuby ext built for wrong Java version in `com.purbon.jrmonitor.JRMonitorService':
java.lang.UnsupportedClassVersionError: com/purbon/jrmonitor/JRMonitorService : Unsupported
major.minor version 52.0
require at org/jruby/RubyKernel.java:1040
(root) at /usr/share/logstash/vendor/bundle/jruby/1.9/gems/jrmonitor-0.4.2/lib/jrmonitor.rb:4
require at org/jruby/RubyKernel.java:1040
(root) at /usr/share/logstash/logstash-core/lib/logstash/instrument/periodic_poller/jvm.rb:1
require at org/jruby/RubyKernel.java:1040
(root) at /usr/share/logstash/logstash-core/lib/logstash/instrument/periodic_poller/jvm.rb:5
require at org/jruby/RubyKernel.java:1040
(root) at /usr/share/logstash/logstash-core/lib/logstash/instrument/periodic_pollers.rb:1
require at org/jruby/RubyKernel.java:1040
(root) at /usr/share/logstash/logstash-core/lib/logstash/instrument/periodic_pollers.rb:3
require at org/jruby/RubyKernel.java:1040
(root) at /usr/share/logstash/lib/bootstrap/environment.rb:70

© IBM Corporation 42
Deletion of documents (every data in Elasticsearch) needs to be done per index file. So, you need to find
the index names first.
Use the curl command to get the list of indices and their size.
There are two types of indices that Spectrum Archive creates:
• ibmsa-config
• ibmsa-stat-<year>.<month>: holds data generated on year/month
5.2.2. Delete old documents from each index
The following procedure needs to be performed per index file. For ibmsa-stat-YYYY-MM indices, you could
skip an index file if the documents created in particular date range should be preserved.
Example of deleting all documents generated more than two months ago:
1) Search the documents matching with the criteria. For this case, you are looking for the document
timestamp is less(=older) than two months ago (“now-2m”). The command shows what will be affected
in the next step.
Note: If you do copy & paste the command from above, do not forget to copy the single quote character
(‘) in the last line.
$ curl -XGET 'http://localhost:9200/_cat/indices?v&h=index,docs.count,docs.deleted,store.size&s=index:asc'
index docs.count docs.deleted store.size
.kibana 2 0 24.2kb
ibmsa-config 78 56 811.7kb
ibmsa-stat-2020.10 9491 0 2.6mb
ibmsa-stat-2020.11 49575 0 12.1mb
ibmsa-stat-2020.12 642 0 550.5kb
ibmsa-stat-2021.01 3958 0 1.2mb
ibmsa-stat-2021.03 34446 0 7.9mb
ibmsa-stat-2021.04 53457 0 12.2mb
ibmsa-stat-2021.05 18309 0 9.4mb
$ curl -XGET 'http://localhost:9200/ibmsa-stat-2020.10/_search' -d '
{ "query":
{ "bool":
{ "must":
[
{ "range":
{ "@timestamp":
{ "lte": "now-2m" }
}
}
]
}
}
}
'

© IBM Corporation 43
2) If the result looks fine, run the command below to delete the matching documents by changing XGET to
XPOST and changing “_search” parameter to “_delete_by_query”.
5.3. Log files
The log files are placed at following locations.
• Logstash => /var/log/logstash on EE nodes
• Elasticsearch => /var/log/elasticsearch on Monitoring node
• Grafana => /var/log/httpd, /var/log/Grafana on Monitoring node
ltfsee_log_collection tool collects the Logstash log files from all EE nodes. For Elasticsearch and
Grafana, you need to collect the logfiles manually if they need to be sent to IBM.
$ curl -XPOST 'http://localhost:9200/ibmsa-stat-2020.10/_delete_by_query' -d '
{ "query":
{ "bool":
{ "must":
[
{ "range":
{ "@timestamp":
{ "lte": "now-2m" }
}
}
]
}
}
}
'

© IBM Corporation 44
6. Limitations
• Activity View supports 16 drives per Spectrum Archive node.
• There is a delay before the new data is displayed on Grafana because:
o Logstash collects the data in certain interval (defined by LS_IBMSA_xxx_INTERVAL parameters
in /etc/sysconfig/logstash file) and update the value on Elasticsearch.
o Grafana periodically refreshes the display by sending a new query to Elasticsearch. The Config
View and Storage View use one hour interval (both are not expected to change often) while
Activity View, System Health View, and Task View use 10 minutes interval.
Press the refresh button at the upper-right corner, or wait for the next autorefresh cycle.
Related Documents