(IASA-Ch-152703) BOUNDABY L&YXt3! SSPAaATI3r0 F77-23060 011 ISOLATED BOA’TPlIT. YOZZLBS U.S. Thmis (George Yashiagtoa univ,) 75 p HC &Oi)/Hu ac 1 CSCL OlA Unclas 1;3/02 29470 Boundary Layer Separation on Isolated Boattail Nozzles fw Willlor klly Abeyods B. S. Nay 1973, brth Carolina State university A Thesis submitted to The Faculty of The School of BPgheering and Applied Science of Phe George Washington University In partial satisfaction of the requirersents for the degree of Master of Science Hay 8, 1977 Thesis directed by Dr. Richard W. Barnwell Associate Professorial Lecturer in hgineering

Welcome message from author
This document is posted to help you gain knowledge. Please leave a comment to let me know what you think about it! Share it to your friends and learn new things together.
Transcript

(IASA-Ch-152703) BOUNDABY L&YXt3! SSPAaATI3r0 F77-23060 011 ISOLATED BOA’TPlIT. YOZZLBS U.S. T h m i s (George Yashiagtoa univ,) 75 p HC & O i ) / H u ac 1 CSCL O l A U n c l a s
1;3/02 29470
Boundary Layer Separation on Isolated Boattail Nozzles
fw Willlor k l l y Abeyods
B. S. Nay 1973, brth Carolina State university
A Thesis submitted to
The Faculty of
The School of BPgheering and Applied Science
of Phe George Washington University I n partial sat isfact ion
of the requirersents for the degree of Master of Science
Hay 8, 1977
Thesis directed by
Dr. Richard W. Barnwell
Associate Professorial Lecturer i n hgineering

Ail invest igat ion has been conducted i n the Langley 16-foot
transonic tunnel a t free-stream Mach numbers from 0.40 to 0.95 a t 0'
angle of a t tack to study the phclpacnon of separated flaw on a series
of circular-arc afterbodies.
cylinders with a d ia re t e r equal to the nozzle exit diameter were used to
simulate jet exhausts.
separation locxioas was obtained using oil-flow techniques.
Both high-pressure air and s o l i d c i r cu la r
A deta i led da ta base of bouudary layer
The results of t h i s invest igat ion indicate tha t boundary layer
separation I s most extensive on s teep boa t t a i l s at high Mach nrrmbers.
Changes in the jet total-pressure r a t i o (jet total t o free-stream
static) a f f e c t the extent of separ- t ion very l i t t l e ; however,
entrainment associated with the presence of a je t has a s ign i f i can t
e f f e c t when compared to so l id s h l a t o r data.
c r i t e r i a were evaluated using experipental data.
general accurately predicted the separation locations for the solid
simulator cases. The bes t r e s u l t s vere obtained by curve-f i t t ing a
modified Reshotko-Tucker c r i t e r ion v i t h experimental data.
Several separat ion
No c r i t e r ion in
ii

I would like to thank all of those uho gave e assistance in the
preparation of this paper.
and Space Administration for giving e the opportunity to pursue
graduate study and for providing the tire and facilities necessary
for this investigation.
I am indebted to the National Aeronautics
I would especially like to acknowledge the contributions of
Dr. Richard W. Barnwell, ny advisor, whose advice was greatly
appreciated. I would like to thank %. Dorothy P. Wright and
Ys. Debbie L. Griffith for typing this paper. Also, I would like
to thank Ms. Kathryn H. Peddrew and rcS. Margaret L; Hurt for their
help in preparing the figures. In addition, I would like to thank
Mr. L. E. Putnam for his advice and his adaptation of the boundary-
layer computer program used herein.

p a g e
T I T L E . . . . . . . . . . . . . . . . . . . . . . . . . . . . i
ABsTRAm . . . . . . . . . . . . . . . . . . . . . . . . . . ii
AOXWLEIE- . . . . . . . . . . . . . . . . . . . . iii
TABLEOF-S ..................... iv
L I S T O P S P W O L S . . . . . . . . . . . . . . . . . . . . . . . V
L I S T O F F I C U B E S . . . . . . . . . . . . . . . . . . . . . viii
Chapter
I. ~ o W m I ~ . . . . . . . . . . . . . r . . . . . . 11. EXPERMENTAL APPARATUS MIDpBocEMlRE . . :* . . . .
WIND TUNNEL DESCRIPTION . . . . . . . . . . . . MODEL AND SUPPORT SYSTD4 DESCRIPTION . . . . . . AF'TERBODY~DELDESCBIPTIOK . . . . . . . . . . ILSTRUjlENTATION AND TEST PWOCEDIJRE . . . . . . . DATAREDUCTION. 0 . . 0 .
111. RESULTS AND DISCUSSION . . . . . . . . . . . . . . . EXPERXMENTAL RESULTS . . . . . . . . . . . . . . TEEORETICAL RESULTS . . . . . . . . . . . . . .
Iv. ~ ~ c L u I ) I ~ ~ b 0 0 . . 0
REPERFNCES . . . . . . . . . . . . . . b . . . . . . . . .
1
3
3
3
1c
10
15
16
16
29
61
62
l v

2 cross-sectional area, m
cf
C P
in te rcept of linear Xcast-squares curve
slope of l i nea r least-squares cume
constant in Stra t ford c r i t e r i o n
loca l skin f r i c t i o n coef f ic ien t , w T
91.
pressure coeff ic ient based on free-stream conditions,
pe - p,
cP
- C
P
d
E
F
G
pressure coef f ic ien t based on conditions a t t he m i n i r r
s t a t i c pressure on the boa t t a i l , - ‘0
qo
modified pressure coef f ic ien t i n S t ra t ford c r i te r ion ,
--_ . diameter, m
standard e r ro r of estimate, 1 I [yi - (a + bzi)l 2
n-2
r a t i o of boundary-layer thickness a t the miniarm s t a t i c
pressure t o tha t at separation defined in equation 4 6 6
in Presz c r i t e r lon , o
SeP
r a t i o of boundary-layer thickness a t the minimum s t a t i c
pressure t o tha t at separation defined in equation 5 6 in Prese c r i t e r ion , o
6sep
V

v i
I
I
i
n
P
r
S
S
- S
T
t
U
X
X
V
Z
B
*C
Y
Ax
-mentum of entrained mass flow i n Presz c r i t e r ion , N
length of boa t t a i l , m
entrained mass flow In Presz c r i t e r ion , !%- see
Reynolds number, ",d, vm
n d e r of points in l i n e a r least-squares curve
2 pressure, N/m
dynadc pressure, N/m 2
b o a t t a i l circular-arc radius, m
r a d i a l dis tance from center l i n e of model, m
nozzle convergence length, m
axial coordinate i n nozzle convergence section, m
streamwise dis tance along body, m
e f fec t ive streaewfse dis tance along body in Stra t ford
c r i te r ion , m
temperature, K
nozzle throat length, m
veloci ty component in s direct ion, m/sec
a x i a l distance a f t from model nose, m
axial distance a f t from start of boa t t a l l , m
dependent var iable i n l i nea r least-squares curve
Independent var iable in l i nea r least-squares curve
terminal b o a t t a i l angle, deg
b o a t t a i l chord angle, deg
spec i f i c heat ra t io
a x i a l distance from the minimv- s t a t i c pressure 05 the
b o a t t a i l t o boundary layer separation, x - xOs m SeP

d
0
V
P
=w
Subscripts
b
9P
e
fs
j
a
m
0
P
PS
S
SeP
t
1
OD
boundary-layer thickness, m
boundary-hyer displace-t thickness, m
boundary-layer Promenturn thickness, rn
kinematic viscosi ty , m /sec 2
3 density, kg/m
w a l l shear stress, N/m 2
base
drwpo i n t
exit
f i c t i c ious stagnation point
jet
l o c a l
IIkaXimUm
b o a t t a i l minimum stat ic pressure point
predicted
preseparation
plume simulator
separation point
stagnation
boundary layer edge, top edge of control volume i n Presz
c r i t e r i o n
f ree--8 tream

LIST OF FIGURES
Figure
1.
2.
3.
4.
5 .
6.
7.
8.
9.
10.
11.
12.
13.
14.
Sketch of air-powered cone-cylinder model with a typ ica l circular-arc convergent nozzle ins ta l led . . . . . Air-powered model with configuration 8 attached, i n s t a l l ed in the Langley 16-foot transonic tunnel. . . . Sketch of cone-cylinder nacel le model showing in t e rna l s t i ng arrangeme3t f o r support of simulators. . . . . . . . . . . . . . . . . . . . . . . Nacelle model i n s t a l l ed i n the Langley 16-foot transonic tunnel with typ ica l circular-arc afterbody and ds/de = 1.00 simulator attached. . . . . Sketch of model and support system with corresponding cross-sectional area d is t r ibu t ions . . . . . . . . . . . . . Detailed sketch of typ ica l configuration with tab les of geometric parameters and in t e rna l coordinates. . . . . Band of the f ree-stream parameters encountered during the investigatinn. . . . . . . . . . . . . . . . . . . . Example of two-cell vortex separation. . . . . . . . . . Oil-flow photographs showing the e f f ec t of Mach number on separation location. . . . . . . . . . . . . . . . . . Oil-flow photographs showing the e f f e c t of j e t to t a l - pressure r a t i o on separation location. . . . . . . . . . Separation locat ions f o r configurations using a so l id cylinder to simulate j e t exhausts. . . . . . . . . . . . Separation locations fo r configurations using high- pressure a i r t o simulate jet exhausts. . . . . . . . . . Comparison of separation locat ions obtained through the use of so l id simulators with those obtained from j e t operation a t ~ , , ~ / p , . = 2.
Comparison of the var ia t ion of separation locat ion predicted by various methods with Mach number f o r configurations with so l id plunre simulators. Experimental pressure d is t r ibu t ions used i n predicting Separation locations. . . . . . . . . . . . . . . . . . . . . . . .
. . . . . . . . . . . . .
Page
4
6
7
8
9
11
14
1 7
18
19
2 1
22
28
35
v i i i

i x
Figure Page
15.
16.
17.
18.
19.
Comparison of the variation of separation locatim predicted by various methods with Mach number f o r configurations with s o l i d plume simulators. Theoretical inviscid pressure d is t r ibu t ions used I n predicting separat ion locat ions . . . . . . . . . . . . Evaluation of predicted separation locations with oil-flow data f o r configurations with s o l i d p l a n e simulators. Experimental pressure d is t r ibu t ions used i n predicting separation locations . . . . . . . . Evaluation of predicted separat ion locat ions with oil-flow data f o r configurations with s o l i d plume simulators. m e o r e t i c a l inv isc id pressure d is t r ibu t ions used i n predict ing separation locat ions . . . . . . . . . . . . . . . . . . . . . . . Comparison of oil-flow data and predicted separation locations made using least squares curve f i t applied t o Reshotko-Tucker c r i t e r ion . . . . . . . . . . . . . . Comparison of experimental and predicted pressure- coeff ic ient d i s t r ibu t ions on a circular-arc b o a t t a i l nozzle using a s o l i d cone t o represent the separated region . . . . . . . . . . . . . . . . . . . . . . . .
39
44
50
58
60

W T E R I
INTRODUCTION
The nacelle afterbody is a critical ares as f a r as a i r c r a f t
performance is concerned.
complex, and therefore hard t o predict .
The flow i n t h i s region can be extremely
The external flow goes
through an expansion and then a compression (ref. I); it a lso i n t e r a c t s
with the j e t plume. This phenomenon causes the afterbody boundary
layer to thicken, and i n many cases separate. In cases i n which
boundary layer separation does occur, the pressure d i s t r ibu t ion and
drag on the afterbody great ly d i f f e r from those of unseparated cases
(ref . 1). t
This f a c t has led t o much experimental work i n the area
(refs . I t o 9 ) ; however, l i t t l e de ta i led separation data is avai lable
from 2, hich improved ana ly t i ca l techniques can he developed.
Presently there are many theore t ica l methods f o r predicting
afterbody flows (refs . 9 t o 33). Most of these employ a poten t ia l flow
calculat ion coupled with a boundary layer calculation. Some of the
boundary-layer methods are designed to predict and ca lcu la te separated
flows implici t ly .
separation locat ion using simpler, semiempirical techniques
(refs . 34 t o 52) and modeling the separated region as a so l id cone
Others approach the problem by predict ing the
frustum ( re f . 37).
unseparated b o a t t e i l flows ( r e f , 1). For separated flow casee,
howevei, the d i f f i c u l t y in correct ly modeling the complex flow near
Good r e su l t s have been obtained fo r cases with
afterbodies has caused the theore t ica l r e s u l t s obtained up t o now t o be
inaccurate .
1

2
I n order t o b e t t e r understand b o a t t a i l flow separation and t o
determine what c r i t e r i a can bes t p red ic t i t f o r use i n patched
i n v i s c i d h i s c i d so lu t ions , an oil-flow study was conducted i n the
Langley 16-foot transonic tunnel using a series of circular-arc
af terbodies ( re f . 1). The inves t iga t ion was conducted a t free-stream
Mach numbers from 0.40 t o 0.94 a t 0' angle of a t tack.
simulate j e t exhausts with j e t total-pressure r a t i o s ( j e t t o t a l t o
free-srream stat ic) varying from jet-off up t o about 9 , depending upon
the configuration and the free-stiram Mach number.
were a l so used t o simulate the j e t s a t the on-design condition. (The
f l w conditions f o r which pressure da ta w a s ava i lab le i n references 1
t o 3 were repeated as closely as possible during the oil-flow tests.)
The primary goal of the test was t o e s t a b l i s h a systematic data base
from which the dependency of flow separation on such f ac to r s a s t he
free-streem Mach number, the longitudinal surface curvature, and the
j e t total-pressure r a t i o could be determined. (Since e s ing le m . l e l
was used f o r the test , and the tunnel i s an atmospheric tunnel, i t was
possible only t o test over a limited Reynolds number range. For t h i s
reason, the e f f e c t of Reynolds number was not included i n the data base.)
The experimental r e s u l t s w i l l be reported in t h i s paper.
evaluation of severa l of the semiempirical techniques f o r predicting
flow separation w i l l also be presenced.
A i r was used to
Sol id cylindeTs
An

CHAPTER I1
EXPERIMENTAL APPARATUS AND PRCICFJNRE
Wind Tunnel Description
This flow separation study was conducted in the Langley l6-foot
transonic tunnel. The tunnel is a single-return, continuous,
atmospheric tunnel.
with s l o t s a t each of the e ight corners.
is contixuously var iable from 0.20 to 1.30.
description of the Langley l6-foot tunnel can be found i n references
53 t@ 55.
Its test sect ion has octagonal cross sect ions
The free-stream Mach number
A more de ta i led
Model and Support System Description
The model used i n t h i s invest igat ion was an isolated, single-
engine nacel le model, t o which various circular-arc b o a t t a i l nozzles
could be attached.
pressure a i r was used to simulate the j e t exhaust, is shown i n f igure 1.
The nacel le model had a rounded shoulder a t the junction of the conical
nose and the cy l indr ica l section.
s t a t i o n 111.76 cm.
a t s t a t ion 121.92 cm.
simulation had a stagnation temperature of about 274 K.
throtigh a s t ing-strut , which supported the model, i n t o the high-
pzeseure plenum.
t o the model axis) i n to the l w p r a e s u r e plenum through e ight multi-
holed sonic nozzles.
circumference of the high-pressure plenum.
A sketch of a typ ica l configuration, i n which high-
The nozzles were attached a t
Nozzle b o a t t a i l s fo r a l l configurations s t a r t ed
The dry, high-pressure air used fo r j e t
It was p iped
The air then flowed r ad ia l ly outward (perpendicular
The nozzles were equally spaced around the
The flow then accelerated
3

4
0 0 ln s;

5
rearward, passing through flovcsroothing screens in the model
ta i lp ipe . These screens, supported by four vanes, consisted of a
0.635-an mesh forwed using 0,0635-cm w i r e .
of the air-powered model ins t a l l ed i n the langley 16-foot transonic
tunnel.
Figure 2 is a photograph
Solid cylinders were also used to simulate jet exhausts.
Figure 3 i l l u s t r a t e s 9 configuration typ ica l of those tested.
i n t e rna l s t i n g w a s ins ta l led in the single-engine nacel le d e l t o
s u p p o r t the solid simulators. Figure 4 shows one of these
configurations ins ta l led i n the Langley 16-foot transonic tunnel.
simulators with a di2ateter equal to the nozzle e x i t diameter
(ds/d, = 1.0) were tested.
f e l t t h i s w a s long enovgh so t h a t base e f f e c t s of the simulator woldd
be negl igible on the boa t ta i l s .
An
Only
All simulators were 27.94 cm long. It was
The model was .nounted i n the tunnel on a s t ing-s t ru t support
system. As shown i n f igures 1 to 5, the nose of the model w a s
attached t o the s t r u t blade.
percent thick with a 50.8-cm chord.
i n cross sect ion, with t h e top d bottom capped With half-cylinders of
2.54-cm radius.
below tSe wind-tucnel center line.
the runnel center l i n e and the nose of the model a t tunnel s t a t i o n
39.93 meters. Cross-sectional area d ie t r ibu t lons of the model and
support system are shown in f igure 5.
percent of the cross-sectional area of t he test sect ion; the maximum
blockage of the model and support system was 0.148 percent.
The blade w a s s-ept 45* and was 5
The s t i n g was 5.08 c m by 10.16 cm
The center line of the s t i n g w a s located 55.88 cm
This placed the a d s of the model on
The model blockage vas 0.099


9
Tunnel 6- - -- ~- *- -
I
55.88 cm !
I
I 1-L Tunnel station 39.93 meters
X, cm
Figure 5.- Sketch of model and support system with corresponding cross-sectional area distributions.

lo
Afterbocq Model Description
A family of e ight circulaparc af terbodies w a s ava i lab le f o r
kigcre 6 shaws sketches and correuponding table8 of tes t ing .
dimamions f o r these nozzle afterbodies. The i n t e r n a l contour of
each nozzle vas bas ica l ly an ASME long-throat nozzle (ref. 56). Sore
mdl f i ca t ions were necessary because the external contour8 set lidts
within which the in t e rna l contours had t o contract from a f ixed
i n t e r n a l diameter t o the required exit diameter.
be a l l o t t e d f o r tube routing.
c i r cu la r cross sections.
Also, space had to
A l l of the nozzles had throa ts with
Instrtmrentation and T e s t Procedure
The e ight afterbody m d e l s and t h e i r so l id simulators w e r e
equipped with static-pressure orif ices.
s ta t ic-pressure data used in t h i s paper were presented i n reference 1.
For the cases i n which air w a s used t o simulate jet exhauets, j e t
total-pressure measurements were obtained by using an internal ly-
mrmted total-pressme rake (fig. 6). The j e t t o t a l pressures were
measured using e l e c t r i c a l strain gage pressure transducers ca l ibra ted
t o an accuracy of 9 . 5 percent of the gage capacity
(6.89 x lo5 N/m2)*
The o r i f i c e locat ions and
A l l t e s t i n g was conducted i n the Langley 16-foot transonic tunnel
a t free-stream Mach numbers ranging from 0.40 t o 0.94 and at an angle
of a t tack of 0’. The model a t t i t u d e was not changed during the t e s t .
The tunnel upflow (on the order of 0.1 degree throughout the free-stream
Mach number range) and s t i n g def lect ion (known t o be extremely small)
were not taken i n t o account. Boundary layer t r ans i t i on waa fixed

11
i(l 1 i
ORIGINAL PAGE IS OF POOR QUAL1TY

12
0
5
0 5
l o D l '
00
0 4J
U W
d U Q &I 1 M d Ccl C 0 u n P W

13
by a 0.254-cm s t r i p of No. 100 g r i t located 2.54 cm from the t i p of
the nose, using the techniques described in references 57 and 58.
High-pressure air w a s used t o simulate je t exhausts with jet
total-pressure r a t i o s varying from jet-off up t o 9, depending upon the
configuration and f ree-stream conditions.
ussd t o simulate the on-design condition.
range covers t ha t typ ica l ly used i n subsonic f l i g h t by t ransports and
f +.ghters.
Solid cylinders were a l so
This jet t o t a l pressure
Since the Langley 16-foot t ransonic tunnel is an atmospheric
tunnel, the tunnel free-stream conditions vary with the ambient
conditions.
of the free-stream Mach number i n f igure 7.
consisted of several runs.
tested.
For configurations which used high-pressure a i r t o simulate j e t exhausts,
a sweep of nozzle total-pressure r a t io s was conducted a t each Mach
number.
var ia t ion, data w a s generally taken a t the highest Mach number f i r s t ,
and then a t progressively lower Mach numbers.
(i.e. each Mach number and/or nozzle total-pressure r a t i o s e t t i n g a t
which data was recorded) , tunnel conditions were allowed to s t a b i l i z e ,
a t which time 10 frames of data were taken over a 10 second period.
The 16-foot tunnel has a small cyc l ic var ia t ion i n the flow with a
period of about 10 seconds.
therefore used f o r each point t o minimize e r ro r s i n the measured
quant i t ies resul t ing from t h i s cy l l c var ia t ion.
The range of free-strean? conditions is s.. own as a function
The oil-flow study
In each run, a pa r t i cu la r configuration w a s
Each run consisted of a sweep of free-stream Mach .lumbers.
In an e f f o r t t o minimize t h e tunnel t o t a l temperature
A t each da ta point
The average of t he 10 frames of data was

14
Q)
5 M C
-0 PI l.4 aJ U c 1 0 r)
E
c; Q PI l.4 c) v) I 0) PI l.4 w
w 0
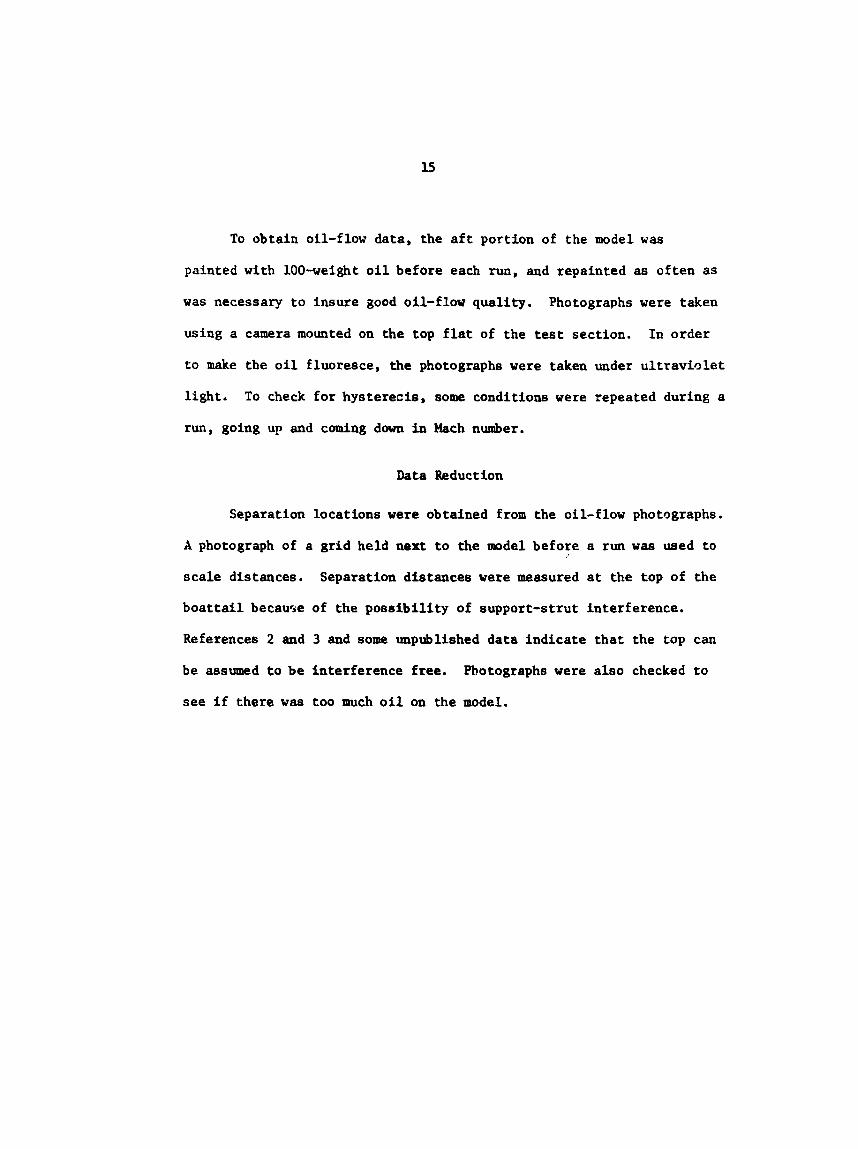
To obtain oil-flow data, the a f t portion of the model w a s
painted with 100-weight o i l before each run, and repainted as often a s
w a s necessary t o insure good oil-flow qual i ty . Photographs were taken
using a camera mounted on the top f l a t of the test section.
t o make the o i l f luoresce, the photographs were taken under u l t r av io l e t
l igh t . To check fo r hysterecis , some conditions were repeated during a
run, going up and coming down in Mach number.
In order
Data Reduction
Separation locations were obtained from the oil-flow photographs.
X photograph of a gr id held next t o the -del before a run w a s used to
sca le distances. Separation distances were measured a t the top of the
b o a t t a i l because of the poss ib i l i t y of support-strut interference.
References 2 and 3 and some unpublished data ind ica te tha t the top can
be assumed t o be interference free.
see i f there w a s too much o i l on the model.
Photographs were a lso checked t o

CHAPTER I11
RESULTS AND DISCUSSION
Experimental Results
Typical photographs obta-iaed during this oil-flow investigation
are presented as figures 8 , 9, and 10. They illustrate some of the
problems encountered while making oil-flow tests. One problem is
getting the proper amount of oil on the model.
oil of a high enough viscosity to remain on the model the length of
There must be enough
time needed for the tunnel to reach the test conditions. Conversely,
the oil must have a low enough viscosity to react to changes in flow
conditions within a reasonable length of time, and be present in a
layer thin enough t o not greatly alter the effective body shape.
Another problem is measuring the separation locations since the
separation line is usually not straight. Generally the line is
curved, conforming to a series of vortlces spaced around the body in
the separated region. This pheilomenon, similar t o Taylor arid Goertler
vortices (ref. 59), is characteristic of turbulent flow, and perhaps
is triggered by small asymmetries in the flow. Figure 8 also shuws a
line in the separated region near the nozzle exit.
that a two-cell vortex pattern may exist in the separated region, at
This indicates
least at high jet total-pressure ratios.
Some factors influencing the location of the separation point are
the free-stream Mach number, the longitudinal curvature of the model,
and the jet plume entrainment and blockage. The Reynolds number also
affects the separation location; however, it was not possible t o test
16


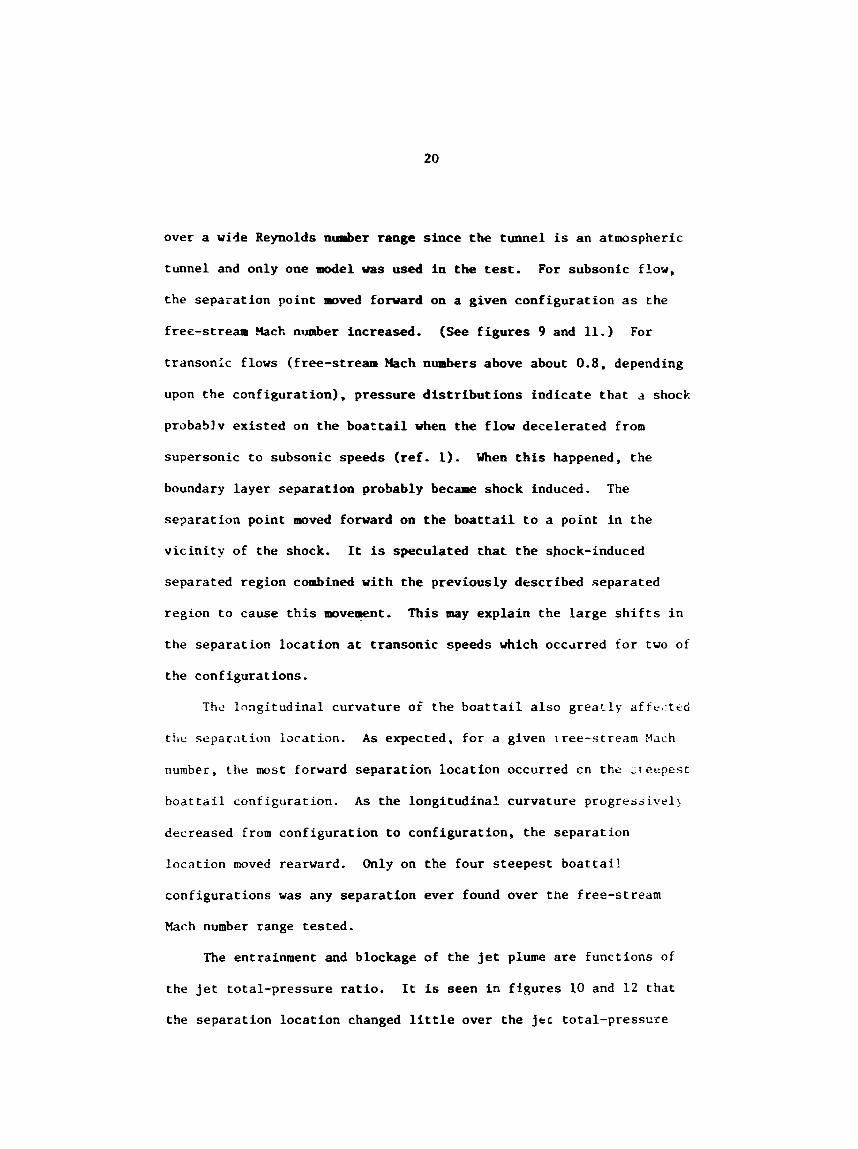
20
over a wide Reynolds number range since the tunnel is an atmospheric
tunnel and only one model was used in the test. For subsonic flow,
the separation point moved forward on a given configuration as the
free-stream Mach number increased. (See figures 9 and 11.) For
transonlc flows (free-stream Nach numbers above about 0 . 8 , depending
upon the configuration), pressure distributions indicate that A shock
probablv existed on the boactail when the flow decelerated from
supersonic to subsonic speeds (ref. 1). When this happened, the
boundary layer separation probably became shock induced. The
separation point moved forward on the boattail to a point in the
vicinity of the shock. It is speculated that the shock-induced
separated region combined with the previously described separated
region to cause this movement. This may explain the large shifts in
the separation location at transonic speeds which occarred for two of
the configurations.
The lnagitudinal curvature of the boattail also greatly affc+.ted
tile separat ion lacation. As expected, for a given iree-stream Nach
number, the most forward separation location occurred cn the zteepest
boattail configuration. As the longitudinal curvature progressivel)
decreased from configuration to configuration, the separation
location moved rearward. Only on the four steepest boattai!
configurations was any separation ever found over the free-stream
Mach number range tested.
The entrainment and blockage of the jet plume are functions of
the jet total-pressure ratio. It i s seen in figures 10 and 12 that
the separation location changed little over the jtrc total-pressure

i m u n 0 . 4 . 5 .6 .7 I .9 1.0
0
Figure 11.- Separation locations for configurations using a s o l i d cylinder to simulate jet exhausts.

22
8 5 8 S 8 % 8 . I . . . a oooada
n 0 v\
0
u
‘0 \
‘0
6
al
0
u

23
c I
0
0
P 0 \ 0
. 0 d
n 8 a >
B x- P \
. ,c al 1 G 4 U C 0 V
c I
N N rl
al d w 0 1 a M bd 4 3 CI M d u-c
U
h
v n

24
n 0 9
P) P
V.l C 0 U
n 0 W

25
0
I \ 0
0
n
2
n w W

r a t i o range teated. (The level of some of the da t a curves may be i n
e r r o r because of an excesi of o i l on the modal.
are at the free-stream Mach number of 0.84 f o r configuration 1, 0.85
and 0.40 f o r configuration 2, and 0.94 f o r configurations 4 and 6.)
The data i n question
The f l a tnes s of the curves probably indicates t h a t the changes i n
entrainment and blockage e f f e c t s induced by varying the je t to t a l -
pressure r a t i o were nearly equal in magnitude and opposite i n e f f ec t .
The jet entrahment tends to mve the separation location
rearward on the b o a t t a i l by en t ra in ing mass from the separated region
rearward i n t o the jet. The magnitude of entrainment is a function of
both the velocity difference and "surface" area between flows.
Therefore, for a convergent na t z l e with a given free-stream condition, I
the mass entrained i n t o the jet would tend to increase as t he jet-exit
ve loc i ty increased.
an increase in the nozzle total-pressure rat io .
less than the ex terna l velocity, the ex terna l flow actual ly tends t o
Thls Increase in jet-exit velocity corresponds t o
If the jet velocity is
entrain mass from the jet. Also, some mixing occurs s ince the externa l
flow contacts the j e t flow a t an angle and muat be turned by the j e t
flow. When the on-design Condition l e reached, t h e jet-exit Mach
number equals one, and remains constant f o r hl&er j e t total-pressure
rat ios . Consequently, the jet-exit velocity a l so reaaine constant.
The velocity in the jet plume increases with higher jet total-pressure
r a t io s ; however, s ince the jet-exit velocity is constant, the velocity
increases near t he b o a t t a i l are r e l a t ive ly small. Consequently, the
entralnmcnt tends t o level off.
While entralnment :en& t o move the separation location

27
reaward , blockage e f f e c t s of jete tend to pressurize the b o a t t a i l
and move the separation locat lon foruard.
ratio is Increased up t o the on-design condition, the Separation
locat ion mves rearward.
the plume blockage e f f e c t s increase, ha l t i ng the rearward erovement
of the separation locat ion and eventually causing a s l i g h t forward
mvement.
(p
i n pa r t t o unsteadiness which can occur i n base flaw cases.
(Reference 60 presents a theore t ica l approach t o the base flaw
problem.) Also, a t the higher Mach numbers, the separation locat ion
is more sens i t ive t o small e r r o r s In s e t t i n g the Mach number in the
wind tunnel.
As the jet total-pressure
As higher total-presrurc ratios are reached,
There appears t o be a d i spa r i ty In some of the jet-off
Aside from experieental e r ro r , t h i s may be due /p, = 1.0) data. t , j
Since the separation locat ion remains almost s ta t ionary
throughout the jet total-pressure ratio range, i t seems l ike ly tha t
s o l i d simulator data could be used t o estimate the jet-on separation
locations. Hawever, f igure 13 shows tha t a difference exists i n the
Separation locations obtained f o r on-design conditions between the
s o l i d simulator da ta and the high-pressure air data. The je t to ta l -
pressure ratio a t which the on-desj gn condition occurs var ies
s l i g h t l y f o r d i f f e r ing Mach nunbers and configurations, causing some
of the difference.
l i t t l e throughout the range of j e t total-pressure r a t io s , most
of the difference between s o l i d simulator and high-pressure air
separation da ta m u s t be due t o entrainment. For subsonic cases,
However, s ince the separation locat ion changes

28
-- --I -- e
- Solid simulator - - - - p t , j / b = 2.0
0 Z/dm = 0.80, d,/dm = 0.50
0 Z/dm * 1.00, ddd, = 0.50
0 Z/dm = 1.00, d,/d, = 0.60 A V d = 1.00, ddd, = 0.70 m
0 L . I 1 I I I u 0 * 4 .5 .6 . 7 .8 . 9 1.0
Figure 13. - Comparfson of separation locations obtained throug’ the use of solid simulators with those obtained from j e t operaticin < i t
P,,j/P, = 2.

29
t h i s difference i n Separation locat ions obtained using the tvo j e t
simulation techniques appears t o be mainly a function of the
"surface" area of the separated region washed by the jet ( the region
between the jet exit and the reattachment point on the plume). This
tends t o d i r ec t ly correspond t o the extent of separat ion on the
boa t t a i l . For t ransonic cases, shock-Induced separat ion probably
occurs. Within experimental accuracy, the d i f ference i n the data
curves reduces t o almost zero. This ind ica tes t ha t the shock
locat ion is probably not great ly a f fec ted by entrainment.
Theoretical Results
Using t h i s newly acquired da ta base, severa l flow separation
cr i ter ia were evaluated.
empirical methods. A patched inviscid/viscid in te rac t ion computer
program consis t ing of a poten t ia l flow calculat ion (ref . 11) and a
momentum-integral boundary layer calculat ion (ref . 12) was used
t o compute the needed boundary layer and inviscid flow parameters.
The c r i t e r i i were applied using both the experimental and theore t ica l
inviscid pressure d is t r ibu t ions as input t o the boundary-layer
program.
d is t r ibu t ions .
the scatter inherent i n experimrntal data, and they are easily
calculated. This experimental scatter (especial ly i n the minimum
pressure) can cause large deviations i n the separat ion predictiona of
some criteria. Also a c r i t e r ion based on the inv isc id pressure
d i s t r ibu t ion could provide a simpler, noninteractive, and cheaper
Most of these criteria were simple, semi-
There were severa l advantages i n using the inviscid pressure
The inv isc id pressure d is t r ibu t ions do not contain

30
solution. By contrast , a c r i t e r i o n based on expe r iwn ta l data might
be more useful i n an i n t e rac t ive scheme t o solve a f l a t f i e l d .
One of the criteria teated was a modified form of the Reshotko-
Tucker c r i t e r ion (ref. 4 9 ) :
M - 0.762 MO
which s t a t e s t ha t the ratio of the Mach number a t separat ion t o the
Mach number a t the minimum pressure point is a constant. "his
c r i t e r ion is derived by applying the momentum and momentof momentum
in t eg ra l equations with spec ia l functions of the boundary layer
shape factor . The shear stress tenns are assumed negl igible i n I
comparison t o pressure tenns.
the present invest igat ion t o b e t t e r f i t experimental data by
incorporating the e f f e c t of Reynolds wmber through the skin f r i c t i o n
coef f ic ien t a t t h e minimum pressure point C t o yield:
This c r i t e r ion w a s modified during
f ,o
This modified form w i l l herer f t - r be referred t o simply as the
Reshotko-Tucker c r i te r ion . I
Another c r i t e r ion evaluated was the Page c r i t e r i o n (ref . 34):

31
This simple c r i t e r i o n states tha t separat ion occurs where the pressure
coef f ic ien t based on the minimum stat ic pressure reaches 0.38.
A t h i r d method is the Prese c r i t e r i o n (ref. 37). The separat ion
location is determined by wing the following equations:
sep , M 4 2 + (y - l)k? (1 - 6*/6) F = 'rzp sep SeP
(1 + h l o /& )p 0 0 M 4- (1 - 6*/6)o
(4)
This method uses the control volume approach.
consis ts of a sect ion of the boundary layer with one end a t the
minimum s t a t i c pressure locat ion and t h e other a t ;he separation
location.
The control volume
Quantit ies with a eubsci ipt of 1 are conditions a t t h e

32
outer edge of t h e control volume.
f o r the r a t i o of t h e boundary-layer thickness a t the minimum s t a t i c
Equations 4 and 5 are equations
pressure location t o t h a t a t the separation locat ion. Equation 4
is an integrated form of the continuity equation, while equation 5
is an integrated form of the momentum equation. Flow separation
occurs when
F = G ( 9 )
The St ra t fo rd c r i t e r i o n is a well-known method fo r determining
the separation loca t ion (refs . 36 and 38). Several similar ex is t ing
methods were combined t o form t h i s c r i te r ion . Laht i ' s version of Lis
c r i t e r i o n was used i n t h i s evaluation:
I
sep
The e f f e c t of the forebody pressure dis t r ibr l t ion and the
actual boundary l aye r traneltlon locat ion on the boundary layer
flow over the b o a t t a i l is handled by computing the dis tance t o
a f i c t i t i o w stagnation point sfS ( the e f fec t ive dis tance f o r
a f la t -p la te turbulent boundary layer t o develop the momentum thickness
at Go). Separation l e indicated when the value of C is between 0.5 and
0.6. The Separation locat ion corresponds t o the mr.ximum value of C i n

33
this interval.
consis ts of two d i f f e ren t layers.
This criterion ass- that the boundary layer
The Inner one is
independmt of upstreao conditions, and the outer layer is assumed
to be affected by only t h e Initial ve loc i ty proffle aad the
downstram pressure gradient.
The Tawnshend
(refs . 39 and 52) :
r
c r i t e r i o n is given by the equation
It is derived with the assumption t h a t the separation is dependent
upon the pressure gradient.
by the presence of the pressure gradient upstream of separation.
This is incorporated i n t o the c r i t e r i o n
The Angle method is givc.. by t h e following equation:
M s i n 8 -0.247 SeP seP
It assumes t h a t the separation location t s a function of the loca l
b o a t t a i l angle 6 and Mach number. It was derived by f i t t i n g a
curve to t h i s set of experimental data.

The Goldsdiaied c r i t e r i o n Is another well-known simple method
(refs. 40 and 41):
n
It assumes t h a t the boundary layer cons is t s of two layers. It a l s o
a s s e s t ha t a line of constant total pressure exists p a r a l l e l to
the surface.
of the adverse pressure gradient. Separation is assumed t o occur
when the laminar sublayer thickens enough t o in t e r sec t t he l i n e of
constant t o t a l pressure. Th3s viscons phenomenon is correlated
through the use of the skin f r i c t i o n coef f ic ien t a t the start of the
adverse pressure gradient.
This line intersects the inner layer a t the beginning
The Wu c r i t e r ion is another simple equation ( re f . 51):
p,,p - 0.565 Mo = 0.795 Po
It is based on experimentid data, and assumes t h a t separation is a
function of two parameters.
start of the adverse pressure gradient.
the separation s t a t i c pressure t o the mini- static pressure.
One of these is the Mach number a t the
The other is the r a t i o of
These eight criteria were tes ted by comparing the i r separation
predictions with experimental data.
were the conditions f o r whicli separation was observed on the
configurations with so l id sfmulators. Figures 14 and 15 show the
var ia t ion of separation locat ion with Mach number f o r the various
The cases used in the evaluction

35
t 1
0 Townsend
I 2 -
0 Solid simulator 0 Reshotko-Tucker A Page h Angle c\ Presz 0 Stratford
L O 0
I I 1 I I I! . 4 . 5 .6 . 7 . a . 9 1.0
(a) Configuration 1 (t/d, = 0.80, d,/d, = 0.50)
Figure 14.- Comparison of the variation of Separation location predicted by various methods with Mach number for configurations with so! id plume simulators. Experimental pressure distrikutions used in predicting separation locations.

36
1.0
.9
. 8
.7
- 6
'sep/%
.5
. 4
. 3 . 2 I 0 L
0
Q \ \
0 Solid simulator 0 Reshotko-Tucker A page b Angle b Presz 0 Stratford o Townsend
J I I I 1 I I . 4 .5 .6 . 7 .a . 9 1.0
Mal
(b) Configuration 2 (t/d, = 1.0, de/dm = 0.50)
Figure 14. - Continued.

37
I . 8 C
i
i - 7 t-
i
I .6 + i
Solid simulator Reshotko-Tucker Goidschmied
Angle Presz Stratford Townsend
page
i - 3 !-
I i I
- 2 -
Ll'A-- . 4 . 5 .6 . 7 . 8 .9 1.0
L O 0
Moo
(4 Configuration 4 (!/dm = 1.0. d,/dm - 0.60)
Figure 14. - Continued.

38
. 7
0 Solid simulator
0 Goldschmied A Page b Presz 0 Stratford 0 Tavnsend
.6 0 Reshotko-Tucker :~ I XSep/d"
_J .9 1.0
0 L l i 0 . 4 . 5 . 6 . 7 . 8
(a) Configuration 6 (\/dm - 1.0, de/d, = 0.70)
Figure 14. - Concluded.

39
1.0 - i
‘sep/% . 5
I . 4 t-
I i
I . 3 -
I . 2 -
0
Solid simulator 0 Reshotko-Tucker 0 Goldschmied A Page b Angle b Presz 0 Stratford 0 Townsend 0 wu
L
t 1 I I I 1 _. 1 0 0 . 4 . 5 . 6 . 7 . a .9 1.0
(a) Configuration 1 (\/dm * 0.80, de/d, = 0.50)
Figure 15.- Comparison of the variation of separation location p r e d i c t e d by various methods with Mach number for ccnfigurations with s o l i d plume simulators. Theoretical inviscid pressure distributions used i n predicting separation locations.

1.0 r
40
Solid simulator 0 Reshotko-Tucker 0 Coldschmied A page b Angle [5 Presz 0 Stratford 0 Townsend 0 WU
0 L 0 . 4 . 5 .6 . 7 . 8 . 9 1.0
Mal
(b) Configuration 2 (\/dm = 1.0, de/dm = 0.50)
Figure 15. - Continued.

41
. 7 -
.6 - 0 0
- 0 A b [5
- n 0 0
Solid simulator Reshotko-Tucker Coldschmied
Angle P resf Stratford Town send wu
Page
1 1 1 I 1 1 1 . 4 . 5 . 6 . 7 . 8 . 9 1.0
0 L 0
(c) Configuration 4 (t/dm = 1.0, d,/d, = 0.60)
Figure 15. -Continued.

42
1.0
.9
.a
. 7
.6
xSep/dlll
. 5
.4
. 3
. 2
0 Solid simulator 0 Reshotko-Tucker 0 Goldschmied fl page b Pres2 n Stratford
I 0 Townsend 0 wu
-
(d) Configuration 6 (\ /dm = 1.0, de/dm 0.70)
Figure 15 . -Concluded.

43
methods. In f igure 14, the experimental pressure d i s t r ibu t ions were
used i n the calculations. I n f igure 15, the theore t ica l inv isc id
pressure d i s t r ibu t ions were used.
data caused much of the scatter i n f igure 14. Also, because of the
pressure plateau i n the separated region, a small e r r o r in the value
of the predicted separation pressure can r e s u l t i n a l a rge e r r o r i n
separation location when using experimental pressures. In f ac t , the
The scatter i n the experimental
Goldschmied c r i t e r i o n predicted separation f o r only four cases, and
the Wu c r i t e d o n f a i l e d t o pred ic t any a t a l l .
the predicted trends using the inviscid pressure d i s t r ibu t ions were
much smoother, although they were of ten very inaccurate. The Wu
c r i t e r i o n was only ab le t o pred ic t separation f o r f i v e cases.
general when the inviscid pressure d i s t r ibu t ion was used, the
Goldschmied c r i t e r i o n predicted the most rearward separation locations.
It was followed i n order by the predictions of Page, Reshotko-Tucker,
Townshend, Presz, and St ra t ford . The bes t overa l l predictions were
made using the Angle c r i t e r i o n based on experimental pressure
d is t r ibu t ions . This was not surpr i s ing s ince the same data were
used t o derive t h i s c r i t e r ion . However, none of the c r i t e r i a appeared
to provide very accurate r e su l t s .
As shown i n f igure 15,
In
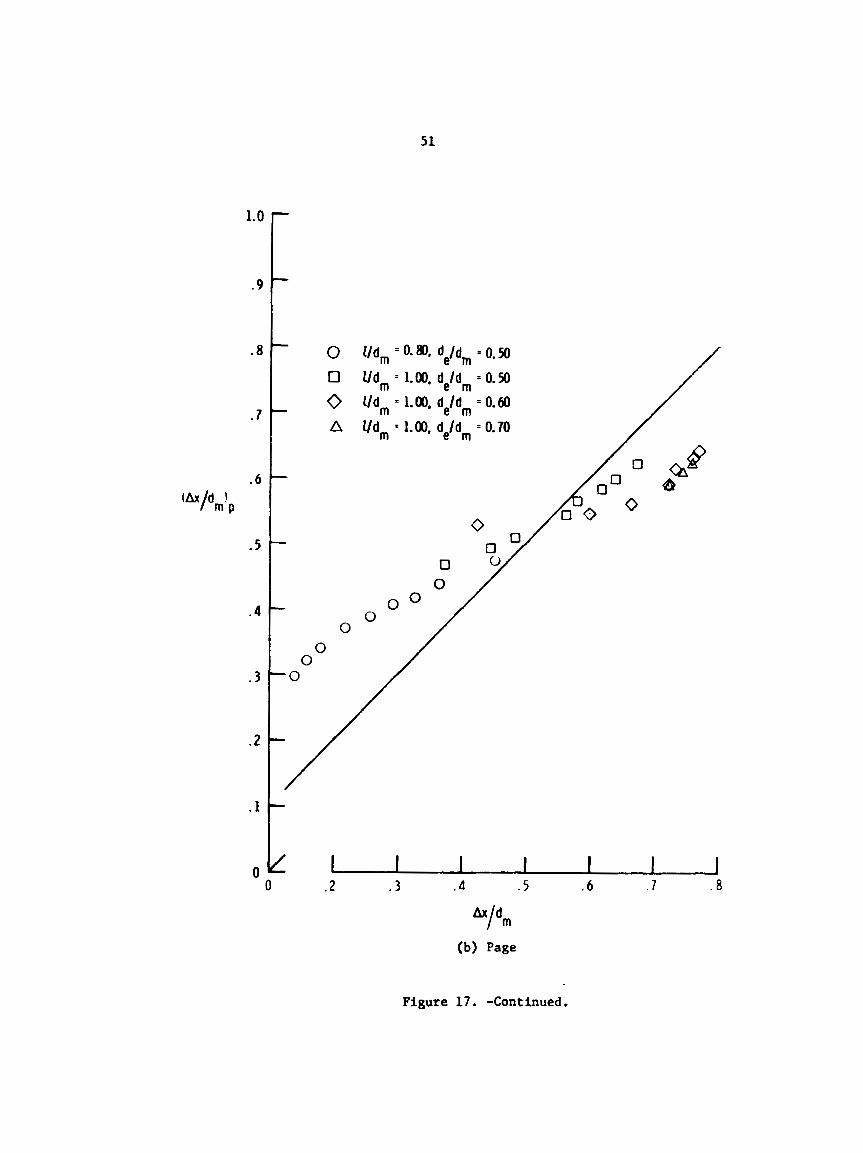
This inaccuracy is b e t t e r seen i n f igures 16 and 1 7 . In f igure16 ,
the predicted separation locat ions 9btained using the experimental
pressure d i s t r ibu t ions are p lo t ted versus the experimental Separation
locations. In f igure 17, the predictions obtained using the inv isc id
pressure d i8 t r ibu t ions are p lo t ted . (The l imited r e s u l t s of the Wu

44
0 0 0 A
l/d, = 0.80, d i d , = 0.50
l /d m = 1.00, d d d , = 0.50 l,’lm = 1.00, de/dm = 0.60 Z/d, = 1.00, d i d , = 0.70
A
.l[
0 >---J--J 0 . 2 . 3 . 4 . 5 .6 . 7 . b
(a) Reshotko-Tucker
Figure 16.- Evaluation of predicted separztion locations with oil-flow data for configurations with solid plume simulators. Experimental pressure distributions used in predicting separation locations.

45
1.0
.9
. 8
. 7
. 6
(&/d 1 m P
. s
. 4
. 3
. 2
. 1
- 0 0
[/dm = 0.80, d,/dm = 0.50 I /d m = 1.00, de/dm = 0.50
- 0 Z/d, = 1.00, d i d , = 0.60
Z/d, = 1.00, d i d , - 0.70 A
-
-
0 0 . 2 . 3 . 4 .5 .6 . 7 . 8
Ax/ dm
(b) Page
Figure 16. -Continued.

46
. 1 -

47
O
.9
lsO F I- O
/ -- - 0- . 2 . 3 . 4 . 5 .6 . 7 .a
. 7
-6
‘ V d m ’ p
- 5
. 4
. j
. 2
.1
0 4dm = 0.8). dJdm = 0.50
0 4dm = 1.00. dJdm = 0.50
0 4d rl, 1.00, dJdm = 0.60 A 4dm = 1.00, de/dm = 0.70
(d) Stratford
Figure 16. -Continued.

48
1.0
- 9
.8
- 1
.6
(Ax/dm;p
. 5
. 4
- 3
. 2
. 1
- 9 0
Ud, = 0.81, dJdm = 0.50
Ild, = 1.00, dJdm = 0.50
- 0 4 d m = 1.00, dJd, = 0.60
4 d m = 1.00. dJdq = 0.70 A
-
-
-
-
O O . 2 - 3 . 4 . 5 .6 . 7 . a
yll
(e) Townsend
Figure 16. -Cont hued.

49
.9 -
-
Figure 16. -Concluded.
. 1 -

50
I i
.9 - i
-.' . 5
0 4dm =O.Bo. ddd, = 0.50 0 l/d = 1.00, de/dm = 0.50
0 l /d = l.@C, de/dm = 0.60
A 4dm = 1.00. d-/d-. = 0.70
m
m e
-4t 0 U
0 7 I
0 . 2 . 3 . 4 .5 . 6 . 7 . a
(a) Reshot ko-Tucker
Figure 17. -Evaluation of predicted separation locations with oil-flow data for configurations with solid plume simulators. inviscid pressure distributions used i n predicting sep,?ration locations.
Theoretical
51
1.0
.9
.8
. 7
.6 Ch/d 1
m P
. 5
. 4
. 3
. 2
. l
0
0 [3
0 A
Udm =O-m, d e m /d = O . %
l/d, = 1.00, de/d, = 0.50
4 d , = 1.00, d d d , = 0.60
Udm = 1.00. d d d - = 0.70
0 0
0 0
0
- e m
0 /
Figure 17. -Continued.

52
.4 1
= 0.8). dJd, = 0.50 = 1.00, dkd, * 0.50 = 1.00. dJd, = 0.60
= 1.00, dkd, = 0.70
= 0.8). dJd, = 0.50 = 1.00, dkd, * 0.50 = 1.00. dJd, = 0.60
= 1.00, dkd, = 0.70
0 0 0 0
0 9
O 0
.1
0 '#'I 0 . 2 . 3 . 4 . s I .6 I . 7 I . 8 J
(c) Presz
Figure 17. -Continued.

53
1.0
.9
.8
. 7
.6
( h / d 1 m P
. 5
. 4
. 3
. 2
. 1
0 0 . 2 . 3 . 4 .5 . 6 . 7 . a
(d) Stratford
Figure 1 7 . -Continued.

54
. 8
. 7
- 6
. 4
- 3
. 2
. 1
- 0 0 0 A
l/d, = 0.83, d,/dm = 0.50
l/dm = 1.00, d,/dm = 0.50 Z/d, = 1.00, dddm = 0.60
Z/dm = 1.00, d I d = 0.70 L
e m
-
-
I I 1 I I I . 2 . 3 . 4 . 5 .6 . 7 .8
0 0 C l
(e) Townsend
Figure 17. -Continued.

55
1 . 0
. 9
. 8
. 7
.6
( Y d r n ’ p . 5
. 4
. 3
3 .-
.1
0
- 0 Z/d, = 0.80, d d d , = 0.50
[/dm = 1.00. $/d, = 0.50
l ld , = 1.00, d d d , = 0.60
[Id- = 1.00, d-/d- = 0.70
0
0 A
-
0 0 0 -/ 0
- 0 0
0
f - I I I 1 1 1 1 0 .2 . 3 . 4 . 5 . 6 . 7 . 8
B/dl?l
( f ) Angle
Figure 17. -Continued.

56
.9 - 0 I/d, = 0.80, de/dm = 0. SO
-
(g) Goldschmied
. 1
Figure 17. -Concluded.
-

5 7
c r i t e r i o n and the Goldschmied c r i t e r i o n based on the expeilmental pressure
d i s t r ibu t ions are not presented.) The extent t h a t the predictions
deviate can be seen fo r a l l methods. It should be noted, however,
t h a t some of the scatter seen i n both f igures is due t o the
experimental e r r o r i n the oil-flow data i t s e l f .
standard e r r o r of estimate fo r each c r i t e r i o n ,
By comparing the
i t w a s found tha t the Angle method based on the experimental pressure
d i s t r ibu t ions yielded the bes t results (E = 0.073)! The next bes t
results were obtained by using the Reshotko-Tucker c r i t e r i o n based
on the inv isc id pressure d is t r ibu t ions .
It is a l s o seen i n f igures 16 and 1 7 tha t the results using the
inv isc id pressure d i s t r ibu t ions are more linear. By f i t t i n g a least
squares curve, 1.e. by t r e a t i n g the predictions as a l i n e a r function
of the experimental data , an improved prediction can empirically be
obtained. The standard e r r o r s of estimate of the r e su l t i ng curve
f i t s are as follows:
Reshotko-Tucker - E 0.038, Page - E E 0.041, Presz - E 0.047, StrLt ford - E 0.048, Townshend - E = 0.051, Angle - E 0.058, Goldschmied - E 0.062.
The improved r e s u l t s obtained by applying the curve f i t t o the Reshotko-
Tocker c r i t e r i o n are compared with the oil-flow data i n f igure 18. The

58
. 9 k I
sep /dm X
Experimental Theory
0 l/d, = @. 80, d d d m = 0.50
3 c3 l/d, = 1.00, ddd, = 0.50 l /d, = 1.00, de,'d, = 0.60
[/d, = 1.00, de/d, = 0.70
0 A
U
Figure 18. -Comparison of oi l - f low data and predicted separation l o c a t i o n s made using least squares curve fit applLed to Reshotko-Tucker criterion .
59
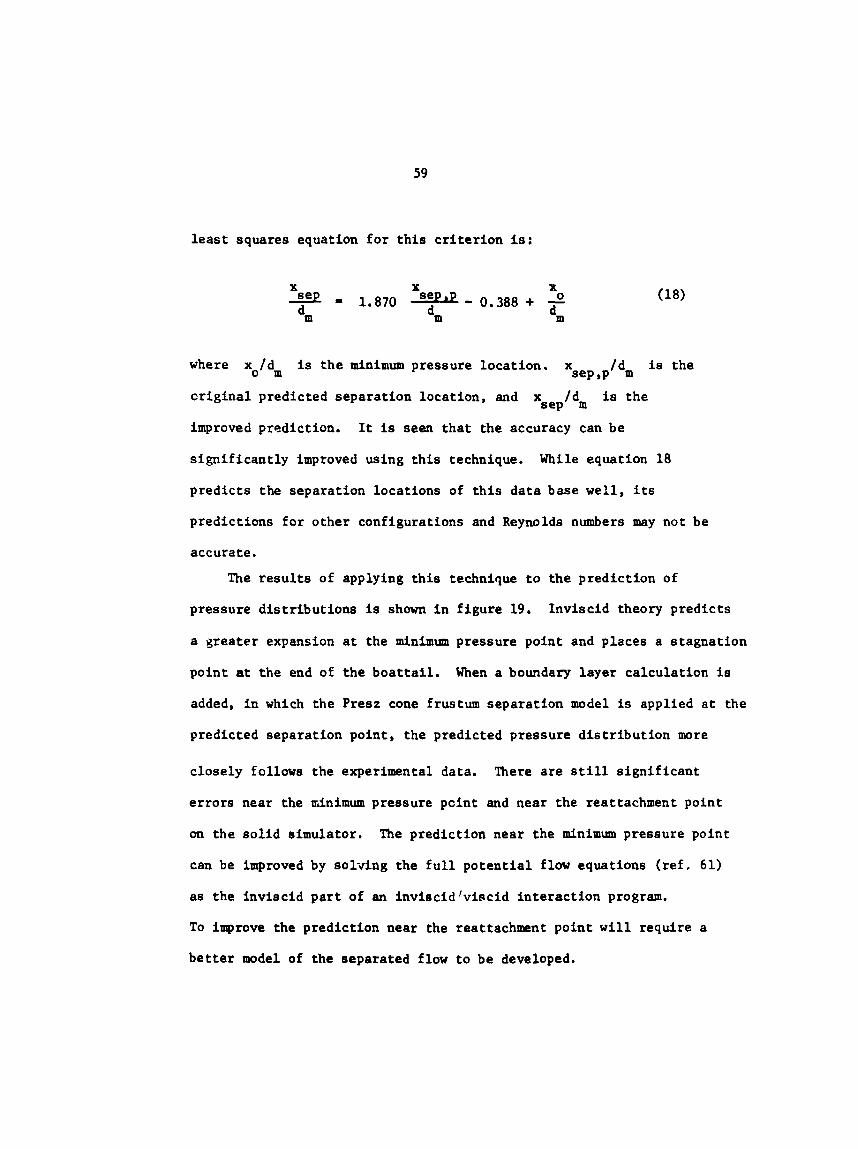
least squares equation f o r t h i s c r i t e r i o n is:
X X Xsep = 1.870 - 0.388 + 2
dm m dm
where xo/dm is t h e minimum pressure locat ion.
c r i g i n a l predicted separation locat ion, and x /dm is the
improved prediction. It is seen tha t the accuracy can be
s ign i f i can t ly improved using t h i s technique.
pred ic t s the Separation locat ions of t h i s da ta base w e l l , i t s
predictions f o r other configurations and Reynolds numbers may not be
accurate.
x sep ,pldm is the
SeP
While equation 18
The r e s u l t s of applying t h i s technique t o the pred ic t ion of
pressure d is t r ibu t ions is shown i n f igure 19. Inviscid theory predic t s
a yreater expansion a t the minimum pressure point and places a stagnation
point at the end of t he boa t t a l l .
added, i n which the Presz cone frustum separation model is applied a t the
predicted separation point , the predicted pressure d i s t r ibu t ion more
When a boundary layer calculation is
closely follows the experimental data. There are s t i l l s ign i f i can t
e r ro r s near the dnimum pressure pcint and near the reattachment point
on the so l id simulator.
can be Improved by solving the full po ten t i a l flow equations (ref. 61)
as the inv isc id p a r t of an inviscid lviscid in te rac t ion program.
To improve the prediction near the reattachment point will require a
b e t t e r model of the separated flow t o be developed.
The prediction near the minimum pressure point

1.(
. E
.6
. 4
.2
C
0
-. 2
-. 4
- . 6
- . a
0 Experimental Inviscid theory -- -
._. - .- - Inviscid / viscid theory
I I I 1 I -1.0 - .5 0 . 5 1.0 1 .5 2 0 2 . 5
X/dnl
Figure 19. -Comparison of experimental and predicted pressure-coefficient distributions on a circular-arc boattail nozzle using a s o i i d cone to represent the separated region.
(Mm = 0.8, \/dm - 0.80, de/d, = 0.50)

CHAPTER IV
CONCLUDING
An investigation has been conducted i n the tangley 16-foot
transonic tunnel a t 0. angle of a t tack and free-stream Mach nwnbers
from 0.40 t o 0.95 t o study the phenomenon of separated f l cn on a
series of circular-arc afterbodies.
c i rcu lar cylinders v i t h
exhausts.
Both high-pressure air and s o l i d
ds/de = 1.00 were used t o simulate je t
The r e su l t s of t h i s test indicate four primary conclusions:
1. The separation locat ion moves forward w i t h increasing
longitudinal curvature and free-stream Mach number. A t t ransonic speeds
shock-induced separation p r ~ h b l y occurs, causing the separation
location t o mvz forward t o the v ic in i ty of the shock location.
2. The separation location moves l i t t l e over the j e t to ta l -
pressure r a t i o range from jet-off up t o 9; hwcver, there is a
s ign i f icant va r i Ice a t subsocic Mach nrrmbers with the s o l i d
simulator data because of entrainment.
3. None of the c r i t e r i a tested produced accurate results i n
general,
experimental dat;, results were much be t te r . Using t h i s technique,
HJwevr r when the predicticns were curve-f i t ted with
the Reshotko-Tucker c r i t e r ion gave the bes t r e su l t s (equation 18).
4. Predicted pressure coef f i c i e n t d i s t r ibu t ions are much improved
when the above technique is used t o predict the separation location.
However, much be t t e r agreement with experimental data w i l l be ross ib le
when an improved separated flow ;I- -1 is developed. This improved
model should be able t o handle ne entrainment e f f ec t s of j e t exhausts.
Also, a separated f low model which can vary i n shape may make the
pressure d is t r ibu t ion be less sensit ive t o the predicted Geparation
location.
62
REFERENCES
1.
2.
3.
4.
5.
6.
7.
8.
9.
10.
11.
12.
13.
Reubush, David E.: Experimental Study of the Effectiveness of Cylindrical Plume Simulatc-s for Predicting Jet-on Boattail Drag at Mach Numbers up to 1.30. NASA TN D-7795, 1974.
Reubush, David E.: Effects of Fineness and Closure Ratios on Boattail Drag of Circular-Arc Afterbody Models With Jet Exhaust at Mach Numbers up to 1.30. NASA TN D-7163, 1973.
Reubush, David E.; and Runckel, Jack F.: Effect of Fineness Ratio on the Boattail Drag of Circular-Arc Afterbodies Having Closure Ratios of 0.50 With Jet Exhaust at Uach Numbers up to 1.30. NASA TN D-7192, 1973.
Ret+ush, David E.: An Experimental Investigation of Jet Plume Simulation With Soli, Circular Cylinders. NASA TIY X-71963, 1974.
Grund, E.; Presz, W., Jr.; and Konarski, M.: Predicting Airframe/ Exhaust Nozzle Interactions at Transonic Mach Numbers. No. 71-720, June 1971.
AIAA Paper
Harrington, Douglas E.: Jet Effects on Boattail Pressure W a g of Isolated Ejector Nozzles at Mach Numbers From 0.60 to 1.47. NASA RI X-1785, 1969.
Glasgow, E.R.; Divita, J .S . ; Everting, P.C.; and Laughrey, J.A.: Analyticai and Experimental Evaluation of Performance Prediction Methods Applicable to Exhaust Nozzles. AIA4 Paper No. 71-719, 1971.
Wu, J.M.: Fcndamental Studies of Subsonic and Transonic F l o w Separation, Part I -- First Phase Sumnmry Report. AEDC - TR-75-95, 1975.
Rom, J.; and Bober, L.J.: Calculation of the Pressure Distribution on Axisynunetric Boattzils Including Effects of Viscous Interactions i d Exhaust Jets in Subsonic Flow. NASA TM X-3109, 1974.
Anon.: Flow Separation. AGARD-CP-168, 1975.
Hess, J.L.; and Smith, A.M.O.: Calculation of Potential Flow About Arbitrary Bodies. Progress in Aeronautical Sciences, Vol. 8, D. Kuchemann, ed., Pergamon Press, Ltd., c. 1967, pp.1-138.
Anon.: Users Manuel for the External Drag and Internal Nozzle Performance Deck (Deck XI) - Superscnic Flow Analysis (Applicable to Deck V:). PWA-3465, Suppl. F, Pt. I (Contract No. AF33(615)- 3128), Pratt and k’hitney Aircraft, Sept. 1, 1968.
Kuhn, Gary D.: Calculation of Compressible Nonadiabatic Boundary Layers in Laminar, Transicional, and Tuzbulent Flow by the Method of Integral Relations. NASA CR-1797, 1971.

63
14.
15.
16.
17.
18.
19 I
20 *
21.
22.
23.
24.
25.
26.
27.
EconomOs, C.; and Boccio, J.: Calculation of Turbulent Boundary Layers With Heat Transfer and Pressure Gradient Utilizing a Compressibility Transforaatioq. N G A CR-1923, 1971.
Hankey, W.L.: Separated Flow Studies. ARL 75-0173, 1975.
Calarese, Dr. Wladimiro: Review of Methods of Solution of Afterbody1 Exhaust Nozzle Flow Fields. AFFDL-TR-74-108, 1974.
Calarese, Dr. Wladimiro: Analysis of Transonic Viscous-Inviscid Icteractions on Axisyunnetric Afterbodies With Jet Effects and Boattail Injection in Separated Regions. AFFDL-TR-75-117, 1975.
Calarese, Dr. Wladimiro: An Analytical Method to Compute Viscous- Inviscid Transonic Flow on Axisymaretric Afterbodies Including Jet Effects and Boattail Bleed in Separated Regions. AIAA Paper No. 75-1293, Oct. 1975.
Cebeci, T.; and Saith, A.M.O.: A Finite-Difference Method for Calculating Compressible Laminar and Turbulent Boundary Layers. J. Basic Engineering, Sept. 1970. pp. 523-535.
Chow, W.L.; Bober. L.J.; and Anderson, B . H . : Numerical Calculation of Transonic Boattail Flow. NASA TN D-7984, 1975.
South, J.C.; and Jameson, A.: Relaxation Solutions for Inviscid hisymmetric Transonic Flow Over Blunt or Pointed Bodies. Computational Fluid Dynamics Conference Proceedings, Palm Springs, CA, July 1973.
AIAA
Nash, J.F.; and Hicks, J.G.: "An Integral Method Including the Effects of Upstream History on the Turbulent Shear Stress," Proceedings - Computation of Turbulent Boundary Layers - 1968 AFOSR-IFP-Stanford Conference, Vol. 1, editors S.J. Kline, et. al.
Coles, D.E.; and Hirst, E.A.: Proceedings - Computation of Turbulent Boundary Layers - 1968 AFOSR-IFP- Stanford Conference, Vol. 2 , Stanford University, 1969.
Altstatt, M.C.: Evaluation of a Method for Computation of Separated, Turbulent, Compressible Boundary Layers. AEDC-TR-76-27, 1976.
Kuhn, C.D.; and Nielsen, J.N.: "Prediction of Turbulent Separated Boundary Layers." A I A A Paper No. 73-663, AIAA 6th Fluid and Plasma Dynamics Conference, Palm Spricgs, CA, July 1973.
Coles, D. : "The Law of the Wake in the Turbulent Boundary Layer ." Journal of Fluid Mechanics, Vol. 1, Part 2, July 1956, pp. 191-226.
Stewartson, K.: Layers." Proceedings of the Royal Society, A, Vol. 200, 1949, pp. 85-100.
"Corrected Incompressible and Compressible Boundary

64
28.
29.
30.
31.
32.
33 *
34 .
35.
36.
37.
38.
39.
40.
41.
42.
Gerhart, P.M.; and Bober, L.J.: Comparison of Several Piethods for Predicting Separation in a Compressible Turbulent Boundary Layer. NASA TMX-3102, 1974.
Oswatitsch, K.: The Separation Condition of Boundary Layers. NASA TT F-15, 200, 1973.
Sachdeva, R.C.: "A Numerical Experiment of Two-Dimensional Turbulent Separation." The Aeronautical Journal, Vol. 76, No. 740, August 1972.
Tsuji, Yutaka; and brikawa, Yoshinobu: "Turbulent Boundary Layer with Pressure Gradient Alternating in Sign." Vol. 27, February 1976, pp. 15-28.
Aeronautical Quarterly,
Nash, J.F.; and Patel, V.C.: Calculations of Unsteady Turbulent Boundary Layers With Flow Reversal. NASA CR-2546, 1975.
Abbott, D.E.; Walker, J.D.A.; York, R.E.: "Numerical Solution of Turbulent Boundary Layers Approaching Separation," - Proceedings of the Fourth International Conference on Numerical Methods in Fluid Dynamics, June 24-28, 1974, University of Colorado. Lecture Notes in Physics, Vol. 35, 1975.
Page, R.H. : "A Theory for Incipient Separation." Developments in Mechanics, Vol. 1, 1961, pp. 563-577.
Keith, J.S.; Ferguson, D.R.; Herkle, C.L.; Heck, P.H.; and Lahti, D.J.: Analytical Method for Predicting the Pressure Distribution About a Nacelle at Transonic Speeds. NASA CR-2217, 1973.
Stratford, B.S.; Beavers, G.S.: The Calculation of the Cornprcssible Turbulent Boundary Layer in an Arbitrary Pressure Gradient- A Correlation of Certain Previous Methods. N.C.T.E.: M.330, 1959.
Presz, W.M., Jr.; and Pitkin, E.T.: An Analytical Model -f hisymmetric Afterbody Flow Separation. AIAA Paper No. hS, June 1975.
Stratford, B.S.: "The Prediction of Separation of the Turbulent Boundary Layer," Journal of Fluid Mechanics, Vol. 5, pp. 1-16, 1959.
Townshend, A.A.: "The Behavior of a Turbulent Boundary Layer Near Separation," Journal of Fluid Mechanics, Vol. 12, pp. 536-554, 1962.
Goldschmied, F.R.: "An Approach to Turbulent Incompressible Separation Under Adverse Pressure Gradients," J. Aircraft, Vol. 2, No. 2, 1965.
Goldschmied, F.E . : "An Approach to Turbulent Incompressible Separation and the Determination of Skin-Friction Under Adverse Pressure Gradients." A I A A Paper No. 64-465, July 1964.
Bradshaw, P.; and Galea, P.V.: 3tep-Induced Separation of a Turbulent Boundary Layer In Compressib'. Flow," J. Fluid Mechanics, Vol. 27, pp. 111-130, 1967.

65
43. Robertson, J.M. : "Prediction of Turbulent Boundary Layer Separation," J. Aero. Science, Vol. 25, No. 8, 1957.
44. Sandborn, V.A.; and Liu, C.Y.: "On Turbulent Boundary Layer Separacion,'' J. Fluid Mechanics, Vol. 32, pp. 293-304, 1968.
45. Sandborn, V.A.: "On the Separation of Boundary Layers," ASME Journal, 1959.
46. Gadd, G.E.: "Interaction Between Wholly Laminar or Wholly Turbulent Boundary Layers and Shock Waves Strong Enough To Cause Separation," J . Aero.Science, Vol. 20, No. 11, 1953.
47. Ross, D.; and Robertson, J.M.: "An Empirical Method for Calculation of the Growth of a Turbulent Boundary Layer," J. Aero. Science, Vol. 21, No. 5 , 1954.
48. Moses, H.L.: "The Behavior of Turtdent Boundary Layers in Adverse Pressure Gradients," MIT Gas Turbine Lab. report 73, 1974.
49. Reshotko, E.; and Tucker, M.: Effect of a Discontinuity on Turbulent Boundary Layer Thickness Parameters With Application to Shock Induced Separation. NACA TN-3454, 1955.
50.
51.
52.
53.
54 .
55.
56.
57.
Alber, E.E.; Bacon, J.W.; and Masson, B.S.: An Experimental Investigation of Turbulent Transonic Viscous-Inviscid Interactions. AIAA Paper 71-565, 1971.
Wu, J.M. ; Moulden, T.H. ; and Uchiyama, N. : Aerodynamic Performance of Missle Configurations at Transonic Speeds Including the Effects of a Jet Plume. U.S. Army Missile Command, TR-RD-76-23, 1976.
Hahn, Mansop; Rubbert, Paul E.; khal, Avtar S.: Evaluation qf Separation Criteria and Their Application To Separated Flow Analysis. AFFDL-TR-72-145, 1973,
Ward, Vernon G.; Whitcomb, Charles F.; and Pearson, Merwin D.: Air- Flow and Power Characteristics of the Langley l6-Foot Transonic Tunnel With Slotted Test Section. NACA RM L52E01, 1952.
Schaefer, William T., Jr.: Characteristics of Major Active Wind Tunnels at the! -Langley Research Center. NASA TM X-1130, 1965.
Corson, Blake W., Jr.; Runckel, Jack F.; and Igoe, William B.: Calibration of the Langley 16-Foot Transonic Tunnel With Test Section Air Removal. NASA TR R-423, 1974.
Anon.: Flow Measurement by Means of Thin Plate Orifices, Flow Nozzles, and Venturi Tubes. Supplement on Instruments and Apparatus, pt. 5, ch. 4, Power Test Codes, ASME, 1959, pp. 5-91.
Braslow, Albert L.; and Knox, Eugene C.: Simpllflcd Method -or Determination of Critical Height of Distributed Roughness Particles for Boundary-Layer Transition at Mach Numbers From 0 to 5. TN-4363, 1958.
NACA

66
58. Braslow, Albert L.; Hicks, Raymond M.; and Harris, Roy V., J r . : Use of Grit-Type Boundary-Layer-Transition Trips on Wind-Tunnel Models. NASA TN D-3579, 1966.
59. Schlicting, Hermann: Boundary-Layer Theory, 1968.
60. Korst, H.H.: A Theory for Base Pressures in Transonic and Supersonic Flow. Journal of Applied Mechanics, Dee. 1956.
61. Wilmoth, R.G.: Analytical Study of Viscous Effects on Transonic Flow Over Boattail Nozzles, AIAA Paper 77-223, Jan. 1977 .
Related Documents