Iowa Rates and Rating Values Filing For Voluntary and Assigned Risk Markets Proposed Effective January 1, 2016

Welcome message from author
This document is posted to help you gain knowledge. Please leave a comment to let me know what you think about it! Share it to your friends and learn new things together.
Transcript

Iowa
Rates and Rating Values Filing For Voluntary and Assigned Risk Markets Proposed Effective January 1, 2016

Chris Bailey State Relations Executive Regulatory Services Division
(P) 850-322-4047 (F) 561-893-5106 Email: [email protected]
106 E. College Avenue, Suite 900, Tallahassee, FL 32301 www.ncci.com
National Council on Compensation Insurance
August 13, 2015
Honorable Nick Gerhart Insurance Commissioner Iowa Insurance Division 601 Locust St., 4th Floor Des Moines, IA 50309-3738
RE: Workers Compensation Rates and Rating Values—Iowa Voluntary Market and Assigned Risk Market - Effective January 1, 2016
Dear Commissioner Gerhart:
In accordance with the applicable statutes and regulations of the state of Iowa, we are filing for your consideration and approval advisory prospective rates and rating values for the Iowa voluntary and assigned risk markets to be effective January 1, 2016 for new and renewal policies.
This filing proposes an overall average increase of 2.7% in voluntary rates and in assigned risk rates. With a proposed reduction in the expense constant from $260 to $160 and a proposed increase in the maximum minimum premium from $800 to $900, the overall average premium increase is 2.2%. The advisory prospective rates for the voluntary market are used as a basis for rates in the assigned risk market.
This filing is made exclusively on behalf of the companies that have given valid consideration for the express purpose of fulfilling regulatory rate filing requirements and other private use of this information.
The following are of special note as a result of item filings approved in Iowa:
1. As a result of Item B‐1397, effective January 1, 2008, data for new Class Codes 7710 and7711 was previously combined with historical data for discontinued Class Code 7704 todetermine a single rate for Class Codes 7710 and 7711. Since there is minimal historical dataremaining for Class Code 7704 in the experience period used for ratemaking, the data forClass Codes 7710 and 7711 is no longer being combined. However, a single combined rate isstill calculated for Class Codes 7710 and 7711 via a payroll weighted average of theseparately indicated rates for these two Class Codes.
2. As a result of Item E‐1402, the split point for experience rating was changed from $15,000to $16,000. This will be the final year of the split point transition period in Iowa. In each subsequent rate filing, the split point will be indexed by the countrywide severity change.
3. As a result of Item R‐1411, the retrospective rating plan parameters were updated.

The Honorable Nick Gerhart Page 2 August 13, 2015
In the enclosed appendix is a list of companies, sorted by group, which as of the time this filing is submitted, are eligible to reference this information. The inclusion of a company on this list merely indicates that the company, or the group to which it belongs, is affiliated with NCCI in this state, or has licensed this information as a non-affiliate, and is not intended to indicate whether the company is currently writing business or is even licensed to write business in this state. As always, if you should have any questions or need additional information, please do not hesitate to contact me at (850) 322-4047 or Tony DiDonato at (561) 893-3116. Respectfully submitted, NATIONAL COUNCIL ON COMPENSATION INSURANCE, INC. Filing Prepared by:
Chris Bailey Tony DiDonato State Relations Executive Director and Senior Actuary Regulatory Services Division Actuarial and Economic Services

IOWA
WORKERS COMPENSATION FILING – JANUARY 1, 2016
Actuarial Certification
I, Tony DiDonato, am a Director and Senior Actuary for the National Council on Compensation Insurance, Inc. I am a Fellow of the Casualty Actuarial Society and a member of the American Academy of Actuaries, and I meet the Qualification Standards of the American Academy of Actuaries to provide the actuarial report contained herein. The information contained in this report has been prepared under my direction in accordance with applicable Actuarial Standards of Practice as promulgated by the Actuarial Standards Board. The Actuarial Standards Board is vested by the U.S.-based actuarial organizations with the responsibility for promulgating Actuarial Standards of Practice for actuaries providing professional services in the United States. Each of these organizations requires its members, through its Code of Professional Conduct, to observe the Actuarial Standards of Practice when practicing in the United States. ________________________ Tony DiDonato Director and Senior Actuary Actuarial and Economic Services
© Copyright 2015 National Council on Compensation Insurance, Inc. All Rights Reserved.

© Copyright 2015 National Council on Compensation Insurance, Inc. All Rights Reserved These materials are comprised of NCCI actuarial judgment and proprietary and confidential information which are valuable assets of NCCI and are protected by copyright and other intellectual property laws. The uses of these materials are governed by a separate contractual agreement between NCCI and its licensees such as an affiliation agreement between NCCI and an end user. Unless expressly authorized by NCCI, you may not copy, create derivative works (by way of example, create or supplement your own works or other materials), display, perform, or use the materials, in whole or in part, in any media. Such actions taken by you, or by your direction, may be in violation of federal copyright and other commercial laws. NCCI does not permit or agree to such use of its materials. In the event such use is contemplated or desired, please contact NCCI's Legal Department for permission. NCCI MAKES NO REPRESENTATIONS OR WARRANTIES RELATING TO THESE MATERIALS, INCLUDING ANY EXPRESS, STATUTORY OR IMPLIED WARRANTIES INCLUDING THE IMPLIED WARRANTY OF MERCHANTABILITY AND FITNESS FOR A PARTICULAR PURPOSE. ADDITIONALLY, AUTHORIZED END USERS ASSUME RESPONSIBILITY FOR THE USE OF, AND FOR ANY AND ALL RESULTS DERIVED OR OBTAINED THROUGH THE USE OF SUCH MATERIALS.

IOWA
WORKERS COMPENSATION FILING – JANUARY 1, 2016
Table of Contents
Background and Filing Procedure ......................................................................... 1
Proposed Change in Voluntary and Assigned Risk Rates .................................... 2
Key Components
Experience ..................................................................................................................... 4
Trend ............................................................................................................................. 5
Benefits ........................................................................................................................ 13
Expenses ..................................................................................................................... 14
Assigned Risk Market ......................................................................................... 16
Conclusion .......................................................................................................... 17
Exhibits
Exhibit I - Iowa Historical Voluntary and Assigned Risk Rate Changes ....................... 18
Exhibit II - Iowa Written Premium ................................................................................ 19
Exhibit III - Iowa Largest Workers Compensation Writers ........................................... 20
Exhibit IV - Proposed Voluntary Market Advisory Rates and Rating Values ............... 21
Exhibit V - Proposed Assigned Risk Rates and Rating Values.................................... 35
NCCI Key Contacts ............................................................................................. 41
Appendix—Affiliate List ...................................................................................... 42
© Copyright 2015 National Council on Compensation Insurance, Inc. All Rights Reserved.

IOWA
WORKERS COMPENSATION FILING – JANUARY 1, 2016
Background and Filing Procedure The workers compensation benefit system is designed to cover medical costs associated with workplace injuries, as well as provide wage replacement (indemnity) benefits to injured workers for lost work time. The National Council on Compensation Insurance, Inc. (NCCI) collects an extensive amount of information regarding the workers compensation system in Iowa, and submits proposed voluntary market advisory prospective rates and assigned risk rates for review and approval by the Iowa Commissioner of Insurance. These advisory prospective rates are intended to cover the indemnity and medical benefits provided under the system, as well as the expenses associated with providing these benefits (loss adjustment expenses). They also contemplate other costs associated with providing workers compensation insurance (such as commissions, taxes, etc.). In this filing, NCCI is proposing that the Commissioner of Insurance approve an overall average increase of 2.7% to the current voluntary advisory rates and the current assigned risk rates (both in effect since January 1, 2015), and that the new values will become effective on January 1, 2016. This document will explain why these changes are indicated. NCCI separately determines voluntary advisory rates and assigned risk rates for each workers compensation classification. In this filing, the actual change from the current rate is different depending on the classification.
© Copyright 2015 National Council on Compensation Insurance, Inc. All Rights Reserved.
Page 1 of 44

IOWA
WORKERS COMPENSATION FILING – JANUARY 1, 2016
Proposed Overall Average Change in Voluntary Advisory Rate Level Key Components Percentage Change Experience and Trend + 0.8% Benefits 0.0% Offset for the Change in Minimum Premium Parameters – 0.1% Production and General Expenses + 0.3% Premium Taxes and Assessments 0.0% Profit and Contingencies Provision + 1.4% Loss-based Expenses – 0.3% Offset for the Change in Expense Constant + 0.6% Overall Rate Level Change Requested + 2.7% Overall Premium Level Change Requested + 2.2% The premium level change includes a proposed expense constant decrease from $260 to $160 as well as a proposed maximum minimum premium increase from $800 to $900. Offsets for these changes are applied to the rate level change to ensure revenue neutrality across the state.
The change in the voluntary advisory rates varies depending on the classification. Each classification belongs to one of five industry groups. The average rate change proposed for each of these five groups is displayed below, as well as the largest increase and largest decrease possible for a classification in each of those groups.
OVERALL AVERAGE RATE LEVEL CHANGE
+2.7%
GOODS & SERVICES +2.0%
Maximum Increase +27% Maximum Decrease -23%
MANUFACTURING +5.5%
Maximum Increase +31% Maximum Decrease -19%
CONTRACTING +1.2%
Maximum Increase +26% Maximum Decrease -24%
MISCELLANEOUS +2.3%
Maximum Increase +27% Maximum Decrease -23%
OFFICE & CLERICAL +1.6%
Maximum Increase +27% Maximum Decrease -23%
© Copyright 2015 National Council on Compensation Insurance, Inc. All Rights Reserved.
Page 2 of 44

IOWA
WORKERS COMPENSATION FILING – JANUARY 1, 2016
Proposed Overall Average Change in Assigned Risk Rate Level Key Components Percentage Change Voluntary Rate Level Change + 2.7% Change in Assigned Risk Rate Differential 0.0%
Overall Rate Level Change Requested + 2.7%
© Copyright 2015 National Council on Compensation Insurance, Inc. All Rights Reserved.
Page 3 of 44

IOWA
WORKERS COMPENSATION FILING – JANUARY 1, 2016
Key Components In determining the overall average rate level change, the following key components are reviewed: Experience NCCI analyzed the emerging experience of Iowa workers compensation policies in recent years. The primary focus of our analysis was on premiums and losses from policy years 2012 and 2013, evaluated as of December 31, 2014 (a policy year captures the premiums and losses from the block of policies that had effective dates during a given year). The most recently available full policy year is 2013 since the last policy had an effective date of December 31, 2013 and did not expire until December 31, 2014. During this year’s analysis, after reviewing various possible experience periods, the use of the two most recently available full policy years of data was selected as most appropriate in terms of providing balance between stability and responsiveness. Also, the use of the two most recently-available policy years is consistent with filings made in the past several years by NCCI in Iowa. It should be noted that NCCI adjusts (via premium and loss on-level factors) the historical policy year experience to reflect approved rate level changes as well as statutory benefit level changes implemented since that time period. NCCI's standard methodology is to utilize statewide (combined voluntary and assigned risk) market data after it has been adjusted to the current voluntary rate level in the calculation of the overall average rate level change. Different aggregations of limited loss experience were analyzed in preparation of this filing. These were (i) paid losses (benefit amounts already paid by insurers on reported claims) and (ii) the sum of paid losses plus case reserves (paid losses and the amounts set aside to cover future payments on those claims). For use in this filing, NCCI utilized loss development factors based on each of these two loss aggregations; paid losses and paid losses plus case reserves. This is consistent with filings made in the past several years by NCCI in Iowa. Loss development factors are needed since paid losses and case reserve estimates on a given claim change over time until the claim is finally closed. The loss development factors are based on how paid losses and case reserve estimates changed over time for claims from older years. In this filing, NCCI is relying on an average change in estimate over the last three years for paid losses and an average change in estimate over the last five years for paid losses plus case reserves.
© Copyright 2015 National Council on Compensation Insurance, Inc. All Rights Reserved.
Page 4 of 44

IOWA
WORKERS COMPENSATION FILING – JANUARY 1, 2016
Key Components (Continued) Trend As noted previously, the filing relies primarily on the experience from policy years 2012 and 2013. However, the proposed advisory rates are intended for use with policies with effective dates starting on January 1, 2016. It is necessary to use trend factors that forecast how much the future Iowa workers compensation experience will differ from the past. These trend factors measure anticipated changes in the amount of indemnity and medical benefits as compared with anticipated changes in the amount of workers’ wages. For example, if benefit costs are expected to grow faster than wages, then a trend factor greater than zero is indicated. Conversely, if wages are expected to grow faster than benefit costs, then a trend factor less than zero is indicated. In order to appreciate the impact of the various filing components on overall system costs, it is helpful to consider the separate indemnity and medical segments of Iowa benefit costs.
As can be seen, 57% of Iowa’s total benefit costs are medical. This percentage is similar to most other states.
Medical57%
Indemnity43%
Distribution of Iowa Benefit Costs
© Copyright 2015 National Council on Compensation Insurance, Inc. All Rights Reserved.
Page 5 of 44

IOWA
WORKERS COMPENSATION FILING – JANUARY 1, 2016
Let us begin by analyzing a measure of the number of workplace injuries (claim frequency) and the average cost of each of these injuries (claim severity). The chart below summarizes the recent history of Iowa lost-time claims (i.e., those claims where a worker missed work time due to a workplace injury). The data in the chart reflect premiums at today’s rate and wage levels.
As this chart illustrates, Iowa’s claim frequency has followed a generally declining pattern over the past seven years with a slight uptick in policy year 2010 and a flattening in policy year 2013.
12.7 12.7
12.2
11.711.9
11.010.7 10.7
9.0
10.0
11.0
12.0
13.0
14.0
15.0
16.0
2006 2007 2008 2009 2010 2011 2012 2013
Fre
qu
ency
per
Mill
ion
of
On
-Lev
eled
, W
age-
Ad
just
ed P
rem
ium
Policy Year
Iowa Claim Frequency
Policy Year Lost-Time Claim Frequency
© Copyright 2015 National Council on Compensation Insurance, Inc. All Rights Reserved.
Page 6 of 44

IOWA
WORKERS COMPENSATION FILING – JANUARY 1, 2016
Let us look at the indemnity side of benefits. The chart below shows Iowa’s historical average indemnity cost per case figures for the most recent eight years. The data in the chart reflect losses at today’s statutory benefit levels.
18,065
20,14521,251
22,74323,760 24,070 24,142
25,892
0
5,000
10,000
15,000
20,000
25,000
30,000
2006 2007 2008 2009 2010 2011 2012 2013
Ave
rag
e C
ost
Per
Cas
e
Policy Year
Iowa Indemnity Cost Per Case
Policy Year Indemnity Cost Per Case (Based on Average of Paid and Paid+Case Losses)
© Copyright 2015 National Council on Compensation Insurance, Inc. All Rights Reserved.
Page 7 of 44

IOWA
WORKERS COMPENSATION FILING – JANUARY 1, 2016
After removing the impact of the growth in workers’ wages that occurred over this time period, the average indemnity cost per case in excess of wage growth is shown in the following chart.
As this chart illustrates, even after adjusting for wage growth over time, the average indemnity cost per case is significantly higher now than in policy year 2006.
21,45923,112 23,981
25,328 25,678 25,247 24,67225,892
0
5,000
10,000
15,000
20,000
25,000
30,000
2006 2007 2008 2009 2010 2011 2012 2013
Ave
rag
e C
ost
Per
Cas
e
Policy Year
Iowa Indemnity Cost Per CaseAdjusted to Current Wage Level
Policy Year Indemnity Cost Per Case (Based on Average of Paid and Paid+Case Losses)
© Copyright 2015 National Council on Compensation Insurance, Inc. All Rights Reserved.
Page 8 of 44
IOWA
WORKERS COMPENSATION FILING – JANUARY 1, 2016
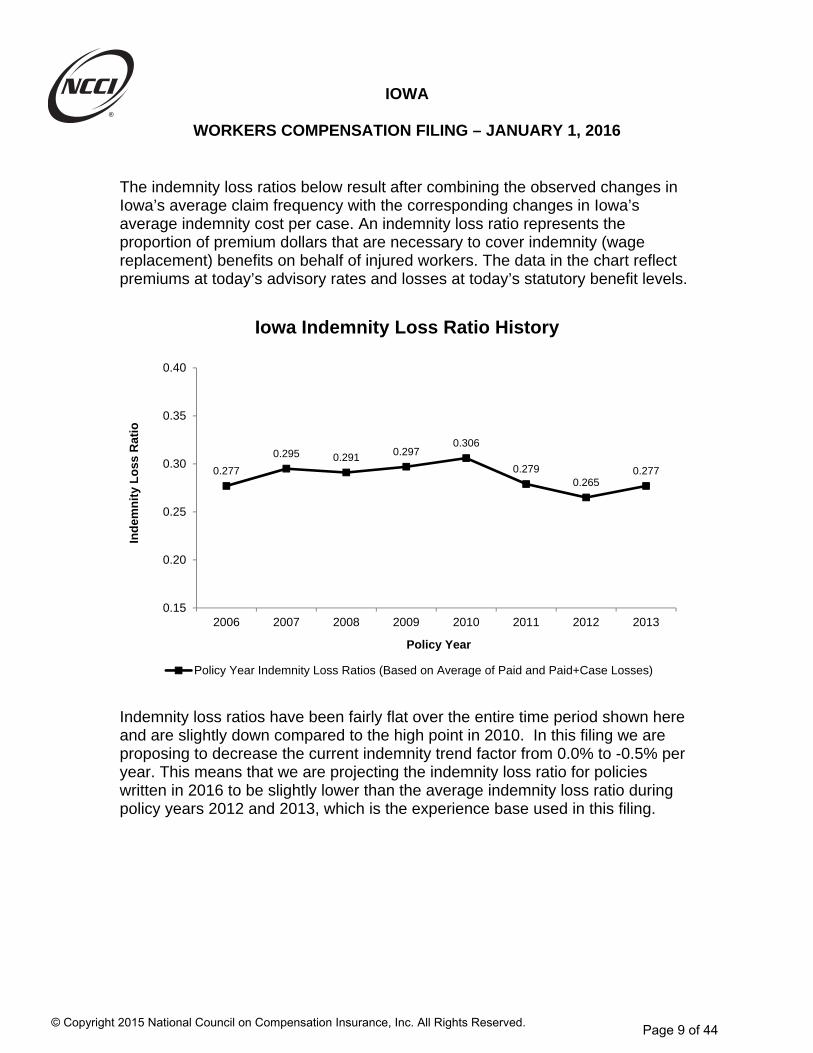
The indemnity loss ratios below result after combining the observed changes in Iowa’s average claim frequency with the corresponding changes in Iowa’s average indemnity cost per case. An indemnity loss ratio represents the proportion of premium dollars that are necessary to cover indemnity (wage replacement) benefits on behalf of injured workers. The data in the chart reflect premiums at today’s advisory rates and losses at today’s statutory benefit levels.
Indemnity loss ratios have been fairly flat over the entire time period shown here and are slightly down compared to the high point in 2010. In this filing we are proposing to decrease the current indemnity trend factor from 0.0% to -0.5% per year. This means that we are projecting the indemnity loss ratio for policies written in 2016 to be slightly lower than the average indemnity loss ratio during policy years 2012 and 2013, which is the experience base used in this filing.
0.277
0.295 0.291 0.2970.306
0.2790.265
0.277
0.15
0.20
0.25
0.30
0.35
0.40
2006 2007 2008 2009 2010 2011 2012 2013
Ind
emn
ity
Lo
ss R
atio
Policy Year
Iowa Indemnity Loss Ratio History
Policy Year Indemnity Loss Ratios (Based on Average of Paid and Paid+Case Losses)
© Copyright 2015 National Council on Compensation Insurance, Inc. All Rights Reserved.
Page 9 of 44

IOWA
WORKERS COMPENSATION FILING – JANUARY 1, 2016
Iowa’s average medical cost over time (claim severity) is tracked in the following chart. The data in the chart reflect losses at today’s statutory benefit levels.
This chart shows that Iowa’s average medical severity has increased significantly since policy year 2006.
21,092
22,862
25,072
28,352 28,097 28,598
30,813
32,232
15,000
20,000
25,000
30,000
35,000
2006 2007 2008 2009 2010 2011 2012 2013
Ave
rag
e C
ost
Per
Cas
e
Policy Year
Iowa Medical Cost Per Case
Policy Year Medical Cost Per Case (Based on Average of Paid and Paid+Case Losses)
© Copyright 2015 National Council on Compensation Insurance, Inc. All Rights Reserved.
Page 10 of 44

IOWA
WORKERS COMPENSATION FILING – JANUARY 1, 2016
After removing the impact of the growth in workers’ wages that occurred over this time period, the average medical cost per case in excess of wage growth is shown in the following chart.
Even after adjusting for changes in wages, average medical costs in Iowa still show significant increases over time. Considering the fact that 57% of the state’s benefits are medical, claims cost changes in this area can notably impact the workers compensation system. (Note: Unlike indemnity benefits, the level of workers compensation medical benefits is not directly based on average weekly wages. Even so, it is still instructive to review the changes in medical average cost per case in excess of wage growth—as this allows one to combine the change in the wage-adjusted medical average cost per case by the similarly-adjusted change in claim frequency in order to approximate the change over time in the overall medical loss ratios.)
25,05826,223
28,281
31,58530,372
29,999
31,49132,232
15,000
20,000
25,000
30,000
35,000
2006 2007 2008 2009 2010 2011 2012 2013
Ave
rag
e C
ost
Per
Cas
e
Policy Year
Iowa Medical Cost Per CaseAdjusted to Current Wage Level
Policy Year Medical Cost Per Case (Based on Average of Paid and Paid+Case Losses)
© Copyright 2015 National Council on Compensation Insurance, Inc. All Rights Reserved.
Page 11 of 44

IOWA
WORKERS COMPENSATION FILING – JANUARY 1, 2016
The medical loss ratios below result after combining the observed changes in Iowa’s average claim frequency with the corresponding changes in the average medical cost per case. A medical loss ratio represents the proportion of premium dollars that are necessary to cover medical benefits on behalf of injured workers. The data in the chart reflect premiums at today’s advisory rates and losses at today’s statutory benefit levels.
Based on our analysis of changes in medical costs and medical loss ratios over extended periods of time, we are proposing to decrease the current medical trend factor from +2.0% to +1.5% per year. This means that we are projecting the medical loss ratio for policies written in 2016 to deteriorate by 1.5% per year from the average medical loss ratio during policy years 2012 and 2013, which is the experience base used in this filing.
0.318
0.3350.344
0.3700.362
0.3310.338
0.345
0.20
0.25
0.30
0.35
0.40
0.45
2006 2007 2008 2009 2010 2011 2012 2013
Med
ical
Lo
ss R
atio
Policy Year
Iowa Medical Loss Ratio History
Policy Year Medical Loss Ratios (Based on Average of Paid and Paid+Case Losses)
© Copyright 2015 National Council on Compensation Insurance, Inc. All Rights Reserved.
Page 12 of 44

IOWA
WORKERS COMPENSATION FILING – JANUARY 1, 2016
Key Components (Continued) Experience and Trend Summary After adjusting the policy year 2012 and 2013 experience base for trend, we are projecting a 0.8% increase is necessary to bring premiums in line with total indemnity and medical losses at today’s statutory benefit levels. Benefits Workers injured in Iowa receive wage replacement (indemnity) benefits at a rate of 80% of their pre-injury weekly wage. These benefits are subject to a weekly minimum and maximum. Each July 1, the minimum and maximum weekly benefits are updated based on Iowa’s most recent state average weekly wage. The latest increase in Iowa’s state average weekly wage is estimated to increase the total indemnity costs by 0.1% and overall system costs by 0.0%.
© Copyright 2015 National Council on Compensation Insurance, Inc. All Rights Reserved.
Page 13 of 44

IOWA
WORKERS COMPENSATION FILING – JANUARY 1, 2016
Key Components (Continued) Expenses Production and General Expenses & Offset for the Change in Expense Constant The proposed rates include a provision for production and general expenses. Premium to fund these expenses is also collected through the application of an expense constant. The latest data from the Insurance Expense Exhibit (which is reported annually by insurers to state insurance departments) is used to derive the Iowa expense provisions. This filing proposes an increase in the production expense provision from 17.5% to 17.8%, an increase in the general expense provision from 5.2% to 5.5%, and a reduction in the expense constant from $260 to $160. The change in the expense constant is the result of a recent study. A 0.3% increase results from the use of the updated expense data and reflects changes in these expenses over time. An additional 0.6% increase in rates is needed to implement the reduction in the expense constant in a revenue neutral manner. Premium Taxes and Assessments The current provision in the rates for taxes and assessments is 2.2% of premium. In this filing, NCCI is proposing no change to the currently approved provision. Loss-based Expenses The proposed advisory rates include a provision for loss adjustment expenses (LAE). LAE is included in the advisory rates by using a ratio of loss adjustment expense dollars to loss dollars (called the LAE provision). After examining LAE indications based on both Iowa-specific data and countrywide data, NCCI is proposing to reduce the currently approved overall LAE provision from 15.4% to 15.1% of losses. Loss adjustment expenses in Iowa are notably lower than the countrywide average. The overall rate change due to the proposed LAE provision is a decrease of 0.3%.
© Copyright 2015 National Council on Compensation Insurance, Inc. All Rights Reserved.
Page 14 of 44

IOWA
WORKERS COMPENSATION FILING – JANUARY 1, 2016
Key Components (Continued) Profit and Contingencies Provision By law, Iowa’s rates must be determined such that Iowa’s workers compensation insurers can be expected to earn a return that is adequate, fair, and not excessive. Analysis and determination of a profit and contingencies provision is necessary to ensure this premise is maintained. This filing proposes an increase in the currently approved 2.5% profit and contingencies provision to 3.5% based upon the results from NCCI’s latest internal rate of return model. The overall rate change due to the proposed profit and contingencies provision is an increase of 1.4%. Minimum Premium Program Parameters This filing proposes an increase in the maximum minimum premium from $800 to $900 for the majority of classes. Exceptions to this are the Farming classifications, which will remain at $450, and the Agriculture classifications, which will remain at $600. In order to implement this in a revenue neutral fashion, the proposed rates have been reduced by 0.1% to reflect the additional 0.1% premium which will be generated by this change.
© Copyright 2015 National Council on Compensation Insurance, Inc. All Rights Reserved.
Page 15 of 44

IOWA
WORKERS COMPENSATION FILING – JANUARY 1, 2016
Assigned Risk Market
As previously mentioned, an overall average increase of 2.7% to the current assigned risk rate level is also being proposed effective January 1, 2016.
A number of assigned risk programs have been instituted in Iowa. These programs help to assure that the assigned risk market is self-funding. This means that the premium collected in the assigned risk market should pay for losses generated by employers in that market. These programs also encourage employers in the assigned risk market to seek coverage in the voluntary market. They are listed below:
Assigned Risk Program Effective DateRemoval of Assigned Risk Premium Discounts 04/16/1987 Take-out Credit Program 01/01/1992Assigned Risk Adjustment Program (ARAP) 07/01/1992 Assigned Risk Differential (Increased to 1.30) 01/01/2014
The following chart provides the history of assigned risk market shares in Iowa, which have increased since 2010.
8.4%
6.2%
4.9%5.4%
4.4%
3.3%
4.1%
5.0%
6.3% 6.4%
0.0%
1.0%
2.0%
3.0%
4.0%
5.0%
6.0%
7.0%
8.0%
9.0%
10.0%
2005 2006 2007 2008 2009 2010 2011 2012 2013 2014*
Mar
ket
Sh
are
Calendar Year
Iowa Assigned Risk Market Shares
*Preliminary, Source: NCCI Residual Market Management Summary
© Copyright 2015 National Council on Compensation Insurance, Inc. All Rights Reserved. Page 16 of 44

IOWA
WORKERS COMPENSATION FILING – JANUARY 1, 2016
Conclusion
This filing document provides a high-level explanation of the proposed increase in Iowa’s current voluntary advisory prospective rate level and current assigned risk rate level by an average of 2.7%.
Here are some of the key observations:
Claim frequency flattened out in policy year 2013
Despite slightly reducing our going-forward projections for medical costs, arate increase is still needed based on the most recent medical loss ratios
NCCI is proposing a slightly higher profit and contingencies provisionbased upon the results from our latest internal rate of return model
The following pages contain additional exhibits that may be of interest, including the proposed voluntary advisory rates, assigned risk rates, and rating values by classification.
© Copyright 2015 National Council on Compensation Insurance, Inc. All Rights Reserved. Page 17 of 44

IOWA
WORKERS COMPENSATION FILING – JANUARY 1, 2016
EXHIBIT I
* Amended filing with an overall rate level increase of 3.9% for new and renewal policies with a
rating effective date of 1/1/13 and a subsequent overall workers compensation rate level increase of 3.8% for new and renewal policies with a rating effective date of 7/1/13.
The chart above shows the average approved voluntary advisory rate and assigned risk rate level changes in Iowa for the last several years.
4.7% 4.4% 3.9% 3.8%
-2.0%
-3.7%
9.1%
4.4% 3.9% 3.8%
1.9%
-3.7%
-10.0%
-5.0%
0.0%
5.0%
10.0%
15.0%
1/1/2011 1/1/2012 1/1/2013* 7/1/2013* 1/1/2014 1/1/2015
Ap
pro
ved
Ch
ang
e
Effective Date
Iowa Historical Voluntary andAssigned Risk Rate Level Changes
Voluntary Assigned Risk
© Copyright 2015 National Council on Compensation Insurance, Inc. All Rights Reserved.
Page 18 of 44

IOWA
WORKERS COMPENSATION FILING – JANUARY 1, 2016
EXHIBIT II
This exhibit illustrates Iowa calendar year written premium totals for the latest ten years.
511531
552 564536 534
598
674
725749
0
100
200
300
400
500
600
700
800
2005 2006 2007 2008 2009 2010 2011 2012 2013 2014
Wri
tten
Pre
miu
m (
$ m
illio
ns)
Calendar Year
Iowa Written Premium
Source: NAIC Annual Statement Data
© Copyright 2015 National Council on Compensation Insurance, Inc. All Rights Reserved.
Page 19 of 44

IOWA
WORKERS COMPENSATION FILING – JANUARY 1, 2016
EXHIBIT III
The five largest insurance company groups providing workers compensation insurance in Iowa in 2014 are shown in this chart.
EMC Insurance Co Group, 8.6%
Travelers Group, 7.7%
Blue Cross & Blue Shield of MI Group,
6.8%
Liberty Mutual Insurance Group,
5.5%
Nationwide Corp Group, 5.4%
All Other Carriers, 66.0%
Iowa Largest Workers Compensation WritersCalendar Year 2014
Source: NAIC Annual Statement Data
© Copyright 2015 National Council on Compensation Insurance, Inc. All Rights Reserved.
Page 20 of 44

WORKERS COMPENSATION AND EMPLOYERS LIABILITY IOWAExhibit IV Page S1
Effective January 1, 2016
CLASS MIN D CLASS MIN D CLASS MIN D CODE RATE PREM ELR RATIO CODE RATE PREM ELR RATIO CODE RATE PREM ELR RATIO
0005 5.72 600 2.72 0.33 2014 9.31 900 3.96 0.27 2709 16.26 900 6.93 0.27 0008 3.84 582 1.73 0.30 2016 4.91 700 2.45 0.34 2710 12.03 900 4.75 0.24 0016 8.40 450 3.56 0.26 2021 3.44 538 1.56 0.30 2714 7.58 900 3.73 0.34 0034 8.13 600 3.89 0.33 2039 6.19 841 3.05 0.34 2731 4.91 700 2.08 0.26 0035 4.65 600 2.29 0.34 2041 7.00 900 3.44 0.34 2735 7.59 900 3.72 0.34
0036 4.91 450 2.34 0.33 2065 4.16 618 2.00 0.33 2759 8.71 900 4.29 0.34 0037 6.05 450 2.72 0.30 2070 8.34 900 4.01 0.33 2790 2.60 446 1.27 0.34 0042 11.51 600 5.20 0.30 2081 5.86 805 2.79 0.33 2797 8.38 900 4.02 0.33 0050 10.19 900 4.89 0.33 2089 5.77 795 2.77 0.33 2799 6.99 900 3.19 0.30 0059D 0.61 – 0.11 0.23 2095 4.73 680 2.27 0.33 2802 7.17 900 3.23 0.30
0065D 0.15 – 0.03 0.26 2105 5.80 798 2.85 0.34 2812 – – 2.12 0.33 0066D 0.15 – 0.03 0.27 2110 3.86 585 1.89 0.34 2835 4.41 645 2.30 0.44 0067D 0.15 – 0.03 0.26 2111 3.64 560 1.80 0.34 2836 3.64 560 1.88 0.44 0079 5.07 600 2.14 0.26 2112 5.27 740 2.58 0.34 2841 6.35 859 3.11 0.34 0083 8.89 450 4.24 0.33 2114 4.13 614 2.04 0.34 2881 5.05 716 2.62 0.44
0106 12.09 900 4.78 0.24 2121 2.25 408 1.08 0.33 2883 4.42 646 2.12 0.33 0113 6.06 827 2.91 0.33 2130 2.80 468 1.35 0.33 2913 5.66 783 2.93 0.44 0170 4.59 665 2.20 0.33 2131 4.01 601 1.92 0.33 2915 4.68 675 2.13 0.30 0251 4.68 675 2.24 0.33 2143 3.37 531 1.65 0.34 2916 6.45 870 2.55 0.24 0400 10.20 900 4.63 0.30 2157 6.06 827 2.92 0.33 2923 3.34 527 1.64 0.34
0401 15.31 A 6.05 0.24 2172 3.25 518 1.48 0.31 2942 4.12 613 2.15 0.44 0771N 0.94 – – – 2174 5.40 754 2.66 0.34 2960 6.83 900 3.27 0.33 0908P 232.00 392 111.59 0.33 2211 13.89 900 5.90 0.26 3004 3.28 521 1.40 0.27 0913P 587.00 747 281.15 0.33 2220 3.48 543 1.67 0.33 3018 4.36 640 1.85 0.26 0917 6.63 889 3.26 0.34 2286 2.63 449 1.29 0.34 3022 6.26 849 3.09 0.34
1005 7.75 900 2.85 0.24 2288 7.01 900 3.45 0.34 3027 7.15 900 3.04 0.26 1016X 17.18 900 6.31 0.24 2300 3.41 535 1.78 0.44 3028 3.70 567 1.77 0.33 1164D 6.82 900 2.45 0.23 2302 3.18 510 1.52 0.33 3030 7.12 900 3.02 0.26 1165D 5.08 719 1.99 0.25 2305 3.48 543 1.57 0.30 3040 8.53 900 3.61 0.26 1320 2.73 460 1.08 0.25 2361 3.44 538 1.65 0.33 3041 7.93 900 3.79 0.33
1322 10.99 900 4.38 0.25 2362 2.66 453 1.27 0.33 3042 6.40 864 2.90 0.30 1430 8.50 900 3.61 0.26 2380 3.75 573 1.79 0.33 3064 7.67 900 3.66 0.33 1438 7.17 900 2.84 0.25 2386 3.09 500 1.53 0.34 3069 – – 2.35 0.33 1452 3.18 510 1.36 0.27 2388 2.71 458 1.33 0.34 3076 4.90 699 2.35 0.33 1463 30.05 900 11.90 0.24 2402 3.83 581 1.62 0.26 3081D 9.28 900 3.86 0.26
1472 7.26 900 2.86 0.24 2413 4.36 640 2.09 0.33 3082D 5.99 819 2.51 0.26 1624D 6.31 854 2.47 0.24 2416 3.35 529 1.60 0.33 3085D 9.97 900 4.19 0.27 1642 4.23 625 1.79 0.26 2417 2.40 424 1.15 0.33 3110 11.93 900 5.70 0.33 1654 8.95 900 3.81 0.27 2501 4.75 683 2.26 0.33 3111 3.66 563 1.75 0.33 1655 5.04 714 2.16 0.27 2503 1.76 354 0.87 0.34 3113 3.31 524 1.58 0.33
1699 6.02 822 2.55 0.26 2534 3.14 505 1.53 0.34 3114 5.53 768 2.65 0.33 1701 5.19 731 2.22 0.27 2570 6.03 823 2.96 0.34 3118 2.74 461 1.35 0.34 1710D 6.64 890 2.81 0.27 2585 6.03 823 2.96 0.34 3119 1.76 354 0.92 0.44 1741D 8.84 900 2.82 0.23 2586 4.36 640 2.09 0.33 3122 2.25 408 1.10 0.34 1747 4.00 600 1.71 0.27 2587 3.78 576 1.87 0.34 3126 6.52 877 3.11 0.33
1748 7.70 900 3.25 0.26 2589 4.01 601 1.92 0.33 3131 2.89 478 1.38 0.33 1803D 11.44 900 4.36 0.24 2600 4.64 670 2.29 0.34 3132 4.24 626 2.02 0.33 1852D 4.82 690 1.55 0.23 2623 10.63 900 4.79 0.30 3145 2.79 467 1.33 0.33 1853 3.63 559 1.66 0.30 2651 2.89 478 1.42 0.34 3146 4.49 654 2.15 0.33 1860 3.14 505 1.55 0.34 2660 3.55 551 1.74 0.34 3169 4.42 646 2.11 0.33
1924 3.20 512 1.57 0.34 2670 2.85 474 1.48 0.44 3175D 6.17 839 2.90 0.33 1925 6.80 900 3.05 0.30 2683 2.91 480 1.42 0.34 3179 4.23 625 2.08 0.34 2001 – – 3.71 0.33 2688 6.28 851 3.07 0.34 3180 4.09 610 2.00 0.34 2002 3.20 512 1.57 0.34 2701 21.33 900 9.04 0.26 3188 2.54 439 1.25 0.34 2003 7.70 900 3.71 0.33 2702 24.22 900 8.84 0.23 3220 2.54 439 1.22 0.33
* Refer to the Footnotes Page for additional information on this class code.
© Copyright 2015 National Council on Compensation Insurance, Inc. All Rights Reserved.
Page 21 of 44

WORKERS COMPENSATION AND EMPLOYERS LIABILITY IOWAExhibit IV Page S2
Effective January 1, 2016
CLASS MIN D CLASS MIN D CLASS MIN D CODE RATE PREM ELR RATIO CODE RATE PREM ELR RATIO CODE RATE PREM ELR RATIO
3223 6.08 829 3.14 0.44 4021 9.14 900 3.89 0.27 4568 3.35 529 1.42 0.26 3224 5.97 817 2.96 0.34 4024D 6.13 834 2.59 0.26 4581 1.62 338 0.64 0.24 3227 6.32 855 3.09 0.34 4034 11.96 900 5.08 0.26 4583 5.30 743 2.10 0.24 3240 3.80 578 1.86 0.34 4036 3.77 575 1.60 0.27 4611 2.37 421 1.16 0.34 3241 4.84 692 2.31 0.33 4038 5.21 733 2.72 0.44 4635 5.39 753 1.97 0.23
3255 3.00 490 1.56 0.44 4053 2.99 489 1.43 0.33 4653 2.94 483 1.44 0.34 3257 4.06 607 1.94 0.33 4061 5.56 772 2.74 0.34 4665 11.15 900 4.75 0.27 3270 3.83 581 1.83 0.33 4062 2.69 456 1.29 0.33 4670 14.76 900 6.22 0.26 3300 6.55 881 3.12 0.33 4101 4.12 613 1.86 0.30 4683 7.79 900 3.73 0.33 3303 5.73 790 2.81 0.34 4109 1.22 294 0.60 0.34 4686 3.72 569 1.58 0.26
3307 4.33 636 2.08 0.33 4110 1.41 315 0.68 0.33 4692 0.89 258 0.44 0.34 3315 6.84 900 3.37 0.34 4111 2.97 487 1.47 0.34 4693 2.82 470 1.35 0.33 3334 5.28 741 2.55 0.33 4112 – – 0.68 0.33 4703 5.45 760 2.62 0.33 3336 5.42 756 2.30 0.26 4113 2.54 439 1.23 0.33 4717 2.85 474 1.48 0.44 3365 10.47 900 4.45 0.26 4114 3.89 588 1.86 0.33 4720 4.47 652 2.14 0.33
3372 5.30 743 2.39 0.30 4130 4.62 668 2.21 0.33 4740 2.60 446 1.11 0.27 3373 7.65 900 3.67 0.33 4131 6.08 829 2.98 0.34 4741 3.29 522 1.58 0.33 3383 1.91 370 0.94 0.34 4133 3.98 598 1.94 0.34 4751 6.69 896 2.80 0.26 3385 1.29 302 0.63 0.34 4149 1.15 287 0.59 0.44 4771N 5.34 851 1.95 0.23 3400 4.01 601 1.82 0.30 4150 – – 0.59 0.44 4777 6.17 839 2.25 0.23
3507 7.15 900 3.42 0.33 4206 4.96 706 2.37 0.33 4825 4.76 684 2.02 0.26 3515 3.48 543 1.66 0.33 4207 4.13 614 1.75 0.26 4828 2.71 458 1.23 0.30 3548 2.43 427 1.17 0.33 4239 4.04 604 1.73 0.27 4829 1.82 360 0.72 0.24 3559 6.28 851 2.98 0.33 4240 4.04 604 1.98 0.34 4902 4.96 706 2.43 0.34 3574 2.07 388 1.02 0.34 4243 3.49 544 1.67 0.33 4923 1.65 342 0.79 0.33
3581 1.99 379 0.98 0.34 4244 3.97 597 1.89 0.33 5020 7.47 900 3.18 0.27 3612 3.63 559 1.64 0.30 4250 3.80 578 1.82 0.33 5022 11.62 900 4.61 0.25 3620 6.23 845 2.64 0.26 4251 4.24 626 2.03 0.33 5037 51.69 900 18.87 0.23 3629 3.84 582 1.88 0.34 4263 3.75 573 1.79 0.33 5040 31.71 900 11.61 0.23 3632 5.83 801 2.63 0.30 4273 3.11 502 1.49 0.33 5057 11.58 900 4.22 0.23
3634 2.86 475 1.41 0.34 4279 3.11 502 1.49 0.33 5059 27.48 900 10.01 0.23 3635 4.73 680 2.26 0.33 4282 3.20 512 1.59 0.34 5069 31.17 900 11.52 0.24 3638 3.09 500 1.52 0.34 4283 3.25 518 1.55 0.33 5102 6.85 900 2.72 0.25 3642 2.86 475 1.36 0.33 4299 3.35 529 1.65 0.34 5146 6.82 900 2.90 0.26 3643 3.28 521 1.57 0.33 4304 7.62 900 3.43 0.30 5160 5.83 801 2.34 0.25
3647 4.62 668 2.10 0.30 4307 3.17 509 1.65 0.44 5183 5.65 782 2.41 0.27 3648 2.34 417 1.15 0.34 4351 1.61 337 0.77 0.33 5188 4.77 685 2.03 0.27 3681 1.94 373 0.95 0.34 4352 2.34 417 1.15 0.34 5190 3.79 577 1.61 0.27 3685 2.40 424 1.18 0.34 4360 1.50 325 0.74 0.34 5191 1.45 320 0.70 0.33 3719 1.86 365 0.68 0.23 4361 1.41 315 0.69 0.34 5192 4.57 663 2.18 0.33
3724 7.31 900 2.89 0.24 4362 – – 0.74 0.34 5213 12.04 900 4.81 0.25 3726 6.02 822 2.21 0.24 4410 4.01 601 1.92 0.33 5215 10.07 900 4.58 0.30 3803 6.77 900 3.25 0.33 4420 7.79 900 3.12 0.25 5221 8.42 900 3.58 0.27 3807 4.52 657 2.22 0.34 4431 2.51 436 1.30 0.44 5222 17.40 900 6.91 0.25 3808 4.30 633 1.95 0.30 4432 2.33 416 1.21 0.44 5223 9.34 900 3.99 0.27
3821 9.10 900 4.12 0.30 4439 3.23 515 1.46 0.30 5348 9.67 900 4.14 0.27 3822 7.01 900 3.16 0.30 4452 5.68 785 2.71 0.33 5402 6.05 826 2.97 0.34 3824 8.08 900 3.65 0.30 4459 4.36 640 2.10 0.33 5403 16.32 900 6.45 0.24 3826 1.27 300 0.61 0.33 4470 4.10 611 1.96 0.33 5437 9.62 900 4.12 0.27 3827 3.40 534 1.54 0.30 4484 4.55 661 2.17 0.33 5443 5.76 794 2.76 0.33
3830 1.90 369 0.86 0.30 4493 4.50 655 2.15 0.33 5445 8.59 900 3.42 0.25 3851 5.53 768 2.73 0.34 4511 0.94 263 0.42 0.30 5462 12.96 900 5.51 0.26 3865 2.42 426 1.25 0.44 4557 3.57 553 1.75 0.34 5472 6.47 872 2.37 0.24 3881 9.17 900 4.38 0.33 4558 3.35 529 1.60 0.33 5473 10.88 900 3.97 0.23 4000 14.69 900 5.80 0.24 4561 – – 1.46 0.30 5474 8.16 900 3.24 0.25
* Refer to the Footnotes Page for additional information on this class code.
© Copyright 2015 National Council on Compensation Insurance, Inc. All Rights Reserved.
Page 22 of 44

WORKERS COMPENSATION AND EMPLOYERS LIABILITY IOWAExhibit IV Page S3
Effective January 1, 2016
CLASS MIN D CLASS MIN D CLASS MIN D CODE RATE PREM ELR RATIO CODE RATE PREM ELR RATIO CODE RATE PREM ELR RATIO
5478 7.02 900 2.99 0.27 6874F 25.80 900 6.66 0.20 7590 4.91 700 2.22 0.30 5479 10.45 900 4.74 0.30 6882 6.63 889 2.44 0.24 7600 4.92 701 2.09 0.26 5480 21.48 900 8.50 0.24 6884 11.72 900 4.34 0.24 7601 – – 2.09 0.26 5491 3.02 492 1.20 0.25 7016M 10.42 900 3.84 0.24 7605 2.57 443 1.09 0.26 5506 9.27 900 3.39 0.23 7024M 11.58 900 4.27 0.24 7610 0.80 248 0.36 0.30
5507 4.37 641 1.74 0.25 7038M 6.34 857 2.30 0.23 7611 – – 2.09 0.26 5508D 21.34 900 9.08 0.27 7046M 17.03 900 6.24 0.24 7612 – – 2.09 0.26 5535 8.54 900 3.62 0.26 7047M 21.49 900 7.49 0.24 7613 – – 2.09 0.26 5537 7.10 900 3.01 0.26 7050M 13.07 900 4.48 0.23 7705 8.03 900 3.64 0.30 5551 28.36 900 10.29 0.23 7090M 7.04 900 2.55 0.23 7710 49.90 900 19.71 0.24
5606 2.42 426 0.96 0.24 7098M 18.92 900 6.93 0.24 7711 49.90 900 19.71 0.24 5610 11.13 900 5.30 0.33 7099M 35.12 900 12.16 0.24 7720 4.59 665 1.95 0.26 5645 13.21 900 5.22 0.24 7133 4.95 705 1.97 0.25 7855 9.59 900 4.10 0.27 5651 – – 5.22 0.24 7151M 6.01 821 2.40 0.25 8001 2.55 441 1.25 0.34 5703 15.78 900 6.71 0.27 7152M 12.40 900 4.67 0.25 8002 2.78 466 1.33 0.33
5705 18.25 900 7.73 0.26 7153M 6.68 895 2.66 0.25 8006 3.72 569 1.78 0.33 5951 1.79 357 0.87 0.34 7222 8.62 900 3.68 0.27 8008 1.83 361 0.89 0.34 6003 9.48 900 4.05 0.27 7228 11.10 900 4.74 0.27 8010 2.41 425 1.18 0.34 6005 6.43 867 2.74 0.27 7229 10.98 900 4.37 0.25 8013 0.44 208 0.21 0.33 6017 16.45 900 6.79 0.25 7230 11.72 900 5.31 0.30 8015 1.23 295 0.59 0.33
6018 3.94 593 1.70 0.27 7231 12.97 900 5.87 0.30 8017 2.23 405 1.09 0.34 6045 4.57 663 1.96 0.27 7232 11.07 900 4.42 0.25 8018 3.62 558 1.78 0.34 6204 13.32 900 5.30 0.25 7309F 20.16 900 5.22 0.20 8021 3.52 547 1.68 0.33 6206 5.57 773 2.04 0.23 7313F 3.75 573 0.97 0.20 8031 3.08 499 1.47 0.33 6213 3.59 555 1.43 0.25 7317F 12.13 900 3.12 0.20 8032 2.75 463 1.35 0.34
6214 4.62 668 1.69 0.23 7327F 29.70 900 7.73 0.20 8033 1.81 359 0.86 0.33 6216 9.51 900 3.49 0.24 7333M 18.70 900 6.99 0.24 8037 2.23 405 1.09 0.34 6217 7.94 900 3.14 0.24 7335M 20.78 900 7.77 0.24 8039 1.88 367 0.92 0.34 6229 6.73 900 2.65 0.24 7337M 38.57 900 13.64 0.24 8044 3.75 573 1.70 0.30 6233 3.71 568 1.48 0.25 7350F 14.44 900 3.98 0.23 8045 0.61 227 0.30 0.34
6235 10.38 900 3.80 0.24 7360 7.56 900 3.22 0.27 8046 3.71 568 1.77 0.33 6236 16.95 900 7.21 0.27 7370 6.72 899 3.21 0.33 8047 1.43 317 0.70 0.34 6237 2.68 455 1.14 0.27 7380 6.30 853 2.85 0.30 8058 3.95 595 1.88 0.33 6251D 9.46 900 3.78 0.25 7382 5.71 788 2.72 0.33 8072 0.98 268 0.48 0.34 6252D 5.59 775 2.02 0.23 7390 6.53 878 3.13 0.33 8102 2.50 435 1.23 0.34
6260D 8.41 900 3.08 0.24 7394M 5.79 797 2.12 0.24 8103 3.60 556 1.62 0.30 6306 6.70 897 2.67 0.25 7395M 6.43 867 2.36 0.24 8105 3.58 554 1.76 0.34 6319 4.53 658 1.80 0.25 7398M 11.93 900 4.14 0.24 8106 7.19 900 3.05 0.26 6325 8.79 900 3.49 0.25 7402 0.34 197 0.16 0.33 8107 4.88 697 2.07 0.26 6400 8.67 900 3.93 0.30 7403 5.27 740 2.23 0.26 8111 3.32 525 1.59 0.33
6503 2.11 392 1.04 0.34 7405N 1.40 397 0.60 0.27 8116 3.54 549 1.69 0.33 6504 3.26 519 1.61 0.34 7420 9.39 900 3.48 0.24 8203 9.46 900 4.53 0.33 6702M* 11.65 900 4.98 0.27 7421 1.48 323 0.59 0.24 8204 5.44 758 2.30 0.26 6703M* 24.03 900 9.71 0.27 7422 2.42 426 0.89 0.24 8209 11.33 900 5.44 0.33 6704M* 12.95 900 5.53 0.27 7425 4.94 703 1.82 0.24 8215 4.39 643 1.87 0.26
6801F 6.41 865 1.86 0.25 7431N 1.13 351 0.42 0.24 8227 7.04 900 2.58 0.24 6811 8.18 900 3.49 0.27 7445N 0.75 – – – 8232 8.13 900 3.45 0.26 6824F 11.72 900 3.27 0.22 7453N 0.61 – – – 8233 3.75 573 1.61 0.27 6826F 12.97 900 3.63 0.25 7502 3.97 597 1.68 0.26 8235 5.21 733 2.50 0.33 6834 10.98 900 4.94 0.30 7515 1.48 323 0.54 0.23 8263 10.34 900 4.63 0.30
6836 7.56 900 3.21 0.26 7520 5.38 752 2.58 0.33 8264 8.83 900 3.73 0.26 6843F 22.30 900 5.82 0.20 7538 6.87 900 2.52 0.24 8265 9.49 900 3.74 0.24 6845F 11.54 900 2.97 0.20 7539 4.29 632 1.70 0.25 8279 9.53 900 3.76 0.24 6854 5.71 788 2.08 0.23 7540 5.47 762 1.98 0.23 8288 10.66 900 4.47 0.26 6872F 11.21 900 2.90 0.20 7580 3.13 504 1.33 0.26 8291 6.58 884 2.97 0.30
* Refer to the Footnotes Page for additional information on this class code.
© Copyright 2015 National Council on Compensation Insurance, Inc. All Rights Reserved.
Page 23 of 44

WORKERS COMPENSATION AND EMPLOYERS LIABILITY IOWAExhibit IV Page S4
Effective January 1, 2016
CLASS MIN D CLASS MIN D CLASS MIN D CODE RATE PREM ELR RATIO CODE RATE PREM ELR RATIO CODE RATE PREM ELR RATIO
8292 4.98 708 2.39 0.33 9016 4.72 679 2.24 0.33 8293 14.82 900 6.31 0.27 9019 2.93 482 1.24 0.26 8304 6.79 900 2.88 0.26 9033 3.37 531 1.60 0.33 8350 7.88 900 3.12 0.25 9040 4.87 696 2.38 0.34 8380 3.99 599 1.81 0.30 9044 2.15 397 1.06 0.34
8381 3.62 558 1.64 0.30 9052 3.40 534 1.67 0.34 8385 3.00 490 1.27 0.26 9058 2.40 424 1.24 0.44 8392 2.78 466 1.33 0.33 9059 – – 0.73 0.34 8393 2.90 479 1.39 0.33 9060 1.84 362 0.90 0.34 8500 6.33 856 2.68 0.26 9061 2.01 381 1.04 0.44
8601 0.77 245 0.35 0.30 9062 1.68 345 0.87 0.44 8602 1.88 367 0.85 0.30 9063 1.43 317 0.70 0.34 8603 0.14 175 0.06 0.33 9077F 5.16 728 1.63 0.32 8606 3.91 590 1.55 0.25 9082 1.84 362 0.95 0.44 8709F 7.62 900 1.97 0.20 9083 1.85 364 0.96 0.44
8719 6.44 868 2.33 0.23 9084 2.34 417 1.11 0.33 8720 2.75 463 1.16 0.26 9088a a a a a 8721 0.47 212 0.20 0.26 9089 1.95 375 0.95 0.34 8723 0.27 190 0.13 0.33 9093 2.40 424 1.17 0.34 8725 3.21 513 1.36 0.26 9101 7.68 900 3.77 0.34
8726F 4.33 636 1.26 0.24 9102 5.63 779 2.68 0.33 8734M 0.80 248 0.34 0.26 9154 1.98 378 0.94 0.33 8737M 0.72 239 0.31 0.26 9156 2.86 475 1.29 0.30 8738M 1.48 323 0.59 0.26 9170 12.54 900 4.56 0.23 8742 0.59 225 0.25 0.26 9178 5.54 769 2.85 0.44
8745 6.85 900 3.09 0.30 9179 23.99 900 11.68 0.34 8748 0.93 262 0.42 0.30 9180 7.31 900 3.07 0.26 8755 0.71 238 0.30 0.26 9182 3.20 512 1.52 0.33 8799 0.74 241 0.35 0.33 9186 13.86 900 5.45 0.24 8800 2.50 435 1.30 0.44 9220 6.59 885 2.98 0.30
8803 0.12 173 0.05 0.26 9402 5.78 796 2.46 0.27 8805M 0.42 206 0.20 0.33 9403 9.47 900 3.75 0.24 8810 0.31 194 0.15 0.33 9410 3.30 523 1.58 0.33 8814M 0.38 202 0.18 0.33 9501 5.66 783 2.56 0.30 8815M 0.78 246 0.36 0.33 9505 5.96 816 2.69 0.30
8820 0.30 193 0.13 0.30 9516 11.14 900 4.73 0.26 8824 4.12 613 2.02 0.34 9519 5.56 772 2.36 0.26 8825 2.21 403 1.15 0.44 9521 6.38 862 2.71 0.26 8826 4.37 641 2.08 0.33 9522 6.05 826 2.90 0.33 8829 4.09 610 1.96 0.33 9534 7.08 900 2.83 0.25
8831 1.94 373 0.92 0.33 9554 15.32 900 6.10 0.25 8832 0.46 211 0.22 0.33 9586 0.88 257 0.46 0.44 8833 1.29 302 0.62 0.33 9600 4.13 614 2.03 0.34 8835 3.34 527 1.60 0.33 9620 1.48 323 0.67 0.30 8842 3.00 490 1.42 0.33
8855 0.27 190 0.13 0.33 8856 0.38 202 0.18 0.33 8864 2.38 422 1.13 0.33 8868 0.56 222 0.28 0.34 8869 1.50 325 0.73 0.34
8871 0.16 178 0.08 0.34 8901 0.53 218 0.24 0.30 9012 2.83 471 1.28 0.30 9014 5.36 750 2.56 0.33 9015 5.44 758 2.59 0.33
* Refer to the Footnotes Page for additional information on this class code.
© Copyright 2015 National Council on Compensation Insurance, Inc. All Rights Reserved.
Page 24 of 44

WORKERS COMPENSATION AND EMPLOYERS LIABILITY IOWAExhibit IV
Page S5Effective January 1, 2016
FOOTNOTES
a Rate for each individual risk must be obtained from NCCI Customer Service or the Rating Organizationhaving jurisdiction.
A Minimum Premium $100 per ginning location for policy minimum premium computation.
D Rate for classification already includes the specific disease loading shown in the table below. See Basic Manual Rule 3-A-7.
Code No.Disease Loading Symbol Code No.
Disease Loading Symbol Code No.
Disease Loading Symbol
0059D 0.61 S 1710D 0.09 S 3175D 0.09 S0065D 0.15 S 1741D 1.11 S 4024D 0.04 S0066D 0.15 S 1803D 0.45 S 5508D 0.13 S0067D 0.15 S 1852D 0.56 Asb 6251D 0.07 S1164D 0.12 S 3081D 0.16 S 6252D 0.05 S1165D 0.07 S 3082D 0.07 S 6260D 0.08 S1624D 0.07 S 3085D 0.16 SAsb=Asbestos, S=Silica
F Rate provides for coverage under the United States Longshore and Harbor Workers Compensation Act and itsextensions. Rate includes a provision for USL&HW Assessment.
M Risks are subject to Admiralty Law or Federal Employers Liability Act (FELA). However, the published rate is for risks that voluntarily purchase standard workers compensation and employers liability coverage. A provision for the USL&HW Assessment is included for those classifications under Program II USL Act.
N This code is part of a ratable / non-ratable group shown below. The statistical non-ratable code and correspondingrate are applied in addition to the basic classification when determining premium.
Class Code
477174057431
P Classification is computed on a per capita basis.
X Refer to special classification phraseology in these pages which is applicable in this state.
* Class Codes with Specific Footnotes
6702 Rate and rating values only appropriate for laying or relaying of tracks or maintenance of way - no work on elevated railroads. Otherwise, assign appropriate construction or erection code rate and elr each x 1.215.
6703 Rate and rating values only appropriate for laying or relaying of tracks or maintenance of way - no work on elevated railroads. Otherwise, assign appropriate construction or erection class rate x 2.506 and elr x 2.369.
6704 Rate and rating values only appropriate for laying or relaying of tracks or maintenance of way - no work onelevated railroads. Otherwise, assign appropriate construction or erection class rate and elr each x 1.35.
74457453
Non-RatableElement Code
0771
© Copyright 2015 National Council on Compensation Insurance, Inc. All Rights Reserved.
Page 25 of 44

WORKERS COMPENSATION AND EMPLOYERS LIABILITY IOWAExhibit IV
Page S6Effective January 1, 2016
MISCELLANEOUS VALUES
Basis of premium applicable in accordance with Basic Manual footnote instructions for Code 7370 --"Taxicab Co.":
Employee operated vehicle…………………………………………………………………………………… $63,500Leased or rented vehicle……………………………………………………………………………………… $42,300
Catastrophe (other than Certified Acts of Terrorism) - (Voluntary) ………………..…..…………………………… 0.01
Expense Constant applicable in accordance with Basic Manual Rule 3-A-11……………………………………… $160
Maximum Weekly Payroll applicable in accordance with Basic Manual Rule 2-E -- "Executive Officers"including members of limited liability companies, Rule 2-E-3 for Partners and Sole Proprietors, and Basic Manual footnote instructions for Code 9178 -- "Athletic Sports or Park: Non-Contact Sports",and Code 9179 -- "Athletic Sports or Park: Contact Sports" …………………………………………….…….............. $3,300
Minimum Weekly Payroll applicable in accordance with Basic Manual Rule 2-E -- "Executive Officers"and members of limited liability companies and Rule 2-E-3 for Partners and Sole Proprietors ……………………… $400
Premium Discount Percentages - (See Basic Manual Rule 3-A-19-a.) The following premium discounts are applicable to Standard Premiums:
Type A Type BFirst $10,000 - -Next 190,000 9.1% 5.1%Next 1,550,000 11.3% 6.5%Over 1,750,000 12.3% 7.5%
Terrorism (Voluntary) ……..………….………………………………………….…………….…………………………… 0.02
United States Longshore and Harbor Workers' Compensation Coverage Percentageapplicable only in connection with Basic Manual Rule 3-A-4……………...…..….…......…….………...……………
Experience Rating EligibilityA risk is eligible for intrastate experience rating when the payrolls or other exposures developed in the last year or last two years of the experience period produced a premium of at least $7,500. If more than two years, an average annual premium of at least $3,750 is required. The Experience Rating Plan Manual should be referenced for the latest approved eligibility amounts by state.
(Multiply a Non-F classification rate by a factor of 2.01 to adjust for differences in benefits and loss-based expenses. This factor is the product of the adjustment for differences in benefits (1.89) and the adjustment for differences in loss-based expenses (1.061).)
101%
© Copyright 2015 National Council on Compensation Insurance, Inc. All Rights Reserved.
Page 26 of 44

EXPERIENCE RATING PLAN MANUAL IOWAExhibit IV
Effective January 1, 2016 TABLE OF WEIGHTING VALUESAPPLICABLE TO ALL POLICIESExperience Rating Program - ERA
Expected Weighting Expected WeightingLosses Values Losses Values
0 -- 2,219 0.04 1,251,744 -- 1,320,789 0.442,220 -- 8,973 0.05 1,320,790 -- 1,393,832 0.458,974 -- 15,871 0.06 1,393,833 -- 1,471,231 0.46
15,872 -- 22,918 0.07 1,471,232 -- 1,553,388 0.4722,919 -- 30,120 0.08 1,553,389 -- 1,640,757 0.48
30,121 -- 50,378 0.09 1,640,758 -- 1,733,851 0.4950,379 -- 74,990 0.10 1,733,852 -- 1,833,251 0.5074,991 -- 96,882 0.11 1,833,252 -- 1,939,623 0.5196,883 -- 118,197 0.12 1,939,624 -- 2,053,727 0.52
118,198 -- 139,516 0.13 2,053,728 -- 2,176,439 0.53
139,517 -- 161,097 0.14 2,176,440 -- 2,308,771 0.54161,098 -- 183,087 0.15 2,308,772 -- 2,451,902 0.55183,088 -- 205,585 0.16 2,451,903 -- 2,607,211 0.56205,586 -- 228,665 0.17 2,607,212 -- 2,776,321 0.57228,666 -- 252,390 0.18 2,776,322 -- 2,961,159 0.58
252,391 -- 276,817 0.19 2,961,160 -- 3,164,026 0.59276,818 -- 301,997 0.20 3,164,027 -- 3,387,697 0.60301,998 -- 327,983 0.21 3,387,698 -- 3,635,544 0.61327,984 -- 354,827 0.22 3,635,545 -- 3,911,713 0.62354,828 -- 382,582 0.23 3,911,714 -- 4,221,354 0.63
382,583 -- 411,304 0.24 4,221,355 -- 4,570,945 0.64411,305 -- 441,052 0.25 4,570,946 -- 4,968,751 0.65441,053 -- 471,886 0.26 4,968,752 -- 5,425,489 0.66471,887 -- 503,872 0.27 5,425,490 -- 5,955,300 0.67503,873 -- 537,082 0.28 5,955,301 -- 6,577,248 0.68
537,083 -- 571,588 0.29 6,577,249 -- 7,317,658 0.69571,589 -- 607,474 0.30 7,317,659 -- 8,213,940 0.70607,475 -- 644,825 0.31 8,213,941 -- 9,321,107 0.71644,826 -- 683,736 0.32 9,321,108 -- 10,723,513 0.72683,737 -- 724,308 0.33 10,723,514 -- 12,557,423 0.73
724,309 -- 766,654 0.34 12,557,424 -- 15,058,203 0.74766,655 -- 810,892 0.35 15,058,204 -- 18,670,434 0.75810,893 -- 857,155 0.36 18,670,435 -- 24,346,787 0.76857,156 -- 905,587 0.37 24,346,788 -- 34,564,210 0.77905,588 -- 956,345 0.38 34,564,211 -- 58,404,845 0.78
956,346 -- 1,009,602 0.39 58,404,846 -- 177,607,962 0.791,009,603 -- 1,065,549 0.40 177,607,963 AND OVER 0.801,065,550 -- 1,124,395 0.411,124,396 -- 1,186,374 0.421,186,375 -- 1,251,743 0.43
(a) G . . . . . . . . . . . . . . . . . . . . . . . . . . . . . . . . . . . . . . . . . . . . . . . . . . . . . . . . . . . . . . . . . . . 10.60 (b) State Per Claim Accident Limitation . . . . . . . . . . . . . . . . . . . . . . . . . . . . . . . . . . . . . . . . $264,500(c) State Multiple Claim Accident Limitation . . . . . . . . . . . . . . . . . . . . . . . . . . . . . . . . . . . . . . . . $529,000(d) USL&HW Per Claim Accident Limitation . . . . . . . . . . . . . . . . . . . . . . . . . . . . . . . . . . . . . . . . $469,500(e) USL&HW Multiple Claim Accident Limitation . . . . . . . . . . . . . . . . . . . . . . . . . . . . . . . . . . . . . $939,000(f) Employers Liability Accident Limitation . . . . . . . . . . . . . . . . . . . . . . . . . . . . . . . . . . . . . . . . $55,000(g) Primary/Excess Loss Split Point . . . . . . . . . . . . . . . . . . . . . . . . . . . . . . . . . . . . . . . . . . . . . . $16,000(h) USL&HW Act -- Expected Loss Factor -- Non-F Classes . . . . . . . . . . . . . . . . . . . . . . . . . . . . 1.89(Multiply a Non-F classification ELR by the USL&HW Act - Expected Loss Factor of 1.89.)
© Copyright 2015 National Council on Compensation Insurance, Inc. All Rights Reserved. 7/15
Page 27 of 44

EXPERIENCE RATING PLAN MANUAL IOWAExhibit IV
Effective January 1, 2016 TABLE OF BALLAST VALUES
APPLICABLE TO ALL POLICIESExperience Rating Plan - ERA
Expected Ballast Expected Ballast Expected BallastLosses Values Losses Values Losses Values
0 -- 57,015 26,500 1,829,571 -- 1,882,540 212,000 3,684,033 -- 3,737,025 397,50057,016 -- 98,129 31,800 1,882,541 -- 1,935,512 217,300 3,737,026 -- 3,790,017 402,80098,130 -- 145,369 37,100 1,935,513 -- 1,988,485 222,600 3,790,018 -- 3,843,010 408,100
145,370 -- 195,204 42,400 1,988,486 -- 2,041,459 227,900 3,843,011 -- 3,896,003 413,400195,205 -- 246,251 47,700 2,041,460 -- 2,094,435 233,200 3,896,004 -- 3,948,996 418,700
246,252 -- 297,939 53,000 2,094,436 -- 2,147,412 238,500 3,948,997 -- 4,001,990 424,000297,940 -- 350,001 58,300 2,147,413 -- 2,200,390 243,800 4,001,991 -- 4,054,984 429,300350,002 -- 402,299 63,600 2,200,391 -- 2,253,369 249,100 4,054,985 -- 4,107,977 434,600402,300 -- 454,754 68,900 2,253,370 -- 2,306,349 254,400 4,107,978 -- 4,160,971 439,900454,755 -- 507,319 74,200 2,306,350 -- 2,359,330 259,700 4,160,972 -- 4,213,965 445,200
507,320 -- 559,965 79,500 2,359,331 -- 2,412,312 265,000 4,213,966 -- 4,266,960 450,500559,966 -- 612,670 84,800 2,412,313 -- 2,465,295 270,300 4,266,961 -- 4,319,954 455,800612,671 -- 665,422 90,100 2,465,296 -- 2,518,278 275,600 4,319,955 -- 4,372,948 461,100665,423 -- 718,209 95,400 2,518,279 -- 2,571,262 280,900 4,372,949 -- 4,425,943 466,400718,210 -- 771,025 100,700 2,571,263 -- 2,624,247 286,200 4,425,944 -- 4,478,938 471,700
771,026 -- 823,865 106,000 2,624,248 -- 2,677,232 291,500 4,478,939 -- 4,531,933 477,000823,866 -- 876,723 111,300 2,677,233 -- 2,730,218 296,800 4,531,934 -- 4,584,928 482,300876,724 -- 929,598 116,600 2,730,219 -- 2,783,204 302,100 4,584,929 -- 4,637,923 487,600929,599 -- 982,486 121,900 2,783,205 -- 2,836,191 307,400 4,637,924 -- 4,690,918 492,900982,487 -- 1,035,385 127,200 2,836,192 -- 2,889,178 312,700 4,690,919 -- 4,743,913 498,200
1,035,386 -- 1,088,294 132,500 2,889,179 -- 2,942,166 318,000 4,743,914 -- 4,796,909 503,5001,088,295 -- 1,141,211 137,800 2,942,167 -- 2,995,154 323,300 4,796,910 -- 4,849,904 508,8001,141,212 -- 1,194,136 143,100 2,995,155 -- 3,048,143 328,600 4,849,905 -- 4,902,900 514,1001,194,137 -- 1,247,067 148,400 3,048,144 -- 3,101,132 333,900 4,902,901 -- 4,955,896 519,4001,247,068 -- 1,300,003 153,700 3,101,133 -- 3,154,121 339,200 4,955,897 -- 5,008,891 524,700
1,300,004 -- 1,352,945 159,000 3,154,122 -- 3,207,111 344,500 5,008,892 -- 5,061,500 530,0001,352,946 -- 1,405,891 164,300 3,207,112 -- 3,260,101 349,8001,405,892 -- 1,458,841 169,600 3,260,102 -- 3,313,092 355,1001,458,842 -- 1,511,794 174,900 3,313,093 -- 3,366,082 360,4001,511,795 -- 1,564,750 180,200 3,366,083 -- 3,419,073 365,700
1,564,751 -- 1,617,709 185,500 3,419,074 -- 3,472,065 371,0001,617,710 -- 1,670,671 190,800 3,472,066 -- 3,525,056 376,3001,670,672 -- 1,723,635 196,100 3,525,057 -- 3,578,048 381,6001,723,636 -- 1,776,602 201,400 3,578,049 -- 3,631,040 386,9001,776,603 -- 1,829,570 206,700 3,631,041 -- 3,684,032 392,200
For Expected Losses greater than $5,061,500, the Ballast Value can be calculated using the following formula (rounded to the nearest 1):
Ballast = (0.10)(Expected Losses) + 2500(Expected Losses)(10.60) / (Expected Losses + (700)(10.60))
G = 10.60
© Copyright 2015 National Council on Compensation Insurance, Inc. All Rights Reserved. 7/15
Page 28 of 44

RETROSPECTIVE RATING PLAN MANUAL IOWASTATE SPECIAL RATING VALUES RR 1
Effective January 1, 2016 Exhibit IV
1. Hazard Group Differentials 2. Tax Multipliers A B C D E F G a. State (non-F Classes) 1.022 1.25 1.00 0.93 0.78 0.66 0.55 0.47 b. Federal Classes, or non-F classes
where rate is increased by the USL&HW Act Percentage 1.063
Expected Loss and3. Expected Loss Ratio Allocated Expense Ratio 4. Table of Expense Ratios
0.585 0.660 Type A: 2015-01Type B: 2015-01
5. 2013 Table of Expected Loss RangesEffective January 1, 2013
6. Excess Loss Factors (Applicable to New and Renewal Policies)
Per Accident Hazard GroupsLimitation A B C D E F G
$10,000 0.459 0.491 0.501 0.525 0.540 0.557 0.561$15,000 0.427 0.463 0.473 0.501 0.518 0.538 0.544$20,000 0.402 0.439 0.451 0.480 0.499 0.521 0.530$25,000 0.380 0.419 0.431 0.462 0.483 0.506 0.516$30,000 0.362 0.401 0.414 0.445 0.468 0.492 0.504$35,000 0.345 0.385 0.398 0.431 0.454 0.480 0.493$40,000 0.330 0.371 0.384 0.417 0.441 0.468 0.482$50,000 0.305 0.346 0.360 0.393 0.419 0.447 0.463$75,000 0.258 0.298 0.313 0.347 0.374 0.404 0.424
$100,000 0.225 0.264 0.279 0.312 0.340 0.371 0.393$125,000 0.200 0.238 0.253 0.285 0.313 0.344 0.368$150,000 0.181 0.217 0.232 0.263 0.291 0.322 0.347$175,000 0.166 0.200 0.214 0.245 0.273 0.303 0.329$200,000 0.153 0.186 0.200 0.229 0.257 0.286 0.314$225,000 0.142 0.173 0.188 0.216 0.243 0.272 0.300$250,000 0.132 0.163 0.177 0.204 0.231 0.259 0.288$275,000 0.124 0.154 0.167 0.194 0.221 0.248 0.277$300,000 0.117 0.146 0.159 0.185 0.211 0.238 0.267$325,000 0.111 0.138 0.152 0.177 0.202 0.229 0.257$350,000 0.105 0.132 0.145 0.169 0.195 0.220 0.249$375,000 0.100 0.126 0.139 0.162 0.187 0.213 0.241$400,000 0.095 0.121 0.133 0.156 0.181 0.205 0.234$425,000 0.091 0.116 0.128 0.151 0.175 0.199 0.228$450,000 0.087 0.111 0.123 0.145 0.169 0.193 0.221$475,000 0.084 0.107 0.119 0.140 0.164 0.187 0.216$500,000 0.080 0.103 0.115 0.136 0.159 0.182 0.210$600,000 0.069 0.090 0.102 0.121 0.142 0.163 0.192$700,000 0.061 0.080 0.091 0.108 0.129 0.149 0.176$800,000 0.054 0.072 0.082 0.099 0.119 0.137 0.164$900,000 0.049 0.066 0.075 0.090 0.110 0.127 0.153
$1,000,000 0.044 0.060 0.069 0.084 0.102 0.118 0.144$2,000,000 0.022 0.032 0.038 0.047 0.060 0.071 0.092$3,000,000 0.014 0.021 0.026 0.032 0.042 0.051 0.068$4,000,000 0.010 0.015 0.019 0.024 0.032 0.039 0.054$5,000,000 0.007 0.012 0.015 0.019 0.026 0.031 0.044$6,000,000 0.006 0.009 0.012 0.015 0.021 0.026 0.038$7,000,000 0.005 0.008 0.010 0.012 0.018 0.022 0.032$8,000,000 0.004 0.006 0.008 0.010 0.015 0.019 0.028$9,000,000 0.003 0.005 0.007 0.009 0.013 0.016 0.025
$10,000,000 0.003 0.004 0.006 0.008 0.011 0.014 0.022
© Copyright 2015 National Council on Compensation Insurance, Inc. All Rights Reserved.
Page 29 of 44
RETROSPECTIVE RATING PLAN MANUAL IOWASTATE SPECIAL RATING VALUES RR 2
Effective January 1, 2016 Exhibit IV
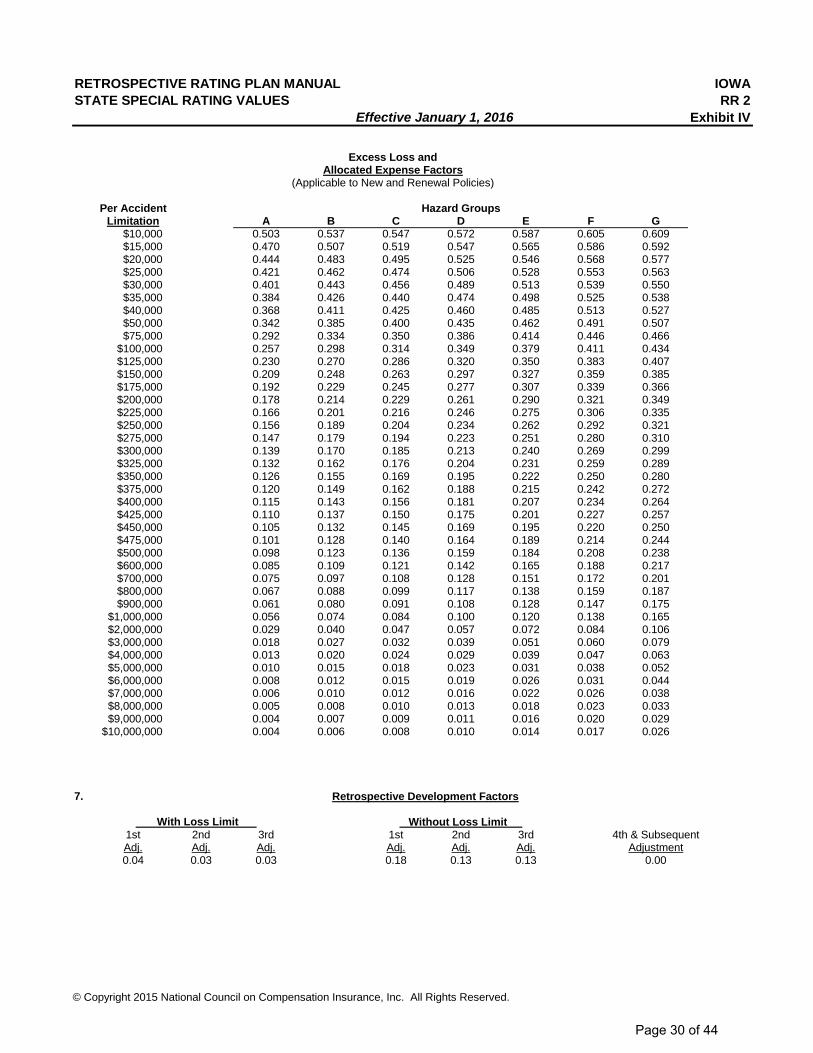
Excess Loss andAllocated Expense Factors
(Applicable to New and Renewal Policies)
Per Accident Hazard GroupsLimitation A B C D E F G
$10,000 0.503 0.537 0.547 0.572 0.587 0.605 0.609$15,000 0.470 0.507 0.519 0.547 0.565 0.586 0.592$20,000 0.444 0.483 0.495 0.525 0.546 0.568 0.577$25,000 0.421 0.462 0.474 0.506 0.528 0.553 0.563$30,000 0.401 0.443 0.456 0.489 0.513 0.539 0.550$35,000 0.384 0.426 0.440 0.474 0.498 0.525 0.538$40,000 0.368 0.411 0.425 0.460 0.485 0.513 0.527$50,000 0.342 0.385 0.400 0.435 0.462 0.491 0.507$75,000 0.292 0.334 0.350 0.386 0.414 0.446 0.466
$100,000 0.257 0.298 0.314 0.349 0.379 0.411 0.434$125,000 0.230 0.270 0.286 0.320 0.350 0.383 0.407$150,000 0.209 0.248 0.263 0.297 0.327 0.359 0.385$175,000 0.192 0.229 0.245 0.277 0.307 0.339 0.366$200,000 0.178 0.214 0.229 0.261 0.290 0.321 0.349$225,000 0.166 0.201 0.216 0.246 0.275 0.306 0.335$250,000 0.156 0.189 0.204 0.234 0.262 0.292 0.321$275,000 0.147 0.179 0.194 0.223 0.251 0.280 0.310$300,000 0.139 0.170 0.185 0.213 0.240 0.269 0.299$325,000 0.132 0.162 0.176 0.204 0.231 0.259 0.289$350,000 0.126 0.155 0.169 0.195 0.222 0.250 0.280$375,000 0.120 0.149 0.162 0.188 0.215 0.242 0.272$400,000 0.115 0.143 0.156 0.181 0.207 0.234 0.264$425,000 0.110 0.137 0.150 0.175 0.201 0.227 0.257$450,000 0.105 0.132 0.145 0.169 0.195 0.220 0.250$475,000 0.101 0.128 0.140 0.164 0.189 0.214 0.244$500,000 0.098 0.123 0.136 0.159 0.184 0.208 0.238$600,000 0.085 0.109 0.121 0.142 0.165 0.188 0.217$700,000 0.075 0.097 0.108 0.128 0.151 0.172 0.201$800,000 0.067 0.088 0.099 0.117 0.138 0.159 0.187$900,000 0.061 0.080 0.091 0.108 0.128 0.147 0.175
$1,000,000 0.056 0.074 0.084 0.100 0.120 0.138 0.165$2,000,000 0.029 0.040 0.047 0.057 0.072 0.084 0.106$3,000,000 0.018 0.027 0.032 0.039 0.051 0.060 0.079$4,000,000 0.013 0.020 0.024 0.029 0.039 0.047 0.063$5,000,000 0.010 0.015 0.018 0.023 0.031 0.038 0.052$6,000,000 0.008 0.012 0.015 0.019 0.026 0.031 0.044$7,000,000 0.006 0.010 0.012 0.016 0.022 0.026 0.038$8,000,000 0.005 0.008 0.010 0.013 0.018 0.023 0.033$9,000,000 0.004 0.007 0.009 0.011 0.016 0.020 0.029
$10,000,000 0.004 0.006 0.008 0.010 0.014 0.017 0.026
7.
With Loss Limit Without Loss Limit 1st 2nd 3rd 1st 2nd 3rd 4th & SubsequentAdj. Adj. Adj. Adj. Adj. Adj. Adjustment0.04 0.03 0.03 0.18 0.13 0.13 0.00
Retrospective Development Factors
© Copyright 2015 National Council on Compensation Insurance, Inc. All Rights Reserved.
Page 30 of 44

Table of Expense Ratios - Excluding Taxes andIncluding Profit and Contingencies
Type A: 2015-01
WC Premium Range Expense WC Premium Range Expense WC Premium Range ExpenseFrom To Ratio From To Ratio From To Ratio
0 - 10,055 0.376 21,928 - 22,469 0.328 393,334 - 424,799 0.280
10,056 - 10,167 0.375 22,470 - 23,037 0.327 424,800 - 461,739 0.279
10,168 - 10,282 0.374 23,038 - 23,636 0.326 461,740 - 505,714 0.278
10,283 - 10,399 0.373 23,637 - 24,266 0.325 505,715 - 558,947 0.277
10,400 - 10,520 0.372 24,267 - 24,931 0.324 558,948 - 624,705 0.276
10,521 - 10,643 0.371 24,932 - 25,633 0.323 624,706 - 707,999 0.275
10,644 - 10,769 0.370 25,634 - 26,376 0.322 708,000 - 816,923 0.274
10,770 - 10,898 0.369 26,377 - 27,164 0.321 816,924 - 965,454 0.273
10,899 - 11,030 0.368 27,165 - 27,999 0.320 965,455 - 1,179,999 0.272
11,031 - 11,165 0.367 28,000 - 28,888 0.319 1,180,000 - 1,517,142 0.271
11,166 - 11,304 0.366 28,889 - 29,836 0.318 1,517,143 - 1,824,799 0.270
11,305 - 11,446 0.365 29,837 - 30,847 0.317 1,824,800 - 1,983,478 0.269
11,447 - 11,592 0.364 30,848 - 31,929 0.316 1,983,479 - 2,172,380 0.268
11,593 - 11,741 0.363 31,930 - 33,090 0.315 2,172,381 - 2,401,052 0.267
11,742 - 11,895 0.362 33,091 - 34,339 0.314 2,401,053 - 2,683,529 0.266
11,896 - 12,052 0.361 34,340 - 35,686 0.313 2,683,530 - 3,041,333 0.265
12,053 - 12,214 0.360 35,687 - 37,142 0.312 3,041,334 - 3,509,230 0.264
12,215 - 12,380 0.359 37,143 - 38,723 0.311 3,509,231 - 4,147,272 0.263
12,381 - 12,551 0.359 38,724 - 40,444 0.311 4,147,273 - 5,068,888 0.263
12,552 - 12,727 0.358 40,445 - 42,325 0.310 5,068,889 - 6,517,142 0.262
12,728 - 12,907 0.357 42,326 - 44,390 0.309 6,517,143 - 9,123,999 0.261
12,908 - 13,093 0.356 44,391 - 46,666 0.308 9,124,000 - 15,206,666 0.260
13,094 - 13,284 0.355 46,667 - 49,189 0.307 15,206,667 - 45,619,999 0.259
13,285 - 13,481 0.354 49,190 - 51,999 0.306 45,620,000 - And Above 0.258
13,482 - 13,684 0.353 52,000 - 55,151 0.305
13,685 - 13,893 0.352 55,152 - 58,709 0.304
13,894 - 14,108 0.351 58,710 - 62,758 0.303
14,109 - 14,330 0.350 62,759 - 67,407 0.302
14,331 - 14,559 0.349 67,408 - 72,799 0.301
14,560 - 14,796 0.348 72,800 - 79,130 0.300
14,797 - 15,041 0.347 79,131 - 86,666 0.299
15,042 - 15,294 0.346 86,667 - 95,789 0.298
15,295 - 15,555 0.345 95,790 - 107,058 0.297
15,556 - 15,826 0.344 107,059 - 121,333 0.296
15,827 - 16,106 0.343 121,334 - 139,999 0.295
16,107 - 16,396 0.342 140,000 - 165,454 0.294
16,397 - 16,697 0.341 165,455 - 200,377 0.293
16,698 - 17,009 0.340 200,378 - 208,235 0.292
17,010 - 17,333 0.339 208,236 - 216,734 0.291
17,334 - 17,669 0.338 216,735 - 225,957 0.290
17,670 - 18,019 0.337 225,958 - 235,999 0.289
18,020 - 18,383 0.336 236,000 - 246,976 0.288
18,384 - 18,762 0.335 246,977 - 259,024 0.287
18,763 - 19,157 0.335 259,025 - 272,307 0.287
19,158 - 19,569 0.334 272,308 - 287,027 0.286
19,570 - 19,999 0.333 287,028 - 303,428 0.285
20,000 - 20,449 0.332 303,429 - 321,818 0.284 First - 10,000 0.0%
20,450 - 20,919 0.331 321,819 - 342,580 0.283 Next - 190,000 9.1%
20,920 - 21,411 0.330 342,581 - 366,206 0.282 Next - 1,550,000 11.3%
21,412 - 21,927 0.329 366,207 - 393,333 0.281 Over - 1,750,000 12.3%
Expected Loss Ratio: 0.585
Tax Multiplier: 1.041
© Copyright 2015 National Council on Compensation Insurance, Inc. All Rights Reserved.
Page 31 of 44

Table of Expense Ratios - Excluding Taxes and Including Profit and Contingencies
Type B: 2015-01
WC Premium Range Expense WC Premium Range Expense WC Premium Range ExpenseFrom To Ratio From To Ratio From To Ratio
0 - 10,099 0.376 19,246 - 19,999 0.352 213,549 - 228,275 0.328
10,100 - 10,303 0.375 20,000 - 20,816 0.351 228,276 - 245,185 0.327
10,304 - 10,515 0.374 20,817 - 21,702 0.350 245,186 - 264,799 0.326
10,516 - 10,736 0.373 21,703 - 22,666 0.349 264,800 - 287,826 0.325
10,737 - 10,967 0.372 22,667 - 23,720 0.348 287,827 - 315,238 0.324
10,968 - 11,208 0.371 23,721 - 24,878 0.347 315,239 - 348,421 0.323
11,209 - 11,460 0.370 24,879 - 26,153 0.346 348,422 - 389,411 0.322
11,461 - 11,724 0.369 26,154 - 27,567 0.345 389,412 - 441,333 0.321
11,725 - 11,999 0.368 27,568 - 29,142 0.344 441,334 - 509,230 0.320
12,000 - 12,289 0.367 29,143 - 30,909 0.343 509,231 - 601,818 0.319
12,290 - 12,592 0.366 30,910 - 32,903 0.342 601,819 - 735,555 0.318
12,593 - 12,911 0.365 32,904 - 35,172 0.341 735,556 - 945,714 0.317
12,912 - 13,246 0.364 35,173 - 37,777 0.340 945,715 - 1,323,999 0.316
13,247 - 13,599 0.363 37,778 - 40,799 0.339 1,324,000 - 1,809,565 0.315
13,600 - 13,972 0.362 40,800 - 44,347 0.338 1,809,566 - 1,981,904 0.314
13,973 - 14,366 0.361 44,348 - 48,571 0.337 1,981,905 - 2,190,526 0.313
14,367 - 14,782 0.360 48,572 - 53,684 0.336 2,190,527 - 2,448,235 0.312
14,783 - 15,223 0.359 53,685 - 59,999 0.335 2,448,236 - 2,774,666 0.311
15,224 - 15,692 0.359 60,000 - 67,999 0.335 2,774,667 - 3,201,538 0.311
15,693 - 16,190 0.358 68,000 - 78,461 0.334 3,201,539 - 3,783,636 0.310
16,191 - 16,721 0.357 78,462 - 92,727 0.333 3,783,637 - 4,624,444 0.309
16,722 - 17,288 0.356 92,728 - 113,333 0.332 4,624,445 - 5,945,714 0.308
17,289 - 17,894 0.355 113,334 - 145,714 0.331 5,945,715 - 8,323,999 0.307
17,895 - 18,545 0.354 145,715 - 200,606 0.330 8,324,000 - 13,873,333 0.306
18,546 - 19,245 0.353 200,607 - 213,548 0.329 13,873,334 - 41,619,999 0.305
41,620,000 - And Above 0.304
First - 10,000 0.0%
Next - 190,000 5.1%
Next - 1,550,000 6.5%
Over - 1,750,000 7.5%
Expected Loss Ratio: 0.585
Tax Multiplier: 1.041
© Copyright 2015 National Council on Compensation Insurance, Inc. All Rights Reserved.
Page 32 of 44

Table of Expense Ratios - Excluding Allocated Loss Adjustment Expense and Taxes and Including Profit and Contingencies
Type A: 2015-01
WC Premium Range Expense WC Premium Range Expense WC Premium Range ExpenseFrom To Ratio From To Ratio From To Ratio
0 - 10,055 0.300 21,928 - 22,469 0.252 393,334 - 424,799 0.204
10,056 - 10,167 0.299 22,470 - 23,037 0.251 424,800 - 461,739 0.203
10,168 - 10,282 0.298 23,038 - 23,636 0.250 461,740 - 505,714 0.202
10,283 - 10,399 0.297 23,637 - 24,266 0.249 505,715 - 558,947 0.201
10,400 - 10,520 0.296 24,267 - 24,931 0.248 558,948 - 624,705 0.200
10,521 - 10,643 0.295 24,932 - 25,633 0.247 624,706 - 707,999 0.199
10,644 - 10,769 0.294 25,634 - 26,376 0.246 708,000 - 816,923 0.198
10,770 - 10,898 0.293 26,377 - 27,164 0.245 816,924 - 965,454 0.197
10,899 - 11,030 0.292 27,165 - 27,999 0.244 965,455 - 1,179,999 0.196
11,031 - 11,165 0.291 28,000 - 28,888 0.243 1,180,000 - 1,517,142 0.195
11,166 - 11,304 0.290 28,889 - 29,836 0.242 1,517,143 - 1,824,799 0.194
11,305 - 11,446 0.289 29,837 - 30,847 0.241 1,824,800 - 1,983,478 0.193
11,447 - 11,592 0.288 30,848 - 31,929 0.240 1,983,479 - 2,172,380 0.192
11,593 - 11,741 0.287 31,930 - 33,090 0.239 2,172,381 - 2,401,052 0.191
11,742 - 11,895 0.286 33,091 - 34,339 0.238 2,401,053 - 2,683,529 0.190
11,896 - 12,052 0.285 34,340 - 35,686 0.237 2,683,530 - 3,041,333 0.189
12,053 - 12,214 0.284 35,687 - 37,142 0.236 3,041,334 - 3,509,230 0.188
12,215 - 12,380 0.284 37,143 - 38,723 0.235 3,509,231 - 4,147,272 0.187
12,381 - 12,551 0.283 38,724 - 40,444 0.235 4,147,273 - 5,068,888 0.187
12,552 - 12,727 0.282 40,445 - 42,325 0.234 5,068,889 - 6,517,142 0.186
12,728 - 12,907 0.281 42,326 - 44,390 0.233 6,517,143 - 9,123,999 0.185
12,908 - 13,093 0.280 44,391 - 46,666 0.232 9,124,000 - 15,206,666 0.184
13,094 - 13,284 0.279 46,667 - 49,189 0.231 15,206,667 - 45,619,999 0.183
13,285 - 13,481 0.278 49,190 - 51,999 0.230 45,620,000 - And Above 0.182
13,482 - 13,684 0.277 52,000 - 55,151 0.229
13,685 - 13,893 0.276 55,152 - 58,709 0.228
13,894 - 14,108 0.275 58,710 - 62,758 0.227
14,109 - 14,330 0.274 62,759 - 67,407 0.226
14,331 - 14,559 0.273 67,408 - 72,799 0.225
14,560 - 14,796 0.272 72,800 - 79,130 0.224
14,797 - 15,041 0.271 79,131 - 86,666 0.223
15,042 - 15,294 0.270 86,667 - 95,789 0.222
15,295 - 15,555 0.269 95,790 - 107,058 0.221
15,556 - 15,826 0.268 107,059 - 121,333 0.220
15,827 - 16,106 0.267 121,334 - 139,999 0.219
16,107 - 16,396 0.266 140,000 - 165,454 0.218
16,397 - 16,697 0.265 165,455 - 200,377 0.217
16,698 - 17,009 0.264 200,378 - 208,235 0.216
17,010 - 17,333 0.263 208,236 - 216,734 0.215
17,334 - 17,669 0.262 216,735 - 225,957 0.214
17,670 - 18,019 0.261 225,958 - 235,999 0.213
18,020 - 18,383 0.260 236,000 - 246,976 0.212
18,384 - 18,762 0.260 246,977 - 259,024 0.211
18,763 - 19,157 0.259 259,025 - 272,307 0.211
19,158 - 19,569 0.258 272,308 - 287,027 0.210
19,570 - 19,999 0.257 287,028 - 303,428 0.209
20,000 - 20,449 0.256 303,429 - 321,818 0.208 First - 10,000 0.0%
20,450 - 20,919 0.255 321,819 - 342,580 0.207 Next - 190,000 9.1%
20,920 - 21,411 0.254 342,581 - 366,206 0.206 Next - 1,550,000 11.3%
21,412 - 21,927 0.253 366,207 - 393,333 0.205 Over - 1,750,000 12.3%
Expected Loss and ALAE Ratio: 0.660
Tax Multiplier: 1.041
© Copyright 2015 National Council on Compensation Insurance, Inc. All Rights Reserved.
Page 33 of 44

Table of Expense Ratios - Excluding Allocated Loss Adjustment Expense and Taxes and Including Profit and Contingencies
Type B: 2015-01
WC Premium Range Expense WC Premium Range Expense WC Premium Range ExpenseFrom To Ratio From To Ratio From To Ratio
0 - 10,099 0.300 19,246 - 19,999 0.276 213,549 - 228,275 0.252
10,100 - 10,303 0.299 20,000 - 20,816 0.275 228,276 - 245,185 0.251
10,304 - 10,515 0.298 20,817 - 21,702 0.274 245,186 - 264,799 0.250
10,516 - 10,736 0.297 21,703 - 22,666 0.273 264,800 - 287,826 0.249
10,737 - 10,967 0.296 22,667 - 23,720 0.272 287,827 - 315,238 0.248
10,968 - 11,208 0.295 23,721 - 24,878 0.271 315,239 - 348,421 0.247
11,209 - 11,460 0.294 24,879 - 26,153 0.270 348,422 - 389,411 0.246
11,461 - 11,724 0.293 26,154 - 27,567 0.269 389,412 - 441,333 0.245
11,725 - 11,999 0.292 27,568 - 29,142 0.268 441,334 - 509,230 0.244
12,000 - 12,289 0.291 29,143 - 30,909 0.267 509,231 - 601,818 0.243
12,290 - 12,592 0.290 30,910 - 32,903 0.266 601,819 - 735,555 0.242
12,593 - 12,911 0.289 32,904 - 35,172 0.265 735,556 - 945,714 0.241
12,912 - 13,246 0.288 35,173 - 37,777 0.264 945,715 - 1,323,999 0.240
13,247 - 13,599 0.287 37,778 - 40,799 0.263 1,324,000 - 1,809,565 0.239
13,600 - 13,972 0.286 40,800 - 44,347 0.262 1,809,566 - 1,981,904 0.238
13,973 - 14,366 0.285 44,348 - 48,571 0.261 1,981,905 - 2,190,526 0.237
14,367 - 14,782 0.284 48,572 - 53,684 0.260 2,190,527 - 2,448,235 0.236
14,783 - 15,223 0.284 53,685 - 59,999 0.260 2,448,236 - 2,774,666 0.235
15,224 - 15,692 0.283 60,000 - 67,999 0.259 2,774,667 - 3,201,538 0.235
15,693 - 16,190 0.282 68,000 - 78,461 0.258 3,201,539 - 3,783,636 0.234
16,191 - 16,721 0.281 78,462 - 92,727 0.257 3,783,637 - 4,624,444 0.233
16,722 - 17,288 0.280 92,728 - 113,333 0.256 4,624,445 - 5,945,714 0.232
17,289 - 17,894 0.279 113,334 - 145,714 0.255 5,945,715 - 8,323,999 0.231
17,895 - 18,545 0.278 145,715 - 200,606 0.254 8,324,000 - 13,873,333 0.230
18,546 - 19,245 0.277 200,607 - 213,548 0.253 13,873,334 - 41,619,999 0.229
41,620,000 - And Above 0.228
First 10,000 0.0%
Next 190,000 5.1%
Next 1,550,000 6.5%
Over 1,750,000 7.5%
Expected Loss and ALAE Ratio: 0.660
Tax Multiplier: 1.041
© Copyright 2015 National Council on Compensation Insurance, Inc. All Rights Reserved.
Page 34 of 44

WORKERS COMPENSATION AND EMPLOYERS LIABILITY IOWAExhibit V Page S1
Effective January 1, 2016APPLICABLE TO ASSIGNED RISK POLICIES ONLY
CLASS MIN D CLASS MIN D CLASS MIN D CODE RATE PREM ELR RATIO CODE RATE PREM ELR RATIO CODE RATE PREM ELR RATIO
0005 7.44 600 2.72 0.33 2014 12.10 900 3.96 0.27 2709 21.14 900 6.93 0.27 0008 4.99 600 1.73 0.30 2016 6.38 862 2.45 0.34 2710 15.64 900 4.75 0.24 0016 10.92 450 3.56 0.26 2021 4.47 652 1.56 0.30 2714 9.85 900 3.73 0.34 0034 10.57 600 3.89 0.33 2039 8.05 900 3.05 0.34 2731 6.38 862 2.08 0.26 0035 6.05 600 2.29 0.34 2041 9.10 900 3.44 0.34 2735 9.87 900 3.72 0.34
0036 6.38 450 2.34 0.33 2065 5.41 755 2.00 0.33 2759 11.32 900 4.29 0.34 0037 7.87 450 2.72 0.30 2070 10.84 900 4.01 0.33 2790 3.38 532 1.27 0.34 0042 14.96 600 5.20 0.30 2081 7.62 900 2.79 0.33 2797 10.89 900 4.02 0.33 0050 13.25 900 4.89 0.33 2089 7.50 900 2.77 0.33 2799 9.09 900 3.19 0.30 0059D 0.79 – 0.11 0.23 2095 6.15 837 2.27 0.33 2802 9.32 900 3.23 0.30
0065D 0.20 – 0.03 0.26 2105 7.54 900 2.85 0.34 2812 – – 2.12 0.33 0066D 0.20 – 0.03 0.27 2110 5.02 712 1.89 0.34 2835 5.73 790 2.30 0.44 0067D 0.20 – 0.03 0.26 2111 4.73 680 1.80 0.34 2836 4.73 680 1.88 0.44 0079 6.59 600 2.14 0.26 2112 6.85 900 2.58 0.34 2841 8.26 900 3.11 0.34 0083 11.56 450 4.24 0.33 2114 5.37 751 2.04 0.34 2881 6.57 883 2.62 0.44
0106 15.72 900 4.78 0.24 2121 2.93 482 1.08 0.33 2883 5.75 793 2.12 0.33 0113 7.88 900 2.91 0.33 2130 3.64 560 1.35 0.33 2913 7.36 900 2.93 0.44 0170 5.97 817 2.20 0.33 2131 5.21 733 1.92 0.33 2915 6.08 829 2.13 0.30 0251 6.08 829 2.24 0.33 2143 4.38 642 1.65 0.34 2916 8.39 900 2.55 0.24 0400 13.26 900 4.63 0.30 2157 7.88 900 2.92 0.33 2923 4.34 637 1.64 0.34
0401 19.90 A 6.05 0.24 2172 4.23 625 1.48 0.31 2942 5.36 750 2.15 0.44 0771N 1.22 – – – 2174 7.02 900 2.66 0.34 2960 8.88 900 3.27 0.33 0908P 302.00 462 111.59 0.33 2211 18.06 900 5.90 0.26 3004 4.26 629 1.40 0.27 0913P 763.00 900 281.15 0.33 2220 4.52 657 1.67 0.33 3018 5.67 784 1.85 0.26 0917 8.62 900 3.26 0.34 2286 3.42 536 1.29 0.34 3022 8.14 900 3.09 0.34
1005 10.08 900 2.85 0.24 2288 9.11 900 3.45 0.34 3027 9.30 900 3.04 0.26 1016X 22.33 900 6.31 0.24 2300 4.43 647 1.78 0.44 3028 4.81 689 1.77 0.33 1164D 8.87 900 2.45 0.23 2302 4.13 614 1.52 0.33 3030 9.26 900 3.02 0.26 1165D 6.60 886 1.99 0.25 2305 4.52 657 1.57 0.30 3040 11.09 900 3.61 0.26 1320 3.55 551 1.08 0.25 2361 4.47 652 1.65 0.33 3041 10.31 900 3.79 0.33
1322 14.29 900 4.38 0.25 2362 3.46 541 1.27 0.33 3042 8.32 900 2.90 0.30 1430 11.05 900 3.61 0.26 2380 4.88 697 1.79 0.33 3064 9.97 900 3.66 0.33 1438 9.32 900 2.84 0.25 2386 4.02 602 1.53 0.34 3069 – – 2.35 0.33 1452 4.13 614 1.36 0.27 2388 3.52 547 1.33 0.34 3076 6.37 861 2.35 0.33 1463 39.07 900 11.90 0.24 2402 4.98 708 1.62 0.26 3081D 12.07 900 3.86 0.26
1472 9.44 900 2.86 0.24 2413 5.67 784 2.09 0.33 3082D 7.79 900 2.51 0.26 1624D 8.20 900 2.47 0.24 2416 4.36 640 1.60 0.33 3085D 12.96 900 4.19 0.27 1642 5.50 765 1.79 0.26 2417 3.12 503 1.15 0.33 3110 15.51 900 5.70 0.33 1654 11.64 900 3.81 0.27 2501 6.18 840 2.26 0.33 3111 4.76 684 1.75 0.33 1655 6.55 881 2.16 0.27 2503 2.29 412 0.87 0.34 3113 4.30 633 1.58 0.33
1699 7.83 900 2.55 0.26 2534 4.08 609 1.53 0.34 3114 7.19 900 2.65 0.33 1701 6.75 900 2.22 0.27 2570 7.84 900 2.96 0.34 3118 3.56 552 1.35 0.34 1710D 8.64 900 2.81 0.27 2585 7.84 900 2.96 0.34 3119 2.29 412 0.92 0.44 1741D 11.49 900 2.82 0.23 2586 5.67 784 2.09 0.33 3122 2.93 482 1.10 0.34 1747 5.20 732 1.71 0.27 2587 4.91 700 1.87 0.34 3126 8.48 900 3.11 0.33
1748 10.01 900 3.25 0.26 2589 5.21 733 1.92 0.33 3131 3.76 574 1.38 0.33 1803D 14.88 900 4.36 0.24 2600 6.03 823 2.29 0.34 3132 5.51 766 2.02 0.33 1852D 6.27 850 1.55 0.23 2623 13.82 900 4.79 0.30 3145 3.63 559 1.33 0.33 1853 4.72 679 1.66 0.30 2651 3.76 574 1.42 0.34 3146 5.84 802 2.15 0.33 1860 4.08 609 1.55 0.34 2660 4.62 668 1.74 0.34 3169 5.75 793 2.11 0.33
1924 4.16 618 1.57 0.34 2670 3.71 568 1.48 0.44 3175D 8.02 900 2.90 0.33 1925 8.84 900 3.05 0.30 2683 3.78 576 1.42 0.34 3179 5.50 765 2.08 0.34 2001 – – 3.71 0.33 2688 8.16 900 3.07 0.34 3180 5.32 745 2.00 0.34 2002 4.16 618 1.57 0.34 2701 27.73 900 9.04 0.26 3188 3.30 523 1.25 0.34 2003 10.01 900 3.71 0.33 2702 31.49 900 8.84 0.23 3220 3.30 523 1.22 0.33
* Refer to the Footnotes Page for additional information on this class code.
© Copyright 2015 National Council on Compensation Insurance, Inc. All Rights Reserved.
Page 35 of 44

WORKERS COMPENSATION AND EMPLOYERS LIABILITY IOWAExhibit V Page S2
Effective January 1, 2016APPLICABLE TO ASSIGNED RISK POLICIES ONLY
CLASS MIN D CLASS MIN D CLASS MIN D CODE RATE PREM ELR RATIO CODE RATE PREM ELR RATIO CODE RATE PREM ELR RATIO
3223 7.90 900 3.14 0.44 4021 11.88 900 3.89 0.27 4568 4.36 640 1.42 0.26 3224 7.76 900 2.96 0.34 4024D 7.97 900 2.59 0.26 4581 2.11 392 0.64 0.24 3227 8.22 900 3.09 0.34 4034 15.55 900 5.08 0.26 4583 6.89 900 2.10 0.24 3240 4.94 703 1.86 0.34 4036 4.90 699 1.60 0.27 4611 3.08 499 1.16 0.34 3241 6.29 852 2.31 0.33 4038 6.77 900 2.72 0.44 4635 7.01 900 1.97 0.23
3255 3.90 589 1.56 0.44 4053 3.89 588 1.43 0.33 4653 3.82 580 1.44 0.34 3257 5.28 741 1.94 0.33 4061 7.23 900 2.74 0.34 4665 14.50 900 4.75 0.27 3270 4.98 708 1.83 0.33 4062 3.50 545 1.29 0.33 4670 19.19 900 6.22 0.26 3300 8.52 900 3.12 0.33 4101 5.36 750 1.86 0.30 4683 10.13 900 3.73 0.33 3303 7.45 900 2.81 0.34 4109 1.59 335 0.60 0.34 4686 4.84 692 1.58 0.26
3307 5.63 779 2.08 0.33 4110 1.83 361 0.68 0.33 4692 1.16 288 0.44 0.34 3315 8.89 900 3.37 0.34 4111 3.86 585 1.47 0.34 4693 3.67 564 1.35 0.33 3334 6.86 900 2.55 0.33 4112 – – 0.68 0.33 4703 7.09 900 2.62 0.33 3336 7.05 900 2.30 0.26 4113 3.30 523 1.23 0.33 4717 3.71 568 1.48 0.44 3365 13.61 900 4.45 0.26 4114 5.06 717 1.86 0.33 4720 5.81 799 2.14 0.33
3372 6.89 900 2.39 0.30 4130 6.01 821 2.21 0.33 4740 3.38 532 1.11 0.27 3373 9.95 900 3.67 0.33 4131 7.90 900 2.98 0.34 4741 4.28 631 1.58 0.33 3383 2.48 433 0.94 0.34 4133 5.17 729 1.94 0.34 4751 8.70 900 2.80 0.26 3385 1.68 345 0.63 0.34 4149 1.50 325 0.59 0.44 4771N 6.94 900 1.95 0.23 3400 5.21 733 1.82 0.30 4150 – – 0.59 0.44 4777 8.02 900 2.25 0.23
3507 9.30 900 3.42 0.33 4206 6.45 870 2.37 0.33 4825 6.19 841 2.02 0.26 3515 4.52 657 1.66 0.33 4207 5.37 751 1.75 0.26 4828 3.52 547 1.23 0.30 3548 3.16 508 1.17 0.33 4239 5.25 738 1.73 0.27 4829 2.37 421 0.72 0.24 3559 8.16 900 2.98 0.33 4240 5.25 738 1.98 0.34 4902 6.45 870 2.43 0.34 3574 2.69 456 1.02 0.34 4243 4.54 659 1.67 0.33 4923 2.15 397 0.79 0.33
3581 2.59 445 0.98 0.34 4244 5.16 728 1.89 0.33 5020 9.71 900 3.18 0.27 3612 4.72 679 1.64 0.30 4250 4.94 703 1.82 0.33 5022 15.11 900 4.61 0.25 3620 8.10 900 2.64 0.26 4251 5.51 766 2.03 0.33 5037 67.20 900 18.87 0.23 3629 4.99 709 1.88 0.34 4263 4.88 697 1.79 0.33 5040 41.22 900 11.61 0.23 3632 7.58 900 2.63 0.30 4273 4.04 604 1.49 0.33 5057 15.05 900 4.22 0.23
3634 3.72 569 1.41 0.34 4279 4.04 604 1.49 0.33 5059 35.72 900 10.01 0.23 3635 6.15 837 2.26 0.33 4282 4.16 618 1.59 0.34 5069 40.52 900 11.52 0.24 3638 4.02 602 1.52 0.34 4283 4.23 625 1.55 0.33 5102 8.91 900 2.72 0.25 3642 3.72 569 1.36 0.33 4299 4.36 640 1.65 0.34 5146 8.87 900 2.90 0.26 3643 4.26 629 1.57 0.33 4304 9.91 900 3.43 0.30 5160 7.58 900 2.34 0.25
3647 6.01 821 2.10 0.30 4307 4.12 613 1.65 0.44 5183 7.35 900 2.41 0.27 3648 3.04 494 1.15 0.34 4351 2.09 390 0.77 0.33 5188 6.20 842 2.03 0.27 3681 2.52 437 0.95 0.34 4352 3.04 494 1.15 0.34 5190 4.93 702 1.61 0.27 3685 3.12 503 1.18 0.34 4360 1.95 375 0.74 0.34 5191 1.89 368 0.70 0.33 3719 2.42 426 0.68 0.23 4361 1.83 361 0.69 0.34 5192 5.94 813 2.18 0.33
3724 9.50 900 2.89 0.24 4362 – – 0.74 0.34 5213 15.65 900 4.81 0.25 3726 7.83 900 2.21 0.24 4410 5.21 733 1.92 0.33 5215 13.09 900 4.58 0.30 3803 8.80 900 3.25 0.33 4420 10.13 900 3.12 0.25 5221 10.95 900 3.58 0.27 3807 5.88 807 2.22 0.34 4431 3.26 519 1.30 0.44 5222 22.62 900 6.91 0.25 3808 5.59 775 1.95 0.30 4432 3.03 493 1.21 0.44 5223 12.14 900 3.99 0.27
3821 11.83 900 4.12 0.30 4439 4.20 622 1.46 0.30 5348 12.57 900 4.14 0.27 3822 9.11 900 3.16 0.30 4452 7.38 900 2.71 0.33 5402 7.87 900 2.97 0.34 3824 10.50 900 3.65 0.30 4459 5.67 784 2.10 0.33 5403 21.22 900 6.45 0.24 3826 1.65 342 0.61 0.33 4470 5.33 746 1.96 0.33 5437 12.51 900 4.12 0.27 3827 4.42 646 1.54 0.30 4484 5.92 811 2.17 0.33 5443 7.49 900 2.76 0.33
3830 2.47 432 0.86 0.30 4493 5.85 804 2.15 0.33 5445 11.17 900 3.42 0.25 3851 7.19 900 2.73 0.34 4511 1.22 294 0.42 0.30 5462 16.85 900 5.51 0.26 3865 3.15 507 1.25 0.44 4557 4.64 670 1.75 0.34 5472 8.41 900 2.37 0.24 3881 11.92 900 4.38 0.33 4558 4.36 640 1.60 0.33 5473 14.14 900 3.97 0.23 4000 19.10 900 5.80 0.24 4561 – – 1.46 0.30 5474 10.61 900 3.24 0.25
* Refer to the Footnotes Page for additional information on this class code.
© Copyright 2015 National Council on Compensation Insurance, Inc. All Rights Reserved.
Page 36 of 44

WORKERS COMPENSATION AND EMPLOYERS LIABILITY IOWAExhibit V Page S3
Effective January 1, 2016APPLICABLE TO ASSIGNED RISK POLICIES ONLY
CLASS MIN D CLASS MIN D CLASS MIN D CODE RATE PREM ELR RATIO CODE RATE PREM ELR RATIO CODE RATE PREM ELR RATIO
5478 9.13 900 2.99 0.27 6874F 33.54 900 6.66 0.20 7590 6.38 862 2.22 0.30 5479 13.59 900 4.74 0.30 6882 8.62 900 2.44 0.24 7600 6.40 864 2.09 0.26 5480 27.92 900 8.50 0.24 6884 15.24 900 4.34 0.24 7601 – – 2.09 0.26 5491 3.93 592 1.20 0.25 7016M 13.55 900 3.84 0.24 7605 3.34 527 1.09 0.26 5506 12.05 900 3.39 0.23 7024M 15.05 900 4.27 0.24 7610 1.04 274 0.36 0.30
5507 5.68 785 1.74 0.25 7038M 8.24 900 2.30 0.23 7611 – – 2.09 0.26 5508D 27.74 900 9.08 0.27 7046M 22.14 900 6.24 0.24 7612 – – 2.09 0.26 5535 11.10 900 3.62 0.26 7047M 27.94 900 7.49 0.24 7613 – – 2.09 0.26 5537 9.23 900 3.01 0.26 7050M 16.99 900 4.48 0.23 7705 10.44 900 3.64 0.30 5551 36.87 900 10.29 0.23 7090M 9.15 900 2.55 0.23 7710 64.87 900 19.71 0.24
5606 3.15 507 0.96 0.24 7098M 24.60 900 6.93 0.24 7711 64.87 900 19.71 0.24 5610 14.47 900 5.30 0.33 7099M 45.66 900 12.16 0.24 7720 5.97 817 1.95 0.26 5645 17.17 900 5.22 0.24 7133 6.44 868 1.97 0.25 7855 12.47 900 4.10 0.27 5651 – – 5.22 0.24 7151M 7.81 900 2.40 0.25 8001 3.32 525 1.25 0.34 5703 20.51 900 6.71 0.27 7152M 16.12 900 4.67 0.25 8002 3.61 557 1.33 0.33
5705 23.73 900 7.73 0.26 7153M 8.68 900 2.66 0.25 8006 4.84 692 1.78 0.33 5951 2.33 416 0.87 0.34 7222 11.21 900 3.68 0.27 8008 2.38 422 0.89 0.34 6003 12.32 900 4.05 0.27 7228 14.43 900 4.74 0.27 8010 3.13 504 1.18 0.34 6005 8.36 900 2.74 0.27 7229 14.27 900 4.37 0.25 8013 0.57 223 0.21 0.33 6017 21.39 900 6.79 0.25 7230 15.24 900 5.31 0.30 8015 1.60 336 0.59 0.33
6018 5.12 723 1.70 0.27 7231 16.86 900 5.87 0.30 8017 2.90 479 1.09 0.34 6045 5.94 813 1.96 0.27 7232 14.39 900 4.42 0.25 8018 4.71 678 1.78 0.34 6204 17.32 900 5.30 0.25 7309F 26.21 900 5.22 0.20 8021 4.58 664 1.68 0.33 6206 7.24 900 2.04 0.23 7313F 4.88 697 0.97 0.20 8031 4.00 600 1.47 0.33 6213 4.67 674 1.43 0.25 7317F 15.77 900 3.12 0.20 8032 3.58 554 1.35 0.34
6214 6.01 821 1.69 0.23 7327F 38.61 900 7.73 0.20 8033 2.35 419 0.86 0.33 6216 12.36 900 3.49 0.24 7333M 24.31 900 6.99 0.24 8037 2.90 479 1.09 0.34 6217 10.32 900 3.14 0.24 7335M 27.01 900 7.77 0.24 8039 2.44 428 0.92 0.34 6229 8.75 900 2.65 0.24 7337M 50.14 900 13.64 0.24 8044 4.88 697 1.70 0.30 6233 4.82 690 1.48 0.25 7350F 18.77 900 3.98 0.23 8045 0.79 247 0.30 0.34
6235 13.49 900 3.80 0.24 7360 9.83 900 3.22 0.27 8046 4.82 690 1.77 0.33 6236 22.04 900 7.21 0.27 7370 8.74 900 3.21 0.33 8047 1.86 365 0.70 0.34 6237 3.48 543 1.14 0.27 7380 8.19 900 2.85 0.30 8058 5.14 725 1.88 0.33 6251D 12.30 900 3.78 0.25 7382 7.42 900 2.72 0.33 8072 1.27 300 0.48 0.34 6252D 7.27 900 2.02 0.23 7390 8.49 900 3.13 0.33 8102 3.25 518 1.23 0.34
6260D 10.93 900 3.08 0.24 7394M 7.53 900 2.12 0.24 8103 4.68 675 1.62 0.30 6306 8.71 900 2.67 0.25 7395M 8.36 900 2.36 0.24 8105 4.65 672 1.76 0.34 6319 5.89 808 1.80 0.25 7398M 15.51 900 4.14 0.24 8106 9.35 900 3.05 0.26 6325 11.43 900 3.49 0.25 7402 0.44 208 0.16 0.33 8107 6.34 857 2.07 0.26 6400 11.27 900 3.93 0.30 7403 6.85 900 2.23 0.26 8111 4.32 635 1.59 0.33
6503 2.74 461 1.04 0.34 7405N 1.82 468 0.60 0.27 8116 4.60 666 1.69 0.33 6504 4.24 626 1.61 0.34 7420 12.21 900 3.48 0.24 8203 12.30 900 4.53 0.33 6702M* 15.15 900 4.98 0.27 7421 1.92 371 0.59 0.24 8204 7.07 900 2.30 0.26 6703M* 31.24 900 9.71 0.27 7422 3.15 507 0.89 0.24 8209 14.73 900 5.44 0.33 6704M* 16.84 900 5.53 0.27 7425 6.42 866 1.82 0.24 8215 5.71 788 1.87 0.26
6801F 8.33 900 1.86 0.25 7431N 1.47 409 0.42 0.24 8227 9.15 900 2.58 0.24 6811 10.63 900 3.49 0.27 7445N 0.98 – – – 8232 10.57 900 3.45 0.26 6824F 15.24 900 3.27 0.22 7453N 0.79 – – – 8233 4.88 697 1.61 0.27 6826F 16.86 900 3.63 0.25 7502 5.16 728 1.68 0.26 8235 6.77 900 2.50 0.33 6834 14.27 900 4.94 0.30 7515 1.92 371 0.54 0.23 8263 13.44 900 4.63 0.30
6836 9.83 900 3.21 0.26 7520 6.99 900 2.58 0.33 8264 11.48 900 3.73 0.26 6843F 28.99 900 5.82 0.20 7538 8.93 900 2.52 0.24 8265 12.34 900 3.74 0.24 6845F 15.00 900 2.97 0.20 7539 5.58 774 1.70 0.25 8279 12.39 900 3.76 0.24 6854 7.42 900 2.08 0.23 7540 7.11 900 1.98 0.23 8288 13.86 900 4.47 0.26 6872F 14.57 900 2.90 0.20 7580 4.07 608 1.33 0.26 8291 8.55 900 2.97 0.30
* Refer to the Footnotes Page for additional information on this class code.
© Copyright 2015 National Council on Compensation Insurance, Inc. All Rights Reserved.
Page 37 of 44
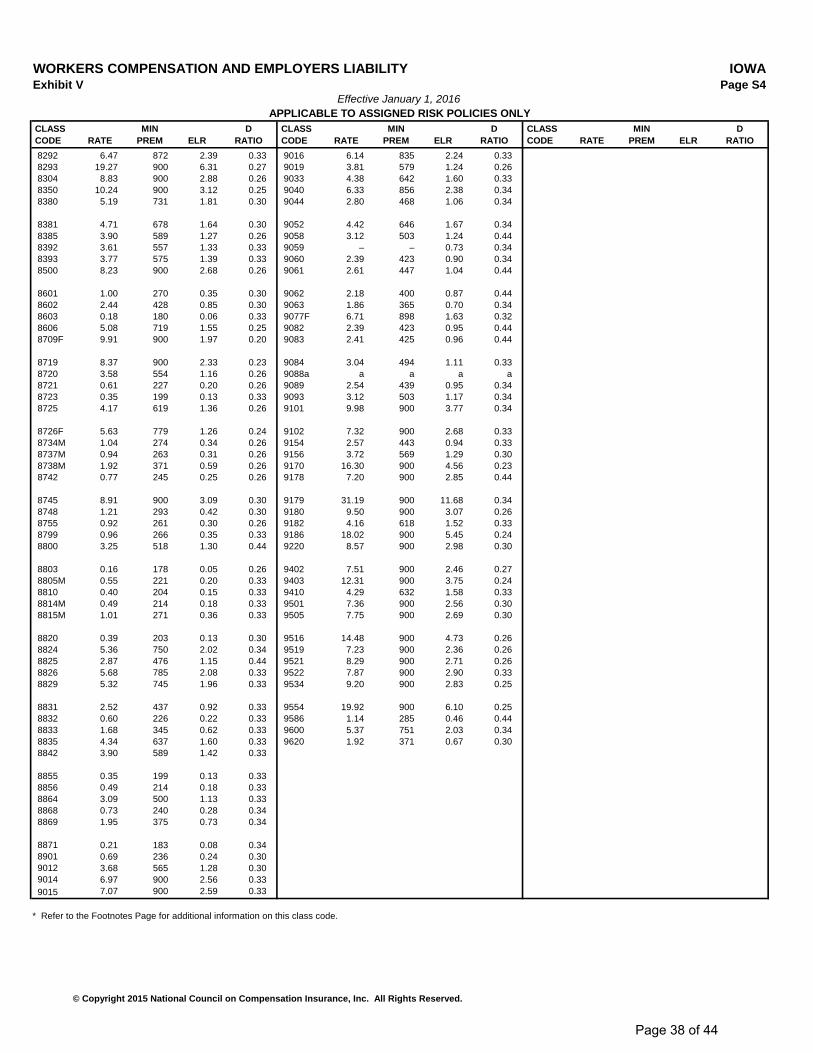
WORKERS COMPENSATION AND EMPLOYERS LIABILITY IOWAExhibit V Page S4
Effective January 1, 2016APPLICABLE TO ASSIGNED RISK POLICIES ONLY
CLASS MIN D CLASS MIN D CLASS MIN D CODE RATE PREM ELR RATIO CODE RATE PREM ELR RATIO CODE RATE PREM ELR RATIO
8292 6.47 872 2.39 0.33 9016 6.14 835 2.24 0.33 8293 19.27 900 6.31 0.27 9019 3.81 579 1.24 0.26 8304 8.83 900 2.88 0.26 9033 4.38 642 1.60 0.33 8350 10.24 900 3.12 0.25 9040 6.33 856 2.38 0.34 8380 5.19 731 1.81 0.30 9044 2.80 468 1.06 0.34
8381 4.71 678 1.64 0.30 9052 4.42 646 1.67 0.34 8385 3.90 589 1.27 0.26 9058 3.12 503 1.24 0.44 8392 3.61 557 1.33 0.33 9059 – – 0.73 0.34 8393 3.77 575 1.39 0.33 9060 2.39 423 0.90 0.34 8500 8.23 900 2.68 0.26 9061 2.61 447 1.04 0.44
8601 1.00 270 0.35 0.30 9062 2.18 400 0.87 0.44 8602 2.44 428 0.85 0.30 9063 1.86 365 0.70 0.34 8603 0.18 180 0.06 0.33 9077F 6.71 898 1.63 0.32 8606 5.08 719 1.55 0.25 9082 2.39 423 0.95 0.44 8709F 9.91 900 1.97 0.20 9083 2.41 425 0.96 0.44
8719 8.37 900 2.33 0.23 9084 3.04 494 1.11 0.33 8720 3.58 554 1.16 0.26 9088a a a a a 8721 0.61 227 0.20 0.26 9089 2.54 439 0.95 0.34 8723 0.35 199 0.13 0.33 9093 3.12 503 1.17 0.34 8725 4.17 619 1.36 0.26 9101 9.98 900 3.77 0.34
8726F 5.63 779 1.26 0.24 9102 7.32 900 2.68 0.33 8734M 1.04 274 0.34 0.26 9154 2.57 443 0.94 0.33 8737M 0.94 263 0.31 0.26 9156 3.72 569 1.29 0.30 8738M 1.92 371 0.59 0.26 9170 16.30 900 4.56 0.23 8742 0.77 245 0.25 0.26 9178 7.20 900 2.85 0.44
8745 8.91 900 3.09 0.30 9179 31.19 900 11.68 0.34 8748 1.21 293 0.42 0.30 9180 9.50 900 3.07 0.26 8755 0.92 261 0.30 0.26 9182 4.16 618 1.52 0.33 8799 0.96 266 0.35 0.33 9186 18.02 900 5.45 0.24 8800 3.25 518 1.30 0.44 9220 8.57 900 2.98 0.30
8803 0.16 178 0.05 0.26 9402 7.51 900 2.46 0.27 8805M 0.55 221 0.20 0.33 9403 12.31 900 3.75 0.24 8810 0.40 204 0.15 0.33 9410 4.29 632 1.58 0.33 8814M 0.49 214 0.18 0.33 9501 7.36 900 2.56 0.30 8815M 1.01 271 0.36 0.33 9505 7.75 900 2.69 0.30
8820 0.39 203 0.13 0.30 9516 14.48 900 4.73 0.26 8824 5.36 750 2.02 0.34 9519 7.23 900 2.36 0.26 8825 2.87 476 1.15 0.44 9521 8.29 900 2.71 0.26 8826 5.68 785 2.08 0.33 9522 7.87 900 2.90 0.33 8829 5.32 745 1.96 0.33 9534 9.20 900 2.83 0.25
8831 2.52 437 0.92 0.33 9554 19.92 900 6.10 0.25 8832 0.60 226 0.22 0.33 9586 1.14 285 0.46 0.44 8833 1.68 345 0.62 0.33 9600 5.37 751 2.03 0.34 8835 4.34 637 1.60 0.33 9620 1.92 371 0.67 0.30 8842 3.90 589 1.42 0.33
8855 0.35 199 0.13 0.33 8856 0.49 214 0.18 0.33 8864 3.09 500 1.13 0.33 8868 0.73 240 0.28 0.34 8869 1.95 375 0.73 0.34
8871 0.21 183 0.08 0.34 8901 0.69 236 0.24 0.30 9012 3.68 565 1.28 0.30 9014 6.97 900 2.56 0.33 9015 7.07 900 2.59 0.33
* Refer to the Footnotes Page for additional information on this class code.
© Copyright 2015 National Council on Compensation Insurance, Inc. All Rights Reserved.
Page 38 of 44

WORKERS COMPENSATION AND EMPLOYERS LIABILITY IOWAExhibit VPage S5
Effective January 1, 2016APPLICABLE TO ASSIGNED RISK POLICIES ONLY
FOOTNOTES
a Rate for each individual risk must be obtained by NCCI Customer Service or the Rating Organizationhaving jurisdiction.
A Minimum Premium $100 per ginning location for policy minimum premium computation.
D Rate for classification already includes the specific disease loading shown in the table below. See Basic Manual Rule 3-A-7.
Code No.Disease Loading Symbol Code No.
Disease Loading Symbol Code No.
Disease Loading Symbol
0059D 0.79 S 1710D 0.12 S 3175D 0.12 S0065D 0.20 S 1741D 1.44 S 4024D 0.05 S0066D 0.20 S 1803D 0.59 S 5508D 0.17 S0067D 0.20 S 1852D 0.73 Asb 6251D 0.09 S1164D 0.16 S 3081D 0.21 S 6252D 0.07 S1165D 0.09 S 3082D 0.09 S 6260D 0.10 S1624D 0.09 S 3085D 0.21 SAsb=Asbestos, S=Silica
F Rate provides for coverage under the United States Longshore and Harbor Workers Compensation Act and itsextensions. Rate includes a provision for USL&HW Assessment.
M Risks are subject to Admiralty Law or Federal Employers Liability Act (FELA). However, the published rate isfor risks that voluntarily purchase standard workers compensation and employers liability coverage. A provisionfor the USL&HW Assessment is included for those classifications under Program II USL Act. For the residual market, coverage under the Federal Employers' Liability Act (FELA) for employees of interstate railroads is not availablefor codes 6702, 6703, 6704, 7151, 7152, 7153, 8734, 8737, 8738, 8805, 8814, and 8815.
N This code is part of a ratable / non-ratable group shown below. The statistical non-ratable code and correspondingrate are applied in addition to the basic classification when determining premium.
Class Code477174057431
P Classification is computed on a per capita basis.
X Refer to special classification phraseology in these pages which is applicable in this state.
* Class Codes with Specific Footnotes
6702 Rate and rating values only appropriate for laying or relaying of tracks or maintenance of way - no work on elevated railroads. Otherwise, assign appropriate construction or erection code rate and elr each x 1.215.
6703 Rate and rating values only appropriate for laying or relaying of tracks or maintenance of way - no work on elevated railroads. Otherwise, assign appropriate construction or erection class rate x 2.506 and elr x 2.369.
6704 Rate and rating values only appropriate for laying or relaying of tracks or maintenance of way - no work onelevated railroads. Otherwise, assign appropriate construction or erection class rate and elr each x 1.35.
74457453
Non-Ratable Element Code
0771
© Copyright 2015 National Council on Compensation Insurance, Inc. All Rights Reserved.
Page 39 of 44
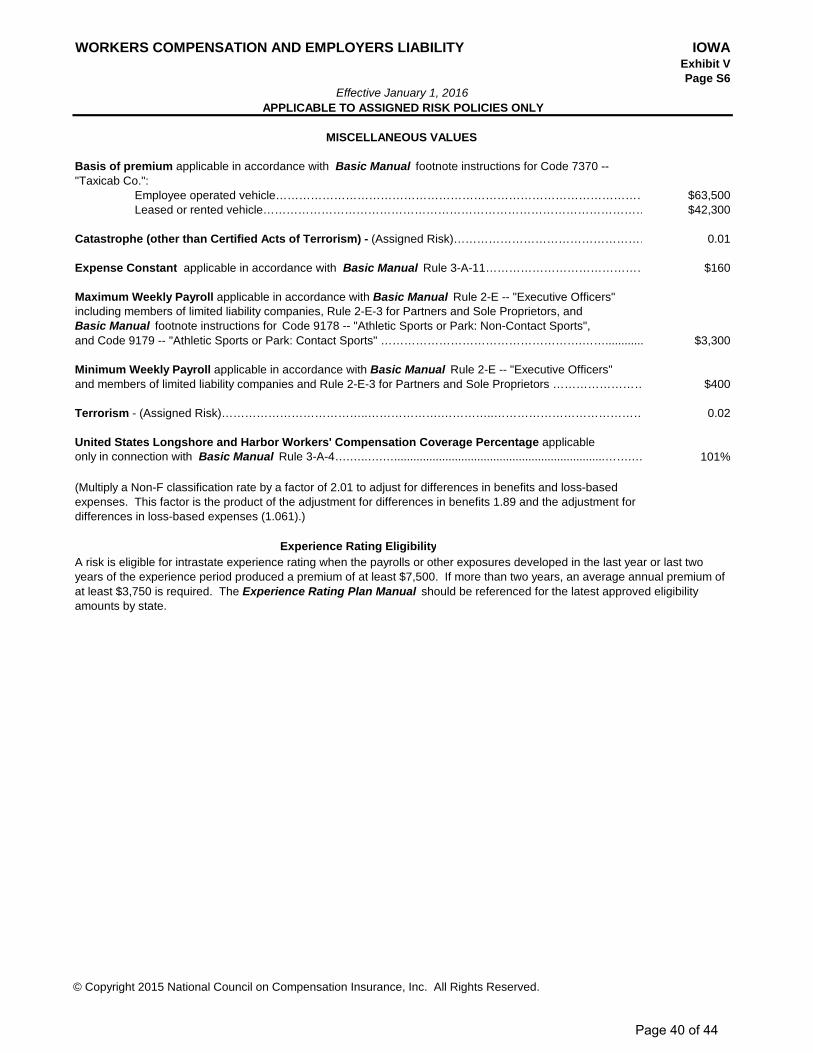
WORKERS COMPENSATION AND EMPLOYERS LIABILITY IOWAExhibit VPage S6
Effective January 1, 2016APPLICABLE TO ASSIGNED RISK POLICIES ONLY
MISCELLANEOUS VALUES
Basis of premium applicable in accordance with Basic Manual footnote instructions for Code 7370 --"Taxicab Co.":
Employee operated vehicle…………………………………………………………………………………… $63,500Leased or rented vehicle……………………………………………………………………………………… $42,300
Catastrophe (other than Certified Acts of Terrorism) - (Assigned Risk)…………………………………………… 0.01
Expense Constant applicable in accordance with Basic Manual Rule 3-A-11…………………………………… $160
Maximum Weekly Payroll applicable in accordance with Basic Manual Rule 2-E -- "Executive Officers"including members of limited liability companies, Rule 2-E-3 for Partners and Sole Proprietors, and Basic Manual footnote instructions for Code 9178 -- "Athletic Sports or Park: Non-Contact Sports",and Code 9179 -- "Athletic Sports or Park: Contact Sports" …………………………………………….……............ $3,300
Minimum Weekly Payroll applicable in accordance with Basic Manual Rule 2-E -- "Executive Officers"and members of limited liability companies and Rule 2-E-3 for Partners and Sole Proprietors …………………… $400
Terrorism - (Assigned Risk)………………………………..……………….…………..………………………………… 0.02
United States Longshore and Harbor Workers' Compensation Coverage Percentage applicableonly in connection with Basic Manual Rule 3-A-4….…..….…..................................................................…….… 101%
Experience Rating EligibilityA risk is eligible for intrastate experience rating when the payrolls or other exposures developed in the last year or last two years of the experience period produced a premium of at least $7,500. If more than two years, an average annual premium of at least $3,750 is required. The Experience Rating Plan Manual should be referenced for the latest approved eligibility amounts by state.
(Multiply a Non-F classification rate by a factor of 2.01 to adjust for differences in benefits and loss-based expenses. This factor is the product of the adjustment for differences in benefits 1.89 and the adjustment for differences in loss-based expenses (1.061).)
© Copyright 2015 National Council on Compensation Insurance, Inc. All Rights Reserved.
Page 40 of 44

IOWA
WORKERS COMPENSATION FILING – JANUARY 1, 2016
NCCI KEY CONTACTS
Christopher T. Bailey State Relations Executive
Regulatory Services Division National Council on Compensation Insurance, Inc. (NCCI)
106 E. College Ave., Suite 900 Tallahassee, FL 32301
Phone (850) 322-4047 Fax (561) 893-5106
Tony DiDonato, FCAS, MAAA Director & Senior Actuary
Actuarial and Economic Services Division National Council on Compensation Insurance, Inc. (NCCI)
901 Peninsula Corporate Circle Boca Raton, FL 33487-1362
Phone (561) 893-3116 Fax (561) 893-5208
All NCCI employees can be contacted via e-mail using the following format:
First Name_Last [email protected]
© Copyright 2015 National Council on Compensation Insurance, Inc. All Rights Reserved.
Page 41 of 44

IOWA
WORKERS COMPENSATION FILING - JANUARY 1, 2016
A M C O INSURANCE COMPANY CINCINNATI INDEMNITY COMPANYACADIA INSURANCE COMPANY CINCINNATI INS COACCIDENT FUND GENERAL INS CO CITIZENS INS CO OF AMERICAACCIDENT FUND INS CO OF AMERICA CLERMONT INS COACCIDENT FUND NATIONAL INS CO COLONIAL AMERICAN CASUALTY & SURETY COACE AMERICAN INSURANCE COMPANY COLUMBIA MUTUAL INSURANCE COACE FIRE UNDERWRITERS INSURANCE COMPANY COLUMBIA NATIONAL INS COACE PROPERTY & CASUALTY INSURANCE COMPANY COMMERCE AND INDUSTRY INS COACIG INS CO COMPANION PROPERTY AND CASUALTY INS COACUITY A MUTUAL INS COMPANY CONSOLIDATED INS COADDISON INSURANCE COMPANY CONTINENTAL CASUALTY COADVANTAGE WC INSURANCE CO CONTINENTAL INDEMNITY COAIG ASSURANCE COMPANY CONTINENTAL INS COAIG PROPERTY CASUALTY COMPANY CONTINENTAL WESTERN INSURANCE COMPANYAIU INSURANCE CO (NATIONAL UNION FIRE OF PITTS PA) CRUM AND FORSTER INDEMNITY COAK NATIONAL INS CO DAKOTA TRUCK UNDERWRITERSALLIED EASTERN IND CO DEERFIELD INS COALLIED INSURANCE COMPANY OF AMERICA DEPOSITORS INS COALLIED PROPERTY AND CASUALTY INS CO DIAMOND INS COALLMERICA FINANCIAL ALLIANCE INS CO DISCOVER PROPERTY & CASUALTY INS COALLMERICA FINANCIAL BENEFIT INS CO DONEGAL MUTUAL INS COAMERICAN ALTERNATIVE INSURANCE CORPORATION EASTERN ADVANTAGE ASSURANCE COMPANYAMERICAN AUTOMOBILE INSURANCE CO EASTERN ALLIANCE INSURANCE COMPANYAMERICAN BUSINESS AND MERCANTILE INS MUTUAL INC EASTGUARD INS COAMERICAN CASUALTY COMPANY OF READING P A ELECTRIC INS COAMERICAN COMPENSATION INS CO EMC PROPERTY & CASUALTY COMPANYAMERICAN ECONOMY INS CO EMCASCO INS COAMERICAN FAMILY HOME INS CO EMPLOYERS ASSURANCE COMPANYAMERICAN FAMILY INS CO EMPLOYERS INS CO OF WAUSAUAMERICAN FAMILY MUTUAL INSURANCE CO EMPLOYERS MUTUAL CASUALTY COAMERICAN FIRE AND CASUALTY CO EMPLOYERS PREFERRED INS COAMERICAN GUARANTEE AND LIABILITY INS CO EVEREST NATIONAL INS COAMERICAN HOME ASSUR CO-NATIONAL UNION FIRE OF PIT EVEREST REINSURANCE CO DIRECTAMERICAN INS CO EXECUTIVE RISK INDEMNITY INCAMERICAN INTERSTATE INS CO EXPLORER INS COAMERICAN MINING INS CO FALLS LAKE NATIONAL INSURANCE COAMERICAN MODERN HOME INS CO FARM BUREAU PROPERTY CASUALTY INS COAMERICAN NATIONAL PROPERTY AND CASUALTY CO FARMERS INSURANCE EXCHANGEAMERICAN SELECT INS CO FARMINGTON CASUALTY COMPANYAMERICAN STATES INS CO A SAFECO COMPANY FARMLAND MUTUAL INSURANCE COMPANYAMERICAN ZURICH INS CO FEDERAL INSURANCE COMPANYAMERISURE INS CO FEDERATED MUTUAL INS COAMERISURE MUTUAL INS CO FEDERATED RURAL ELECTRIC INS EXCHANGEAMERISURE PARTNERS INS CO FEDERATED SERVICE INS COAMGUARD INS CO FIDELITY & DEPOSIT COMPANY OF MARYLANDAMTRUST INSURANCE CO OF KS INC FIDELITY & GUARANTY INS UNDERWRITERSARCH INSURANCE COMPANY FIDELITY & GUARANTY INSURANCE COARGONAUT GREAT CENTRAL INS CO FIREMANS FUND INSURANCE COARGONAUT INS CO FIREMENS INS CO OF WASHINGTON DCARGONAUT MIDWEST INS CO FIRST DAKOTA INDEMNITY COASSOCIATED INDEMNITY CORP FIRST LIBERTY INS CORPATLANTIC SPECIALTY INS CO (ONEBEACON) FIRST NATIONAL INS CO OF AMERICAATLANTIC STATES INS CO FIRSTCOMP INSURANCE COAUSTIN MUTUAL INSURANCE COMPANY FLORISTS MUTUAL INSURANCE COAUTO OWNERS INS CO FOREMOST INS CO GRAND RAPIDS MICHIGANBADGER MUTUAL INS CO FOREMOST PROPERTY & CAS INSBANKERS STANDARD FIRE AND MARINE CO FOREMOST SIGNATURE INS COBANKERS STANDARD INS CO FRANK WINSTON CRUM INSURANCE COBEARING MIDWEST CAUSALTY COMPANY GENERAL CASUALTY COMPANY OF WISCONSINBENCHMARK INSURANCE COMPANY GENERAL CASUALTY INSURANCE COMPANYBERKLEY NATIONAL INSURANCE COMPANY GENERAL INS CO OF AMERICABERKLEY REGIONAL INS CO GENESIS INS COBERKSHIRE HATHAWAY DIRECT INSURANCE COMPANY GRANITE STATE INSURANCE COMPANYBERKSHIRE HATHAWAY HOMESTATE INS CO GRAPHIC ARTS MUTUAL INS COBITCO GENERAL INSURANCE CORPORATION GREAT AMERICAN ALLIANCE INS COBITCO NATIONAL INSURANCE COMPANY GREAT AMERICAN ASSURANCE COMPANYBRICKSTREET MUTUAL INS CO GREAT AMERICAN INS CO OF NYBROTHERHOOD MUTUAL INS CO GREAT AMERICAN INSURANCE COMPANYCALIFORNIA INSURANCE COMPANY GREAT AMERICAN SPIRIT INS COCAPITOL INDEMNITY CORP GREAT DIVIDE INSURANCE COMPANYCAROLINA CASUALTY INS CO GREAT MIDWEST INS COCHARTER OAK FIRE INS CO GREAT NORTHERN INS COCHEROKEE INS CO GREAT WEST CASUALTY COMPANYCHUBB INDEMNITY INS CO GREATER NY MUTUAL INS COCHUBB NATIONAL INS CO GREENWICH INS COCHURCH MUTUAL INS CO GRINNELL MUTUAL REINSURANCE COCINCINNATI CASUALTY COMPANY GRINNELL SELECT INS CO
AFFILIATES LIST FOR IOWA
Page 42 of 44
© Copyright 2015 National Council on Compensation Insurance, Inc. All Rights Reserved.

IOWA
WORKERS COMPENSATION FILING - JANUARY 1, 2016
GUIDEONE ELITE INS CO NORGUARD INS COGUIDEONE MUTUAL INS CO NORTH AMERICAN ELITE INSURANCE COHAMILTON MUTUAL INS CO NORTH AMERICAN SPECIALTY INS COHANOVER AMERICAN INS CO NORTH POINTE INS COHANOVER INS CO NORTH RIVER INS COHARLEYSVILLE INSURANCE COMPANY NORTHSTONE INSURANCE COMPANYHARLEYSVILLE LAKE STATES INSURANCE COMPANY NOVA CASUALTY COMPANYHARLEYSVILLE PREFERRED INSURANCE CO OAK RIVER INSURANCE COMPANYHARLEYSVILLE WORCESTER INSURANCE CO OBI NATIONAL INSURANCE COMPANYHARTFORD ACCIDENT AND INDEMNITY CO OH CASUALTY INS COHARTFORD CASUALTY INS CO OH FARMERS INS COHARTFORD FIRE INSURANCE CO OHIO SECURITY INS COHARTFORD INS CO OF IL OLD REPUBLIC GENERAL INSURANCE CORPORATIONHARTFORD INS CO OF MIDWEST OLD REPUBLIC INS COHARTFORD INS CO OF THE SOUTHEAST OWNERS INSURANCE COMPANYHARTFORD UNDERWRITERS INS CO PA MANUFACTURERS ASSN INS COHASTINGS MUTUAL INS CO PA MANUFACTURERS INDEMNITY COHAWKEYE-SECURITY INS CO PACIFIC EMPLOYERS INS COHDI GERLING AMERICA INSURANCE COMPANY PACIFIC INDEMNITY COIA AMERICAN INS CO PACIFIC INS CO LTDIA LONG TERM CARE RISK MGMT ASSN PARTNERS MUTUAL INS COIA MUTUAL INS CO PATRONS MUTUAL INS CO OF CTIL EMCASCO INS CO PEERLESS INDEMNITY INS COILLINOIS CASUALTY COMPANY PEERLESS INSURANCE COMPANYILLINOIS INSURANCE COMPANY PEKIN INS COILLINOIS NATIONAL INSURANCE COMPANY PENN MILLERS INS COIMPERIUM INSURANCE COMPANY PENNSYLVANIA INSURANCE COMPANYIMT INS CO PETROLEUM CASUALTY COINDEMNITY INS CO OF N AMERICA (INA INS) (CT GEN) PHARMACISTS MUTUAL INS COINDIANA INSURANCE COMPANY PHOENIX INS COINS CO OF NORTH AMERICA PINNACLEPOINT INSURANCE COMPANYINS CO OF THE STATE PA PIONEER SPECIALTY INSURANCE COMPANYINS CO OF THE WEST PLAZA INSURANCE COINTEGRITY MUTUAL INS CO PRAETORIAN INSURANCE COMPANYINTEGRITY PROPERTY & CASUALTY INS CO PREFERRED PROFESSIONAL INSURANCE COMPANYLAFAYETTE INS CO PREVISOR INSURANCE COMPANYLE MARS INS CO PROPERTY AND CASUALTY INS CO OF HARTFORDLIBERTY INS CORP PROTECTIVE INS COLIBERTY INSURANCE UNDERWRITERS INC QBE INSURANCE CORPORATIONLIBERTY MUTUAL FIRE INS CO REDWOOD FIRE & CASUALTY INS COLIBERTY MUTUAL INS CO REGENT INSURANCE COMPANYLM INS CORP REPUBLIC INDEMNITY COMPANY OF AMERICAMA BAY INS CO RIVERPORT INSURANCE COMPANYMANUFACTURERS ALLIANCE INS CO RLI INSURANCE COMPANYMARKEL AMERICAN INSURANCE CO ROCKWOOD CASUALTY INS COMARKEL INSURANCE CO SAFECO INS CO OF AMERICAMEMIC INDEMNITY CO SAFETY FIRST INS COMERIDIAN SECURITY INSURANCE COMPANY SAFETY NATIONAL CASUALTY CORPMHA INSURANCE COMPANY SAGAMORE INSURANCE COMID CENTURY INS CO SAMSUNG FIRE AND MARINE INS CO LTD USBMIDDLESEX INS CO SECURA INSURANCE A MUTUAL COMIDWEST BUILDERS CASUALTY MUTUAL COMPANY SECURA SUPREME INS COMIDWEST EMPLOYERS CASUALTY CO SECURITY NATIONAL INS CO (AMTRUST GROUP)MIDWEST FAMILY MUTUAL INS CO SELECTIVE INS CO OF SCMIDWEST INS CO SELECTIVE INS CO OF THE SOUTHEASTMIDWESTERN INDEMNITY CO SELECTIVE INSURANCE COMPANY OF AMERICAMILBANK INSURANCE COMPANY SELECTIVE WAY INS COMILWAUKEE CASUALTY INSURANCE CO (AMTRUST GROUP) SENECA INSURANCE COMITSUI SUMITOMO INS CO OF AMERICA SENTINEL INS COMITSUI SUMITOMO INS USA INC SENTRY CASUALTY COMOTORISTS COMMERCIAL MUTUAL INSURANCE COMPANY SENTRY INSURANCE A MUTUAL CONATIONAL AMERICAN INS CO SENTRY SELECT INSURANCE COMPANYNATIONAL CASUALTY CO SEQUOIA INSURANCE CONATIONAL FIRE INS CO OF HARTFORD SFM MUTUAL INS CONATIONAL INTERSTATE INS CO SFM SELECT INSURANCE COMPANYNATIONAL LIABILITY & FIRE INSURANCE CO SOCIETY INSURANCE A MUTUAL COMPANYNATIONAL SURETY CORP SOMPO JAPAN INSURANCE CO OF AMERICANATIONAL UNION FIRE INS CO OF PITTSBURG PA SOUTHERN INS CONATIONWIDE AGRIBUSINESS INS CO ST PAUL FIRE AND MARINE INS CONATIONWIDE MUTUAL FIRE INS CO ST PAUL GUARDIAN INS CONATIONWIDE MUTUAL INS CO ST PAUL MERCURY INS CONETHERLANDS INSURANCE COMPANY ST PAUL PROTECTIVE INS CONEW HAMPSHIRE INSURANCE COMPANY STANDARD FIRE INSURANCE COMPANYNEW YORK MARINE AND GENERAL INSURANCE CO STAR INS CO
Page 43 of 44
© Copyright 2015 National Council on Compensation Insurance, Inc. All Rights Reserved.

IOWA
WORKERS COMPENSATION FILING - JANUARY 1, 2016
STARNET INSURANCE COMPANYSTARR INDEMNITY AND LIABILITY COSTATE AUTO PROPERTY AND CASUALTY INS COSTATE AUTOMOBILE MUTUAL INS COSTATE FARM FIRE AND CASUALTY COSTATE NATIONAL INSURANCE COMPANYSTONINGTON INS COSUMMITPOINT INSURANCE COMPANYT H E INSURANCE COMPANYTECHNOLOGY INSURANCE COTHE TRAVELERS CASUALTY COMPANYTNUS INSURANCE COTOKIO MARINE AMERICA INSURANCE COTORUS NATIONAL INSURANCE COMPANYTRANS PACIFIC INS COTRANSGUARD INS CO OF AMERICA INCTRANSPORTATION INS COTRAVELERS CASUALTY AND SURETY COTRAVELERS CASUALTY INS CO OF AMERICATRAVELERS INDEMNITY COTRAVELERS INDEMNITY CO OF AMERICATRAVELERS INDEMNITY CO OF CTTRAVELERS INSURANCE COTRAVELERS PROPERTY CASUALTY CO OF AMERICATRI STATE INSURANCE COMPANY OF MINNESOTATRIANGLE INSURANCE COMPANY INCTRIUMPHE CASUALTY COMPANYTRUCK INSURANCE EXCHANGETRUMBULL INS COTWIN CITY FIRE INS COUNION INS CO OF PROVIDENCEUNION INSURANCE COMPANYUNITED FIRE AND CASUALTY COUNITED STATES FIDELITY AND GUARANTY COUNITED WI INS COUS FIRE INS COUTICA MUTUAL INS COVALLEY FORGE INS COVANLINER INS COVIGILANT INS COWADENA INSURANCE COMPANYWAUSAU UNDERWRITERS INSURANCE COMPANYWESCO INSURANCE COMPANY (AMTRUST GROUP)WEST AMERICAN INS COWEST BEND MUTUAL INS COWESTCHESTER FIRE INSURANCE COMPANYWESTERN AGRICULTURAL INS COWESTERN NATIONAL ASSURANCE COWESTERN NATIONAL MUTUAL INS COWESTFIELD INS COWESTFIELD NATIONAL INS COWESTPORT INSURANCE CORPORATIONWILLIAMSBURG NATIONAL INS COWORK FIRST CASUALTY COXL INS CO OF NY INCXL INSURANCE AMERICA INCXL SPECIALTY INS COZENITH INS COZNAT INS COZURICH AMERICAN INS COZURICH AMERICAN INS CO OF IL
Page 44 of 44
© Copyright 2015 National Council on Compensation Insurance, Inc. All Rights Reserved.
Related Documents