1 Min Jung Kang URP 2009 0601 Report 1 (pBQ) I. Sample Calculations for p-Benzoquinone (pBQ) and Amino Acid (Lysine) 1. pBQ (FW= 108.09g/mol) - Calculate the concentration of pBQ stock solution with 0.01g of pBQ powder using a 2 mL (=0.002L) volumetric flask. g L mol g L mol 01 . 0 1 002 . 0 09 . 108 0463 . 0 of pBQ - Calculate the volume of pBQ stock solution needed to make a diluted pBQ solution (0.05mM) using a 1 mL quartz cuvette. 2 2 1 1 V M V M 1 2 2 1 M V M V L mL L mM mL mM M V M V 08 . 1 1 1000 ) 3 . 46 ( ) 1 )( 05 . 0 ( 1 2 2 1 of pBQ stock solution (46.3 mM) 2. Amino acid: Lysine (FW=182.6 g/mol) - Calculate the concentration of lysine stock solution with 0.1g of lysine powder using a 10 mL (=0.010 L) volumetric flask. g L mol g L mol 1 . 0 1 01 . 0 6 . 182 055 . 0 of lysine - Calculate the volume of lysine stock solution needed to make a diluted lysine solution (20mM) using a 1 mL quartz cuvette. 2 2 1 1 V M V M 1 2 2 1 M V M V L mL L mM mL mM M V M V 6 . 363 1 1000 ) 55 ( ) 1 )( 20 ( 1 2 2 1 of lysine stock solution (55 mM) M1 = Molarity of stock solution = 46.3 mM V1 = Volume of stock solution = X mL M2 = Molarity of diluted solution = 0.05 mM V2 = Volume of diluted solution = 1mL (cuvette) M1 = Molarity of stock solution = 55 mM V1 = Volume of stock solution = X mL M2 = Molarity of diluted solution = 20 mM V2 = Volume of diluted solution = 1mL (cuvette)

Welcome message from author
This document is posted to help you gain knowledge. Please leave a comment to let me know what you think about it! Share it to your friends and learn new things together.
Transcript

1
Min Jung Kang URP 2009 0601 Report 1 (pBQ)
I. Sample Calculations for p-Benzoquinone (pBQ) and Amino Acid (Lysine)
1. pBQ (FW= 108.09g/mol) - Calculate the concentration of pBQ stock solution with 0.01g of pBQ powder using a 2 mL
(=0.002L) volumetric flask.
gL
mol
g
L
mol01.0
1
002.009.1080463.0
of pBQ
- Calculate the volume of pBQ stock solution needed to make a diluted pBQ solution (0.05mM)
using a 1 mL quartz cuvette.
2211 VMVM 1
221 M
VMV
LmL
L
mM
mLmM
M
VMV
08.11
1000
)3.46(
)1)(05.0(
1
221
of pBQ stock solution (46.3 mM)
2. Amino acid: Lysine (FW=182.6 g/mol)
- Calculate the concentration of lysine stock solution with 0.1g of lysine powder using a 10 mL (=0.010 L) volumetric flask.
gL
mol
g
L
mol1.0
1
01.06.182055.0
of lysine
- Calculate the volume of lysine stock solution needed to make a diluted lysine solution (20mM)
using a 1 mL quartz cuvette.
2211 VMVM 1
221 M
VMV
LmL
L
mM
mLmM
M
VMV
6.3631
1000
)55(
)1)(20(
1
221
of lysine stock solution (55 mM)
M1 = Molarity of stock solution = 46.3 mM V1 = Volume of stock solution = X mL M2 = Molarity of diluted solution = 0.05 mM V2 = Volume of diluted solution = 1mL (cuvette)
M1 = Molarity of stock solution = 55 mM V1 = Volume of stock solution = X mL M2 = Molarity of diluted solution = 20 mM V2 = Volume of diluted solution = 1mL (cuvette)
2
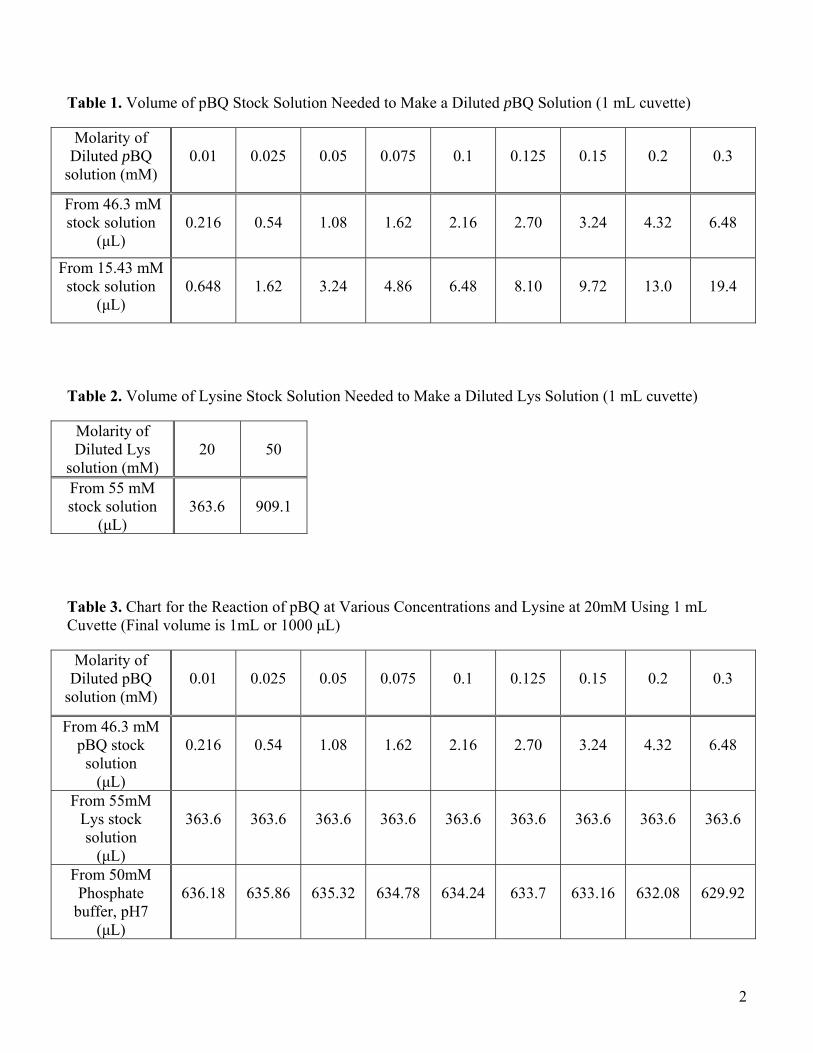
Table 1. Volume of pBQ Stock Solution Needed to Make a Diluted pBQ Solution (1 mL cuvette)
Molarity of Diluted pBQ
solution (mM)
0.01
0.025
0.05
0.075
0.1
0.125
0.15
0.2
0.3
From 46.3 mM stock solution
(μL)
0.216
0.54
1.08
1.62
2.16
2.70
3.24
4.32
6.48
From 15.43 mM stock solution
(μL)
0.648
1.62
3.24
4.86
6.48
8.10
9.72
13.0
19.4
Table 2. Volume of Lysine Stock Solution Needed to Make a Diluted Lys Solution (1 mL cuvette)
Molarity of Diluted Lys
solution (mM)
20
50
From 55 mM stock solution
(μL)
363.6
909.1
Table 3. Chart for the Reaction of pBQ at Various Concentrations and Lysine at 20mM Using 1 mL Cuvette (Final volume is 1mL or 1000 μL)
Molarity of Diluted pBQ
solution (mM)
0.01
0.025
0.05
0.075
0.1
0.125
0.15
0.2
0.3
From 46.3 mM pBQ stock
solution (μL)
0.216
0.54
1.08
1.62
2.16
2.70
3.24
4.32
6.48
From 55mM Lys stock solution
(μL)
363.6
363.6
363.6
363.6
363.6
363.6
363.6
363.6
363.6
From 50mM Phosphate
buffer, pH7 (μL)
636.18
635.86
635.32
634.78
634.24
633.7
633.16
632.08
629.92

3
II. Instructions for Preparation of pBQ Stock Solution
1. Before transferring pBQ from the bottle to the balance, spray the weigh paper and spatula with the anti-static gun.
2. Weigh out approximately 10mg (0.01g) of pBQ powder to make 46.3 mM of pBQ stock solution
and transfer it into a 2 mL volumetric flask. 3. Rinse the mouth of the volumetric flask with 50mM phosphate buffer, pH 7, using a disposable
pipette. 4. Bring the solution to volume using the same phosphate buffer. 5. Place the cap on the flask and wrap the mouth of the flask with parafilm wax paper. 6. Shake well and place the volumetric flask in the sonicator for 10 minutes. 7. After 10 minutes has passed, remove the flask from the sonicator and place on ice until the
solution is needed. 8. Since pBQ is very reactive, fresh pBQ solution should be prepared.
III. Instructions for Preparation of pBQ and Amino Acid Samples Using Shimadzu UV/Vis
Spectrometer
1. Shimadzu UV/Vis spectrometer should be turned on and heated to 37°C at least 10 minutes before using it.
2. Perform autozero and baseline correction with the reference cell containing 50 mM phosphate
buffer, pH 7. 3. While sonicating pBQ stock solution for 10 minutes, prepare the quartz cuvettes with amino acid
and 50 mM phosphate buffer, pH 7. 4. Place the cuvettes in the sample holder of the spectrometer for 10 minutes to be equilibrated to
37°C before adding pBQ solution. 5. Prepare the timer and measure the time it takes to pipette aliquot of pBQ stock solution.
Measured time is going to be used when absorbance data is processed based on the corrected time. 6. Scan each cuvette. If each sample is triplicated, scan three samples at once since pBQ is less
reactive than ClpBQ. The reaction of ClpBQ is much quicker, so each cuvette should be scanned separately or individually.

4
IV. Kinetics Rule for pBQ and Amino Acid Reaction
1. If the samples are triplicated, scan three samples at once and correct the time.
2. Scan time interval is one fifth times of half-life time
2
15
1t .
3. Scan time interval for the pBQ control is 2 times of half-life time (2 x t1/2). 4. It takes approximately 1 minute to pipette pBQ solution into three cuvettes and place them in the
cell holder. It also takes 35 seconds for Shimadzu UV/Vis spectrometer to scan one cell. Thus, add 1 minute and 35 seconds (95sec) for the corrected time of the first cell, 1 minute and 70 seconds (130sec) for the second cell and 1 minute and 105 seconds (165 sec).
5. Half-life time (t1/2) is determined by selecting reactant λmax (=246nm) and first five data points.
Generate a plot of absorbance at 246nm vs. corrected time. Find the equation of line and calculate t1/2. Consider y-intercept as an initial absorbance. t1/2 is the time when half of initial absorbance (y-intercept) is being measured.
6. Scan the sample continually up to 4 times of half-life time (4 x t1/2) so that you have at least 5
data points to generate the rate constant. 7. A∞ can be detected when the sample is scanned at ten times of half-life time (10 x t1/2). 8. Use kinetic equation to find the rate constant.
ktAA
AA t
0
ln , where
9. Select the data generated within t1/2. Plot
0
lnAA
AA t vs. time. In other words, maximum range
of x-axis is one times of half-life time (1 x t1/2). 10. Find the equation of the line, and the slope is the rate constant.
*** Shimadzu UV/Vis Spectrometer Trouble Shooting ***
Perform autozero and baseline correction whenever software (UVProbe) is reopened. To delete UV/Vis spectra, perform right click on the spectra, select “Legend” and unmark
unnecessary spectra.
To delete unnecessary UV/Vis absorbance, perform right click on the absorbance table, select “Select All” and select “Hide” by performing right click.
A∞ : Absorbance at the time infinity At : Absorbance at time t A0 : Initial absorbance t : Reaction time k : Pseudo first order rate constant

5
V. Experimental Results and Discussion V-1. Standardization of pBQ Objective: To determine in which range of concentration of pBQ fits best to find out the rate
constant. Method: Initial absorbance at 246nm was recorded at different concentration of pBQ solution.
The samples were duplicated and the spectrum was scanned from 700 to 200nm by Shimadzu UV/Vis spectrometer. A plot of absorbance at 246nm vs. concentration of pBQ was generated to see the linear portion desirable to give the best accuracy and precision.
Table 4. Absorbance at 246nm measured by UV/Vis spectrometer at different concentrations of pBQ
Figure 1. Standardization of pBQ Using UV/Vis Spectrometer (File: MJK1-55-1)
Standardization of pBQ using UV/Vis spectrometer
0
0.5
1
1.5
2
2.5
3
3.5
0 0.1 0.2 0.3 0.4 0.5
[pBQ] (mM)
Ab
so
rba
nc
e a
t 2
46
nm
Conclusion: The concentration of pBQ should be selected in the range of less than 0.15mM of
pBQ to determine the rate constant of the reaction of pBQ with amino acid.
[pBQ](mM) Absorbance 0.01 0.025 0.05 0.075 0.1 0.125 0.15 0.2 0.25 0.35 0.4 0.5
246nm (cell1) 0.434 0.711 1.233 1.695 2.214 2.482 2.783 2.817 2.799 2.834 2.767 2.872
246nm (cell2) 0.363 0.692 1.2 1.702 2.094 2.408 2.696 2.767 2.767 2.767 2.834 2.799
Average 0.399 0.702 1.217 1.699 2.154 2.445 2.740 2.792 2.783 2.801 2.801 2.836

6
V-2. pBQ Control at different concentrations Objective: To determine the stability or absorbance change of pBQ in 50mM phosphate buffer,
pH7 in time dependent manner. Method: Each sample was triplicated and the spectrum was scanned from 700 to 200nm for 10
times of half-life (10 x t1/2) by Shimadzu UV/Vis spectrometer. Scan time interval was 2 times of half-life (2 x t1/2). A plot of absorbance at 246nm vs. time was generated. Only representative UV/Vis spectra were selected in this report.
Table 5. UV/Vis Spectral Change of pBQ Control at Different Concentrations
UV/Vis Spectral Change of 0.01 mM of pBQ Control
Cell3: Control- [pBQ]=0.01mM
0
0.05
0.1
0.15
0.2
0.25
200 300 400 500 600 700
Wavelength (nm)
Ab
sorb
ance
File: MJK1-72-1
Cell3: Control- [pBQ]=0.01mM
0.222
0.224
0.226
0.228
0.23
0.232
0.234
0 50 100 150
Time (min)
Ab
sorb
ance
at
246n
m ∆A=0.233-0.223=0.01
File: MJK1-72-1
UV/Vis Spectral Change of 0.025 mM of pBQ Control
Cell1: Control- [pBQ]=0.025mM
00.10.20.30.40.50.60.70.80.9
1
200 300 400 500 600 700
Wavelength (nm)
Ab
sorb
ance
File: MJK1-71-1-0.025
Cell1: Control- [pBQ]=0.025mM
0.865
0.87
0.875
0.88
0.885
0.89
0.895
0.9
0 50 100 150
Time (min)
Ab
sorb
ance
at
246n
m
∆A=0.897-0.871=0.026
File: MJK1-71-0.025

7
UV/Vis Spectral Change of 0.05 mM of pBQ Control
Cell2: Control- [pBQ]=0.05mM
0
0.1
0.2
0.3
0.4
0.5
0.6
0.7
0.8
200 300 400 500 600 700
Wavelength (nm)
Ab
sorb
ance
File: K-MJK1-48-1
Cell2: Control- [pBQ]=0.05mM
0.714
0.716
0.718
0.72
0.722
0.724
0.726
0.728
0.73
0.732
0 50 100
Time (min)
Ab
sorb
ance
at
246n
m
∆A=0.731-0.715= 0.016
File: K-MJK1-48-1
UV/Vis Spectral Change of 0.075 mM of pBQ Control
Cell2: Control- [pBQ]=0.075mM
00.20.40.60.8
11.21.41.61.8
2
200 300 400 500 600 700
Wavelength (nm)
Ab
sorb
ance
File: MJK1-71-2-0.075
Cell2: Control- [pBQ]=0.075mM
1.8151.82
1.8251.83
1.8351.84
1.8451.85
1.8551.86
1.8651.87
0 50 100 150
Time (min)
Ab
sorb
ance
at
246n
m
∆A=1.866-1.822= 0.044
File: MJK1-71-2-0.075
UV/Vis Spectral Change of 0.01 mM of pBQ Control
Cell2: Control- [pBQ]=0.10mM
0
0.5
1
1.5
2
2.5
200 300 400 500 600 700
Wavelength (nm)
Ab
sorb
ance
File: K-MJK1-48-2
Cell2: Control- [pBQ]=0.10mM
2.142.162.182.2
2.222.242.262.282.3
2.322.342.36
0 50 100 150
Time (min)
Ab
sorb
ance
at
246n
m
∆A=2.334-2.157=0.177
File: K-MJK1-48-2

8
V-3. Reaction of 0.01mM of pBQ and 20mM of Lysine Objective: To determine half-life time and the rate constant. Method: Each sample was triplicated and the spectrum was scanned from 700 to 200nm for 10
times of half-life (10 x t1/2) by Shimadzu UV/Vis spectrometer. Scan time interval was one fifth times of half-life (1/5 x t1/2). A plot of absorbance at 246nm vs. time was generated. Only representative UV/Vis spectra were selected in this report.
Table 6. Results of Reaction of [pBQ]=0.01mM, [Lys]=20mM Using UV/Vis Spectrometer
Time Elapsed UV/Vis Spectral Change Time-Dependent Absorbance Change at 246nm
Cell1: [pBQ]=0.01mM, [Lys]=20mM
00.2
0.40.60.8
11.21.41.6
1.82
200 300 400 500 600 700
Wavelength (nm)
Ab
sorb
ance
File: MJK1-58-1
Cell1: [pBQ]=0.01mM, [Lys]=20mM
0
0.05
0.1
0.15
0.2
0.25
0.3
0.35
0 50 100 150
Corrected Time (min)
Ab
sorb
ance
at
246n
m
File: K-MJK1-58-1
Half-life Time (t1/2): 11.2min Rate Constant (k): 0.0892min-1
Cell1: [pBQ]=0.01mM, [Lys]=20mMHalf-life time (t1/2): 11.2min
y = -0.0143x + 0.3211
R2 = 0.9981
0
0.05
0.1
0.15
0.2
0.25
0.3
0.35
0 5 10 15
Corrected Time (min)
Ab
sorb
ance
at
246n
m
File: K-MJK1-58-1
Cell1: [pBQ]=0.01mM, [Lys]=20mMHalf-life time (t1/2): 11.2min
y = -0.0892x + 0.2015
R2 = 0.9828
-1.2
-1
-0.8
-0.6
-0.4
-0.2
0
0.2
0 5 10 15
Corrected Time (min)
Ln
((A
f-A
t)/(
Af-
Ai)
)
File: K-MJK1-58-1
9
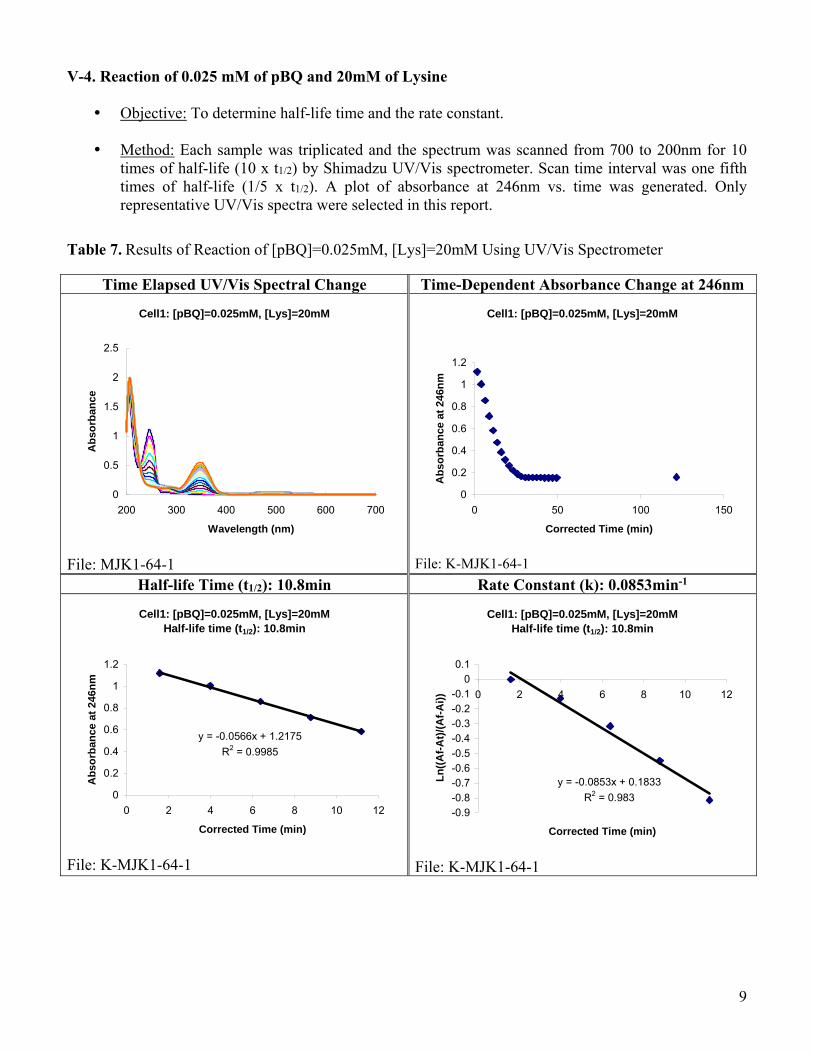
V-4. Reaction of 0.025 mM of pBQ and 20mM of Lysine Objective: To determine half-life time and the rate constant. Method: Each sample was triplicated and the spectrum was scanned from 700 to 200nm for 10
times of half-life (10 x t1/2) by Shimadzu UV/Vis spectrometer. Scan time interval was one fifth times of half-life (1/5 x t1/2). A plot of absorbance at 246nm vs. time was generated. Only representative UV/Vis spectra were selected in this report.
Table 7. Results of Reaction of [pBQ]=0.025mM, [Lys]=20mM Using UV/Vis Spectrometer
Time Elapsed UV/Vis Spectral Change Time-Dependent Absorbance Change at 246nm
Cell1: [pBQ]=0.025mM, [Lys]=20mM
0
0.5
1
1.5
2
2.5
200 300 400 500 600 700
Wavelength (nm)
Ab
sorb
ance
File: MJK1-64-1
Cell1: [pBQ]=0.025mM, [Lys]=20mM
0
0.2
0.4
0.6
0.8
1
1.2
0 50 100 150
Corrected Time (min)
Ab
sorb
ance
at
246n
m
File: K-MJK1-64-1
Half-life Time (t1/2): 10.8min Rate Constant (k): 0.0853min-1
Cell1: [pBQ]=0.025mM, [Lys]=20mMHalf-life time (t1/2): 10.8min
y = -0.0566x + 1.2175
R2 = 0.9985
0
0.2
0.4
0.6
0.8
1
1.2
0 2 4 6 8 10 12
Corrected Time (min)
Ab
sorb
ance
at
246n
m
File: K-MJK1-64-1
Cell1: [pBQ]=0.025mM, [Lys]=20mMHalf-life time (t1/2): 10.8min
y = -0.0853x + 0.1833
R2 = 0.983
-0.9-0.8-0.7-0.6-0.5
-0.4-0.3-0.2-0.1
00.1
0 2 4 6 8 10 12
Corrected Time (min)
Ln
((A
f-A
t)/(
Af-
Ai)
)
File: K-MJK1-64-1

10
V-5. Reaction of 0.05 mM of pBQ and 20mM of Lysine Objective: To determine half-life time and the rate constant. Method: Each sample was triplicated and the spectrum was scanned from 700 to 200nm for 10
times of half-life (10 x t1/2) by Shimadzu UV/Vis spectrometer. Scan time interval was one fifth times of half-life (1/5 x t1/2). A plot of absorbance at 246nm vs. time was generated. Only representative UV/Vis spectra were selected in this report.
Table 8. Results of Reaction of [pBQ]=0.05mM, [Lys]=20mM Using UV/Vis Spectrometer
Time Elapsed UV/Vis Spectral Change Time-Dependent Absorbance Change at 246nm
Cell1: [pBQ]=0.05mM, [Lys]=20mM
0
0.5
1
1.5
2
2.5
200 300 400 500 600 700
Wavelength (nm)
Ab
sorb
ance
File: MJK1-43-1
Cell1: [pBQ]=0.05mM, [Lys]=20mM
0
0.2
0.4
0.6
0.8
1
1.2
1.4
0 50 100 150
Corrected Time (min)
Ab
sorb
ance
at
246n
m
File: KK-MJK1-43-1
Half-life Time (t1/2): 10.5 min Rate Constant (k): 0.0809 min-1
Cell1: [pBQ]=0.05mM, [Lys]=20mM
Half-life time (t1/2): 10.5min
y = -0.0643x + 1.3541R2 = 0.9972
0
0.2
0.4
0.6
0.8
1
1.2
1.4
0 5 10 15
Corrected Time (min)
Ab
sorb
ance
at
246n
m
File: KK-MJK1-43-1
Cell1: [pBQ]=0.05mM, [Lys]=20mM
Half-life time (t1/2): 10.5min
y = -0.0809x + 0.1661R2 = 0.984
-0.7
-0.6
-0.5
-0.4
-0.3
-0.2
-0.1
0
0.1
0 5 10 15
Corrected Time (min)
Ln
((A
f-A
t)/(
Af-
Ai)
)
File: KK-MJK1-43-1
11
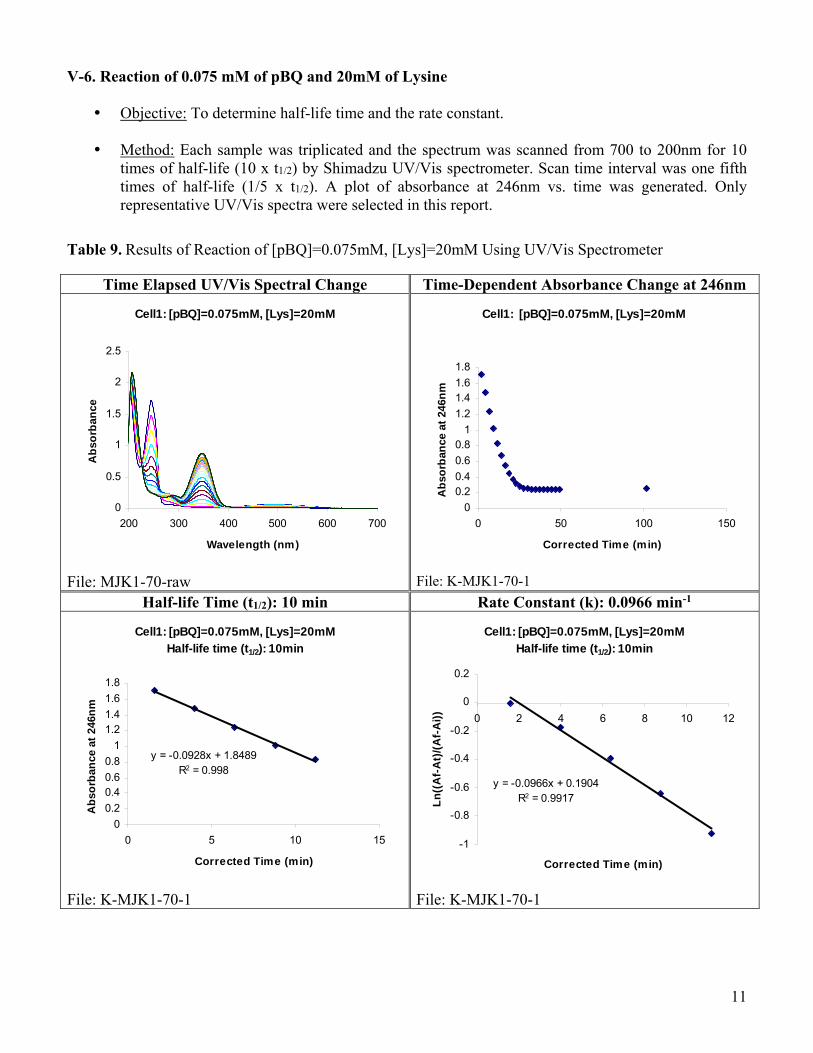
V-6. Reaction of 0.075 mM of pBQ and 20mM of Lysine Objective: To determine half-life time and the rate constant. Method: Each sample was triplicated and the spectrum was scanned from 700 to 200nm for 10
times of half-life (10 x t1/2) by Shimadzu UV/Vis spectrometer. Scan time interval was one fifth times of half-life (1/5 x t1/2). A plot of absorbance at 246nm vs. time was generated. Only representative UV/Vis spectra were selected in this report.
Table 9. Results of Reaction of [pBQ]=0.075mM, [Lys]=20mM Using UV/Vis Spectrometer
Time Elapsed UV/Vis Spectral Change Time-Dependent Absorbance Change at 246nm
Cell1: [pBQ]=0.075mM, [Lys]=20mM
0
0.5
1
1.5
2
2.5
200 300 400 500 600 700
Wavelength (nm)
Ab
sorb
ance
File: MJK1-70-raw
Cell1: [pBQ]=0.075mM, [Lys]=20mM
0
0.20.4
0.6
0.81
1.2
1.41.6
1.8
0 50 100 150
Corrected Time (min)
Ab
sorb
ance
at
246n
m
File: K-MJK1-70-1
Half-life Time (t1/2): 10 min Rate Constant (k): 0.0966 min-1
Cell1: [pBQ]=0.075mM, [Lys]=20mM
Half-life time (t1/2): 10min
y = -0.0928x + 1.8489R2 = 0.998
0
0.2
0.40.6
0.8
1
1.21.4
1.6
1.8
0 5 10 15
Corrected Time (min)
Ab
sorb
ance
at
246n
m
File: K-MJK1-70-1
Cell1: [pBQ]=0.075mM, [Lys]=20mM
Half-life time (t1/2): 10min
y = -0.0966x + 0.1904R2 = 0.9917
-1
-0.8
-0.6
-0.4
-0.2
0
0.2
0 2 4 6 8 10 12
Corrected Time (min)
Ln
((A
f-A
t)/(
Af-
Ai)
)
File: K-MJK1-70-1

12
V-7. Reaction of 0.1 mM of pBQ and 20mM of Lysine Objective: To determine half-life time and the rate constant. Method: Each sample was triplicated and the spectrum was scanned from 700 to 200nm for 10
times of half-life (10 x t1/2) by Shimadzu UV/Vis spectrometer. Scan time interval was one fifth times of half-life (1/5 x t1/2). A plot of absorbance at 246nm vs. time was generated. Only representative UV/Vis spectra were selected in this report.
Table 10. Results of Reaction of [pBQ]=0.1mM, [Lys]=20mM Using UV/Vis Spectrometer
Time Elapsed UV/Vis Spectral Change Time-Dependent Absorbance Change at 246nm
Cell1: [pBQ]=0.1mM, [Lys]=20mM
0
0.5
1
1.5
2
2.5
200 300 400 500 600 700
Wavelength (nm)
Ab
sorb
ance
File: MJK1-45-1
Cell1: [pBQ]=0.1mM, [Lys]=20mM
0
0.5
1
1.5
2
2.5
0 50 100 150
Corrected Time (min)
Ab
sorb
ance
at
246n
m
File: K-MJK1-45-1
Half-life Time (t1/2): 11.2 min Rate Constant (k): 0.0853min-1
Cell1: [pBQ]=0.1mM, [Lys]=20mM
Half-life time (t1/2): 11.2min
y = -0.1131x + 2.5436R2 = 0.997
0
0.5
1
1.5
2
2.5
0 5 10 15
Corrected Time (min)
Ab
sorb
ance
at
246n
m
File: K-MJK1-45-1
Cell1: [pBQ]=0.1mM, [Lys]=20mM
Half-life time (t1/2): 11.2min
y = -0.0878x + 0.2103R2 = 0.9742
-1.2
-1
-0.8
-0.6
-0.4
-0.2
0
0.2
0 5 10 15
Corrected Time (min)
Ln
((A
f-A
t)/(
Af-
Ai)
)
File: K-MJK1-45-1

13
Table 11. Average Rate Constant of pBQ at Different Concentrations and Lys at 20mM Avg. Rate Constant= 0.0915 min-1 Avg. Rate Constant= 0.1022 min-1
Rate Constants of pBQ and 20mM Lys (First data included)
0
0.02
0.04
0.06
0.08
0.1
0.12
0.14
0 0.025 0.05 0.075 0.1 0.125
[pBQ] (mM)
Rat
e C
on
stan
t (m
in)-1
File: pBQ+Lys Table.xls
Rate Constants of pBQ and 20mM Lys(First data excluded)
0
0.02
0.04
0.06
0.08
0.1
0.12
0.14
0 0.025 0.05 0.075 0.1 0.125
[pBQ] (mM)
Rat
e C
on
stan
t (m
in)-1
File: pBQ+Lys Table.xls

14
VI. Not Corrected Time vs. Corrected Time and First Data Included vs. First Data Excluded Objective: To determine how different rate constants and half-life are generated when not
corrected time frame and corrected time frame is used and when first data is included and excluded.
Table 12. Half-life and Rate Constants of pBQ and Lys When First Data is Included
pBQ+Lys First Data Included
Corrected Time Not Corrected Time
0.01mM+20mM Lys t1/2 (min) Rate Constant (min-1) t1/2 (min) Rate Constant (min-1)
Cell1 11.2 0.0892 10.4 0.0892 Cell2 11.2 0.0931 10.1 0.0833 Cell3 11.2 0.0987 9.8 0.0902
avg. 11.2 0.0937 10.1 0.08757 stdev. 2.2E-15 0.0048 0.3 0.00373
0.025mM+20mM Lys t1/2 (min) Rate Constant (min-1) t1/2 (min) Rate Constant (min-1)
Cell1 10.8 0.0853 10 0.0853 Cell2 11 0.0859 9.9 0.0859 Cell3 10.9 0.0923 9.5 0.0923
avg. 10.9 0.0878 9.8 0.08783 stdev. 0.1 0.0039 0.2646 0.00388
0.05mM+20mM Lys t1/2 (min) Rate Constant (min-1) t1/2 (min) Rate Constant (min-1)
Cell1 10.5 0.0809 10.2 0.0809 Cell2 9.6 0.0956 9.6 0.0956 Cell3 12 0.0709 10.2 0.0709
avg. 10.7 0.0825 10 0.08247 stdev. 1.21244 0.0124 0.3464 0.01242
0.075mM+20mM Lys t1/2 (min) Rate Constant (min-1) t1/2 (min) Rate Constant (min-1)
Cell1 10 0.0966 9.2 0.0966 Cell2 10.6 0.0949 9.5 0.0949 Cell3 10.2 0.1048 8.8 0.1048
avg. 10.2667 0.0988 9.1667 0.09877 stdev. 0.30551 0.0053 0.3512 0.00529
0.10mM+20mM Lys t1/2 (min) Rate Constant (min-1) t1/2 (min) Rate Constant (min-1)
Cell1 11.2 0.0878 10.5 0.0878 Cell2 10.8 0.097 9.7 0.097 Cell3 11 0.1002 9.6 0.1002
avg. 11 0.095 9.9333 0.095 stdev. 0.2 0.0064 0.4933 0.00644

15
Table 13. Half-life Time and Rate Constants of pBQ and Lys When First Data is Excluded
Conclusion: The corrected/not corrected time frame did not affect rate constants significantly.
pBQ+Lys First Data Excluded
Corrected Time Not Corrected Time
0.01mM+20mM Lys t1/2 (min) Rate Constant (min-1) t1/2 (min) Rate Constant (min-1)
Cell1 11.1 0.0999 9.9 0.0999 Cell2 11.1 0.104 10 0.0952 Cell3 11.3 0.1085 10.3 0.1013
avg. 11.17 0.1041 10.1 0.0988 stdev. 0.11547 0.0043 0.208167 0.0032
0.025mM+20mM Lys t1/2 (min) Rate Constant (min-1) t1/2 (min) Rate Constant (min-1)
Cell1 10.5 0.0954 9.8 0.0954 Cell2 10.8 0.0962 9.7 0.0962 Cell3 10.8 0.1018 9.5 0.1018
avg. 10.7 0.0978 9.667 0.0978 stdev. 0.173205 0.0035 0.152753 0.0035
0.05mM+20mM Lys t1/2 (min) Rate Constant (min-1) t1/2 (min) Rate Constant (min-1)
Cell1 10.2 0.0904 10.5 0.0904 Cell2 9.6 0.1026 9.6 0.0904 Cell3 10.2 0.0925 12 0.0925
avg. 10 0.0952 10.7 0.0911 stdev. 0.34641 0.0065 1.212436 0.0012
0.075mM+20mM Lys t1/2 (min) Rate Constant (min-1) t1/2 (min) Rate Constant (min-1)
Cell1 10.1 0.1044 9.3 0.1044 Cell2 10.9 0.1062 9.4 0.1062 Cell3 10.4 0.1114 9 0.1114
avg. 10.47 0.1073 9.23 0.1073 stdev. 0.404145 0.0036 0.208167 0.0036
0.10mM+20mM Lys t1/2 (min) Rate Constant (min-1) t1/2 (min) Rate Constant (min-1)
Cell1 11 0.1005 10.2 0.1005 Cell2 10.8 0.1079 9.7 0.1079 Cell3 11 0.1116 9.6 0.1116
avg. 10.93 0.1067 9.83 0.1067 stdev. 0.11547 0.0057 0.321455 0.0057

16
Table 14. Chart for the Calculated Volume of Quinones at 0.01 to 0.075mM and Amino Acids at 10 to 40mM
Reactant Stock (mM) Final (mM) Vol. (μL)
1mL Cuvet Vol. (μL)
3mL Cuvet
pBQ (108.1g/mol) 0.004 g of pBQ in 2 mL vol.flask
0.010 0.54 1.62
18.50 mM
0.025 1.35 4.05
0.050 2.70 8.11
0.075 4.05 12.16
ClpBQ (142.54g/mol) 0.004 g of ClpBQ in 2 mL vol.flask
14.03 mM
0.010 0.71 2.14 0.025 1.78 5.35
0.050 3.56 10.69
0.075 5.35 16.04
MepBQ (122.12g/mol) 0.004 g of MepBQ in 2 mL vol.flask
16.38 mM
0.010 0.61 1.83
0.025 1.53 4.58
0.050 3.05 9.16
0.075 4.58 13.74
Lys (182.6g/mol) 0.1g of Lys in 10 mL vol.flask
54.76 mM
10 182.6 547.8 20 365.2 1095.6 30 547.8 1643.4 40 730.4 2191.2
Cys (121.2g/mol) 0.05 g of Cys in 10 mL vol.flask
41.25 mM
10 242.4 727.2 20 484.8 1454.4 30 727.2 2181.6 40 969.6 2908.8
Asp (133.1g/mol) 0.05 g of Asp in 10 mL vol.flask
37.57 mM
10 266.2 798.6 20 532.4 1597.2 30 798.6 2395.8 40 1064.8 3194.4
Ser (105.1g/mol) 0.05 g of Ser in 10 mL vol.flask
47.57 mM
10 210.2 630.6 20 420.4 1261.2 30 630.6 1891.8 40 840.8 2522.4
Thr (119.1g/mol) 0.05 g of Thr in 10 mL vol.flask
41.98 mM
10 238.2 714.6 20 476.4 1429.2 30 714.6 2143.8 40 952.8 2858.4

17
1. Reaction of 0.01 mM of pBQ and 10 mM of Lysine Objective: To determine t1/2 and the rate constant. Method: Each sample was triplicated and the spectrum was scanned continually from 700 to
200nm for 4 times of half-life (4 x t1/2) and A∞ was detected at 8 times of half life (8 x t1/2) by Shimadzu UV/Vis spectrometer. Scan time interval was 2 minutes and a plot of absorbance at 246nm vs. time was generated. Only representative UV/Vis spectra were selected in this report.
Table 15. Results of Reaction of [pBQ]=0.01mM, [Lys]=10mM Using UV/Vis Spectrometer
Time Elapsed UV/Vis Spectral Change Time-Dependent Absorbance Change at 246nm
Cell1: [pBQ]=0.01mM, [Lys]=10mM
0
0.2
0.4
0.6
0.8
1
1.2
1.4
200 300 400 500 600 700
Wavelength (nm)
Ab
sorb
ance
File: MJK1-100-pBQ0.01-Lys10-raw
Cell1: [pBQ]=0.01mM, [Lys]=10mMt1/2: 20.4min
0
0.05
0.1
0.15
0.2
0.25
0.3
0 50 100 150 200
Corrected Time (min)
Ab
sorb
ance
at
246n
m
File: K-MJK1-100-pBQ0.01-Lys10-1
Avg. Half-life (t1/2): 19.6 min Avg. Rate Constant (k’): 0.0398 min-1
Cell1: [pBQ]=0.01mM, [Lys]=10mMt1/2: 20.4min
y = -0.0067x + 0.2733
R2 = 0.9989
0
0.05
0.1
0.15
0.2
0.25
0.3
0 2 4 6 8 10 12
Corrected Time (min)
Ab
sorb
ance
at
246n
m
File: K-MJK1-100-pBQ0.01-Lys10-1
Cell1: [pBQ]=0.01mM, [Lys]=10mMt1/2: 20.4min
y = -0.0379x + 0.0863
R2 = 0.9963
-0.8
-0.7
-0.6
-0.5
-0.4
-0.3
-0.2
-0.1
0
0.1
0 5 10 15 20 25
Corrected Time (min)
Ln
((A
f-A
t)/(
Af-
Ai)
)
File: K-MJK1-100-pBQ0.01-Lys10-1

18
2. Reaction of 0.01 mM of pBQ and 30 mM of Lysine Objective: To determine t1/2 and the rate constant. Method: Each sample was triplicated and the spectrum was scanned continually from 700 to
200nm for 4 times of half-life (4 x t1/2) and A∞ was detected at 8 times of half life (8 x t1/2) by Shimadzu UV/Vis spectrometer. Scan time interval was 2 minutes and a plot of absorbance at 246nm vs. time was generated. Only representative UV/Vis spectra were selected in this report.
Table 16. Results of Reaction of [pBQ]=0.01mM, [Lys]=30mM Using UV/Vis Spectrometer
Time Elapsed UV/Vis Spectral Change Time-Dependent Absorbance Change at 246nm
Cell1: [pBQ]=0.01mM, [Lys]=30mM
0
0.5
1
1.5
2
2.5
200 300 400 500 600 700
Wavelength (nm)
Ab
sorb
ance
File: MJK1-100-pBQ0.01-Lys30-raw
Cell1: [pBQ]=0.01mM, [Lys]=30mMt1/2: 8.4min
0
0.05
0.1
0.15
0.2
0.25
0.3
0 20 40 60 80
Corrected Time (min)
Ab
sorb
ance
at
246n
m
File: K-MJK1-100-pBQ0.01-Lys30-1
Avg. Half-life (t1/2): 8.4 min Avg. Rate Constant (k’): 0.122 min-1
Cell1: [pBQ]=0.01mM, [Lys]=30mMt1/2: 8.4min
y = -0.0173x + 0.2908
R2 = 0.9981
0
0.05
0.1
0.15
0.2
0.25
0.3
0 2 4 6 8 10 12
Corrected Time (min)
Ab
sorb
ance
at
246n
m
File: K-MJK1-100-pBQ0.01-Lys30-1
Cell1: [pBQ]=0.01mM, [Lys]=30mMt1/2: 8.4min
y = -0.1145x + 0.2186
R2 = 0.9917
-1
-0.8
-0.6
-0.4
-0.2
0
0.2
0 2 4 6 8 10 12
Corrected Time (min)
Ln
((A
f-A
t)/(
Af-
Ai)
)
File: K-MJK1-100-pBQ0.01-Lys30-1

19
3. Reaction of 0.01 mM of pBQ and 40 mM of Lysine Objective: To determine t1/2 and the rate constant. Method: Each sample was triplicated and the spectrum was scanned continually from 700 to
200nm for 4 times of half-life (4 x t1/2) and A∞ was detected at 8 times of half life (8 x t1/2) by Cary UV/Vis spectrometer. Scan time interval was 1.3 minutes and a plot of absorbance at 246nm vs. time was generated. Only representative UV/Vis spectra were selected in this report.
Table 17. Results of Reaction of [pBQ]=0.01mM, [Lys]=40mM Using UV/Vis Spectrometer
Time Elapsed UV/Vis Spectral Change Time-Dependent Absorbance Change at 246nm
Cell1: [pBQ]=0.01mM, [Lys]=40mM
0
0.5
1
1.5
2
2.5
200 300 400 500 600 700
Wavelength (nm)
Ab
sorb
ance
File: MJK1-100-pBQ0.01-Lys40-Cell1
Cell1: [pBQ]=0.01mM, [Lys]=40mMt1/2: 5.7 min
0
0.05
0.1
0.15
0.2
0.25
0 10 20 30 40 50
Time (min)
Ab
sorb
ance
at
246n
m
File: K-MJK1-100-pBQ0.01-Lys40-1
Avg. Half-life (t1/2): 5.5 min Avg. Rate Constant (k’): 0.182 min-1
Cell1: [pBQ]=0.01mM, [Lys]=40mMt1/2: 5.7 min
y = -0.0201x + 0.231
R2 = 0.9948
0
0.05
0.1
0.15
0.2
0.25
0 2 4 6 8
Time (min)
Ab
sorb
ance
at
246n
m
File: K-MJK1-100-pBQ0.01-Lys40-1
Cell1: [pBQ]=0.01mM, [Lys]=40mMt1/2: 5.7 min
y = -0.182x + 0.0394
R2 = 0.9926
-1.2
-1
-0.8
-0.6
-0.4
-0.2
0
0.2
0 2 4 6 8
Time (min)
Ab
sorb
ance
at
246n
m
File: K-MJK1-100-pBQ0.01-Lys40-1

20
4. Reaction of 0.01 mM of pBQ and 20 mM of Serine Objective: To determine t1/2 and the rate constant. Method: Each sample was triplicated and the spectrum was scanned continually from 700 to
200nm for 4 times of half-life (4 x t1/2) and A∞ was detected at 8 times of half life (8 x t1/2) by Shimadzu UV/Vis spectrometer. Scan time interval was 3 minutes and a plot of absorbance at 246 nm vs. time was generated. Only representative UV/Vis spectra were selected in this report.
Table 17. Results of Reaction of [pBQ]=0.01mM, [Ser]=20mM Using UV/Vis Spectrometer
Time Elapsed UV/Vis Spectral Change Time-Dependent Absorbance Change at 246nm
Cell1: [pBQ]=0.01mM, [Ser]=20mM
00.20.40.60.8
11.21.41.61.8
2
200 300 400 500 600 700
Wavelength (nm)
Ab
sorb
ance
File: MJK1-93-pBQ0.01-Ser20-raw
Cell1: [pBQ]=0.01mM, [Ser]=20mMHalf-life time (t1/2): 20.2min
0
0.05
0.1
0.15
0.2
0.25
0.3
0.35
0.4
0 50 100 150 200
Corrected Time (min)
Ab
sorb
ance
at
246n
m
File: K-MJK1-93-pBQ0.01-Ser20-1
Avg. Half-life (t1/2): 20.2 min Avg. Rate Constant (k’): 0.0394 min-1
Cell1: [pBQ]=0.01mM, [Ser]=20mMHalf-life time (t1/2): 20.2min
y = -0.0095x + 0.3836
R2 = 0.9986
0
0.05
0.1
0.15
0.2
0.25
0.3
0.35
0.4
0 5 10 15
Corrected Time (min)
Ab
sorb
ance
at
246n
m
File: K-MJK1-93-pBQ0.01-Ser20-1
Cell1: [pBQ]=0.01mM, [Ser]=20mMHalf-life time (t1/2): 20.2min
y = -0.0388x + 0.072
R2 = 0.9994
-0.8
-0.7
-0.6
-0.5
-0.4
-0.3
-0.2
-0.1
0
0.1
0 5 10 15 20 25
Corrected Time (min)
Ln
((A
f-A
t)/(
Af-
Ai)
)
File: K-MJK1-93-pBQ0.01-Ser20-1

21
5. Reaction of 0.01 mM of pBQ and 20 mM of Threonine Objective: To determine t1/2 and the rate constant. Method: Each sample was triplicated and the spectrum was scanned continually from 700 to
200nm for 4 times of half-life (4 x t1/2) and A∞ was detected at 8 times of half life (8 x t1/2) by Shimadzu UV/Vis spectrometer. Scan time interval was 2.25 minutes and a plot of absorbance at 246 nm vs. time was generated. Only representative UV/Vis spectra were selected in this report.
Table 18. Results of Reaction of [pBQ]=0.01mM, [Thr]=20mM Using UV/Vis Spectrometer
Time Elapsed UV/Vis Spectral Change Time-Dependent Absorbance Change at 246nm
Cell1: [pBQ]=0.01mM, [Thr]=20mM
00.20.40.60.8
11.21.41.61.8
2
200 300 400 500 600 700
Wavelength (nm)
Ab
sorb
ance
File: MJK1-97-pBQ0.01-Thr20-raw
Cell1: [pBQ]=0.01mM, [Thr]=20mMHalf-life time (t1/2): 16.8min
0
0.05
0.1
0.15
0.2
0.25
0 50 100 150
Corrected Time (min)
Ab
sorb
ance
at
246n
m
File: K-MJK1-97-pBQ0.01-Thr20-1
Avg. Half-life (t1/2): 16.6 min Avg. Rate Constant (k’): 0.0505 min-1
Cell1: [pBQ]=0.01mM, [Thr]=20mMHalf-life time (t1/2): 16.8min
y = -0.007x + 0.235
R2 = 0.9991
0
0.05
0.1
0.15
0.2
0.25
0 2 4 6 8 10 12
Corrected Time (min)
Ab
sorb
ance
at
246n
m
File: K-MJK1-97-pBQ0.01-Thr20-1
Cell1: [pBQ]=0.01mM, [Thr]=20mMHalf-life time (t1/2): 16.8min
y = -0.0494x + 0.095
R2 = 0.999
-0.9-0.8-0.7-0.6-0.5-0.4-0.3-0.2-0.1
00.1
0 5 10 15 20
Corrected Time (min)
Ln
((A
f-A
t)/(
Af-
Ai)
)
File: K-MJK1-97-pBQ0.01-Thr20-1

22
6. Reaction of 0.01 mM of pBQ and 20 mM of Aspartate Objective: To determine t1/2 and the rate constant. Method: Each sample was triplicated and continually scanned for 6 hours from 700 to 200nm.
After 24 hours, absorbance was obtained and A∞ was detected after 53 hours by Shimadzu UV/Vis spectrometer. Scan time interval was 600 sec (10 min) and a plot of absorbance at 246 nm vs. time was generated. Only representative UV/Vis spectra were selected in this report.
Table 19. Results of Reaction of [pBQ]=0.01mM, [Asp]=20mM Using UV/Vis Spectrometer
Time Elapsed UV/Vis Spectral Change Time-Dependent Absorbance Change at 246 nm
Cell1: [pBQ]=0.01mM, [Asp]=20mM
0
0.5
1
1.5
2
2.5
3
200 300 400 500 600 700
Wavelength (nm)
Ab
sorb
ance
File: MJK1-112-pBQ0.01-Asp20-raw
Cell1: [pBQ]=0.01mM, [Asp]=20mMt1/2: 228.4min
0
0.05
0.1
0.15
0.2
0.25
0 1000 2000 3000 4000
Time (min)
Ab
sorb
ance
at
246
nm
File: K-MJK1-112-pBQ0.01-Asp20-1
Avg. Half-life (t1/2): 230.5 min (3.8hr) Avg. Rate Constant (k’): 0.000257 min-1
Cell1: [pBQ]=0.01mM, [Asp]=20mMt1/2: 228.4min
y = -0.0005x + 0.2284R2 = 0.9952
0.205
0.21
0.215
0.22
0.225
0.23
0.235
0 10 20 30 40 50
Time (min)
Ab
sorb
ance
at
246
nm
File: K-MJK1-112-pBQ0.01-Asp20-1
Cell1: [pBQ]=0.01mM, [Asp]=20mMt1/2: 228.4min
y = -0.0026x - 0.004R2 = 0.9999
-0.7
-0.6
-0.5
-0.4
-0.3
-0.2
-0.1
0
0 50 100 150 200 250
Time (min)
Ln
((A
f-A
t)/(
Af-
Ai)
)
File: K-MJK1-112-pBQ0.01-Asp20-1

23
7. Reaction of 0.01 mM of pBQ and 20 mM of Cysteine Objective: To determine t1/2 and the rate constant. Method: Each sample was triplicated and was continually scanned for 4 hours every 600 seconds
(10 min) from 700 to 200nm by Shimadzu UV/Vis spectrometer. Absorbance values were also obtained after 23.3 hours and 48.8 hours. These sample cuvettes were placed in the water bath at 37 ºC. A plot of absorbance at 299 nm vs. time was generated. Only representative UV/Vis spectra were selected in this report.
Table 20. Results of Reaction of [pBQ]=0.01mM, [Cys]=20mM Using UV/Vis Spectrometer
Time Elapsed UV/Vis Spectral Change Time-Dependent Absorbance Change at 299 nm
Cell1: [pBQ]=0.01mM, [Cys]=20mM
0
0.5
1
1.5
2
2.5
3
200 300 400 500 600 700
Wavelength (nm)
Ab
sorb
ance
File: MJK1-118-pBQ0.01-Cys20-1
Cell1: [pBQ]=0.01mM, [Cys]=20mM
0
0.02
0.04
0.06
0.08
0.1
0.12
0 20 40 60
Time (hr)
Ab
sorb
ance
at
299
nm
File: MJK1-118-pBQ0.01-Cys20-1
Data Analysis: After 23.3 hours have passed, the white particles were not appeared in the sample cuvettes but were shown when detected 48.8 hours after the sample has been prepared. It was not obvious to see the λmax and absorbance values at 299 nm were constantly increasing in time dependent manner, representing the product accumulation caused by adduct formation of pBQ with cysteine.

24
Table 21. Average t1/2 and Rate Constants of the Reactions of pBQ at 0.01 to 0.075mM and Lys at 20mM (File: pBQ + Lys Table)
0.01-0.075mM pBQ
+ 20 mM Lys
0.01mM pBQ 0.025mM pBQ 0.05mM pBQ 0.075mM pBQ
t1/2 (min)
k' (min-1)
t1/2 (min)
k' (min-1)
t1/2 (min)
k' (min-1)
t1/2 (min)
k' (min-1)
Cell1 11.2 0.0892 10.8 0.0853 10.5 0.0809 10 0.0966
Cell2 11.2 0.0931 11 0.0859 9.6 0.0956 10.6 0.0949
Cell3 11.2 0.0987 10.9 0.0923 12 0.0709 10.2 0.1048
Avg. 11.2 0.0937 10.9 0.0878 10.7 0.0825 10.2667 0.0988
Stdev. 0.0 0.0048 0.1 0.0039 1.21244 0.0124 0.30551 0.0053
Figure 1. Rate Constants vs. [pBQ] ([Lys]=20mM) (File: pBQ + Lys Table)
Rate Constants of pBQ and 20mM Lys
0
0.02
0.04
0.06
0.08
0.1
0.12
0.14
0 0.025 0.05 0.075 0.1
[pBQ] (mM)
Rat
e C
on
stan
t (m
in)-1
Conclusion: The pseudo first order rate constants are independent of the concentration of pBQ.

25
Table 22. Average t1/2 and Rate Constants of the Reactions of ClpBQ 0.01mM and Lys at 10 to 40mM (File: pBQ + Lys Table)
0.01mM pBQ +
10-40mM Lys
10mM Lys 20mM Lys 30mM Lys 40mM Lys
t1/2 (min)
k' (min-1)
t1/2 (min)
k' (min-1)
t1/2 (min)
k' (min-1)
t1/2 (min)
k' (min-1)
Cell1 20.4 0.0379 11.2 0.0892 8.4 0.1145 5.7 0.182
Cell2 19.2 0.0403 11.2 0.0931 8.4 0.1228 5.5 0.1788
Cell3 19.2 0.0412 11.2 0.0987 8.4 0.1291 5.3 0.1859
Avg. 19.6 0.0398 11.2 0.0937 8.4 0.1221 5.5 0.1822
Stdev. 0.6928 0.0017 0.0 0.0048 0.0 0.0073 0.2 0.0036
Figure 2. Rate Constants vs. [Lys] ([pBQ]=0.01 mM) (File: pBQ + Lys Table)
Rate Constant vs. [Lys]([pBQ]=0.01mM)
0
0.05
0.1
0.15
0.2
0 10 20 30 40 50
[Lys] (mM)
Rat
e C
on
stan
t (m
in-1
)
Conclusion: The pseudo first order rate constants are dependent on the concentration of lysine.

26
Table 23. Average t1/2 and Rate Constants of the Reactions of 0.01mM pBQ and 20mM Amino Acids
0.01mM pBQ +
20 mM A.A
20mM Lys 20mM Ser 20mM Thr 20 mM Asp
t1/2 (min)
k' (min-1)
t1/2 (min)
k' (min-1)
t1/2 (min)
k' (min-1)
t1/2 (min)
k' (min-1)
Cell1 11.2 0.0892 20.2 0.0388 16.8 0.0494 228.4 0.0026
Cell2 11.2 0.0931 20 0.0397 16.7 0.0505 218.4 0.0026
Cell3 11.2 0.0987 20.4 0.0398 16.4 0.051 244.6 0.0025
Avg. 11.2 0.0937 20.2 0.0394 16.6 0.0503 230.5 0.00257
Stdev. 2.2E-15 0.0048 0.2 0.0006 0.2082 0.0008 13.22 5.77E-05
Related Documents