POLITICAL MAP OF BARANGAY BAHONG PHYSICAL AND SOCIO-ECONOMIC PROFILE I. PHYSICAL PROFILE Geographic Location The barangay is located on the south western part of La Trinidad. It shares its boundaries with other four barangays of the municipality. On the north, Barangay Alno and the Municipality of Tublay, Barangay Tawang on the south and Barangay Shilan on the south-east and Barangay Alapang on the west. The barangay is three (3) kilometers from the Poblacion, 2 kilometers from the national highway, 3 kilometers from the provincial road and Provincial Capitol and 10 kilometers away from Baguio City. Abra Kalinga Apayao Ifugao Benguet Mt. Province ITOGON TUBA BOKOD ATOK BAKUN BUGUIAS KABAYAN TUBLAY KIBUNGAN MANKAYAN KAPANGAN BAGUIO CITY LA TRINIDAD Cordillera Administrative Region Philippines Benguet Province

Welcome message from author
This document is posted to help you gain knowledge. Please leave a comment to let me know what you think about it! Share it to your friends and learn new things together.
Transcript

1 POLITICAL MAP OF BARANGAY BAHONG
PHYSICAL AND SOCIO-ECONOMIC PROFILE
I. PHYSICAL PROFILE
Geographic Location The barangay is located on the south western part of La Trinidad. It shares its
boundaries with other four barangays of the municipality. On the north, Barangay Alno and the
Municipality of Tublay, Barangay Tawang on the south and Barangay Shilan on the south-east
and Barangay Alapang on the west. The barangay is three (3) kilometers from the Poblacion, 2
kilometers from the national highway, 3 kilometers from the provincial road and Provincial
Capitol and 10 kilometers away from Baguio City.
Abra Kalinga
Apayao
Ifugao
Benguet
Mt. Province
ITOGONTUBA
BOKOD
ATOK
BAKUN
BUGUIAS
KABAYAN
TUBLAY
KIBUNGAN
MANKAYAN
KAPANGAN
BAGUIO CITY
LA TRINIDAD
Cordillera Administrative Region
Philippines Benguet Province

2
Not to Scale
Land Area
The DENR Cadastral Survey places the land area of the barangay at 657.5645 hectares
representing 8.1387% of the municipality’s total land area. It constitutes the 7th largest
barangay of the municipality of La Trinidad.
Political Subdivision
Bahong is one of the barangay of the municipality of La Trinidad, Province of Benguet. It
comprises 5 sitios namely: Sadag, Central Bahong, Anoding, Ma-e and Tomay.
Accessibility
Bahong is accessible via Baguio-Bontoc Road or the Camp Dangwa-Bahong-Sadag
Provincial Road. Public Utility jeeps are available. You can take jeeps which ply from Baguio to
Bahong or Baguio to Camp Dangwa line. There are other jeep lines and taxis passing by the
barangay. Bahong is about 4 kilometers away from the Municipal Hall of La Trinidad.
Alapang
Alno
Tawang
Shilan
Municipality of
Tublay
Prepared by: MPDO La Trinidad under CBMS, 2013
3
4
II. NATURAL AND PHYSICAL CHARACTERISTICS
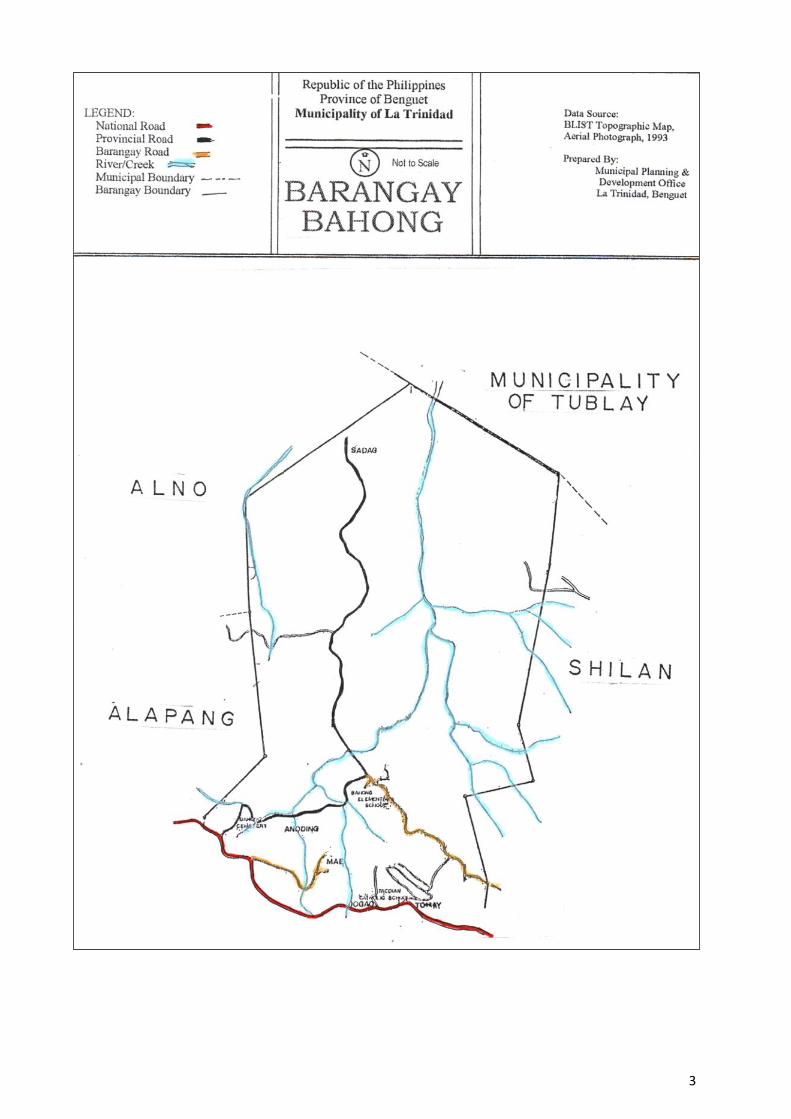
Climate and Rainfall The barangay has an average temperature of 26° centigrade at minimum. It has
classified under the type “A” climate having two pronounced seasons, dry from November to
April and wet during the rest of the year.
Topography and Slope
Barangay Bahong has slopes varying from 0% and above. Based on ranking, the most
dominant land of the barangay is hilly to mountainous with slopes which range from 19% to
30%. This is followed by upland areas (slope of 9-18%), then rough mountainous areas (slope of
31-50%), next is the very steep, extremely rough mountainous areas ranging 50% and above.
The elevation ranges from 900 to 1,400 meters above sea level.
Soil Type
There are three (3) types of soil in the barangay namely: Puguis gravelly loam, Tacdian
loam, and Halsema loam. Internal drainage is moderately slow. External drainage is good to
excessive. These soil types have danger of soil erosion.
Water Bodies
The barangay has one river called Dong-oy River. There are also five creeks namely:
Bahong Creek, Talingting Creek, Bacbac Creek, Doheb Creek and Pacdal Creek located along the
boundaries of Bahong and Alno. There are also 10 springs in the barangay.
Land Use
Agriculture. The Agricultural land covers an area of 540.32 hectares.
Road. The road covers an area of 66.81 hectares.
Residential. The residential area covers an area of 29.66 hectares.
Commercial. The commercial are covers an area of 17.82 hectares.
Institutional. The institutional land covers an area of 2.95 hectares.
Existing Land Use
Land Use Hectares %
Agricultural 540.32 82.17%
Road 66.81 10.16%
Residential 29.66 4.51%
Commercial 17.82 2.71%
Institutional 2.95 0.45%
Total 657.56 100.00% Source: Bahong Socio-Economic Profile 1998

5
III. DEMOGRAPHY
Population, Growth, and Population Estimates
Bahong’s population in 1975 was 1,490, it has increased to 1,514 in year 1980 and 2,660
in 1990. It continuously increased to 2,969 in 1995, 3,000 in year 2000, 3,997 in year 2007, and
4,828 in year 2010.
Population: Census years 1975-2010
Census 1975 1980 1990 1995 2000 2007 2010
Population 1,490 1,514 2,660 2,969 3,000 3,997 4,828 Source: NSO
The population growth rate of barangay Bahong between years of 1990 and 1995 was
2%, but dropped down to 0.22% between year 1995 and 2000. It went high to 4.184% between
2000 and 2007 and 6.50% between 2007 and 2010.
Intercensal Growth Rate AVERAGE GROWTH RATE 1990-1995 1995-2000 2000-2007 2007-2010
2 0.22 4.184 6.50 3.23 Source: LT Physical and Socio-economic Profile 2012
Adopting the derived average growth rate of 3.23, Bahong has a projected population of
5,310 persons with 1,328 estimated households in year 2013. For the year 2014, the projected
population is 5,482 persons with 1,370 households. For year 2015, the projected population is
at 5,659 people with 1,415 estimated households.
Estimated Population (2012-2020)
Year Projected Population Estimated No. of HHs
2011 4,984 1,246
2012 5,144 1,286
2013 5,310 1,328
2014 5,482 1,370
2015 5,659 1,415
2016 5,841 1,460
2017 6,030 1,507
2018 6,224 1,556
2019 6,425 1,606
2020 6,632 1,658 Source: MPDO Estimates based on NSO Census 1995, 2000, 2007 & 2010
Population Doubling Time : 21.7 years
According to CBMS Survey last 2010, the total population of Bahong was 4,215 people,
composed of 50.75% or 2,139 males and 49.25% or 2,076 females. The total number of
households was 941, with an average household size of 4.
Total Number of Households : 941
Average Household Size : 4
Source: CBMS 2010
Sex # %
Male 2,139 50.75%
Female 2,076 49.25%
Total 4,215 100.00%

6
Population by Sitio
Most or 34.50% of total population reside in Sitio Tomay. This is followed by Central
Bahong with 740 residents representing 17.56% of the total. There were 678 residents in
Anoding, 674 residents in Sadag, and 669 residents in Ma-e, representing 16.09%, 15.99% and
15.87% respectively.
Sitio/Purok Households
Population
# %
Tomay 331 1,454 34.50%
Ma-e 146 669 15.87%
Central Bahong 171 740 17.56%
Sadag 149 674 15.99%
Anoding 144 678 16.09%
Total 941 4,215 100.00% Source: CBMS 2010
Density and Classification
The barangay population density in 1990 was 4.05 persons per square kilometer. This
increased to 4.52 in 1995, 4.56 in 2000, 6.08 in year 2007, and 7 persons per square kilometer in
2010. Based on the derived densities, Bahong is still classified as rural barangay.
Population Density (Persons per Square Km)
Census Year 1990 1995 2000 2007 2010
Density 4.05 4.52 4.56 6.08 7 Source: LT Physical & Socio-Economic Profile 2012
Population by Sex and Age Group
Males who belong to age bracket 5-9 have the greatest number in the male group,
representing 5.86% of the total population. Females aging 15-19 have the highest population in
the female group, representing 5.86% of the total population.
The derived total sex ratio was 103%. This means that for every 100 female, there are
103 males. The age bracket of 70-74 has sex ratio of 100%, which indicates that there was equal
number of males to that of the females.
Sex ratios lower than 100 indicate that female population is greater than male
population. This can be seen in age groups of 0-4, 10-14, 15-19, 20-24, 55-59, 75-79, and 80+.
While ratios higher than 100 indicate that male population is predominant over female
population as shown in age groups of 5-9, 25-29, 30-34, 35-39, 40-44, 45-49, 50-54, 60-64, and
65-69. Only group 70-74 has equal number of male to female.

7
Age Total Male Female % Male %Female Sex Ratio
0-4 432 208 224 4.93% 5.31% 92.86%
5-9 479 247 232 5.86% 5.50% 106.47%
10-14 444 218 226 5.17% 5.36% 96.46%
15-19 446 199 247 4.72% 5.86% 80.57%
20-24 405 202 203 4.79% 4.82% 99.51%
25-29 352 177 175 4.20% 4.15% 101.14%
30-34 342 190 152 4.51% 3.61% 125.00%
35-39 273 153 120 3.63% 2.85% 127.50%
40-44 256 143 113 3.39% 2.68% 126.55%
45-49 225 120 105 2.85% 2.49% 114.29%
50-54 174 91 83 2.16% 1.97% 109.64%
55-59 117 55 62 1.30% 1.47% 88.71%
60-64 93 51 42 1.21% 1.00% 121.43%
65-69 67 35 32 0.83% 0.76% 109.38%
70-74 42 21 21 0.50% 0.50% 100.00%
75-79 33 15 18 0.36% 0.43% 83.33%
80+ 35 14 21 0.33% 0.50% 66.67%
Total 4,215 2,139 2,076 50.75% 49.25% 103.03% Source: CBMS 2010
Age Group Male Female Both Sexes Proportion
all ages 2,139 2,076 4,215 100%
0 30 21 51 1.21%
1 44 57 101 2.40%
2 43 47 90 2.14%
3 48 47 95 2.25%
4 43 52 95 2.25%
5 49 52 101 2.40%
6 61 41 102 2.42%
7 47 41 88 2.09%
8 52 55 107 2.54%
9 38 43 81 1.92%
10 44 53 97 2.30%
11 44 50 94 2.23%
12 33 35 68 1.61%
300.0 200.0 100.0 0.0 100.0 200.0 300.0
0-4
10-14
20-24
30-34
40-44
50-54
60-64
70-74
80+
0-4 5-910-14
15-19
20-24
25-29
30-34
35-39
40-44
45-49
50-54
55-59
60-64
65-69
70-74
75-79
80+
Female 224. 232. 226. 247. 203. 175. 152. 120. 113. 105. 83.0 62.0 42.0 32.0 21.0 18.0 21.0
Male -208. -247. -218. -199. -202. -177. -190. -153. -143. -120. -91.0 -55.0 -51.0 -35.0 -21.0 -15.0 -14.0
AGE-SEX PYRAMID 2010
Female
Male

8
13 51 44 95 2.25%
14 46 44 90 2.14%
15 43 42 85 2.02%
16 29 46 75 1.78%
17 40 51 91 2.16%
18 43 59 102 2.42%
19 44 49 93 2.21%
20 35 36 71 1.68%
21-25 197 196 393 9.32%
26-30 189 176 365 8.66%
31-35 185 153 338 8.02%
36-40 148 116 264 6.26%
41-45 137 105 242 5.74%
46-50 110 106 216 5.12%
51-55 90 69 159 3.77%
56-60 52 67 119 2.82%
61-65 49 36 85 2.02%
66 & over 75 87 162 3.84% Source: CBMS 2010
Age Dependency
There were 2,683 individuals who belong to working age group, representing 63.65% of
the total population. The total number of dependents was 1,532 or 36.35%, consisting 1,355
young dependents and 177 elderly dependents.
Dependency Ratios # % to Total Ratios
Young-Age Dependency Ratio (0-14) 1,355 32.15% 50.50
Old-Age Dependency Ratio (65+) 177 4.20% 6.60
Age Dependency Ratio (Total Dependent) 1,532 36.35% 57.10
Working Age Group (15-64) 2,683 63.65% 42.90 Source: CBMS 2010
Median Age
The population of Bahong has a median age of 24 years old. This means that half of the
population belongs to the young population ages 24 years old and below.
Migration
The total number of migrants in Bahong is 861, representing 20.43% of the total
population. This comprised of 418 males, representing 48.55% of the total migrants, and 443
females representing 51.45%. The in-migration rate is high at 178.33 indicating that Bahong is
an in-migration area.
Migrants by Sex # %
Male 418 48.55%
Female 443 51.45%
Total to Population 861 20.43% Source: CBMS 2010
In-Migration Rate : 178.33

9
Length of Residency
Majority or 58.70% of the population resided in Bahong since birth. There were 862
individuals who have resided in the barangay for a period of 0-5 year, representing 20.45%.
Three hundred ninety six (396) persons resided in the barangay for a period of 6-10 years,
representing 9.40%.
Length of Residency # %
0 - 5 Years 862 20.45%
6 - 10 Years 396 9.40%
11 - 15 Years 189 4.48%
16 - 20 Years 95 2.25%
21 - 25 Years 73 1.73%
26 - 30 Years 67 1.59%
31 - 35 Years 20 0.47%
36 - 40 Years 22 0.52%
41 - 45 Years 10 0.24%
46 - 50 Years 3 0.07%
51 - 55 Years 1 0.02%
56 - 60 Years 2 0.05%
61 - 65 Years 1 0.02%
Since Birth 2,474 58.70%
Total 4,215 100.00% Source: CBMS 2010
IV. SOCIAL CHARACTERISTICS
A. CULTURAL ATTRIBUTES
Religious Affiliation
Majority or 74.97% of the residents in Bahong are members of Catholic religion with
3,160. There were 181 individuals who belong to Anglican Church, representing 4.29%. Baptist
Church has 151 members, representing 3.58% of the total population. The rest of the
population belongs to various different religious denominations.
Religion # % Religion # %
Aglipay 2 0.05% Hope in Christ 1 0.02%
Anglican 181 4.29% Iglesia ni Cristo 58 1.38%
Assembly of God 24 0.57% Islam 16 0.38%
Baptist 151 3.58% Jehovah’s Witnesses 84 1.99%
Born Again Christian 68 1.61% Jesus the Good Shepherd 3 0.07%
Catholic 3,160 74.97% Life Spirit Fellowship 2 0.05%
Christian Baptist 4 0.09% Lutheran 33 0.78%
Christian Science 8 0.19% Pentecostal 39 0.93%
Christian Truth 5 0.12% Protestant 79 1.87%
Church of Christ 1 0.02% Seventh Day Adventist 4 0.09%
Espiritista 2 0.05% United Church of Christ of the Philippines 65 1.54%
Evangelical 19 0.45% Wesleyan 8 0.19%
Faith Comm. Church 7 0.17% None 161 3.82%
Free Believers 5 0.12% Not Stated 2 0.05%
Full Gospel 10 0.24%
Fundamental Baptist 13 0.31% Total 4,215 100.00% Source: CBMS 2010

10
Membership to a Community Organization (10 years old and above)
As to participation in community affairs, a total of 671 persons or 20.31% are members
of a community organization, of which 347 were males and 324 were females. There were 2,633
individuals who were not members of any community organization, representing 79.69% of the
total population. This is composed of 1,337 males and 1,296 females.
Membership to a Community Organization Male Female Total %
Member 347 324 671 20.31%
Non-Member 1,337 1,296 2,633 79.69%
Total 1,684 1,620 3,304 100.00%
Source: CBMS 2010
There were 511 members of cooperative, with 277 males and 234 females, representing
76.15% of the total members of organization. Senior Citizen Association has 72 members, 29
males and 43 females, representing 10.73%. Twenty four (24) were members of the Women’s
Organization, with a male and 23 females, representing 3.58%.
Type of Community Organizations Male Female Total %
Religious Group 6 9 15 2.24%
Youth Group 3 1 4 0.60%
Cultural Group 3 3 6 0.89%
Political Group 0 1 1 0.15%
Women's Organization 1 23 24 3.58%
Agriculture-Based Organization 3 3 6 0.89%
Labor Organization 0 1 1 0.15%
Civic Association 0 0 - 0.00%
Cooperative 277 234 511 76.15%
Senior Citizen Association 29 43 72 10.73%
Others 25 6 31 4.62%
Total 347 324 614 100.00% Source: CBMS 2010
Ethnicity
Majority or 62.78% of the total population belong to Ibaloi ethnic group. This is
followed by Kankana-ey ethnic group with 754, representing 17.89% of the total population.
Bontoc group were at 210 and 118 belong to Ifugao group, representing 4.98% and 2.80%
respectively.
Indigenous Group # % Indigenous Group # %
Aeta 7 0.17% Kalanguya 16 0.38%
Apayao 1 0.02% Kalinga 4 0.09%
Ayangan 4 0.09% Kankanaey 754 17.89%
Bago 11 0.26% Kiangan 1 0.02%
Bontoc 210 4.98% Mangyan 1 0.02%
Ibaloi 2,646 62.78% Tuwali 4 0.09%
Ibanag 19 0.45% Not belong to Indigenous Tribe 419 9.94%
Ifugao 118 2.80% Total 4,215 100.00% Source: CBMS 2010

11
B. EDUCATION
Literacy (10 years old and above)
Bahong has a literacy rate of 96.22% of the population who are 10 years old and above.
Of the 3,179 literate, 1,623 of them were males and 1,556 were females. There were 125
individuals who were illiterate, composing 61 males and 64 females, representing 3.78% of the
total.
Literacy by Sex Male Female Total %
Literate 1,623 1,556 3,179 96.22%
Illiterate 61 64 125 3.78%
Total 1,684 1,620 3,304 100.00% Source: CBMS 2010
Out of the total population, 1,287 individuals or 30.53% are still attending school. This
comprised 606 males and 681 females. While a total of 2,928 persons were not attending
school, with 1,533 males and 1,395 females, representing 69.47% of the total population.
Attending School by Sex Male Female Total %
Attending School 606 681 1,287 30.53%
Not attending School 1,533 1,395 2,928 69.47%
Total 2,139 2,076 4,215 100.00% Source: CBMS 2010
Educational Attainment of Population Aged 3 years old and Above
There were 369 who are not able to go to school with 191 males and 178 females,
representing 9.29% of the total population of 3 years old and above. A total of 102 were able to
go to day care, 53 males and 49 females, representing 2.57%. Nursery or preparatory or
kindergarten accounted to 83, of which 43 were males and 40 were females, representing 2.09%
A total of 798 persons were able to enter elementary. Two hundred sixty one (261)
persons were able to graduate from elementary, with 152 males and 109 females representing
6.57%. There were 604 individuals who enter high school. At least 504 individuals were able to
graduate from high school, comprised of 249 males and 255 female, representing 12.69%.
There were 456 individuals who were able to reach college. A number of 650 persons
were able to graduate from college with 271 males and 379 females, representing 16.36%. Four
(4) people were able to obtain units in masters and or doctorates, a male and 3 females. Twelve
(12) individuals were able to finish their doctors and or Masters degree. This consists of 4 males
and 8 females.
Educational Attainment (3 y/o +) Male Female Total %
No Grade 191 178 369 9.29%
Day Care 53 49 102 2.57%
Nursery/Kindergarten/Preparatory 43 40 83 2.09%
Grade 1 58 59 117 2.94%
Grade 2 85 74 159 4.00%
Grade 3 80 62 142 3.57%
Grade 4 97 66 163 4.10%
Grade 5 79 57 136 3.42%
Grade 6/7 52 29 81 2.04%
Elementary Graduate 152 109 261 6.57%

12
1st Year High School 92 75 167 4.20%
2nd Year High School 103 79 182 4.58%
3rd Year High School 97 80 177 4.46%
4th/5th Year High School 45 33 78 1.96%
High School graduate 249 255 504 12.69%
1st year Post Secondary 18 5 23 0.58%
2nd year Post Secondary 8 10 18 0.45%
3rd year Post Secondary 5 2 7 0.18%
Post Secondary graduate 47 35 82 2.06%
1st year College 56 88 144 3.62%
2nd year College 68 91 159 4.00%
3rd year College 49 60 109 2.74%
4th year College or higher 19 25 44 1.11%
College graduate 271 379 650 16.36%
With units Masters/Doctors 1 3 4 0.10%
Doctors/Masters degree 4 8 12 0.30%
Total 2,022 1,951 3,973 100.00% Source: CBMS 2010
Educational Attainment of those in School
For those who were attending school, Grade 3 has the most number of enrollees with
108 pupils, 51 males and 57 females, representing 8.39%. Grade 1 had 104 enrolled pupils with
50 males and 54 females, representing 8.08%. Ninety three (93) were enrolled in Grade 2,
where 44 were males and 49 were females, representing 7.23%. Nursery or preparatory or
kindergarten accounted to 92 enrollees with 52 males and 40 females, representing 7.15% of the
total number of those attending school.
Some 87 students were enrolled in first year high school with 48 males and 39 females,
representing 6.76%. There were 84 enrolled students in second year high school, 43 males and
41 females, representing 6.53% of the total. Third year high school had 59 enrollees, comprising
22 males and 37 females, representing 4.58%. For fourth year, there were 74 enrollees with 37
males and 37 females, which represents 5.75% of the total number of attending school.
Grade/Year Level Male Female Total %
Day Care 40 36 76 5.91%
Nursery/Kindergarten/Preparatory 52 40 92 7.15%
Grade 1 50 54 104 8.08%
Grade 2 44 49 93 7.23%
Grade 3 51 57 108 8.39%
Grade 4 39 48 87 6.76%
Grade 5 39 46 85 6.60%
Grade 6/7 31 34 65 5.05%
1st Year High School 48 39 87 6.76%
2nd Year High School 43 41 84 6.53%
3rd Year High School 22 37 59 4.58%
4th/5th Year High School 37 37 74 5.75%
1st year Post Secondary 3 1 4 0.31%
2nd year Post Secondary 4 1 5 0.39%
3rd year Post Secondary 3 0 3 0.23%
1st year College 31 51 82 6.37%
2nd year College 21 48 69 5.36%
3rd year College 19 34 53 4.12%

13
4th year College or higher 28 27 55 4.27%
Post Graduate with Units 1 1 2 0.16%
Total 606 681 1287 100.00% Source: CBMS 2010
First year college had 82 enrolled students, 31 males and 51 females, representing
6.37%. A total of 69 students were enrolled in second year college, wherein 21 were males and
48 were females, representing 5.36%. There were 53 or 4.12%, 19 males and 34 females, who
were in third year college. Fourth year college had 55 enrolled students, comprising 28 males
and 27 females, which represents 4.27%. Only two persons (a male and a female) were enrolled
with some units for masters or doctors degree.
Attending School by Age Group (3 to 21 years old)
There were a total of 1,727 members of the community who are from school going age
(3 to 21 years old). This comprised of 840 males and 887 females. Out of 1,727 individuals,
1,227 or 71.05% were in school and 500 or 28.95% were no longer in school.
From pre-school going age, most of them were not attending school. For those in
elementary ages 6 to 12 years old, at least more than 90% were in school except for those in age
bracket of 7 were only 88.64% were in school. For ages appropriate for high school, more than
85% were attending school except for age bracket 16 wherein only 82.67% were in school. For
ages appropriate for college level, there were less compared to those in the lower levels.
Attending/Not Attending School by Age Group (3 to 21 years old)
Sex In School Out of School
Age Group Male Female Total # % To Age Group # % To Age Group
3 48 47 95 5 5.26% 90 94.74%
4 43 52 95 25 26.32% 70 73.68%
5 49 52 101 60 59.41% 41 40.59%
6 61 41 102 93 91.18% 9 8.82%
7 47 41 88 78 88.64% 10 11.36%
8 52 55 107 101 94.39% 6 5.61%
9 38 43 81 77 95.06% 4 4.94%
10 44 53 97 92 94.85% 5 5.15%
11 44 50 94 89 94.68% 5 5.32%
12 33 35 68 65 95.59% 3 4.41% 13 51 44 95 88 92.63% 7 7.37%
14 46 44 90 78 86.67% 12 13.33%
15 43 42 85 73 85.88% 12 14.12%
16 29 46 75 62 82.67% 13 17.33%
17 40 51 91 69 75.82% 22 24.18%
18 43 59 102 67 65.69% 35 34.31%
19 44 49 93 51 54.84% 42 45.16%
20 35 36 71 31 43.66% 40 56.34%
21 50 47 97 23 23.71% 74 76.29%
3-21 840 887 1,727 1,227 71.05% 500 28.95%
22-25 147 149 296 20 6.76% 249 84.12%
26-30 189 176 365 2 0.55% 363 99.45%
31-35 185 153 338 2 0.59% 336 99.41%
36 & over 661 586 1,247 0 0.00% 1247 100.00%
Total 2,022 1,951 3,973 1,251
2,695 Source: CBMS 2010

14
Educational Facilities and Enrollment
School Level Name of School Enrollment
(SY 2011-12) Category
Elementary Bahong Elementary School 231 Public Source: DepEd-LT, TESDA, 2012
Type of School Enrolled In
There were 625 who were enrolled in Public Schools, representing 48.56% of the total
number of those in school. And 662 were enrolled in private schools comprising 51.44% of the
total.
Enrollment by School Type # %
Public School 625 48.56%
Private School 662 51.44%
Total 1,287 100.00% Source: CBMS 2010
Sports & Recreation Facilities : Bahong E/S Playground
C. HEALTH
Health Facilities
Bahong’s Barangay Health Station is adjacent to Baguio-Bontoc Road. The midwife holds
clinic on Mondays, Wednesdays and Fridays. Then she conducts home visits on Thursday.
Another clinic is located in Sadag Day Care Center. Clinic day is every third Tuesday of the
month. The Benguet General Hospital and some private clinics are found at the core of La
Trinidad. Other hospitals and clinics are available at nearby Baguio City.
Treatment for Sickness
All of the households in the community had members who got sick. Out of 941
households, there were 755 households who got sick and availed medical treatment. Some 186
households had members who got sick but did not avail any medical treatment.
Availed Treatment/Cure For Sickness HHs %
Yes 755 80.23%
No 186 19.77%
Did Not Get Sick 0 0.00%
Total 941 100.00% Source: CBMS 2010
Access to Health Facilities
Of the 755 who received treatment, majority or 407 of them availed treatment from the
provincial public hospital. There were 267 patients who received treatment in a private hospital
or clinic, representing 35.36%. Some 45 availed medical attention in rural health units,
representing 5.96% of the total. There were 16 or 2.12% who received treatment in the
barangay health station and 12 patients received medical treatment from municipal public
hospital.

15
Place Where Received Treatment # %
Public Hospital (provincial) 407 53.91%
Public Hospital (municipal/city) 12 1.59%
Public Hospital (district) 0 0.00%
Public Hospital (national) 3 0.40%
Private Hospital/Clinic 267 35.36%
Rural Health Units 45 5.96%
Barangay Health Station/Center 16 2.12%
Non-medical/Non-trained Hilot/Personnel 3 0.40%
Others 2 0.26%
Total 755 100.00% Source: CBMS 2010
Mortality
As of 2010, there were 19 individuals who died in the community, of whom 9 were
males and 10 were females. There were 3 persons, 2 males and 1 female, who died due to
disease of the heart, representing 15.79%. Two (2) individuals, all females, died due to cancer
and another 2 females died due to complications during pregnancy or delivery, representing
10.53% of the total cause of deaths. One male casualty died due to disease of the vascular
system, representing 5.26%. There were 11 other deaths recorded with 6 male casualty and 5
female casualty, representing 57.89% of the total deaths.
Cause of Death Male Female Total %
Diseases of the heart 2 1 3 15.79%
Diseases of the vascular system 1 0 1 5.26%
Cancer 0 2 2 10.53%
Complications During pregnancy/Delivery 0 2 2 10.53%
Others 6 5 11 57.89%
Total 9 10 19 100.00% Source: CBMS 2010
Nutritional Status of Children (0-5 years old)
A total of 615 children were recorded in Bahong in 2012, wherein 300 were males and
315 were females. Of the total, 612 are of normal weight with 299 males and 313 females,
representing 99.51% of the total number of children. Only 3 children are underweight, a male
and 2 females, which represents 0.49%.
Nutritional Status of Children 0-5 Years Old Male Female Total %
Overweight 0 0 0 0.00%
Normal 299 313 612 99.51%
Underweight 1 2 3 0.49%
Severely Underweight 0 0 0 0.00
Total 300 315 615 100.00% Source: MHO 2012

16
Family Planning Methods Usage
There were 697 couples recorded in Bahong. Out of the total number of couples, 562
women were of child-bearing age. Among the 562 couples, only 364 are practicing family
planning.
Number of Couples : 697
Number of Married Women of Child-Bearing Age : 562
Couples Practicing Family Planning : 364
Most of the couples use pills as a family planning method, representing 31.59%. Some
69 couples adapted tubal ligation, representing 18.96%. There were 44 couples or 12.09% who
used billing ovulation method. While injectable is adapted by 41 couples, representing 11.26%
of the total.
Couples by Family Planning Method # %
Barrier Method 19 5.22%
Basal Body Temperature 1 0.27%
Billings Ovulation Method 44 12.09%
Injectable 41 11.26%
IUD 11 3.02%
Lactational Amenorrhea Method 1 0.27%
Pills 115 31.59%
Standard Days Method 22 6.04%
Symtothermal Method 1 0.27%
Tubal Ligation 69 18.96%
Vasectomy 0 0.00%
Don't Know 2 0.55%
Others 38 10.44%
Total 364 100.00% Source: CBMS 2010
Contraceptive Prevalence Rate : 64.77% of Currently Married Women (CWM)
15-49 years old use contraceptive methods
57.65% of CWM 15-49 years old use
Modern Contraceptive Method
7.12% of CWM 15-49 years old use
Traditional Contraceptive Method
Environmental Sanitation
Solid Waste Management
Waste Generation. A total of 3 metric tons of waste were generated daily in Bahong.
There were 2.25 metric tons of wastes generated from residential areas. From institutional
areas (schools and offices), 0.26 metric tons was generated. Business establishments produce
0.24 metric tons and 0.20 metric tons comes from farms.
Estimated Total Waste Generated : 3 metric tons (mt) daily
Residential : 2.25 mt Commercial : 0.24 mt
Institutional : 0.26 mt Agriculture : 0.20 mt
Markets : 0.00 mt Source: MPDO estimate based on 0.534 kg/person/day
17
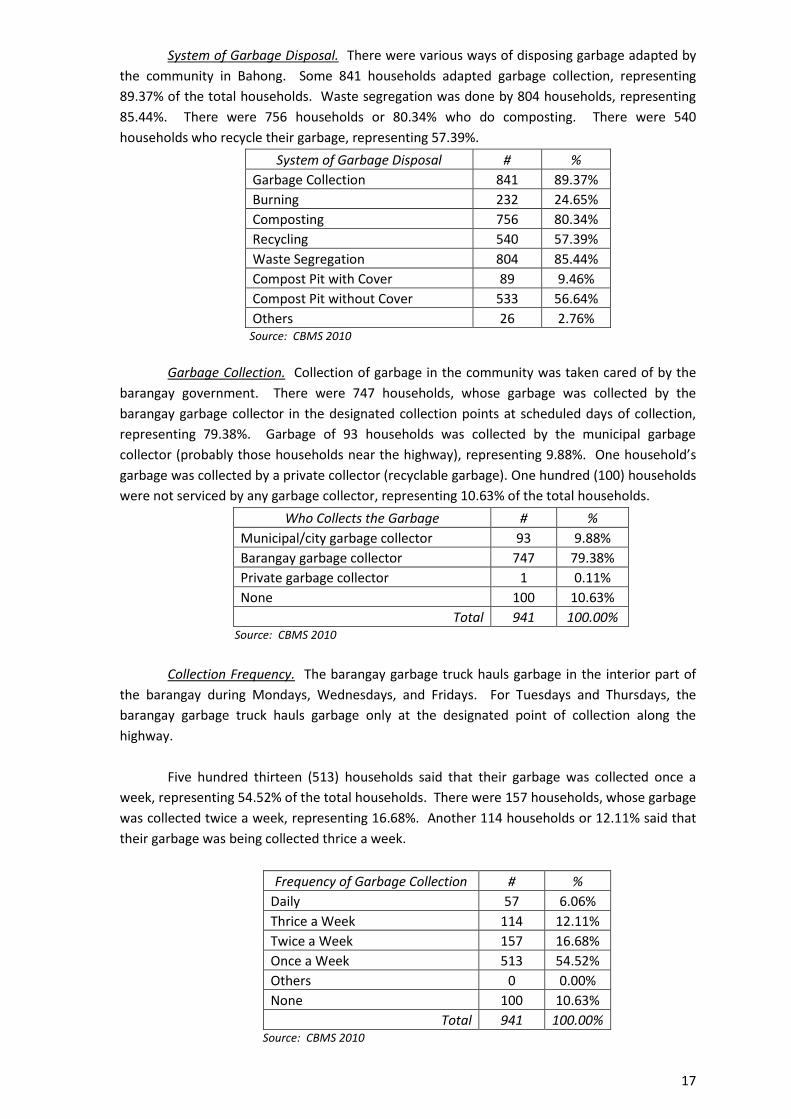
System of Garbage Disposal. There were various ways of disposing garbage adapted by
the community in Bahong. Some 841 households adapted garbage collection, representing
89.37% of the total households. Waste segregation was done by 804 households, representing
85.44%. There were 756 households or 80.34% who do composting. There were 540
households who recycle their garbage, representing 57.39%.
System of Garbage Disposal # %
Garbage Collection 841 89.37%
Burning 232 24.65%
Composting 756 80.34%
Recycling 540 57.39%
Waste Segregation 804 85.44%
Compost Pit with Cover 89 9.46%
Compost Pit without Cover 533 56.64%
Others 26 2.76% Source: CBMS 2010
Garbage Collection. Collection of garbage in the community was taken cared of by the
barangay government. There were 747 households, whose garbage was collected by the
barangay garbage collector in the designated collection points at scheduled days of collection,
representing 79.38%. Garbage of 93 households was collected by the municipal garbage
collector (probably those households near the highway), representing 9.88%. One household’s
garbage was collected by a private collector (recyclable garbage). One hundred (100) households
were not serviced by any garbage collector, representing 10.63% of the total households.
Who Collects the Garbage # %
Municipal/city garbage collector 93 9.88%
Barangay garbage collector 747 79.38%
Private garbage collector 1 0.11%
None 100 10.63%
Total 941 100.00% Source: CBMS 2010
Collection Frequency. The barangay garbage truck hauls garbage in the interior part of
the barangay during Mondays, Wednesdays, and Fridays. For Tuesdays and Thursdays, the
barangay garbage truck hauls garbage only at the designated point of collection along the
highway.
Five hundred thirteen (513) households said that their garbage was collected once a
week, representing 54.52% of the total households. There were 157 households, whose garbage
was collected twice a week, representing 16.68%. Another 114 households or 12.11% said that
their garbage was being collected thrice a week.
Frequency of Garbage Collection # %
Daily 57 6.06%
Thrice a Week 114 12.11%
Twice a Week 157 16.68%
Once a Week 513 54.52%
Others 0 0.00%
None 100 10.63%
Total 941 100.00% Source: CBMS 2010

18
Sanitation Facilities
There were 712 households who owned flush toilets with septic tanks representing
75.66% of the total households. One hundred fifty two (152) households shared with others’
septic tank, representing 16.15%. Pits are still used by some households, wherein 43 households
use closed pit and 31 households use open pit, representing 4.57% and 3.29% respectively.
Three households do not have toilet, representing 0.32%.
Kind of Toilet Facility # %
Water-sealed Flush to Sewerage/Septic Tank- own 712 75.66%
Water-sealed Flush to Sewerage/Septic Tank- shared 152 16.15%
Close Pit 43 4.57%
Open Pit 31 3.29%
No Toilet 3 0.32%
Others 0 0.00%
Total 941 100.00% Source: CBMS 2010
D. HOUSING
Residential Construction
From the records of the Municipal Engineering Office, a total of 22 new buildings were
constructed in barangay Bahong last 2012. This represents 5.82% of the total number of
buildings constructed in La Trinidad.
House Ownership
As to house ownership, 692 households were owners of house and lot representing
73.54% of the total households. There were 104 households living in a rent-free house and lot
with consent of the owner, representing 11.05%. Households who rent house or room including
lot were at 95, representing 10.10%. There were 21 households who own a house with rent-free
lot with the consent of the owner, which represent 2.23% of the total.
Households by Tenure Status # %
Owner, owner-like possession of house and lot 692 73.54%
Rent house/room including lot 95 10.10%
Own house, rent lot 11 1.17%
Own house, rent-free lot with consent of owner 21 2.23%
Own house, rent-free lot without consent of owner 3 0.32%
Rent-free house and lot with consent of owner 104 11.05%
Rent-free house and lot without consent of owner 4 0.43%
Other tenure status 11 1.17%
Total 941 100.00% Source: CBMS 2010
Average Imputed Rent per Month for the House and/Lot: Ᵽ4,091
Minimum Imputed Rent : Ᵽ100
Maximum Imputed Rent : Ᵽ60,000

19
Construction Materials of Housing Units
Walls of houses of 895 households were made of strong materials, representing 95.11%
of the total households. There were 27 households, whose dwelling walls were made out of
mixed materials, but predominantly strong materials, representing 2.87%. Fifteen (15)
households or 1.59% had houses made of light wall materials.
Households by Type of Materials Used for Walls # %
Strong Materials 895 95.11%
Light Materials 15 1.59%
Salvaged/Makeshift Materials 2 0.21%
Mixed but Predominantly Strong 27 2.87%
Mixed but Predominantly Light 2 0.21%
Mixed but Predominantly Salvage 0 0.00%
Total 941 100.00% Source: CBMS 2010
For materials used for the roofs, 869 household dwellings had roofs made of strong
materials, representing 92.35% of the total households. Roofs made out of mixed but
predominantly strong materials were at 44 or 4.68%. Households whose roofs were made of
light materials were at 21, representing 2.23% of the total.
Imputed Rent: If the house and lot is owned or being used for free, the imputed rent refers to the amount the owner would charge to rent the housing unit.
Households by Type of Materials Used for Roof # %
Strong Materials 869 92.35%
Light Materials 21 2.23%
Salvaged/Makeshift Materials 3 0.32%
Mixed but Predominantly Strong 44 4.68%
Mixed but Predominantly Light 4 0.43%
Mixed but Predominantly Salvage 0 0.00%
Total 941 100% Source: CBMS 2010
House Conveniences
The LPG Gas Stove/Range is the most commonly owned cooking appliance with 807
households or 85.76%. This is followed by television which is owned by 752 households,
representing 79.91%. There were 706 households who owned cellular phones, representing
75.03%. Six hundred fifty eight (658) households owned a radio or radio cassette, representing
69.93%.
A number of 603 households owned a CD/VCD/DVD player, representing 64.08%.
Refrigerator or freezer was owned by 529 households or 56.22% of the total households. There
were 489 households who own electric iron and 474 households who own washing machine,
representing 51.97% and 50.37% respectively.

20
Households With Appliances/Durables # %
Radio/Radio Cassette 658 69.93%
Television 752 79.91%
CD/VCD/DVD 603 64.08%
Stereo/Component 177 18.81%
Karaoke 130 13.82%
Refrigerator/Freezer 529 56.22%
Electric Fan 159 16.90%
Electric Iron 489 51.97%
LPG Gas Stove/Range 807 85.76%
Washing Machine 474 50.37%
Microwave Oven 188 19.98%
Personal Computer 287 30.50%
Mobile Phone/Cellular Phone 706 75.03%
Landline Telephone 69 7.33%
Air-conditioner 23 2.44%
Sewing Machine 43 4.57%
Car, Jeep, Motorcycle & Other Motorized Vehicles 286 30.39% Source: CBMS 2010
E. SOCIAL WELFARE
Day Care Center Facilities
Bahong Day Care Center Bahong Christian Community Day Care Center
Sadag Day Care Center
Clientele Groups
Solo Parents
There were 79 solo parents in Bahong, where 36 were males and 43 were females. The
most common reason for being a solo parent is death of spouse with 25 widows or widowers,
representing 31.65%. Reason of non-marriage accounted for 22 solo parents, representing
27.85%. There were 10 solo parents due to legal separation, representing 12.66%. Another 10
solo parents or 12.66% were due to abandonment of spouse.
Reasons For Being A Solo Parent Male Female Total %
Death of Spouse 9 16 25 31.65%
Imprisonment of Spouse 2 0 2 2.53%
Legal Separation from Spouse for At least One Year 6 4 10 12.66%
Abandonment of Spouse for At least One Year 7 3 10 12.66% Unmarried Mother/Father Who Preferred to Keep the Child Instead of Others Caring for Him/her 8 14 22 27.85%
Assumes the Responsibility of the Head of the Family 0 2 2 2.53%
Other Reason 4 4 8 10.13%
Total 36 43 79 100.00% Source: CBMS 2010

21
Persons with Disability
A total of 82 persons with disabilities were recorded in Bahong in 2010, where 63 were
males and 19 were females. There were 6, 3 males and 3 females, who were regularly impaired
by mental illness, representing 7.32% of the total number of persons with disabilities. Five (5)
male individuals were partially blind, representing 6.10%. Another 5 persons, 4 males and a
female had severe cerebral palsy, representing 6.10%. There were 4 males who had oral defect,
representing 4.88%. Another 4 had mild cerebral palsy and 4 people were regularly intellectually
impaired, representing 4.88%.
Persons With Disability By Type Male Female Total %
Total Blindness 3 0 3 3.66%
Partial Blindness 5 0 5 6.10%
Low Vision 1 0 1 1.22%
Totally Deaf 3 0 3 3.66%
Partially Deaf 1 0 1 1.22%
Hard of Hearing 1 0 1 1.22%
Oral Defect 4 0 4 4.88%
Mild Cerebral Palsy 2 2 4 4.88%
Severe Cerebral Palsy 4 1 5 6.10%
Regularly Intellectually Impaired 3 1 4 4.88%
Severely Intellectually Impaired 1 1 2 2.44%
Regularly Impaired by Mental Illness 3 3 6 7.32%
Severely Intellectually Impaired by Mental Illness 2 0 2 2.44%
Severely Multiple Impaired 0 2 2 2.44%
Others 30 9 39 47.56%
Total 63 19 82 100.00% Source: CBMS 2010
Disabilities of 31 individuals were due to illness, with 31 males and 8 females,
representing 47.56% of the total number of disabled person. Individuals with in-born disabilities
were at 34, where 27 were males and 7 were females, representing 41.46%. Accident-related
disability accounted to 8 individuals, 5 males and 3 females, representing 9.76%.
Cause of Disability Male Female Total %
In-born 27 7 34 41.46%
Illness 31 8 39 47.56%
Accident 5 3 8 9.76%
Others 0 1 1 1.22%
Total 63 19 82 100.00% Source: CBMS 2010
Out of 82 persons with disabilities, only 8 individuals were able to receive assistance,
representing 9.76%. There were 3 individuals who were able to receive food assistance,
representing 3.66% of the total disabled persons. Financial assistance was received by 2
disabled persons representing 2.44%. One individual was able to receive medical assistance,
representing 1.22%. Two (2) disabled individuals received other kind of assistance, representing
2.44%. Sources of assistance were from government having 6 recipients, 1 from non-
government agency and 1 from other sources.

22
Source: CBMS 2010
Senior Citizens
A number of 183 senior citizens were recorded in Bahong, with 123 males and 60
females, representing 4.34% of the total population. There were 126 seniors who had their
identification cards, which composed of 76 males and 50 females, representing 68.85% of the
total. Fifty seven (57) seniors with 47 males and 10 females do not have their identification
cards, representing 31.15%. There were 24 seniors who were able to use their identification
cards, of which 6 were males and 18 were females, representing 13.11%.
Senior Citizen ID Usage Male Female Total %
Members Who Has Able to Use ID 6 18 24 13.11%
With Identification Card 76 50 126 68.85%
Without Identification Card 47 10 57 31.15%
Total 123 60 183 4.34% Source: CBMS 2010
Access to Government Programs
A total of 519 households were able to benefit from various programs of the
Government, representing 55.15% of the total households. Most or 140 of the households were
recipients of the Supplemental Feeding program, representing 26.97%. The Philhealth for
Indigents program had 136 beneficiaries, representing 26.20%. There were 131 households or
25.24% who were recipients of Health Assistance program. The Credit program had 54
recipients, representing 10.40% of the total. From the total beneficiaries of the Government
programs, 419 households or 80.73% said that the effects of the programs are good.
Types of Programs Received/Availed by the HHs # %
Recipient of CARP 13 2.50%
Philhealth For Indigents 136 26.20%
Supplemental Feeding Program 140 26.97%
Health Assistance Program 131 25.24%
Education /Scholarship Program 34 6.55%
Skills Or Livelihood Training Program 2 0.39%
Housing Program 0 0.00%
Credit Program 54 10.40%
Other Types Of Program 9 1.73%
Total 519 100.00% Source: CBMS 2010
Program Effect Rating # %
Positive 419 80.73%
No Effect 48 9.25%
Negative Effect 52 0.10
Total 519 100.00% Source: CBMS 2010
Source of Assistance Received # %
Government 6 7.32%
NGO 1 1.22%
Others 1 1.22%
Total 8 9.76%
Assistance Received # %
Medical Assistance 1 1.22%
Financial Assistance 2 2.44%
Food Assistance 3 3.66%
Others 2 2.44%
Total 8 9.76%

23
F. PUBLIC SAFETY
Peace and Order
In 2012, a total of 56 incidents of crime were recorded in barangay Bahong. There were
31 victims of vehicular accidents in the community, representing 55.36% of the total. Physical
injuries accounted to 7 victims, representing 12.50%. Five (5) individuals were victims of non-
index crimes, representing 8.93% of the total.
Victims of Crime # %
Car Napping 1 1.79%
Child Abuse 1 1.79%
Other Non-index 5 8.93%
Physical Injuries 7 12.50%
Robbery 4 7.14%
Theft 3 5.36%
Special Laws 1 1.79%
VAWC 3 5.36%
Vehicular Accidents 31 55.36%
Total 56 100.00% Source: PNP-LT, 2012 Data
Calamity
In year 2010, a total of 734 households said that they were affected by natural and/or
man-made disasters. Majority of the households or 99.59% were affected by typhoon. Three (3)
households were due to flood representing 0.41% of the total.
Types of Calamities # %
Typhoon 731 99.59%
Flood 3 0.41%
Drought 0 0.00%
Earthquake 0 0.00%
Volcanic Eruption 0 0.00%
Armed Conflict 0 0.00%
Fire 0 0.00%
Others 0 0.00%
Total 734 100.00% Source: CBMS 2010
V. ECONOMY A. SOURCE OF INCOME
Entrepreneurial Activities
As to source of income, there were 343 households who are engaged in crop farming
and gardening with an average annual income of Ᵽ103,700. One hundred seventy five (175)
households were in wholesale and retail trade activities having Ᵽ110,414 average annual
income. Sixty six (66) households were engaged in transportation, storage, and communication
services, wherein their average annual income was at Ᵽ142,199. Livestock and poultry raising
accounted to 38 households having an average income of Ᵽ27,997 annually.

24
Entrepreneurial Activities by Income Households Income (Ᵽ)
# % Minimum Average Maximum
Crop Farming and Gardening 343 36.45% Ᵽ1,000 Ᵽ103,700 Ᵽ1,500,000
Livestock and Poultry Raising 38 4.04% 2,000 27,997 200,000
Fishing Activities 0 0.00% 0 0 0
Forestry and Hunting Activities 2 0.21% 60,000 80,000 100,000
Wholesale & Retail Trade Activities 175 18.60% 1,000 110,414 1,489,400
Manufacturing Activities 7 0.74% 15,000 57,214 108,000
Community, Social & Personal 17 1.81% 12,000 79,649 300,000
Transportation, Storage, and Communication Services
66
7.01% 10,008 142,199 1,382,400
Mining and Quarrying Activities 5 0.53% 16,000 63,330 316,648
Construction 9 0.96% 48,000 226,933 1,200,000
Other Activities 26 2.76% 7,000 74,292 480,000
Total 688 Source: CBMS 2010
Salaries and Wages
More than half of the total households in Bahong were wage earners. This comprised of
495 households having an average income of Ᵽ242,765 annually.
Salaries and Wages by Income Households Income (Ᵽ)
# % Minimum Average Maximum
Salaries and Wages 495 52.60% Ᵽ4,800 Ᵽ242,765 34,464,000 Source: CBMS 2010
Additional Sources of Income
Aside from the main source of income, 647 households had other source of income.
There were 210 households who received dividends from investments with average annual
income of Ᵽ37,525. A number of 158 households received remittances from Overseas Filipino
Workers having an average income of Ᵽ149,618 annually. Ninety six (96) households had
additional income from cash receipts, support, assistance and relief from domestic sources with
an average income of Ᵽ23,568.
Some 52 households received cash receipts, gift, support, relief and other income from
abroad with an average income of Ᵽ55,561 annually. Forty three (43) households made
additional income from rentals of agricultural lands, buildings, spaces and other properties
having an average annual income of Ᵽ73,930. There were 39 households who received
additional income from retirement pensions with an average income of Ᵽ140,681 annually.
Additional Sources of Income Number of HHs
Minimum Income
Average Income
Maximum Income
Net Share of Crops, Livestock, and Poultry Raised by Other Households
12 Ᵽ1,500
Ᵽ40,808
Ᵽ200,000
Remittances from Overseas Filipino Workers 158 1,000 149,618 3,000,000 Receipts from Abroad 52 500 55,561 600,000 Receipts from Domestic Sources 96 200 23,568 288,000 Rentals Received 43 500 73,930 360,000 Interest Earned 28 100 1,183 168,000 Pension and Retirement Received 39 810 140,681 1,080,000 Dividends from Investment 210 100 37,525 7,880,190 Other Sources 9 100 157,789 700,000
Total 647 Source: CBMS 2010

25
Annual Per Capita Income
Based on 2010 Survey, a number of 124 households had an annual per capita income of
less than Ᵽ15,820 (poverty threshold), representing 13.18% of the total population. The annual
per capita poverty threshold is the minimum annual income required to be spent by each
member of a family to satisfy their nutritional requirements and other basic needs. None of
them said that they experienced food shortage for the past three months.
Agriculture
Bahong has 343 households who were engaged in agriculture. This represents 36.45% of
the total number of households.
Tenure Status. There were 256 households who owned the agricultural land they were
tilling, representing 74.64% of the total number of households engaged in agriculture. Fifty five
(55) households rent the land they were cultivating, representing 16.03%. Thirty one (31)
households or 9.04% do not own the land they were tilling but have the consent of the owner.
Tenure Status(Agricultural Land) # %
Owned or owner-like possession 256 74.64%
Rent 55 16.03%
Not owned but with consent of owner 31 9.04%
Not owned and without consent of owner 1 0.29%
Other 0 0.00%
Total 343 100.00% Source: CBMS 2010
Agricultural Land Area. About 312 households were cultivating an agricultural land area
of less than one hectare, representing 90.96% of the total number of households engaged in
farming. Twenty nine (29) households or 8.45% worked on 1-3 hectares of agricultural land.
Only 2 households were working on agricultural land area more than 5 hectares, representing
0.58%.
Area of Agricultural Land # %
Less Than 1 Hectare 312 90.96%
1 - 3 Hectares 29 8.45%
3.1 - 5 Hectares 0 0.00%
More Than 5 Hectares 2 0.58%
Not Specified 0 0.00%
Total 343 100.00% Source: CBMS 2010
Agricultural Implements. Most of the farmers or 886 farmers said that they own the
equipment or facilities they use, representing 92.97% of all farmers. There were 64 farmers who
do not actually own the equipment and/or facilities they use in the farm, representing 6.72%.
The insecticide or pesticide sprayer was used by 305 farmers, representing 32% of all the
farmers. Two hundred thirty eight (238) farmers owned a harrow, representing 24.97%. And
irrigation pump was used by 141 farmers or 14.80% of the total.
Ownership of Equipments/Facilities # %
Yes 886 92.97%
No 64 6.72%
Not Stated 3 0.31%
Type of Agricultural Equipment/Facilities Used # %
Beast of Burden 8 0.84%
Plow 41 4.30%
Harrow 238 24.97%

26
Mower 59 6.19%
Thresher or Corn Sheller 19 1.99%
Insecticide/ Pesticide Sprayer 305 32.00%
Farm Tractor 13 1.36%
Hand Tractor 12 1.26%
Turtle or Mud boat 1 0.10%
Planter/Transplanter /Dryers 3 0.31%
Mechanical Dryer 3 0.31%
Multipurpose Drying Pavement 4 0.42%
Rice Mill/Corn Mill/Feed Mill 2 0.21%
Harvester, Any Crop 5 0.52%
Warehouse Granary 13 1.36%
Farm Shed 75 7.87%
Irrigation Pump 141 14.80%
Other Equipments/Facilities 11 1.15% Source: CBMS 2010
Livestock Raising
There were 38 households who were engaged in livestock raising. Most of the
households or 28 households raised hog for fattening, representing 73.68%. Four (4) households
raised chicken which represent 10.53%. Chicken for egg laying was raised by only one
household. Five (5) households raised other kind of livestock or poultry, representing 13.16% of
the total.
Livestock Being Raised by Households # %
Hog for Fattening 28 73.68%
Sow 0 0.00%
Goat 0 0.00%
Carabao 0 0.00%
Cow 0 0.00%
Chicken 4 10.53%
Chicken for Egg Laying 1 2.63%
Duck 0 0.00%
Other Livestock/Poultry 5 13.16%
Total 38 100.00% Source: CBMS 2010
There were a total of 5,343 kilograms of meat and 42 live animals that were produced by
those households engaged in livestock or poultry raising.
Volume of Production of Livestock/Poultry Volume of Production
Live animals 42 heads
Meat 5,343 kgs.
Milk 0 liter.
Eggs 0 pc. Source: CBMS 2010
B. EMPLOYMENT
Labor Force
Bahong has a total potential labor force of 2,683 persons (15 t0 64 years old), with 1,381
males and 1,302 females. The actual labor force is 1,796 persons, 1,077 males and 719 females,
which does not include those unable, not available and not looking for work (e.g. students,
disabled persons, housewives, retired persons and seasonal workers). A total of 1,777

27
individuals were employed which composed of 1,707 persons aged 15-64 years old, 63 persons
who are 65 years old and above, and 7 who are 14 years old and below, garnering a high 98.94%
employment rate. Only 19 individuals were unemployed representing 1.06%.
Labor Force Male Female Total %
Potential Labor Force (15-64 years old) 1,381 1,302 2,683 Actual Labor Force
Employed 1,068 709 1,777 98.94%
Employed Members (15-64 Years Old ) 1,032 675 1,707 95.04%
Employed Members (14 Years Old & Below) 3 4 7 0.39%
Employed Members (65 Years Old & Above) 33 30 63 3.51%
Unemployed Members Who are Looking for Work 9 10 19 1.06%
Actual Labor Force 1,077 719 1,796 100.00% Source: CBMS 2010
Nature of Employment
Of the total employed, 1,626 individuals were permanently employed with 970 males
and 656 females, representing 91.50%. Individuals employed in short-term, seasonal and or
casual basis were at 121 composed of 78 males and 43 females, and representing 6.81%. There
were 30 persons, 20 males and 10 females, who worked on different jobs on day to day or week
to week basis, representing 1.69% of the total number of employed.
Nature Of Employment Male Female Total %
Permanent 970 656 1,626 91.50%
Short-term, seasonal, casual 78 43 121 6.81%
Worked on different jobs on day to day/week to week 20 10 30 1.69%
Total 1,068 709 1,777 100.00% Source: CBMS 2010
Employment by Sector
Most or 817 individuals or 45.98% were employed in agriculture, mining and forestry,
wherein 551 were males and 266 were females. This is followed by 247 individuals employed in
wholesale and retail trade with 86 males and 161 females, representing 13.90%. There were
162 persons employed in transportation, storage and communication sector, which represents
9.12%. This composed of 151 males and 11 females.
Some 137 persons were employed in other community, social or personal activities with
54 males and 53 females, representing 6.02%. Education sector employed 89 individuals with 20
males and 69 females, representing 5.01% of the total. There were 82 persons or 4.61% who
were employed in public administration and defense sector, which consists of 50 males and 32
females.
Employment By Sector/Industry Male Female Total %
Agriculture, Mining, and Forestry 551 266 817 45.98%
Fishing 3 2 5 0.28%
Mining and Quarrying 10 0 10 0.56%
Manufacturing 13 6 19 1.07%
Electricity, Gas, and Water Supply 13 3 16 0.90%
Construction 56 5 61 3.43%
Wholesale & Retail Trade 86 161 247 13.90%
Hotel and Restaurants 15 11 26 1.46%
Transportation, Storage, and Communication 151 11 162 9.12%

28
Financial Intermediation 13 13 26 1.46%
Real Estate, Renting, and Business Activities 12 10 22 1.24%
Public Administration and Defense 50 32 82 4.61%
Education 20 69 89 5.01%
Health and Social Work 9 27 36 2.03%
Other Community, Social/Personal Activities 54 53 107 6.02%
Private HHs with Employed Persons 9 40 49 2.76%
Extra- territorial Organization 3 0 3 0.17%
Total 1,068 709 1,777 100.00% Source: CBMS 2010
Primary Occupation or Business
There were 608 farmers, forestry workers and fishermen which composed of 413 males
and 195 females. It has a percentage rate of 34.21% of the total employed labor force. Three
hundred fifty nine (359) individuals were laborers and unskilled workers, of which 242 were
males and 117 were females, representing 20.20%. Service workers and shop and market sales
workers were at 354 or 19.92%, wherein there were 152 males and 202 females.
A number of 135 individuals were physical, mathematical and engineering science
professionals, wherein 45 were males and 90 were females, representing 7.60%. There were
101 who were officials of government and special-interest organizations, corporate executives,
managers, managing proprietors and supervisors, of which 58 were males and 43 were females,
representing 5.68%.
Type Of Primary Occupation Or Business Male Female Total % Officials of Gov't & Special-Interest Organizations, Corporate Executives, Managers, Managing Proprietors & Supervisors
58
43
101 5.68%
Physical, Mathematical &Engineering Science Professionals 45 90 135 7.60%
Technician and Associate Professionals 16 12 28 1.58%
Clerks 22 30 52 2.93%
Service Workers and Shop and Market Sales Workers 152 202 354 19.92%
Farmers, Forestry Workers and Fishermen 413 195 608 34.21%
Trades and Related Workers 22 12 34 1.91%
Plant and Machine Operators and Assemblers 95 4 99 5.57%
Laborers and Unskilled Workers 242 117 359 20.20%
Special Occupations 3 4 7 0.39%
Total 1,068 709 1,777 100.00% Source: CBMS 2010
Class of Worker
Individuals who worked for a household were at 539 with 314 males and 225 females,
representing 30.33%. There were 376, 243 males and 133 females, who worked for a private
establishments representing 21.16%. Two hundred eighty two (282) or 15.87% worked without
pay on their own family operated farm or business, with 184 males and 98 females. Another 271
individuals were self-employed. There were 150 males and 121 females, representing 15.25%
of the total.

29
Class Of Worker Male Female Total %
Worked for a household 314 225 539 30.33%
Worked for a private establishment 243 133 376 21.16%
Worked for government/government corporation 58 61 119 6.70%
Self employed without employees 150 121 271 15.25%
Employer in own family-operated farm/business 50 34 84 4.73%
Worked with pay on own family operated farm/business 69 37 106 5.97%
Work without pay on own family operated farm/business 184 98 282 15.87%
Total 1,068 709 1,777 100.00% Source: CBMS 2010
Professionals
There were a total of 262 individuals who were professionals, wherein 228 were males
and 34 were females. Most of them were professional teachers which accounted to 87
individuals, of which 75 were males and 12 were females, representing 33.21%. Nurses were at
62 with 56 males and 6 females, representing 23.66%. Some 26 individuals or 9.92% were
criminologist, wherein 24 were males and 2 were females. Civil engineers accounted to 14
individuals, of which 10 were males and 4 were females, representing 5.34%
Type of Professionals Male Female Total %
Aeronautical Engineer 1 2 3 1.15%
Agriculturist 3 0 3 1.15%
Architect 1 0 1 0.38%
Attorney-at-Law 5 0 5 1.91%
Certified Public Accountant 8 1 9 3.44%
Chemical Engineer 1 0 1 0.38%
Chief Mate (Marine Deck Officer) 1 0 1 0.38%
Civil Engineer 10 4 14 5.34%
Criminologist 24 2 26 9.92%
Dentist 3 0 3 1.15%
Elect. And Comm. Engineer 5 0 5 1.91%
Forester 4 0 4 1.53%
Geodetic Engineer 3 0 3 1.15%
Geologist 0 1 1 0.38%
Major Patron (Marine Deck Officer) 1 0 1 0.38%
Master Mariner 1 0 1 0.38%
Mechanical Plant Engineer 1 0 1 0.38%
Medical Doctor 1 0 1 0.38%
Medical Laboratory Technician 1 0 1 0.38%
Medical Technologist 4 0 4 1.53%
Midwife 2 0 2 0.76%
Nurse 56 6 62 23.66%
Optometrist 2 0 2 0.76%
Pharmacist 2 0 2 0.76%
Physician 2 0 2 0.76%
Professional Teacher 75 12 87 33.21%
Radiologic Technologist 1 0 1 0.38%
Social Worker 1 2 3 1.15%
Veterinarian 1 1 2 0.76%
Other Profession 8 3 11 4.20%
Total 228 34 262 100.00% Source: CBMS 2010
Unemployment and Job Search Method

30
There were 19 unemployed individuals (15-64 years old) who were seeking for work. As
job search method, most or 11 individuals approached the employer directly, representing
57.89% of the total unemployed. Five (5) individuals approached relatives or friends,
representing 26.32%. One individual registered in a public employment agency, 1 answered
private advertisement, and another one registered in private employment agency, representing
5.26% for each job search method.
Job Search Method (15-64 Years Old) Male Female Total %
Registered in public employment agency 1 0 1 5.26%
Registered in private employment agency 0 1 1 5.26%
Approached employer directly 5 6 11 57.89%
Approached relatives/friends 2 3 5 26.32%
Placed or answered private advertisements 1 0 1 5.26%
Others 0 0 0 0.00%
Total 9 10 19 100.00% Source: CBMS 2010
Reason for Not Searching or Applying for a Job
Out of the total potential labor force, 957 individuals were not searching or applying for
work. Most of them were students, which accounted to 439 or 45.87%, of which, 183 were
males and 256 were females. Two hundred ninety nine (299) persons are not seeking for job
due to housekeeping duties, with 26 males and 273 females, representing 31.24%.
There were 65 who were either too young or old, retired, and/or permanently disabled,
representing 6.79%. Sixty four (64) individuals were waiting for the results of previous job
application, representing 6.69% of the total. A number of 43 persons or 4.49% were temporarily
ill or disabled.
Reasons For Not Looking For Work Male Female Total %
Believes no work is available 14 6 20 2.09%
Awaiting results of previous job application 37 27 64 6.69%
Temporary illness/disability 28 15 43 4.49%
Bad Weather 0 1 1 0.10%
Waiting for rehire/job recall 13 1 14 1.46%
Too young/old, retired, permanently disabled 32 33 65 6.79%
Housekeeping 26 273 299 31.24%
Schooling 183 256 439 45.87%
Other reasons 7 5 12 1.25%
Total 340 617 957 100.00% Source: CBMS 2010
Overseas Employment
A total of 218 Overseas Filipino Workers were recorded in Bahong. This composed of
149 males and 69 females. Most or 59 workers were in Japan, representing 27.06% of the total
OFWs. Some 27 OFWs worked in Hong Kong, representing 12.39%. Workers in United Kingdom
were at 22 or 10.09%.
Saudi Arabia accommodated 19 workers, which accounted to 8.72% of the total. There
were 16 workers in Canada, representing 7.34%. The United States of America hired 12 workers.

31
Country of Work # % Country of Work # %
Bahrain 1 0.46% Portugal 1 0.46%
Canada 16 7.34% Qatar 4 1.83%
China 4 1.83% Russia 1 0.46%
Cyprus 1 0.46% Saudi Arabia 19 8.72%
Haiti 2 0.92% Singapore 6 2.75%
Hong Kong 27 12.39% Spain 3 1.38%
Ireland 1 0.46% Switzerland 1 0.46%
Israel 3 1.38% Taiwan 3 1.38%
Japan 59 27.06% Turkey 1 0.46%
Korea 5 2.29% Thailand 3 1.38%
Kuwait 1 0.46% United Arab Emirates 9 4.13%
Macao 6 2.75% United Kingdom 22 10.09%
Malaysia 3 1.38% United States of America 12 5.50%
Maldives 1 0.46% Zambia 2 0.92%
New Zealand 1 0.46% Total 218 100.00%
Source: CBMS 2010
Kind of Work Abroad
Majority of the OFWs or 97.71% were service, shops and market sales workers abroad.
Three individuals were physical, mathematical and engineering science professionals. Two (2)
individuals worked abroad as technician and associate professionals.
Kind Of Work In Abroad Male Female Total % Officials of Gov't and Special-Interest Organizations, Corporate Executives, Managers, Managing Proprietors and Supervisors 0 0 0 0.00%
Physical, Mathematical and Engineering Science Professionals 3 0 3 1.38%
Technician and Associate Professionals 0 2 2 0.92%
Clerks 0 0 0 0.00%
Service Workers and Shop and Market Sales Workers 146 67 213 97.71%
Farmers, Forestry Workers and Fishermen 0 0 0 0.00%
Trades and Related Workers 0 0 0 0.00%
Plant and Machine Operators and Assemblers 0 0 0 0.00%
Laborers and Unskilled Workers 0 0 0 0.00%
Special Occupations 0 0 0 0.00%
Total 149 69 218 100.00% Source: CBMS 2010
C. INFRASTRUCTURE & UTILITIES
Electricity
A total of 906 households have electrical connections with BENECO, representing
96.28% of the total households. While there were 33 households who do not have electrical
connection, representing 3.51%. The average monthly electrical bill was at Ᵽ736.00.
Number of Households with Electricity Connections: 906 (96.28% of total households)
Number of Households w/o Electrical Connections : 33 (3.51% of total households)
Average Monthly Electrical Bill : Ᵽ736.00

32
Source of Electricity # %
Electric Company 906 96.28%
Generator 0 0.00%
Solar 0 0.00%
Battery 0 0.00%
Others 2 0.22%
None 33 3.51%
Total 941 100.00% Source: CBMS 2010
Access to Safe Drinking Water
There were 516 households who have access to safe water (bottled water), representing
54.84% of the total households. Some 227 households or 24.12% have their own connections to
the community water system and 34 households shared with other households’ water
connection. Source of water of 148 households is from rivers, stream, lake and/or spring,
representing 15.73%.
Source of Drinking Water # %
Community Water System-own 227 24.12%
Community Water System-shared 34 3.61%
Deep Well-own 2 0.21%
Deep Well-shared 2 0.21%
Artesian Well-own 1 0.11%
Artesian Well-shared 0 0.00%
Dug/Shallow Well-own 0 0.00%
Dug/Shallow Well-shared 1 0.11%
River, Stream, Lake, Spring 148 15.73%
Bottled Water 516 54.84%
Tanker Truck/Peddler 6 0.64%
Others 4 0.43%
Total 941 100.00% Source: CBMS 2010
There were 343 households, whose source of drinking water is within their premises,
representing 36.45%. Sixty seven (67) households’ source of water is outside their premises but
around 250 meters or less, representing 7.12%. Source of water of 7 households is outside their
premises and more than 251 meters, representing 0.74% of the total households.
Distance of Source of Drinking Water # %
Within Premises 343 36.45%
Outside Premises But 250 Meters/Less 67 7.12%
251 Meters or More 7 0.74%
Don't Know 2 0.21%
Not Stated 522 55.47%
Total 941 100.00% Source: CBMS 2010

33
Domestic Water System
The Bahong Multi-Purpose Cooperative runs a domestic water system that serves some
households in the community. There were 261 households being serviced by the system.
From the records of La Trinidad Water District, there were 167 households who have
connection by their domestic water system.
Roads
Name of Road Length
(km) Road
ROW (M) Area of
Jurisdiction Remarks
Baguio-Bontoc Road 9.687 20.000 National Concrete
Camp Dangwa-Bahong-Sadag Rd. 3.030 4.000 Provincial Concrete
(Camp Dangwa) Ma-e-Bahong Rd. 0.375 3.000 Barangay Concrete
Bahong-Tawang Road 2.000 3.000 Barangay Concrete
Bahong-Tomay Road 1.442 2.880 Barangay Concrete
Camp Dangwa-Make Road 0.625 2.650 Barangay Concrete
Halsema-Sungkian-Tomay-Bahong Rd. 0.500 3.000 Barangay Gravel
Pagal-Pasnaan Road 0.500 2.580 Barangay Gravel Source: CLUP 2000-10 &2013-2023
CBMS Indicators of Poverty
Access to safe water is the top problem of barangay Bahong. There were 145
households who do not have access to safe water. Most of the households who do not have
access to safe water are found in Tomay with 58 households. There were 36 in Sadag, 27 in
Central Bahong, 19 in Ma-e and 5 households in Anoding.
Another felt problem in the community is low income. A total of 124 households were
affected, where 45 households were affected in Sadag, 30 households in Central Bahong, 20
households in Anoding, another 20 households in Tomay, and 9 households in Ma-e.
UNMET NEEDS
HHs w/ number of Unmet Needs

34
Poverty Indicators/Sitio Sad
ag
Cen
tra
l
Ba
ho
ng
An
od
ing
Ma
-e
Tom
ay
Tota
l
A.EDUCATION
Children Not Attending E/S 5 2 3 1 6 17 Children Not Attending High School 12 4 5 5 10 36 B.HEALTH & NUTRITION Children (0-5 years old) who died 2 0 0 0 0 2 Women who Died 0 0 0 0 1 1 Malnourished Children 1 0 0 0 0 1 C. HOUSING HH Who are Squatters 2 1 1 2 0 6 HH in Makeshift Housing 0 1 0 0 0 1 D.INCOME & LIVELIHOOD HH w/ incomes Below Poverty Threshold 45 30 20 9 20 124 HH w/ incomes Below Food Threshold 30 11 12 6 7 66 HH who Experienced Hunger 0 0 0 0 0 0 Unemployed 3 0 1 0 9 13 E.WATER & SANITATION HH without Access to Safe Water 36 27 5 19 58 145 HH with No Sanitary Toilet 5 11 7 0 8 31
Source: CBMS 2010, as verified by Barangay Officials in 2012
Related Documents