I. Pace II. “Value Bubble” ? III. Evolving Distributor Landscape. IV. Unique Approaches V. Conclusion / Questions

I. Pace II. “Value Bubble” ? III. Evolving Distributor Landscape. IV. Unique Approaches V. Conclusion / Questions.
Dec 22, 2015
Welcome message from author
This document is posted to help you gain knowledge. Please leave a comment to let me know what you think about it! Share it to your friends and learn new things together.
Transcript
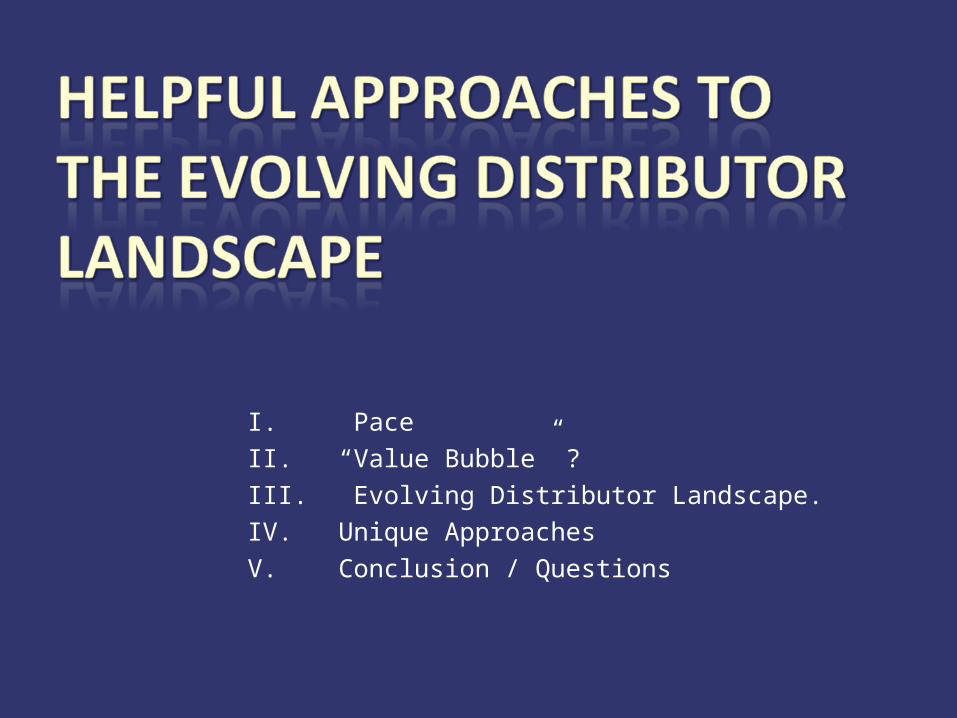
I. PaceII. “Value Bubble” ?III. Evolving Distributor Landscape. IV. Unique ApproachesV. Conclusion / Questions


Pain Pleasure
•Supplier pressure.•Declining profit.•Losing brands.•Failing to get “hot” new products (internal or external).•Poor performance by major supplier.•Consolidation (supplier or competitor).•Legal, legislative, tax changes.•Anxiety of change.
•Premium price.•Continued employment.•Confidentiality.•Better ROI elsewhere.•Ease of process.•Sell everything.•Quality of life..

A-B branches counted as one distributor.
Top3
Top 5
Top5
Top 10
Top 4
Top 25
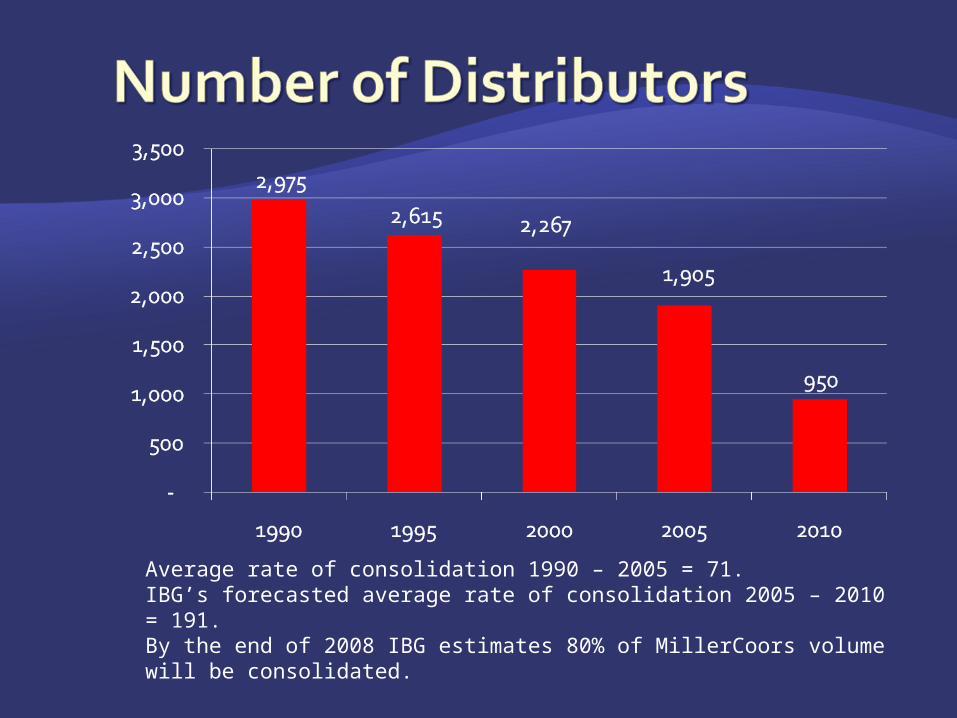
Average rate of consolidation 1990 – 2005 = 71.IBG’s forecasted average rate of consolidation 2005 – 2010 = 191.By the end of 2008 IBG estimates 80% of MillerCoors volume will be consolidated.

2007Rank Distributor Volume Activity
1 Anheuser Busch Branches 92.0 What will InBev do?2 Reyes 57.4 San Diego ?3 Goldring / Moffett 41.24 Ben E. Keith 38.0 Non Exclusive5 Silver Eagle 35.3 San Antonio6 Manhattan Beer 28.67 Topa Equities (John Anderson) 27.0 Coors LA8 JJ Taylor 23.7 Minneapolis?, Ft. Lauderdale.9 L. Knife 23.0 Craft Beer Company Formed10 Hensley 22.8 President??

Rank Distributor Volume Activity
11 Gold Coast 22.0 Ft. Lauderdale (tried to buy A-B)12 Andrews Distributing 20.9 Miller Ft. Worth13 Soave Distributing 20.2 A-B partnerships14 Banko 16.815 United Distributors 16.016 Monarch 15.2 Buying in Indiana17 Glazer's 15.0 Merged with Southern Wine & Spirits18 Shenck 13.9 Selling19 Standard Sales 13.820 Heidelberg Distributing 13.5 Ohio?

2007Rank Distributor Volume Activity
21 Frank Fuhrer 13.422 House of LaRose 11.523 Clare Rose 11.224 Premier Distributing 10.925 Houston Distributing 10.9 Part of Keg 1

At least 90% of volume will be done by Mega distributors.

• Average # of cases A-B / Other Mega:6,602,276
• Average # of cases A-B / Other small: 825,284
• Average # of cases M/C/O Mega:4,649,082
• Average # of cases M/C/O small:1,074,455
• Average # of cases No big 2: 95,796
Based on Industry volume of 218.25M Bbls. Assumes in next 5 years A-B will have 30% of All Other volume, MillerCoors will have 68% of All Other volume and those with No Big 2supplier will have 2%.

• Mega distributors are picking up steam.– Reyes, Silver Eagle, JJ Taylor, Ingram, COHO, Ben E.
Keith.– Regional or national emphasis?
• Regional: Ingram, Silver Eagle, COHO.• National: Southern Wine & Spirits, Reyes.
• Miller/Coors JV impact on consolidation.– State franchise laws and contracts will have huge
impact on emphasis.– No more status quo survivors (no profit, no pressure,
no problem attitude is no longer acceptable).– JV is being aggressive in seeking to accomplish
synergies.• Will A-B accelerate consolidation?

• Buyers pushing back on sharing synergies.• Sellers (and Brokers) are getting very
aggressive.• Punitive damages sought from buyers.
• Banks are requiring more equity and credit markets are forecasted to tighten.
• Approval process is expensive.– Suppliers use approval process to gain financial
commitments.– Some distributors major in minors.– Brand flight increasing.

• Different types of Valuation Methods:– Stand Alone: Outside party purchases your business. No
synergies exist and the value is determined by the ability of the company to generate future cash flows.
– Horizontal Value – Some synergies can be expected when a wholesaler purchases his neighbor.
– Vertical Value – One wholesaler buying another in the same market. Savings are created through closing of warehouse(s), number of people and equipment needed.
The value of any business is determined by its ability to generate cash flow.
NOT Gross Profit Multiple and NOT Per Case!!

Weighted Average For 2007 Is 3.02, up 20% in 22 months!Brands and businesses – asset sale.
1995-2005 +3.8% per year / 22 months +20%.

A-B 3.30 = MillerCoors 1.90 Other domestics 1.20 Crafts 2.83 = Imports 3.25 National Avg. 3.02
?Sources: IBG transactions, Litigation, Verified Trade Publications through 2007.
Recent trends
Increased profit caused by organic growth in volume and margin with aggressive cost containment by distributors.
A-B distributors began aggressively buying non A-B brands.
Economics of consolidation works. Low cost of money. Panic. MillerCoors JV. A-B - InBev

You decide. Different for every market. Credit crisis. Slowing of high-end brands (price increase?). Growth of low-end brands (price increases?). Tax increases on beer Beverage industry growth vs. other industries
(global). Franchise laws being tested. Impact of litigation. Industry of turtles, not rabbits.


Past (1996) – mostly dominated by single system at supplier / distributor level. IBG’s definition of dominance is any share
advantage of more than 2 to 1. A-B = 45.4% SOM Miller = 21.9 SOM Coors = 10.0% SOM Others = 22.7% SOM

• Supplier Landscape – MillerCoors– A-B / InBev– Crown consolidated.– Heineken / Femsa / Scottish & Newcastle.– Pyramid & Magic Hat.
• Current (2008) – Supplier / distributor landscape becoming more competitive.– Consumers changing attitudes.– Wine & spirits growth.– Marketing shift (macro to micro).– Non-A-B distributor consolidation. – A-B consolidation?
• Industry now more competitive.

A-B Miller Coors OthersAZ 57.9% 17.1% 13.1% 11.9%GA 54.0% 22.6% 6.1% 17.2%FL 54.7% 21.7% 5.0% 18.6%NM 52.1% 13.2% 17.7% 16.8%
A-B Miller / CoorsAZ 57.4% 42.6% TucsonGA 55.0% 45.0%FL 57.9% 42.1% Orlando, Ft. Lauderdale
1996
2006

A-BMiller / Coors /
OthersMA 47.6% 52.4%OR 31.2% 68.8% COHOMT 48.0% 52.0%
2006

• New York• Philadelphia• Charlotte• Birmingham• San Diego• Sacramento• Seattle• Portland• Salt Lake City
• Omaha• Memphis• Austin• Denver• Las Vegas• Reno• Minneapolis• Milwaukee• Raleigh

• New York• Philadelphia• Charlotte• Birmingham• San Diego• Sacramento• Seattle• Portland• Salt Lake City
• Omaha• Memphis• Austin• Denver• Las Vegas• Reno• Minneapolis• Milwaukee• Raleigh
Consolidation approved. IBG is aware of 9 others.


Should all brands be treated the same?

• Are Mega Distributors better equipped to become value-added marketers?
• Not all suppliers, retailers, consumers, distributors or brands are the same.– Logistics Distributor .
• Minimum drop size.• Heavy tel-sell.• Limited retail promotion or local marketing.• Work high volume accounts / handle the rest.• Push mentality at retail.

• Not all suppliers, retailers, consumers, distributors or brands are the same.
Brand Building Distributor.• Total market service• Strong in-outlet merchandising.• On / Off premise promotions.• Community involvement.• Pull mentality at retail.
Logistics Distributor vs. Logistics Distributor vs. Brand BuilderBrand Builder

– Problem: How to reduce operating costs to 15% and still provide brand building services.
(Focus).– To be brand builders you must have time to
sell.– Assume:
• 50 hour work week, 75 stops per week, 10 minute drive time between accounts, 30 brands, 300 SKU’s.
3,000 Min. per week750 Drive time per week
2,250 Min. for service per week75 Stops per week30 Min. for service per stop60 Seconds / minute
1,800 Seconds for service per stop30 Brands60 Seconds for service per brand per stop300 SKU's6 Seconds for service per SKU per stop

• Emotions of one distributor per market will never fly!
• Eliminates redundant cost thus allowing more focus on selling functions (15% operating cost target).
• Distributor retains intangible value.• Vertical and horizontal potential.• One major supplier is 0 for 17.• IBG is 1 for forever.

• Status quo is gone• Biggest change moving forward will be A-
B’s reaction to new MillerCoors configuration.
• Economics begin to overtake emotions.• Overall pace has picked up. • Mega distributors are gaining steam.• Are prices of brands and businesses
peaking? • Are distributors logistics providers , brand
builders, or both ?• Shared Services is a way to reallocate
focus and reduce cost! – but… • Landscape has changed at all levels.
• Consumer, retailer, distributor, supplier.

Related Documents