IOWA STATE UNIVERSITY Department of Animal Science Model Development and Selection of Variables Animal Science 500 Lecture No. 17 October 28, 2010

I OWA S TATE U NIVERSITY Department of Animal Science Model Development and Selection of Variables Animal Science 500 Lecture No. 17 October 28, 2010.
Dec 18, 2015
Welcome message from author
This document is posted to help you gain knowledge. Please leave a comment to let me know what you think about it! Share it to your friends and learn new things together.
Transcript
IOWA STATE UNIVERSITYDepartment of Animal Science
Model Development and Selection of Variables
Animal Science 500
Lecture No. 17
October 28, 2010
IOWA STATE UNIVERSITYDepartment of Animal Science
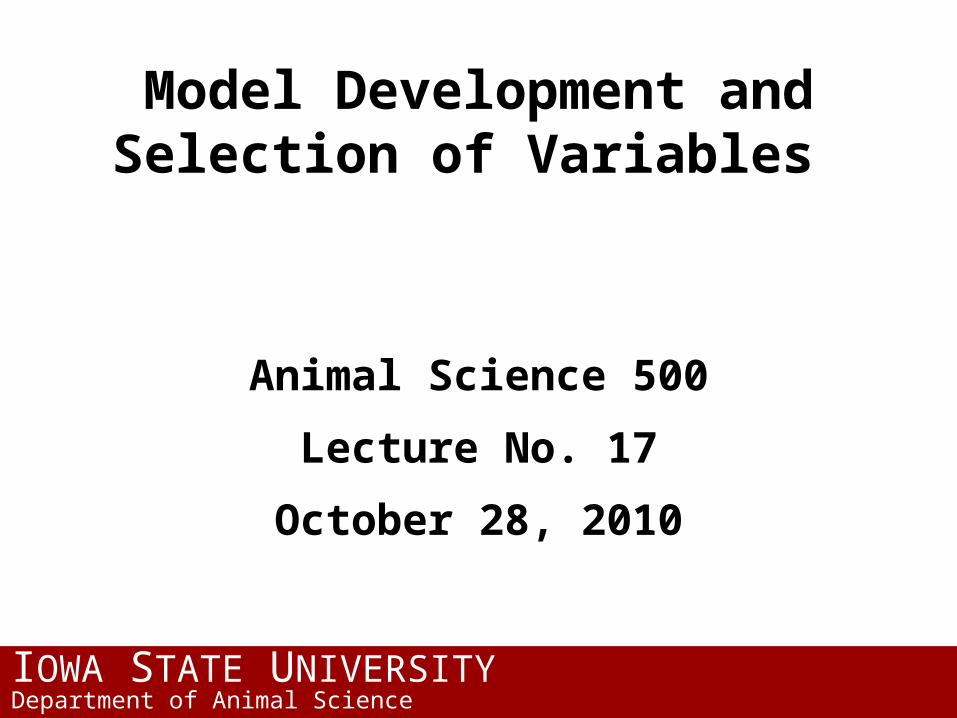
Using PROC COMPAREu PROC COMPARE compares two SAS datasets with each other.
n It warns you if it detects observations (rows) or variables (columns) that do not agree across the two datasets.
n When there are no disagreements, you can be confident that data entry is reliable.
u To use PROC COMPARE, enter your data twice, once each into two separate raw data files.
u Next use the two raw data files to create two SAS data sets.
u Then use PROC COMPARE.
IOWA STATE UNIVERSITYDepartment of Animal Science
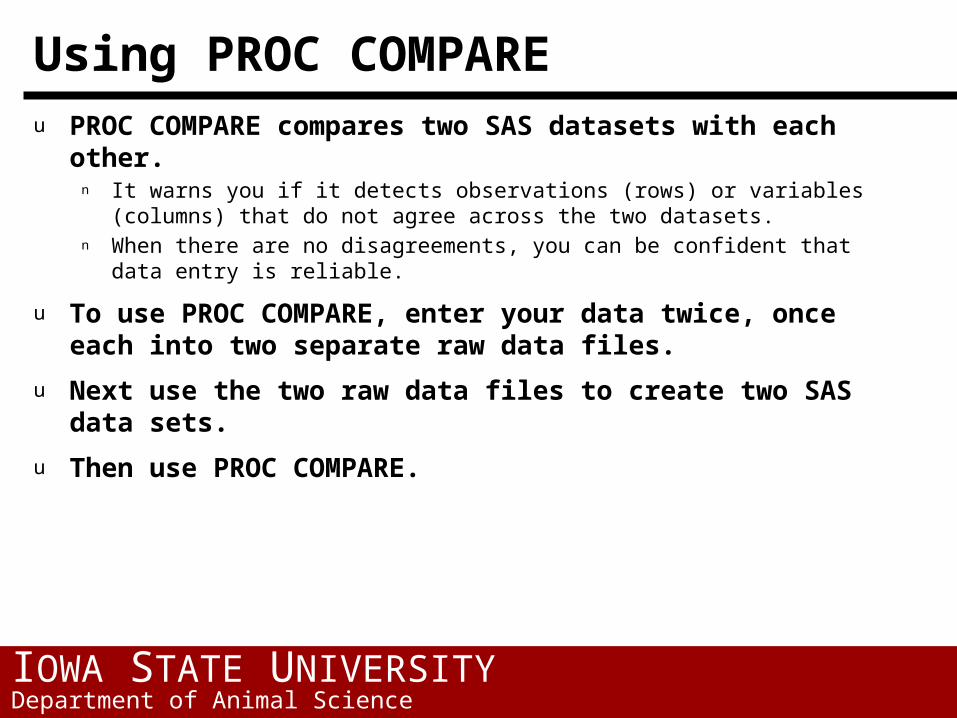
Using PROC COMPAREu Example:
The following example compares the two SAS data sets named PIG1 and PIG12.
u PROC COMPARE BASE = PIG1 COMPARE = PIG12 ERROR ; ID subjctid ;
u The BASE keyword defines the data set that SAS will use as a basis for comparison.
u The keyword COMPARE defines the dataset which SAS will compare with the base dataset.
u The ERROR keyword requests that SAS print an error message to the SASLOG file if it discovers any differences when it compares the two data sets.
IOWA STATE UNIVERSITYDepartment of Animal Science
Using PROC COMPAREu The ID statement tells SAS to compare rows (observations) in the
data set by the identifying variable, which here is named SUBJCTID. This variable must have a unique value for each case.
u PROC COMPARE features a number of options, many of which are designed to control the amount and type of information displayed in the listing file.

IOWA STATE UNIVERSITYDepartment of Animal Science
Class Statement
u Variables included in the CLASS statement referred to as class variables.
u Specifies the variables whose values define the subgroup combinations for the analysis.n Represent various level of some factors or effects
l Treatment (1,….n)l Season (spring, summer, fall, and winter coded 1 through 4)l Breedl Colorl Sexl Linel Dayl Laboratory

IOWA STATE UNIVERSITYDepartment of Animal Science
Class Variables
u Are usually things you would like to account for in your model
u Can be numeric or character
u Can be continuous values
u They are generally not used in regression analysesn What meaning would they have
IOWA STATE UNIVERSITYDepartment of Animal Science
Class Statement Optionsu Ascending sorts class variable in ascending order
u Descending sorts class variable in descending order
Other options with the Class statement generally related to the procedure (PROC) being used and thus will not cover them all
IOWA STATE UNIVERSITYDepartment of Animal Science
Discrete Variables
u A discrete variable is one that cannot take on all values within the limits of the variable. n Limited to whole numbersn For example, responses to a five-point rating scale can
only take on the values 1, 2, 3, 4, and 5. n The variable cannot have the value 1.7. A variable such
as a person's height can take on any value.
Discrete variables also are of two types:1. unorderable (also called nominal variables)
2. orderable (also called ordinal)
IOWA STATE UNIVERSITYDepartment of Animal Science
Discrete Variablesu Data sometimes called categorical as the
observations may fall into one of a number of categories for example: n Any trait where you score the value
l Lameness scoresl Body condition scoresl Soundness scoring
Reproductive Feet and leg
l Behavioral traits Fear test Back test Vocal scores
l Body lesion scores

IOWA STATE UNIVERSITYDepartment of Animal Science
Discrete Variablesu When do discrete variables become continuous
or do they?
u What is a trait like number born alive considered discrete or continuous?
IOWA STATE UNIVERSITYDepartment of Animal Science
Model Development and Selection of Variables
Example:
The general problem addressed is to identify important soil characteristics influencing aerial biomass production of marsh grass, Spartina alterniflora.

IOWA STATE UNIVERSITYDepartment of Animal Science
Assumptions of the Linear Regression Model1.Linear Functional form
2.Fixed independent variables
3.Independent observations
4.Representative sample and proper specification of the model (no omitted variables)
5.Normality of the residuals or errors
6.Equality of variance of the errors (homogeneity of residual variance)
7.No multicollinearity
8.No autocorrelation of the errors
9.No outlier distortion

IOWA STATE UNIVERSITYDepartment of Animal Science
Explanation of the Assumptions1. Linear Functional form
n Does not detect curvilinear relationships
2. The Observations are Independent observationsn Representative sample from some larger populationn If the observations are not independent results in an autocorrelation which inflates the
t and r and f statistics which in turn distorts the significance tests
3. Normality of the residualsn Permits proper significance testing similar to ANOVA and other statistical procedures
4. Equal variance (or no heterogenous variance)n Heteroskedasticity precludes generalization and external validityn This too distorts the significance tests being used
5. Multicollinearity (many of the traits exhibit collinearity)n Biases parameter estimation. n Can prevent the analysis from running or converging (getting your answers)
6. Severe or several outliers will distort the results and may bias the results. n If outliers have high influence and the sample is not large enough, then they may
serious bias the parameter estimates
IOWA STATE UNIVERSITYDepartment of Animal Science
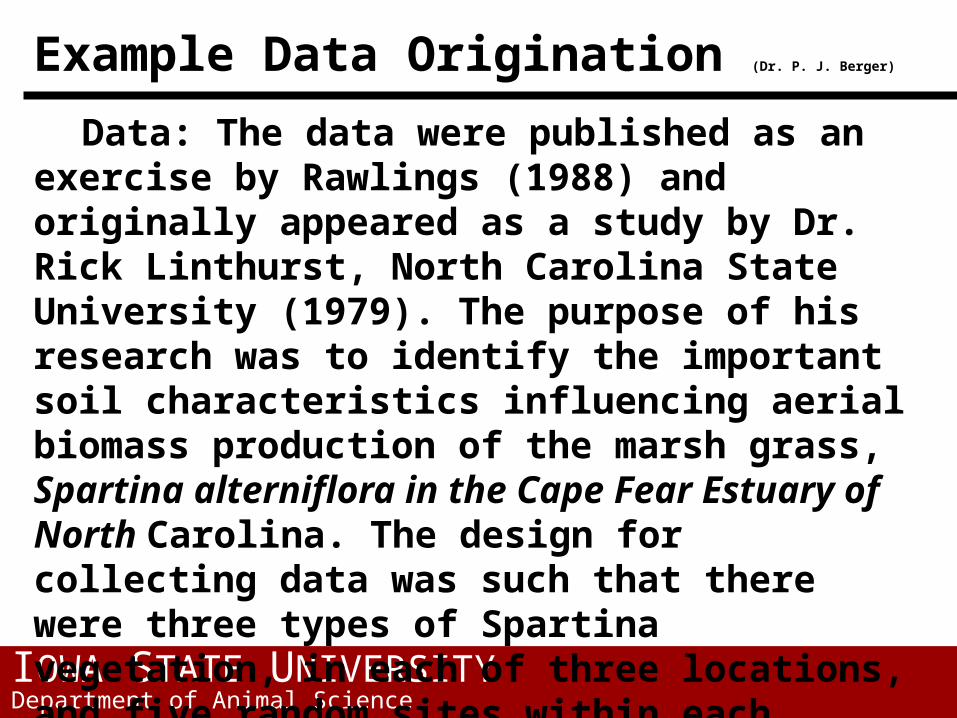
Example Data Origination (Dr. P. J. Berger)
Data: The data were published as an exercise by Rawlings (1988) and originally appeared as a study by Dr. Rick Linthurst, North Carolina State University (1979). The purpose of his research was to identify the important soil characteristics influencing aerial biomass production of the marsh grass, Spartina alterniflora in the Cape Fear Estuary of North Carolina. The design for collecting data was such that there were three types of Spartina vegetation, in each of three locations, and five random sites within each location vegetation type.
IOWA STATE UNIVERSITYDepartment of Animal Science
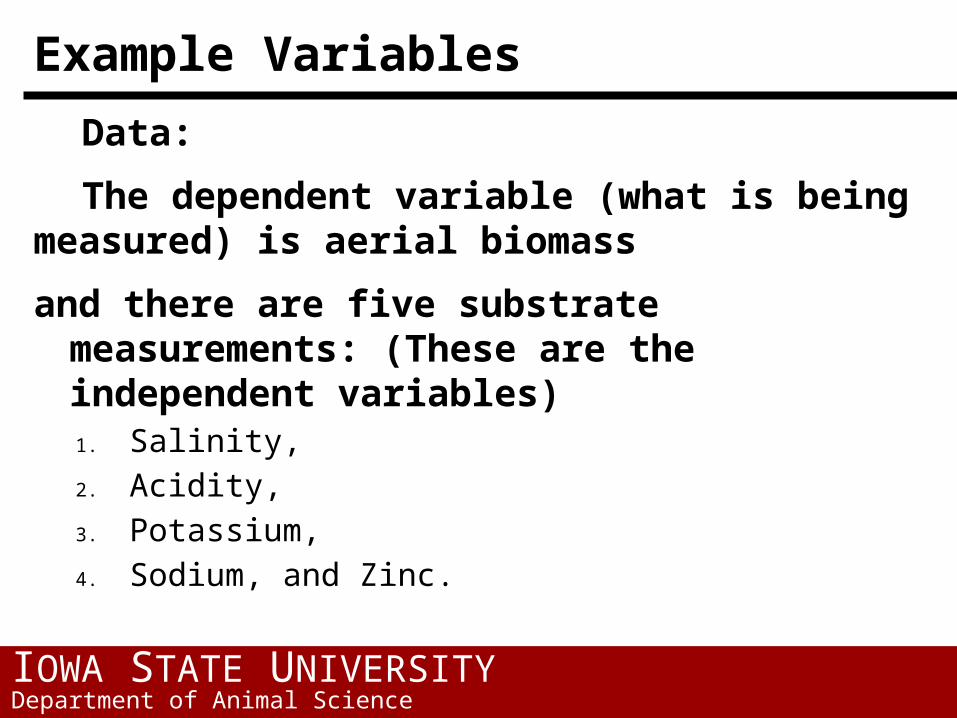
Example Variables
Data:
The dependent variable (what is being measured) is aerial biomass
and there are five substrate measurements: (These are the independent variables) 1. Salinity,
2. Acidity,
3. Potassium,
4. Sodium, and Zinc.
IOWA STATE UNIVERSITYDepartment of Animal Science
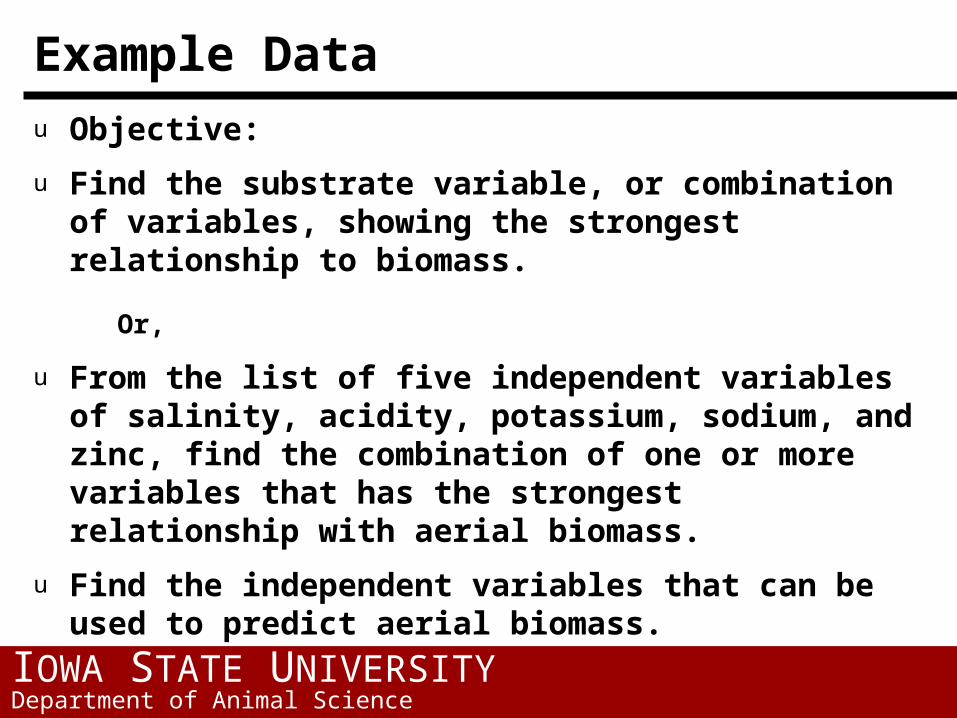
Example Datau Objective:
u Find the substrate variable, or combination of variables, showing the strongest relationship to biomass.
Or,
u From the list of five independent variables of salinity, acidity, potassium, sodium, and zinc, find the combination of one or more variables that has the strongest relationship with aerial biomass.
u Find the independent variables that can be used to predict aerial biomass.
IOWA STATE UNIVERSITYDepartment of Animal Science
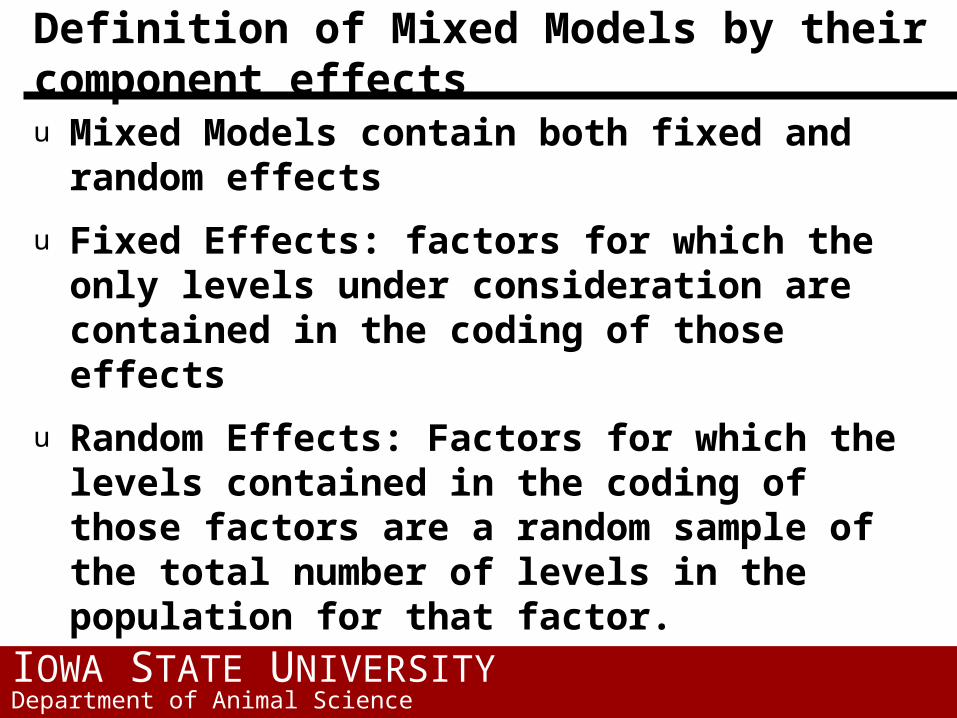
Definition of Mixed Models by their component effectsu Mixed Models contain both fixed and random
effects
u Fixed Effects: factors for which the only levels under consideration are contained in the coding of those effects
u Random Effects: Factors for which the levels contained in the coding of those factors are a random sample of the total number of levels in the population for that factor.
IOWA STATE UNIVERSITYDepartment of Animal Science
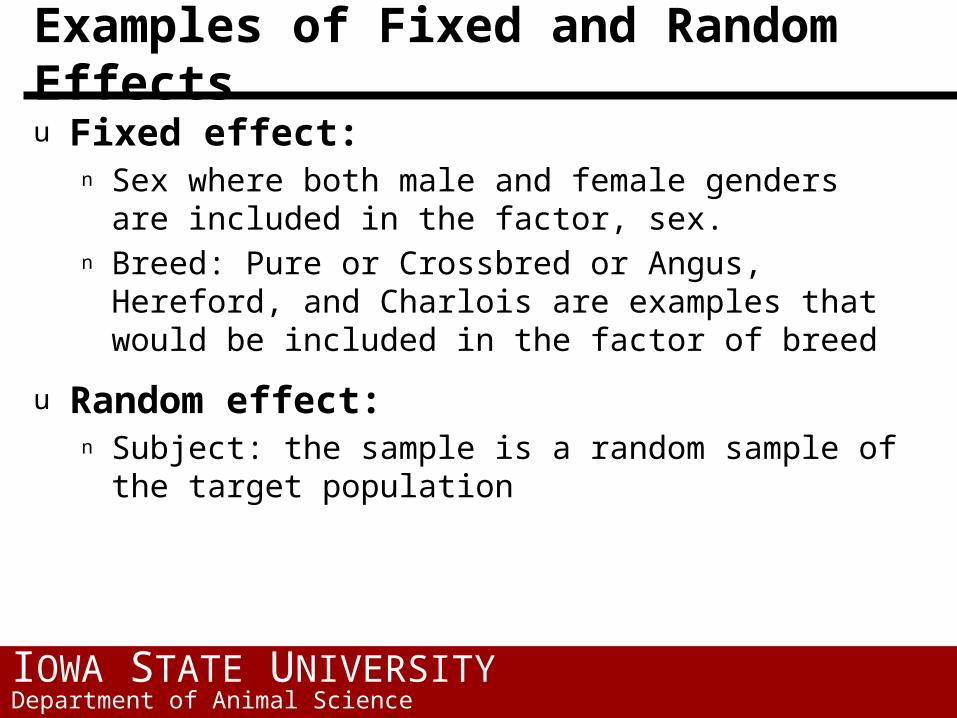
Examples of Fixed and Random Effects
u Fixed effect:n Sex where both male and female genders are included
in the factor, sex.n Breed: Pure or Crossbred or Angus, Hereford, and
Charlois are examples that would be included in the factor of breed
u Random effect:n Subject: the sample is a random sample of the target
population
IOWA STATE UNIVERSITYDepartment of Animal Science
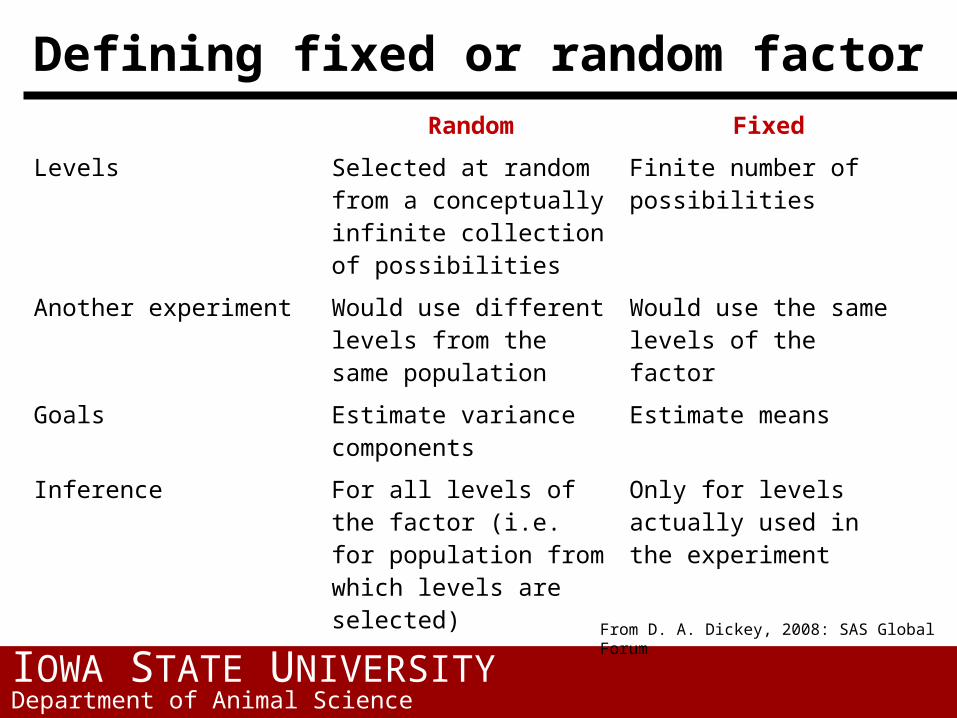
Defining fixed or random factorRandom Fixed
Levels Selected at random from a conceptually infinite collection of possibilities
Finite number of possibilities
Another experiment Would use different levels from the same population
Would use the same levels of the factor
Goals Estimate variance components
Estimate means
Inference For all levels of the factor (i.e. for population from which levels are selected)
Only for levels actually used in the experiment
From D. A. Dickey, 2008: SAS Global Forum
IOWA STATE UNIVERSITYDepartment of Animal Science
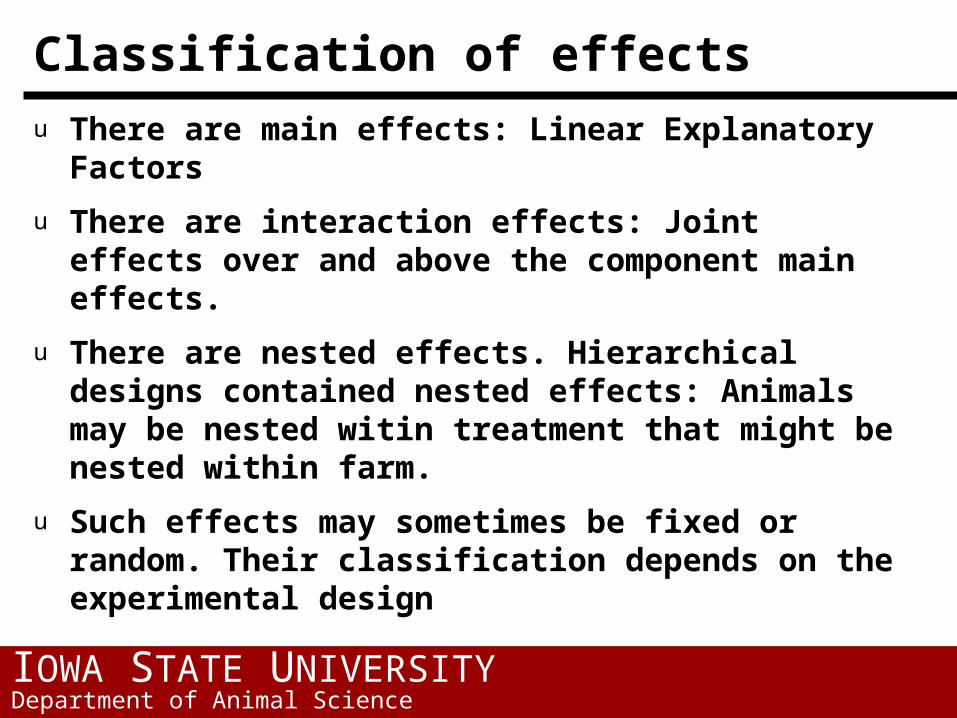
Classification of effectsu There are main effects: Linear Explanatory Factors
u There are interaction effects: Joint effects over and above the component main effects.
u There are nested effects. Hierarchical designs contained nested effects: Animals may be nested witin treatment that might be nested within farm.
u Such effects may sometimes be fixed or random. Their classification depends on the experimental design
IOWA STATE UNIVERSITYDepartment of Animal Science
Classification of effectsu Between-subjects effects are those who are in one
group or another but not in both.
u Experimental group is a fixed effect because the manager is considering only those groups in his experiment.
u One group is the experimental group and the other is the control group. Therefore, this grouping factor is a between- subject effect.
u Within-subject effects are experienced by subjects repeatedly over time.
IOWA STATE UNIVERSITYDepartment of Animal Science
Classification of effectsu Trial is a random effect when there are several trials in
the repeated measures design; all subjects experience all of the trials.
u Trial is therefore a within-subject effect.
u Example an operator of a scanning machine may be a fixed or random effect, depending upon whether one is generalizing beyond the sample
u If ultrasound scanner operator is a random effect, then the machine*operator interaction is a random effect.
u There are contrasts: These contrast the values of one level with those of other levels of the same effect.
IOWA STATE UNIVERSITYDepartment of Animal Science
Classification of Effects cont’d
u Hierarchical designs have nested effects.n Nested effects are those with subjects within groups.
u An example would be pen of animals nested within barn and barns nested within farms
u SAS expresses nesting of effects by:n Pen of animals(barn)n Barn(farms)
IOWA STATE UNIVERSITYDepartment of Animal Science
Interactions case
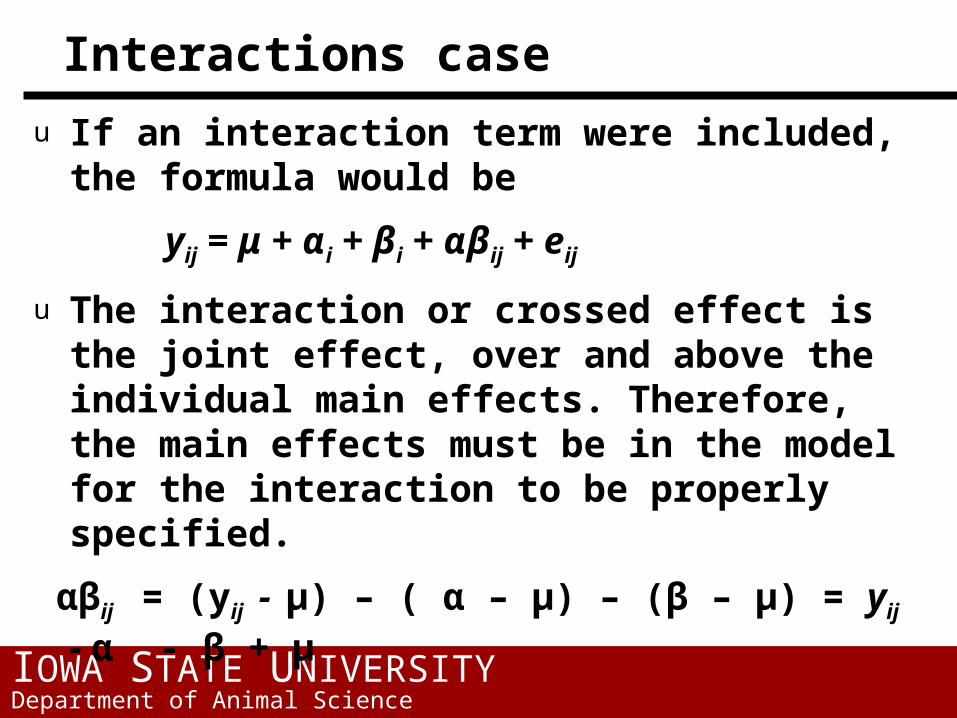
u If an interaction term were included, the formula would be
yij = μ + αi + βi + αβij + eij
u The interaction or crossed effect is the joint effect, over and above the individual main effects. Therefore, the main effects must be in the model for the interaction to be properly specified.
αβij = (yij - μ) – ( α – μ) – (β – μ) = yij - α - β + μ
IOWA STATE UNIVERSITYDepartment of Animal Science
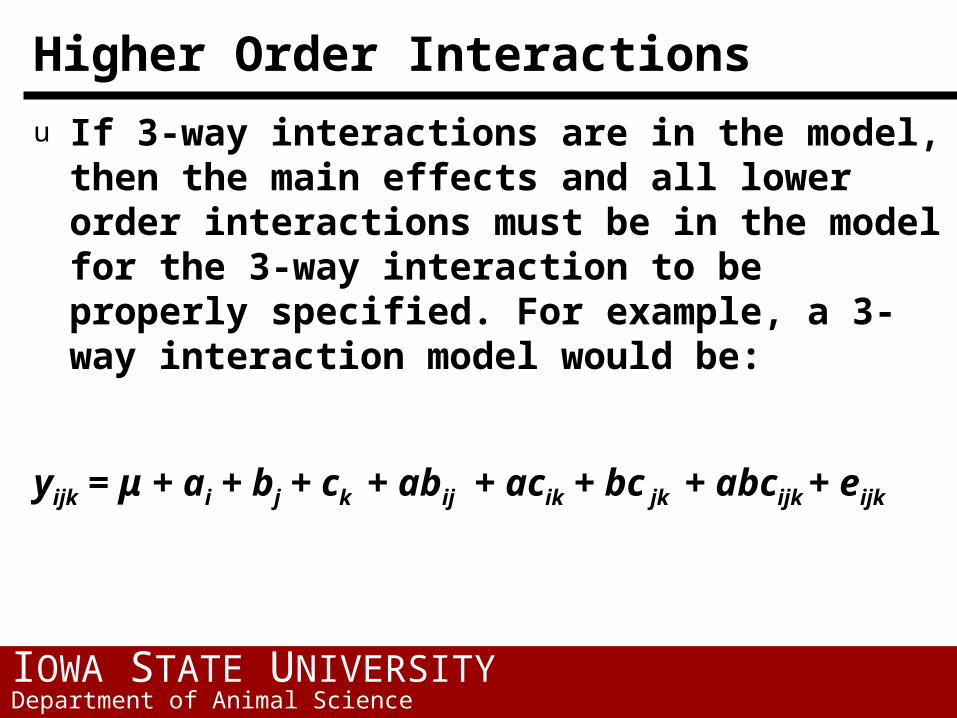
Higher Order Interactions
u If 3-way interactions are in the model, then the main effects and all lower order interactions must be in the model for the 3-way interaction to be properly specified. For example, a 3-way interaction model would be:
yijk = μ + ai + bj + ck + abij + acik + bc jk + abcijk + eijk
Related Documents