Erasmus Mundus Joint Master in Economics and Management of Network Industries (EMIN) Master’s Thesis IMPACT OF LARGE-SCALE INTEGRATION OF RES IN ELECTRIC POWER SYSTEMS EXPLORATION OF THE FUTURE EUROPEAN ELECTRICITY MARKET DESIGN Author: Ainhoa Villar Lejarreta Supervisor: Remco Verzijlbergh Co-Supervisor: Germán Morales-España Madrid, January 2016 UNIVERSIDAD PONTIFICIA COMILLAS ESCUELA TÉCNICA SUPERIOR DE INGENIERÍA (ICAI) DELFT UNIVERSITY OF TECHNOLOGY

Welcome message from author
This document is posted to help you gain knowledge. Please leave a comment to let me know what you think about it! Share it to your friends and learn new things together.
Transcript

Erasmus Mundus Joint Master in Economics and
Management of Network Industries (EMIN)
Master’s Thesis
IMPACT OF LARGE-SCALE INTEGRATION OF RES IN
ELECTRIC POWER SYSTEMS
EXPLORATION OF THE FUTURE EUROPEAN ELECTRICITY MARKET DESIGN
Author: Ainhoa Villar Lejarreta
Supervisor: Remco Verzijlbergh
Co-Supervisor: Germán Morales-España
Madrid, January 2016
UNIVERSIDAD PONTIFICIA COMILLAS
ESCUELA TÉCNICA SUPERIOR DE INGENIERÍA (ICAI)
DELFT UNIVERSITY OF TECHNOLOGY

Page left blank intentionally

Erasmus Mundus Joint Master in Economics and Management of Network Industries (EMIN), 2013-2015
This master thesis is part of the requirements of the Erasmus Mundus Joint Master in
Economics and Management of Network Industries (EMIN), 2013-2015. Delft
University of Technology and Comillas Pontifical University are the two participating
universities. In the end of this Erasmus Mundus EMIN programme, the student will be
granted for both the Master degree of Electric Power Industry from Comillas Pontifical
University, and the Master degree of Engineering Policy Analysis from Delft University
of Technology.

Page left blank intentionally

20160111

Page left blank intentionally

Exploration of the future European Electricity Market Design
Summary
Master Thesis MSc Economics and Management of Network Industries (EMIN) MSc Engineering and Policy Analysis (EPA) MSc Electric Power Industry (MEPI) – Ainhoa Villar Lejarreta i
SUMMARY
Until recently the European electricity system has been operating as a set of isolated national
markets with divergent regulatory norms. Today, the day-ahead markets between South-
Western Europe and North-Western Europe are fully coupled, enabling the trading of electricity
all the way from Portugal to Finland. Moreover, policy-makers in the power sector are currently
preparing the design of what it will be called the Internal Energy Market. Europe's power sector
aims for an integrated, more competitive, secure and sustainable power system. Meanwhile,
ambitious renewable targets aim for a decarbonization of the electricity sector by 2050. This
will lead to a large deployment of renewable technologies into the system, with almost 50% of
them being the most intermittent, uncertain and unevenly distributed sources in the continent,
wind and solar.
The introduction of the projected large amounts of intermittent sources will impact both the
functioning of the electricity markets and the operation of the transmission grids. Cross-border
congestion profiles are expected to suffer changes, transmission constraints will appear and an
effective congestion management approach will be needed within the framework of the market's
redesign.
Currently, the congestion management mechanism in place in many Member States is based on
a redispatch phase after market clearance, which results in inefficiencies and additional
rebalancing costs. This congestion management approach falls within the zonal market design.
A consistent integration of electricity markets across Europe enabling the access of large
capacities of renewable generation would have the potential to maximize overall welfare to all
agents. Generators would enter a more competitive market with a lower risk, consumers would
benefit from lower electricity prices and transmission system operators would benefit from
reduced operation costs of balancing and reserve.
Locational marginal pricing, also known as nodal market design, would be able to provide an
integrated approach of national and international congestion management, a joint allocation of
international transmission rights, the integration of congestion management with day-ahead,
intraday and balancing markets and finally a transparent approach to facilitate secure and
effective cooperation and information exchange among European system operators. However, a
committed high-level support on a European level would be required for its further
implementation.
The objective of this thesis is to gain a better understanding of the European power market in
presence of large amounts of renewable energies and under different power market designs, and
find out by how much can the market design and its features affect the provision of cost-
efficient electricity, this is the system's variable generation costs of electricity.
In order to study the influence of the power market design in the integration of large amounts of
renewable energies, an optimization model is used. The model solves a weekly unit

Exploration of the future European Electricity Market Design
Summary
Master Thesis MSc Economics and Management of Network Industries (EMIN) MSc Engineering and Policy Analysis (EPA) MSc Electric Power Industry (MEPI) – Ainhoa Villar Lejarreta ii
commitment problem and the transmission constrained economic dispatch for the day-ahead
market of a conceptual network of Europe and from a centralized decision making point of
view. The model uses a mixed-integer linear programming (MILP) formulation of the unit
commitment and minimizes total variable generation costs of the system. The two market
designs studied, nodal market and zonal market, are modeled according to how congestion is
managed in each case.
The aim is to analyze the impact of the power market design on the power system's variables:
total variable generation costs, RES curtailment, energy production by technology, non-served
energy and hourly electricity prices while subjected to several scenarios of increasing degree of
RES integration. For this, different degrees of future RES scenarios based on ENTSO-E market
studies are used.
The research shows that in a high renewable scenario the total variable generation costs of the
power system when it operates under a zonal power market are around 0,32% higher than under
a nodal market. These potential savings under a nodal market could even be larger especially if
the large expected projections of renewable sources of generation finally materialize and
provided that the required network capacities are delivered effectively on time.
Moreover, the degree of curtailment in both nodal and zonal markets rise notably in a high
renewable scenario compared to the current situation, up to a weekly curtailment of 7,83% and
8,01%, respectively. Such notable amounts of curtailment could be due to the insufficient
development of the transmission network assumed which leads to the incapability of supplying
cheap renewable energy across wide regions and instead having to commit or reschedule local
and more expensive technologies.
On the other hand, costs of unserved energy represent 2,95% and 3,08% of the total system's
variable generation costs in the nodal and zonal market, respectively. It is again highlighted the
importance of a timely delivery of the network infrastructure investments to gradually integrate
the large deployment of renewables in the system.
Overall, a nodal market in Europe could have the potential of improving efficiency in the
system by reducing variable generation costs by 0,32% compared to a zonal market. Benefits
could increase even more if an adequate network expansion plan that takes into account the
growth of renewable energies would deliver its investments on a timely manner.

Exploration of the future European Electricity Market Design
Preface
Master Thesis MSc Economics and Management of Network Industries (EMIN) MSc Engineering and Policy Analysis (EPA) MSc Electric Power Industry (MEPI) – Ainhoa Villar Lejarreta iii
PREFACE
This research thesis is the end point of the two-year Erasmus Mundus Master Programme
Economics and Management of Network Industries (EMIN), carried out at the faculty of
Technology, Policy and Management of the Delft University of Technology (Delft) and at the
ICAI Engineering School of Comillas University (Madrid).
The research project presented below is aimed at everyone interested in electric power systems,
in the integration of renewable energies and the design of power markets.
Upon completion of this thesis, I would like to thank the European Commission for giving me
the opportunity to pursue the EMIN programme and allowing me to combine my studies in TU
Delft and Comillas University. I would also like to appreciate professors in both universities for
their valuable teachings in the fields of energy and policy analysis. In particular, I would like to
thank my first supervisor Remco for his constant support and guidance and Germán for his
valuable input in the preparation of this thesis, as well as Bert Enserink and Pauline Herder for
their constructive feedback.
I also want to thank my friends Hugo, Shujie, Roxanne, Kevin, Donna, Hector, Hanif, Lien,
Djong, Viet, Maria Luisa, Mariam and Tariq for their help and shared happiness during this
time. Last but not least, I want to thank all my family, especially my dear parents for their
continuous support and help at all times.
Ainhoa Villar Lejarreta, December 2015.

Exploration of the future European Electricity Market Design
Preface
Master Thesis MSc Economics and Management of Network Industries (EMIN) MSc Engineering and Policy Analysis (EPA) MSc Electric Power Industry (MEPI) – Ainhoa Villar Lejarreta iv
Page left blank intentionally

Exploration of the future European Electricity Market Design
Table of Contents
Master Thesis MSc Economics and Management of Network Industries (EMIN) MSc Engineering and Policy Analysis (EPA) MSc Electric Power Industry (MEPI) – Ainhoa Villar Lejarreta v
TABLE OF CONTENTS
Summary………………………………………………………………………………………....i
Preface…………………………………………………………………………………………...ii
Table of Contents………………………………………………………………………………..v
List of Figures………………………………………………………………………………….vii
List of Tables……………………………………………………………………………………ix
Nomenclature…………………………………………………………………………………...xi
1. Introduction………………………………………………………….....……………………3
1.1. Europe's Future Power System. Problem in context…………………………………….3
1.2. Impact of large-scale integration of renewable generation………………………...........6
1.2.1. Effects on the day-ahead, intraday & balancing electricity markets…………….6
1.2.2. Effects on congestion management……………………………………………..10
1.3. Power market designs and congestion management…………………………………...11
1.4. Problem definition……………………………………………………………………...12
1.5. Research objectives…………………………………………………………………….13
1.6. Thesis outline and structure…………………………………………………………….14
2. Theory and Model Description……………………………………………………………19
2.1. Theory of Unit-Commitment…………………………………………………………...19
2.2. Theory of Optimal DC Power Flow……………………………………………………21
2.3. Locational Marginal Prices……………………………………………………………..25
2.4. Modeling approach……………………………………………………………………..26
2.4.1. Modeling Objectives………………………………………………………....…27
2.4.2. Modeling Methodology: The Day-Ahead Market…………………………...…27
2.4.3. Modeling Methodology: Implementation of Power Market Designs………..…30
2.5. The Optimization Problem. Model Formulation…………………………………….…32
2.5.1. Objective Function………………………………………………………...……34
2.5.2. Constraints………………………………………………………………………36
2.5.2.1. Power system balance requirement……………………………………36
2.5.2.2. Production of committed units………………………………………...36
2.5.2.3. Logical commitment and minimum up and downtime constraints……37
2.5.2.4. Generation capacity limits………………………………………….....37
2.5.2.5. Upward and downward system operating reserves……………………38
2.5.2.6. Ramping limits………………………………………………………...38
2.5.2.7. Network constraints…………………………………...………………39
3. Simulation Setup……………….....………………………………………………………..43
3.1. Scenario definition……………………………………………………………...………43
3.1.1. Reference scenario……………………………………………………………...44
3.1.2. Scenario EU 2020………………………………………………………………45

Exploration of the future European Electricity Market Design
Table of Contents
Master Thesis MSc Economics and Management of Network Industries (EMIN) MSc Engineering and Policy Analysis (EPA) MSc Electric Power Industry (MEPI) – Ainhoa Villar Lejarreta vi
3.1.3. The Visions for 2030…………………………………………………………....46
3.2. Model Data………………………………………………………………………….….50
3.2.1. Demand………………………………………………………………………....50
3.2.2. Generator properties………………………………………………………….....51
3.2.2.1. Generator costs…………………………………………….………….51
3.2.2.2. Technical and environmental characteristics……………………….....53
3.2.2.3. Initial conditions………………………………………………….…..55
3.2.3. Renewable generation……………………………………………………..……55
3.2.4. Network parameters…………………………………………………………….57
3.2.4.1. Transmission line capacities………………………………………..…58
3.2.4.2. Inductive reactances…………………………………………………..58
4. Simulation Results………………………………………………………………………....61
4.1. Power system generation costs……………………………………………..………….61
4.2. Further analysis of RES scenarios and power market designs……………..………….65
4.2.1. Curtailment of renewable energy…………………………………...…………..65
4.2.2. System generation dispatch profiles………………………………….…………68
4.2.3. Non-served energy……………………………………………………………....72
4.2.4. Effects of system outputs on the generation costs………………...…………….73
4.2.5. Electricity prices and congestion costs…………………………….…………....75
4.2.6. Sensitivity analysis of model parameters..............................................................78
4.2.6.1. CO2 emission cost rate...........................................................................78
4.2.6.2. Intra-zonal network capacities...............................................................82
4.2.6.2.1. Double intra-zonal network capacities......................................82
4.2.6.2.2. Half intra-zonal network capacities..........................................85
5. Conclusions and recommendations……………………………………………………….91
5.1. Conclusions of the research…………………………………………………………...91
5.2. Reflections on the modeling process and results...........................................................95
5.3. Recommendations……………………………………………………………….….…96
5.3.1. Guidelines for future work…...…………………………………………….……96
5.3.2. Reflection and policy implications in the European framework………………..97
Bibliography…………………………………………………………………………………..101
Appendices…………………………….……………………………………………………...105
Appendix A GAMS model code……......………………….......………………………...107
Appendix B Generation mix of the system, per country and per scenario........……...119
Appendix C Demand parameter and assumptions.....……………………………....…125
Appendix D Generator properties, fuel costs and network parameters……………...127

Exploration of the future European Electricity Market Design
List of Figures
Master Thesis MSc Economics and Management of Network Industries (EMIN) MSc Engineering and Policy Analysis (EPA) MSc Electric Power Industry (MEPI) – Ainhoa Villar Lejarreta vii
LIST OF FIGURES
Figure 1.1. Price convergence in Central-Western Europe………………………………………7
Figure 1.2. Day-ahead prices in France and power transmissions from Germany to France…….8
Figure 1.3. Cross-border arrangements in intraday and balancing markets in Europe in 2009….9
Figure 2.1. Impedance of line ij…………………………………………………………………22
Figure 2.2. Conceptual European network modeled in the day-ahead market………………….28
Figure 2.3. Schematic representation of the modeling process of the power market designs..... 31
Figure 3.1. General overview of the generation mix across all scenarios………………………44
Figure 3.2 . Breakdown of generation mix per country in Scenario B year 2014………………45
Figure 3.3 . Breakdown of generation mix per country in Scenario EU year 2020…………….46
Figure 3.4. Political and economic frameworks of the four Visions……………………………48
Figure 3.5. Generation and load frameworks of the four Visions………………………………48
Figure 3.6 . Breakdown of generation mix per country in Vision 1 year 2030…………………49
Figure 3.7 . Breakdown of generation mix per country in Vision 4 year 2030…………………49
Figure 3.8. Linear approximation of input-output characteristic of generator g………………..52
Figure 3.9. Global irradiation (kWh/m2) (above) and solar electricity (kWh/kWp) (below) in
European countries……………………………………………………………………………..56
Figure 3.10. Annual full-load hours for onshore wind energy in the European Union…………57
Figure 4.1. Generation costs in Reference scenario B (2014) and Vision 4 (2030)…………….64
Figure 4.2. Distribution of the hourly RES curtailment of the power system in Reference
scenario (2014) and Vision 4 (2030)…………………………………………………………....66
Figure 4.3. Hourly wind and solar energy curtailment in the power system in Vision 4
(2030)…………………………………………………………………………………………...68
Figure 4.4. Generation dispatch profiles in Reference scenario (2014) and Vision 4 (2030) for
the three power market designs…………………………………………………………………70
Figure 4.5. Average Locational Marginal Prices in Reference scenario (2014) and Vision 4
(2030) for the nodal and zonal markets…………………………………………………………76

Exploration of the future European Electricity Market Design
List of Figures
Master Thesis MSc Economics and Management of Network Industries (EMIN) MSc Engineering and Policy Analysis (EPA) MSc Electric Power Industry (MEPI) – Ainhoa Villar Lejarreta viii
Figure 4.6. Difference in Locational Marginal Prices of nodal and zonal markets in Reference
scenario (2014) and Vision 4 (2030)……………………………………………………………78
Figure 4.7. Generation dispatch profiles in Vision 4 (2030) for the nodal and zonal power
market designs for the base case and low CO2 emission cost rate……………………………..80
Figure 4.8. Average Locational Marginal Prices in Vision 4 (2030) for the nodal and zonal
markets for the base case and low CO2 emission cost rate……………………………………..81
Figure 4.9. Difference in average Locational Marginal Prices between nodal and zonal markets
in Vision 4 (2030) for the base case and low CO2 emission cost rate………………………….82
Figure 4.10. Average Locational Marginal Prices in Vision 4 (2030) for the nodal and zonal
markets for the base case and double intra-zonal capacities……………………………………84
Figure 4.11. Difference in average Locational Marginal Prices between nodal and zonal markets
in Vision 4 (2030) for the base case and double intra-zonal capacities………………………..85
Figure 4.12. Average Locational Marginal Prices in Vision 4 (2030) for the nodal and zonal
markets for the base case and half intra-zonal capacities……………………………………...87
Figure 4.13. Difference in average Locational Marginal Prices between nodal and zonal markets
in Vision 4 (2030) for the base case and half intra-zonal capacities………………………..…88

Exploration of the future European Electricity Market Design
List of Tables
Master Thesis MSc Economics and Management of Network Industries (EMIN) MSc Engineering and Policy Analysis (EPA) MSc Electric Power Industry (MEPI) – Ainhoa Villar Lejarreta ix
LIST OF TABLES
Table 4.1. Breakdown of generation, non-served energy and redispatch costs for Scenario B
(2014) and Vision 4 (2030) for the three proposed power market designs.………………….....62
Table 4.2. Comparison of total variable generation costs between Reference scenario (2014) and
Vision 4 (2030) for the three proposed power market designs in all their phases……………...63
Table 4.3. Renewable production, total production and curtailment of renewable energy in
Reference scenario (2014) and Vision 4 (2030) for the three power market designs…………..67
Table 4.4. Breakdown of energy production by technology type in Reference scenario (2014)
and Vision 4 (2030) for the three power market designs……………………….………………71
Table 4.5. Breakdown of energy production by technology type in Reference scenario (2014)
and Vision 4 (2030) for zonal power market in its two phases…………………………………72
Table 4.6. Comparison of non-served energy costs between Reference scenario (2014) and
Vision 4 (2030) for the three proposed power market designs in all their phases……………...73
Table 4.7. Impact of system outputs on variable generation costs……………………………..74
Table 4.8. Breakdown of generation, non-served energy and redispatch costs in Vision 4 (2030)
for the nodal and zonal power markets and for the base case and low CO2 emission cost rate..79
Table 4.9. Breakdown of generation, non-served energy and redispatch costs in Vision 4 (2030)
for the nodal and zonal power markets and for the base case and double intra-zonal network
capacities......................................................................................................................................83
Table 4.10. Breakdown of generation, non-served energy and redispatch costs in Vision 4
(2030) for the nodal and zonal power markets and for the base case and half intra-zonal network
capacities……………………………………………………………………….……………….86

Exploration of the future European Electricity Market Design
List of Tables
Master Thesis MSc Economics and Management of Network Industries (EMIN) MSc Engineering and Policy Analysis (EPA) MSc Electric Power Industry (MEPI) – Ainhoa Villar Lejarreta x
Page left blank intentionally

Exploration of the future European Electricity Market Design
NOMENCLATURE
Master Thesis MSc Economics and Management of Network Industries (EMIN) MSc Engineering and Policy Analysis (EPA) MSc Electric Power Industry (MEPI) – Ainhoa Villar Lejarreta xi
NOMENCLATURE
A. Indexes and Sets
Generating units, from 1 to
Generating units in with minimum uptime equal to one hour
Location of generating unit in bus
Hourly periods, from 1 to hours
Network buses, from 1 to ( and are used indistinctly)
Subset of , network buses connected to at least one AC transmission line
Subset of , network buses connected only to HVDC transmission lines
Power line circuits, from 1 to
Subset of , network buses and connected by an AC transmission line and circuit ID c
HVDC lines, from 1 to
HVDC line from bus (to bus )
B. Parameters
1) Model parameters related to hourly periods:
Instantaneous demand in hour and in node [GW]
Maximum intermittent generation from wind and solar in hour and in node [GW]
2) Model parameters related to the generating units:
Maximum power output of generating unit g [GW]
Minimum power output of generating unit g [GW]

Exploration of the future European Electricity Market Design
NOMENCLATURE
Master Thesis MSc Economics and Management of Network Industries (EMIN) MSc Engineering and Policy Analysis (EPA) MSc Electric Power Industry (MEPI) – Ainhoa Villar Lejarreta xii
Initial power output of generating unit g [GW]
Initial power output of generating unit g above [GW]
Initial time status of generating unit g, defined as the time the unit has been online [hours]
Initial commitment status of generating unit g, which is equal to 1 if the unit is online and 0 if it
is offline
Ramp-up capability of generating unit g [GW/hour]
Ramp-down capability of generating unit g [GW/hour]
Minimum time online of generating unit g [hours]
Minimum time offline of generating unit g [hours]
Fuel cost of generating unit g [M€/GWh]
Variable operation & maintenance cost of generating unit g [M€/GWh]
Marginal cost of generating unit g [M€/GWh]
Fixed fuel consumption cost of generating unit g [M€/hour]
Startup cost of generating unit g [M€/GW]
Shutdown cost of generating unit g [M€/GW]
Emission rate of generating unit g [tCO2/GWh]
Cost of CO2 emissions [M€/tCO2]
Cost of non-served energy [M€/GWh]
3) Model parameters related to the network:
Inductive reactance X of line and circuit ID [p.u.]
Slack Bus = 2
Susceptance B of line
Impedance Z of line . Inverse of B: Z = B-1

Exploration of the future European Electricity Market Design
NOMENCLATURE
Master Thesis MSc Economics and Management of Network Industries (EMIN) MSc Engineering and Policy Analysis (EPA) MSc Electric Power Industry (MEPI) – Ainhoa Villar Lejarreta xiii
Power transfer distribution factor for AC transmission line , circuit ID and node
Maximum power capacity of AC transmission line and circuit ID [GW]
Incidence matrix: Incidence of DC line and node
Maximum power capacity of HVDC line [GW]
Locational Marginal Price (nodal price) in node in hour [M€/GWh]
Dual variable of system balance constraint for every hour [M€/GWh]
Dual variable of the network constraint of the AC transmission line for every hour
[M€/GWh]
Dual variable of the power balance constraint in nodes with only HVDC lines for every
hour [M€/GWh]
C. Variables
1) Free and continuous variables:
Total variable generation costs [M€]. Objective function.
Power flow through AC line and circuit ID in hour [GW]
Power flow through HVDC line in hour [GW]
2) Positive and continuous variables:
Power output of generating unit in hour [GW]
Power output of generating unit above the minimum output in hour [GW]
Operating upward reserve of generating unit in hour [GW]
Operating downward reserve of generating unit in hour [GW]
Intermittent generation from wind and solar in node in hour [GW]
Non-served energy in node in hour [GW]

Exploration of the future European Electricity Market Design
NOMENCLATURE
Master Thesis MSc Economics and Management of Network Industries (EMIN) MSc Engineering and Policy Analysis (EPA) MSc Electric Power Industry (MEPI) – Ainhoa Villar Lejarreta xiv
3) Binary variables:
Commitment status of generating unit in hour , which is equal to 1 if the unit is online
and 0 if it is offline
Startup status of generating unit in hour , which is equal to 1 if the unit starts up and 0
otherwise
Shutdown status of generating unit in hour , which is equal to 1 if the unit shuts down
and 0 otherwise

Master Thesis MSc Economics and Management of Network Industries (EMIN) MSc Engineering and Policy Analysis (EPA) MSc Electric Power Industry (MEPI) – Ainhoa Villar Lejarreta Page 1
CHAPTER 1
INTRODUCTION

Master Thesis MSc Economics and Management of Network Industries (EMIN) MSc Engineering and Policy Analysis (EPA) MSc Electric Power Industry (MEPI) – Ainhoa Villar Lejarreta Page 2
Page left blank intentionally

Exploration of the future European Electricity Market Design
Chapter 1 - Introduction
Master Thesis MSc Economics and Management of Network Industries (EMIN) MSc Engineering and Policy Analysis (EPA) MSc Electric Power Industry (MEPI) – Ainhoa Villar Lejarreta Page 3
1. Introduction
Until recently the European electricity system has been operating as a set of isolated national
markets with divergent regulatory norms. The trend now is that these markets are unified into a
single more efficient market. This requires solving a number of technical and regulatory
problems.
Additionally, nowadays there is a growing concern about the environment in all different kind
of fields. International institutions, governments and industries are gradually adopting more
sustainable norms and practices in order to exploit resources at minimum cost. This trend can
also be seen in the growth of renewable energies in the power system. They too present issues in
regard to their integration into the system.
Chapter 1 exposes the path followed by the power systems in Europe, makes an appraisal of the
technical and regulatory problems to be solved in the near future and identifies existing and
alternative power market designs that would contribute to a more economically efficient and
transparent European electricity market.
1.1. Europe's Future Power System. Problem in context.
Nowadays, Europe's Power System is immersed in an energy transition period. Policy-makers in
the power sector are currently envisioning the future power system of what it is lately being
called an Energy Union for Europe. Consultations to experts and stakeholders, and legislative
proposals are being put forward for what it will be the biggest redesign of Europe's electricity
market.
Short after the liberalization process of national energy markets around the 1980s started, driven
largely by economic reasons, the European Union already engaged in a broader approach to the
restructuring of the power markets in the Member States. Setting aside the economic national
goals of every individual country in the region, the European Union focused on the strategic and
political concerns involving the power sector. The high dependency of the Union on external
sources of oil and gas prompted the following three pillars which are still the basis of today's
energy needs: secure an increasing supply of energy from domestic and foreign sources, develop
a more competitive European energy market and support environmental protection and the
development of renewable energy sources (Barroso, 2006). With these goals in mind and
following several European Directives in the 1990s that favoured the liberalization of markets,
the grounds for the creation of a single European energy market were established.
However, the restructuring process of the different national markets towards a more competitive
and efficient one turned out to take longer than expected for several reasons. (Pollitt, 2009)
argues that the privatization of state-owned electricity assets, the opening of the market to
competition, the vertical unbundling of transmission and distribution activities from the

Exploration of the future European Electricity Market Design
Chapter 1 - Introduction
Master Thesis MSc Economics and Management of Network Industries (EMIN) MSc Engineering and Policy Analysis (EPA) MSc Electric Power Industry (MEPI) – Ainhoa Villar Lejarreta Page 4
generation and retailing services and the introduction of an independent regulator are all four
stages that should be completed in advance for a successful implementation of a market-based
reform. Nevertheless, a continuous process of interactions between market players and
regulatory authorities in all Member States took place revealing the complexity to reach the
same level of development of all stages in the different countries. Technical, economical and
political barriers towards competitive markets explain the delays and the difficulties in the
process of the reform (Karan & Kazdagli, 2011).
Technical barriers are related to the characteristics of the commodity of electricity. Electricity
depends on a physical grid that reduces liquidity and adds complexity to the operation of
markets. Close coordination is required between the operators of different networks for energy
trade to happen and is well-known that every power system has certain market arrangements
that differ from one another, inevitably running into numerous obstacles.
From the economical and political point of view, national governments are reluctant to give up
complete control over national energy markets due to the importance of security of supply and
the energy sector on the economic development of the rest of the industries. This situation
avoids effective competition from taking place and hence inefficiencies appear, such as the need
to introduce state subsidies to keep an industry functioning (Karan & Kazdagli, 2011).
Moreover, the generation mix in every country is extremely different. Some countries might
rely more on a specific technology than another and this, together with EU mechanisms
implemented supporting certain technologies over others, might emphasize price differences
among regions, certainly giving way to uneven distributions of the gains and, thus, rising
uneasiness in governments to further integrate in a common electricity market.
Despite these barriers, considerable progress has been made thanks to the efforts of stakeholders
and the European Commission, the main driving force and main policy maker in this energy
reform. Relevant milestones have been achieved. Today, the full price coupling of the day-
ahead markets between South-Western Europe and North-Western Europe is in place enabling
the trading of electricity all the way from Portugal to Finland. Similarly, on-going progress is
taking place in Eastern Europe. Moreover, a centralised information platform has been made
available by the European Network of Transmission System Operators for Electricity (ENTSO-
E), where data about electricity markets is published, aiming for greater transparency among all
market players.
Complementarily to the market coupling initiatives, an updated investment plan for network
expansion was released by the ENTSO-E in its Ten-Year Network Development Plan (TYNDP)
2014, in which a total investment of 150 Billion Euros is predicted until the year 2030. In this
regard, only two thirds of the infrastructure projects are being delivered on a timely manner.
Transmission System Operators (TSOs) are facing challenges due to permit procedures or lack
of public acceptance. However, the ENTSO-E emphasizes in its plan the benefits that greater
interconnections would bring to all market players by achieving greater convergence in
electricity prices between regions as well as a significant reduction in these (ENTSO-E, 2014).

Exploration of the future European Electricity Market Design
Chapter 1 - Introduction
Master Thesis MSc Economics and Management of Network Industries (EMIN) MSc Engineering and Policy Analysis (EPA) MSc Electric Power Industry (MEPI) – Ainhoa Villar Lejarreta Page 5
Again, committed political support is of utmost importance to achieve a proper European
integrated market.
While in the past years focus in the energy sector shifted from liberalization to the integration of
the national markets, more specifically to the coupling of the day-ahead energy markets, the
priority for the future years is set on decarbonisation policies, security of supply and the
integration of markets closer to real-time like intra-day and balancing markets.
The European Union's renewable energy directive from 2009 is boosting investments in
renewable technologies in such amounts that has caused struggles to conventional generation,
grid operators and regulators to effectively respond to ever-increasing uncertainty levels in the
power system. Given the ambitious environmental energy targets set for 2050, for which
European power systems will have to reduce its contribution to greenhouse gas (GHG)
emissions to zero, still large number of investments in renewable sources are expected in the
whole of Europe. Consequently, an adequate future design of the power market would be one
that fosters more operational flexibility to allow TSOs to efficiently manage the increased
uncertainty in the system.
On the other hand, the coupling of the regional day-ahead markets brought improvements over
market results. Transmission capacity is, since then, used more efficiently and the flow of traded
energy is in accordance to the price differences between regions (Borggrefe & Neuhoff, 2011).
Market coupling favours convergence of prices, which boosts competition and therefore better
quality services and ultimately better prices for consumers. Moreover, (Meeus, et al., 2005)
highlighted that a further stage of market integration is necessary and a cross-border balancing
and intraday markets should be set up. In fact, according to the European Commission, short-
term cross-border markets should be at the core of the European power market redesign. These
markets are able to best capture the value of operational flexibility sought for large-scale
integration of renewables due to their closeness to real-time operation.
Finally, greater degree of liberalization of energy markets, more cross-border interconnections
and larger amounts of renewable technologies in the system require changes to the way the
power system is operated. With a top-down framework, the foundations on which the internal
electricity market in Europe is being built are laid through the development of the network
codes. Elaborated by the European Commission, the ENTSO-E and the Agency for the
Cooperation of Energy Regulators (ACER), these codes provide a complete set of rules on
different areas of the electricity market that will need to be implemented and complied with
across Europe. They will become binding technical EU regulations. When this happens, Europe
will then be one step closer to the realisation of the Internal Energy Market (IEM), and hence, of
its energy goals.

Exploration of the future European Electricity Market Design
Chapter 1 - Introduction
Master Thesis MSc Economics and Management of Network Industries (EMIN) MSc Engineering and Policy Analysis (EPA) MSc Electric Power Industry (MEPI) – Ainhoa Villar Lejarreta Page 6
1.2. Impact of large-scale integration of Renewable Generation
The energy target set for 2020 to reach at least a 20% share of energy coming from renewable
sources and the initiative of decarbonising the electricity sector by 2050 will lead to a
significant increase in green energy technologies in the power system. Almost 50% of this
installed capacity will be represented by wind and solar power plants which are, of all
renewable energy sources, the most intermittent, unpredictable and unevenly distributed sources
around the continent (Eurelectric, 2010). The large-scale introduction of these types of
renewable sources will impact both the functioning of the electricity markets and the operation
of the transmission and distribution grids.
The following sections go further into the effects of the expected high integration of renewable
energies on the coupled day-ahead, and current intraday and balancing markets in Europe and
on the system operation and congestion management in the network.
1.2.1. Effects on the day ahead, intraday & balancing electricity markets
In most Member States there are three distinct types of electricity markets currently in place:
day-ahead, intraday and balancing markets. Day-ahead and intraday markets are energy markets
in which power is traded on different timeframes, as their names accurately suggest, while
balancing markets have been traditionally used by system operators to provide reserves and
response capacity to balance the system when unplanned events take place, as in the case of
plant outages, load prediction errors or wind uncertainty.
After the regional coupling of the North-Western and South-Western day-ahead markets in May
2014, a greater harmonization of the wholesale prices is expected in the whole region. Such
convergence of prices was also the initial result after the market coupling in the Central-Western
(CWE) region took place in November 2010 (Figure 1.1).
The current market coupling mechanism uses a common price formation that allows to optimize
the allocation of cross-border interconnection capacities for power exchange. The allocation of
this transmission capacity is done through implicit auctioning. This means that the available
transmission capacity is auctioned jointly with the auctions of electricity in the spot markets,
accomplishing in this way the integration of the different national electricity markets. The
optimized use of the interconnections between countries in theory yields two results: (i) a
general decrease in spot prices and (ii) a general decrease in the differences of spot prices
between regions provided that the required transmission capacities are in place.

Exploration of the future European Electricity Market Design
Chapter 1 - Introduction
Master Thesis MSc Economics and Management of Network Industries (EMIN) MSc Engineering and Policy Analysis (EPA) MSc Electric Power Industry (MEPI) – Ainhoa Villar Lejarreta Page 7
Figure 1.1. Price convergence in Central-Western Europe. Source: (Böckers, et al., 2013).
Firstly, prices should decrease because, given the principle of the merit order dispatch, cheaper
power from renewables, for example, can be delivered to other regions that would not have been
possible otherwise. It is worth mentioning that the impact of the renewable targets on the day-
ahead market cannot be decoupled from an increasing coupling of the regional day-ahead
markets since they are part of the same strategy (Eurelectric, 2010). To illustrate the reader,
Figure 1.2 presents the power exported from Germany to France and the day-ahead prices in
France after the market coupling took place in 2010. In the graph, when German imports
increase, French day-ahead prices fall. Knowing that Germany has a higher renewables capacity
share compared to France, it is likely that this price drop is due to cheaper power imports than
its nuclear power, i.e. renewable sources (Doan, 2012).
Secondly, if there is sufficient cross-border capacity and the day-ahead prices in France fall due
to German imports, then spot prices in Germany will increase because there is more power
produced with respect to the situation where there are no imports to France. In this way, a price
equilibrium is reached and price differences are reduced. However, in practice prices are yet not
completely harmonized and price divergence is still significant like in the year 2012 in Figure
1.1. This is due to congestions in the network caused by still insufficient transmission capacity
in that region, unexpected failure of generators, sudden increase in demand or too much
renewable generation in one country.

Exploration of the future European Electricity Market Design
Chapter 1 - Introduction
Master Thesis MSc Economics and Management of Network Industries (EMIN) MSc Engineering and Policy Analysis (EPA) MSc Electric Power Industry (MEPI) – Ainhoa Villar Lejarreta Page 8
Figure 1.2. Day-ahead prices in France and power transmissions from Germany to France.
(Source: RTE, Powernext)
In fact, renewable sources in the system lower day-ahead prices on average. However, due to
the stochastic behaviour of weather and therefore the intermittent nature of renewables,
uncertainty levels increase and sudden price spikes can appear when there is no wind or sun
available. As a result, price volatility increases. Moreover, higher penetration of renewables will
increase price volatility even more, influencing the future price hedging strategies and the
behaviour of energy traders in the derivatives market. Furthermore, TSOs will have the difficult
task to decide in real time the most appropriate capacity to dispatch when suddenly the wind
stops or the sun is not available, resulting in higher costs and therefore higher spot prices.
Regarding intraday and balancing markets, several countries in Europe have them in place to
allow for readjustments of the dispatch during the day. However, the market setups differ
significantly from one country to another and are still far from competitive and efficient
harmonized European markets (Figure 1.3) (Borggrefe & Neuhoff, 2011).
The main issue with their current design in most countries is the inability to optimize between
the balancing and the day-ahead markets. Energy suppliers have to send their commitment
offers to either the day-ahead or intraday markets, or to the balancing market. In many cases it is
not possible to change this commitment when we are closer to real-time. Therefore, while
already committed power plants in the day-ahead market would be able to provide upward
balancing power when they are asked to reduce production due to an increase in wind feed-in,
they are unable to do so. Instead, more expensive technologies have to provide the balancing
services.
Moreover, the increased uncertainty in day-ahead markets due to the growing penetration of
renewables has encouraged an increase in demand for reserve capacities in these markets to

Exploration of the future European Electricity Market Design
Chapter 1 - Introduction
Master Thesis MSc Economics and Management of Network Industries (EMIN) MSc Engineering and Policy Analysis (EPA) MSc Electric Power Industry (MEPI) – Ainhoa Villar Lejarreta Page 9
ensure security of supply. This results in larger amounts of startups and part-load costs, thereby
increasing generation and operational costs of the system (EWIS, 2010). This trend is expected
to continue with an increasing share of renewables, and despite the improvements in wind
forecasting this will not enable a full use of the system's flexibility if no changes are made in the
design of these markets.
Figure 1.3. Cross-border arrangements in intraday and balancing markets in Europe in 2009.
Source: EWI, 2010.
The initiative of regional coupling between the European day-ahead markets now extends to
applying such coupling mechanism to both intraday and balancing markets. Until now this had
low priority in many countries. (Smeers, 2008) argues that day-ahead, intraday and real-time are
different steps of a single trading process and therefore they require a single trading platform,
instead of the current three different market schemes. The future market design should allow
TSOs to efficiently manage the increased uncertainty in the system and generators should help
by allowing them to offer a joint bid for energy production and provision of balancing services.
The main beneficiaries of the reviewed market design would be European consumers who
benefit from improved security of supply and lower system costs, which results in lower
electricity prices. System operators also benefit from more transparent operational procedures
and reduced costs. However, the improvement and harmonization of the electricity markets can
be seen as a threat to dominant generation companies who might see their large benefits shrink
due to an easier entry of competing generators in the intraday and balancing markets (Borggrefe
& Neuhoff, 2011).

Exploration of the future European Electricity Market Design
Chapter 1 - Introduction
Master Thesis MSc Economics and Management of Network Industries (EMIN) MSc Engineering and Policy Analysis (EPA) MSc Electric Power Industry (MEPI) – Ainhoa Villar Lejarreta Page 10
1.2.2. Effects on congestion management
Congestion management has become an operational challenge in more and more liberalized
power systems due to the increasing number of bilateral contracts for electricity trade.
Transmission congestion is the operating condition in which there is insufficient transmission
capacity to deliver all the traded energy simultaneously and therefore certain lines in the
network may become overloaded. TSOs, as operators of the system, are in charge of alleviating
these situations and restoring a secure state of the system.
The further deployment of renewable energies in the following years is expected to take place
mainly in offshore sites, away from load centers, thus new transmission lines will be required.
Besides, distribution grids will also need new investments due to a large increase of distributed
generation.
In the case that the large introduction of renewables is not accompanied by a timely delivery of
the required transmission investments, as already mentioned in section 1.1, transmission
constraints would appear affecting system operation. Congestion already exists in European
cross-border interconnections, but the expected renewable penetration will change this cross-
border congestion profiles to a greater extent (Neuhoff, et al., 2011).
Currently, the most typical way TSOs solve congestions in the European network is by
redispatching generation, curtailing demand or a combination of both. The main concerns of the
system redispatch solution are its high costs, which are usually and ultimately paid by the
consumers, and its susceptibility to high levels of market power. Also, even if generators are
allocated with the redispatch costs, incentives to locate outside congested areas would be
relatively low, resulting in a long-term economically inefficient solution to congestion
(Hakvoort, et al., 2009).
Therefore, an adequate congestion management mechanism should be able to promote the
efficient use of the existing transmission capacity while maintaining a reliable and secure power
system, and guaranteeing maximum transparency to public and private investment agents.
According to (Neuhoff, et al., 2011) an effective congestion management scheme for Europe
would have to integrate the following criteria:
An integrated approach of national and international congestion management
Joint allocation of international transmission rights
Integration of congestion management with day-ahead energy markets
Integration of congestion management with intraday and balancing markets
A transparent approach to facilitate secure and effective cooperation and information
exchange among European system operators

Exploration of the future European Electricity Market Design
Chapter 1 - Introduction
Master Thesis MSc Economics and Management of Network Industries (EMIN) MSc Engineering and Policy Analysis (EPA) MSc Electric Power Industry (MEPI) – Ainhoa Villar Lejarreta Page 11
1.3. Power market designs and congestion management
In previous sections it has been illustrated the improvements, the future challenges and the
importance of a closely integrated operation of the power system to achieve a secure,
competitive and sustainable European electricity system. The network codes, developed by the
European Commission, the ENTSO-E and ACER, set the rules and procedures to trade
electricity across Europe based on some framework guidelines and hence define the new power
market design. The power market design proposed by European stakeholders is, as briefly
mentioned in section 1.1, based on implicit auctioning and flow-based capacity allocation.
Currently in Europe, the market design is based on a multi-region day-ahead market coupling
mechanism, or also known as zonal market. The zonal market approach assumes one electricity
price per market zone. In continental Europe every market zone is limited by national
boundaries and in the Nordic region every country is divided into several market zones. By
doing this, intra-zonal congestion is not accounted for through the market. Instead, only cross-
border interconnections are considered and the TSOs manage congestion inside the zones after
market clearance, through a redispatch process, incurring in operational inefficiencies as already
explained. Now, the allocation method of cross-border transmission capacity is not
straightforward mainly because commercial energy flows do not correspond with the actual
energy flows in the network. The latter follow Kirchhoff's circuit laws. There are different
capacity allocation methods used in worldwide electricity markets, namely the Available
Transfer Capacity (ATC) method, the Flow-Based Market Coupling (FBMC) method, both for
the zonal market approach, and the nodal market.
Since May 2015, the FBMC model is currently implemented in the day-ahead market of Central
Western Europe (Belgium, the Netherlands, France, Germany and Austria). In the rest of
continental Europe transmission capacity is still allocated through the ATC methodology. The
difference between these two cross-border capacity allocation methods is at what point in time
the allocation of capacity is done. In the FBMC method the allocation is partly done with the
clearing of the market while in ATC it is done ex-ante. As a result, given the heuristic approach
with which the ATC is calculated and the independence of each cross-border link in the
calculation, the ATC value is conservative to prevent line overloadings, thus reducing the
capacity available to the market (Van den Bergh, et al., 2015). On the other hand, because the
FBMC considers the critical lines in the grid simultaneously with the market, the allowed
commercial capacity between zones is no longer independent from one another and the final
value is less conservative. FBMC method results in a more efficient design for capacity
allocation than the previous ATC method. (Smeers, 2008) points out that the FBMC
methodology is a reliable allocation method and applicable, from a computational perspective,
for all markets from day-ahead to real-time. Despite the improvement in efficiency, the complex
calculations that entail the FBMC method questions its transparency towards market players.
Even though the third allocation method, the nodal market, is not viewed among the targets of
the Internal Electricity Market model, according to (Neuhoff, et al., 2011) it offers an even more

Exploration of the future European Electricity Market Design
Chapter 1 - Introduction
Master Thesis MSc Economics and Management of Network Industries (EMIN) MSc Engineering and Policy Analysis (EPA) MSc Electric Power Industry (MEPI) – Ainhoa Villar Lejarreta Page 12
efficient and transparent approach to congestion management. In many power systems in the US
(ERCOT, CAISO, ISO-NE, NYISO, and PJM markets), this option was chosen over zonal
market due to the changing nature of the congested lines in their highly-meshed networks. This
method takes into account all physical transmission constraints in the market clearing, therefore
every node in the network represents one market zone, i.e. one price. Nodal market scheme is
also known as Locational Marginal Pricing (LMP). The price in every node reflects the
locational value of energy, it includes the cost of supplying the energy as well as the cost of
delivering it. Price differences in nodes show the costs of transmission at the same time it gives
proper allocation signals to market players on where to site required generation, transmission
and load. Moreover, since there is no need for a redispatch phase after market clearance, gaming
opportunities and abuse of market power would be significantly reduced. Equally important, the
link between the day-ahead market and the intraday and balancing markets would be improved
(Borggrefe & Neuhoff, 2011).
(Neuhoff, et al., 2011) describe the potential benefits that this market design would add to the
European context given the change in the generation portfolio and the need for a more efficient
use of transmission capacity. Regarding this, it could be useful to rethink in a new zone
configuration for Europe. They argue that the costs of changing the power market design and
establishing new trading arrangements can be high but in case of implementing the change the
sooner it is done the cheaper it would be. Nevertheless, some incumbent generation companies
might be opposed to the change because of rent re-allocation issues. Consumers would be the
great beneficiaries due to lower system costs that would translate into lower electricity prices.
Nevertheless, more initiative at a European level and a committed high-level support among
Member States would be essential for further steps.
1.4. Problem definition
Renewable energy technologies are becoming an increasingly important source of electricity
production in Europe's power system, which is making an important effort to move towards a
decarbonized, secure and more affordable system.
Alongside the benefits brought by the introduction of more green technologies, the uncertain
nature of these sources impact the functioning of the markets and the operation of the system in
all time scopes. In relation to this research, the daily variability of wind and sun influences the
unit scheduling in the day-ahead markets, in which flexible and commonly more expensive
units need to be available. Moreover, the limited predictability of wind generation or the
uncertainty degree in the forecasted errors calls for the need of a dynamic balancing mechanism
that is able to accomplish the required adjustments in real-time operation. Evidently, a
significantly larger share of renewables in the power system magnifies these challenges even
more. If the current electricity trading arrangements are maintained, TSOs would have to face
many more difficulties, incurring in even more inefficiencies.

Exploration of the future European Electricity Market Design
Chapter 1 - Introduction
Master Thesis MSc Economics and Management of Network Industries (EMIN) MSc Engineering and Policy Analysis (EPA) MSc Electric Power Industry (MEPI) – Ainhoa Villar Lejarreta Page 13
From a network topology perspective, the integration of renewable sources is not evenly
distributed around the continent. While wind farms are mostly concentrated, and are expected to
further expand, in regions close to the North Sea, photovoltaic solar panels are located in
specific and sunnier areas of the continent. This uneven distribution of generation sources, if not
accompanied by a proper transmission network expansion plan, can lead to significant
modifications in the power flows through the grid, affecting in turn the current cross-border
congestion profiles between countries and underutilizing the available network capacity. An
effective congestion management approach that captures the future elements of the system and
addresses the foreseen challenges would contribute to maximizing the benefits of power trade in
Europe.
A long-term solution to the above challenges is closely linked to reviewing the current power
market design and how it manages congestion in the electricity grid. Attention should be
focused on whether it makes more economic and operational sense to enhance, from a bottom-
up approach, the current European model with additional features focused on capacity adequacy
and the expected flexibility needs or implement a new market design with top-down support.
With this approach, this thesis performs a comparative study of the two different power markets
discussed above: the zonal market with the FBMC capacity allocation method and the nodal
market.
1.5. Research objectives
Following the research problem above, the question hence arises by how much can the power
market design structure and its market features affect the provision of cost-efficient electricity in
high renewable scenarios, and, consequently, how the market participants on a European scale
are influenced by it. The research objective of this thesis can be thus formulated as gaining a
better understanding of the European power market in presence of large amounts of renewable
energy sources and under different power market designs.
The research objective prompts the following main research question:
To what extent can the power market design and the future expected large-scale integration of
renewable energy sources have an effect on the system's variable generation costs of
electricity?
Additionally, several subquestions are formulated that provide an answer to how the main
question can best be explained; to identify what is the cause of such effect, if any; and to why it
is of importance to address this research's main question, respectively. The subquestions are
formulated as follows:
1. How can the European power system be modeled to best reproduce its behaviour when
functioning under different power market designs in combination with high and low renewable
scenarios?

Exploration of the future European Electricity Market Design
Chapter 1 - Introduction
Master Thesis MSc Economics and Management of Network Industries (EMIN) MSc Engineering and Policy Analysis (EPA) MSc Electric Power Industry (MEPI) – Ainhoa Villar Lejarreta Page 14
2. To what extent the difference in variable electricity generation costs between scenarios and
across power market designs can be attributed to an increased usage of renewable
technologies, network congestions or non-served energy costs?
3. How can the difference in electricity prices within and between European countries impact
the markets' participants behaviour in the power market?
1.6. Thesis outline and structure
This thesis covers the research objective and research questions with the following structure:
Chapter 2 presents the necessary theory of unit commitment models used in the planning and
operation of electric power systems as well as the technical and mathematical theory needed to
understand the use of optimal DC power flow models. Furthermore, the modeling objectives,
the network topology and the modeling methodology to implement the proposed power market
designs are addressed. Finally, the mathematical formulation of the specific model used is
provided.
Chapter 3 describes the renewable scenarios used based on the Adequacy Forecast & Scenario
Outlook of 2014 from the ENTSO-E, which extend to the year 2030, and the necessary input
model data and parameter assumptions made. Moreover, a section in this chapter is dedicated to
validating the output of the model with reality.
In chapter 4 the research outputs are presented and the answers to the research questions are
exposed. Here, the effect on the variable electricity generation costs of the power market design
in combination with a high penetration of green technologies is analyzed. Also, further analysis
is made on the possible cause or causes that generate the different outputs as well as the degree
and the possible implications that these outputs would have on the European energy multi-actor
context.
Chapter 5 exposes the conclusions, recommendations and some reflections. Here, the answer to
the research questions are formulated and the aim is to connect the results obtained with the
model to the current and foreseen situation in the European power system.
Some scope limitations of the thesis are explained in the following points:
A mathematical optimization model is used to model the short-term planning and
operation of the power system. Investments in new generation assets or network
capacities are not accounted for.
Rational, cost-minimizing agents are assumed and strategic bidding of market agents is
not taken into account. The optimization problem is solved from a central planner
perspective.

Exploration of the future European Electricity Market Design
Chapter 1 - Introduction
Master Thesis MSc Economics and Management of Network Industries (EMIN) MSc Engineering and Policy Analysis (EPA) MSc Electric Power Industry (MEPI) – Ainhoa Villar Lejarreta Page 15
The optimization problem is modeled with deterministic renewable scenarios that are
based on the scenario data provided by the ENTSO-E.
Renewable generation of wind and solar assigned to every specific node of the network
is calculated based on the forecasted wind speed and solar radiation time-series in the
assumed location of that node rather than on the average of a region covered by that
node.
The flexibility of the power system has been limited by the arbitrary number of thermal
units assigned to every node of the network. This has a direct effect on the actual
commitment, startup and shutdown schedules. As an example, it is not the same having
one thermal unit of a maximum capacity of 500 MW than having two thermal units of
maximum capacity of 250 MW each. The flexibility degree with which the power
system can operate has been modified.
Hydro energy resources are left out of the scope in the generation mix in all scenarios.
In order to account for this shortcoming, demand values obtained from the ENTSO-E
database are adjusted in those countries where hydro accounts for a significant share in
the generation mix. The outputs obtained from the optimization model should therefore
be interpreted knowing that optimization of hydro resources in combination with
intermittent renewable sources will play an important role in the replacement of
expensive thermal generation thanks to their flexibility and complementary use.

Exploration of the future European Electricity Market Design
Chapter 1 - Introduction
Master Thesis MSc Economics and Management of Network Industries (EMIN) MSc Engineering and Policy Analysis (EPA) MSc Electric Power Industry (MEPI) – Ainhoa Villar Lejarreta Page 16
Page left blank intentionally

Master Thesis MSc Economics and Management of Network Industries (EMIN) MSc Engineering and Policy Analysis (EPA) MSc Electric Power Industry (MEPI) – Ainhoa Villar Lejarreta Page 17
CHAPTER 2
THEORY AND MODEL DESCRIPTION

Master Thesis MSc Economics and Management of Network Industries (EMIN) MSc Engineering and Policy Analysis (EPA) MSc Electric Power Industry (MEPI) – Ainhoa Villar Lejarreta Page 18
Page left blank intentionally

Exploration of the future European Electricity Market Design Chapter 2 – Theory and Model Description
Master Thesis MSc Economics and Management of Network Industries (EMIN) MSc Engineering and Policy Analysis (EPA) MSc Electric Power Industry (MEPI) – Ainhoa Villar Lejarreta Page 19
2. Theory and Model Description
Chapter 2 presents the fundamental concepts in the theory of power systems and the modeling
optimization techniques and formulations used in the field. Once these concepts and
formulations are addressed, the second part of the chapter describes the modeling approach, the
methodology and the formulation chosen for the defined problem.
2.1. Theory of Unit Commitment
Unit commitment models are needed by system operators to schedule efficiently the resources
available in order to achieve a reliable and economically sustainable operation of the power
system. Unit commitment in power systems is an optimization problem that has the main
objective of finding the minimum-cost scheduling of all the generating units in the system over
a specified period of time, usually over a short-term horizon. Simultaneously, this objective is
subject to meeting the system electricity demand, complying with different types of system
constraints (technical, operational, environmental, regulatory), and take into account the long-
term signals such as the water value in hydro energy sources and guarantee an appropriate level
of reliability.
The unit commitment problem has technical and operational constraints for every generating
unit as well as for the coupling operation of these units, and the shorter the temporal scope of
the model and the time interval used, the more detailed the modeling of the generating units
should be. In general terms, the main constraints that can be found in a common formulation of
the unit commitment problem are related to:
The minimum uptime and downtime of the units
The upward and downward ramp limits
The capacity limits of the units
The status of the units and
The reserves constraints.
The unit commitment problem, of combinatorial nature, represents a challenging but necessary
task for system operators in the daily planning of power systems. An unplanned management of
the available generation resources can cause system operators and generation companies to
incur in extremely high economic losses. A unit commitment model provides a plan of the
physical operation of the system: start-up and shut-down decisions are made and an hourly
schedule of the generation park is obtained. Moreover, this short-term planning also helps to
forecast the following:
The operational costs of the system
The generation costs
The fuel consumption
The management of the reservoirs

Exploration of the future European Electricity Market Design Chapter 2 – Theory and Model Description
Master Thesis MSc Economics and Management of Network Industries (EMIN) MSc Engineering and Policy Analysis (EPA) MSc Electric Power Industry (MEPI) – Ainhoa Villar Lejarreta Page 20
The utilization factors for each generation unit
The aggregated generation for each type of technology and
The marginal costs of the units.
There exist many different approaches and ongoing research in the literature on how to solve the
unit commitment problem. Several numerical optimization techniques have been used to
address the problem. These techniques include priority list methods (Sheble, 1990) (Dillon, et
al., 1978), dynamic programming (Ouyang & Shahidehpour, 1991) (Muckstadt & Wilson,
1968), integer programming (Garver, 1963) (Snyder, et al., 1987), mixed-integer linear
programming (Cohen & Yoshimura, 1983), branch-and-bound methods (Sandrin & Merlin,
1983), and Lagrangian relaxation methods (Shahidehpour & Ouyang, 1992). Priority lists is a
quick method that specifies the order in which units are switched on or off, however, the quality
of the output is not always assured. Regarding the dynamic programming technique, the precise
solution of the model can be obtained but the large computation time is the main disadvantage.
Integer and mixed-integer methods apply linear programming by relaxing its integrality
requirements but have been used only in small unit commitment problems. The branch-and-
bound method is different from other techniques since it assumes no priority ordering, it applies
a linear function to represent fuel consumption and time-dependent start-up costs and it
calculates the required upper and lower bounds. Finally, the Lagrangian relaxation technique
can give a fast solution but it might not always numerically converge providing a low quality
solution.
Among the techniques briefly mentioned above, the Lagrangian relaxation and mixed-integer
linear programming (MILP) are the most popular methods. According to (Morales-España, et
al., 2013), the world's largest competitive wholesale market, PJM, recently switched from using
Lagrangian relaxation to MILP. However, despite the many improvements made in MILP
solvers, the time needed to solve unit commitment problems continues to be a main limitation.
Therefore, a thoroughly improved MILP formulation can really make a difference in lowering
the computational overload and making it possible to run larger or more complex problems.
Reference to the formulation used in (Morales-España, et al., 2013) shall be made in following
sections.
On the other hand, a pure unit commitment model does not include the transmission network,
instead the model's approach is to consider that all generation and load is connected in one
single node. However, because generation units are scattered in different places interconnected
between them across the network, the power flows are restricted to the capacity limits of the
transmission lines. Therefore, in order to obtain a feasible commitment schedule of the
generators the transmission network should be included in the model: a transmission economic
dispatch model is needed.
A transmission constrained economic dispatch problem, namely an optimal AC power flow
model, seeks to minimize operational costs of providing electricity by taking into account the
network constraints. The model provides as results the power output of each generating unit and
the power flows through the transmission lines, as well as a specified operating reserves margin,

Exploration of the future European Electricity Market Design Chapter 2 – Theory and Model Description
Master Thesis MSc Economics and Management of Network Industries (EMIN) MSc Engineering and Policy Analysis (EPA) MSc Electric Power Industry (MEPI) – Ainhoa Villar Lejarreta Page 21
also known as the spinning reserve. Additionally, the model introduces the important concept of
nodal prices or nodal marginal costs which will be addressed in subsequent sections.
Finally, the merger between a pure unit commitment model and a transmission constraint
economic dispatch problem provides a full and detailed overview of the required short-term
planning carried out by a Transmission System Operator (TSO). However, there are some
drawbacks to solving the AC power flow problem. An electricity network with N nodes results
in an AC power flow with 2N non-linear equations that are solved iteratively for every time step
(Van den Bergh, et al., 2014). Given the non-linearity of the transmission constraints and the
heavy computational effort required, a simplified version of an AC power flow based on linear
programming is used in practice. Section 2.2 presents the simplifications made for the AC
power flow model.
2.2. Theory of Optimal DC Power Flow
In the following section a detailed description of DC power flows is given. The AC load flow
constraints can be formulated as linear constraints based on three main assumptions.
1. The inductive component of the AC transmission line is greater than the resistive one for all
lines ( ) which means that network losses can be ignored and the line admittances can
be simplified to line susceptances in the admittance matrix ( ). The higher the voltage
of the network in question, the more valid this assumption will be.
2. All the bus voltages have a similar magnitude in per unit values. This is achieved by
managing the reactive power in the system to maintain voltage fluctuations to the smallest
possible degree. However, real life examples show that this assumption is the largest source of
DC power flow errors.
(Eq. 2.1)
3. The phase angle differences between neighbouring node voltages ( and ) under stable
operation conditions are small. This translates into a linearization of the sine and cosine terms in
the AC power flow equations as equation 2.2 shows. In general terms, this linearization is more
correct in weakly loaded grids, but even in peak load instances, the error made by this
assumption is less than 1%.
(Eq. 2.2)
How close reality adjusts to these three assumptions is what makes the solution given by the DC
power flow model more accurate. Generally, compared to AC power flows, the accuracy of DC

Exploration of the future European Electricity Market Design Chapter 2 – Theory and Model Description
Master Thesis MSc Economics and Management of Network Industries (EMIN) MSc Engineering and Policy Analysis (EPA) MSc Electric Power Industry (MEPI) – Ainhoa Villar Lejarreta Page 22
power flow models when applied to high voltage grids is close to 5% when averaged over all
lines. Therefore, by keeping in mind the conclusions drawn for individual lines, the error
deviations are assumed to be acceptable.
Although a reference bus is needed as reference point in the linearization of the power flow
model, the literature (Sheble, 1990) (Baldick, 2003) (Dillon, et al., 1978) (Baldick, et al., 2005)
proves that the DC power flow formulation is not significantly sensitive to different operating
points. Therefore, as long as the network topology is kept unchanged, the DC power flow
equations can be used for all operating points indistinctly.
Figure 2.1. Impedance of line ij
In the DC power flow problem perfect voltage support, reactive power management, negligible
network losses are assumed and only line active power flows are considered. The active power
flow through an AC transmission line follows the following equation:
(Eq. 2.3)
By applying the mentioned assumptions above, equation 2.3 simplifies to the DC power flow
equation, Eq. 2.4:
(Eq. 2.4)
Similarly, the simplified DC power flow equation for nodal active power balances in one node
is shown below (Eq. 2.5), with being the positive direction of the active power flow from
node to and the susceptance of line between node and (Van den Bergh, et al., 2014):
(Eq. 2.5)

Exploration of the future European Electricity Market Design Chapter 2 – Theory and Model Description
Master Thesis MSc Economics and Management of Network Industries (EMIN) MSc Engineering and Policy Analysis (EPA) MSc Electric Power Industry (MEPI) – Ainhoa Villar Lejarreta Page 23
If node is now considered to be the reference bus, Eq. 2.5 can be then written in matricial
form:
(Eq. 2.6)
(Eq. 2.7)
Therefore, the voltage phase angle is calculated as in Eq. 2.8 and, by substituting this
expression in Eq. 2.4, the Power Transfer Distribution Factors (PTDFs) are obtained, as shown
in Eq. 2.10.
(Eq. 2.8)
(Eq. 2.9)
(Eq. 2.10)
Finally, the DC power flow equations of the AC transmission lines in the network are
represented in matrix form in Eq. 2.11.
(Eq. 2.11)
The Power Transfer Distribution Factors (PTDFs) linearly relate the power injections in the
nodes of the network ( ) and the active power flows in the lines ( ). In essence, the link

Exploration of the future European Electricity Market Design Chapter 2 – Theory and Model Description
Master Thesis MSc Economics and Management of Network Industries (EMIN) MSc Engineering and Policy Analysis (EPA) MSc Electric Power Industry (MEPI) – Ainhoa Villar Lejarreta Page 24
between and is a relation between reactances. Also called sensitivity factors, an
element in the PTDF matrix provides an approximation of how the power flow through
transmission line changes with an injection or withdrawal of one MW of active power at node
(Van den Bergh, et al., 2014). For the PTDF calculation, the reference node or slack bus needs
to be removed from the DC power flow equations in order to obtain a set of linearly
independent equations.
Finally, the active power flows are bounded by the capacities of the transmission lines, Eq. 2.12.
(Eq. 2.12)
Until this point, only AC transmission lines have been considered in the formulation. However,
High Voltage Direct Current (HVDC) lines can also be part of the meshed high voltage grid. In
case the HVDC line is embedded within an AC grid, the power flow through this line can be
fully controlled. If the HVDC line connects extremes of the network, like for example offshore
wind farms with the continental grid or interconnects two asynchronous power systems, then the
HVDC transmission line is not a true power flow controlling device.
Van den Bergh (2014) proposes a methodology to model these lines based on the replacement
of the line capacity for a combination of a positive and negative power injections at the two
nodes that connect the HVDC line. The methodology applied in this research uses Van den
Bergh's idea of replacing the power flow through the HVDC line ( ) for the nodal injections
in the corresponding nodes ( ) through the relationship given by , the incidence matrix
of the HVDC network. is a L N matrix with if line L starts at node N,
if line L ends at node N and if line L is not incident to node N. Therefore,
represents a vector that contains the nodal injections in every node due to the power flow
through the HVDC lines (Eq. 2.13).
(Eq. 2.13)
Even though no reactance is associated to the HVDC lines, the DC power flow equations of the
AC lines should also include the effect of the power flows in the HVDC lines. This effect is
included in Eq. 2.14 by adding the term to Eq. 2.11. Finally, Eq. 2.14 are the DC power
flow equations of the AC transmission lines in a network with HVDC lines.

Exploration of the future European Electricity Market Design Chapter 2 – Theory and Model Description
Master Thesis MSc Economics and Management of Network Industries (EMIN) MSc Engineering and Policy Analysis (EPA) MSc Electric Power Industry (MEPI) – Ainhoa Villar Lejarreta Page 25
(Eq. 2.14)
Equation 2.14 implicitly takes care of the power balance in the nodes that are connected to at
least one AC transmission line. However, an additional constraint needs to be added in order to
guarantee power balance in the nodes connected only to HVDC lines (Eq. 2.15). This constraint
includes the net injection calculated as a result of the net generation, demand and energy not
served in every node ( ) plus the net inflow due to the power flow of HVDC lines
connected to node
(Eq. 2.15)
2.3. Locational Marginal Prices
The Locational Marginal Prices (LMP), or nodal prices, are also the marginal costs of
electricity. Nodal prices guarantee at every point in time that demand is met at minimum cost
and price differences reflect generation and transmission capacity scarcity, as already explained
in section 1.3. The LMP mechanism takes into account all the physical transmission constraints
in the clearing of the day-ahead market. Based on a real representation of the network and a
transparent approach, the price calculation is done a posteriori, after solving the linear
programming model, and is based on the dual variables of the system balance and network
constraints.
Every constraint in the model has a corresponding dual variable, also called shadow price. A
dual variable provides crucial information about the system. It measures how much the
objective function varies when the corresponding constraint is incremented by one unit. In other
words, in this case they measure the change in total variable generation costs when demand,
generation or non-served energy vary by one unit.
It should be noted that non-binding constraints correspond to shadow prices equal to zero. In the
event that some constraints are binding, for example a specific line is operating at its limit
capacity, the shadow price for that line will be non-zero and thus it indicates the presence of
transmission congestion in the network. The system balance constraint, specified as an equality
constraint (Eq. 2.16), always binds; it suggests a price that always supports balance in the
system.
Eq. 2.16. System balance constraint and its dual variable.

Exploration of the future European Electricity Market Design Chapter 2 – Theory and Model Description
Master Thesis MSc Economics and Management of Network Industries (EMIN) MSc Engineering and Policy Analysis (EPA) MSc Electric Power Industry (MEPI) – Ainhoa Villar Lejarreta Page 26
The following fundamental formula, in the absence of network losses, is used to calculate the
LMP in any node:
Eq. 2.17. Formula of locational marginal prices (€/MWh) based on dual variables.
where:
Node
Hourly period
Shadow price (dual variable) of the system balance constraint
AC power transmission line
– Power Transfer Distribution Factor of AC transmission line due to node
Shadow price (dual variable) of the network constraint of AC transmission line
Shadow price (dual variable) of the power balance constraint in nodes with only
HVDC lines
The advantage of using a nodal pricing mechanism over a FBMC or ATC mechanism is that it
efficiently manages congestion in the network without interference of the TSOs. This is because
they internalize the energy losses and congestions in accordance with the network constraints.
As an important result, nodal prices give efficient economic short-term signals to market
participants and stimulate the required investments and the appropriate performances of system
operation.
2.4. Modeling approach
Large-scale integration of renewable energy sources in the near future is expected to become a
main driver to enhance operational practices to provide a more flexible and efficient functioning
of the European power system. This flexibility can be achieved from the generation side, from
both conventional and renewable generation, by improving their system reliability and stability
capabilities; it can also be achieved from the load side, with demand response and also from the
operational side, by better exploiting the existing transmission infrastructure and by sharing
greater cooperation between regions for transmission expansion.
Moreover, the power market design, which in general terms dictates the rules of the power
system's functioning, has an impact on how the power system's flexibility is managed and
therefore it also has an effect on the variable generation costs of the power system. In order to
stress the relevance of the power market design in presence of increasing renewable capacity, an
energy model is developed. The following subsections elaborate on the modeling objectives, the

Exploration of the future European Electricity Market Design Chapter 2 – Theory and Model Description
Master Thesis MSc Economics and Management of Network Industries (EMIN) MSc Engineering and Policy Analysis (EPA) MSc Electric Power Industry (MEPI) – Ainhoa Villar Lejarreta Page 27
type of the chosen model and its scope and the modeling methodology used to implement the
proposed power market designs.
2.4.1 Modeling Objectives
The interest of this research lies in gaining further insights on the functioning of the European
power system under different power market designs taking into account the large amounts of
renewable sources that will be integrated in the following years. Up until now system operators
have had relatively little problems integrating small amounts of RES. However, according to the
European Commission, a new renewable energy target has been set: at least 27% of the final
energy consumption in the European Union as a whole should come from renewable sources by
the year 2030. This is expected to unfold many challenges for TSOs in efficiently managing the
network as explained in section 1.2.2.
In order to reflect the impacts of the high RES integration in the functioning of the power
system, a bottom-up model approach is chosen. With this approach the considered energy
system is technically and economically parameterized and looked at from a technological
perspective. Following this, a comprehensive analysis of the technological aspect under study is
allowed (Jägemann, et al., 2013), in this case the large deployment of RES technologies in the
power system under different power market designs.
Within this bottom-up approach, an optimization model is selected over a simulation model, like
agent-based models or system dynamics models. TSOs are the entities that operate and manage
the power system, and their aim is to manage it in the least costly way possible. Hence, the
ability of the optimization model to determine a system optimal solution from a centralized
perspective makes it more suitable for the present research.
The aim is to analyze the impact of the power market design on the power system's variables,
like total variable generation costs, hourly electricity prices, hourly line congestions, RES
curtailment and total production derived from different fuel types, while subjected to several
scenarios of increasing degree of RES integration. Therefore, it is preferred to develop a model
that gives the optimal functioning of the system for a given objective function, i.e. minimization
of total variable generation costs, and a set of constraints that express the technical limitations
and political targets in the system.
2.4.2 Modeling the Day-Ahead Market
With the theory of unit commitment and optimal DC power flow models explained in sections
2.1 and 2.2, the optimization model developed in this research solves the unit commitment
problem and a transmission constrained economic dispatch of the units for a conceptual network
of North-West and central Europe. Figure 2.2 shows a representation of the modeled network.

Exploration of the future European Electricity Market Design Chapter 2 – Theory and Model Description
Master Thesis MSc Economics and Management of Network Industries (EMIN) MSc Engineering and Policy Analysis (EPA) MSc Electric Power Industry (MEPI) – Ainhoa Villar Lejarreta Page 28
The model simulates the day-ahead market for the European network in Figure 2.2 from a
centralized decision making point of view. This means no strategic behaviour between agents is
considered in the model. The day-ahead market is solved by minimizing total variable
generation costs at the same time it allocates the hourly demand over the existing generating
units and complies with the technical limitations of the power system, i.e. maximum capacities
of the generators or transmission line limits.
Morales-España et al. (2013) proposes a mixed-integer linear programming (MILP) formulation
of the unit commitment problem. Compared to other existing and efficient formulations, this
tighter and more compact formulation reduces the feasible region that needs to be explored by
the solver and it increases the speed with which solvers search the optimal integer solution in
that feasible region. This model's formulation characteristics lower the model's computational
complexity in comparison to other unit commitment formulations, making it attractive for large
unit commitment problems representing large power systems. For this reason, this UC
formulation is chosen in this research. For a detailed elaboration on the peculiarities and
advantages of the mentioned formulation, the interested reader is referred to Morales-España et
al. (2013). Additionally, the network elements have been added to the UC formulation as it will
be explained in the mathematical formulation section, section 2.4.
Figure 2.2. Conceptual European network modeled in the day-ahead market

Exploration of the future European Electricity Market Design Chapter 2 – Theory and Model Description
Master Thesis MSc Economics and Management of Network Industries (EMIN) MSc Engineering and Policy Analysis (EPA) MSc Electric Power Industry (MEPI) – Ainhoa Villar Lejarreta Page 29
Technological scope
The model includes the operational costs and technical characteristics of 873 conventional
power plants as well as their commitment decisions. The following generation technologies are
considered:
Nuclear power plants
Coal-fired steam power plants powered with coal or anthracite
Lignite-fired steam power plants
Heavy and light fuel oil power plants
Combined cycle gas turbines (CCGT) powered with natural gas
Gas-fired steam turbines
Regarding renewable technologies, both onshore and off-shore wind and solar energy
production are included in the generation mix. Normalized generation profiles of wind and solar
energy which account for the characteristic wind and solar daily patterns are included as input
data in the model from The National Centers for Environmental Prediction (NCEP) Climate
Forecast System (CFS) database (Saha, et al., 2011), and scaled with the renewable installed
capacity in every RES scenario considered. The thermal generation mix is also updated with the
scenarios, except hydro generation, which given the lack of input data, was not considered.
It should be noted that renewable energy production is given priority in the model as no
operational cost is assigned to it and curtailment, this is disconnecting renewable sources from
the power grid, is allowed to happen in situations of sudden lack of demand or line congestions.
Temporal scope
The model calculates the optimal economic dispatch schedule that meets the hourly demand for
one week in July in a reference scenario in the year 2014. Furthermore, another five scenarios
representing different projections of RES integration for the years 2020 and 2030 are used to
help assess the system's operation adequacy in these situations. These scenarios are named as
scenario EU 2020 and Visions 1, 2, 3 and 4 for the year 2030. A detailed description of these
scenarios is done in chapter 3.
Regional scope
Twelve countries in the European Union are covered in the modeled network with one, two and
up to five nodes per country, in the case of Germany. In total the model contains 22 nodes
connected by a total of 72 transmission corridors. Figure 2.2 shows the network topology with
the nodes and transmission lines used. This power system is a highly simplified version of the

Exploration of the future European Electricity Market Design Chapter 2 – Theory and Model Description
Master Thesis MSc Economics and Management of Network Industries (EMIN) MSc Engineering and Policy Analysis (EPA) MSc Electric Power Industry (MEPI) – Ainhoa Villar Lejarreta Page 30
real high voltage European network. However, the number and type of connections between
countries are defined in accordance to reality.
Transmission corridors in the network differ between AC and HVDC lines. Their transmission
capacities and number of circuits in each corridor are defined based on (Van Blijswijk, et al.,
2015). The HVDC links mainly connect remote regions with renewable resources to load
centers in the meshed AC continental power system. Moreover, both types of transmission
corridors are modeled differently. As already mentioned in section 2.2, AC transmission lines
have an electrical reactance associated to them which largely determines the distribution of the
power flows in the grid. On the other hand, the flow through HVDC transmission lines is not
dependent on an electrical reactance but still affects the flows in the rest of AC transmission
lines in the network. The specific network formulation will be detailed in section 2.5.
Regarding the allocation of thermal generation in the grid, a generation database from TU Delft
(Enipedia) was initially used as an indication of the number of existing units and their location
in every country. However, given the incompleteness of the data, an arbitrary estimation of the
number of generating units in every node and for every type of technology was made. This
estimation was calculated by taking into account the country's generation mix for the scenario in
question and assuming a range of realistic capacity values of the generators according to the fuel
type. No change in the number of units is assumed across scenarios, only the capacities of these
units change in order to adjust to the new generation mix in the different scenarios. Tables D.6
to D.11 in Appendix D show the capacity values used according to the fuel type and the
scenario.
With respect to renewable generation, the normalized wind and solar feed-in profiles implicitly
account for regional variations of wind speed and solar radiation throughout the power system.
Regarding demand, the national hourly demand value obtained from the online Transparency
Platform of the ENTSO-E is allocated to every node in the country proportionally to the
population in every zone covered by every node. National population statistics from the year
2013 are mostly used. In this way, every hour and every node in the network have one demand
value assigned.
2.4.3 Model Implementation of Power Market Designs
In this section the methodology used to model the different power market designs discussed in
section 1.3, the FBMC allocation method for the zonal market and the nodal market, is
presented. They are modeled according to how congestion is managed in each case. Figure 2.3
shows a schematic representation of the modeling process described below.
In the nodal market, as previously explained congestion is entirely handled through the market.
In this case the unit commitment and economic dispatch model is run with all the network

Exploration of the future European Electricity Market Design Chapter 2 – Theory and Model Description
Master Thesis MSc Economics and Management of Network Industries (EMIN) MSc Engineering and Policy Analysis (EPA) MSc Electric Power Industry (MEPI) – Ainhoa Villar Lejarreta Page 31
constraints activated. The output dispatch of the model is therefore feasible with all the
constraints and needs no adjustments.
Figure 2.3. Schematic representation of the modeling process of the power market designs
A zonal market with a Flow Based Market Coupling (FBMC) capacity allocation mechanism is
modeled in two different steps. In a first phase the unit commitment schedule of the generating
units and the economic dispatch is calculated by the TSO once the clearance of the market is
done. In the model this is done by running the optimization algorithm taking into account only
cross-border interconnections. The national transmission lines are ignored by setting their
inductive reactances to zero and their capacities to a very large value.
During the second phase, the TSO evaluates intra-zonal congestion within national boundaries,
and checks the feasibility of the dispatch outcome with the national transmission constraints. In
practice, this translates into running the MIP economic dispatch model once again taking into
account all the transmission lines. In the redispatch phase the commitment, startup and
COPPER PLATE MARKET
Run the Model:
All interconnections ignored
System generation costs obtained
NODAL MARKET
Run the Model:
All interconnections considered
System generation costs obtained
Nodal prices obtained
ZONAL MARKET
REDISPATCH PHASE
Run the Model:
Commitment decisions maintained
All interconnections considered
System redispatch if necessary
System generation costs obtained
Nodal prices obtained
ZONAL MARKET
FIRST PHASE
Run the Model:
Interconnections within
zones ignored
Commitment decisions of
units obtained

Exploration of the future European Electricity Market Design Chapter 2 – Theory and Model Description
Master Thesis MSc Economics and Management of Network Industries (EMIN) MSc Engineering and Policy Analysis (EPA) MSc Electric Power Industry (MEPI) – Ainhoa Villar Lejarreta Page 32
shutdown schedules obtained from the economic dispatch in the first phase are fixed; no startup
or shutdown of plants can now take place. The redispatching process should be facilitated by
those units who are already committed.
Moreover, given the direction towards where Europe is heading, a reference model is used for
comparison purposes. This model, referred to hereafter as Copper Plate, assumes a perfectly
future integrated Internal Electricity Market with the sufficient network capacity in all locations
that ensures a single wholesale price and prevents any congestion from existing in the whole of
Europe. In practice, this major assumption translates into running the unit commitment and
economic dispatch model without taking into account the transmission constraints of the
European network. Knowing that the current situation is far from such ideal model, it serves as
a reference with respect to the zonal and nodal markets and it provides with a rough estimation
of the studied parameters in a yet unreal electricity system.
2.5. The Optimization Problem. Model Formulation
The clearance of the day-ahead market is modeled with a unit commitment and a transmission
constrained economic dispatch model (UC & TCED). The optimization model minimizes the
total variable generation costs of the considered power system (Morales-España, et al., 2013).
These costs include fixed generation costs comprised by the fixed fuel consumption costs and
the startup and shutdown costs, and the operational costs that include the variable production of
the units and the CO2 emission costs.
Simultaneously, the optimization problem is constrained to a set of technical limitations of the
thermal units, to maximum wind and solar hourly generation profiles and to line transmission
capacities, among the most relevant ones.
The optimization problem is programmed using GAMS (General Algebraic Modeling System),
a high-level modeling software for mathematical programming and optimization. By using the
GAMS solver, Cplex, large linear and mixed integer programming problems can be solved. The
GAMS code of the model can be found in Appendix A. An interface with Excel-GAMS-Matlab
was prepared to input the data into the software and generate the output figures.
The mathematical formulation implemented in the model will be presented and explained in the
section below. Given its complexity, a text representation of the model is presented in Text Box
1 to help the reader understand the functioning of the model. The tight and compact formulation
used is adapted from (Morales-España, et al., 2013), and additional parameters and variables
have been added in order to model the dispatchable HVDC transmission lines existing in the
network.
The code in GAMS is divided mainly into four differentiated sections: sets, parameters,
variables and equations. In the following section the equations will be presented and explained.
Refer to the Nomenclature for a clarification of the defined sets and parameters used in the

Exploration of the future European Electricity Market Design Chapter 2 – Theory and Model Description
Master Thesis MSc Economics and Management of Network Industries (EMIN) MSc Engineering and Policy Analysis (EPA) MSc Electric Power Industry (MEPI) – Ainhoa Villar Lejarreta Page 33
model. For consistency reasons, uppercase letters denote parameters and sets. Lowercase letters
denote variables and indexes.
Text Box 1. Text scheme of optimization model
Optimization Problem:
Unit Commitment & Transmission Constrained
Economic Dispatch
Minimize
Total variable power system variable generation costs to supply electricity
demand for a week
Fixed fuel cost consumption
Start up and shutdown cost
Variable production and operation & maintenance cost
CO2 emission cost
Subject to
Power system balance
Total thermal energy production + total renewable energy
production + total non-served energy in the system needs to be
equal to the total energy demand in the system in every hour
The provision of upward and downward operating reserves for
every hour in the system needs to be ensured to respond to
unexpected events in the grid. These reserves are estimated to be a
percentage of the hourly demand and are provided by the online
generating units that can increase or decrease their output over their
scheduled output in limited time. For simplicity reasons, reserves
have been assumed to be zero.
Constraints of thermal generating units
Total production of committed units. If a generating unit is
committed, its production needs to be above the unit's technical
minimum output.
Generator output must remain below its maximum capacity.
Logical commitment constraint. A unit can start up, be committed
and shut down in different, consecutive or alternate, periods but it
can never start up and shut down simultaneously.
Minimum time online and offline. If a unit is committed, it must
remain online for a minimum number of hourly periods. Similarly,
if a unit is shut down, it must remain offline for a minimum number
of hourly periods.
The production above technical minimum of the unit + upward
reserve of the unit needs to be less or equal to the difference
between the unit's maximum capacity and its technical minimum
output.
The downward reserve of the unit needs to be less or equal to the
production above technical minimum of the unit.

Exploration of the future European Electricity Market Design Chapter 2 – Theory and Model Description
Master Thesis MSc Economics and Management of Network Industries (EMIN) MSc Engineering and Policy Analysis (EPA) MSc Electric Power Industry (MEPI) – Ainhoa Villar Lejarreta Page 34
Ramping limits of the units. The increase or decrease in a unit's
output has to remain lower than its maximum upward and
downward ramp capabilities, respectively.
Network constraints
Capacity limits of the transmission lines. The flow of energy
through the AC and HVDC transmission lines needs to remain
lower than the maximum capacity of these.
Power flow in AC transmission lines. The power flowing through a
specific AC transmission line is equal to the net power injection in
a node multiplied by a factor (PTDF), and summed over all the
nodes in the network that connect to any AC line.
The net power injection in a node includes production + non-served
energy demand + the net power inflow from HVDC lines
connected to that node.
The factor PTDF relates the net power injection in a node that
connects to any AC line, to the flow of the AC line of whose power
flow is being calculated.
The power balance in every node connecting to any AC line is
implicitly guaranteed with this equation.
Power balance in nodes connecting only to HVDC lines.
Production + non-served energy demand + the net power inflow
from HVDC lines connected to that node should be equal to zero.
2.5.1 Objective Function
The unit commitment model's algorithm seeks to minimize the total variable generation costs to
supply electricity for one week in the simplified European power system considered. In general
terms, these total variable generation costs are defined as the sum of: (i) the fixed fuel
consumption costs , (ii) the variable costs of production (ii) the startup and
shutdown costs and , (iii) the non-served energy costs and (vi) the CO2 emission
costs , as shown in equation 2.18.
(Eq. 2.18)
The fixed fuel consumption cost is the sum over all the generators and all hourly periods of
the fixed cost of fuel in €/hour incurred for all thermal generating units (Eq. 2.19). This cost is
obtained based on the fixed fuel consumption of the units according to the fuel type used. Units
that have lower fixed fuel consumption rates like nuclear fuel, lignite, coal and anthracite units,
have a lower fixed fuel cost compared to those units using natural gas, gas or light and heavy
fuel oil.

Exploration of the future European Electricity Market Design Chapter 2 – Theory and Model Description
Master Thesis MSc Economics and Management of Network Industries (EMIN) MSc Engineering and Policy Analysis (EPA) MSc Electric Power Industry (MEPI) – Ainhoa Villar Lejarreta Page 35
(Eq. 2.19)
The short run marginal cost (SRMC) of production refers to the marginal cost of the generators.
It is calculated over all generators and all hourly periods (Eq. 2.20). It includes the
production cost and the operation and maintenance cost of the units. The production cost can be
approximated to the fuel cost in €/MWh divided by the operating efficiency of the generating
unit.
(Eq. 2.20)
Startup costs reflect the consumption of fuel required to reach the optimal conditions of
temperature and pressure in the boiler of the generating units. This cost is calculated over all
generators and all hourly periods following equation 2.21, where represents the startup
cost of unit per capacity installed, is the unit's maximum capacity and is the unit's
binary startup variable. In this model, shutdown costs have been assumed to be a 10% of the
startup costs.
(Eq. 2.21)
(Eq. 2.22)
In general terms, the cost of non-served energy is a result of the total amount of energy not
supplied in every node and hour, , multiplied by the cost of non-served energy in
€/MWh calculated over all the nodes and all hourly periods as shown in equation 2.23.
(Eq. 2.23)
The objective function also includes a term for total CO2 emission costs for those thermal units
with an emission rate (tonnes of CO2/GWh). The emission rate multiplied by the cost of CO2
emissions, (M€/ tonnes of CO2), by the power output of the unit and summed over all
thermal generators and all hourly periods gives the total CO2 emission cost (Eq. 2.24).

Exploration of the future European Electricity Market Design Chapter 2 – Theory and Model Description
Master Thesis MSc Economics and Management of Network Industries (EMIN) MSc Engineering and Policy Analysis (EPA) MSc Electric Power Industry (MEPI) – Ainhoa Villar Lejarreta Page 36
(Eq. 2.24)
2.5.2 Constraints
Alongside the objective function several technical constraints exist and they need to be
complied with. The following section is devoted to review these constraints.
2.5.2.1 Power system balance requirement.
An energy balance is required between demand and thermal ( and renewable
production at all time periods in the power system. Curtailment of renewable generation is
allowed in the model if it is required to comply with system balance. Additionally, a variable for
non-served energy is included to take into account situations in which there is a lack of energy
production or the network limits the supply of electricity to a particular load center. This is
guaranteed with equation 2.25.
(Eq. 2.25)
2.5.2.2 Production of committed units.
The total production of a unit is modeled in two separate terms, as shown in equation 2.26. On
the one hand there is the technical minimum output of the unit once it is committed and on the
other hand a term is included in case the output is above that minimum.
(Eq. 2.26)
Moreover, the initial behaviour of the units is limited by their initial conditions (Morales-
España, et al., 2013). In practice, a day in advance is modeled in order to obtain the initial
conditions for the following day. If the initial output of the unit lies above its technical
minimum output then the unit is committed.

Exploration of the future European Electricity Market Design Chapter 2 – Theory and Model Description
Master Thesis MSc Economics and Management of Network Industries (EMIN) MSc Engineering and Policy Analysis (EPA) MSc Electric Power Industry (MEPI) – Ainhoa Villar Lejarreta Page 37
2.5.2.3 Logical Commitment and Minimum Up and Downtime constraints
The following constraint (Eq. 2.27) guarantees that the commitment, startup and shutdown
binary variables take the adequate values between hourly periods.
(Eq. 2.27)
On the other hand, equations 2.28 and 2.29 refer to the minimum number of hourly periods that
the units must be online and offline. As specified in (Morales-España, et al., 2013) the
combination of these constraints results in , and this assures that a unit does not
start up or shut down simultaneously.
(Eq. 2.28)
(Eq. 2.29)
2.5.2.4 Generation capacity limits
The proposed formulation from (Morales-España, et al., 2013) for the generators' capacity limits
over their production and their upward and downward spinning reserve is constrained by the
committed, start up and shutdown status of the units. It is realistic to assume that, immediately
after starting up a unit or immediately before shutting down the unit, this one is producing at its
minimum level. Equations 2.30, 2.31 and 2.32 assure that, both if a unit is started up in hour
( ) or shut down in ( ), the production of that unit in hour will be its
minimum output ( ) since the right term would be multiplied by zero and
is defined as a positive variable.
(Eq. 2.30)
(Eq. 2.31)

Exploration of the future European Electricity Market Design Chapter 2 – Theory and Model Description
Master Thesis MSc Economics and Management of Network Industries (EMIN) MSc Engineering and Policy Analysis (EPA) MSc Electric Power Industry (MEPI) – Ainhoa Villar Lejarreta Page 38
(Eq. 2.32)
(Eq. 2.33)
It is noted that equations 2.30 and 2.31 are applied for the subset which contains the
generating units with = 1. On the other hand, equation 2.32 is included for those units with
, this is when the units are operating for at least two online periods. Although equation
2.30 and 2.31 are feasible for both when and when , using the combination of Eq.
2.30, 2.31 and 2.32 provides a tighter and more compact formulation. The reader can refer to
(Morales-España, et al., 2013) for more information about the use of this formulation.
2.5.2.5 Upward and downward system operating reserves
The following constraints (Eq. 2.34 and Eq. 2.35) ensure the provision of upward and
downward operating reserves for every hour in the system. These reserves, provided by the
online generating units, are defined as the power that these units can increase or decrease over
their programmed output within a limited time in response to an automatic generation control
(AGC). For simplicity reasons, reserves are assumed to be zero.
(Eq. 2.34)
(Eq. 2.35)
2.5.2.6 Ramping limits
Equations 2.36 and 2.37 ensure that the upward and downward ramp rate limits of all the units
are respected.
(Eq. 2.36)
(Eq. 2.37)

Exploration of the future European Electricity Market Design Chapter 2 – Theory and Model Description
Master Thesis MSc Economics and Management of Network Industries (EMIN) MSc Engineering and Policy Analysis (EPA) MSc Electric Power Industry (MEPI) – Ainhoa Villar Lejarreta Page 39
2.5.2.7 Network constraints
The power flow in AC transmission lines is calculated using a linearized approximation of the
AC power flow problem: the DC power flow model. The Power Transfer Distribution Factors
(PTDF) are calculated as the result of the linearization process. This simplification is based on a
series of assumptions previously explained in section 2.2.
For every hourly period and for every AC transmission line in the network, the active power
flows in these lines are calculated using the linear relationships (PTDFs) between the active
power flows and the net power injections in the subset of nodes that connect at least one AC
transmission line ( (Eq. 2.30). These net power injections are obtained from the power
balance in every bus; it includes the total thermal and renewable generation, the demand, the
non-served energy and the injections due to the power flows in the HVDC lines connected to
the node in question. Equation 2.30 implicitly ensures the power balance in those nodes that are
connected to at least one AC transmission line.
(Eq. 2.30)
Regarding the power flows in the HVDC lines ( ), these are calculated through the power
balance equation of those nodes in the network connected only to HVDC lines (Eq. 2.31).
(Eq. 2.31)
Moreover, Eq. 2.32 and Eq. 2.33 ensure that the transmission line capacities are respected in
both AC and HVDC lines.
(Eq.
2.32)
(Eq.
2.33)

Exploration of the future European Electricity Market Design Chapter 2 – Theory and Model Description
Master Thesis MSc Economics and Management of Network Industries (EMIN) MSc Engineering and Policy Analysis (EPA) MSc Electric Power Industry (MEPI) – Ainhoa Villar Lejarreta Page 40
Page left blank intentionally

Master Thesis MSc Economics and Management of Network Industries (EMIN) MSc Engineering and Policy Analysis (EPA) MSc Electric Power Industry (MEPI) – Ainhoa Villar Lejarreta Page 41
CHAPTER 3
SIMULATION SETUP

Master Thesis MSc Economics and Management of Network Industries (EMIN) MSc Engineering and Policy Analysis (EPA) MSc Electric Power Industry (MEPI) – Ainhoa Villar Lejarreta Page 42
Page left blank intentionally
Exploration of the future European Electricity Market Design Chapter 3 – Simulation Setup
Master Thesis MSc Economics and Management of Network Industries (EMIN) MSc Engineering and Policy Analysis (EPA) MSc Electric Power Industry (MEPI) – Ainhoa Villar Lejarreta Page 43
3. Simulation Setup
Until now, the focus has been set on the theory and application of unit commitment and
economic dispatch models for the present research and to the approach used to model the
proposed power market designs.
The following chapter discusses the renewable scenarios used and the assumptions made in the
optimization model that will serve to analyse how well the different power market designs
accommodate the different degrees of renewable energy sources integrated in the power system.
Moreover, sections 3.2 and onwards give a description of the input data and its sources.
Demand, operating reserves, the properties of the generators and their costs, renewable
generation and the parameters of the network are identified and used in the formulation
previously presented.
3.1. Scenario definition
Five future scenarios with different degrees of renewable energy integration in Europe are used
to help assess the degree of uncertainty that a long-term generation adequacy assessment entails.
Moreover, these scenarios help evaluate the evolution of key parameters relevant to a proper
functioning of the European interconnected power system. Trends on nodal electricity prices,
the degree of power line congestions, curtailment of renewable generation and the evolution of
the system's total variable operation costs over the three proposed power market designs is the
main focus of the scenario analysis.
The scenarios are based on the Scenario Outlook & Adequacy Forecast (SO&AF) from 2014 to
2030 (ENTSO-E, 2014a), which are annually published by the ENTSO-E, as part of the Ten-
Year Network Development Plan (TYNDP) (ENTSO-E, 2014b).
The Scenario Outlook & Adequacy Forecast report sets out three scenarios (Scenario A
"Conservative", Scenario B "Best Estimate" and Scenario EU 2020) and four visions for 2030.
In these scenarios generation and demand forecasts are specified for all Member States and the
adequacy of the ENTSO-E's interconnected power system is assessed on the mid and long-term
horizon focusing on power balance, margins, energy indicators and the generation mix. Thus, it
provides stakeholders in the electricity sector with what the future holds on the European level.
The specific scenarios used in this research are the following:
Scenario B "Best Estimate", as the reference scenario for year 2014.
The EU 2020 Scenario.
The four Visions for 2030.
These scenarios are non-probabilistic, instead they have associated estimations of the generation
mix and the demand profiles. The details on the assumptions on which these scenarios are built

Exploration of the future European Electricity Market Design Chapter 3 – Simulation Setup
Master Thesis MSc Economics and Management of Network Industries (EMIN) MSc Engineering and Policy Analysis (EPA) MSc Electric Power Industry (MEPI) – Ainhoa Villar Lejarreta Page 44
are shown in the next subsections. Figure 3.1 gives an overview of the generation mix for the
considered network across the chosen scenarios.
Figure 3.1. General overview of the generation mix across all scenarios.
Source: Own source, calculated with the input data in the model.
In relative terms, it can be noted that the share of installed renewable capacity in the entire
power system considered is expected to increase from 26% in 2014 to 61% in year 2030 while
all the thermal technologies decrease in share. Along with this general decrease of thermal
power plants, the lowest capacity values of coal-fired steam power plants are spotted in Vision 3
(51,7 MW). This is combined with the highest capacity values of gas-fired steam power plants
and combined-cycle gas turbines in Vision 3, which increase by 27% with respect to the
capacity installed in scenario EU 2020 (see Table B.2 in Appendix B). Therefore, there is a
clear shift expected towards renewable sources and, consequently, a need for flexible responsive
technologies to react in case of sudden lack of wind or sun.
3.1.1. Reference scenario
Scenario B "Best Estimate" is used as the reference base case scenario to model the current
situation in the year 2014. It is a bottom-up scenario based on the TSOs' expectations of
potential developments for the period 2014 to 2025 given that market signals incentivize
investments.

Exploration of the future European Electricity Market Design Chapter 3 – Simulation Setup
Master Thesis MSc Economics and Management of Network Industries (EMIN) MSc Engineering and Policy Analysis (EPA) MSc Electric Power Industry (MEPI) – Ainhoa Villar Lejarreta Page 45
In terms of generation mix, this scenario takes into account the generation capacity considered
to be as sure and whose commissioning is under process as well as the future commissioning of
power plants considered as credible according to the TSOs' available information. The request
to obtain connection to the grid by producers is not the only source of estimation used by the
TSOs to consider the likelihood that a project takes place, but also the regional economic
assessments of these are taken into account.
Figure 3.2 shows the generation mix per country used to model the network in year 2014 (See
associated Table B.3 in Appendix B). The share of renewable installed capacity is well below
30% except in countries like Germany, Norway or Denmark, which already have significant
amounts of solar plants and wind farms, respectively. For further political and economical
viewpoints considered in this scenario the reader can refer to the Scenario Outlook & Adequacy
Forecast 2014-2030 (ENTSO-E, 2014a).
Figure 3.2 . Breakdown of generation mix per country in Scenario B year 2014.
Source: Own source, calculated with the input data in the model.
3.1.2. Scenario EU 2020
Scenario EU 2020, built from a top-down approach, is derived from the National Renewable
Action Plans (NREAP) of the member states or from the equivalent governmental plan in case
of lack thereof. It gives an estimation of the required future renewable energy developments to
comply with the European 20-20-20 objectives. Conventional generation capacity forecasts that
support the European renewable plan are also envisaged on a national basis. Moreover, the

Exploration of the future European Electricity Market Design Chapter 3 – Simulation Setup
Master Thesis MSc Economics and Management of Network Industries (EMIN) MSc Engineering and Policy Analysis (EPA) MSc Electric Power Industry (MEPI) – Ainhoa Villar Lejarreta Page 46
assumptions in this scenario also serve as an important tool for the ENTSO-E's analysis related
to the requirements for future grid development.
Compared to Scenario B, the difference of both scenarios is reflected between the number of
projects that are likely to happen given the regional market incentives with the number of
projects needed to meet a set of political objectives on a European level. In this respect, and
provided that all countries meet their national renewable targets, Figure 3.3 shows that almost
all countries increase their renewable capacity share to at least 30%. (See associated Table B.4
in Appendix B).
Simultaneously, there is a considerable decrease in the system of coal-fired power plants (lignite
and hard coal) (12%) and fuel oil plants (27%) with respect to the reference scenario. Nuclear
power plants share drops by a 4,5% while gas-fired plants and CCGTs slightly increase their
share by 3,8%. For further political and economical viewpoints considered in this scenario the
reader can refer to the Scenario Outlook & Adequacy Forecast 2014-2030 (ENTSO-E, 2014a).
Figure 3.3 . Breakdown of generation mix per country in Scenario EU year 2020.
Source: Own source, calculated with the input data in the model.
3.1.3. The Visions for 2030
The year 2030 serves as a bridge between the European energy targets of 2020 and 2050. The
four Visions presented in the ENTSO-E Scenario Outlook & Adequacy Forecast are
conceptually different from the scenarios shown until now. There are no probabilities associated

Exploration of the future European Electricity Market Design Chapter 3 – Simulation Setup
Master Thesis MSc Economics and Management of Network Industries (EMIN) MSc Engineering and Policy Analysis (EPA) MSc Electric Power Industry (MEPI) – Ainhoa Villar Lejarreta Page 47
to them but they are also not forecasts. Taking into account the high uncertainties of such long-
term predictions, quantitative data is gathered for the four Visions based on public economic
analyses, existing European documents and previous ENTSO-E market studies, such as the Pan-
European Market Modeling data used for the Ten Year Network Development Plan (TYNDP),
2014.
The aim of these Visions is to estimate the extreme values between which the actual evolution
of parameters in the system is expected to lie (ENTSO-E, 2014a). It differs from the objective of
scenario B and scenario EU 2020, which estimate the actual evolution of parameters under
different assumptions.
The Visions are named as following:
Vision 1 - Slow Progress
Vision 2 - Money Rules
Vision 3 - Green Transition
Vision 4 - Green Revolution
Source: TYNDP, (ENTSO-E, 2014b).
Underlying every Vision there are significantly different assumptions. Visions 1 and 3 are built
from a bottom-up approach with each country's energy policy and assume thereby a weak
integration of the European energy market, with Vision 1 assuming an overall delay in the
energy goals of 2050 and Vision 3 considered to be on track with these policy goals.
On the other hand and in contrast to the above, Visions 2 and 4 are built from a top-down
approach, and assume a strong integrated European market. The generation mix development
strategy is derived from Visions 1 and 3 after a harmonization of the data from all countries.
Figure 3.4 and Figure 3.5 give a brief overview of the political and economical frameworks and
the generation and demand assumptions under which the Visions are built, respectively. For
further details on these assumptions, the interested reader is referred to the Scenario Outlook &
Adequacy Forecast 2014-2030 (ENTSO-E, 2014a).

Exploration of the future European Electricity Market Design Chapter 3 – Simulation Setup
Master Thesis MSc Economics and Management of Network Industries (EMIN) MSc Engineering and Policy Analysis (EPA) MSc Electric Power Industry (MEPI) – Ainhoa Villar Lejarreta Page 48
Figure 3.4. Political and economic frameworks of the four Visions. Source: TYNDP 2014.
Figure 3.5. Generation and load frameworks of the four Visions. Source: TYNDP 2014

Exploration of the future European Electricity Market Design Chapter 3 – Simulation Setup
Master Thesis MSc Economics and Management of Network Industries (EMIN) MSc Engineering and Policy Analysis (EPA) MSc Electric Power Industry (MEPI) – Ainhoa Villar Lejarreta Page 49
Figure 3.6 and Figure 3.7 show the breakdown of the generation mix per country for Vision 1
and Vision 4. Appendix B contains the analogous figures for Visions 2 and 3, and the associated
Tables Table B.5 to Table B.8 in Appendix B.
Figure 3.6 . Breakdown of generation mix per country in Vision 1 year 2030.
Source: Own source, calculated with the input data in the model.
Figure 3.7 . Breakdown of generation mix per country in Vision 4 year 2030.
Source: Own source, calculated with the input data in the model.

Exploration of the future European Electricity Market Design Chapter 3 – Simulation Setup
Master Thesis MSc Economics and Management of Network Industries (EMIN) MSc Engineering and Policy Analysis (EPA) MSc Electric Power Industry (MEPI) – Ainhoa Villar Lejarreta Page 50
3.2. Model Data
The optimization model used to model part of the European power system is very data intensive
due to the large number of parameters required related to generating units and transmission
lines. The next subsection describes the input parameters in the model, the assumptions adopted
and the sources used.
3.2.1. Demand
In terms of load forecast, the best national estimate by the TSOs is used. The load estimation is
based on demography, economic growth and energy efficiency policy assumptions.
Hourly load values in MW for all the countries in the study were collected for the second week
(from day 7 to day 14) of January and July 2014. These demand time series were obtained from
the ENTSO-E consumption data portal. These two different weeks in the year were selected in
order to account for seasonal differences in the demand profile and in the type of technologies
used.
The year 2014 was chosen for the reference scenario presented in section 3.1 since it was the
latest available online data and it fits with the scenario B for 2014 from the ENTSO-E. The
same time series from 2014 is used for the scenario EU 2020 and it is scaled by applying to it an
annual percentage demand increase (see Table C.1 in Appendix C). As for the Visions for 2030,
the time series obtained from the TYNDP (ENTSO-E, 2014b) are used instead.
Given that in the considered network in some cases there are multiple nodes per country, the
approach followed to allocate the total hourly demand value of each country is to divide this
value of the demand proportionally to the population in the region covered by every node. In
this way, demand values are obtained for every hourly period and every node of the network.
Population data is retrieved from national statistics websites of the different countries. Table C.4
in Appendix C shows the criteria used to divide the country into their corresponding number of
zones and assign them to each and every node.
On the other hand, in the case that the hourly demand in any node cannot be fully met due to
transmission constraints or lack of generation capacity, a high penalization cost is introduced in
the objective function of the optimization problem, as already stated in section 2.5.1, in order to
minimize this term as much as possible. The cost parameter used for the non-served energy cost
amounts to 200 €/MWh. This magnitude is higher than the most expensive generator in the
system, with a marginal cost of 111 €/MWh, and it lies in the range of the marginal costs of
peak plants in balancing markets. In case there is a large unbalance in the system, these power
plants will likely be called upon in the balancing market to meet these system unbalances.

Exploration of the future European Electricity Market Design Chapter 3 – Simulation Setup
Master Thesis MSc Economics and Management of Network Industries (EMIN) MSc Engineering and Policy Analysis (EPA) MSc Electric Power Industry (MEPI) – Ainhoa Villar Lejarreta Page 51
3.2.2. Generator properties
Generating units have three different types of properties: cost properties, technical
characteristics and properties related to their initial operating conditions. In the subsections
below follows a description of the assumptions made regarding the required input parameters of
these units.
3.2.2.1. Generator costs
Financial characteristics of generators depend on the type of technology in question. Since the
model is focused on the short-term planning and schedule of the units for the day-ahead market,
fixed costs and capital investments are not included. From among a unit's variable costs, it is
relevant to differentiate between the following cost parameters:
Fuel cost
Fixed fuel cost
Operation & maintenance cost
Short-run marginal cost
Startup & shutdown cost
It is not the same to operate a nuclear power plant or a gas-fired steam turbine based power
plant. The plant's flexibility in terms of response reaction to startup and shutdown commands is
directly connected to its operational costs. A nuclear power plant is less flexible and has lower
operational costs.
Fuel cost
According to the type of technology employed, the fuel used will be more or less expensive.
This is reflected in this parameter which defines the cost in Euros of fuel used per MWh of
energy produced of every thermal generator. Average values are obtained from (Neuhoff, et al.,
2013) and are shown in Table D.1 in Appendix D.
Moreover, some random variability is introduced in the fuel cost of every generator
understanding that the cost of every technology will not be the same for all generators spread in
the network. Therefore, a random maximum value of +/- 10 % of the average value is added to
the input parameter.
Fixed fuel cost
This parameter refers to the cost of the fixed amount of fuel that is required or consumed during
the time that the thermal generator is turned on. Again, it depends on the fuel type of the
generator and it is measured in Euros per hour. Figure 3.8 shows the linear approximation of the

Exploration of the future European Electricity Market Design Chapter 3 – Simulation Setup
Master Thesis MSc Economics and Management of Network Industries (EMIN) MSc Engineering and Policy Analysis (EPA) MSc Electric Power Industry (MEPI) – Ainhoa Villar Lejarreta Page 52
input-output characteristic of a generic generator . The term represents the fixed fuel
consumption in thermie per hour and the variable consumption in thermie per MWh. See
Appendix D for more information.
Figure 3.8. Linear approximation of input-output characteristic of generator g.
Source: Adapted figure from Comillas University.
Operation & maintenance cost
According to the type of fuel, this parameter is defined as the cost to operate and maintain a
generating unit in Euros per MWh of energy produced. In a similar way, and in order to
facilitate the algorithm to choose the most cost-effective generators, a variation of +/- 10 % is
introduced with respect to the average cost shown in Table D.3 in Appendix D.
Short-run marginal cost (SRMC)
This parameter corresponds to the overall variable cost of a generator and it equals:
The average operating efficiency values of the different types of technologies are shown in
Table D.4 in Appendix D and are taken from (Neuhoff, et al., 2013).

Exploration of the future European Electricity Market Design Chapter 3 – Simulation Setup
Master Thesis MSc Economics and Management of Network Industries (EMIN) MSc Engineering and Policy Analysis (EPA) MSc Electric Power Industry (MEPI) – Ainhoa Villar Lejarreta Page 53
Startup & shutdown costs
The cycling process of thermal power plants is becoming more and more relevant in power
systems with increasing penetration of renewable sources since it is closely linked to the
operational flexibility of the thermal plants. Starting up and shutting plants down has a
degenerative effect on the units' components due to sudden variations in temperature and
pressure accelerating failures and outages (Van den Bergh & Delarue, 2015). Therefore, the
power plant cycling process has associated startup and shutdown costs.
The startup cost in this model has been defined as the cost in million Euros per GW of installed
capacity of starting up the generator unit from a "cold" status. Additionally, startup costs consist
of direct and indirect startup costs. Table D.5 in Appendix D shows the adopted startup costs in
the model, taken from (Van den Bergh & Delarue, 2015).
Direct startup cost (€/MW) - Reflects the cost of fuel consumed needed to reach the
optimal conditions of temperature and pressure in the power plant's boiler, as well as the
CO2 emissions and auxiliary services during the startup process. In reality this cost is a
function on the time the unit has been shut down. For simplicity reasons, it is assumed
this is constant.
Indirect startup cost (€/MW) - Incorporates the long-term cycling costs such as the
capital replacement and maintenance costs into a short-term operational horizon.
Regarding the shutdown costs, this cost is incurred due mainly to the waste of fuel when the
thermal generator has been disconnected from the grid. Besides, it can represent the wearing off
cost due to startup and shutdown operations that reduce the plant's lifetime. A 10 % of the
startup cost is considered for this parameter.
3.2.2.2. Technical and environmental characteristics
Thermal generators' technical characteristics such as the upward and downward ramping limits,
the minimum technical output, the minimum online and offline times or CO2 emissions rate
determine among other factors in the model the units' utilization rates. This subsection presents
the assumptions made for each of the following generator's parameters:
Maximum output
Minimum technical output
Upward and downward ramp limits
Minimum online and offline times
CO2 emission rate
Maximum output
The maximum output of a generator corresponds to the capacity installed of that generator. The
capacity of every generating unit is obtained by using the ENTSO-E's Scenario Outlook &

Exploration of the future European Electricity Market Design Chapter 3 – Simulation Setup
Master Thesis MSc Economics and Management of Network Industries (EMIN) MSc Engineering and Policy Analysis (EPA) MSc Electric Power Industry (MEPI) – Ainhoa Villar Lejarreta Page 54
Adequacy Forecast mentioned in section 3.1. The country's installed capacity for the
corresponding fuel type, country and scenario (scenario 2014, 2020 and the Visions for 2030) is
divided by the number of units of the corresponding fuel type and country.
The number of generators assigned to every node of the network is estimated such that the
above calculation gives installed capacity values that lie within a realistic range. The number of
units of every type of technology is assumed to be the same across scenarios.
In Appendix D, Table D.6 to Table D.11 show the capacities of the generators used for every
fuel type, country and scenario.
Minimum technical output
The minimum technical load required for every generator is assumed to be a percentage of the
nominal maximum output. Table D.12 in Appendix D indicates the adopted values according to
the type of technology taken from (Neuhoff, et al., 2013).
.Upward and downward ramping limits
Upward and downward ramp limits define by how many MW can the generator increase or
decrease its power output in one hour, respectively. Same load gradient is defined for both
upward and downward limits, see Table D.13 in Appendix D. Values were taken from Comillas
University model prototypes.
Minimum online and offline times
Flexibility of conventional generation technologies is a very important feature to measure in a
power system with an increasing share of renewable generation. However, due to both technical
and economical reasons, once a unit is connected or disconnected from the grid this one has to
remain connected or disconnected, respectively, for a minimum amount of time. Given the lack
of data for this specific parameter, the "cold" startup time from (Eurelectric, 2011) was assumed
as a good approximation, see Table D.14 in Appendix D. Both minimum online and offline
times are considered to be the same.
CO2 emission rate
Every generator unit emits certain amounts of CO2 depending on the technology used and has a
certain annual energy output. The CO2 intensity of each generator (tCO2/MWh) is the emission
rate. This parameter is calculated with the available annual CO2 emissions and the annual
energy output from Enipedia database (TUDelft, 2014). The data from Enipedia is the
projection for year 2020 and the same value is used in all scenarios.
The amount of CO2 emissions produced in the power system is included as a term of the
objective function. The aim is to minimize this term by including a high penalization cost for
emitting. This cost, also included as a model parameter, is referred to as the CO2 emission cost
rate and its value is set to 100 Euros/tonnes of CO2 taken from the (European Commission,

Exploration of the future European Electricity Market Design Chapter 3 – Simulation Setup
Master Thesis MSc Economics and Management of Network Industries (EMIN) MSc Engineering and Policy Analysis (EPA) MSc Electric Power Industry (MEPI) – Ainhoa Villar Lejarreta Page 55
2013) ensuring compliance with European regulatory rules. Knowing that the chosen value is
presumably high in the range of possible actual values in the ETS trading scheme, a sensitivity
analysis will be performed with a reduced value of the base case CO2 emission cost rate and
changes in the generation costs and generation dispatch profiles will be analysed.
3.2.2.3. Initial conditions
The initial conditions of the generators such as the unit's status, its output and the initial time
status need to be fixed beforehand in order to get a realistic behaviour of the units in
consecutive periods.
Initial output
The model is run for one week plus one day in advance. This day in advance is used to specify
the initial output of every generator. The 24th hour of that day sets the initial conditions for the
actual week that wants to be modeled. These initial conditions are calculated for every scenario
defined and for comparison purposes, the three studied power market designs (Nodal, Zonal and
Copper Plate) use the same initial conditions.
Initial commitment status
Once the initial output of the units is specified, and by using Morales-España et al. (2013)
formulation, the initial commitment status is determined depending on whether the initial output
is greater or smaller than the minimum technical output of the unit.
Initial time status
This parameter indicates the time in hours that the generator has been online or offline. It is
assumed that in case the initial output of the unit is zero, the initial time status equals to minus
the minimum offline time; in other words this is the minimum time that the generator has to be
off. In case the initial output is different from zero, the initial time status equals to the minimum
online time; this is the minimum time the generator has to be switched on (Morales-España, et
al., 2013).
3.2.3. Renewable generation
Renewable energy sources are not distributed evenly over the European continent and also not
over the considered network. Solar and wind energy represent 15,7% share of renewable
generation in 2013 (Eurostat, 2015) and this share is expected to drastically increase in the
following years. Therefore, these two renewable technologies are used in the research. Solar
energy is more available in countries like France, Austria, north of Italy and south of Germany

Exploration of the future European Electricity Market Design Chapter 3 – Simulation Setup
Master Thesis MSc Economics and Management of Network Industries (EMIN) MSc Engineering and Policy Analysis (EPA) MSc Electric Power Industry (MEPI) – Ainhoa Villar Lejarreta Page 56
(Figure 3.9), while there is higher potential for wind energy in northern coastal and offshore
regions of the continent (Figure 3.10).
Normalised hourly profiles from the year 2014 are used to input the renewable generation in all
scenarios. These profiles are based on the wind speed and solar irradiation estimations in every
node of the network taken from a worldwide wind and solar database for the year 2014 (Saha, et
al., 2011). These estimations are calculated based on standard turbines power curves (Wijnja-
Vlot, 2015).
The hourly renewable generation input parameter is defined as the maximum hourly wind and
solar energy produced, and since curtailment is allowed in the model, it is possible for the
algorithm to determine less renewable generation in some hourly periods.
Figure 3.9. Global irradiation (kWh/m
2) (above) and solar electricity (kWh/kWp) (below) in
European countries. Source: European Photovoltaic Technology Platform, 2006.

Exploration of the future European Electricity Market Design Chapter 3 – Simulation Setup
Master Thesis MSc Economics and Management of Network Industries (EMIN) MSc Engineering and Policy Analysis (EPA) MSc Electric Power Industry (MEPI) – Ainhoa Villar Lejarreta Page 57
Figure 3.10. Distribution of wind energy density (GWh/km
2) in Europe for 2030.
Source: European Environment Agency, 2008.
With the wind and solar installed capacities from the Scenario Outlook & Adequacy Forecast
2014-2025 (ENTSO-E, 2014a), and by multiplying these capacities allocated in every node by
the normalised generation profiles, the actual generation profile is obtained in every node and
for every scenario. Both onshore and offshore installed capacities are included given that it is
estimated that a large share of the future wind capacity will be due to offshore wind farms.
Each country's wind and solar installed capacities are allocated equally among the country's
nodes. In other words, this means that in Germany's five nodes, a 20% of the country's installed
capacity for both wind and solar is assigned in every node. Table B.9 and Table B.10 in
Appendix B shows the installed capacity for wind and solar technologies for every country and
every scenario.
3.2.4. Network parameters
Transmission line capacities and line reactances are probably among the most important input
parameters in the model. These can largely affect the output of the unit commitment schedule
and power flow output. It should also be noted that there was no access to official data so
educated estimations were made in order to stay as close as possible to reality.

Exploration of the future European Electricity Market Design Chapter 3 – Simulation Setup
Master Thesis MSc Economics and Management of Network Industries (EMIN) MSc Engineering and Policy Analysis (EPA) MSc Electric Power Industry (MEPI) – Ainhoa Villar Lejarreta Page 58
3.2.4.1. Transmission line capacities
Transmission line capacities are defined as the maximum power a particular line can withstand
in normal operational conditions. According to the network topology defined in Van Blijswijk,
et al., (2015), some of the transmission corridors have more than one line circuit, considering
them lines in parallel with the same power capacity.
A sensitivity analysis will be performed by reducing and increasing by 50% the capacity of the
intra-zonal transmission lines with respect to the base case values. The intra-zonal lines are the
ones within zones, i.e. countries.
3.2.4.2. Inductive reactances
As mentioned before, the inductive reactances of every line circuit becomes an important input
parameter since the Power Transfer Distribution Factors (PTDF), and hence the power flows are
determined by the relation between these reactances.
This network parameter is usually not made publicly available. Therefore, an average unitary
reactance of the Dutch power grid equal to is used as the reference
unitary reactance for the considered network (Van Blijswijk, 2011). Since the lengths of the
power lines are available, the reactances can be easily obtained. For the exact calculations of the
line reactances, the reader is referred to Appendix D.

Master Thesis MSc Economics and Management of Network Industries (EMIN) MSc Engineering and Policy Analysis (EPA) MSc Electric Power Industry (MEPI) – Ainhoa Villar Lejarreta Page 59
CHAPTER 4
SIMULATION RESULTS

Master Thesis MSc Economics and Management of Network Industries (EMIN) MSc Engineering and Policy Analysis (EPA) MSc Electric Power Industry (MEPI) – Ainhoa Villar Lejarreta Page 60
Page left blank intentionally

Exploration of the future European Electricity Market Design Chapter 4 – Simulation Results
Master Thesis MSc Economics and Management of Network Industries (EMIN) MSc Engineering and Policy Analysis (EPA) MSc Electric Power Industry (MEPI) – Ainhoa Villar Lejarreta Page 61
4. Simulation Results
The following chapter presents the results obtained from the optimization model for the defined
scenarios and the studied power market designs and it deals with the main research question and
the second research sub-question. Discussions of the results are done baring in mind the
limitations of the research.
In subsequent sections the power system's variable generation costs, the degree of renewable
energy curtailed, the system's economic generation dispatch profiles and the degree of non-
served energy in the system are discussed. The extent to which the mentioned system
parameters are influenced by the amounts of renewable energies and by the design of the power
market in place is further developed here.
4.1. Power System Generation Costs
The main aim of this research is to gain a better insight on the functioning of the North-Western
and Central Europe's power system under different market designs and for different degrees of
renewable integration, as well as to obtain a rough order of magnitude of the effect of these two
dimensions on the total variable generation costs of the power system.
As a reminder to the reader, the model's objective function expresses the minimization of the
total variable generation costs of the system. Fixed costs related to new investments in
generation are out of the scope of this research. The variable generation costs include startup,
shutdown and fixed fuel consumption costs, which are fixed costs incurred due to the
scheduling of the generating units, and variable operation costs due to the generators'
production, CO2 emissions and the non-served energy.
The results show that in a high renewable scenario, more specifically for Vision 4, the total
variable generation costs of the power system when it operates under a zonal power market are
around 0,32% higher than if the power system operates under a nodal market, see Table 4.1.
While in the first phase of the zonal market (Zonal Phase I), generation costs are around 0,8%
cheaper than under a nodal market, this difference is reversed and increased to 0,32% after the
redispatch process (Zonal Redispatch Phase) is carried out by the TSOs.
A redispatch phase in a zonal market is required in order to adjust the scheduled generation in
accordance to the limits of the network. The research shows that redispatch costs in the high
renewable scenario amount to 19 Million Euros (1% of total variable generation costs) for the
whole system and for a weekly operation, while in the reference scenario these are significantly
smaller, over half the amount, 9,5 Million Euros (0,57% of total variable generation costs) (see
Table 4.1). Knowing that future extensions of network infrastructure are not accounted for in the
model, and therefore knowing that redispatch costs in Vision 4 could actually be lower due to
more cross-border interconnections helping in alleviating congestions in intra-zonal lines, the
redispatch process would still be necessary to completely fix the intra-zonal congestions.

Exploration of the future European Electricity Market Design Chapter 4 – Simulation Results
Master Thesis MSc Economics and Management of Network Industries (EMIN) MSc Engineering and Policy Analysis (EPA) MSc Electric Power Industry (MEPI) – Ainhoa Villar Lejarreta Page 62
Furthermore, the magnitude of the redispatch costs (19 Million Euros) is close to that of the
fixed generation costs, which depend in turn on the scheduling of the units. This points out the
inefficiency of the power system functioning under a zonal market. Given that the network
constraints are not jointly taken into account in the market clearing, the redispatch phase will be
inevitably necessary in the highly-meshed European network and will therefore add an extra
cost and an operational burden to TSOs.
Table 4.1. Breakdown of generation, non-served energy and redispatch costs for Scenario B
(2014) and Vision 4 (2030) for the three proposed power market designs.
Costs (Million Euros) Copper
Plate Nodal
Zonal
Phase I
Zonal
Phase I vs.
Nodal (%)
Zonal
Redispatch
Phase
Zonal
Redispatch
Phase vs.
Nodal (%)
Vision 4 (High RES scenario)
Total Variable Generation 1462,3 1882,8 1866,9 -0,8 1888,9 0,32
Fixed Generation 27,2 28,6 28,0 -2,3 28,0 -2,30
Operation 1432,3 1798,6 1783,7 -0,8 1802,7 0,23
Non-served energy 2,8 55,6 55,2 -0,8 58,2 4,72
Redispatch - - - 19,0
Scenario B 2014 (Low RES scenario)
Total Variable Generation 1559,9 1640,6 1640,5 0,0 1659,9 1,17
Fixed Generation 10,2 11,6 11,6 0,1 11,6 0,15
Operation 1549,7 1627,2 1627,0 0,0 1636,4 0,57
Non-served energy 0,1 1,9 2,0 4,7 11,9 531,66
Redispatch - - - 9,5
On the other hand, the absolute difference in total variable generation costs between nodal and
zonal markets for Vision 4 is 6,1 Million Euros (see Table 4.1). This weekly difference in costs
would translate into 317,2 Million Euros of annual savings under a nodal market. Neuhoff, et
al., (2013) estimates annual savings ranging from 0,8 Billion Euros to 2 Billion Euros under a
nodal market, depending on the penetration of renewables considered. Taking into account the
simplifications made on this thesis network compared to the one used in Neuhoff, et al., (2013),
the result obtained in this research is believed to be in line with the range estimated by Neuhoff.
With regard to the reference scenario, there is a larger difference, 1,17%, between the nodal and
zonal power market schemes with respect to the high renewable scenario. However, similarly to
before, the increase in variable generation costs can be observed in the redispatch phase of the
zonal market (see Table 4.1). Given the much lesser amount of renewable capacity available in
the system in this scenario, more expensive generating units are in charge of amplifying the
difference in relative terms between nodal and zonal in a low renewable scenario.

Exploration of the future European Electricity Market Design Chapter 4 – Simulation Results
Master Thesis MSc Economics and Management of Network Industries (EMIN) MSc Engineering and Policy Analysis (EPA) MSc Electric Power Industry (MEPI) – Ainhoa Villar Lejarreta Page 63
Additionally, both market designs have relatively similar generation costs as those that would
be expected in a copper plate market, in which one single electricity price would be established
for the whole of the European power system (see Figure 4.1). A copper plate market design is
used, as already explained, as a theoretical reference and has little real meaning, since it is based
on the unrealistic assumption that the power system has unlimited network capacity to supply
cost-efficient electricity to everywhere in the network. However, it can still be used as a
reference because it highlights the increasing value of transmission with higher renewable
energies in the system.
Furthermore, when comparing each market design between both renewable scenarios, Table 4.2
shows that total variable generation costs increase in both nodal and zonal cases in Vision 4 by
14,8% and 13,8%, respectively, while in the case of a copper plate market, costs would decrease
by 6,3%. The significant increase of generation costs in the nodal and zonal cases with large
amounts of renewable sources, together with the decrease of these in the copper plate case,
encourages to conclude that this increase might be due to a shortage in network capacity that
produces congestions and causes either more expensive technologies to be committed or
demand to not be met, and hence non-served energy costs to rise. In fact, Table 4.1 shows the
significant variations in non-served energy costs between the high and low renewable scenarios
for the zonal and nodal power market designs. However, further analysis is performed in
subsequent sections before reaching that conclusion.
Additionally, it can be noticed that the mentioned effect of an inappropriate network for a future
scenario with high renewables is amplified in the nodal market, which has a slightly higher
difference than in the zonal market (see Table 4.2). The reason for this lies in the inherent
characteristic of the nodal market to optimally utilize the generating resources in the system
across the entire system. Therefore, a poor network would distort the ideal functioning of the
nodal market scheme.
Table 4.2. Comparison of total variable generation costs between Reference scenario (2014) and
Vision 4 (2030) for the three proposed power market designs in all their phases.
Power Market Design
Reference
scenario (2014) Vision 4 (2030)
Vision 4 vs.
Reference
scenario (%) Low RES High RES
Copper Plate 1559,9 1462,3 -6,3
Nodal 1640,6 1882,8 14,8
Zonal First Phase 1640,5 1866,9 13,8
Zonal Redispatch Phase 1660,0 1888,9 13,8

Exploration of the future European Electricity Market Design Chapter 4 – Simulation Results
Master Thesis MSc Economics and Management of Network Industries (EMIN) MSc Engineering and Policy Analysis (EPA) MSc Electric Power Industry (MEPI) – Ainhoa Villar Lejarreta Page 64
Figure 4.1. Generation costs in Reference scenario B (2014) and Vision 4 (2030).

Exploration of the future European Electricity Market Design Chapter 4 – Simulation Results
Master Thesis MSc Economics and Management of Network Industries (EMIN) MSc Engineering and Policy Analysis (EPA) MSc Electric Power Industry (MEPI) – Ainhoa Villar Lejarreta Page 65
In summary, the results referred to above reveal a potential saving of 0,32% in variable
generation costs under nodal power market operation in contrast to a power system operating
under a zonal market. Especially if the large expected projections of renewable sources of
generation finally materializes, the result above could indicate that a nodal market in Europe
would allow to maximize social welfare provided that the required network capacities are
delivered effectively.
4.2. Further Analysis of RES Scenarios and Power Market Designs
The following subsections discuss some possible underlying causes of the increase in variable
generation costs in a high renewable scenario. Several output variables are analyzed such as the
curtailment of renewable generation, the total production of every type of technology and the
non-served energy in the system.
Also, in this section the electricity prices calculated a posteriori in the model are presented and
an analysis is done on how they might influence actors in the power sector and across regions in
Europe.
4.2.1 Curtailment of renewable energy
As it was mentioned in section 2.4.2, renewable energy production is given priority in the day-
ahead's merit order among the rest of generation technologies. However, it could happen that,
due to the concentration of these energy sources in the end-points of the network and a weak
transmission capacity in some specific parts of it, wind and solar power spillages not only
become necessary but could turn out to be significantly high with larger integration of
renewables. In a current zonal market total system generation costs would increase due to the
redispatch process and revenues for renewable energy producers would shrink.
The outputs of the model show that the degree of curtailment rises notably in Vision 4
compared to the reference scenario, for which there is no curtailment. Figure 4.2 presents the
distribution of the system's hourly curtailment, expressed in percentage and calculated with
respect to the maximum renewable generation. For Vision 4, it can be observed that half of the
hourly curtailment lies between approximately 1% and 9% in the nodal case and between 1%
and 9,5% in the zonal case (the interquartile range in the box-plots). Therefore, in both power
market designs the curtailment variability is very similar, with slightly higher maximum
curtailment values, above 22%, in the zonal case.
The similarity between both system curtailment profiles can be largely attributed to using the
same renewable daily patterns implicitly accounted for in the wind and solar feed-ins. The
difference between them, however, results from the required redispatch process in the zonal
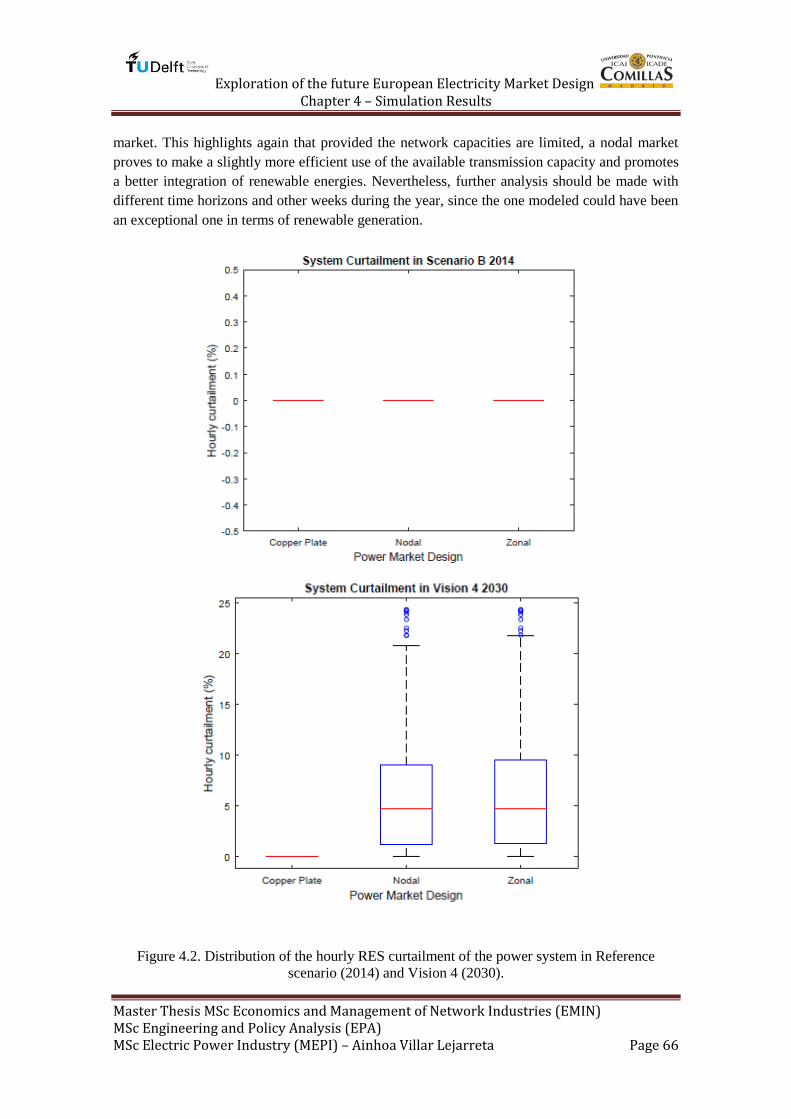
Exploration of the future European Electricity Market Design Chapter 4 – Simulation Results
Master Thesis MSc Economics and Management of Network Industries (EMIN) MSc Engineering and Policy Analysis (EPA) MSc Electric Power Industry (MEPI) – Ainhoa Villar Lejarreta Page 66
market. This highlights again that provided the network capacities are limited, a nodal market
proves to make a slightly more efficient use of the available transmission capacity and promotes
a better integration of renewable energies. Nevertheless, further analysis should be made with
different time horizons and other weeks during the year, since the one modeled could have been
an exceptional one in terms of renewable generation.
Figure 4.2. Distribution of the hourly RES curtailment of the power system in Reference
scenario (2014) and Vision 4 (2030).

Exploration of the future European Electricity Market Design Chapter 4 – Simulation Results
Master Thesis MSc Economics and Management of Network Industries (EMIN) MSc Engineering and Policy Analysis (EPA) MSc Electric Power Industry (MEPI) – Ainhoa Villar Lejarreta Page 67
In absolute terms, in a power system that would generate a weekly amount close to 45,3 TWh of
energy in a extreme high renewable scenario in 2030, around 1,57 TWh of renewable energy in
the nodal case and 1,60 TWh in the zonal case would be "spilled". These amounts represent a
weekly curtailment of 7,83% and 8,01%, respectively, with respect to the weekly renewable
energy production (see Table 4.3). These curtailment values are noteworthy. A major reason
that could justify such notable amounts of curtailment in the European system is the insufficient
development of the transmission network assumed which leads to the incapability of supplying
cheap renewable energy across wide regions and having to commit or reschedule local and more
expensive technologies. In this research, no grid upgrades have been included between scenarios
for comparison reasons. However, it is clear that network planning should keep the deployment
of future renewables in mind and economic assessments should be performed to quantify the
savings made with reduced curtailment against the expensive investments of line extensions.
Table 4.3. Renewable production, total production and curtailment of renewable energy in
Reference scenario (2014) and Vision 4 (2030) for the three power market designs.
System output Copper Plate Nodal
Zonal
Redispatch
Phase
Vision 4, 2030 (High RES scenario)
RES Production (GWh) 21599,89 20031,19 19998,35
Total generation (GWh) 45591,08 45327,10 45313,98
Curtailment (GWh) 0,00 1568,71 1601,54
Curtailment (%) 0,00 7,83 8,01
Reference scenario, 2014 (Low RES scenario)
RES Production (GWh) 5646,03 5646,03 5646,03
Total generation (GWh) 36391,36 36382,58 36332,57
Curtailment (GWh) 0,00 0,00 0,00
Curtailment (%) 0,00 0,00 0,00
Besides the above, curtailment of renewables can also take place when an adequate reserves
margin is required to maintain system balance and system reliability. Figure 4.3 shows that the
time intervals in which system curtailment would be highest match with the early hours of the
day during which the highest increase of demand occurs. Before this period coal, gas and fuel
oil power plants are usually brought up to their technical minimum output and, hence, excess
night wind power output needs to be turned off. In the next section an analysis will be done with
regard to the dispatch generation profiles, and it then can be further analysed whether thermal
generation substitutes renewables in such periods.

Exploration of the future European Electricity Market Design Chapter 4 – Simulation Results
Master Thesis MSc Economics and Management of Network Industries (EMIN) MSc Engineering and Policy Analysis (EPA) MSc Electric Power Industry (MEPI) – Ainhoa Villar Lejarreta Page 68
Figure 4.3. Hourly wind and solar energy curtailment in the power system in Vision 4 (2030).
Finally, curtailment can also occur due to a global oversupply in the system. In this situation,
there is an excessive amount of generation capacity installed than what is actually needed. Such
situation can be detected by checking whether there is demand systematically not met in every
node in the network for consecutive hours. Section 4.2.3 looks further into this.
4.2.2 System Generation Dispatch profiles
This section looks into the generation dispatch profiles obtained for the system as a whole under
the three different power market designs and for the low and high renewable scenario.
The reader should be reminded that Vision 4 assumes a strong integrated European market with
harmonized policies within Member States, and this is reflected in the generation mix and in the
capacities installed in the system of each type of technology. All energy resources should be
available to meet demand everywhere else in Europe.
Compared to the reference scenario, in Vision 4 and in all three power market designs there is a
significant reduction in nuclear power usage as base load mainly to accommodate the large
amounts of renewables (see Figure 4.4). Moreover, the nuclear power generated in the high

Exploration of the future European Electricity Market Design Chapter 4 – Simulation Results
Master Thesis MSc Economics and Management of Network Industries (EMIN) MSc Engineering and Policy Analysis (EPA) MSc Electric Power Industry (MEPI) – Ainhoa Villar Lejarreta Page 69
renewable scenario follows a more variable profile suggesting greater flexibility in the operation
of nuclear power plants in the near future.
Regarding more flexible plants like coal-fired or gas-fired plants, these have undergone
substantial changes in their dispatch pattern. Both technologies become even more flexible,
experiencing drastic peaks and valleys in Vision 4. Overall, energy production from these two
technologies has experienced inverted behaviours: gas-fired plants increased their production
despite the high fuel costs in contrast to the reduction of coal-fired power plants production (see
Table 4.4). The need for quick responsive backup technologies with high penetration of
renewables and a high CO2 emission cost rate used have led to this increase in usage. With
respect to oil-fired plants, their energy output has reduced mainly to the reduction of their
capacity installed across the continent.
Renewable energy production, however, has reached very high levels in Vision 4, to the extent
that in some particular hours all the demand is covered with almost only nuclear and renewable
energy especially in the Copper Plate market (see Figure 4.4).
When comparing between power market designs, Table 4.4 shows that nodal and zonal power
markets, if yet different, are quite similar in contrast to the power outputs obtained in the copper
plate option. On the one hand, larger amounts of cheaper energy, i.e. renewables and nuclear,
are produced in the copper plate instead of using the more expensive thermal technologies. This
partly explains the cheaper variable generation costs obtained in a theoretical copper plate
system. On the other hand, in the nodal and zonal markets more production comes from gas
(18,22% and 18,46%, respectively) and coal plants (30,01% and 30,66%, respectively) due to
the limitations in the network and the redispatch process that prevent cost-efficient technologies
from being dispatched.

Exploration of the future European Electricity Market Design Chapter 4 – Simulation Results
Master Thesis MSc Economics and Management of Network Industries (EMIN) MSc Engineering and Policy Analysis (EPA) MSc Electric Power Industry (MEPI) – Ainhoa Villar Lejarreta Page 70
REFERENCE SCENARIO, 2014 VISION 4, 2030
CO
PP
ER
PL
AT
E
NO
DA
L
ZO
NA
L R
ED
ISP
AT
CH
PH
AS
E
Figure 4.4. Generation dispatch profiles in Reference scenario (2014) and Vision 4 (2030) for
the three power market designs

Exploration of the future European Electricity Market Design Chapter 4 – Simulation Results
Master Thesis MSc Economics and Management of Network Industries (EMIN) MSc Engineering and Policy Analysis (EPA) MSc Electric Power Industry (MEPI) – Ainhoa Villar Lejarreta Page 71
Table 4.4. Breakdown of energy production by technology type in Reference scenario (2014)
and Vision 4 (2030) for the three power market designs.
Production by
technology
type (GWh)
Copper
Plate Nodal
Zonal
Redispatch
Phase
of Nodal
with respect to
Copper Plate
(%)
of Zonal
with respect to
Copper Plate
(%)
Vision 4, 2030 (High RES scenario)
Gas 7528,04 8899,65 8917,84 18,22 18,46
Coal 4040,22 5252,62 5279,10 30,01 30,66
Nuclear 11968,85 10594,33 10557,51 -11,48 -11,79
Oil 454,07 549,32 561,18 20,98 23,59
RES 21599,89 20031,19 19998,35 -7,26 -7,41
Total 45591,08 45327,10 45313,98 -0,58 -0,61
Reference scenario, 2014 (Low RES scenario)
Gas 5344,37 5769,47 5536,28 7,95 3,59
Coal 6246,18 6580,41 6970,96 5,35 11,60
Nuclear 17503,77 16996,99 16754,54 -2,90 -4,28
Oil 1651,02 1389,68 1424,76 -15,83 -13,70
RES 5646,03 5646,03 5646,03 0,00 0,00
Total 36391,36 36382,58 36332,57 -0,02 -0,16
If a further step is reached in the analysis and due attention is given to what is happening in the
system's operating phases under a zonal power market, the reasoning by Neuhoff et al. (2011) is
proved: zonal market produces an inefficient dispatch within countries.
The reason is again network limitations. After the first phase, a commitment schedule ignoring
intra-zonal network limits, i.e. congestion, that ensures minimum system generation costs is
obtained. The second phase takes care of the infeasibilities in the schedule caused by line
congestions. This means that cheap generation that was aimed to supply a load center located
somewhere in the network can no longer fulfill this due to the impossibility of being delivered.
Instead, local and more expensive generation covers that shortage and the cheap generation i.e.
renewable and nuclear energies face curtailments. As Table 4.5 shows, around 1,82% more gas
and 1,82% more oil are dispatched in a high renewable scenario compared to the first phase.
Similarly, nuclear and renewable plants are redispatched and their production decrease by
0,88% and 0,39%, respectively.
It is noteworthy to mention, however, that compared to a low renewable scenario the redispatch
of expensive generation sources is reduced in relative terms, mainly due to the greater overall
availability of renewable capacity installed in the system.

Exploration of the future European Electricity Market Design Chapter 4 – Simulation Results
Master Thesis MSc Economics and Management of Network Industries (EMIN) MSc Engineering and Policy Analysis (EPA) MSc Electric Power Industry (MEPI) – Ainhoa Villar Lejarreta Page 72
Table 4.5. Breakdown of energy production by technology type in Reference scenario (2014)
and Vision 4 (2030) for zonal power market in its two phases.
Production by
technology type
(GWh)
First Phase (I) Redispatch
Phase (II)
of Redispatch
phase with respect to
First Phase (%)
Vision 4, 2030 (High RES scenario)
Gas 8758,23 8917,84 1,82
Coal 5292,10 5279,10 -0,25
Nuclear 10650,72 10557,51 -0,88
Oil 551,16 561,18 1,82
RES 20077,06 19998,35 -0,39
Total 45329,28 45313,98 -0,03
Reference scenario, 2014 (Low RES scenario)
Gas 5276,78 5536,28 4,92
Coal 6962,33 6970,96 0,12
Nuclear 17132,04 16754,54 -2,20
Oil 1368,64 1424,76 4,10
RES 5646,03 5646,03 0,00
Total 36385,82 36332,57 -0,15
On the one hand, these results reveal that managing national congestion during the operational
hour, after market clearance i.e. after a unit commitment schedule is generated, rather than
through the market, as it is done under a nodal scheme, it ultimately produces higher generation
costs especially when the network transmission capacities are designed so that small levels of
congestion are always produced. On the other hand, the increased amount in renewable
generation in the high RES scenario produces variations in the merit order dispatch with respect
to that of the reference scenario, which in turn highlights the changes undergone with each
market design as well as the slight differences between them.
4.2.3 Non-served energy
This section analyses to what extent the non-served energy costs impact on the system's
dispatch and on the system's variable generation costs in the different power market designs and
in the high and low renewable scenarios.
As previously stated in section 4.1, the magnitude of the non-served energy costs are
considerably high for the nodal and zonal markets in a scenario with high penetration of
renewable energies. Costs of unserved energy in the zonal market amount to 58,22 Million
Euros, a 4,72% larger than those in the nodal market, 55,60 Million Euros (see Table 4.6). In the
reference scenario, however, non-served energy costs only amount to 1,88 Million Euros in the

Exploration of the future European Electricity Market Design Chapter 4 – Simulation Results
Master Thesis MSc Economics and Management of Network Industries (EMIN) MSc Engineering and Policy Analysis (EPA) MSc Electric Power Industry (MEPI) – Ainhoa Villar Lejarreta Page 73
nodal market and to 11,9 Million Euros in the zonal market. The latter one is still considerably
high.
Table 4.6. Comparison of non-served energy costs between Reference scenario (2014) and
Vision 4 (2030) for the three proposed power market designs in all their phases.
Costs (in Million Euros) Copper
Plate Nodal
Zonal
Phase I
Zonal
Phase I vs.
Nodal (%)
Zonal
Redispatch
Phase
Zonal
Redispatch
Phase vs.
Nodal (%)
Vision 4 (High RES scenario)
Total Variable Generation 1462,35 1882,82 1866,85 -0,85 1888,90 0,32
Non-served energy 2,80 55,60 55,16 -0,78 58,22 4,72
Non-served energy : Total
Variable Generation (%) 0,192 2,953 2,955 3,082
Scenario B 2014 (Low RES scenario)
Total Variable Generation 1559,94 1640,65 1640,53 -0,01 1659,9 1,17
Non-served energy 0,12 1,88 1,96 4,74 11,9 531,66
Non-served energy : Total
Variable Generation (%) 0,008 0,114 0,120 0,717
These costs largely depend on the system's generation adequacy to meet the required demand,
reflected by the costs in a Copper Plate market in Table 4.6, and the system's network capacity
planning to appropriately deliver the energy to all demand points in the network. Non-served
energy costs of nodal and zonal markets represent 2,95% and 3,08% of the total system's
variable generation costs, respectively (see Table 4.6). It is again highlighted the importance of
a timely delivery of the network infrastructure investments in order to gradually integrate the
large deployment of renewables in the system.
4.2.4 Effects of system outputs on the generation costs
In the subsections above, it has been discussed the influence of a large penetration of renewable
energies in the power system and the design of the latter on the following system outputs:
curtailment of renewable energy, system's economic generation dispatch profile and non-served
energy in the system.
As a summary, Table 4.7 shows the contribution of the system outputs on the system's variable
generation costs. It should be noted that while the energy production by type of technology and
the non-served energy directly impact on the costs of generation in the system, the curtailment
of renewable energy does not directly contribute to it. The degree of curtailment of renewables

Exploration of the future European Electricity Market Design Chapter 4 – Simulation Results
Master Thesis MSc Economics and Management of Network Industries (EMIN) MSc Engineering and Policy Analysis (EPA) MSc Electric Power Industry (MEPI) – Ainhoa Villar Lejarreta Page 74
instead shows the lost savings in the system's generation dispatch, the opportunity cost of
having to spill renewable generation because of not having the sufficient physical network to
deliver that green cheap energy.
Table 4.7. Impact of system outputs on variable generation costs.
System output
(GWh)
Copper
Plate Nodal
Zonal
Redispatch
Phase
of Nodal
with respect to
Copper Plate
(%)
of Zonal
with respect
to Copper
Plate (%)
Vision 4, 2030 (High RES scenario)
Gas 7528,04 8899,65 8917,84 18,22 18,46
Coal 4040,22 5252,62 5279,10 30,01 30,66
Nuclear 11968,85 10594,33 10557,51 -11,48 -11,79
Oil 454,07 549,32 561,18 20,98 23,59
RES 21599,89 20031,19 19998,35 -7,26 -7,41
Non-served energy 14,01 277,99 291,11 1884,23 1977,82
Curtailment 0,00 1568,71 1601,54 Very large Very large
Reference scenario, 2014 (Low RES scenario)
Gas 5344,37 5769,47 5536,28 7,95 3,59
Coal 6246,18 6580,41 6970,96 5,35 11,60
Nuclear 17503,77 16996,99 16754,54 -2,90 -4,28
Oil 1651,02 1389,68 1424,76 -15,83 -13,70
RES 5646,03 5646,03 5646,03 0,00 0,00
Non-served energy 0,60 9,38 59,39 1461,51 9785,13
Curtailment 0,00 0,00 0,00 0,00 0,00
Overall, a combination of factors leads to having higher variable generation costs in a scenario
with high penetration of renewable technologies, as presented in section 4.1. As indicated in
Table 4.7, a drastic increase of renewable production would contribute to a significant decrease
in generation costs but a significant increase in gas production to support the unpredictability of
renewables and maintain the system's reliability within adequate limits has the opposite impact.
Simultaneously, around a 60% decrease in cheap nuclear production accentuates this effect even
more. Furthermore, the high renewable scenario results in very large amounts of non-served
energy due mainly to insufficient network capacity and large amounts of curtailment due again
to congestions, i.e. network inadequacy, that prevent cheap renewable energy to be transported
to load centers far away.
With respect to the power market designs, and taking Copper Plate as a reference, the nodal and
zonal markets experiment higher amounts of gas, coal and oil, i.e. more expensive technologies,
and a reduction in nuclear and renewable energy productions. As for non-served energy and

Exploration of the future European Electricity Market Design Chapter 4 – Simulation Results
Master Thesis MSc Economics and Management of Network Industries (EMIN) MSc Engineering and Policy Analysis (EPA) MSc Electric Power Industry (MEPI) – Ainhoa Villar Lejarreta Page 75
curtailment levels, these are extremely above those of the Copper Plate market (see Table 4.7).
Additionally, it should be mentioned that, in a high renewable scenario, nodal and zonal markets
have very close percentage differences between them for every system output, when compared
to Copper Plate. Finally, and referring back to the second research sub-question, it all comes
down to having an adequate planning to expand the network and be able to follow up a
complete integration of electricity markets and the deployment of the renewable targets.
Therefore, whether it makes operational and economical sense to implement a nodal market in
Europe will depend on the network expansion projects and the success of cooperation policies
between Member States.
4.2.5 Electricity Prices and Congestion Costs
This section presents an overview of the electricity prices calculated following the model's
economic dispatch outcome. More specifically, the weekly average electricity prices in the
nodal and zonal markets and the difference between them are presented for both high and low
renewable scenarios.
Wholesale electricity prices under a nodal market scheme bring many short-term benefits as
already identified in previous sections. They provide more transparency to market players, more
efficiency and reliability in system operation for TSOs at the same time they reduce local
market power practices and unwanted trading strategies, the so-called "inc-dec game" (Neuhoff,
et al., 2011) and support the transmission planning process. Moreover, demand responsiveness
would also benefit from its implementation in retail markets.
Figure 4.5 indeed reveals an overall decreasing trend in weekly average nodal prices in a higher
renewable scenario in both market designs. Furthermore, in the case of the nodal market both
intra-national and cross-border network congestions can be observed in the reference scenario
between some regions: between North and South of Germany, between Czech Republic and
Germany, between France and Germany, between Belgium and France or within Belgium. This
suggests the need for transmission capacity development both within national power grids and
between international borders. Also, these congestions, especially in continental Europe, seem
to be alleviated with the presence of more renewables. Most probably this is due to the higher
amounts of renewable generation that meet the demand in every node of the network.
Nonetheless, congestions keep existing between the end points of the network and continental
Europe.
In the case of the zonal market, the nodal prices reflect the single electricity price per zone, i.e.
per country, and as it can be observed in Figure 4.5 there is also a tendency towards greater
homogenization of prices with larger amounts of renewable energies, especially in central-
western Europe. The extremes of the network, however, have either much cheaper electricity
prices due probably to a higher concentration of renewable sources or much more expensive
prices. The latter could be due to either a lack of transmission capacity or a still quite
predominant thermal generation mix, like the case of Poland, in which prices are pushed
upwards through the merit order mechanism.

Exploration of the future European Electricity Market Design Chapter 4 – Simulation Results
Master Thesis MSc Economics and Management of Network Industries (EMIN) MSc Engineering and Policy Analysis (EPA) MSc Electric Power Industry (MEPI) – Ainhoa Villar Lejarreta Page 76
REFERENCE SCENARIO, 2014
VISION 4, 2030
NO
DA
L
ZO
NA
L F
IRS
T P
HA
SE
Figure 4.5. Average Locational Marginal Prices in nodal and zonal markets in Reference
scenario (2014) and Vision 4 (2030).
Through the operational information given in real-time by TSOs, including the information
about the state of the network provided by the LMPs, generators can identify when and where
congestions and supply shortages are taking place allowing them to consider it in their short-
term decision-making. From the consumer's point of view, however, only those that explicitly
bid into the wholesale market are directly impacted by the prices. The rest of consumers who

Exploration of the future European Electricity Market Design Chapter 4 – Simulation Results
Master Thesis MSc Economics and Management of Network Industries (EMIN) MSc Engineering and Policy Analysis (EPA) MSc Electric Power Industry (MEPI) – Ainhoa Villar Lejarreta Page 77
are supplied by electric utilities do not experiment the full impact of the LMPs and their
variations for now, since utilities average prices across the territories where they own generating
units. Only competitive retail markets that facilitate demand response initiatives would give the
opportunity to consumers to react to price spikes.
In order to check for differences in LMPs between power market designs and how these might
affect participants in the European power market, Figure 4.6 plots the difference between
weekly average nodal prices under both market designs, calculated as:
.
Overall, the differences between nodal prices, if already small, are generally even smaller in a
higher renewable scenario, as shown in Figure 4.6. Moreover, energy producers get paid at the
node where their generators are located. Therefore generators located in zones like the south of
Germany, Netherlands, Austria and north of Italy, for instance, where the differences in LMPs
are negative, would benefit from the implementation of a nodal market scheme since LMPs in
nodal would be higher than those in a zonal market. Figure 4.6, in fact, illustrates that
implementing a nodal market in Europe would impact to a greater or lesser extent on the
revenues of the energy producers across the continent, both within national borders and outside
a country's borders. This result suggests that a harmonization of the energy policies related to
capacity markets is necessary in the different Member States to minimize welfare redistributions
issues.
However, it should be taken into account, though, that the modeled week could be an
anomalous one in terms of renewable generation for example. Therefore, a more in-depth
analysis of the electricity prices is needed to conclude the degree of impact of the market design
and the large amounts of intermittent generation on the LMPs and therefore on the market
actors. The price analysis should be done for a longer time horizon and in different seasons of
the year.

Exploration of the future European Electricity Market Design Chapter 4 – Simulation Results
Master Thesis MSc Economics and Management of Network Industries (EMIN) MSc Engineering and Policy Analysis (EPA) MSc Electric Power Industry (MEPI) – Ainhoa Villar Lejarreta Page 78
REFERENCE SCENARIO, 2014
VISION 4, 2030
Figure 4.6. Difference in average Locational Marginal Prices between nodal and zonal markets
in Reference scenario (2014) and Vision 4 (2030).
4.2.6 Sensitivity analysis of model parameters
In the following subsections a sensitivity analysis is performed to test the impact of the CO2
emission cost rate and the intra-zonal network capacities on the outcomes of the model, mainly
on the system variable generation costs, the economic dispatch profiles and the nodal prices
under the nodal and zonal market designs. The sensitivity analysis is performed for the high
renewable scenario and it is contrasted against that of the base case.
4.2.6.1. CO2 emission cost rate
The base case value for the CO2 emission cost rate was set to 100€/tonnes of CO2, which is
thought to be on the high side of the forecasting range. Therefore, a significantly lower value of
20€/ tonnes of CO2 is chosen for the sensitivity analysis.
As Table 4.8 shows, with a CO2 cost five times lower, total variable generation costs in a high
renewable scenario would be 0,58% higher in a zonal market with respect to a nodal market, in
contrast to the 0,32% difference in the base case (see Table 4.1). Besides, operation costs are

Exploration of the future European Electricity Market Design Chapter 4 – Simulation Results
Master Thesis MSc Economics and Management of Network Industries (EMIN) MSc Engineering and Policy Analysis (EPA) MSc Electric Power Industry (MEPI) – Ainhoa Villar Lejarreta Page 79
lower as cheaper coal generation is dispatched instead of expensive gas units. Figure 4.7 indeed
shows that part of the base case gas production has been replaced by production of coal.
Table 4.8. Breakdown of generation, non-served energy and redispatch costs in Vision 4 (2030)
for the nodal and zonal power markets and for the base case and low CO2 emission cost rate.
Costs (Million
Euros) Nodal
Zonal
Phase I
Zonal
Phase I vs.
Nodal (%)
Zonal
Redispatch
Phase
Zonal Redispatch
Phase vs. Nodal
(%)
Low CO2 emission cost rate = 20 €/tonnes of CO2
Total Variable
Generation 1106,9 1090,2 -1,5 1113,3 0,58
Fixed Generation 28,4 29,4 3,5 29,4 3,50
Operation 1055,7 1038,8 -1,6 1054,9 -0,08
Non-served energy 22,7 22,0 -3,1 29,0 27,69
Redispatch - - 16,1
Base case
Total Variable
Generation 1882,8 1866,9 -0,8 1888,9 0,32
Fixed Generation 28,6 28,0 -2,3 28,0 -2,30
Operation 1798,6 1783,7 -0,8 1802,7 0,23
Non-served energy 55,6 55,2 -0,8 58,2 4,72
Redispatch - - 19,0

Exploration of the future European Electricity Market Design Chapter 4 – Simulation Results
Master Thesis MSc Economics and Management of Network Industries (EMIN) MSc Engineering and Policy Analysis (EPA) MSc Electric Power Industry (MEPI) – Ainhoa Villar Lejarreta Page 80
BASE CASE
LOW CO2 EMISSION COST RATE
NO
DA
L
ZO
NA
L R
ED
ISP
AT
CH
PH
AS
E
Figure 4.7. Generation dispatch profiles in Vision 4 (2030) for the nodal and zonal power
market designs for the base case and low CO2 emission cost rate.
With regard to the nodal prices of electricity, while a lower CO2 emission cost does not
influence to a large degree, in principle, the network's congestion patterns, Figure 4.8 does show

Exploration of the future European Electricity Market Design Chapter 4 – Simulation Results
Master Thesis MSc Economics and Management of Network Industries (EMIN) MSc Engineering and Policy Analysis (EPA) MSc Electric Power Industry (MEPI) – Ainhoa Villar Lejarreta Page 81
reduced nodal prices in both market designs with a lower CO2 price. From the policy
perspective, this underlines the importance of setting appropriate tax levels or subsidies that
could otherwise distort the market outcome to undesirable levels.
BASE CASE
LOW CO2 EMISSION COST RATE
NO
DA
L
ZO
NA
L F
IRS
T P
HA
SE
Figure 4.8. Average Locational Marginal Prices in Vision 4 (2030) for the nodal and zonal
markets for the base case and low CO2 emission cost rate.
A lower CO2 price also makes the difference between the electricity prices in the zonal and
nodal markets more negative across the network (see Figure 4.9), thus, favouring the nodal
market in the generators' view as revenues would be larger. However, some zones in northern

Exploration of the future European Electricity Market Design Chapter 4 – Simulation Results
Master Thesis MSc Economics and Management of Network Industries (EMIN) MSc Engineering and Policy Analysis (EPA) MSc Electric Power Industry (MEPI) – Ainhoa Villar Lejarreta Page 82
Germany and Denmark would still slightly benefit from a zonal market. Again, a broader price
analysis should be performed to be able to conclude more firmly.
BASE CASE
LOW CO2 EMISSION COST RATE
Figure 4.9. Difference in average Locational Marginal Prices between nodal and zonal markets
in Vision 4 (2030) for the base case and low CO2 emission cost rate.
4.2.6.2. Intra-zonal network capacities
Transmission lines and network capacities represent important factors in the modeling of the
power system since they determine the power flow profiles and the power limits of the lines.
Two sensitivity tests will be performed to analyse the impact of doubling or halving intra-zonal
capacities on system variable generation costs, on nodal prices and on the difference of nodal
prices between nodal and zonal markets. The intra-zonal network capacities are the line
capacities located within a country.
4.2.6.2.1. Double intra-zonal network capacities
Increasing by 50% the capacities of the intra-zonal transmission lines would reduce the
difference in total variable generation costs between the nodal and zonal markets to 0,17% as
compared to the 0,32% of the base case (see Table 4.9). However, a 4,38% difference in non-
served energy costs between zonal and nodal markets is still close to that of the base case,
4,72%. Plus, absolute values of non-served energy costs are very similar to those in the base
case. Moreover, total variable generation costs would be reduced by only 0,5% and 0,65%, in
the nodal and zonal markets respectively, compared to the base case. This suggests that

Exploration of the future European Electricity Market Design Chapter 4 – Simulation Results
Master Thesis MSc Economics and Management of Network Industries (EMIN) MSc Engineering and Policy Analysis (EPA) MSc Electric Power Industry (MEPI) – Ainhoa Villar Lejarreta Page 83
doubling the capacities within zones would not be enough to meet system's demand in a cost-
efficient way.
Table 4.9. Breakdown of generation, non-served energy and redispatch costs in Vision 4 (2030)
for the nodal and zonal power markets and for the base case and double intra-zonal capacities.
Costs (Million Euros) Nodal Zonal
Phase I
Zonal
Phase I vs.
Nodal (%)
Zonal
Redispatch
Phase
Zonal
Redispatch
Phase vs.
Nodal (%)
Double intra-zonal network capacities
Total Variable Generation 1873,4 1866,9 -0,4 1876,6 0,17
Fixed Generation 28,9 28,0 -3,3 28,0 -3,32
Operation 1789,1 1783,7 -0,3 1790,9 0,10
Non-served energy 55,4 55,2 -0,4 57,8 4,38
Redispatch - - 7,1
Base case
Total Variable Generation 1882,8 1866,9 -0,8 1888,9 0,32
Fixed Generation 28,6 28,0 -2,3 28,0 -2,30
Operation 1798,6 1783,7 -0,8 1802,7 0,23
Non-served energy 55,6 55,2 -0,8 58,2 4,72
Redispatch - - 19,0
In terms of alleviating network congestions, doubling the capacities within countries has slightly
helped to improve transmission constraints in the nodal market between the north and south of
Germany and within Belgium, as Figure 4.10 shows. Additionally, prices in the nodal market
are very similar to those in the zonal market. Nevertheless, cross-border congestions limit the
nodal market's potential to improve operating efficiency of the system since they keep being
quite significant.

Exploration of the future European Electricity Market Design Chapter 4 – Simulation Results
Master Thesis MSc Economics and Management of Network Industries (EMIN) MSc Engineering and Policy Analysis (EPA) MSc Electric Power Industry (MEPI) – Ainhoa Villar Lejarreta Page 84
BASE CASE
DOUBLE INTRA-ZONAL CAPACITIES
NO
DA
L
ZO
NA
L F
IRS
T P
HA
SE
Figure 4.10. Average Locational Marginal Prices in Vision 4 (2030) for the nodal and zonal
markets for the base case and double intra-zonal capacities.
On the other hand, a 50% increase in the intra-zonal network capacities decrease the difference
in nodal prices between both markets, compared to the base case, to values that range from -4 to
2 €/MWh according to Figure 4.11. From the generators' point of view, the small differences
would hardly impact on their revenues if a nodal market is implemented. However, a more
extensive study should be done in order to account for possible anomalies in this week's
generation profile.

Exploration of the future European Electricity Market Design Chapter 4 – Simulation Results
Master Thesis MSc Economics and Management of Network Industries (EMIN) MSc Engineering and Policy Analysis (EPA) MSc Electric Power Industry (MEPI) – Ainhoa Villar Lejarreta Page 85
BASE CASE
DOUBLE INTRA-ZONAL CAPACITIES
Figure 4.11. Difference in average Locational Marginal Prices between nodal and zonal markets
in Vision 4 (2030) for the base case and double intra-zonal capacities.
4.2.6.2.2. Half intra-zonal network capacities
In the case of decreasing by 50% the intra-zonal capacities, the zonal market turns out to be
1,89% more costly in terms of total variable generation costs than the nodal market design. In
comparison to the base case, total variable generation costs would be 3,36% higher in the nodal
market and almost 5% higher in the zonal market. Moreover, in this case the redispatch costs
would amount to 53,6 Million Euros, 2,82 times higher than in the base case, and non-served
energy costs in the zonal redispatch phase would more than double those in the first phase,
reaching 117,7 Million Euros (see Table 4.10).

Exploration of the future European Electricity Market Design Chapter 4 – Simulation Results
Master Thesis MSc Economics and Management of Network Industries (EMIN) MSc Engineering and Policy Analysis (EPA) MSc Electric Power Industry (MEPI) – Ainhoa Villar Lejarreta Page 86
Table 4.10. Breakdown of generation, non-served energy and redispatch costs in Vision 4
(2030) for the nodal and zonal power markets and for the base case and half intra-zonal
capacities.
Costs (Million Euros) Nodal Zonal
Phase I
Zonal
Phase I vs.
Nodal (%)
Zonal
Redispatch
Phase
Zonal
Redispatch
Phase vs. Nodal
(%)
Half intra-zonal network capacities
Total Variable Generation 1946,2 1866,9 -4,1 1983,1 1,89
Fixed Generation 28,4 28,0 -1,7 28,0 -1,66
Operation 1860,2 1783,7 -4,1 1837,4 -1,23
Non-served energy 57,5 55,2 -4,1 117,7 104,63
Redispatch - - 53,6
Base case
Total Variable Generation 1882,8 1866,9 -0,8 1888,9 0,32
Fixed Generation 28,6 28,0 -2,3 28,0 -2,30
Operation 1798,6 1783,7 -0,8 1802,7 0,23
Non-served energy 55,6 55,2 -0,8 58,2 4,72
Redispatch - - 19,0
In relation to the electricity prices, reducing intra-zonal line capacities accentuates network
congestions within zones even more. This can be observed in north-eastern Germany and
Belgium in the nodal market, whereas in the zonal case no major change can be seen (Figure
4.12). Cross-border transmission constraints are again not affected. Here, it is reflected the
transparency of the nodal market over the zonal one. The nodal market provides information
about where transmission development would be more valuable to reduce congestions in the
network while the zonal approach conceals it completely.

Exploration of the future European Electricity Market Design Chapter 4 – Simulation Results
Master Thesis MSc Economics and Management of Network Industries (EMIN) MSc Engineering and Policy Analysis (EPA) MSc Electric Power Industry (MEPI) – Ainhoa Villar Lejarreta Page 87
BASE CASE
HALF INTRA-ZONAL CAPACITIES
NO
DA
L
ZO
NA
L F
IRS
T P
HA
SE
Figure 4.12. Average Locational Marginal Prices in Vision 4 (2030) for the nodal and zonal
markets for the base case and half intra-zonal capacities.
Once again, in this case a 50% decrease in intra-zonal line capacities increase the differences
between nodal prices of both markets to values ranging from -10 to 25 €/MWh (Figure 4.13).
These magnitudes, yet low, could start to impact producers' behaviours in the market. Energy
producers owning generators in nodes with a positive difference, meaning
, would rather operate under a zonal market structure, especially if those generators
are downstream of a transmission constraint since that would mean that once the congestion is
solved the price at that particular node will rise, hence increasing the generators' revenues.

Exploration of the future European Electricity Market Design Chapter 4 – Simulation Results
Master Thesis MSc Economics and Management of Network Industries (EMIN) MSc Engineering and Policy Analysis (EPA) MSc Electric Power Industry (MEPI) – Ainhoa Villar Lejarreta Page 88
BASE CASE
HALF INTRA-ZONAL CAPACITIES
Figure 4.13. Difference in average Locational Marginal Prices between nodal and zonal markets
in Vision 4 (2030) for the base case and half intra-zonal capacities.

Master Thesis MSc Economics and Management of Network Industries (EMIN) MSc Engineering and Policy Analysis (EPA) MSc Electric Power Industry (MEPI) – Ainhoa Villar Lejarreta Page 89
CHAPTER 5
CONCLUSIONS AND
RECOMMENDATIONS

Master Thesis MSc Economics and Management of Network Industries (EMIN) MSc Engineering and Policy Analysis (EPA) MSc Electric Power Industry (MEPI) – Ainhoa Villar Lejarreta Page 90
Page left blank intentionally

Exploration of the future European Electricity Market Design Chapter 5 – Conclusions and Recommendations
Master Thesis MSc Economics and Management of Network Industries (EMIN) MSc Engineering and Policy Analysis (EPA) MSc Electric Power Industry (MEPI) – Ainhoa Villar Lejarreta Page 91
5. Conclusions and Recommendations
In this last chapter the main results and conclusions drawn from the research work are
presented. Section 5.1 formulates the answers to the main research question introduced in
chapter 1 as well as to its three sub-questions. Section 5.2 reflects on the modeling process with
the research work. Section 5.3 gives some recommendations for future research and relevant
considerations for policy makers in the European power sector. Some final reflections on these
policies are also exposed.
5.1. Conclusions of the research
This research work started with the objective of gaining better insights on the functioning of the
European power sector and market under different power market designs and in high renewable
scenarios. In particular, the main research question posed is:
To what extent can the power market design and the future expected large-scale integration of
renewable energy sources have an effect on the system's variable generation costs of
electricity?
High penetration of renewable energy sources bring a number of opportunities to many actors in
the power system but involve also many big challenges to power system operators. Given their
unpredictable nature and the need of a reliable and continuous system balance, the dispatch of
large amounts of this green technology in combination with other existing conventional
technologies will unfold new ways of operating the power market, starting by identifying the
future transmission line congestions in the network. A power market design able to intrinsically
manage congestion not only will play a positive effect on the integration of renewable energy
sources but will also ensure the operation of the system at minimum costs.
The current power market rules in Europe respond to a multi-region day-ahead market coupling
design (zonal market) in which real-time markets take into account inter-zonal congestion but
establish a single electricity price inside each zone, namely a country. On a second phase, this is
during operational hour, network congestion is handled by the Transmission System Operator
(TSO) who conveniently redispatches generating units, incurring in extra operational costs. In a
locational marginal pricing market scheme (nodal market), however, real-time markets
determine the feasible generating schedule at one go and electricity prices internalize the
locational value of delivering the energy, providing actors with a more transparent and efficient
market design. The implementation of a nodal market design in Europe could lead to a potential

Exploration of the future European Electricity Market Design Chapter 5 – Conclusions and Recommendations
Master Thesis MSc Economics and Management of Network Industries (EMIN) MSc Engineering and Policy Analysis (EPA) MSc Electric Power Industry (MEPI) – Ainhoa Villar Lejarreta Page 92
saving of 0,32% in the system's total variable generation costs with respect to the zonal power
market option.
A successful implementation of the power market's redesign also depends on an appropriate
network expansion plan. The research has shown that a well-developed network infrastructure is
a crucial factor in the effective integration of large amounts of renewable energies. The
mentioned expansion plan should cover both already existing transmission lines that need
reinforcements within and between regions and new ones that will become necessary when
more off-shore wind farms are developed. An extended network could emphasize to a greater
extent the 0,32% savings in system's generation costs under a nodal market compared to those
in a zonal market.
Sub-question 1. How can the European power system be modeled to best reproduce its
behaviour when functioning under different power market designs in combination with high and
low renewable scenarios?
Firstly, and referring to the main research question, the objective of power systems is to supply
the required demand with the available energy resources in the market at minimum cost. For
this, TSOs use unit commitment models and constrained economic dispatch models to obtain a
generating schedule that involves minimum total generation costs for the system and that is
technically feasible with the physical network. Accordingly, the chosen technique to model
Europe's power system is based on the optimization of energy resources from a system's
viewpoint, i.e. minimization of the system's variable generation costs.
Secondly, in the context of the Internal Energy Market for Europe that aims for a competitive
and efficient power system, it was chosen to model the power system from a centralised point of
view as if there was a single centralized planner managing all the generating units in Europe. In
this way, it is assumed that the system's optimal solution is found.
Thirdly, a major feature of power market designs in relation to the penetration of renewable
energies in the system concerns the network capacity allocation method and the mechanism
used to manage congestions in the lines. While in a zonal market congestion is handled through
system operators with a redispatch process during the operational hour, the nodal market
implicitly takes care of congestion through the market clearing by including all the network
constraints in the optimization algorithm. It is precisely this difference that is used to reproduce
and model both power market designs. This method reflects the efficient use of the available
transmission capacity in the nodal market and the impact of the redispatch process on the
system's variable generation costs in the zonal market. Moreover, the additional features
included in the optimization's problem formulation related to the HVDC transmission lines in
the system give a deep insight on the complexity of the network and the system's power flow
problem.

Exploration of the future European Electricity Market Design Chapter 5 – Conclusions and Recommendations
Master Thesis MSc Economics and Management of Network Industries (EMIN) MSc Engineering and Policy Analysis (EPA) MSc Electric Power Industry (MEPI) – Ainhoa Villar Lejarreta Page 93
Finally, the use of markedly different renewable scenarios validated by the ENTSO-E to model
the system's generation mix aids to gain a clear insight, from the technological point of view, of
how the different power plant technologies and their production levels in the day-ahead market
are impacted by the network's topology limitations and the power market design in question.
Sub-question 2. To what extent the difference in variable electricity generation costs between
scenarios and across power market designs can be attributed to an increase usage of renewable
technologies, network congestions or non-served energy costs?
The research has showed that the large-scale integration of renewable energies in the power
system by 2030 would lead to a reduction of 6,3% in the considered system's total variable
generation costs if the latter would operate under a Copper Plate design. A lower percentage of
savings would be expected provided the completion of the mechanisms to fully integrate the
day-ahead markets and the completion of the required network developments that prevents
significant amounts of network congestions.
Regarding the other two power market designs, despite the large rise of renewable energy
production in 2030, accounting for 44,19% and 44,13% of the total energy production in the
nodal and zonal markets, respectively, the power system has also required to increase the share
of gas production from 15,9% to 19,6% in the nodal market and from 15,2% to 19,7% in the
zonal market with respect to the reference scenario. Additionally, the incapability of the system
to meet significant amounts of energy has been reflected in the share of non-served energy costs
with respect to the system's total variable generation costs, 2,95% and 3,08% shares in the nodal
and zonal markets, respectively. Moreover, significant renewable curtailment values of 7,83%
and 8,01% in the nodal and zonal markets, respectively, reveal the system's inefficient
integration of the deployed RES capacity in the system. And last but not least, the additional
redispatch costs incurred in the zonal market, a 1% share of the total variable generation costs,
stress even more the degree of intra-zonal congestions needed to be fixed compared to the nodal
market.
All the factors above have revealed the extent of the network's congestion that provokes a share
of the demand to not be met, part of the wind and solar potential to be curtailed and
consequently more expensive technology to be dispatched, thus undermining the performance
of an efficient power market design. The above emphasizes the relevance of having an upgraded
network, whose expansion plan should be rigorously developed at the same pace as the
deployment of the projected renewable energies. In order to be successful this process needs a
common approach between Member States based on information exchanges and maximum
transparency as well as full commitment to the project of the IEM for Europe.

Exploration of the future European Electricity Market Design Chapter 5 – Conclusions and Recommendations
Master Thesis MSc Economics and Management of Network Industries (EMIN) MSc Engineering and Policy Analysis (EPA) MSc Electric Power Industry (MEPI) – Ainhoa Villar Lejarreta Page 94
Sub-question 3. How can the difference in electricity prices within and between European
countries impact the markets' participants behaviour in the power market?
For a given market design, variations of electricity prices within and between countries impact
on the generators' revenues depending on whether they are located upstream or downstream of
the transmission constraint. On the one hand, generators' revenues are directly proportional to
the nodal prices of the nodes where they are located. On the other hand, being located upstream
of the transmission constraint translates into initially having assigned a higher electricity price
than that of the downstream end. In the case of the zonal market, once the congestion is fixed by
the TSO, the price of the upstream node would be lowered and the price of the downstream
node would be increased. Therefore, generators located downstream of the transmission
constraint would see an opportunity to increase their revenues. It should be noted that the more
open the market is to competition and the lower the concentration of the wholesale market is,
the less opportunity there is for incumbent generators to strategically bid in the market, the "inc-
dec game" (Neuhoff, et al., 2011).
The research shows that in both nodal and zonal market designs weekly average nodal prices
decrease in overall in a high renewable scenario. Additionally, intra-national and cross-border
network congestions can be spotted, but with the analysis performed it is difficult to conclude
whether these congestions are systematically present in the network. Also, these spotted
congestions seem to be slightly reduced with more renewables. This could be due to the overall
larger amount of renewable generation available in every node to meet the demand in each
node. Following this, a point could be reached in which, provided network capacities are
adequately developed, the vast presence of renewable energies in the generation mix could push
wholesale prices to such low levels that revenues of both thermal and renewable energy
producers could be negatively affected.
Furthermore, the base case price analysis performed shows that indeed there are some zones in
the network, and hence generators located there too, that would benefit from the implementation
of a nodal market since nodal prices would be slightly higher under a nodal scheme. However,
for the modeled week these price differences between market designs are reduced as more
renewables are integrated. Taking into account the shortcomings of the network modeled, higher
differences between nodal and zonal nodal prices could be expected.
On the other hand, the results of the sensitivity analysis reflect that the lower the price that
thermal generators have to pay for CO2 emissions, the more negative are the nodal price
differences between the zonal and nodal markets, and hence the more economically beneficial
would be for generators bidding in the market. This output reminds that any kind of
environmental policy or subsidy can impact, to a larger extent than thought, the market outcome
and therefore they should be looked at carefully before implementing them. Moreover, a 50%
increase in intra-zonal network capacities in a high renewable scenario would decrease the
difference in nodal prices between both markets, to significantly smaller differences that would
not largely impact on producers' revenues. In contrast, a 50% decrease in intra-zonal line
capacities would increase nodal price differences to values of up to 25€/MWh. These

Exploration of the future European Electricity Market Design Chapter 5 – Conclusions and Recommendations
Master Thesis MSc Economics and Management of Network Industries (EMIN) MSc Engineering and Policy Analysis (EPA) MSc Electric Power Industry (MEPI) – Ainhoa Villar Lejarreta Page 95
magnitudes, if prolonged in time, could start impacting market participants and define whether a
zonal or nodal market would be more convenient from the producers' perspective.
The price analysis performed for a future high renewable scenario, if extended to longer time
horizons and different seasons, could provide further insights and a robust analysis of future
congestion patterns and a possible configuration of smaller price zones for continental Europe to
operate in a similar way to how the Nordic countries currently operate.
5.2. Reflection on the modeling process and results
Following the conclusions and the answers to the research questions posed in this thesis work, a
reflection is presented below on the assumptions and the modeling process, the results and the
limitations of the work.
As in every model representing a real-life system, many simplifying assumptions have to be
made in order to model the system under computational and time constraints. In other cases,
input data assumptions are needed due to the lack of accessible real data. In this regard, day-
ahead markets of three phase electric power systems are usually modeled using unit
commitment and transmission constrained economic dispatch models that use a linearized
mathematical formulation, the so-called DC power flow model. As explained in section 2.2, the
accuracy of the DC approximation to model the AC power network lies around 5% when it is
applied to high voltage grids and when outcomes are averaged over all the lines in the network.
This means that error deviations are acceptable as long as conclusions are not drawn for
individual lines.
In relation to the required input data, it is worth mentioning that an extensive data search was
necessary to comply with data as realistic as possible and many intermediate calculations with
this data were required to prepare the input parameters before running the optimization model.
Data assumptions related to the network are most probably among the most determining
parameters to obtain power flows that conform more closely to reality. Transmission line
capacities, the number of circuits in every transmission corridor and especially the relationship
between line inductive reactances, are key in determining these power flows since the Power
Transfer Distribution Factors (PTDFs) used in the DC power flow approximation are based on
relations between reactances. Electrical characteristics of the power grids are usually not
accessible to the public, therefore a reference impedance base was estimated (Appendix D) and
relations between reactances of the lines were kept by using the lengths of the transmission
lines.
The optimization problem is modeled with deterministic renewable scenarios that are based on
scenario data provided by the ENTSO-E. Hydro energy is, however, left out from the generation
mix due to lack of data. In order to account for this, the demand parameter was adjusted in those
nodes of the network where hydro resources are predominant, such as in Norway or Austria.
The outputs obtained from the model should therefore be interpreted knowing that optimization

Exploration of the future European Electricity Market Design Chapter 5 – Conclusions and Recommendations
Master Thesis MSc Economics and Management of Network Industries (EMIN) MSc Engineering and Policy Analysis (EPA) MSc Electric Power Industry (MEPI) – Ainhoa Villar Lejarreta Page 96
of hydro resources in combination with intermittent renewable sources will play an important
role important role in the replacement of expensive thermal generation thanks to their flexibility
and complementary use. Moreover, renewable generation of wind and solar is assigned to every
node of the network according to the forecasted wind speed and solar radiation time-series in
the assumed location of that node rather than on the average of a region covered by that node.
This assumption induces to errors due to regional variations of the renewable sources. In the
same way, the initial plan was to model the power system for two different snapshots in a year,
i.e. two weeks in different seasons, in order to account for seasonal characteristic variations in
wind and solar generation profiles. However, this was not possible due to lack of time and the
many difficulties encountered to correct the model's inconsistent outputs.
It is important to remind the reader that the purpose of the thesis is not to predict exact values of
certain model outputs but rather the interest lies in revealing trends and mechanisms that could
serve for the future European power market and its design.
All in all, it should be pointed out that the outcomes obtained from the model should be
interpreted baring in mind the shortcomings of the modeled network, which despite the
similarity to reality of the cross-border interconnections, transmission lines within the countries
are significantly simplified and therefore constraints in these parts of the network are not
realistically taken into account. It is expected that with an extended and validated network
topology, the outcomes of the model regarding total variable generation costs, renewable
curtailment levels, non-served energy levels and the differences between nodal prices would
emphasize greater differences between the nodal and zonal markets, favouring even more the
nodal market scheme as an efficient alternative market design.
5.3. Recommendations
5.3.1. Guidelines for future work
Several recommendations for future research can be drawn from the present research work.
While the interaction between conventional generation and different integration levels of
renewable energies has been tackled in this thesis, the combination and complementary use of
hydro energy resources with intermittent and uncertain energy sources like wind and solar has
not been included. Hydro resources are also expected to increase, yet in a more moderate way
than pure renewable energies, and their known flexibility to stabilize variations between
demand and supply could play a major role in the future power system. In the context of
Europe's redesign of the power system it would be interesting to study how different the market
outcomes would be, especially in terms of system generation costs and network congestions.
Another aspect that could be reviewed is the perfect competition behaviour assumed in the
modeling of the system. Now, it is assumed that the generators' bids reflect their marginal costs,
however, in reality there is always strategic bidding to some extent. This ultimately impacts on

Exploration of the future European Electricity Market Design Chapter 5 – Conclusions and Recommendations
Master Thesis MSc Economics and Management of Network Industries (EMIN) MSc Engineering and Policy Analysis (EPA) MSc Electric Power Industry (MEPI) – Ainhoa Villar Lejarreta Page 97
the optimal economic dispatch and the wholesale electricity prices. However, introducing
strategic behaviour of the market agents increases the complexity of the model even more.
Regarding the model's temporal scope, it is suggested that a longer time horizon is chosen to
model the power system in order to obtain more robust results and conclusions. The chosen
week in July could have been an unusual one in terms of renewable generation. For example,
different weeks during the year or more consecutive weeks would be equally acceptable
approximations.
From the network topology point of view, an increased granularity of the network to obtain a
highly-meshed network closer to the real one could bring some added value to further help
differentiate between the market outcomes of a nodal market and a zonal one. It would be
helpful to avoid end-nodes in the network to minimize congestions that in reality would not
have been there.
Also related to the network and in a similar way as was discussed in this thesis for the high-
voltage power grid, changes to how congestion is managed in the distribution system will be
required. A significant share of the projected renewable sources are expected to be integrated
through the medium-voltage distribution systems. This will cause bidirectional flows, which
were inexistent before, and they need to be taken into account. Therefore, more interaction
between the Distribution System Operators (DSO) and the market will be expected. A similar
analysis to this work could be done to study the impact of high penetration of renewables in the
efficient operation of distribution networks.
Given the further aim of integrating short-term markets and due to increasing amounts of
renewables in the system, these must increasingly be able to provide balancing power. To date,
balancing reserves have been supplied by large conventional power plants and pumped-storage
facilities. Some studies have already proved that renewable energies can also provide balancing
power, even reacting faster than other conventional plants. However, the current framework of
balancing markets prevents renewable energies from actually offering this service. An analysis
on the impact of large penetration of renewables on the design and on balancing market prices
could bring some light to this issue.
5.3.2. Reflection and policy implications in the European framework
The redesign of the power market involves many concerns for market players who in some way
or another may be affected if implementation steps go ahead. In this section I display several
reflections on some policy implications and recommendations that should be borne in mind in
parallel to the redesign process of the power market.
The redesign process of Europe's power market design attempts to achieve a single and greater
competitive and efficient power system. However, while market coupling has proved to
improve market outcomes, regional regulations can have a negative effect on the performance of
this coupled market. The national renewable policies set could tend to fragment the common
market and undermine the benefits from increased energy trade. This is because renewable

Exploration of the future European Electricity Market Design Chapter 5 – Conclusions and Recommendations
Master Thesis MSc Economics and Management of Network Industries (EMIN) MSc Engineering and Policy Analysis (EPA) MSc Electric Power Industry (MEPI) – Ainhoa Villar Lejarreta Page 98
support schemes are still defined on a national basis and in many cases these schemes support
the development of a particular technology in locations where, if looked at it from a European
point of view, they are not as efficient as they would have been if placed somewhere else in the
continent. An example of this could be the deployment of large amounts of solar PV panels in
Germany compared to the not as many and as effective as those in Spain. This misallocation of
resources, along with the excessive investments and corresponding subsidies, could have been
avoided if a European framework for renewable energies would have been in place at the same
time the path for the IEM was being prepared.
Harmonizing renewable policies in all Member States and replacing feed-in tariffs on a national
level for a quota system on a European level could help promote cost-effective technologies in a
technology-neutral way and in efficient locations. A quota system is already set up in some
Nordic countries. This support scheme is quantity-based rather than setting a fixed price for
renewable producers. The renewable energy quota refers to the minimum annual share of RES
that electricity suppliers, large electricity consumers or electricity retailers have to meet and the
high compatibility with market competitiveness and the hints it gives to transmission planners to
adjust to network development requirements makes this support scheme a good candidate to
apply on a European level.
A similar issue to the above could happen in relation to securing the adequacy of national
capacity and reserve mechanisms. Similarly as with national renewable targets, some Member
States opt for a capacity payment policy to power plants in their territories. A capacity payment
represents a fixed price that is paid to generators to reward them for the capacity they can
produce to guarantee security of supply, rather than what they actually produce. With this the
benefits of integrating markets in Europe are not fully exploited since larger markets increase
competition within capacity markets and less of this capacity would be needed in total.
Moreover, depending on the magnitude of these capacity payments, this policy could distort
market outcomes significantly by impacting prices in the short-term and hence influencing
power plant operations nationally and internationally. The latter can lead to a welfare
redistribution effect between interconnected national markets. If a Member State implements a
capacity payment to ensure its generation adequacy, it will most likely positively influence the
generation adequacy of an adjacent Member State with no capacity remuneration, and
ultimately, the consumers in the first one will be the ones financing the generation adequacy
levels of the latter. Therefore, it is crucial that the common approach of the IEM is not
jeopardized by divergent policies for security of supply. Member States should be encouraged
to homogenize them by European institutions.
With regards to considering a change in the market design, welfare redistribution issues can also
arise between already existing generators. This issue is particularly relevant for a market
shifting to a nodal scheme, in which nodal prices can experiment more drastic changes than in a
zonal market, thus shifting economic surplus between actors, both generators and consumers.
As a means to mitigate these congestion costs, especially during the initial implementation
phases of the new market design, financial instruments such as financial transmission rights
(FTRs) could become an important mechanism to alleviate impacts on revenues and high price

Exploration of the future European Electricity Market Design Chapter 5 – Conclusions and Recommendations
Master Thesis MSc Economics and Management of Network Industries (EMIN) MSc Engineering and Policy Analysis (EPA) MSc Electric Power Industry (MEPI) – Ainhoa Villar Lejarreta Page 99
risks. The holder of an FTR is allowed to receive the difference between two nodes prices, both
of them specified in the FTR conditions. TSOs would fund this financial instrument from the
congestion revenue it receives. Nonetheless, the increased variability and uncertainty in the
system due to large amounts of renewable energies also increase the uncertainty for FTR
holders about the congestion patterns in the lines. Therefore, new financial instruments need to
be developed to address the intermittency of renewables.

Exploration of the future European Electricity Market Design Chapter 5 – Conclusions and Recommendations
Master Thesis MSc Economics and Management of Network Industries (EMIN) MSc Engineering and Policy Analysis (EPA) MSc Electric Power Industry (MEPI) – Ainhoa Villar Lejarreta Page 100
Page left blank intentionally

Exploration of the future European Electricity Market Design Bibliography
Master Thesis MSc Economics and Management of Network Industries (EMIN) MSc Engineering and Policy Analysis (EPA) MSc Electric Power Industry (MEPI) – Ainhoa Villar Lejarreta Page 101
BIBLIOGRAPHY
Baldick, R., 2003. 'Variation of Distribution Factors with Loading'. IEEE Transactions on Power Systems, 18(4),
pp. 1316-1323.
Baldick, R., Dixit, K. & Oberbye, T., 2005. 'Empirical Analysis of the Variation of Distribution Factors with
Loading'. IEEE Power Engineering Society General Meeting, Volume 1, pp. 221-229.
Barroso, J., 2006. The EU and energy: looking to the future. EU Focus September 1-3.
Belgian Federal Government, 2013. Statistics Belgium. [Online]
Available at: http://statbel.fgov.be/en/statistics/figures/
[Accessed March 2015].
Beurskens, L., Hekkenberg, M. & Vethman, P., 2011. Renewable Energy Projections as Published in the National
Renewable Energy Action Plans of the European Member States. Energy research Centre of the Netherlands
(ECN) and European Environment Agency (EEA). [Online]
Available at: https://www.ecn.nl/projects/nreap/2010/home/
[Accessed April 2015].
Böckers, V., Haucap, P. J. & Heimeshoff, D. U., 2013. Cost of Non-Europe in the Single Market for Energy.
Benefits of an integrated European electricity market: the role of competition, Brussels: s.n.
Borggrefe, F. & Neuhoff, K., 2011. Balancing and Intraday Market Design: Options for Wind Integration. Smart
Power Market Project, s.l.: s.n.
Central Commission for Statistics, 2015. Centraal Bureau voor de Statistiek. [Online]
Available at: http://www.cbs.nl/en-GB/menu/home/default.htm
[Accessed March 2015].
Central Statistical Office of Poland, 2015. Information Portal. Central Statistical Office of Poland. [Online]
Available at: http://stat.gov.pl/en/
[Accessed March 2015].
Cohen, A. & Yoshimura, M., 1983. 'A Branch-and-Bound Algorithm for Unit Commitment'. IEEE Transactions on
Power Apparatus and Systems, PAS-102(2), pp. 444-451.
Dillon, T., Edwin, K., Kochs, H. & Taud, R., 1978. 'Integer Programming Approach to the Problem of Optimal
Unit Commitment with Probabilistic Reserve Determination'. IEEE Transactions on Power Apparatus and
Systems, PAS-97(6), pp. 2154-2166.
Directorate General of the Ministry of the Economy, Industry and the Digital Sector and of the Ministry of Finance
and Public Accounts, 2015. INSEE. National Institute of Statistics and Eonomic Studies. [Online]
Available at: http://www.insee.fr/en/default.asp
[Accessed March 2015].

Exploration of the future European Electricity Market Design Bibliography
Master Thesis MSc Economics and Management of Network Industries (EMIN) MSc Engineering and Policy Analysis (EPA) MSc Electric Power Industry (MEPI) – Ainhoa Villar Lejarreta Page 102
Doan, B.-T., 2012. Impact of German Renewable Energies on the Spot Prices of the French-German Electricity
Markets. Paris: s.n.
Ela, E., Milligan, M. & Kirby, B., 2011. NREL. Operating Reserves and Variable Generation. A comprehensive
review of current strategies, studies and fundamental research on the impact that increased RES generation has on
power system operating reserves. Technical Report, s.l.: s.n.
ENTSO-E, 2014. Overview of Internal Electricity Market-related project work, s.l.: s.n.
ENTSO-E, 2014. Scenario Outlook and Adequacy Forecast 2014-2030, s.l.: s.n.
ENTSO-E, 2014. Ten-Year Network Development Plan 2014, s.l.: s.n.
ENTSO-E, 2015. Hourly load values of all countries for a specific month. ENTSO-E Transparency Platform.
[Online]
Available at: https://www.entsoe.eu/data/data-portal/consumption/Pages/default.aspx
[Accessed 12 September 2015].
Eurelectric, 2010. Integrating Intermittent Renewables Sources into the EU Electricity System by 2020: Challenges
and Solutions, s.l.: s.n.
European Commission, 2013. The EU Emissions Trading System (EU ETS), s.l.: s.n.
European Environment Agency, 2011. National Renewable Energy Action Plan (NREAP) of Member States, s.l.:
s.n.
EWI, 2010. 'European RES-E Policy Analysis - Eine modellbasierte Studie über die Entwicklung der
Stromerzeugung aus Erneuerbaren Energiequellen in Europa und die Auswirkungen auf den konventionellen
Strommarkt', s.l.: s.n.
EWIS, 2010. 'European Wind Integration Study- Towards a successfull integration of wind power into European
Electricity Grids', s.l.: s.n.
Federal Institution under Public Law, 2015. Statistics Austria. The Information Manager. [Online]
Available at: http://www.statistik.at/web_de/statistiken/index.html
[Accessed March 2015].
Federal Statistical Office, 2015. Statistisches Bundesamt. [Online]
Available at: https://www.destatis.de/EN/Homepage.html
[Accessed March 2015].
Galiana, F. & Zhuang, F., 1988. 'Toward a More Rigorous and Practical Unit Commitment by Lagrangian
Relaxation'. IEEE Transactions on Power Systems, 3(2), pp. 763-770.
GAMS, 2014. General Algebraic Modeling System. GAMS Development Corporation.. [Online]
Available at: http://www.gams.com/
Garver, L., 1963. 'Power Generation Scheduling by Integer Programming Development of Theory'. IEEE
Transactions on Power Apparatus and Systems, Volume PAS-18, pp. 730-735.

Exploration of the future European Electricity Market Design Bibliography
Master Thesis MSc Economics and Management of Network Industries (EMIN) MSc Engineering and Policy Analysis (EPA) MSc Electric Power Industry (MEPI) – Ainhoa Villar Lejarreta Page 103
Government Digital Service, 2015. Statistics UK. [Online]
Available at: https://www.gov.uk/government/statistics
[Accessed March 2015].
Hakvoort, R., Harris, D., Meeuwsen, J. & Hesmondhalgh, S., 2009. A system for congestion management in the
Netherlands. Assessment of the options, Zwolle: s.n.
ISTAT, 2015. Italian National Institute of Statistics. [Online]
Available at: http://www.istat.it/en/
[Accessed March 2015].
Karan, K. & Kazdagli, H., 2011. The development of energy markets in Europe. In: Financial Aspects in Energy: A
European Perspective. Berlin, Heidelberg: Springer, pp. 11-32, 231.
Litvinov, E., 2011. Power System and LMP Fundamentals. Business Architecture and Technology. WEM 301 ISO
New England Inc. PowerPoint slides. s.l.:s.n.
Morales-España, G., Latorre, J. M. & Ramos, A., 2013. Tight and Compact MILP Formulation for the Thermal
Unit Commitment Problem, s.l.: s.n.
Muckstadt, J. & Wilson, R., 1968. 'An Application of Mixed-Integer Programming Duality to Scheduling Thermal
Generating Systems'. IEEE Transactions on Power Apparatus and Systems, pp. 1968-1978.
Neuhoff, K. et al., 2013. Renewable electric energy integration: Quantifying the value of design of markets for
international transmission capacity. Energy Economics, Volume 40, pp. 760-772.
Neuhoff, K., Hobbs, B. F. & Newbery, D., 2011. Congestion Management in European Power Networks: Criteria
to Assess the Available Options. Smart Power Market Project, s.l.: s.n.
Ouyang, Z. & Shahidehpour, S., 1991. 'An Intelligent Dynamic Programming for Unit Commitment Application'.
IEEE Transactions on Power Apparatus and Systems, 6(3), pp. 1203-1209.
Pollitt, M., 2009. Electricity Liberalization in the EU: A Progress Report, s.l.: s.n.
Safari, A., Shayanfar, H. & Jahani, R., 2010. Optimal Unit Commitment of Power System Using Fast Messy
Genetic Algorithm. International Journal on “Technical and Physical Problems of Engineering” (IJTPE).
Published by International Organization on TPE (IOTPE), 2(2), pp. 22-27.
Saha, S. et al., 2011. updated monthly. NCEP Climate Forecast System Version 2 (CFSv2). Selected Hourly Time-
Series Products. Research Data Archive at the National Center for Atmospheric Research, Computational and
Information Systems Laboratory. [Online]
Available at: http://rda.ucar.edu/datasets/ds094.1/
[Accessed 20 October 2015].
Sandrin, P. & Merlin, A., 1983. 'A New Method for Unit Commitment at Electricité de France'. IEEE Transactions
on Power Apparatus and Systems, Volume PAS-102, pp. 1218-1255.

Exploration of the future European Electricity Market Design Bibliography
Master Thesis MSc Economics and Management of Network Industries (EMIN) MSc Engineering and Policy Analysis (EPA) MSc Electric Power Industry (MEPI) – Ainhoa Villar Lejarreta Page 104
Shahidehpour, S. & Ouyang, Z., 1992. 'A Hybrid Artificial Neural Network/Dynamic Programming Approach to
Unit Commitment'. IEEE Transactions on Power Systems, 7(1), pp. 236-242.
Sheble, G., 1990. 'Solution of the Unit Commitment Problem by the Method of Unit Periods'. IEEE Transactions
on Power Systems, 5(1), pp. 257-260.
Smeers, Y., 2008. 'Study on the general design of electricity market mechanisms close to real time'. Study for the
Commission for Electricity and Gas Regulation (CREG), s.l.: s.n.
Snyder, W., Powell, H. & Rayburn, J., 1987. 'Dynamic Programming Approach to Unit Commitment'. IEEE
Transactions on Power Apparatus and Systems, Volume PAS-2, pp. 339-350.
State Administration of the Czech Republic, 2014. Czech Statistical Office. [Online]
Available at: https://www.czso.cz/csu/czso/about-czso
[Accessed March 2015].
Statistics Norway, 2015. StatBank Norway. [Online]
Available at: https://statbank.ssb.no/en/statistikkbanken
[Accessed March 2015].
Statistics Sweden, 2013. SCB. Statistics Sweden. [Online]
Available at: http://www.scb.se/en_/
[Accessed March 2015].
The Danish Ministry of Social Affairs and the Interior, 2015. Statistics Denmark. [Online]
Available at: http://www.dst.dk/en#
[Accessed March 2015].
Tseng, C.-L.et al., 1999. A Transmission-Constrained Unit Commitment Method in Power System Scheduling.
Decision Support Systems, Volume 24, p. 297–310.
TUDelft, 2014. Enipedia. [Online]
Available at: http://enipedia.tudelft.nl/wiki/Main_Page
Van Blijswijk, M., 2011. Congestion management in the Dutch power sector: A quantitative evaluation of policy
options. Master Thesis, s.l.: s.n.
Van Blijswijk, M., de Vries, L. & Van der Lee, G., 2015. 'Modeling transmission system development in North
West Europe with endogenous investment'. Draft article submitted for publication in a scientific journal,
September 2015.
Van den Bergh, K. & Delarue, E., 2015. Cycling of conventional power plants: Technical limits and actual costs.
Energy Conversion and Management, Volume 97, pp. 70-77.
Van den Bergh, K., Delarue, E. & D'Haeseleer, W., 2014. DC Power Flow in Unit Commitment Models.TME
Working Paper - Energy and Enviroment, s.l.: s.n.

Exploration of the future European Electricity Market Design Appendices
Master Thesis MSc Economics and Management of Network Industries (EMIN) MSc Engineering and Policy Analysis (EPA) MSc Electric Power Industry (MEPI) – Ainhoa Villar Lejarreta Page 105
APPENDICES

Exploration of the future European Electricity Market Design Appendices
Master Thesis MSc Economics and Management of Network Industries (EMIN) MSc Engineering and Policy Analysis (EPA) MSc Electric Power Industry (MEPI) – Ainhoa Villar Lejarreta Page 106
Page left blank intentionally

Exploration of the future European Electricity Market Design Appendix A – GAMS Model Code
Master Thesis MSc Economics and Management of Network Industries (EMIN) MSc Engineering and Policy Analysis (EPA) MSc Electric Power Industry (MEPI) – Ainhoa Villar Lejarreta Page 107
APPENDIX A
GAMS model code
WEEKLY UNIT COMMITMENT AND TRANSMISSION CONSTRAINED ECONOMIC DISPATCH OF
THERMAL AND RES UNITS (SDUC AND TCED)
$OnText
Ainhoa Villar, based on Germán Morales SDUC model. February 24, 2015
$OffText
$OnEmpty OnMulti OffListing
* Solve the optimization problems until optimality
option Optcr = 0.001, Reslim=12000;
* Declaration of sets and indices
SETS
p hourly periods
p1(p) first hour of the day
sc wind scenarios (inactive set)
g generation units
g1(g) generation unit with up time equal to 1h
i buses
l dc lines
is(i) buses without slack bus
iac(i) busses connected to at least one ac line connection
idc(i) dc busses
isac(i) busses without slack bus and connected to at least one ac line connection
c circuit ID
ij(i,i,c) Buses connected by a transmission line and circuit ID c
ijac(i,i,c) Buses connected by an ac transmission line and circuit ID c
ij2(i,i) pairs of buses with at least one line connection
ig(i,g) location of generator g in node i
alias(p,pp)
alias(i,j)
alias(c,cc)
alias(i,ii)
alias(l,ll)
;
PARAMETERS
*Parameters related to hourly periods
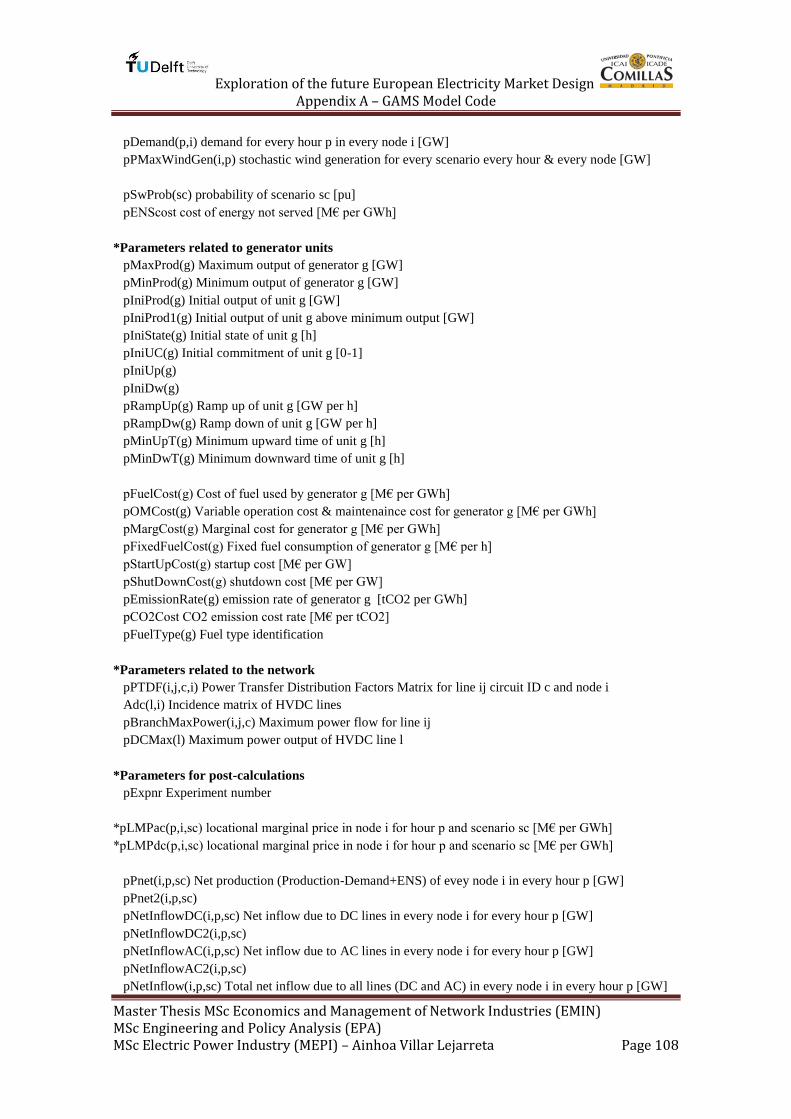
Exploration of the future European Electricity Market Design Appendix A – GAMS Model Code
Master Thesis MSc Economics and Management of Network Industries (EMIN) MSc Engineering and Policy Analysis (EPA) MSc Electric Power Industry (MEPI) – Ainhoa Villar Lejarreta Page 108
pDemand(p,i) demand for every hour p in every node i [GW]
pPMaxWindGen(i,p) stochastic wind generation for every scenario every hour & every node [GW]
pSwProb(sc) probability of scenario sc [pu]
pENScost cost of energy not served [M€ per GWh]
*Parameters related to generator units
pMaxProd(g) Maximum output of generator g [GW]
pMinProd(g) Minimum output of generator g [GW]
pIniProd(g) Initial output of unit g [GW]
pIniProd1(g) Initial output of unit g above minimum output [GW]
pIniState(g) Initial state of unit g [h]
pIniUC(g) Initial commitment of unit g [0-1]
pIniUp(g)
pIniDw(g)
pRampUp(g) Ramp up of unit g [GW per h]
pRampDw(g) Ramp down of unit g [GW per h]
pMinUpT(g) Minimum upward time of unit g [h]
pMinDwT(g) Minimum downward time of unit g [h]
pFuelCost(g) Cost of fuel used by generator g [M€ per GWh]
pOMCost(g) Variable operation cost & maintenaince cost for generator g [M€ per GWh]
pMargCost(g) Marginal cost for generator g [M€ per GWh]
pFixedFuelCost(g) Fixed fuel consumption of generator g [M€ per h]
pStartUpCost(g) startup cost [M€ per GW]
pShutDownCost(g) shutdown cost [M€ per GW]
pEmissionRate(g) emission rate of generator g [tCO2 per GWh]
pCO2Cost CO2 emission cost rate [M€ per tCO2]
pFuelType(g) Fuel type identification
*Parameters related to the network
pPTDF(i,j,c,i) Power Transfer Distribution Factors Matrix for line ij circuit ID c and node i
Adc(l,i) Incidence matrix of HVDC lines
pBranchMaxPower(i,j,c) Maximum power flow for line ij
pDCMax(l) Maximum power output of HVDC line l
*Parameters for post-calculations
pExpnr Experiment number
*pLMPac(p,i,sc) locational marginal price in node i for hour p and scenario sc [M€ per GWh]
*pLMPdc(p,i,sc) locational marginal price in node i for hour p and scenario sc [M€ per GWh]
pPnet(i,p,sc) Net production (Production-Demand+ENS) of evey node i in every hour p [GW]
pPnet2(i,p,sc)
pNetInflowDC(i,p,sc) Net inflow due to DC lines in every node i for every hour p [GW]
pNetInflowDC2(i,p,sc)
pNetInflowAC(i,p,sc) Net inflow due to AC lines in every node i for every hour p [GW]
pNetInflowAC2(i,p,sc)
pNetInflow(i,p,sc) Total net inflow due to all lines (DC and AC) in every node i in every hour p [GW]

Exploration of the future European Electricity Market Design Appendix A – GAMS Model Code
Master Thesis MSc Economics and Management of Network Industries (EMIN) MSc Engineering and Policy Analysis (EPA) MSc Electric Power Industry (MEPI) – Ainhoa Villar Lejarreta Page 109
pSummary(*)
pTotal(g,p,sc)
;
* Declaration of free variables
VARIABLES
vTotalVCost total system variable cost [M€]
vPBranch(i,j,c,p,sc) power flow through branch i -> j and circuit c for every hour p & scenario sc [GW]
vPDCline(l,p,sc) power flow through dc line l for every hour p and scenario sc [GW]
;
POSITIVE VARIABLES
vProduct (g,p,sc) output of the unit g for hour p and scenario sc [GW]
vProduct1 (g,p,sc) output of the unit g > min load for hour p and scenario sc [GW]
vUpReserve(p,g,sc) operating reserve up of unit g for hour p and scenario sc [GW]
vDwReserve(p,g,sc) operating reserve down of unit g for hour p and scenario sc [GW]
vENS (p,i,sc) energy not served in node i for every hour p and every scenario sc [GW]
vIG (i,p,sc) intermittent generation in node i for every hour p and every scenario sc [GW]
BINARY VARIABLES
vCommitt (g,p) commitment of the unit g in hour p [0-1]
vStartup (g,p) startup of the unit g in hour p [0-1]
vShutdown (g,p) shutdown of the unit g in hour p [0-1]
* Declaration of Equations
EQUATIONS
eTotalVCost total system variable cost [M€]
eBalance (p,sc) load generation balance in hour p for scenario sc [GW]
eThrmMax (g,p,sc) max output of the committed unit g (with uptime and downtime greater than 1h) in
hour p and scenario sc [GW]
eThrmMax2 (g,p,sc) max output of the committed unit g (with uptime lower than 2h) in hour p and
scenario sc [GW]
eThrmMax3 (g,p,sc) max output of the committed unit g (with downtime lower than 2h) in hour p and
scenario sc [GW]
eThrmMin (g,p,sc) min output of the committed unit g in hour p and scenario sc [GW]
eTotOutput(g,p,sc) total output of committed unit g in hour p [GW]
eRampUp (g,p,sc) bound on ramp up of unit g in hour p [GW]
eRampDw (g,p,sc) bound on ramp down of unit g in hour p [GW]
eMinTUp (g,p) minimum up time (committed)
eMinTDown (g,p) minimum down time (not committed)
eUCStrShut(g,p) relation between commitment startup and shutdown decision
ePBranch(p,i,j,c,sc) Network constraints of line ij circuit c for hour p and scenario sc
ePDCnodes(p,i,sc) Balance equation for DC nodes

Exploration of the future European Electricity Market Design Appendix A – GAMS Model Code
Master Thesis MSc Economics and Management of Network Industries (EMIN) MSc Engineering and Policy Analysis (EPA) MSc Electric Power Industry (MEPI) – Ainhoa Villar Lejarreta Page 110
;
* Formulation of equations:
eTotalVCost .. vTotalVCost =e= sum[(p,i,sc), pENSCost*vENS(p,i,sc) ] +
sum[(p,g,sc), pEmissionRate(g)*pCO2Cost*vProduct(g,p,sc) ] +
sum[(p,g,sc), pMargCost(g)*vProduct(g,p,sc) ] +
sum[(p,g), pFixedFuelCost(g)*vCommitt(g,p) ] +
sum[(p,g), pStartupCost(g)*vStartup(g,p)*pMaxProd(g) ] +
sum[(p,g), pShutDownCost(g)*vShutdown(g,p) ];
*Balance Demand with Production of thermal generation and IG & ENS in the system every hour p
eBalance (p,sc) .. sum[g, vProduct(g,p,sc)] + sum[i,vIG(i,p,sc)+vENS(p,i,sc)] =e=sum[i,
pDemand(p,i)];
*Capacity Limits
eThrmMax (g,p,sc) $[not(g1(g))] .. vProduct1(g,p,sc) +vUpReserve(p,g,sc)=l= (pMaxProd(g)-
pMinProd(g))*(vCommitt(g,p) - vStartup(g,p) - vShutdown(g,p+1));
eThrmMax2 (g1(g),p,sc) .. vProduct1(g,p,sc) +vUpReserve(p,g,sc)=l= (pMaxProd(g)-
pMinProd(g))*(vCommitt(g,p) - vStartup(g,p));
eThrmMax3 (g1(g),p,sc) .. vProduct1(g,p,sc) +vUpReserve(p,g,sc)=l= (pMaxprod(g)-
pMinProd(g))*(vCommitt(g,p) - vShutdown(g,p+1));
eThrmMin (g,p,sc) .. vProduct1(g,p,sc)-vDwReserve(p,g,sc) =g= 0;
*Power Output of unit g always above technical minimum
eTotOutput(g,p,sc) .. vProduct(g,p,sc) =e= pMinProd(g)*vCommitt(g,p) + vProduct1(g,p,sc) ;
*Ramping constraints
eRampUp(g,p,sc) .. vProduct1(g,p,sc)-vProduct1(g,p-1,sc)-pIniProd1(g) $p1(p) =l=
pRampUp(g) ;
eRampDw(g,p,sc) ..-vProduct1(g,p,sc)+vProduct1(g,p-1,sc)+pIniProd1(g) $p1(p) =l=
pRampDw(g) - (pRampDw(g)-(pMinProd(g)-pMinProd(g)))*vShutDown(g,p)$p1(p);
*Relation between commitment startup and shutdown decision
eUCStrShut(g,p) .. vCommitt(g,p) - vCommitt(g,p-1) - pIniUC(g) $p1(p) =e= vStartup(g,p) -
vShutdown(g,p) ;
*Minimum Time Up and Minimum Time Down
eMinTUp(g,p) $[ord(p)>=pMinUpT(g)] .. sum[pp$(ord(pp)>=(ord(p)-pMinUpT(g)+1) and
ord(pp)<=ord(p)),vStartup (g,pp)] =l= vCommitt(g,p);
eMinTDown(g,p) $[ord(p)>=pMinDwT(g)] .. sum[pp$(ord(pp)>=(ord(p)-pMinDwT(g)+1) and
ord(pp)<=ord(p)),vShutdown(g,pp)] =l= 1 - vCommitt(g,p);
*Network constraint 1

Exploration of the future European Electricity Market Design Appendix A – GAMS Model Code
Master Thesis MSc Economics and Management of Network Industries (EMIN) MSc Engineering and Policy Analysis (EPA) MSc Electric Power Industry (MEPI) – Ainhoa Villar Lejarreta Page 111
ePBranch(p,i,j,c,sc) $[ijac(i,j,c)] ..vPBranch(i,j,c,p,sc) =E= SUM[isac, pPTDF(i,j,c,isac)*(SUM [g $
ig(isac,g),vCommitt(g,p)*pMinProd(g)+ vProduct1(g,p,sc)] - pDemand(p,isac) +vENS(p,isac,sc) +
vIG(isac,p,sc) + SUM[l , Adc(l,isac) * vPDCline(l,p,sc) ] ) ] ;
*Network constraint 2
ePDCnodes(p,i,sc) $[idc(i)] ..SUM [g $ ig(i,g),vCommitt(g,p)*pMinProd(g)+ vProduct1(g,p,sc)] -
pDemand(p,i) +vENS(p,i,sc) + vIG(i,p,sc) =E= -SUM[l , Adc(l,i) * vPDCline(l,p,sc) ] ;
************************************************************************************
**********************OBTAINING PARAMETERS*************************************
sets
$include indicesV1
;
$include paramV1
;
table pDemand2(p,i) thermal generation parameters
$include demandV1
;
table pPMaxWindEnergy(p,i) thermal generation parameters
$include RESproductionV1
;
table pThermalGen(g,*) thermal generation parameters
$include thermalgenV1
;
table pNetwork(i,j,c,*) network parameters
$include ACnetworkV1
;
table pDClines(l,*) dummy generators parameters
$include DClinesV1
;
************************************************************************************
*********************SCALING PARAMETERS****************************************
* Scaling of parameters from MW and € to GW and M€ from €/MWh to M€/GWh
pDemand(p,i) = pDemand2(p,i) * 1e-3 ;
pPMaxWindGen(i,p)= pPMaxWindEnergy(p,i) * 1e-3;
pMaxProd (g) = pThermalGen(g,'MaxProd') * 1e-3 ;
pMinProd (g) = pThermalGen(g,'MinProd') * 1e-3 ;
pIniProd (g) = pThermalGen(g,'IniProd') * 1e-3 ;
pIniState (g) = pThermalGen(g,'IniState') ;
pRampUp (g) = pThermalGen(g,'RampUp') * 1e-3 * 100 ;
pRampDw (g) = pThermalGen(g,'RampDw') * 1e-3 * 100;
pMinUpT (g) = pThermalGen(g,'MinUpTime' ) ;
pMinDwT (g) = pThermalGen(g,'MinDwTime' ) ;
pFixedFuelCost (g) = pThermalGen(g,'FixedFuelCost') * 1e-6 ;

Exploration of the future European Electricity Market Design Appendix A – GAMS Model Code
Master Thesis MSc Economics and Management of Network Industries (EMIN) MSc Engineering and Policy Analysis (EPA) MSc Electric Power Industry (MEPI) – Ainhoa Villar Lejarreta Page 112
pMargCost (g) = pThermalGen(g,'MarginalCost') * 1e-3 ;
pShutDownCost (g) = pThermalGen(g,'ShutDownCost' )*1e-3 ;
pStartUpCost (g) = pThermalGen(g,'StartUpCost' ) * 1e-3 ;
pEmissionRate(g) = pThermalGen(g,'EmissionRate' ) * 1e3 ;
pFuelType(g) = pThermalgen(g,'FuelType');
pBranchMaxPower(i,j,c) = pNetwork(i,j,c,'Pmax') * 1e-3;
pDCmax(l) =pDClines(l,'Pmax') * 1e-3;
************************************************************************************
***************LOADING NETWORK INFO, ASSIGNMENT OF SETS***********************
g1(g) $[pMinUpT(g)=1] = yes;
execute_load 'PTDF.gdx' isac,is,pPTDF,ijac, Adc, iac, idc;
display pPTDF ;
*Assignment of thermal generators g to their corresponding buses i
ig(i,g) $[ord(i) = pThermalGen(g,'Bus')] = YES;
display ig ;
is(i) = is(i)*(SUM[g,ig(i,g)]);
display is ;
ij(i,j,c) $ pNetwork(i,j,c,'Pmax') = YES;
display ij ;
************************************************************************************
***********BOUNDS ON VARIABLES, OTHER DATA & INITIAL CONDITIONS**************
*Allowing curtailment of Wind and Solar
vIG.up(i,p,sc)= pPMaxWindGen(i,p) ;
* Bounds on variables
vStartup.up(g,p) = 1 ;
vShutdown.up(g,p) = 1 ;
vStartup.lo(g,p) = 0 ;
vShutdown.lo(g,p) = 0 ;
vProduct1.up (g,p,sc) = pMaxProd(g)-pMinProd(g);
vUpReserve.up (p,g,sc) = pMaxProd(g)-pMinProd(g);
vDwReserve.up (p,g,sc) = pMaxProd(g)-pMinProd(g);
vPBranch.up(i,j,c,p,sc) = pBranchMaxPower(i,j,c);
vPBranch.lo(i,j,c,p,sc) = -pBranchMaxPower(i,j,c);
vPDCline.up(l,p,sc) = pDCmax(l);
vPDCline.lo(l,p,sc) = -pDCmax(l);
*Other entry data
* Determine the first hour of the day
p1(p) $[ord(p) = 1] = yes ;

Exploration of the future European Electricity Market Design Appendix A – GAMS Model Code
Master Thesis MSc Economics and Management of Network Industries (EMIN) MSc Engineering and Policy Analysis (EPA) MSc Electric Power Industry (MEPI) – Ainhoa Villar Lejarreta Page 113
* Definition of the cost of non-served energy M€/GWh
pENScost=0.2;
*Definition of the cost of CO2 emission cost rate M€/tonnes of CO2
pCO2Cost=0.0001;
* If the initial output of the unit is above its minimum load then the unit is committed, otherwise it
is not committed
pIniUC(g)= 1 $[pIniProd(g) >= pMinProd(g)] ;
pIniProd1(g)=(pIniProd(g)-pMinProd(g))*pIniUC(g);
display pIniProd1, pIniUC ;
* If the minimum up or down times are 0, they are changed to 1h
pMinUpT(g) $[pMinUpT(g) = 0] = 1 ;
pMinDwT(g) $[pMinDwT(g) = 0] = 1 ;
*Initial up/dw/Start-Up conditions
pIniUp(g) $[pIniState(g)>=0] = pIniState(g) ;
pIniDw(g) $[pIniState(g)< 0] = abs(pIniState(g));
* SOLVER OPTIONS
* Selection of the solver for linear programming problems
OPTION LP = Cplex;
* Maximum number of iterations that are allowed
*OPTION ITERLIM = 100000;
file COPT / cplex.opt /
put COPT putclose 'rinsheur 200' /;
model UCandTCED / all/ ;
UCandTCED.solprint = 0 ;
UCandTCED.holdfixed = 1 ;
UCandTCED.optfile = 1;
*model UCandTCED / eTotalVCost, eBalance, eOpReserve, eReserveUp, eReserveDw,
* eMaxOutput, eMinOutput, eTotOutput, eRampUp, eRampDw,
* eUCStrShut, eMinTUp, eMinTDown, ePBranch
* /;
* Solve the stochastic daily unit commitment & transmission constrained economic dispatch model
solve UCandTCED using MIP minimizing vTotalVCost;
pSummary('NumEqs') = UCandTCED.Numequ;
pSummary('NumRealVar') = UCandTCED.Numvar - UCandTCED.Numdvar - 1;
pSummary('NumBinVar') = UCandTCED.Numdvar;
pSummary('OptMILP') = UCandTCED.Objval;
pSummary('CPUTime') = UCandTCED.Resusd;
pSummary('NonZeros') = UCandTCED.Numnz;
pSummary('OptRMIP') = UCandTCED.Objval+eps;

Exploration of the future European Electricity Market Design Appendix A – GAMS Model Code
Master Thesis MSc Economics and Management of Network Industries (EMIN) MSc Engineering and Policy Analysis (EPA) MSc Electric Power Industry (MEPI) – Ainhoa Villar Lejarreta Page 114
pSummary('RGap') = (UCandTCED.Objest-UCandTCED.Objval)/UCandTCED.Objval + eps;
pSummary('Iters') = UCandTCED.Iterusd+eps;
pSummary('Nodes') = UCandTCED.Nodusd+eps;
pSummary('SolStat') = UCandTCED.solvestat;
pSummary('LBound') = UCandTCED.Objest+eps;
************************************************************************************
*********************CALCULATION OF OUTPUT VARIABLES**************************
*Calculation of LMPs, nodal prices finally done in MATLAB
*For nodes that are connected to both AC and HVDC lines:
*pLMPac(p,iac,sc) = eBalance.m(p,sc) + sum[(j,c), pPTDF(iac,j,c,iac)*ePBranch.m(p,iac,j,c,sc)];
*For nodes that are connected only to HVDC lines:
*pLMPdc(p,idc,sc) = eBalance.m(p,sc) + ePDCnodes.m(p,idc,sc);
display eBalance.m, ePBranch.m, ePDCnodes.m;
*Calculation of Commitment Planning Costs, Operation and Non-served energy Costs:
parameter pPlanningCost, pOperationCost, ensCost;
pPlanningCost = sum[(p,g), pFixedFuelCost(g)*vCommitt.l(g,p)] +
sum[(p,g), pStartupCost(g)*vStartup.l(g,p)*pMaxProd(g)] +
sum[(p,g), pShutDownCost(g)*vShutdown.l(g,p)];
ensCost = sum[(p,i,sc), pENSCost*vENS.l(p,i,sc)];
pOperationCost = vTotalVCost.l - pPlanningCost - ensCost;
*Calculation of aggregated production in every node i of generators located in that node
parameter pAggrProd(i,p,sc);
pAggrProd(i,p,sc) = sum[g $ig(i,g), vProduct.l(g,p,sc)] ;
*Calculation of Net inflow (Inflow-Outflow) in every node i for every hour p due to HVDC lines
pNetInflowDC(i,p,sc) = SUM[l , Adc(l,i) * vPDCline.l(l,p,sc) ] ;
pNetInflowDC2(i,p,sc) = pNetInflowDC(i,p,sc) + EPS;
*Calculation of Net inflow (Inflow-Outflow) in every node i for every hour p due to AC lines
pNetInflowAC(i,p,sc) = sum[(j,c) $ij(j,i,c), vPBranch.l(j,i,c,p,sc)] - sum[(j,c) $ij(i,j,c),
vPBranch.l(i,j,c,p,sc)];
pNetInflowAC2(i,p,sc) = pNetInflowAC(i,p,sc) + EPS;
*Calculation of Net inflow in every node i for every hour p due to AC and HVDC lines
pNetInflow(i,p,sc) = pNetInflowDC2(i,p,sc) + pNetInflowAC2(i,p,sc);
*Renaming pDemand to reposition indexes
parameter pDemand3(i,p);
pDemand3(i,p)= pDemand(p,i);
*Renaming pENS to reposition indexes

Exploration of the future European Electricity Market Design Appendix A – GAMS Model Code
Master Thesis MSc Economics and Management of Network Industries (EMIN) MSc Engineering and Policy Analysis (EPA) MSc Electric Power Industry (MEPI) – Ainhoa Villar Lejarreta Page 115
parameter pENS(i,p,sc);
pENS(i,p,sc)=vENS.l(p,i,sc);
*Calculation of hourly curtailment and % of hourly RES Curtailment in the whole system
parameter pTotalCurtailment(p,sc), pCurtailment(p,sc), pPMaxWindGen2(i,p);
pPMaxWindGen2(i,p)=pPMaxWindGen(i,p) + EPS;
pTotalCurtailment(p,sc)=sum[i, (pPMaxWindGen2(i,p) - vIG.l(i,p,sc)) ];
pCurtailment(p,sc)= pTotalCurtailment(p,sc) / [sum[i, pPMaxWindGen2(i,p)]] * 100;
************************************************************************************
*******************WRITE OUTPUT VARIABLES IN TEXT FILE**************************
file summaryout /"Summary.txt"/ ; summaryout.pc=6;
put summaryout ;
put "----------------" /
put "General information" /
put "----------------" /
put 'Expnr ' , pExpnr:<3:0 /
put "program execution date ", system.date /
put "program execution time", system.time /
put "title of the model", system.title/
put "input file name", system.ifile /
put "output file name", system.ofile /
*put "current file page", system.page /
*put "restart file date", system.rdate /
*put "restart file name", system.rfile /
*put "restart file time", system.rtime /
*put "save file name", system.sfile /
put "----------------" /
put "Solution Summary" /
put "----------------" /
put "NumEqs " , pSummary('NumEqs'):<8:0 /
put "NumRealVar" , pSummary('NumRealVar'):<8.0 /
put "NumBinVar " , pSummary('NumBinVar'):<8.0 /
put "OptMILP " , pSummary('OptMILP'):<8.6 /
put "CPUTime " , pSummary('CPUTime'):<8.6 /
put "NonZeros " , pSummary('NonZeros'):<8.0 /
put "OptRMIP " , pSummary('OptRMIP'):<8.6 /
*put "IntGap " , pSummary('IntGap'):<8.0 /
*put "OptRMIP " , pSummary('OptRMIP'):<8.0 /
put "RGap " , pSummary('RGap'):<8.6 /
put "Iters " , pSummary('Iters'):<8.0 /
put "Nodes " , pSummary('Nodes'):<8.0 /
put "SolStat " , pSummary('SolStat'):<8.0 /
put "LBound " , pSummary('LBound'):<8.6 /
put "----------------" / ;
*Power flows through AC and HVDC lines

Exploration of the future European Electricity Market Design Appendix A – GAMS Model Code
Master Thesis MSc Economics and Management of Network Industries (EMIN) MSc Engineering and Policy Analysis (EPA) MSc Electric Power Industry (MEPI) – Ainhoa Villar Lejarreta Page 116
file actxtout /"AClineFlows.txt"/ ; actxtout.pc=5;
put actxtout ;
put '# Exprnr' pExpnr:<3:0 /
loop((i,j,c,p,sc), put$(ijac(i,j,c)), i.tl, j.tl, c.tl, p.tl, vPBranch.l(i,j,c,p,sc):<15:8 /);
file dctxtout /"DClineFlows.txt"/ ; dctxtout.pc=5;
put dctxtout ;
put '# Exprnr' pExpnr:<3:0 /
loop((l,p,sc), put, l.tl, p.tl, vPDCline.l(l,p,sc):<15:8 /);
*Production of generators
file prodtxtout /"Production.txt"/ ; prodtxtout.pc=5;
put prodtxtout ;
put '# Exprnr' pExpnr:<3:0 /
loop((g,p,sc), put, g.tl, p.tl, vProduct.l(g,p,sc):<20:10 /);
*Generator Type
file gentypetxtout /"GeneratorType.txt"/ ; gentypetxtout.pc=5;
put gentypetxtout ;
put '# Exprnr' pExpnr:<3:0 /
loop((g), put, g.tl, pThermalgen(g,'FuelType'):<1:0 /);
*RES production
file restxtout /"RESproduction.txt"/ ; restxtout.pc=5;
put restxtout ;
put '# Exprnr' pExpnr:<3:0 /
loop((i,p,sc), put, i.tl, p.tl, vIG.l(i,p,sc):<20:10 /);
file maxrestxtout /"MaximumRES.txt"/ ; maxrestxtout.pc=5;
put maxrestxtout ;
put '# Exprnr' pExpnr:<3:0 /
loop((i,p), put, i.tl, p.tl, pPMaxWindGen2(i,p):<10:8 /);
*Aggregated production in every node of the generators located in that node
file aggrprodtxtout /"AggregatedProduction.txt"/ ; aggrprodtxtout.pc=5;
put aggrprodtxtout ;
put '# Exprnr' pExpnr:<3:0 /
loop((i,p,sc), put, i.tl, p.tl, pAggrProd(i,p,sc):<10:8 /);
*Demand
file demtxtout /"Demand.txt"/ ; demtxtout.pc=5;
put demtxtout ;
put '# Exprnr' pExpnr:<3:0 /
loop((i,p), put, i.tl, p.tl, pDemand3(i,p):<20:10 /);
*Total curtailment and % curtailment
file totalcurttxtout /"TotalCurtailment.txt"/ ; totalcurttxtout.pc=5;
put totalcurttxtout ;
put '# Exprnr' pExpnr:<3:0 /

Exploration of the future European Electricity Market Design Appendix A – GAMS Model Code
Master Thesis MSc Economics and Management of Network Industries (EMIN) MSc Engineering and Policy Analysis (EPA) MSc Electric Power Industry (MEPI) – Ainhoa Villar Lejarreta Page 117
loop((p,sc), put, p.tl, pTotalCurtailment(p,sc):<10:8 /);
file curttxtout /"Curtailment.txt"/ ; curttxtout.pc=5;
put curttxtout ;
put '# Exprnr' pExpnr:<3:0 /
loop((p,sc), put, p.tl, pCurtailment(p,sc):<6:3 /);
file netintxtout /"NetInflow.txt"/ ; netintxtout.pc=5;
put netintxtout ;
put '# Exprnr' pExpnr:<3:0 /
loop((i,p,sc), put, i.tl, p.tl, pNetInflow(i,p,sc):<15:8 /);
*Non-served energy
file enstxtout /"ENS.txt"/ ; enstxtout.pc=5;
put enstxtout ;
put '# Exprnr' pExpnr:<3:0 /
loop((i,p,sc), put, i.tl, p.tl, pENS(i,p,sc):<20:10 /);
*Costs
file coststxtout /"Costs.txt"/ ; coststxtout.pc=5;
put coststxtout ;
put '# Exprnr',pExpnr:<3:0 /
put 'Generation Costs',vTotalVcost.l:<20:3 /
put 'Planning Costs',pPlanningCost:<20:3 /
put 'Operation Costs',pOperationCost:<20:3 /;
*Commitment, Startup and Shutdown
file commtxtout /"Commitment.txt"/ ; commtxtout.pc=5;
put commtxtout ;
put '# Exprnr' pExpnr:<3:0 /
loop((g,p), put, g.tl, p.tl, vCommitt.l(g,p):<1:0 /);
file startxtout /"Startup.txt"/ ; startxtout.pc=5;
put startxtout ;
put '# Exprnr' pExpnr:<3:0 /
loop((g,p), put, g.tl, p.tl, vStartup.l(g,p):<1:0 /);
file shuttxtout /"Shutdown.txt"/ ; shuttxtout.pc=5;
put shuttxtout ;
put '# Exprnr' pExpnr:<3:0 /
loop((g,p), put, g.tl, p.tl, vShutdown.l(g,p):<1:0 /);
*Network Information
file acnetwtxtout /"ACNetwork.txt"/ ; acnetwtxtout.pc=5;
put acnetwtxtout ;
put '# Exprnr' pExpnr:<3:0 /
loop((i,j,c), put$(ijac(i,j,c)), i.tl, j.tl, c.tl, pNetwork(i,j,c,'Pmax'):<15:8 /);
file dcnetwtxtout /"DCNetwork.txt"/ ; dcnetwtxtout.pc=5;

Exploration of the future European Electricity Market Design Appendix A – GAMS Model Code
Master Thesis MSc Economics and Management of Network Industries (EMIN) MSc Engineering and Policy Analysis (EPA) MSc Electric Power Industry (MEPI) – Ainhoa Villar Lejarreta Page 118
put dcnetwtxtout ;
put '# Exprnr' pExpnr:<3:0 /
loop((l), put, l.tl, pDClines(l,'Pmax'):<15:8 /);
file ptdfout /"PTDF.txt"/ ; ptdfout.pc=5;
put ptdfout ;
put "Expnr" , pExpnr:<3:0 /
put "fromN", "toN", "c", loop(i, put$(isac(i)), i.tl) put / ;
loop((i,j,c), put$(ijac(i,j,c)), i.tl, j.tl, c.tl, loop(ii, put$(pPTDF(i,j,c,ii)), pPTDF(i,j,c,ii):<10:8 )
put$(ijac(i,j,c)) / );
*Dual Variables
file lambdaout /"Lambda.txt"/ ; lambdaout.pc=5;
put lambdaout ;
put "Expnr" , pExpnr:<3:0 /
loop((p,sc), put, p.tl, eBalance.m(p,sc):<20:10 /);
file muout /"Mu.txt"/ ; muout.pc=5;
put muout ;
put "Expnr" , pExpnr:<3:0 /
loop((i,j,c,p,sc), put$(ijac(i,j,c)), i.tl, j.tl, c.tl, p.tl, vPBranch.m(i,j,c,p,sc):<20:10 /);
$ontext
file mudcout /"MuDC.txt"/ ; mudcout.pc=5;
put mudcout ;
put '# Exprnr' pExpnr:<3:0 /
loop((l,p,sc), put, l.tl, p.tl, vPDCline.m(l,p,sc):<20:10 /);
$offtext
file lambdadcout /"LambdaDC.txt"/ ; lambdadcout.pc=5;
put lambdadcout ;
put '# Exprnr' pExpnr:<3:0 /
loop((i,p,sc), put$(idc(i)), i.tl, p.tl, ePDCnodes.m(p,i,sc):<20:10 /);
************************************************************************************

Exploration of the future European Electricity Market Design Appendix B- Generation mix of the system, per country and per scenario
Master Thesis MSc Economics and Management of Network Industries (EMIN) MSc Engineering and Policy Analysis (EPA) MSc Electric Power Industry (MEPI) – Ainhoa Villar Lejarreta Page 119
APPENDIX B
Generation mix of the system, per country and per scenario
Table B.1. Generation mix of the system. Total capacity installed (GW) in every scenario.
Wind Solar RES Nuclear Lignite
Hard Coal
(Anthracit
e + Coal)
Gas
(Natural
Gas + Gas)
Fuel Oil
(Light +
Heavy)
Total
Scenario B
2014 76,5 59,0 135,5 104,2 37,5 88,6 130,4 34,1 530,2
Scenario EU
2020 157,2 94,6 251,8 99,5 34,3 76,2 135,4 25,0 622,1
Vision 1
2030 157,0 96,2 253,2 87,1 27,6 61,2 147,4 5,9 582,4
Vision 2
2030 157,0 96,2 253,2 85,3 27,6 61,2 136,8 5,9 570,0
Vision 3
2030 256,5 158,6 415,1 77,5 30,8 51,7 172,0 9,6 756,6
Vision 4
2030 325,5 189,1 514,6 77,9 26,4 45,6 167,8 9,6 841,9
Table B.2. Generation mix of the system. Increased installed capacity (%) in every scenario.
Wind Solar RES Nuclear Lignite
Hard Coal
(Anthracit
e + Coal)
Gas
(Natural
Gas + Gas)
Fuel Oil
(Light +
Heavy)
Total
Scenario
B 2014
Scenario
EU 2020
(1)
105,56 60,25 85,83 -4,55 -8,30 -14,00 3,81 -26,76 17,33
Vision 1
2030 (2) -0,13 1,74 0,57 -12,46 -19,55 -19,63 8,85 -76,46 -6,39
Vision 2
2030 (3) -0,13 1,74 0,57 -14,26 -19,55 -19,63 1,04 -76,47 -8,37
Vision 3
2030 (4) 63,16 67,73 64,88 -22,11 -10,36 -32,09 27,03 -61,66 21,63
Vision 4
2030 (5) 107,08 99,99 104,42 -21,62 -23,19 -40,15 23,91 -61,66 35,33
(1): with respect to B 2014
(2): with respect to EU 2020
(3): with respect to EU 2020
(4): with respect to EU 2020
(5): with respect to EU 2020

Exploration of the future European Electricity Market Design Appendix B- Generation mix of the system, per country and per scenario
Master Thesis MSc Economics and Management of Network Industries (EMIN) MSc Engineering and Policy Analysis (EPA) MSc Electric Power Industry (MEPI) – Ainhoa Villar Lejarreta Page 120
Thermal, Wind & Solar capacity installed (%) associated to the national yearly targets for
RES shares in electricity in 2014-2030.
Source: ENTSO-E (Scenario B for 2014, Scenario EU for 2020 and the Visions for 2030).
Table B.3. Generation mix per country. Capacity installed (%) in scenario B 2014.
Country Wind Solar Nuclear Lignite
Hard
Coal Gas Fuel Oil
% % % % % % %
Netherlands 9 2 2 0 19 65 3
Germany 21 22 7 13 18 17 2
Austria 19 4 0 0 0 77 0
Belgium 10 15 33 0 2 39 1
France 9 5 63 0 5 6 12
Norway 41 0 0 0 0 59 0
Denmark 48 6 0 0 24 22 0
Sweden 20 0 50 0 1 5 24
UK 12 0 13 0 28 44 3
Poland 11 0 0 26 60 3 0
Czech
Republic 2 13 23 46 8 8 0
Italy 9 19 0 0 9 44 18
Total (%) 14 11 20 7 17 25 6
Table B.4. Generation mix per country. Capacity installed (%) in scenario EU 2020.
Country Wind Solar Nuclear Lignite
Hard
Coal Gas Fuel Oil
% % % % % % %
Netherlands 21 9 1 0 12 54 3
Germany 33 25 4 9 13 14 1
Austria 24 3 0 0 0 73 0
Belgium 22 18 23 0 0 36 0
France 21 12 52 0 2 6 7
Norway 68 0 0 0 0 32 0
Denmark 56 10 0 0 10 17 6
Sweden 33 0 52 0 1 4 12
UK 27 0 12 0 20 40 1
Poland 16 1 0 22 55 6 0
Czech
Republic 3 14 21 45 6 10 0
Italy 12 27 0 0 8 38 14
Total (%) 25 15 16 6 12 22 4

Exploration of the future European Electricity Market Design Appendix B- Generation mix of the system, per country and per scenario
Master Thesis MSc Economics and Management of Network Industries (EMIN) MSc Engineering and Policy Analysis (EPA) MSc Electric Power Industry (MEPI) – Ainhoa Villar Lejarreta Page 121
Table B.5. Generation mix per country. Capacity installed (%) in Vision 1, 2030.
Country Wind Solar Nuclear Lignite
Hard
Coal Gas Fuel Oil
% % % % % % %
Netherlands 21 14 2 0 18 45 0
Germany 33 31 0 8 16 10 1
Austria 20 5 0 0 7 65 2
Belgium 23 19 0 0 0 58 0
France 20 12 57 0 2 8 2
Norway 76 0 0 0 0 24 0
Denmark 48 8 0 0 20 24 0
Sweden 37 0 59 0 0 0 4
UK 32 2 11 0 4 50 1
Poland 27 2 14 22 29 6 0
Czech
Republic 4 10 26 29 8 23 0
Italy 14 25 0 0 12 47 2
Total (%) 27 17 15 5 11 25 1
Table B.6. Generation mix per country. Capacity installed (%) in Vision 2, 2030.
Country Wind Solar Nuclear Lignite
Hard
Coal Gas Fuel Oil
% % % % % % %
Netherlands 21 14 2 0 18 45 0
Germany 34 31 0 8 16 9 1
Austria 21 5 0 0 8 64 2
Belgium 23 19 0 0 0 58 0
France 20 12 57 0 2 7 2
Norway 76 0 0 0 0 24 0
Denmark 49 8 0 0 21 23 0
Sweden 41 0 54 0 0 0 4
UK 34 2 12 0 4 47 1
Poland 27 2 14 22 29 6 0
Czech
Republic 4 11 27 31 8 20 0
Italy 14 26 0 0 12 46 3
Total (%) 28 17 15 5 11 24 1

Exploration of the future European Electricity Market Design Appendix B- Generation mix of the system, per country and per scenario
Master Thesis MSc Economics and Management of Network Industries (EMIN) MSc Engineering and Policy Analysis (EPA) MSc Electric Power Industry (MEPI) – Ainhoa Villar Lejarreta Page 122
Table B.7. Generation mix per country. Capacity installed (%) in Vision 3, 2030.
Country Wind Solar Nuclear Lignite
Hard
Coal Gas Fuel Oil
% % % % % % %
Netherlands 29 19 0 0 13 39 0
Germany 37 30 0 6 10 18 1
Austria 30 19 0 0 7 43 2
Belgium 32 22 0 0 0 46 0
France 31 23 31 0 1 10 3
Norway 85 0 0 0 0 15 0
Denmark 53 17 0 0 14 16 0
Sweden 49 4 44 0 0 0 3
UK 46 5 12 0 5 32 1
Poland 25 2 15 29 10 18 0
Czech
Republic 3 9 34 26 7 21 0
Italy 16 36 0 0 8 35 4
Total (%) 34 21 10 4 7 23 1
Table B.8. Generation mix per country. Capacity installed (%) in Vision 4, 2030.
Country Wind Solar Nuclear Lignite
Hard
Coal Gas Fuel Oil
% % % % % % %
Netherlands 30 22 1 0 11 36 0
Germany 45 27 0 5 7 15 0
Austria 26 31 0 0 5 36 2
Belgium 33 24 0 0 0 42 0
France 33 31 25 0 1 8 2
Norway 93 0 0 0 0 7 0
Denmark 55 16 0 0 13 16 0
Sweden 62 3 33 0 0 0 2
UK 48 5 11 0 5 31 0
Poland 34 12 13 16 9 16 0
Czech
Republic 5 15 32 24 5 19 0
Italy 17 37 0 0 7 35 4
Total (%) 38,66 22,46 9 3 5 20 1

Exploration of the future European Electricity Market Design Appendix B- Generation mix of the system, per country and per scenario
Master Thesis MSc Economics and Management of Network Industries (EMIN) MSc Engineering and Policy Analysis (EPA) MSc Electric Power Industry (MEPI) – Ainhoa Villar Lejarreta Page 123
Wind & Solar capacities installed (MW) associated to each country's yearly targets for
RES shares in electricity in 2014-2030.
Source: ENTSO-E (Scenario B for 2014, Scenario EU for 2020 and the Visions for 2030)
Table B.9. Installed capacities for wind and solar technologies in every country and in every
scenario (MW).
Country Scenario B 2014 EU 2020 Vision 1 2030
Wind Solar Wind Solar Wind Solar
Netherlands 2710 760 7780 3500 6000 4000
Germany 34720 36330 65790 49670 59300 55100
Austria 1900 400 2600 320 3290 820
Belgium 1720 2680 4900 4050 4790 4050
France 9000 5100 25000 15000 20000 12000
Norway 800 0 2800 0 2750 0
Denmark 4800 560 6850 1250 6850 1110
Sweden 3980 0 6400 0 6250 0
UK 7790 0 20310 0 30570 1870
Poland 3440 0 5850 270 8400 500
Czech Republic 310 2150 570 2500 740 2000
Italy North
(60% of installed
capacity in whole
country)
5298 11028 8340 18000 8046 14760
Total (GW) 76,468 59,008 157,19 94,56 156,986 96,21
Table B.10. Installed capacities for wind and solar technologies in every country and in every
scenario (MW) (continuation).
Country Vision 2 2030 Vision 3 2030 Vision 4 2030
Wind Solar Wind Solar Wind Solar
Netherlands 6000 4000 12000 8000 12800 9100
Germany 59300 55100 85000 68800 113100 68800
Austria 3290 820 5500 3500 5500 6500
Belgium 4790 4050 8540 5740 9370 6740
France 20000 12000 40000 30000 52400 49600
Norway 2750 0 5000 0 11400 0
Denmark 6850 1110 10460 3430 11460 3430
Sweden 6250 0 11100 1000 19000 1000
UK 30570 1870 54870 5800 60370 5800
Poland 8400 500 10000 1000 15600 5300
Czech Republic 740 2000 740 2000 1250 3500

Exploration of the future European Electricity Market Design Appendix B- Generation mix of the system, per country and per scenario
Master Thesis MSc Economics and Management of Network Industries (EMIN) MSc Engineering and Policy Analysis (EPA) MSc Electric Power Industry (MEPI) – Ainhoa Villar Lejarreta Page 124
Italy North
(60% of installed
capacity in whole
country)
8046 14760 13260 29340 13260 29340
Total (GW) 156,986 96,21 256,47 158,61 325,51 189,11
Figure B.1 . Breakdown of generation mix per country in Vision 2 year 2030
Figure B.2 . Breakdown of generation mix per country in Vision 3 year 2030

Exploration of the future European Electricity Market Design Appendix C- Demand parameter and assumptions
Master Thesis MSc Economics and Management of Network Industries (EMIN) MSc Engineering and Policy Analysis (EPA) MSc Electric Power Industry (MEPI) – Ainhoa Villar Lejarreta Page 125
APPENDIX C
Demand parameter and assumptions
Table C.1. Annual percentage increase of demand (%) applied in scenario EU 2020.
Netherlands Germany Austria Belgium France Norway
Increase of the gross final
energy consumption in the
electricity sector from
2014 to 2020 (%)
5,3 -5,43 10,65 9,03 1,38 0,45
Note: For the additional energy efficiency scenario. Own calculation from the ECN database.
Denmark Sweden
Great
Britain Poland
Czech
Republic Italy
Increase of the gross final
energy consumption in the
electricity sector from
2014 to 2020 (%)
1,03 0,93 1,25 13,18 10,11 2,92
Note: For the additional energy efficiency scenario. Own calculation from the ECN database.
Table C.2. Adjustment of the demand in Norway (node i14 ).
Norway (node i14)
Capacity (MW) Fossil Fuels Wind Solar Total Capacity minus
Hydro
Total Capacity
(Thermal+RES+hydro)
Scenario B 2014 1150 800 0 1950 32950
Scenario EU 2020 1300 2800 0 4100 37100
Vision 1 2030 855 2750 0 3605 41505
Vision 2 2030 855 2750 0 3605 41505
Vision 3 2030 855 5000 0 5855 44455
Vision 4 2030 855 11400 0 12255 64255
Table C.3. Adjustment of the demand in Austria (nodes i09 and i10).
Austria (nodes i109 and i10)
Capacity (MW) Fossil Fuels Wind Solar Total Capacity minus
Hydro
Total Capacity
(Thermal + RES + hydro)
Scenario B 2014 8000 1900 400 10300 23900
Scenario EU 2020 8000 2600 320 10920 25020
Vision 1 2030 12156 3290 820 16266 35772
Vision 2 2030 11629 3290 820 15739 35244
Vision 3 2030 9500 5500 3500 18500 38606
Vision 4 2030 8856 5500 6500 20856 42592

Exploration of the future European Electricity Market Design Appendix C- Demand parameter and assumptions
Master Thesis MSc Economics and Management of Network Industries (EMIN) MSc Engineering and Policy Analysis (EPA) MSc Electric Power Industry (MEPI) – Ainhoa Villar Lejarreta Page 126
Table C.4. Nodes list, latitude and longitude of nodes, provinces covered in each zone and
population in each zone.
Node
(Country - Zone) Nodes Latitude Longitude Provinces Population
Netherlands
NL - North i01 52,79 6,26 Groningen, Friesland, Drenthe, Overijssel,
Flevoland 3256276
NL - South i02 51,61 5,48 1/2Utrecht, Gelderland,1/2North Brabant, Limburg 4995834,5
NL - West i03 52,06 4,86 North Holland, South Holland, Zeeland, 1/2Utrecht,
1/2North Brabant 8527464,5
Germany
DE - North i04 53,28 9,99 Hamburg, Mecklenburg-Vorpommern, Schleswig-
Holstein, 1/2Niedersachsen 10054081,5
DE - West i05 51,81 7,96 Bremen, Nordrhein-Westfalen, 1/2Niedersachsen 22124526,5
DE - South i06 48,87 11,73 Bayern, Sachsen, Thüringen 18811469
DE - South West i07 49,84 8,53 Baden-Württemberg, Hessen, Rheinland-Pfalz,
Saarland 21661787
DE - East i08 51,97 12,40 Berlin, Brandenburg, Sachsen-Anhalt 8115599
Austria
AT - East i09 47,32 11,81 Vienna, Burgenland, Lower Austria, Styria,
1/2Carinthia,1/2Upper Austria 5879992,5
AT - West i10 47,79 15,18 Vorarlberg, Tyrol, Salzburg, 1/2Carinthia,1/2Upper
Austria 2619766,5
Belgium
BE - North i11 51,03 4,51 West-Flanders, East-Flanders, Antwerpen,
Limburg, 1/2Flemish Brabant, 1/2Brussels 6408536,5
BE - South i12 50,37 5,26 Hainaut, 1/2Flemish Brabant, Walloon Brabant,
Namur, Liege, Luxembourg, 1/2Brussels 4691017,5
France i13 48,11 3,49 65754000
Norway i14 60,58 8,30 5109044
Denmark
DK - West i15 56,19 9,20 Nordjylland, Midtjylland, Syddanmark 3071110
DK - East i16 55,52 11,77 Hovedstaden, Sjaelland 2588605
Sweden i17 57,69 14,26 9 644 864
Great Britain i18 52,16 -0,48 64100000
Poland i19 52,87 16,98 38495700
Czech Republic i20 49,71 14,15 10510719
Italy
IT - North West i21 45,35 8,66 Aosta Valley, Piedmont, Liguria, Lombardy 16130725
IT - North East i22 45,68 11,47 Trentino-Alto Adige, Veneto, Emilia-Romagna,
Friuli-Venezia Giulia 11654486

Exploration of the future European Electricity Market Design Appendix D- Generator properties, fuel costs and network parameters
Master Thesis MSc Economics and Management of Network Industries (EMIN) MSc Engineering and Policy Analysis (EPA) MSc Electric Power Industry (MEPI) – Ainhoa Villar Lejarreta Page 127
APPENDIX D
Generator properties, fuel costs and network parameters
Table D.1. Fuel costs according to type of fuel (€/MWh)
Nuclear 3.0
Lignite 4.40
Coal 12.70
Anthracite 12.70
Gas 38.70
Natural Gas 38.70
Light Fuel Oil 30.60
Heavy Fuel Oil 30.60
Table D.2. Fixed Fuel Cost according to fuel type (€/h).
Fuel type
Fixed fuel
consumption
(MThermie/h)
Random cost range for
fixed fuel consumption cost
(€/h)
Nuclear 0 10 - 30
Lignite 0.015 10 - 30
Coal 0.03 10 - 30
Anthracite 0.06 10 - 30
Gas 0.09 30 - 70
Natural Gas 0.09 30 - 70
Light Fuel Oil 0.08 30 - 70
Heavy Fuel Oil 0.08 30 - 70
The Fixed Fuel Consumption (MTh/h) according to the fuel type is used to specify an indicative
cost range for the Fixed Fuel Cost (€/h). This means that it will be assumed that those fuel types
like nuclear, lignite, coal and anthracite, which have lower fixed fuel consumption rates
compared to natural gas, gas and light and heavy fuel oil, will also have a lower fixed fuel
consumption cost.
In the same way as it was assumed with the fuel cost (€/MWh), random variability is introduced
by using a cost range of fixed fuel consumption costs for each type of fuel. Table D.2 shows the
cost ranges chosen for the calculation.

Exploration of the future European Electricity Market Design Appendix D- Generator properties, fuel costs and network parameters
Master Thesis MSc Economics and Management of Network Industries (EMIN) MSc Engineering and Policy Analysis (EPA) MSc Electric Power Industry (MEPI) – Ainhoa Villar Lejarreta Page 128
Table D.3. Operation & maintenance costs according to type of fuel (€/MWh)
Nuclear 1.2
Lignite 2.4
Coal 1.8
Anthracite 1.2
Gas 2
Natural Gas 1.2
Light Fuel Oil 1.2
Heavy Fuel Oil 1.2
Table D.4. Average operating efficiency according to type of technology (%)
Nuclear 30
Lignite 36
Coal 38
Anthracite 38
Gas 39
Natural Gas 50
Light Fuel Oil 39
Heavy Fuel Oil 39
Table D.5. Average startup costs according to type of technology (€/MW)
Generation technology Direct Cost Indirect Cost Total cost
Nuclear 35 0 35
Lignite-fired steam 28 55 83
Coal-fired steam 25 55 80
Anthracite-fired steam 25 55 80
Combined-cycle gas turbines 5 40 45
Gas-fired steam 33 40 73
Light & heavy fuel oil 33 40 73

Exploration of the future European Electricity Market Design Appendix D- Generator properties, fuel costs and network parameters
Master Thesis MSc Economics and Management of Network Industries (EMIN) MSc Engineering and Policy Analysis (EPA) MSc Electric Power Industry (MEPI) – Ainhoa Villar Lejarreta Page 129
Table D.6. Capacities of generating units according to fuel type for scenario B 2014 (MW)
Country Anthracite
+ Coal Lignite
Light +
Heavy Fuel
Oil
Natural
Gas + Gas Nuclear
Netherlands 953,33 138,57 607,88 490
Germany 731,71 2124 150 569,2 1508,75
Austria 150
Belgium 160 1186
France 346,67 571,43 90,63 3321,05
Norway 71,88
Denmark 133,89 3,33 84,23
Sweden 230 243,16 153,33 3300
UK 845,45 120,53 403,78 898
Poland 637,1 858 92
Czech Republic 56,82 206,22 8 42,12 930
Italy 172,97 653,5 509,88
Table D.7. Capacities of generating units according to fuel type for scenario EU 2020 (MW)
Country Anthracite
+ Coal Lignite
Light +
Heavy Fuel
Oil
Natural
Gas + Gas Nuclear
Netherlands 770 138,5 612 490
Germany 623,17 1846 104,8 558,2 1000
Austria 150
Belgium 184,2 1012
France 193,33 390,5 117,2 3315
Norway 81,25
Denmark 68,33 48,67 80
Sweden 100 121,05 116,7 3367
UK 707,3 52,1 412,57 898
Poland 635,8 809 220
Czech Republic 48,2 210,5 10 52,2 930
Italy 188 582,5 524,9

Exploration of the future European Electricity Market Design Appendix D- Generator properties, fuel costs and network parameters
Master Thesis MSc Economics and Management of Network Industries (EMIN) MSc Engineering and Policy Analysis (EPA) MSc Electric Power Industry (MEPI) – Ainhoa Villar Lejarreta Page 130
Table D.8. Capacities of generating units according to fuel type for Vision 1, 2030 (MW)
Country Anthracite
+ Coal Lignite
Light +
Heavy Fuel
Oil
Natural
Gas + Gas Nuclear
Netherlands 869 0 396,94 484
Germany 701,8 1486,7 52,04 370,46 0
Austria 204,19
Belgium 287,26 0
France 116 83,48 116,61 2947,37
Norway 53,44
Denmark 162,5 0 134,85
Sweden 0 34,74 0 3317,33
UK 174,14 26,53 638,95 1092,1
Poland 297,13 696 195
Czech Republic 68,18 156,76 0 139,7 1300
Italy 235,34 89,74 553,58
Table D.9. Capacities of generating units according to fuel type for Vision 2, 2030 (MW)
Country Anthracite
+ Coal Lignite
Light +
Heavy Fuel
Oil
Natural
Gas + Gas Nuclear
Netherlands 869 0 394,33 484
Germany 701,81 1486,72 52,05 318,67 0
Austria 194,05
Belgium 278,98 0
France 116 83,48 107,58 2947,37
Norway 53,44
Denmark 162,5 0 123,5
Sweden 0 34,74 0 2719,67
UK 174,14 26,53 582,17 1092,1
Poland 297,13 696 195
Czech Republic 68,18 156,76 0 114,33 1300
Italy 235,34 89,72 531,14

Exploration of the future European Electricity Market Design Appendix D- Generator properties, fuel costs and network parameters
Master Thesis MSc Economics and Management of Network Industries (EMIN) MSc Engineering and Policy Analysis (EPA) MSc Electric Power Industry (MEPI) – Ainhoa Villar Lejarreta Page 131
Table D.10. Capacities of generating units according to fuel type for Vision 3, 2030 (MW)
Country Anthracite
+ Coal Lignite
Light +
Heavy Fuel
Oil
Natural
Gas + Gas Nuclear
Netherlands 869 0 485,7 0
Germany 551,98 1316,5 52,04 825,26 0
Austria 153,12
Belgium 287,26 0
France 116 178,57 195 2105,26
Norway 53,44
Denmark 148,78 0 124,31
Sweden 0 34,74 0 3317,33
UK 264,45 31,89 513,58 1391
Poland 132,9 1181,7 713
Czech Republic 68,18 156,76 0 139,7 1900
Italy 235,34 189,64 573,11
Table D.11. Capacities of generating units according to fuel type for Vision 4, 2030 (MW)
Country Anthracite
+ Coal Lignite
Light +
Heavy Fuel
Oil
Natural
Gas + Gas Nuclear
Netherlands 770,17 0 461,03 484
Germany 451,79 1316,52 52,05 786,04 0
Austria 145,39
Belgium 276,56 0
France 116 178,57 195 2105,26
Norway 53,44
Denmark 148,78 0 124,31
Sweden 0 34,74 0 3317,33
UK 264,45 31,89 513,58 1391
Poland 132,9 741 713
Czech Republic 54,55 156,76 0 136,36 1900
Italy 204,4 189,62 563,33

Exploration of the future European Electricity Market Design Appendix D- Generator properties, fuel costs and network parameters
Master Thesis MSc Economics and Management of Network Industries (EMIN) MSc Engineering and Policy Analysis (EPA) MSc Electric Power Industry (MEPI) – Ainhoa Villar Lejarreta Page 132
Table D.12. Minimum generation according to type of technology (% of nominal output)
Nuclear 40
Lignite-fired steam 40
Coal-fired steam 38
Anthracite-fired steam 38
Combined-cycle gas turbines 33
Gas-fired steam 33
Light & heavy fuel oil 33
Table D.13. Upward and downward ramp limits according to type of technology (MW/h)
Nuclear 1000
Lignite-fired steam 40
Coal-fired steam 40
Anthracite-fired steam 120
Combined-cycle gas turbines 70
Gas-fired steam 80
Light & heavy fuel oil 130
Table D.14. Minimum online and offline times according to type of technology (h)
Nuclear 40
Lignite-fired steam 10
Coal-fired steam 6
Anthracite-fired steam 6
Combined-cycle gas turbines 2
Gas-fired steam 2
Light & heavy fuel oil 0.042
Calculation of the inductive reactances of the transmission lines.
To calculate the reactances in the per unit system, an impedance base is calculated by
assuming a value for and for the whole network:
Therefore, the reference unitary reactance in p.u./km used for all lines equals to:
And using , the real reactances in the model vary between [0.51, 2.03] p.u.
Related Documents