Hyundai Merchant Marine Co., Ltd. Company overview May 2010

Welcome message from author
This document is posted to help you gain knowledge. Please leave a comment to let me know what you think about it! Share it to your friends and learn new things together.
Transcript
1Hyundai Merchant Marine Co.,Ltd.
Hyundai Merchant Marine Co., Ltd.
Company overview
May 2010
HYUNDAI MERCHANT MARINE Co.,Ltd.
Important Notice
This presentation contains “forward-looking statements”, that are based on Hyundai Merchant
Marine’s current expectations, prospects, assumptions, market view and strategies. These
statements are subject to risks and uncertainties as various factors may cause actual results to
differ materially. We undertake no duty to update or revise any forward–looking statements,
whether as a results of new information, future events, or otherwise.
Ⅰ. Company Overview
1. Business Portfolio
2. Fleet Portfolio
3. Fleet Expansion Plan
4. HMM’s Competitiveness
5. Overall Result
6. 2010 Market Outlook
7. 2010 Guidance
Ⅱ. Divisional Data
Table of Contents
3
HYUNDAI MERCHANT MARINE Co.,Ltd.
458 490
108
303
555 466
97
314
587
-565
12
-700
-500
-300
-100
100
300
500
700
900
Container Wet Bulk Dry Bulk Total
5,190 5,541
4,644 3,945
5,119 4,846 4,734 5,092
8,003
6,115
1,755
Total Container Wet Bulk Dry Bulk
53%
15%
32%
73%
16%12%
66%
15% 15%
61%
19%
13%
66%
18%
16%
1. Business Portfolio
4
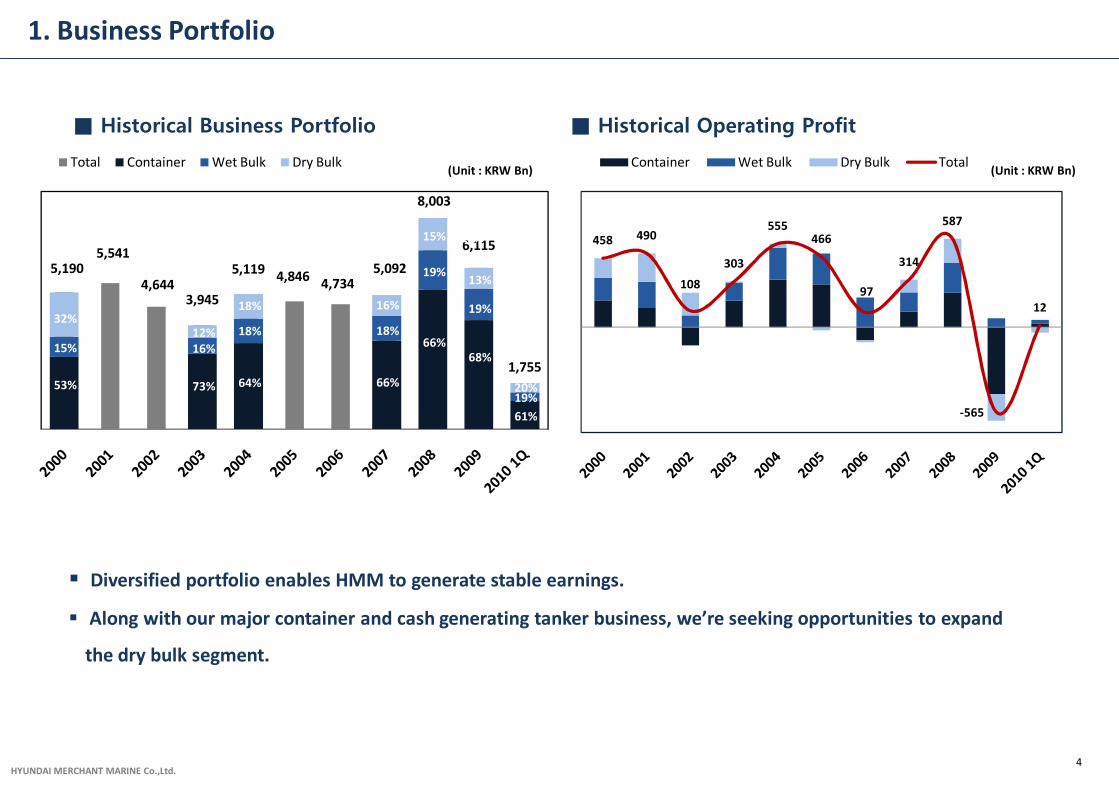
§ Diversified portfolio enables HMM to generate stable earnings.
§ Along with our major container and cash generating tanker business, we’re seeking opportunities to expand
the dry bulk segment.
■ Historical Operating Profit■ Historical Business Portfolio
(Unit : KRW Bn)(Unit : KRW Bn)
64%
18%
18%
19%
68%
19%
13%
19%20%
HYUNDAI MERCHANT MARINE Co.,Ltd.
2. Fleet Portfolio
5
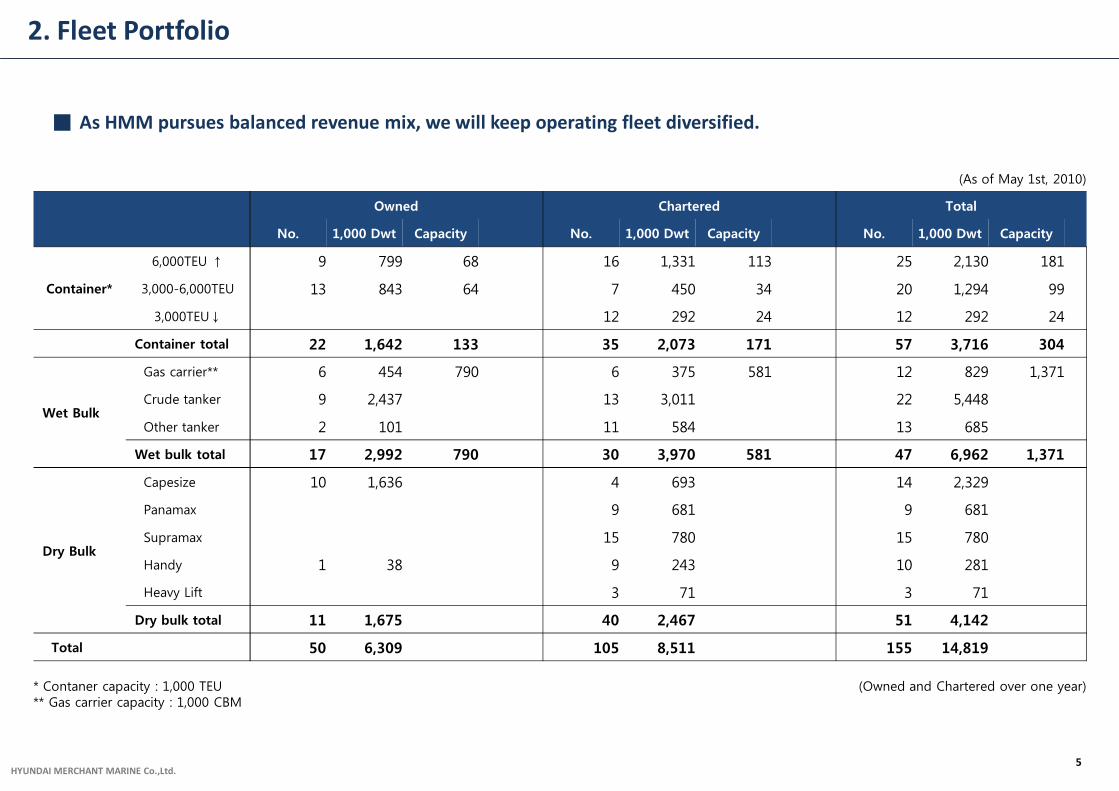
■ As HMM pursues balanced revenue mix, we will keep operating fleet diversified.
(As of May 1st, 2010)
Owned Chartered Total
No. 1,000 Dwt Capacity No. 1,000 Dwt Capacity No. 1,000 Dwt Capacity
Container*
6,000TEU ↑ 9 799 68 16 1,331 113 25 2,130 181
3,000-6,000TEU 13 843 64 7 450 34 20 1,294 99
3,000TEU↓ 12 292 24 12 292 24
Container total 22 1,642 133 35 2,073 171 57 3,716 304
Wet Bulk
Gas carrier** 6 454 790 6 375 581 12 829 1,371
Crude tanker 9 2,437 13 3,011 22 5,448
Other tanker 2 101 11 584 13 685
Wet bulk total 17 2,992 790 30 3,970 581 47 6,962 1,371
Dry Bulk
Capesize 10 1,636 4 693 14 2,329
Panamax 9 681 9 681
Supramax 15 780 15 780
Handy 1 38 9 243 10 281
Heavy Lift 3 71 3 71
Dry bulk total 11 1,675 40 2,467 51 4,142
Total 50 6,309 105 8,511 155 14,819
* Contaner capacity : 1,000 TEU** Gas carrier capacity : 1,000 CBM
(Owned and Chartered over one year)
HYUNDAI MERCHANT MARINE Co.,Ltd.
3. Fleet Expansion Plan
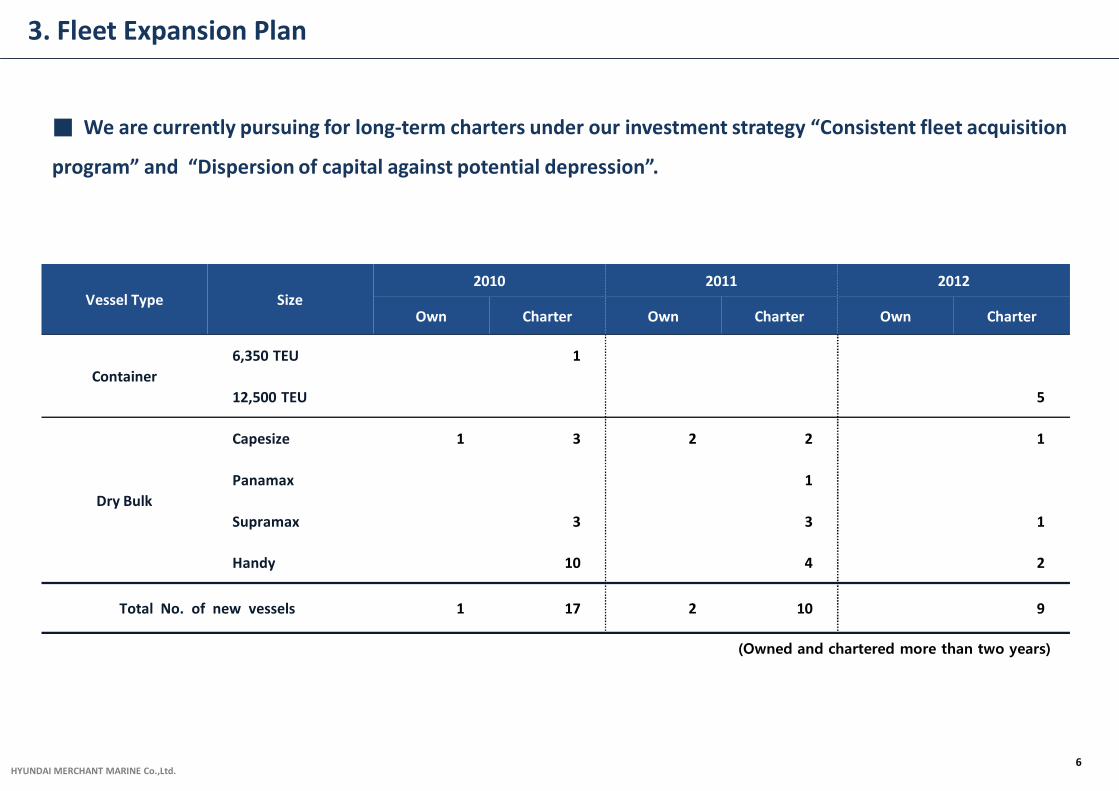
(Owned and chartered more than two years)
Vessel Type Size2010 2011 2012
Own Charter Own Charter Own Charter
Container
6,350 TEU 1
12,500 TEU 5
Dry Bulk
Capesize 1 3 2 2 1
Panamax 1
Supramax 3 3 1
Handy 10 4 2
Total No. of new vessels 1 17 2 10 9
6
■ We are currently pursuing for long-term charters under our investment strategy “Consistent fleet acquisition
program” and “Dispersion of capital against potential depression”.
HYUNDAI MERCHANT MARINE Co.,Ltd.
45
34
0
1
2
3
4
5
6
7
8
9
10
0
50
100
150
200
2002 2003 2004 2005 2006 2007 2008 2009
4. HMM’s Competitiveness
7
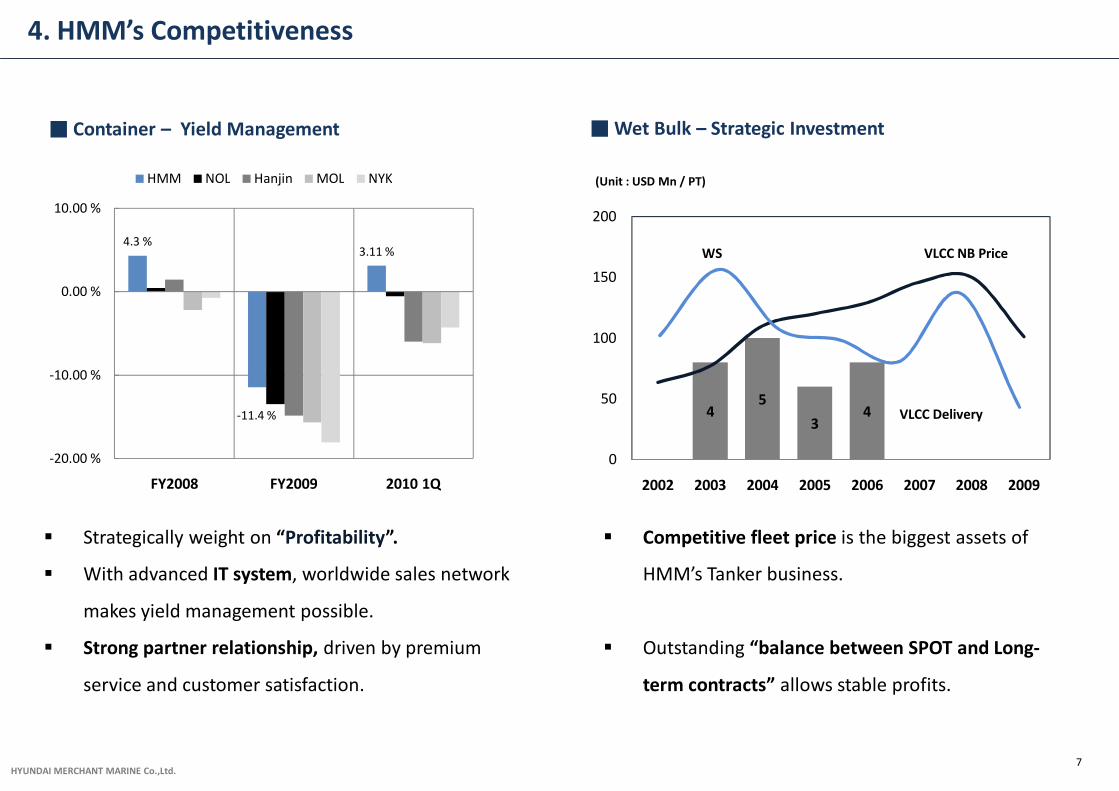
■ Container – Yield Management
§ Strategically weight on “Profitability”.
§ With advanced IT system, worldwide sales network
makes yield management possible.
§ Strong partner relationship, driven by premium
service and customer satisfaction.
(Unit : USD Mn / PT)
■ Wet Bulk – Strategic Investment
§ Competitive fleet price is the biggest assets of
HMM’s Tanker business.
§ Outstanding “balance between SPOT and Long-
term contracts” allows stable profits.
WS VLCC NB Price
VLCC Delivery
4.3 %
-11.4 %
3.11 %
-20.00 %
-10.00 %
0.00 %
10.00 %
FY2008 FY2009 2010 1Q
HMM NOL Hanjin MOL NYK
HYUNDAI MERCHANT MARINE Co.,Ltd.
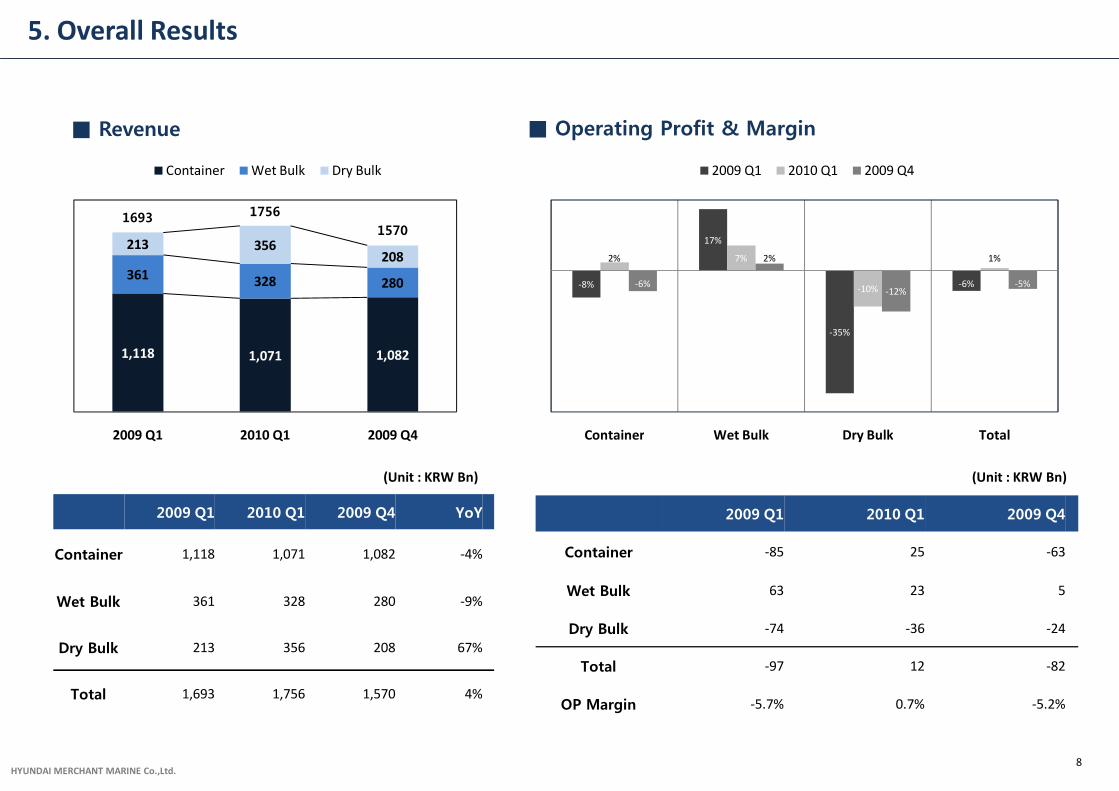
5. Overall Results
8
■ Revenue ■ Operating Profit & Margin
(Unit : KRW Bn)(Unit : KRW Bn)
1,118 1,071 1,082
361 328 280
213 356208
2009 Q1 2010 Q1 2009 Q4
Container Wet Bulk Dry Bulk
2009 Q1 2010 Q1 2009 Q4 YoY
Container 1,118 1,071 1,082 -4%
Wet Bulk 361 328 280 -9%
Dry Bulk 213 356 208 67%
Total 1,693 1,756 1,570 4%
1693 1756
1570
-8%
17%
-35%
-6%
2% 7%
-10%
1%
-6%
2%
-12%-5%
Container Wet Bulk Dry Bulk Total
2009 Q1 2010 Q1 2009 Q4
2009 Q1 2010 Q1 2009 Q4
Container -85 25 -63
Wet Bulk 63 23 5
Dry Bulk -74 -36 -24
Total -97 12 -82
OP Margin -5.7% 0.7% -5.2%
HYUNDAI MERCHANT MARINE Co.,Ltd.
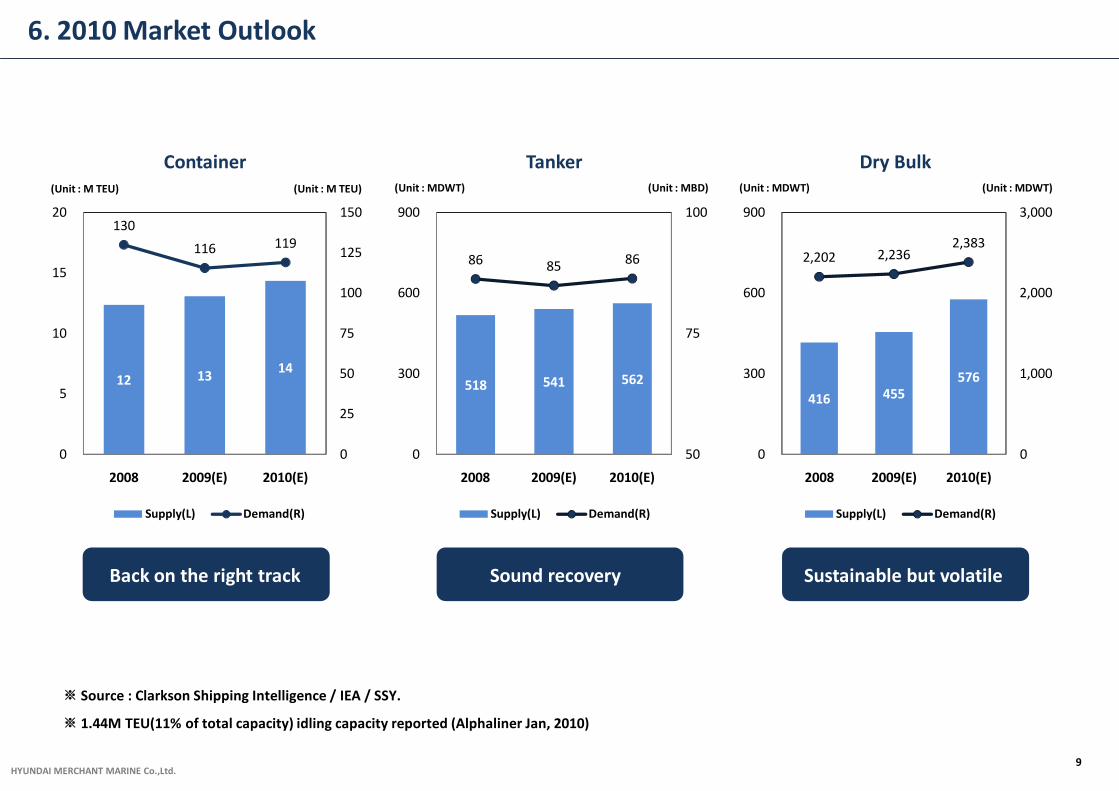
6. 2010 Market Outlook
9
Container Tanker Dry Bulk
※ Source : Clarkson Shipping Intelligence / IEA / SSY.
※ 1.44M TEU(11% of total capacity) idling capacity reported (Alphaliner Jan, 2010)
(Unit : M TEU) (Unit : M TEU) (Unit : MDWT) (Unit : MBD) (Unit : MDWT) (Unit : MDWT)
12 13 14
130
116 119
0
25
50
75
100
125
150
0
5
10
15
20
2008 2009(E) 2010(E)
Supply(L) Demand(R)
518 541 562
86 85 86
50
75
100
0
300
600
900
2008 2009(E) 2010(E)
Supply(L) Demand(R)
416 455 576
2,202 2,236 2,383
0
1,000
2,000
3,000
0
300
600
900
2008 2009(E) 2010(E)
Supply(L) Demand(R)
Back on the right track Sound recovery Sustainable but volatile
HYUNDAI MERCHANT MARINE Co.,Ltd.
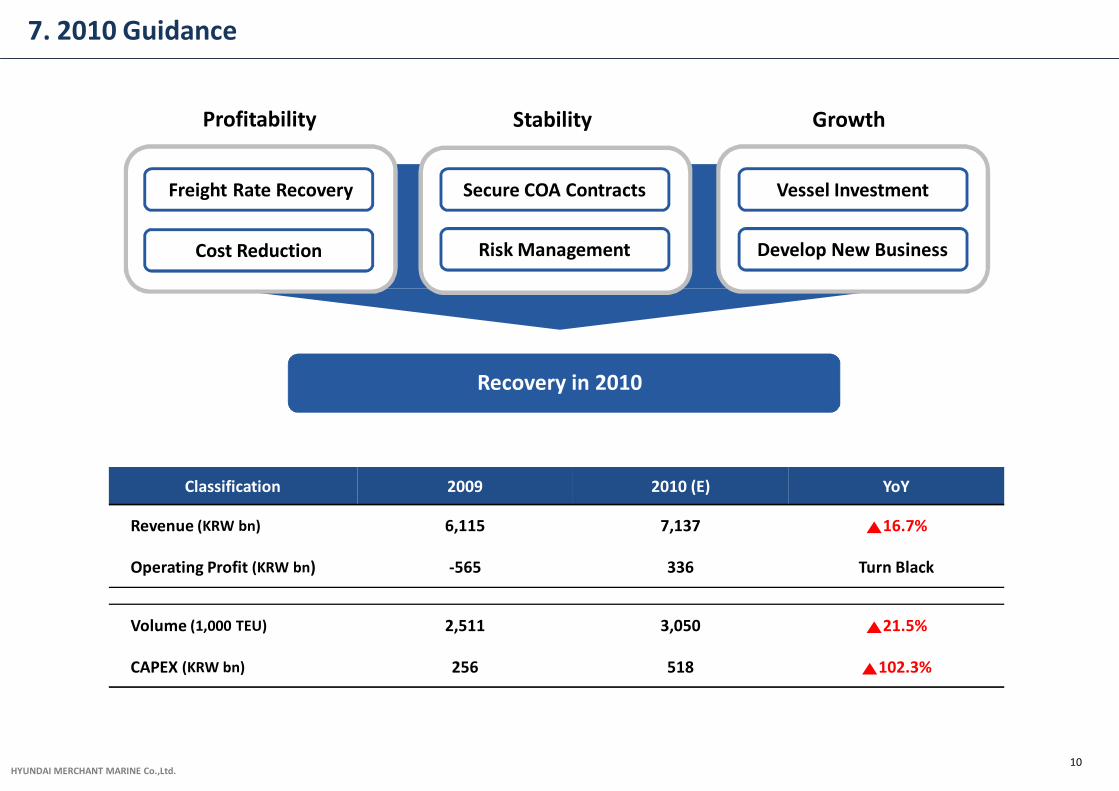
7. 2010 Guidance
10
Classification 2009 2010 (E) YoY
Revenue (KRW bn) 6,115 7,137 ▲16.7%
Operating Profit (KRW bn) -565 336 Turn Black
Volume (1,000 TEU) 2,511 3,050 ▲21.5%
CAPEX (KRW bn) 256 518 ▲102.3%
Freight Rate Recovery Secure COA Contracts Vessel Investment
Cost Reduction Risk Management Develop New Business
Profitability Stability Growth
Recovery in 2010
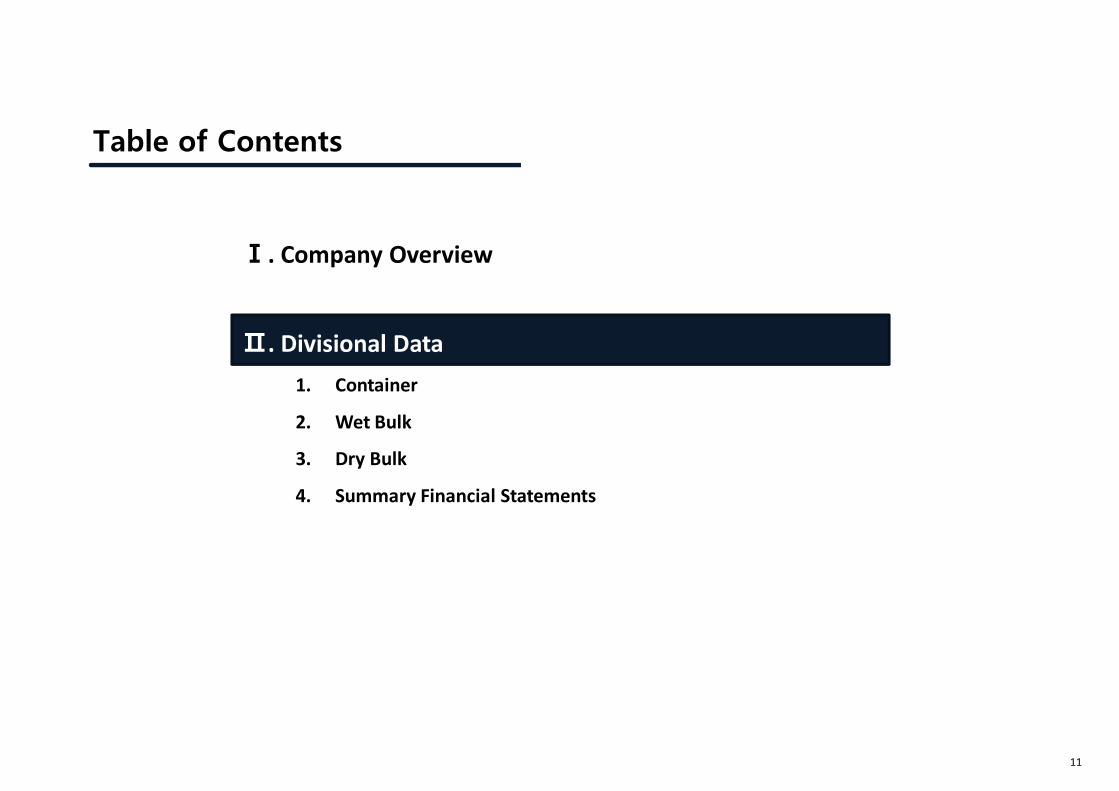
Ⅰ. Company Overview
Ⅱ. Divisional Data
1. Container
2. Wet Bulk
3. Dry Bulk
4. Summary Financial Statements
Table of Contents
11
HYUNDAI MERCHANT MARINE Co.,Ltd.
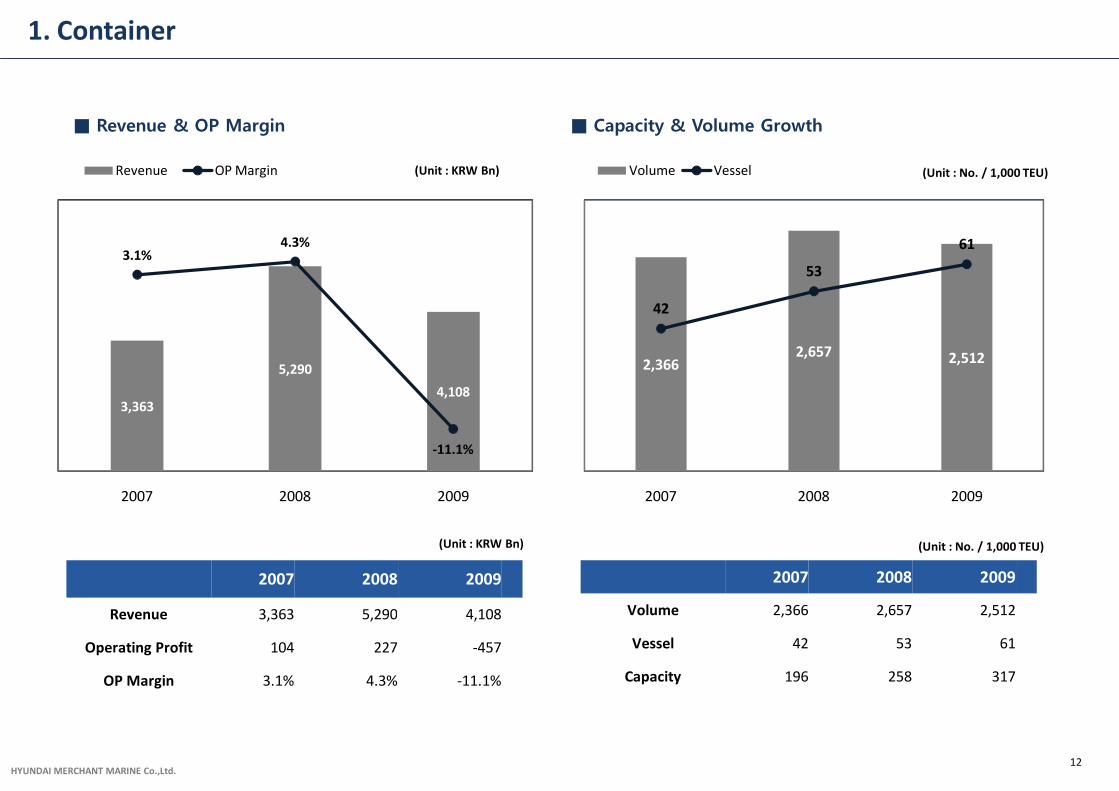
1. Container
■ Capacity & Volume Growth
12
■ Revenue & OP Margin
(Unit : No. / 1,000 TEU)(Unit : KRW Bn)
(Unit : No. / 1,000 TEU)(Unit : KRW Bn)
2,366 2,657 2,512
42
53
61
0
20
40
60
80
0
1,000
2,000
3,000
2007 2008 2009
Volume Vessel
2007 2008 2009
Revenue 3,363 5,290 4,108
Operating Profit 104 227 -457
OP Margin 3.1% 4.3% -11.1%
2007 2008 2009
Volume 2,366 2,657 2,512
Vessel 42 53 61
Capacity 196 258 317
3,363
5,290
4,108
3.1%4.3%
-11.1%-15%
-10%
-5%
0%
5%
10%
0
1,000
2,000
3,000
4,000
5,000
6,000
7,000
2007 2008 2009
Revenue OP Margin
HYUNDAI MERCHANT MARINE Co.,Ltd.
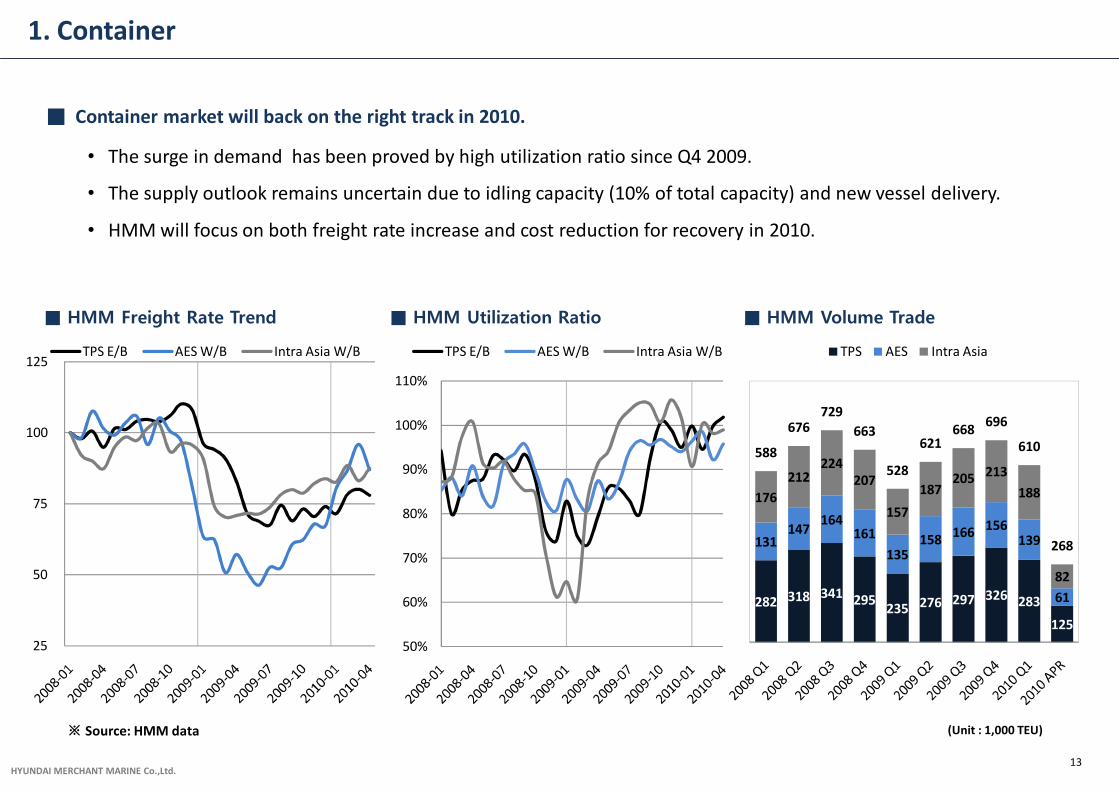
1. Container
■ HMM Freight Rate Trend ■ HMM Utilization Ratio
※ Source: HMM data
13
■ HMM Volume Trade
■ Container market will back on the right track in 2010.
• The surge in demand has been proved by high utilization ratio since Q4 2009.
• The supply outlook remains uncertain due to idling capacity (10% of total capacity) and new vessel delivery.
• HMM will focus on both freight rate increase and cost reduction for recovery in 2010.
(Unit : 1,000 TEU)
50%
60%
70%
80%
90%
100%
110%
TPS E/B AES W/B Intra Asia W/B
282 318 341 295 235 276 297 326 283
125
131 147
164 161
135 158
166 156 139
61
176
212 224
207
157
187 205 213
188
82
588
676 729
663
528
621 668
696
610
268
TPS AES Intra Asia
25
50
75
100
125 TPS E/B AES W/B Intra Asia W/B
HYUNDAI MERCHANT MARINE Co.,Ltd.
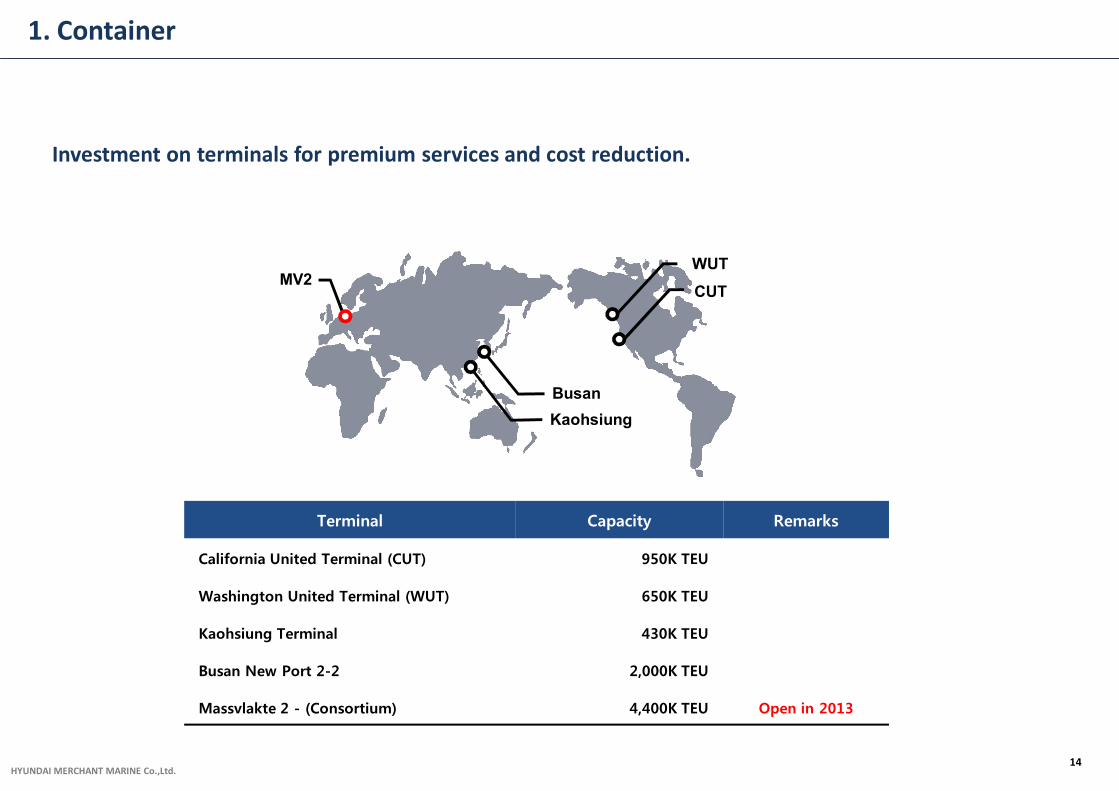
Investment on terminals for premium services and cost reduction.
Terminal Capacity Remarks
California United Terminal (CUT) 950K TEU
Washington United Terminal (WUT) 650K TEU
Kaohsiung Terminal 430K TEU
Busan New Port 2-2 2,000K TEU
Massvlakte 2 - (Consortium) 4,400K TEU Open in 2013
WUT
CUT
Busan
Kaohsiung
MV2
14
1. Container
HYUNDAI MERCHANT MARINE Co.,Ltd.
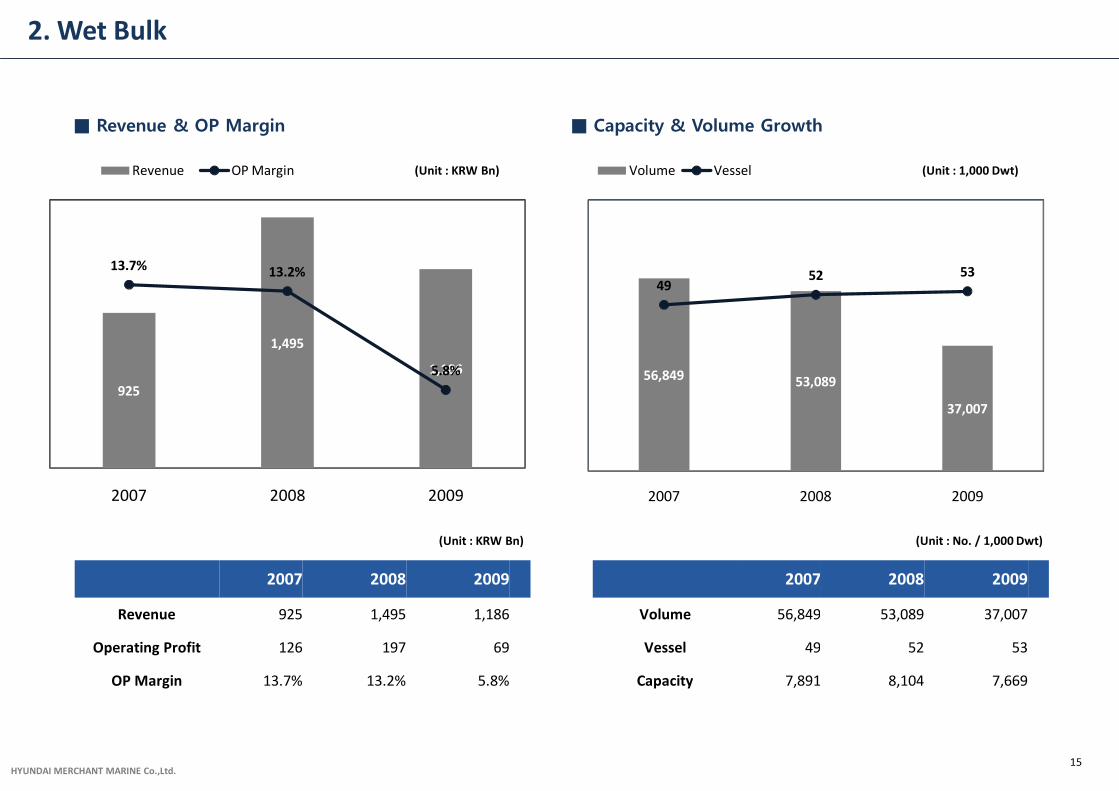
2. Wet Bulk
15
■ Capacity & Volume Growth■ Revenue & OP Margin
(Unit : 1,000 Dwt)(Unit : KRW Bn)
(Unit : No. / 1,000 Dwt)(Unit : KRW Bn)
56,849 53,089
37,007
4952 53
0
20
40
60
80
0
10,000
20,000
30,000
40,000
50,000
60,000
70,000
80,000
2007 2008 2009
Volume Vessel
2007 2008 2009
Revenue 925 1,495 1,186
Operating Profit 126 197 69
OP Margin 13.7% 13.2% 5.8%
2007 2008 2009
Volume 56,849 53,089 37,007
Vessel 49 52 53
Capacity 7,891 8,104 7,669
925
1,495
1,186
13.7% 13.2%
5.8%
0%
5%
10%
15%
20%
0
200
400
600
800
1,000
1,200
1,400
1,600
2007 2008 2009
Revenue OP Margin
HYUNDAI MERCHANT MARINE Co.,Ltd.
2. Wet Bulk
Source: Clarkson YTD, HMM data
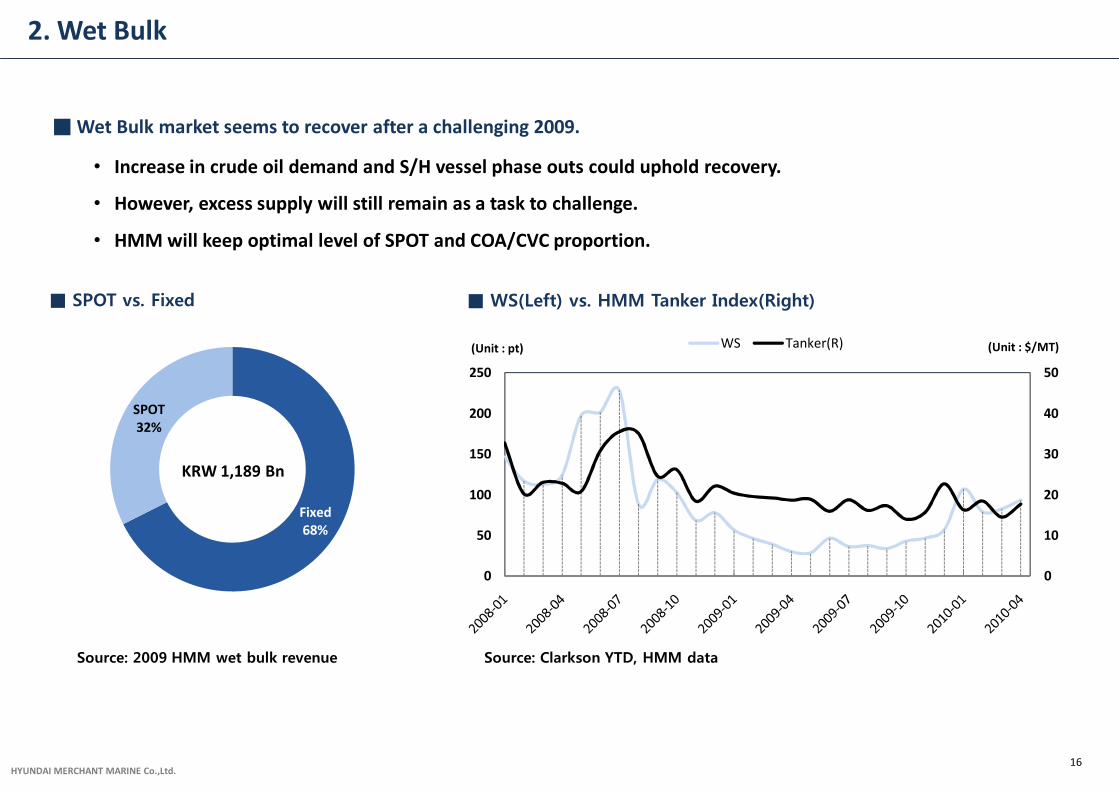
■ WS(Left) vs. HMM Tanker Index(Right)
(Unit : pt) (Unit : $/MT)
16
■ Wet Bulk market seems to recover after a challenging 2009.
• Increase in crude oil demand and S/H vessel phase outs could uphold recovery.
• However, excess supply will still remain as a task to challenge.
• HMM will keep optimal level of SPOT and COA/CVC proportion.
Source: 2009 HMM wet bulk revenue
■ SPOT vs. Fixed
Fixed68%
SPOT32%
KRW 1,189 Bn
0
10
20
30
40
50
0
50
100
150
200
250
WS Tanker(R)
HYUNDAI MERCHANT MARINE Co.,Ltd.
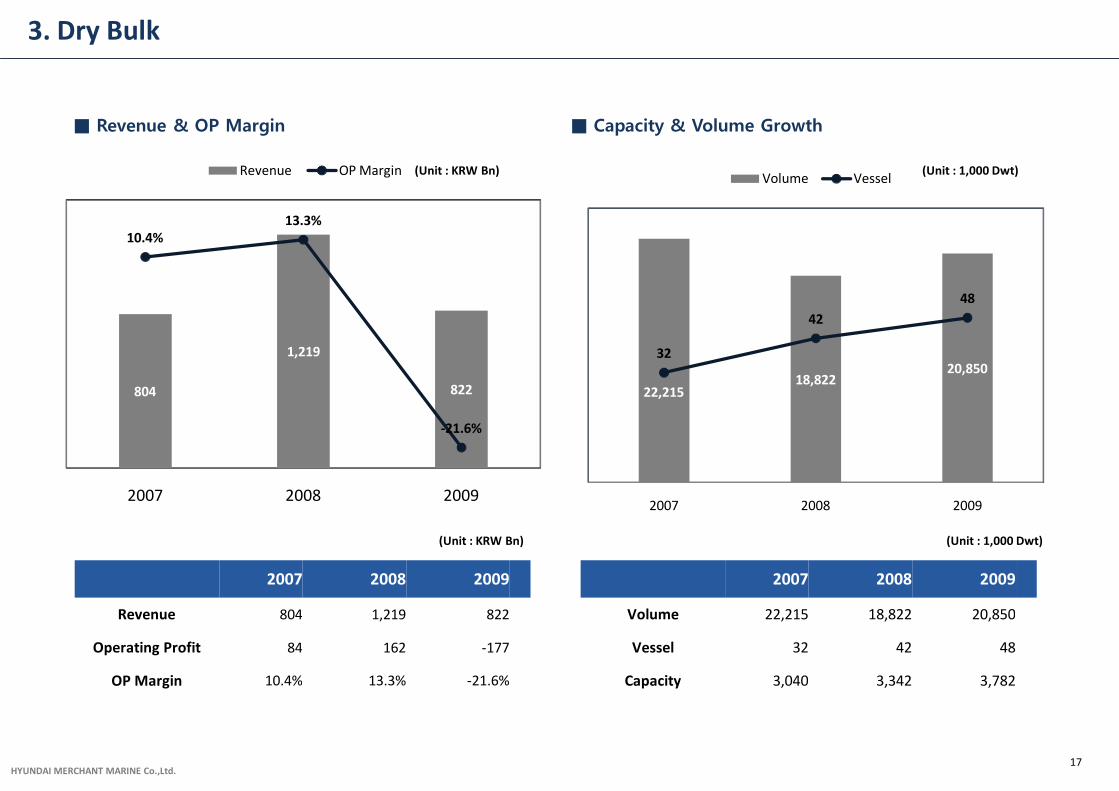
3. Dry Bulk
17
■ Capacity & Volume Growth■ Revenue & OP Margin
(Unit : 1,000 Dwt)(Unit : KRW Bn)
(Unit : 1,000 Dwt)(Unit : KRW Bn)
2007 2008 2009
Revenue 804 1,219 822
Operating Profit 84 162 -177
OP Margin 10.4% 13.3% -21.6%
2007 2008 2009
Volume 22,215 18,822 20,850
Vessel 32 42 48
Capacity 3,040 3,342 3,782
22,215 18,822
20,850 32
42
48
0
20
40
60
80
0
5,000
10,000
15,000
20,000
25,000
2007 2008 2009
Volume Vessel
804
1,219
822
10.4%13.3%
-21.6%
-25%
-20%
-15%
-10%
-5%
0%
5%
10%
15%
20%
0
200
400
600
800
1,000
1,200
1,400
2007 2008 2009
Revenue OP Margin
HYUNDAI MERCHANT MARINE Co.,Ltd.
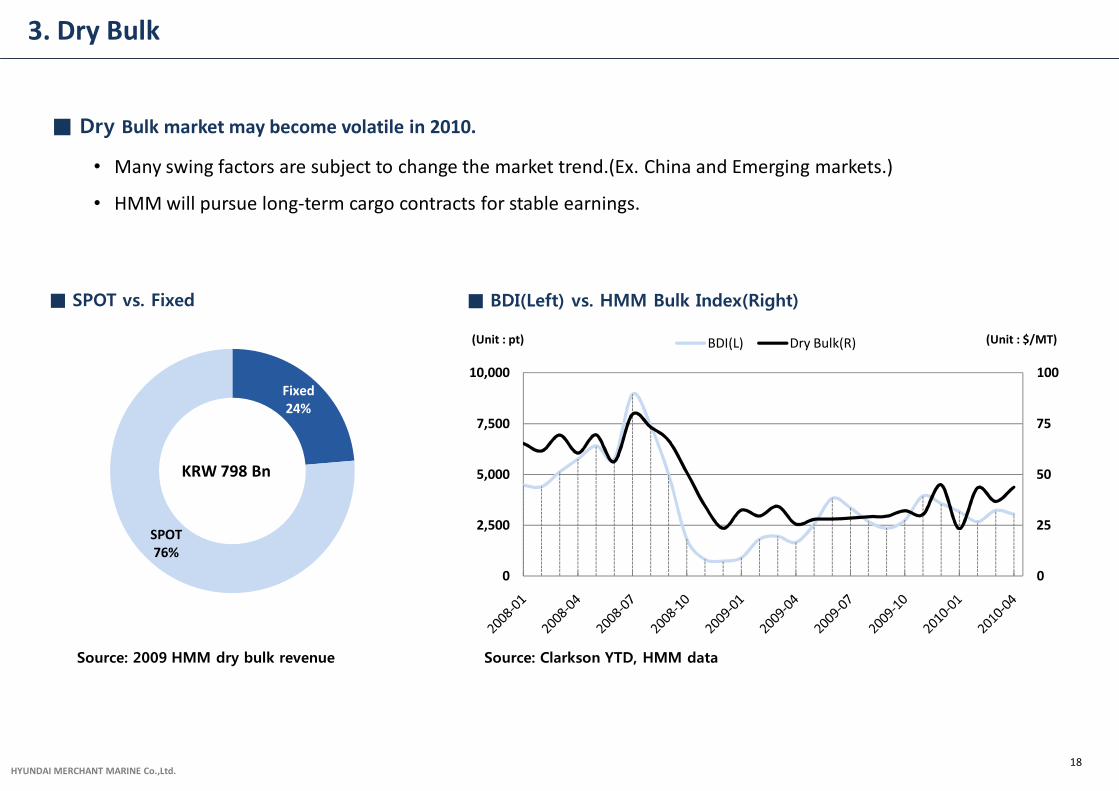
Fixed24%
SPOT76%
3. Dry Bulk
■ BDI(Left) vs. HMM Bulk Index(Right)
(Unit : pt) (Unit : $/MT)
Source: Clarkson YTD, HMM data
18
■ Dry Bulk market may become volatile in 2010.
• Many swing factors are subject to change the market trend.(Ex. China and Emerging markets.)
• HMM will pursue long-term cargo contracts for stable earnings.
■ SPOT vs. Fixed
Source: 2009 HMM dry bulk revenue
KRW 798 Bn
0
25
50
75
100
0
2,500
5,000
7,500
10,000
BDI(L) Dry Bulk(R)
HYUNDAI MERCHANT MARINE Co.,Ltd.19
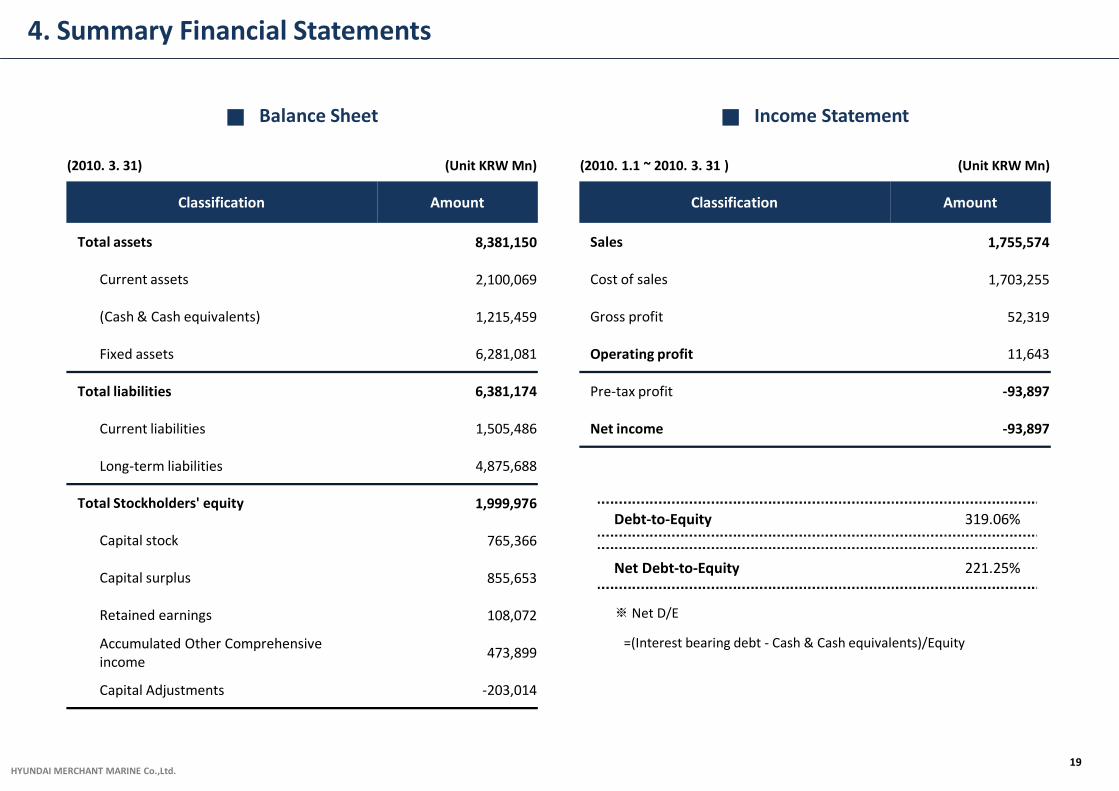
4. Summary Financial Statements
■ Balance Sheet ■ Income Statement
(2010. 3. 31) (Unit KRW Mn) (2010. 1.1 ~ 2010. 3. 31 ) (Unit KRW Mn)
Classification Amount Classification Amount
Total assets 8,381,150 Sales 1,755,574
Current assets 2,100,069 Cost of sales 1,703,255
(Cash & Cash equivalents) 1,215,459 Gross profit 52,319
Fixed assets 6,281,081 Operating profit 11,643
Total liabilities 6,381,174 Pre-tax profit -93,897
Current liabilities 1,505,486 Net income -93,897
Long-term liabilities 4,875,688
Total Stockholders' equity 1,999,976
Capital stock 765,366
Capital surplus 855,653
Retained earnings 108,072
Accumulated Other Comprehensive income
473,899
Capital Adjustments -203,014
Debt-to-Equity 319.06%
Net Debt-to-Equity 221.25%
※ Net D/E
=(Interest bearing debt - Cash & Cash equivalents)/Equity
HYUNDAI MERCHANT MARINE Co.,Ltd.
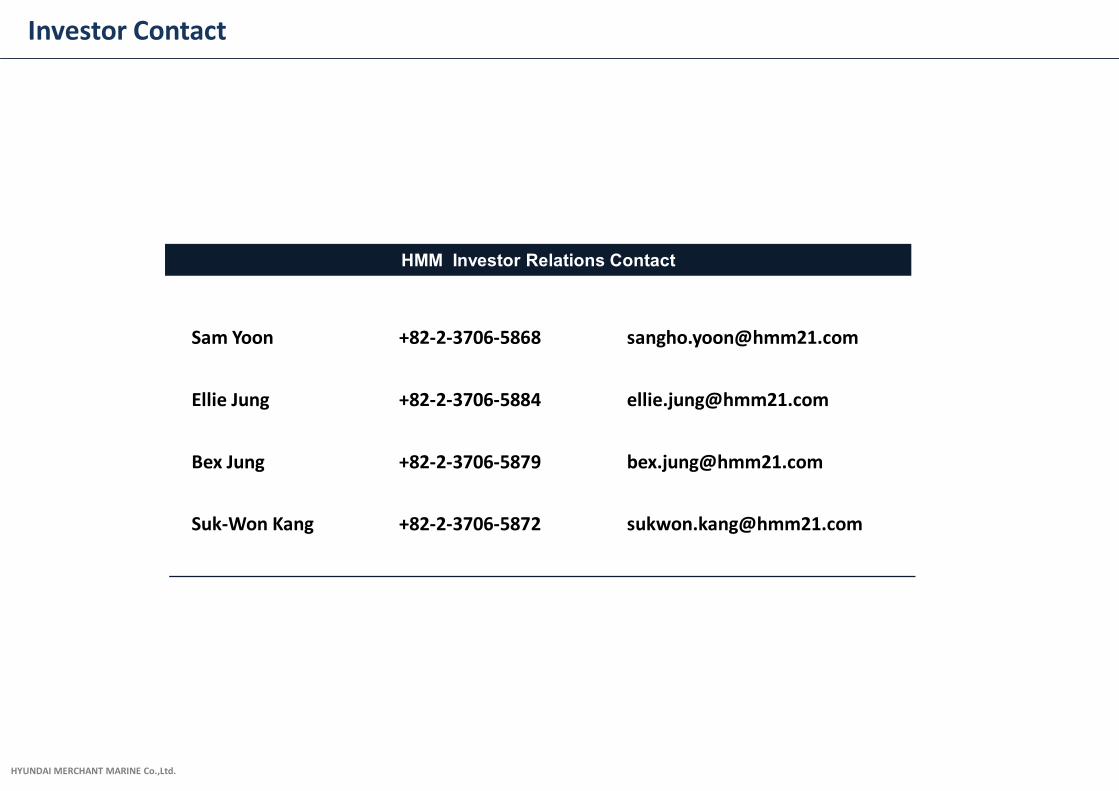
Investor Contact
HMM Investor Relations Contact
Sam Yoon +82-2-3706-5868 [email protected]
Ellie Jung +82-2-3706-5884 [email protected]
Bex Jung +82-2-3706-5879 [email protected]
Suk-Won Kang +82-2-3706-5872 [email protected]
Related Documents